Article

Screening of the Effective Additive to Inhibit Surfactin from Forming Precipitation with Divalent Cations for Surfactin Enhanced Oil Recovery

1
Department of Earth Resources Engineering, Graduate School of Engineering, Kyushu University, Fukuoka 8190395, Japan
2
Department of Earth Resources Engineering, Faculty of Engineering, Kyushu University, Fukuoka 8190395, Japan
3
New Business Development Department, Corporate Research & Business Division, Kaneka Corporation, Osaka 5308288, Japan
*
Author to whom correspondence should be addressed.
Energies 2020, 13(10), 2430; https://doi.org/10.3390/en13102430
Submission received: 25 February 2020 / Revised: 3 May 2020 / Accepted: 7 May 2020 / Published: 12 May 2020
(This article belongs to the Special Issue Enhanced Oil Recovery 2020)

Abstract

:
Surfactin, which is an anionic bio-surfactant, can be effective for enhanced oil recovery because it decreases interfacial tension between oil and water. However, it forms precipitation by binding with divalent cations. This study examined the countermeasure to prevent surfactin from forming precipitation for applying it to enhanced oil recovery. Alcohols, chelating agents, a cationic surfactant and an ion capturing substance were selected as the candidates for inhibiting surfactin from forming precipitation. Citric acid and trisodium citrate were selected as promising candidates through the measurements of turbidity of the mixture of the candidate, surfactin and calcium ions. Those chemicals also had a function as a co-surfactant for surfactin. However, the permeability of the Berea sandstone core into which the solution containing surfactin and trisodium citrate was injected was decreased significantly, whereas citric acid could be injected into the core without significant permeability reduction. Citric acid was therefore selected as the best inhibitor and subjected to the core flooding experiments. High enhancement of oil recovery of 9.4% (vs. original oil in place (OOIP)) was obtained and pressure drop was not increased during the injection of surfactin and citric acid. Those results suggest that citric acid has a dual role as the binding inhibitor and co-surfactant for surfactin.

1. Introduction

Surfactant is used for enhanced oil recovery (EOR) because it has capabilities to reduce interfacial tension (IFT) between oil and water and improves the replacement efficiency of oil [1]. A lot of field trials of surfactant EOR have been performed in many countries and great enhancement of oil recovery has been reported in almost all the field trials [2,3,4,5,6,7,8,9,10,11]. There are three types of surfactant: anionic surfactant, cationic surfactant and non-ionic surfactant. In general, anionic surfactant is the most popular surfactant for EOR because it has the highest capability to reduce IFT between oil and water in the three types of surfactant. Different types of anionic surfactant are used for EOR around the world [12]; however, it still has several challenges in order to be more effectively used for EOR. The most significant challenge is its high cost and high environmental load [13]. In addition, surfactant EOR is significantly affected by several reservoir conditions, such as reservoir temperature, salinity of formation water, concentration of divalent cations in formation water, and clay content in reservoir rock [14]. In particular, divalent cations such as calcium ions and magnesium ions have a significant negative influence on surfactant EOR. Those divalent cations bind to the anionic surfactant and inhibit the IFT reduction. Also, the anionic surfactant forms precipitation with those divalent cations, which blocks pore throats in the oil reservoir and significantly reduces the permeability of the reservoir. It has been proposed that surfactant EOR can be applied to reservoirs whose concentration of divalent cation is less than 15–900 ppm [15,16,17]. Sheng [14] proposed 100 ppm as a screening criteria of the divalent cation concentration based on the values published previously and the data from real field projects. Therefore, several methods for preventing the formation of precipitation have been proposed. Zhang et al. and Flaaten et al. [18,19] investigated the potential of sodium metaborate as an alkali which sequestered the divalent cations. Khaled [17] investigated sodium acrylate as a chelating agent which prevented the precipitation formation by binding divalent cations.
This study focused on the surfactin, which is an anionic biosurfactant generated by the bacterial strain Bacillus subtilis, and investigated the method for preventing the surfactin from forming the precipitation in the solution containing divalent cations. As surfactin is a biosurfactant, it is advantageous on the low environmental load. In addition, the surfactin has high capability to reduce IFT with low concentration because its critical micellar concentration (CMC) is quite low such as 0.0003 wt% [20]. This number is approximately 1/300 of the CMC of sodium lauryl sulfate (SDS), which is one of popular chemical surfactants used for surfactant EOR. The manufacturing cost of surfactin is more expensive than that of chemical surfactants. The manufacturing cost is mainly expended for extracting the surfactin from the culture solution and purifying the surfactin extracted from the culture solution. The cost of the culture solution is therefore not as expensive, and we assume that EOR using the culture solution can be economically feasible. However, because the culture solution contained not only surfactin but also various substances which might affect the surfactin, this study examined only the effect of pure surfactin on EOR in order to understand the function of pure surfactin as basic research.
The purpose of this study is to obtain the suitable inhibitors which prevent the surfactin from forming precipitation and are cheap and environmentally friendly in comparison with the chemicals which were proposed by previous studies. For that purpose, we prepared several types of candidate chemical which have a possibility to be the suitable inhibitors in this study. In addition, we performed injectivity tests and core flooding experiments using the chemicals which were selected as the suitable inhibitors through the turbidity measurements and IFT measurements of the testing solution in order to evaluate the potential of EOR using surfactin.

2. Materials and Methods

2.1. Materials Used in This Study

Intermediate crude oil, which was collected in an oilfield in Akita, Japan, was used for the experiments in this study. API gravity and viscosity of the crude oil was 35.0° and 9.0 cP at 20 °C, respectively. The surfactin which was used in this study was made by Kaneka Corporation, Tokyo, Japan. Surfactin is generated by Bacillus subtilis and extracted from the culture solution of that bacteria. It can be dissolved into water which has a pH of 6.5 or more.
The capability as an inhibitor of two kinds of alcohol, five kinds of chelating agent, a cationic surfactant, and a nano-particle of zeolite was evaluated in this study. Two kinds of alcohol, namely isopropanol and tertiary butyl alcohol, were prepared as the candidates, because these alcohols enhanced the solubility of surfactin calcium. Five kinds of chelating agent, such as citric acid, trisodium citrate, sodium polyacrylate, pentasodium triphosphate and BAPTA (1,2-Bis(2-aminophenoxy)ethane-N,N,N’,N’-tetraacetic acid) were prepared as the candidates, because these chelating agents prevented calcium ion from binding with the surfactin by capturing calcium ions and forming metal complex ions with calcium ions.
Cetyltrimethylammonium bromide (CTAB), a cationic surfactant, was made a candidate because it prevented the surfactin from binding with calcium ions by binding with surfactin, which was an anionic surfactant. Nanoparticles of zeolite were made to be a candidate because they prevented calcium ions from binding with the surfactin by capturing calcium ions by their ion exchange capacity.
Although it is well known that various kinds of ions are contained in reservoir brine, only calcium ions were used as a representative of ions which were contained in the reservoir brine in this study. The surfactin only combines with cationic ions in reservoir brine because it is an anionic surfactant. In general, four cations, namely sodium ions, potassium ions, magnesium ions and calcium ions, are major cations in reservoir brine. Even if the concentration of divalent cations is low, the surfactin combines with them and forms precipitation easily. Since the concentration of calcium ions is usually higher than that of magnesium ions in reservoir brine [21,22,23], we selected calcium ions as a representative of divalent cations which were contained in the reservoir brine in this study. On the other hand, monovalent cations such as sodium ions and potassium ions may also affect the surfactin. We have already examined the effect of sodium chloride, which is the major element in reservoir brine, on the surfactin through our preliminary studies. The precipitation is not formed in the surfactin solution containing sodium chloride and the IFT between oil and the surfactin solution is not affected if the concentration of sodium chloride is 2.0 wt% or less (data not shown). That is low for the concentration of sodium chloride in reservoir brine; however, there are many oil reservoirs which contain such low-salinity water. We assume that the surfactin can be applied for EOR in such low-salinity oil reservoirs. The surfactin may be also affected by the synergistic effect of several ions in reservoir brine; however, this paper pays attention only to calcium ions in order to avoid complication of the problem as basic research.
Calcium chloride aqueous solution was prepared for the experiment in this study by putting calcium chloride into ion exchange water. The concentration of calcium ions was set to 900 ppm, which was the same concentration of divalent cations as that in the study of Khaled [17]. We call the calcium chloride aqueous solution the synthetic brine in this study.

2.2. Methodology

2.2.1. Turbidity Measurements

The first screening of the candidate was carried out to narrow down the candidates by comparing the turbidity of the testing solution. The turbidity of the synthetic brine containing 0.3 wt% of surfactin and a candidate of the inhibitor was measured using a digital turbidimeter TU-2016 (FUSO Co., Ltd., Tokyo, Japan) in order to screen the effective inhibitors. The turbidimeter measured the turbidity of solution by using the 90° scattering light method and its measurement range is from 0 to 1000 Nephelometric Turbidity Unit, NTU. The original solution containing surfactin and a candidate of the inhibitor was prepared for the turbidity measurements. The concentration of surfactin in the original solution was 3.0 wt%. The concentration of the candidate of the inhibitor in the original solution was different depending on the candidates, as shown in Table 1. The concentration was determined by considering their solubility and was set a little higher to find out the inhibitory effect on the precipitation formation. As the pH of 10.0 wt% citric acid solution was too low for surfactin to dissolve in the solution, the pH of the citric acid solution was adjusted to 7.0 with KOH. The testing solution was prepared by putting 1.0 mL of the original solution into 9.0 mL of synthetic brine whose concentration of calcium was 1000 ppm. The final concentration of surfactin and calcium in the testing solution was therefore 0.3 wt% and 900 ppm, respectively. The final concentration of the candidate in the testing solution was also one-tenth of the concentration of the original solution.
Subsequently to the first screening, the second screening was carried out to determine the necessary minimum concentration of the candidates which were selected through the first screening for preventing the surfactin from forming precipitation of surfactin calcium. The concentration of the candidates in the testing solution for the second screening was set lower than that for the first screening to determine the necessary minimum concentration of the candidates.

2.2.2. IFT Measurements

The influence of the inhibitor on the surfactin capacity for decreasing IFT was evaluated by measuring the IFT between the crude oil and the synthetic brine containing the inhibitor and surfactin. The concentration of surfactin in the testing solutions was 0.3 wt%. The reduction in IFT between the crude oil and the testing solution was measured based on the pendant drop method using the drop master DMs-401 (Kyowa Interface Science Co., Ltd., Tokyo, Japan). An oil droplet was made in the testing solution and the pictures of the oil droplet were taken by a camera. The photo image of the oil droplet was subjected to image analysis and the IFT value was calculated by the Young–Laplace equation.

2.2.3. Surfactin Injectivity Tests

The injectivity of the synthetic brine containing surfactin and the inhibitors was evaluated by the experiments injecting the mixed solution into a Berea sandstone core which was saturated with the synthetic brine. The diameter and length of the cores which were used in this study were approximately 25.4 and 60.0 mm, respectively. The absolute permeability of the cores, which was measured by injecting water into the cores, was approximately 30 md.
First, the core was soaked in synthetic brine after the dry weight of the core was measured. The pore spaces in the core were completely saturated with the synthetic brine under vacuum conditions. Subsequently, the weight of the brine-saturated core was measured. The pore volume of the core was calculated based on the brine density and weight difference between the dry core and brine-saturated core. The porosity of the cores used in this study was approximately 18%.
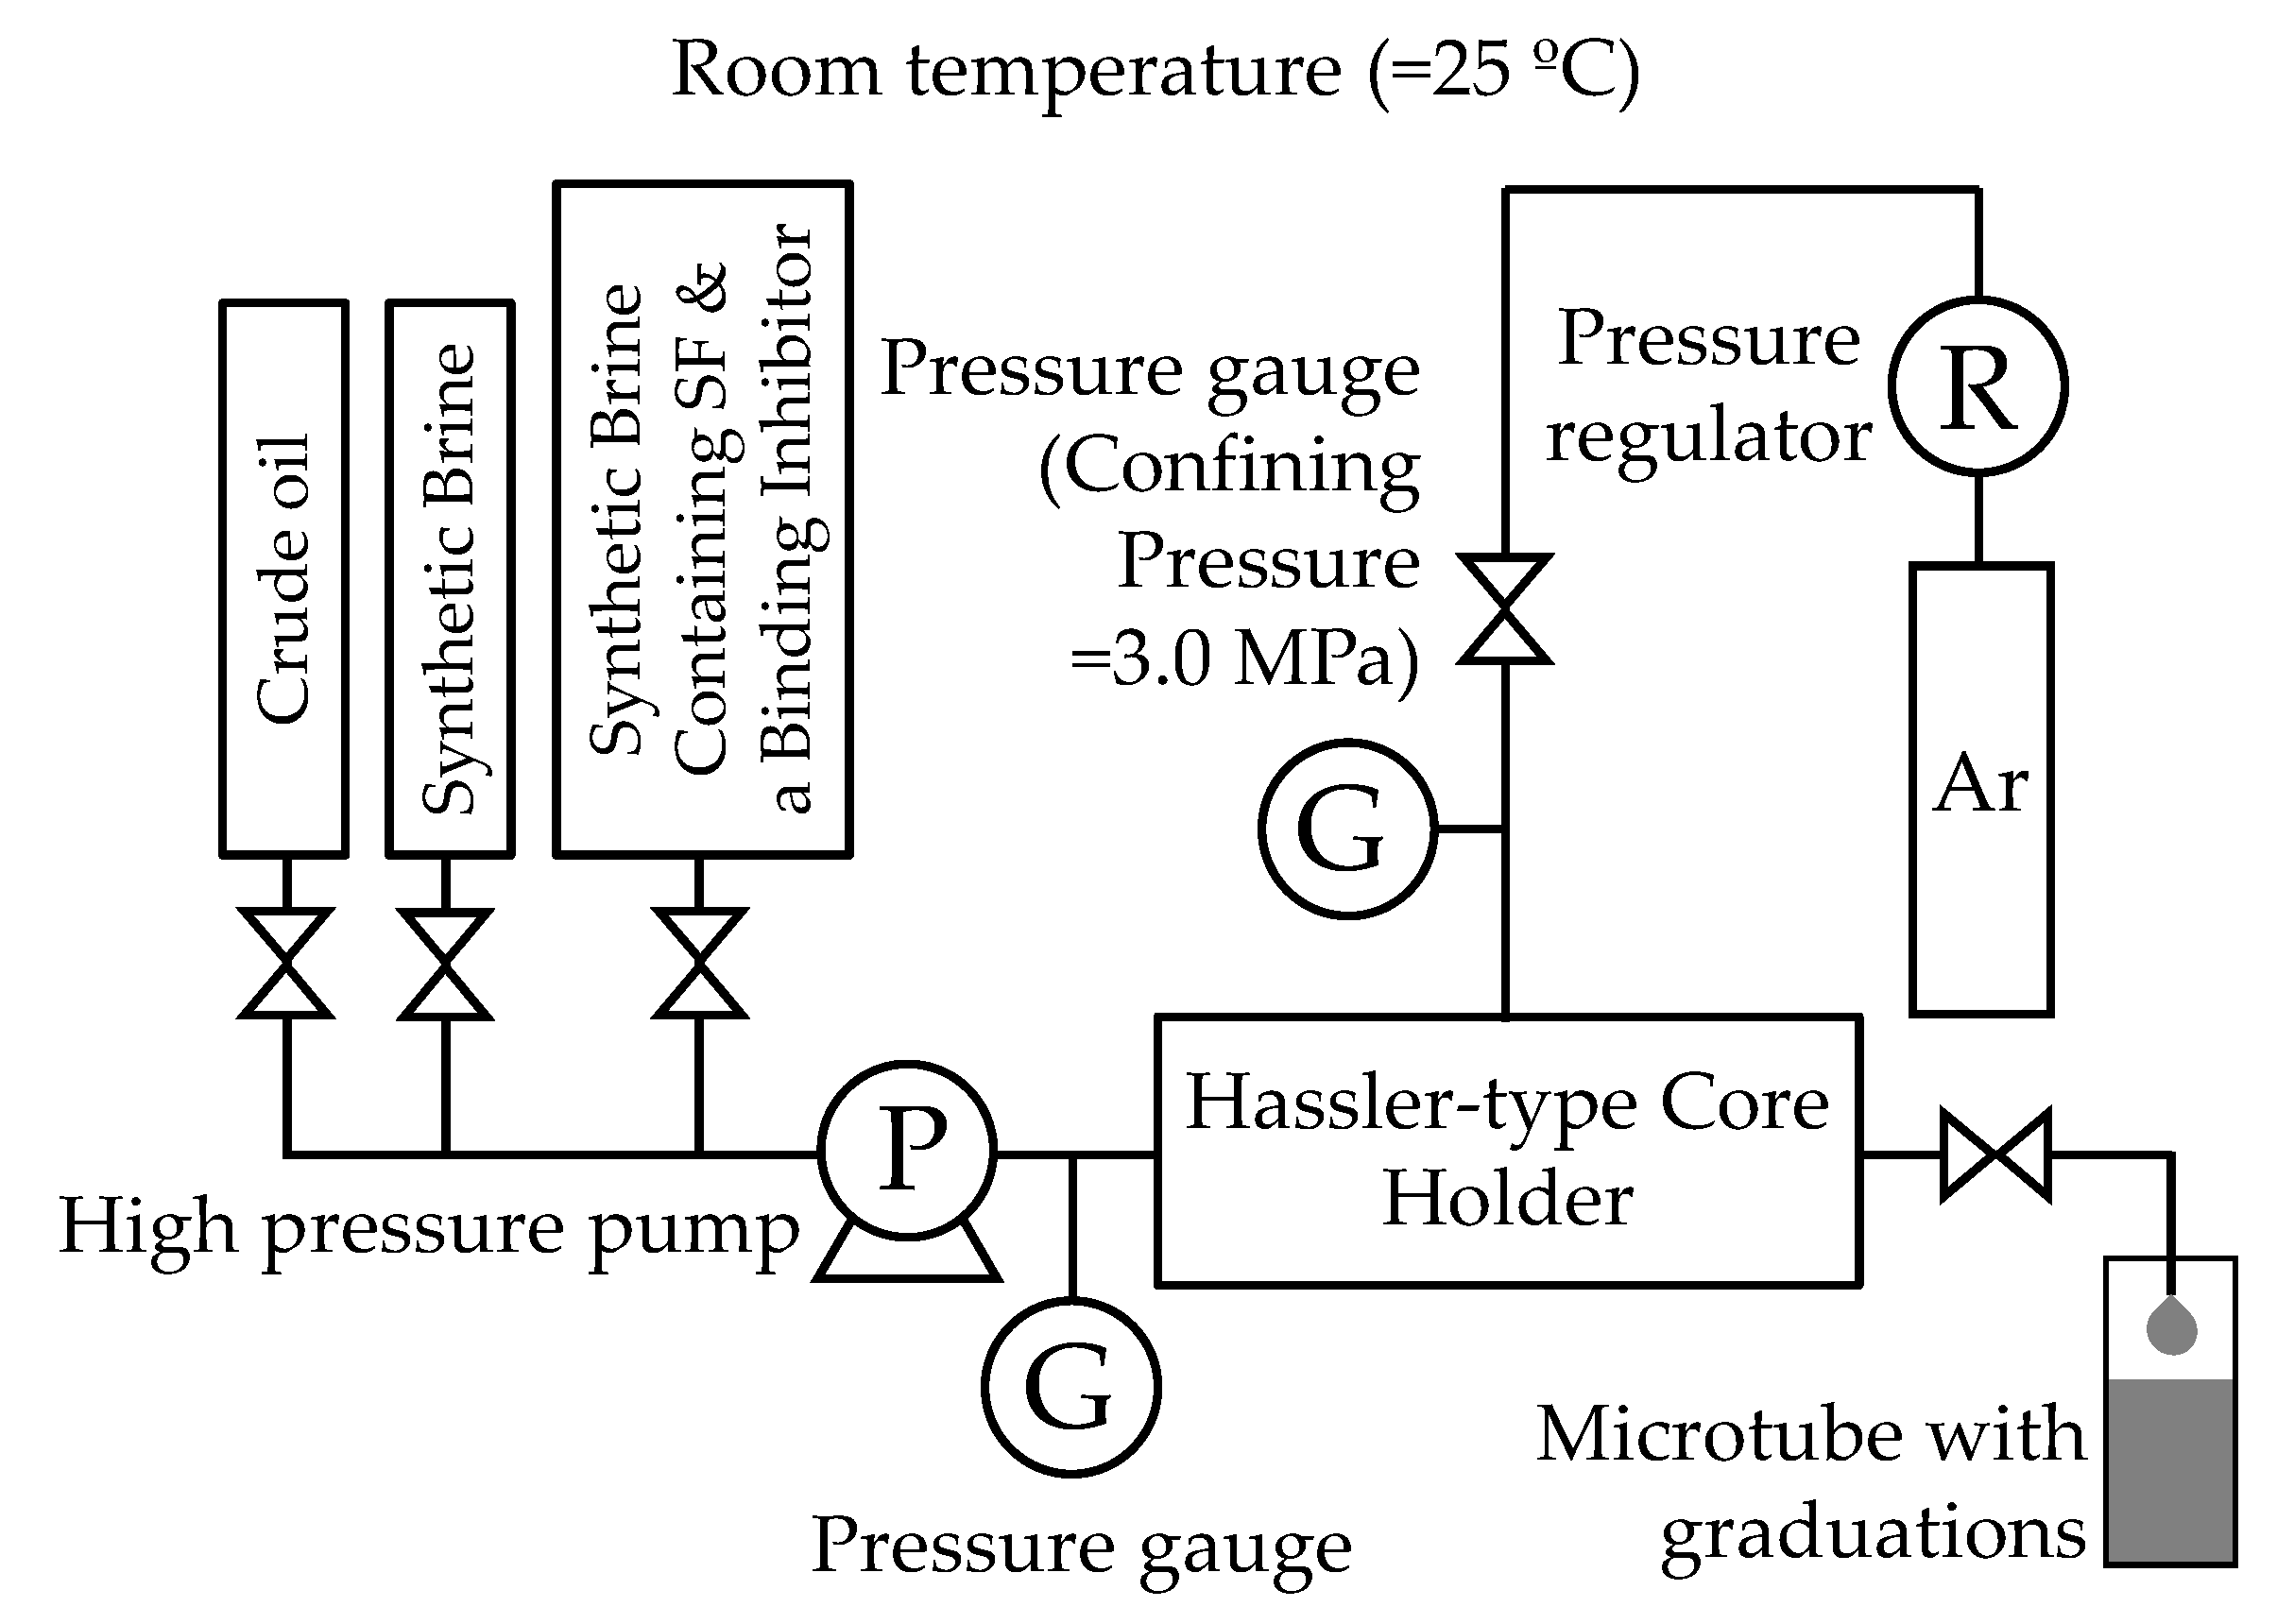
The surfactin injectivity tests were carried out by using a permeability measurement system, which mainly consisted of a hassler type core holder, a constant flow rate pump, a pressure gauge and a tank of fluids which were injected. Figure 1 shows the schematic image of the permeability measurement system used in this study. The Berea sandstone core, which had been saturated with the synthetic brine, was installed into the core holder. Then, 3.0 MPa of confining radial pressure was applied to the core by argon gas. The tests were carried out at room temperature (25 °C) and atmospheric pressure.
First, the synthetic brine was injected into the core using the constant flow rate pump in order to measure the absolute permeability of the core. The absolute permeability was calculated by using the following Darcy equation.
K = Q μ L A Δ P
where K is the absolute permeability of the core, Q is the flow rate, μ is the viscosity of the fluid injected, L is the length of the core, A is the cross-sectional area of the core, and ΔP is the pressure difference between both ends of the core. The synthetic brine was injected into the core with three different flow rates in the range from 0.20 to 1.0 mL/min. Then, the absolute permeability was calculated three times for a core by using three different pairs of the flow rate and the pressure difference. The mean value of the three absolute permeability values was defined as the initial absolute permeability of the core.
Subsequently, the apparent permeability of the core was measured by injecting the synthetic brine containing surfactin and an inhibitor into the core with the constant flow rate of 0.25 mL/min. The apparent permeability of the core was calculated by the Darcy equation every time when 0.5 mL of fluid was flowed out from the core. Then, 3.0 pore volumes (PV) of the synthetic brine containing surfactin and an inhibitor were totally injected into the core. The injectivity of the synthetic brine containing surfactin and an inhibitor was evaluated with the value of specific permeability. The specific permeability was defined as the quotient of the apparent permeability divided by the initial absolute permeability as follows.
k s = k a K
where ks is the specific permeability, ka is the apparent permeability which was measured by injecting the synthetic brine containing surfactin and an inhibitor into the core, and K is the absolute permeability, which was measured by injecting the synthetic brine into the core.

2.2.4. Core Flooding Experiments

Two Berea sandstone cores whose absolute permeability was different were used for the core flooding experiments in this study. The diameter and length of the cores were 44.3 and 72.3 mm, respectively. The permeability of the cores was measured by injecting the synthetic brine into the cores. The permeability of the less permeable core and more permeable core was 5.9 and 175 md, respectively. In this study, the permeability of the less permeable core was set based on the supposition of the permeability of an actual oil reservoir. Meanwhile, the more permeable core was used for determining the effect of surfactin on the enhancement of oil recovery by assuming a case where the influence of permeability reduction was minor.
The cores were soaked in the synthetic brine and the pore spaces in the cores were completely saturated with the synthetic brine under vacuum conditions. Subsequently, the weight of the brine-saturated core was measured. The pore volume of the core was calculated based on the brine density and weight difference between the dry core and brine-saturated core. The porosity of the less permeable core and more permeable core was 13.7% and 19.8%, respectively.
The core flooding experiment was carried out by using a core flooding system which consisted of a hassler type core holder, constant flow rate pumps, pressure gauge and tanks of fluids which were injected. Figure 2 shows the schematic image of the core flooding system which was used in this study. The experiment was carried out at room temperature (25 °C) and atmospheric pressure. A Berea sandstone core which had been saturated with the synthetic brine was installed into the core holder. Then, 3.0 MPa of confining radial pressure was applied to the core by water. A core flooding experiment was carried out as follows. First, synthetic brine was injected into the core with three different flow rates of 0.22, 0.44 and 0.96 mL/min using the constant flow rate pump in order to measure the absolute permeability of the core. Then, about 3.0 pore volumes (PV) of crude oil were injected into the core with the flow rate of 0.07 mL/min. The original oil in place (OOIP) should be equal to the volume of synthetic brine displaced by the oil injected. After the experimental oil reservoir was prepared, primary oil recovery was carried out by injecting 4.0 PV of synthetic brine into the oil reservoir with a flow rate of 0.07 mL/min. The injection pressure was recorded during the injection of the synthetic brine. The effluent from the oil reservoir was collected every 20 min into graduated microtubes. The primary oil recovery was continued until the oil did not flow out from the oil reservoir. Subsequently, 3.1–3.6 PV of synthetic brine containing surfactin and the inhibitor was injected into the oil reservoir with the flow rate of 0.07 mL/min. The injection pressure was recorded and the effluent from the oil reservoir was collected during the injection of the synthetic brine containing surfactin and the inhibitor in the same way as in the primary oil recovery.

3. Results and Discussion

3.1. Turbidity Measurements

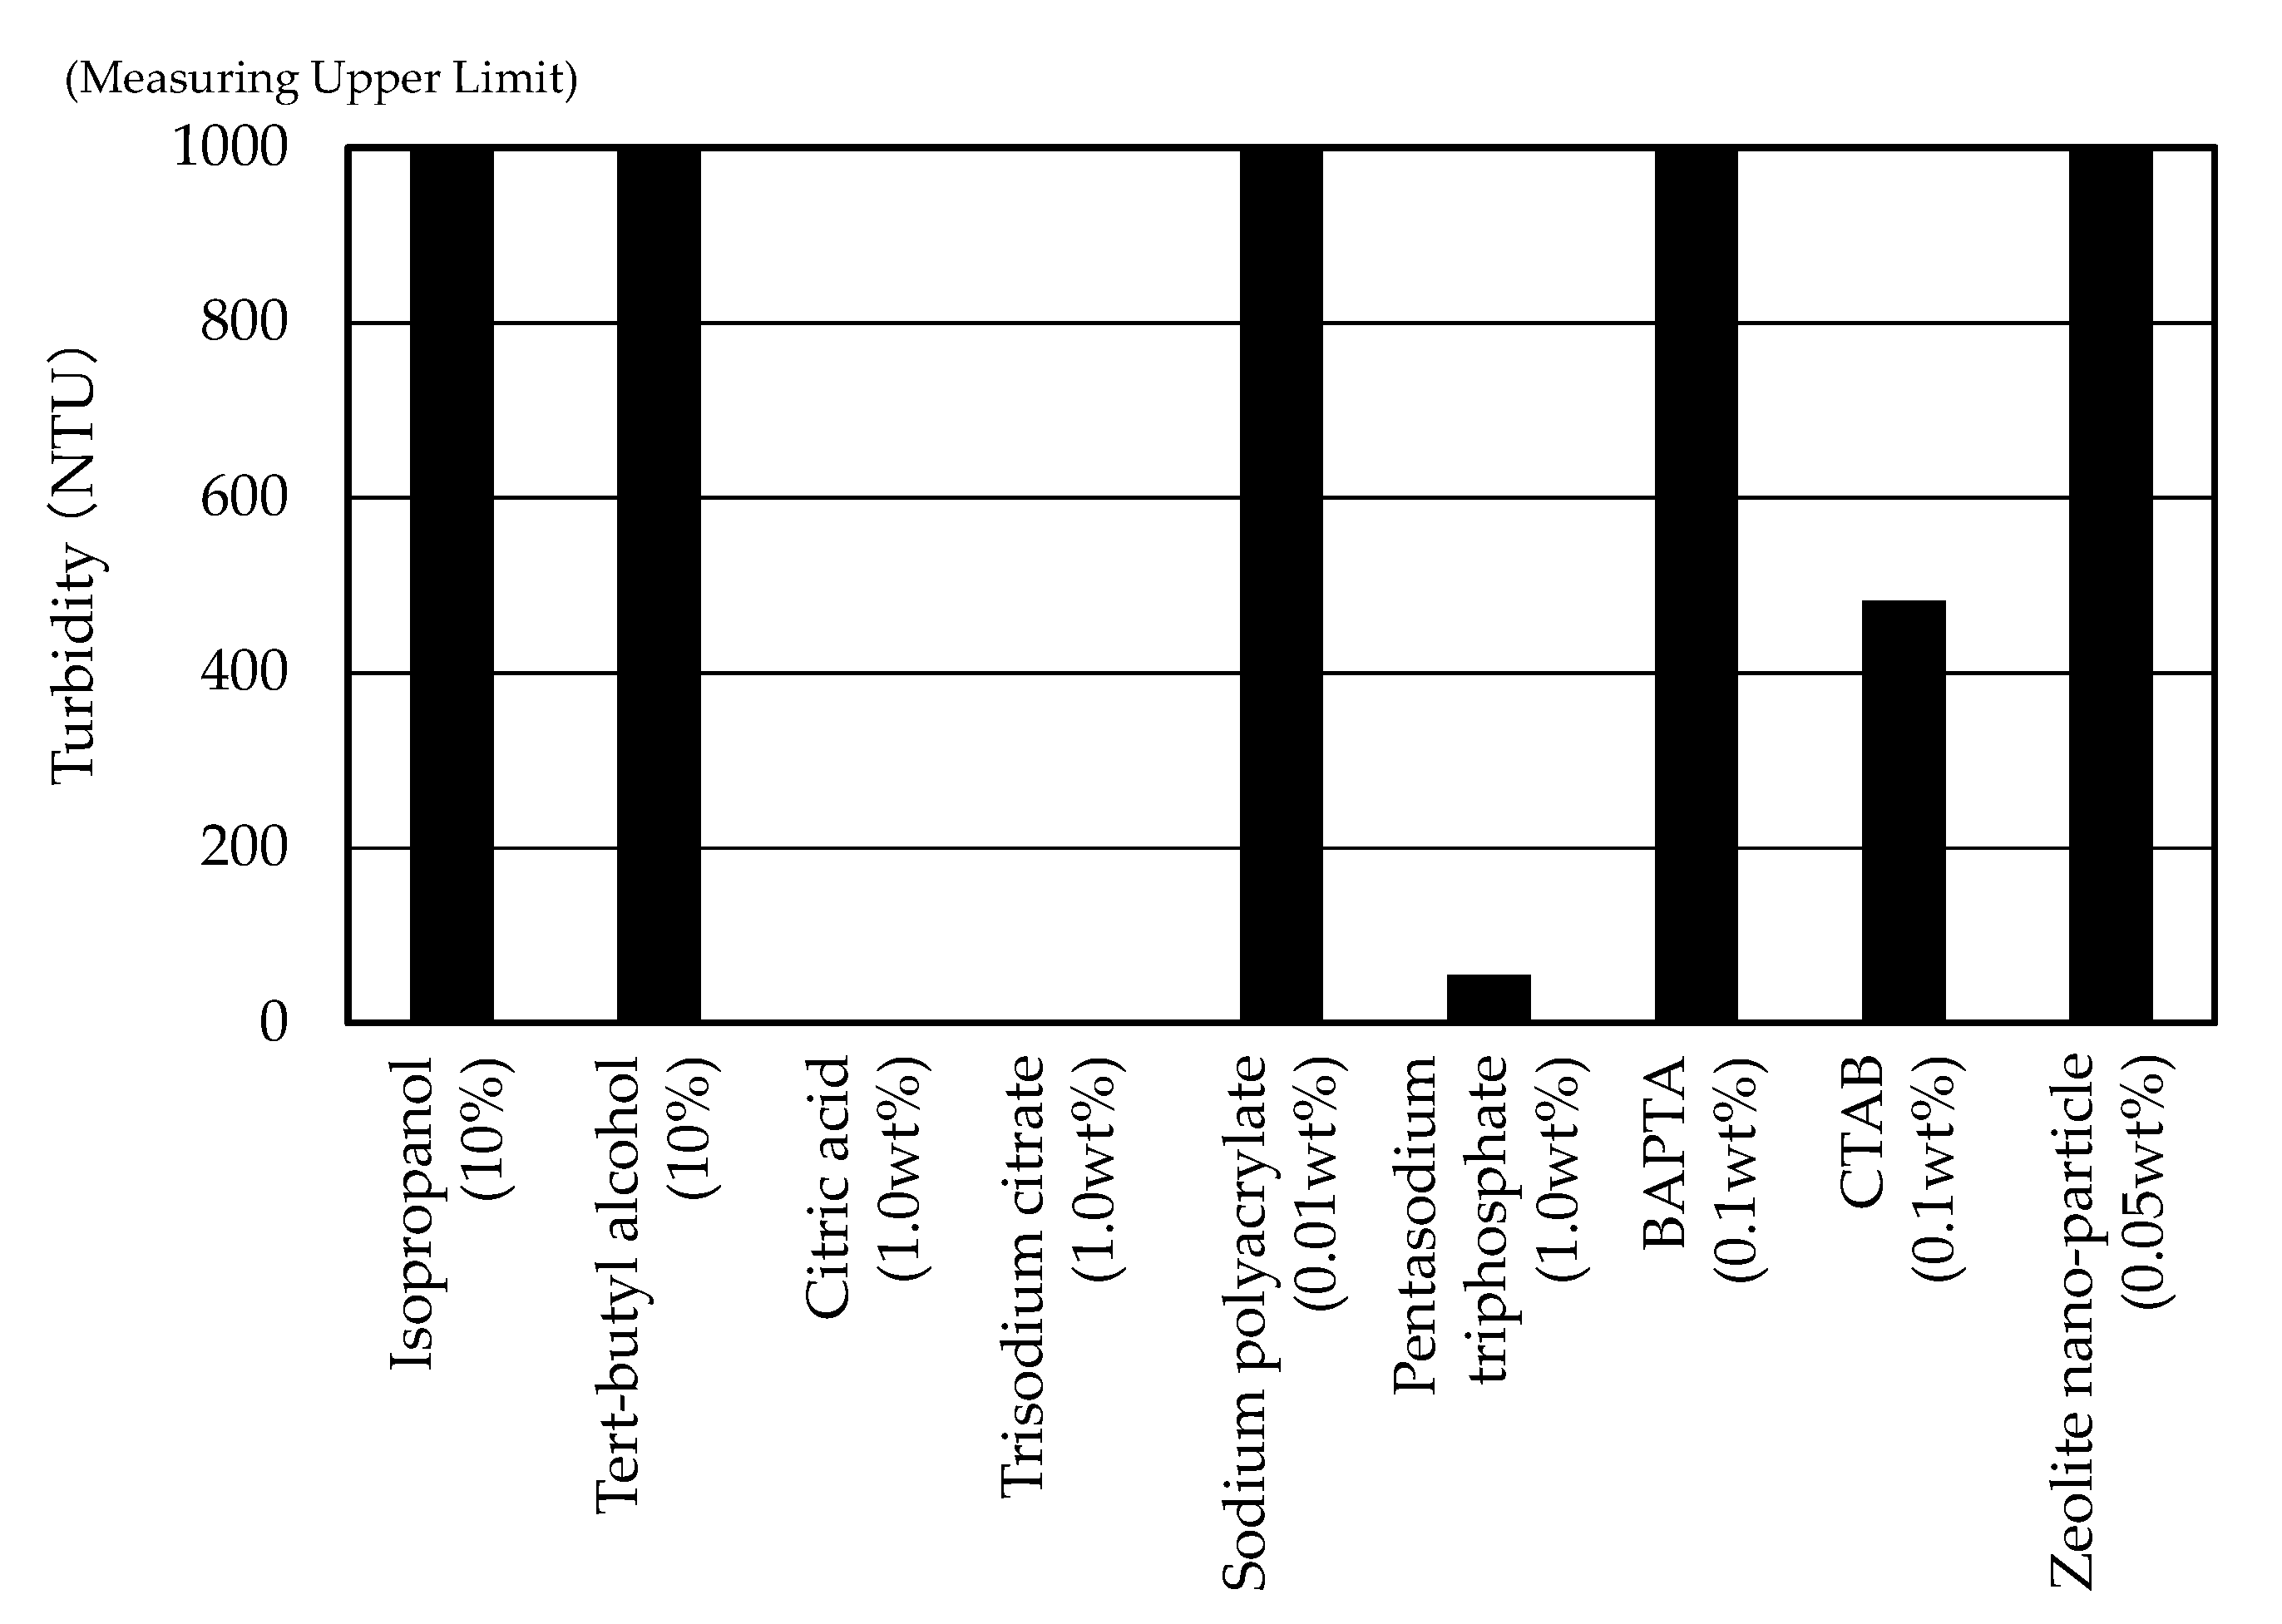
Figure 3 shows the results of the turbidity measurement of the testing solution which was carried out for the first screening of the candidates of the inhibitor. The turbidity of the solution containing citric acid, trisodium citrate or pentasodium triphosphate was extremely low as compared with that of the solution containing other candidates. These results indicate that those three candidates successfully prevented the surfactin from forming precipitation of surfactin calcium.
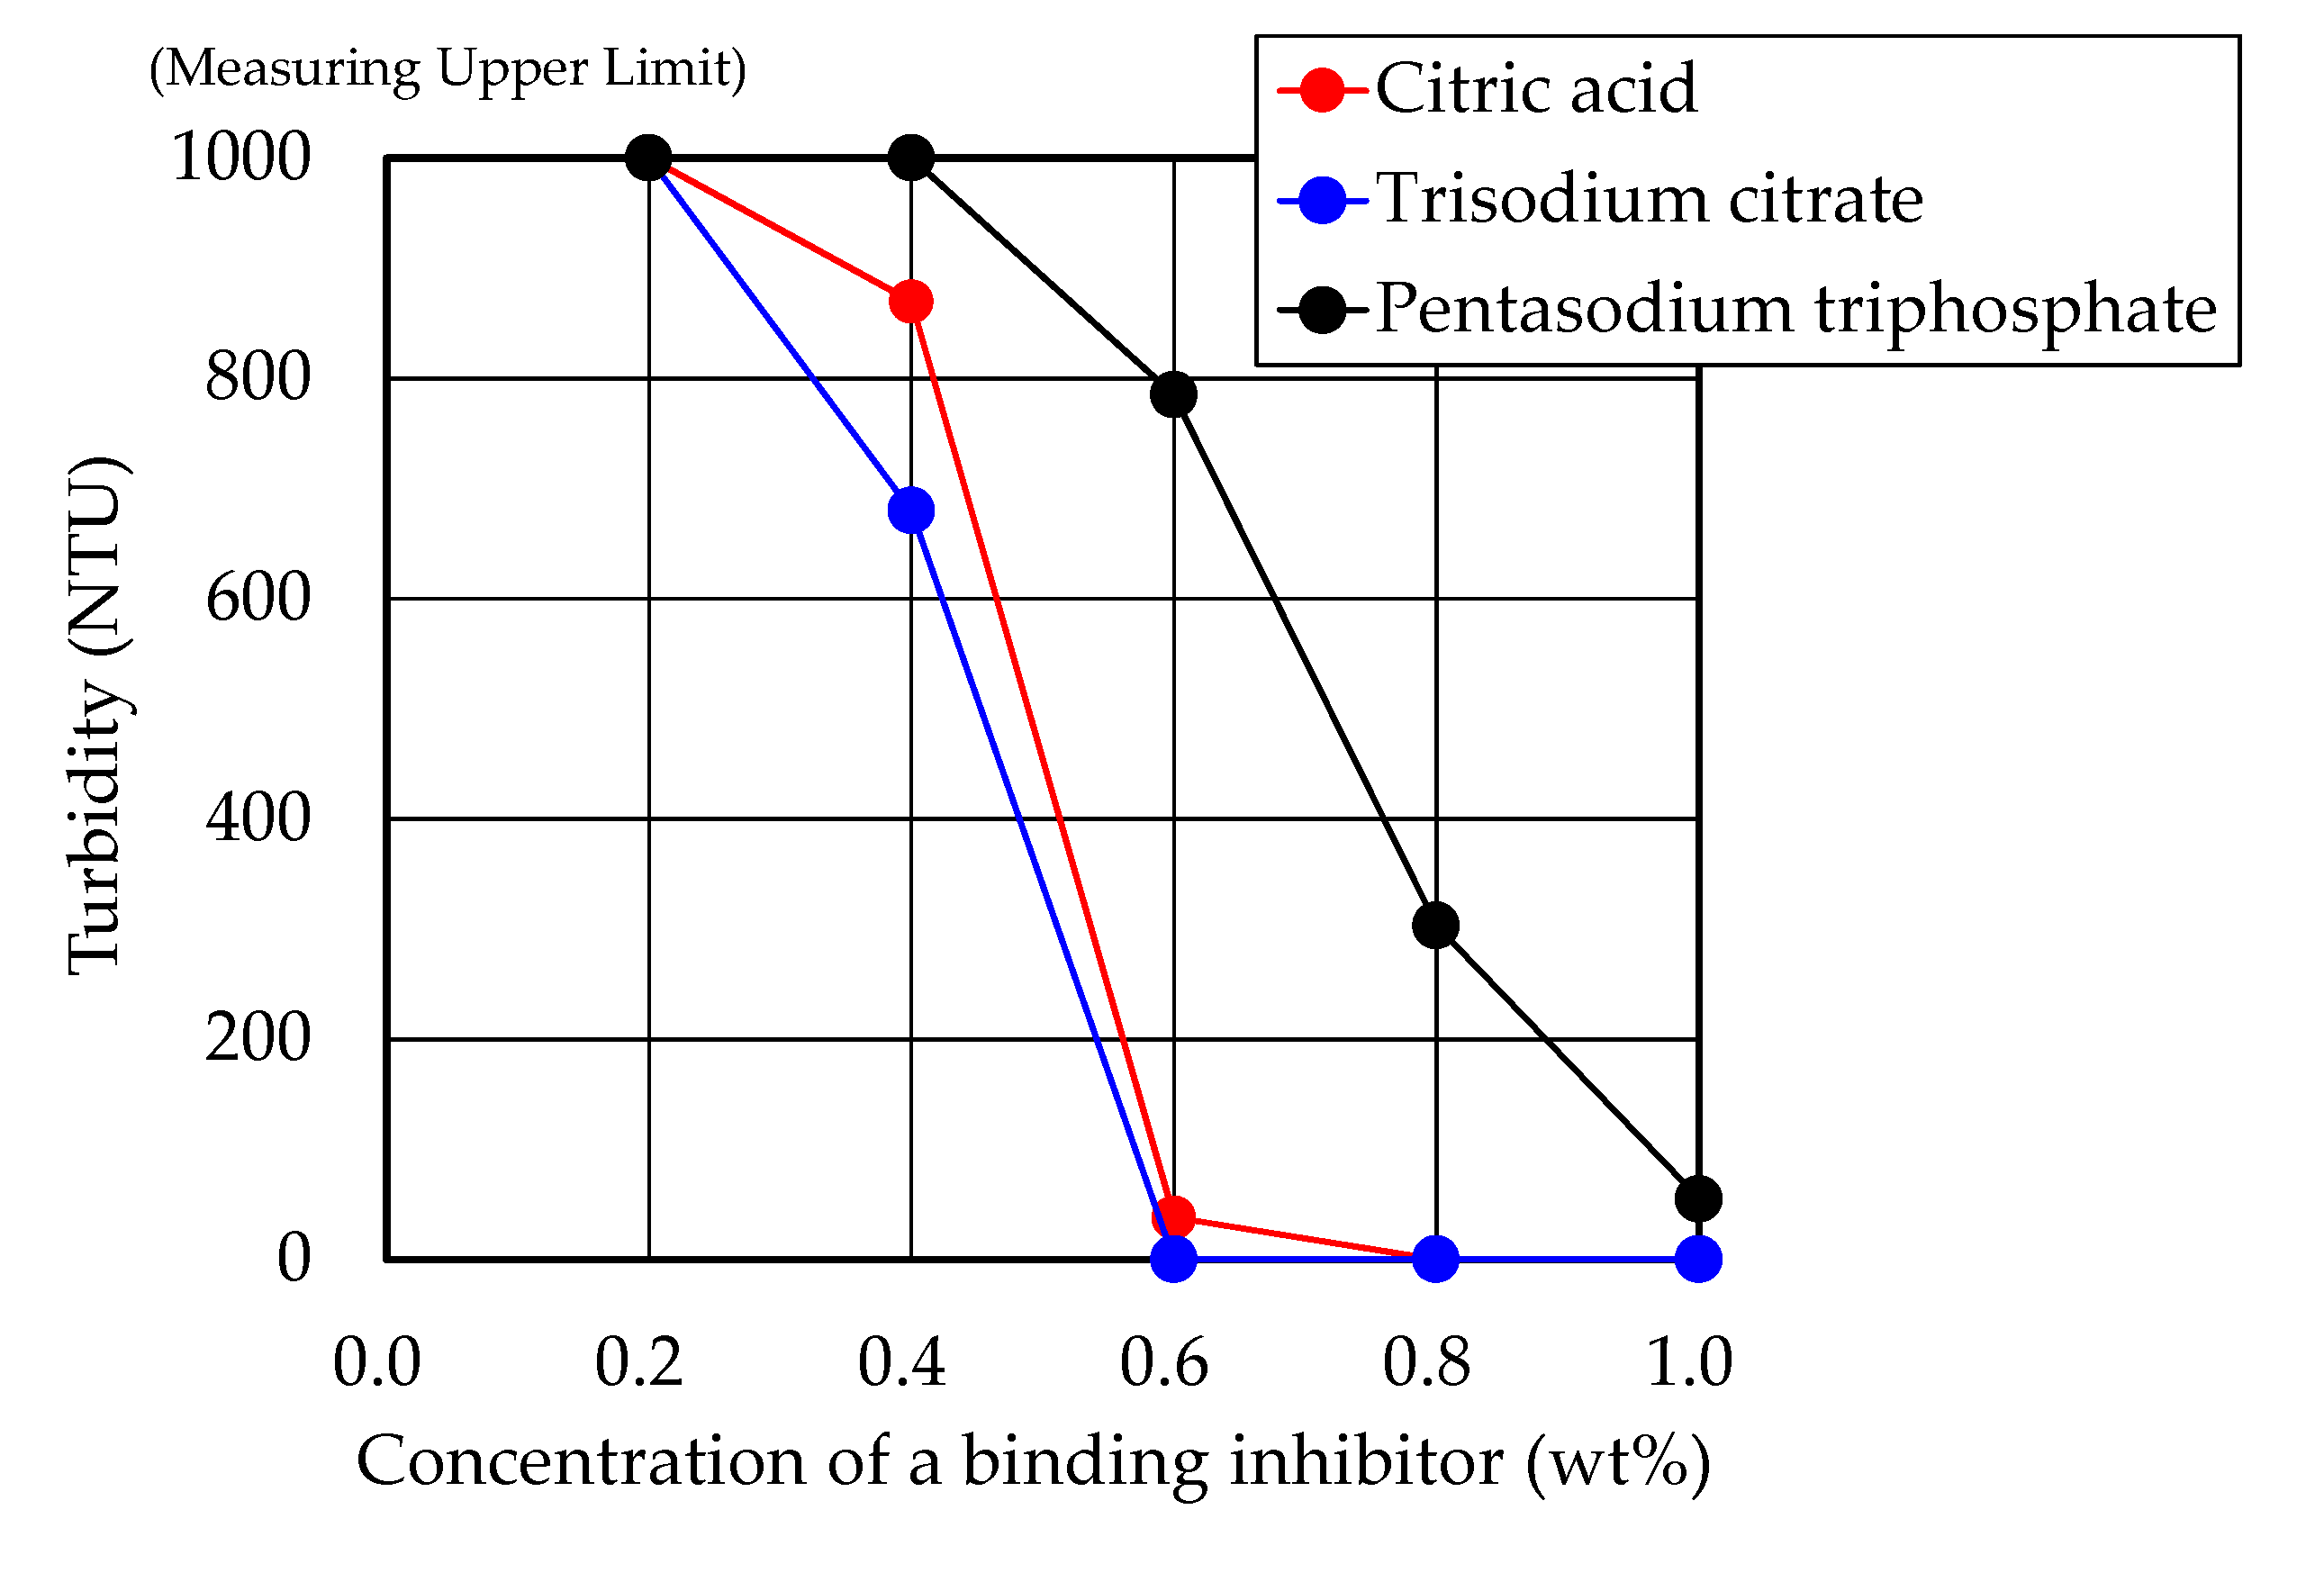
The minimum required concentrations of these three candidates for preventing the surfactin from forming the precipitation were therefore evaluated by the additional turbidity measurement tests. Figure 4 shows the results of the turbidity measurement of the testing solution which contained the three candidates, respectively, with different concentrations. The minimum required concentration of citric acid and trisodium citrate for preventing the surfactant from forming the precipitation was 0.6 wt%, while that of pentasodium triphosphate was 1.0 wt%. As the minimum required concentration of citric acid and trisodium citrate was lower than that of pentasodium triphosphate, both citric acid and trisodium citrate were selected as the potential inhibitors and subjected to the next screening.

3.2. IFT Measurements

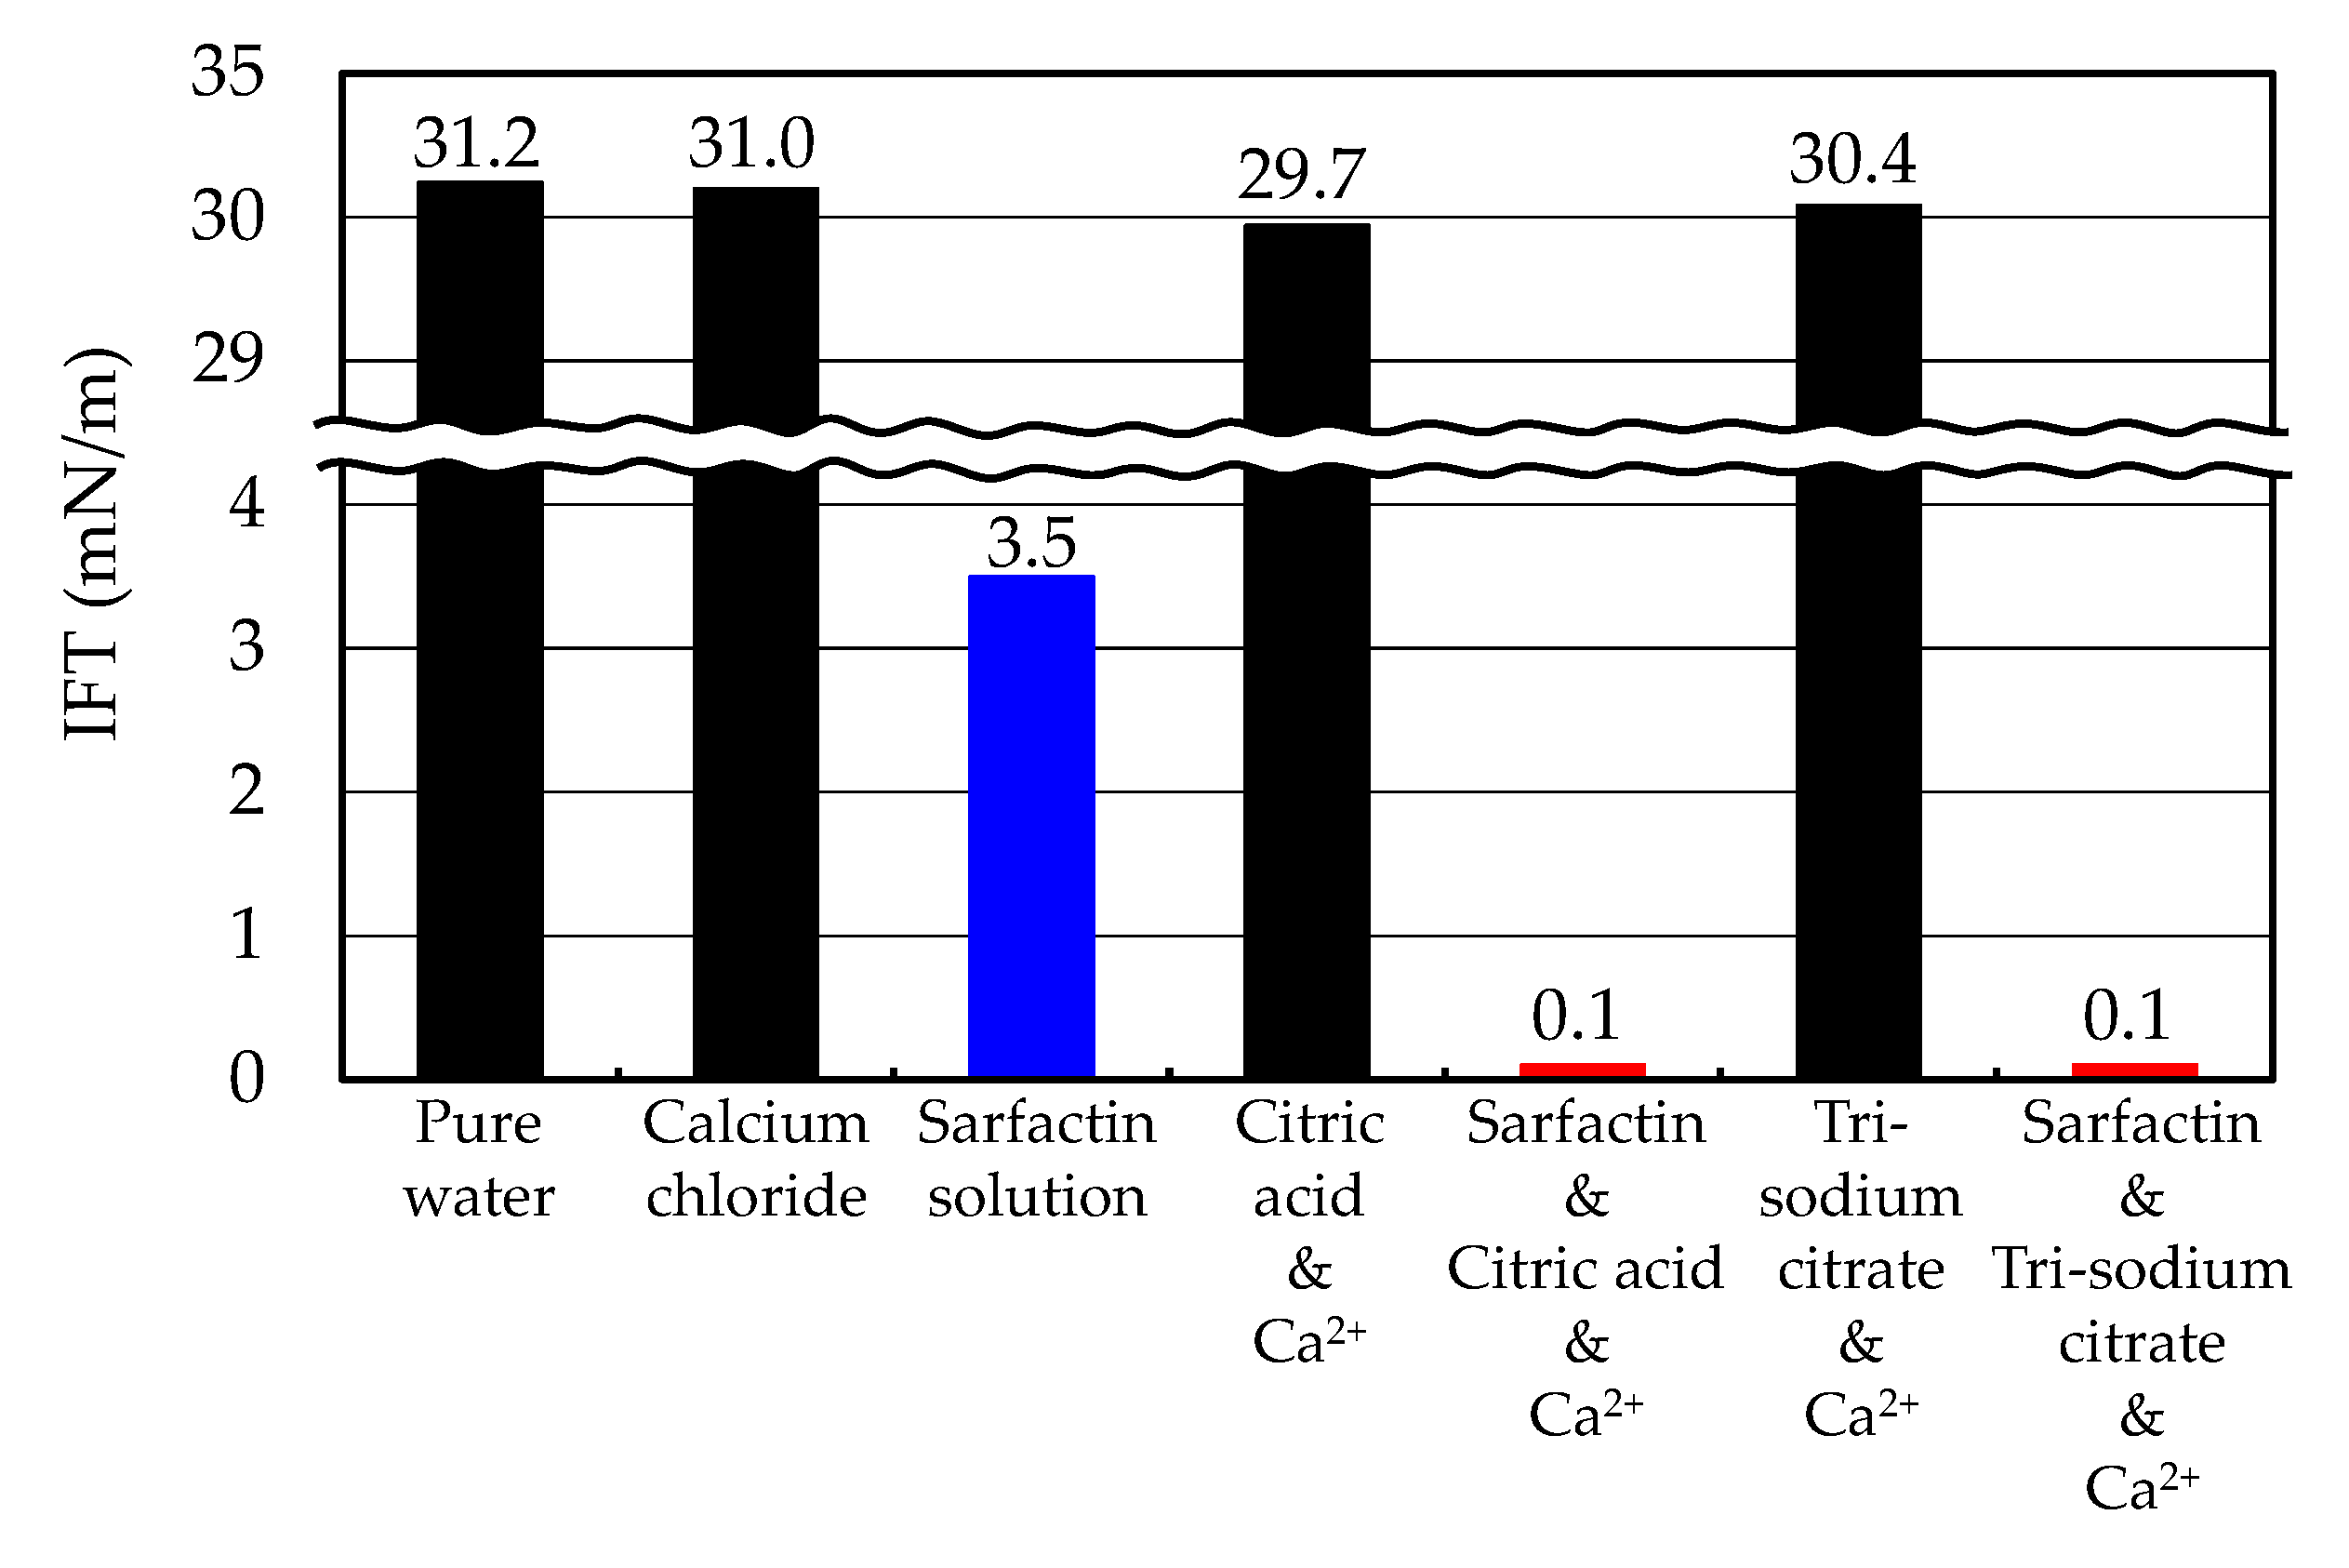
The IFT between crude oil and the testing solution which contained citric acid or trisodium citrate was measured in order to examine the effect of those chemicals on the reduction in the IFT. The concentration of both chemicals in the testing solution was 0.6 wt%, which was their minimum required concentration for preventing the surfactin from forming the precipitation. IFT between oil and pure surfactin solution was also measured as a comparison reference.
Figure 5 shows the results of the measurements of the IFT between crude oil and each testing solution. The IFT between the oil and the testing solution containing citric acid and tri-sodium citrate was less than 0.1 mN/m, while the IFT between oil and pure surfactin solution was 3.5 mN/m. The IFT reduction was assumed to be brought by the synergistic effects of the surfactin and those additives because the IFT between the oil and calcium solution, citric acid solution and tri-sodium citrate solution was similar to the IFT between oil and pure water, as shown in the Figure 5. These results suggest that both citric acid and trisodium citrate do not inhibit the IFT reducing effect of the surfactin, but rather they enhance the effect thereof, and have strong potential as co-surfactants of surfactin. Both citric acid and trisodium citrate were therefore subjected to the next screening.

3.3. Surfactin Injectivity Tests

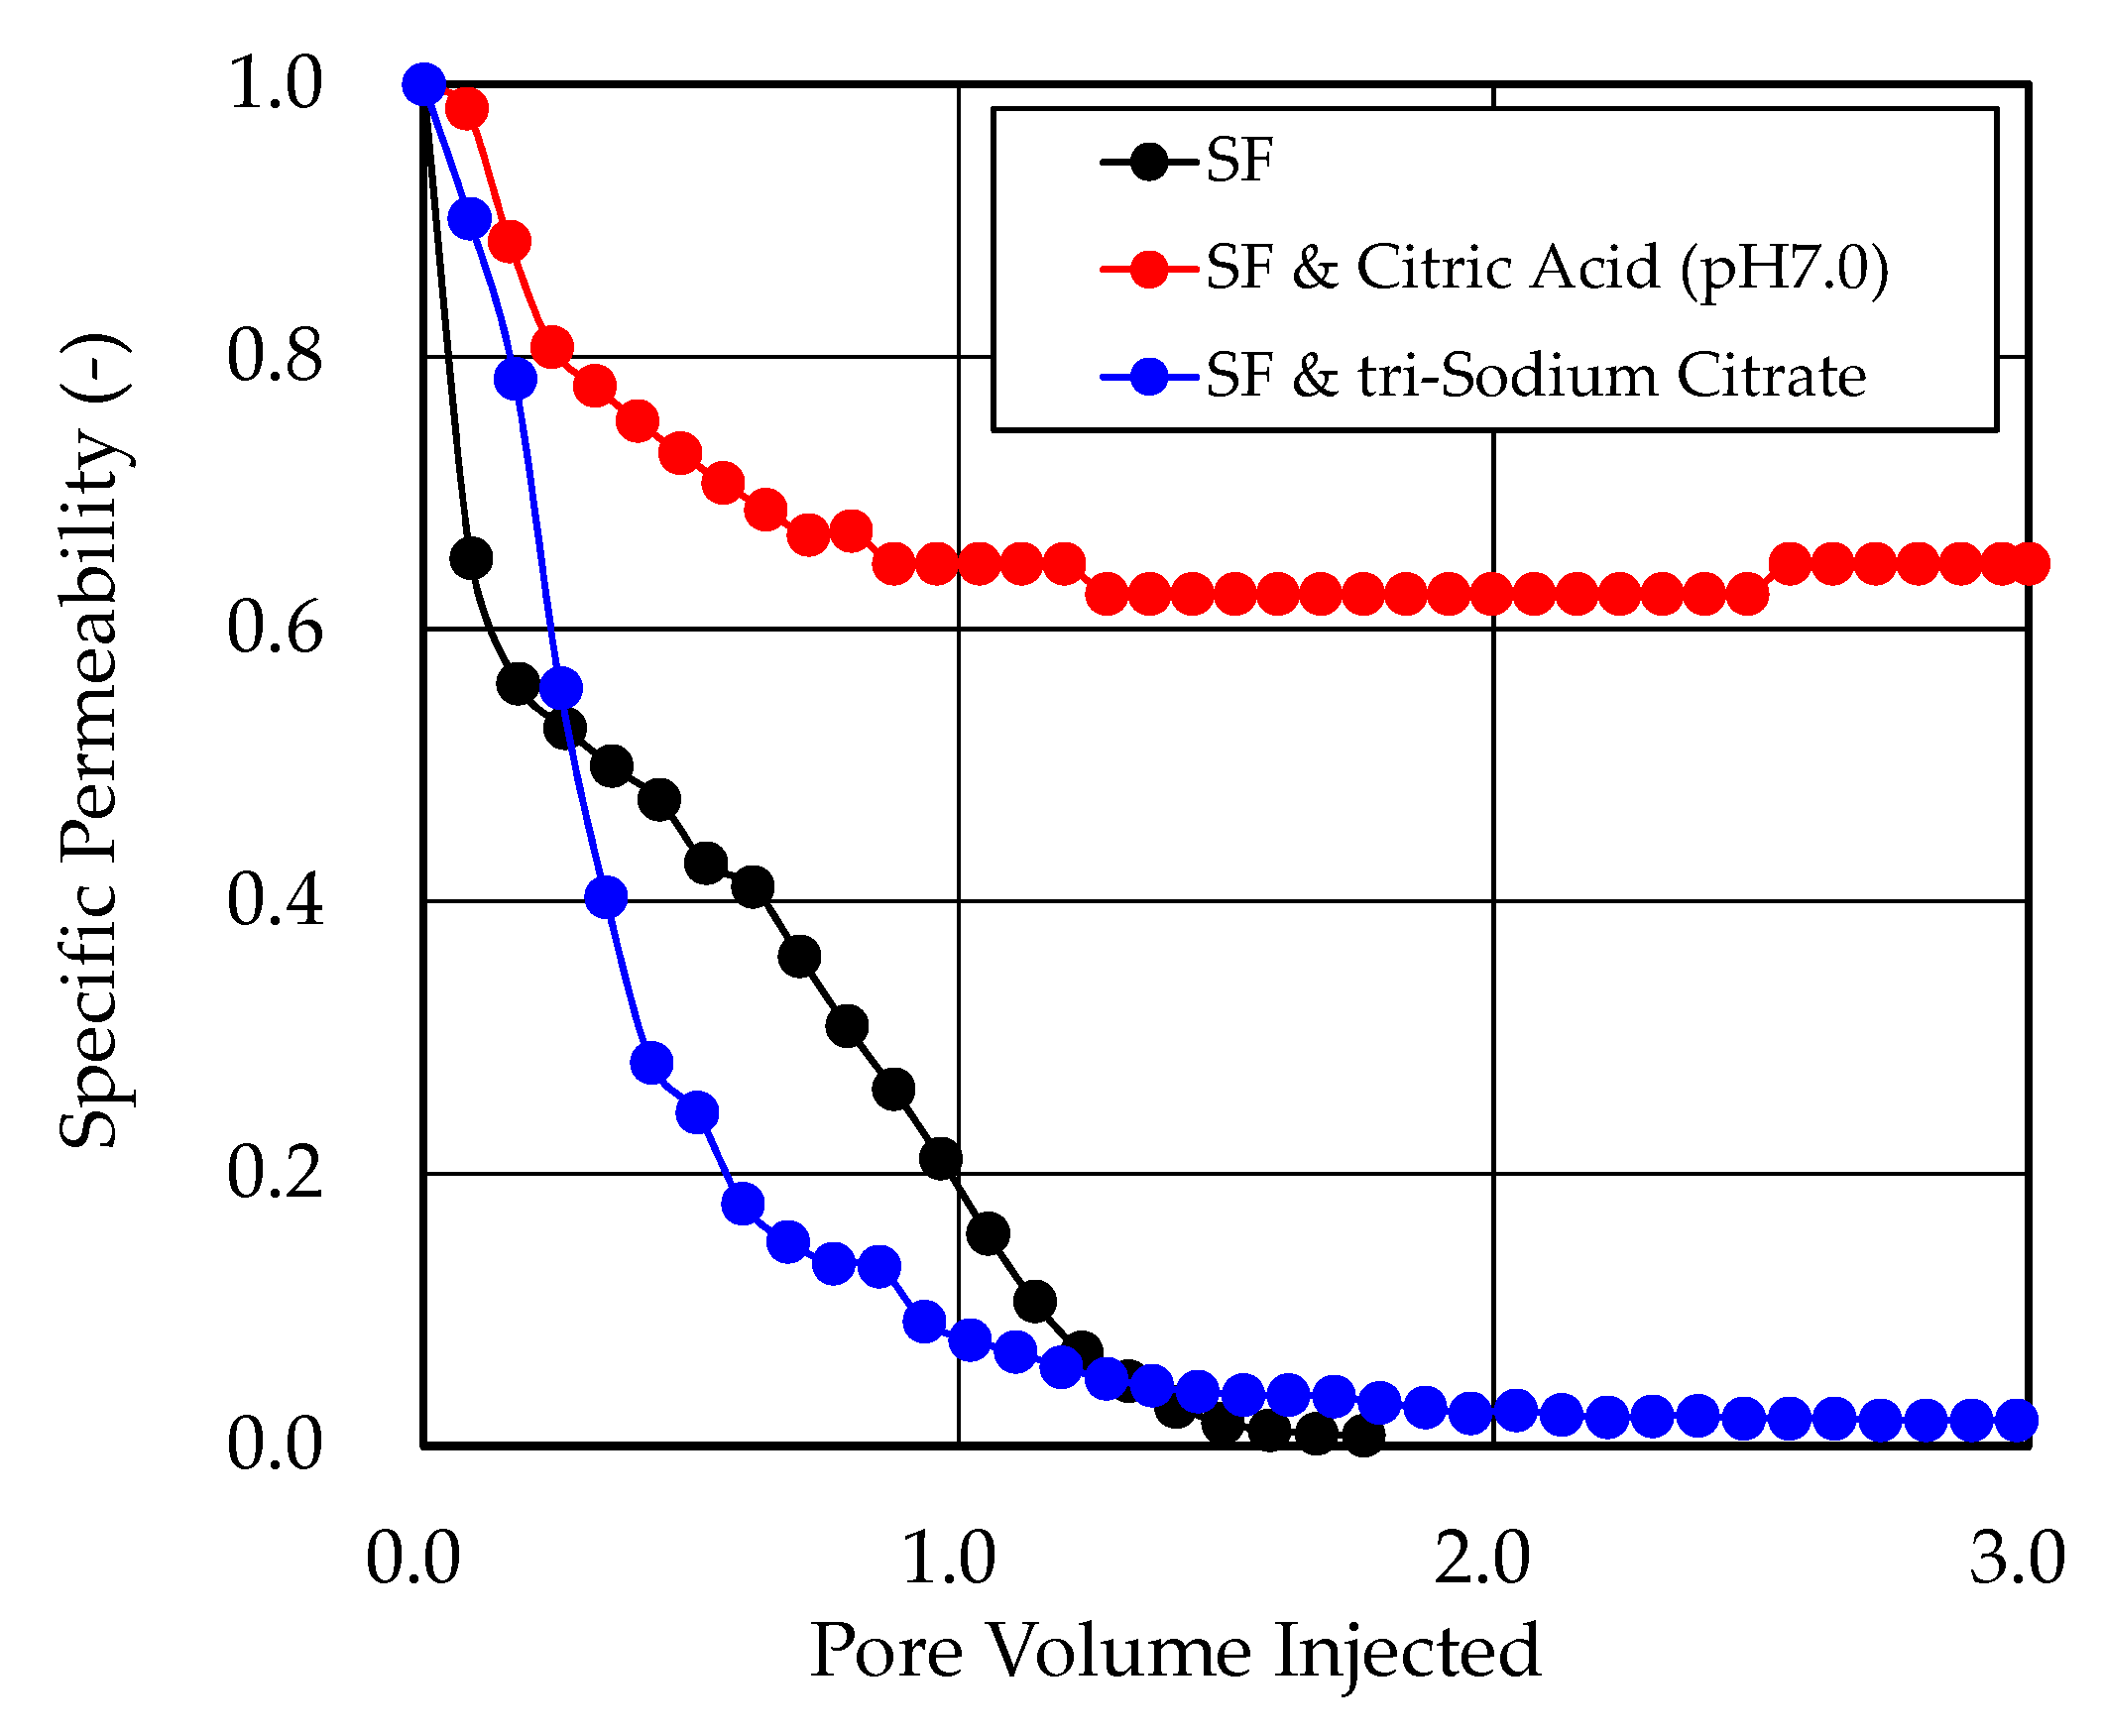
Table 2 shows the results of the surfactin injectivity test. Figure 6 shows the temporal change in the specific permeability during the injection of the testing solutions.
When the synthetic brine containing surfactin was injected into the core without the candidate chemicals, the specific permeability was significantly decreased to less than 0.1, as shown in Figure 6. Similarly, the specific permeability was also decreased to less than 0.1 by the injection of synthetic brine containing surfactin and trisodium citrate, as shown in Figure 6. On the other hand, the specific permeability was not decreased so much when the synthetic brine containing surfactin and citric acid was injected into the core, as shown in Figure 6. The specific permeability was suppressed to 30% by adding citric acid into the surfactin solution.
The precipitation of surfactin calcium was formed in the core by the reaction between surfactin and calcium ion and it caused a decrease in the specific permeability during the injection of surfactin solution without the candidate chemicals. A decrease in the specific permeability was also found during the injection of surfactin solution with trisodium citrate, which was a candidate chemical. Yellowish-red colloidal particles were found in the effluent during the injection of surfactin solution containing trisodium citrate. The yellowish-red colloidal particles were dried and subjected to the ultimate analysis using an X-ray fluorescence spectrometer (XRF). The content of ferrum and aluminum in the particles was quite high—28.5% and 12.8%, respectively. In general, ferrum and aluminum are dissolved into liquid phase and form the hydroxide colloids under high pH condition. As the pH of the synthetic brine containing trisodium citrate was high, specifically 8.5, it was assumed that ferrum and aluminum, which had been originally contained in the sandstone core, were dissolved into the liquid phase under high pH condition and the colloids of ferrous hydroxide and aluminum hydroxide were formed in the core. Those colloidal particles blocked the pore throat in the core and the specific permeability was significantly decreased.
On the other hand, the specific permeability was not decreased so much during the injection of the surfactin solution containing citric acid. It was assumed that the precipitation of surfactin calcium formed at the contact surface between the original synthetic brine and the injected synthetic brine containing surfactin and citric acid due to a shortage of citric acid at that area. Due to this, the specific permeability was a slightly decreased by the injection of the synthetic brine containing surfactin and citric acid. However, the colloidal particles were not found in the effluent which was collected during the injection of synthetic brine containing surfactin and citric acid. As the pH of the synthetic brine containing citric acid was adjusted to 7.0, the hydroxide colloids were not formed so much in the core and the specific permeability was not decreased as much.

3.4. Core Flooding Experiments

Table 3 shows the results of core flooding experiments. The volume of original oil in place in the less permeable oil reservoir and more permeable oil reservoir was 11.9 and 10.1 mL, respectively. The initial oil saturation of those oil reservoirs was 77.9% and 63.7%, respectively, and 6.5 mL and 6.8 mL of oil was recovered from those oil reservoirs, respectively, by injecting 4.0 PV of synthetic brine into the oil reservoirs. The primary oil recovery factor of those oil reservoirs was therefore 54.8% and 63.7%, respectively. As the result, the residual oil saturation of those oil reservoirs after the primary oil recovery was 35.2% and 24.0%, respectively.
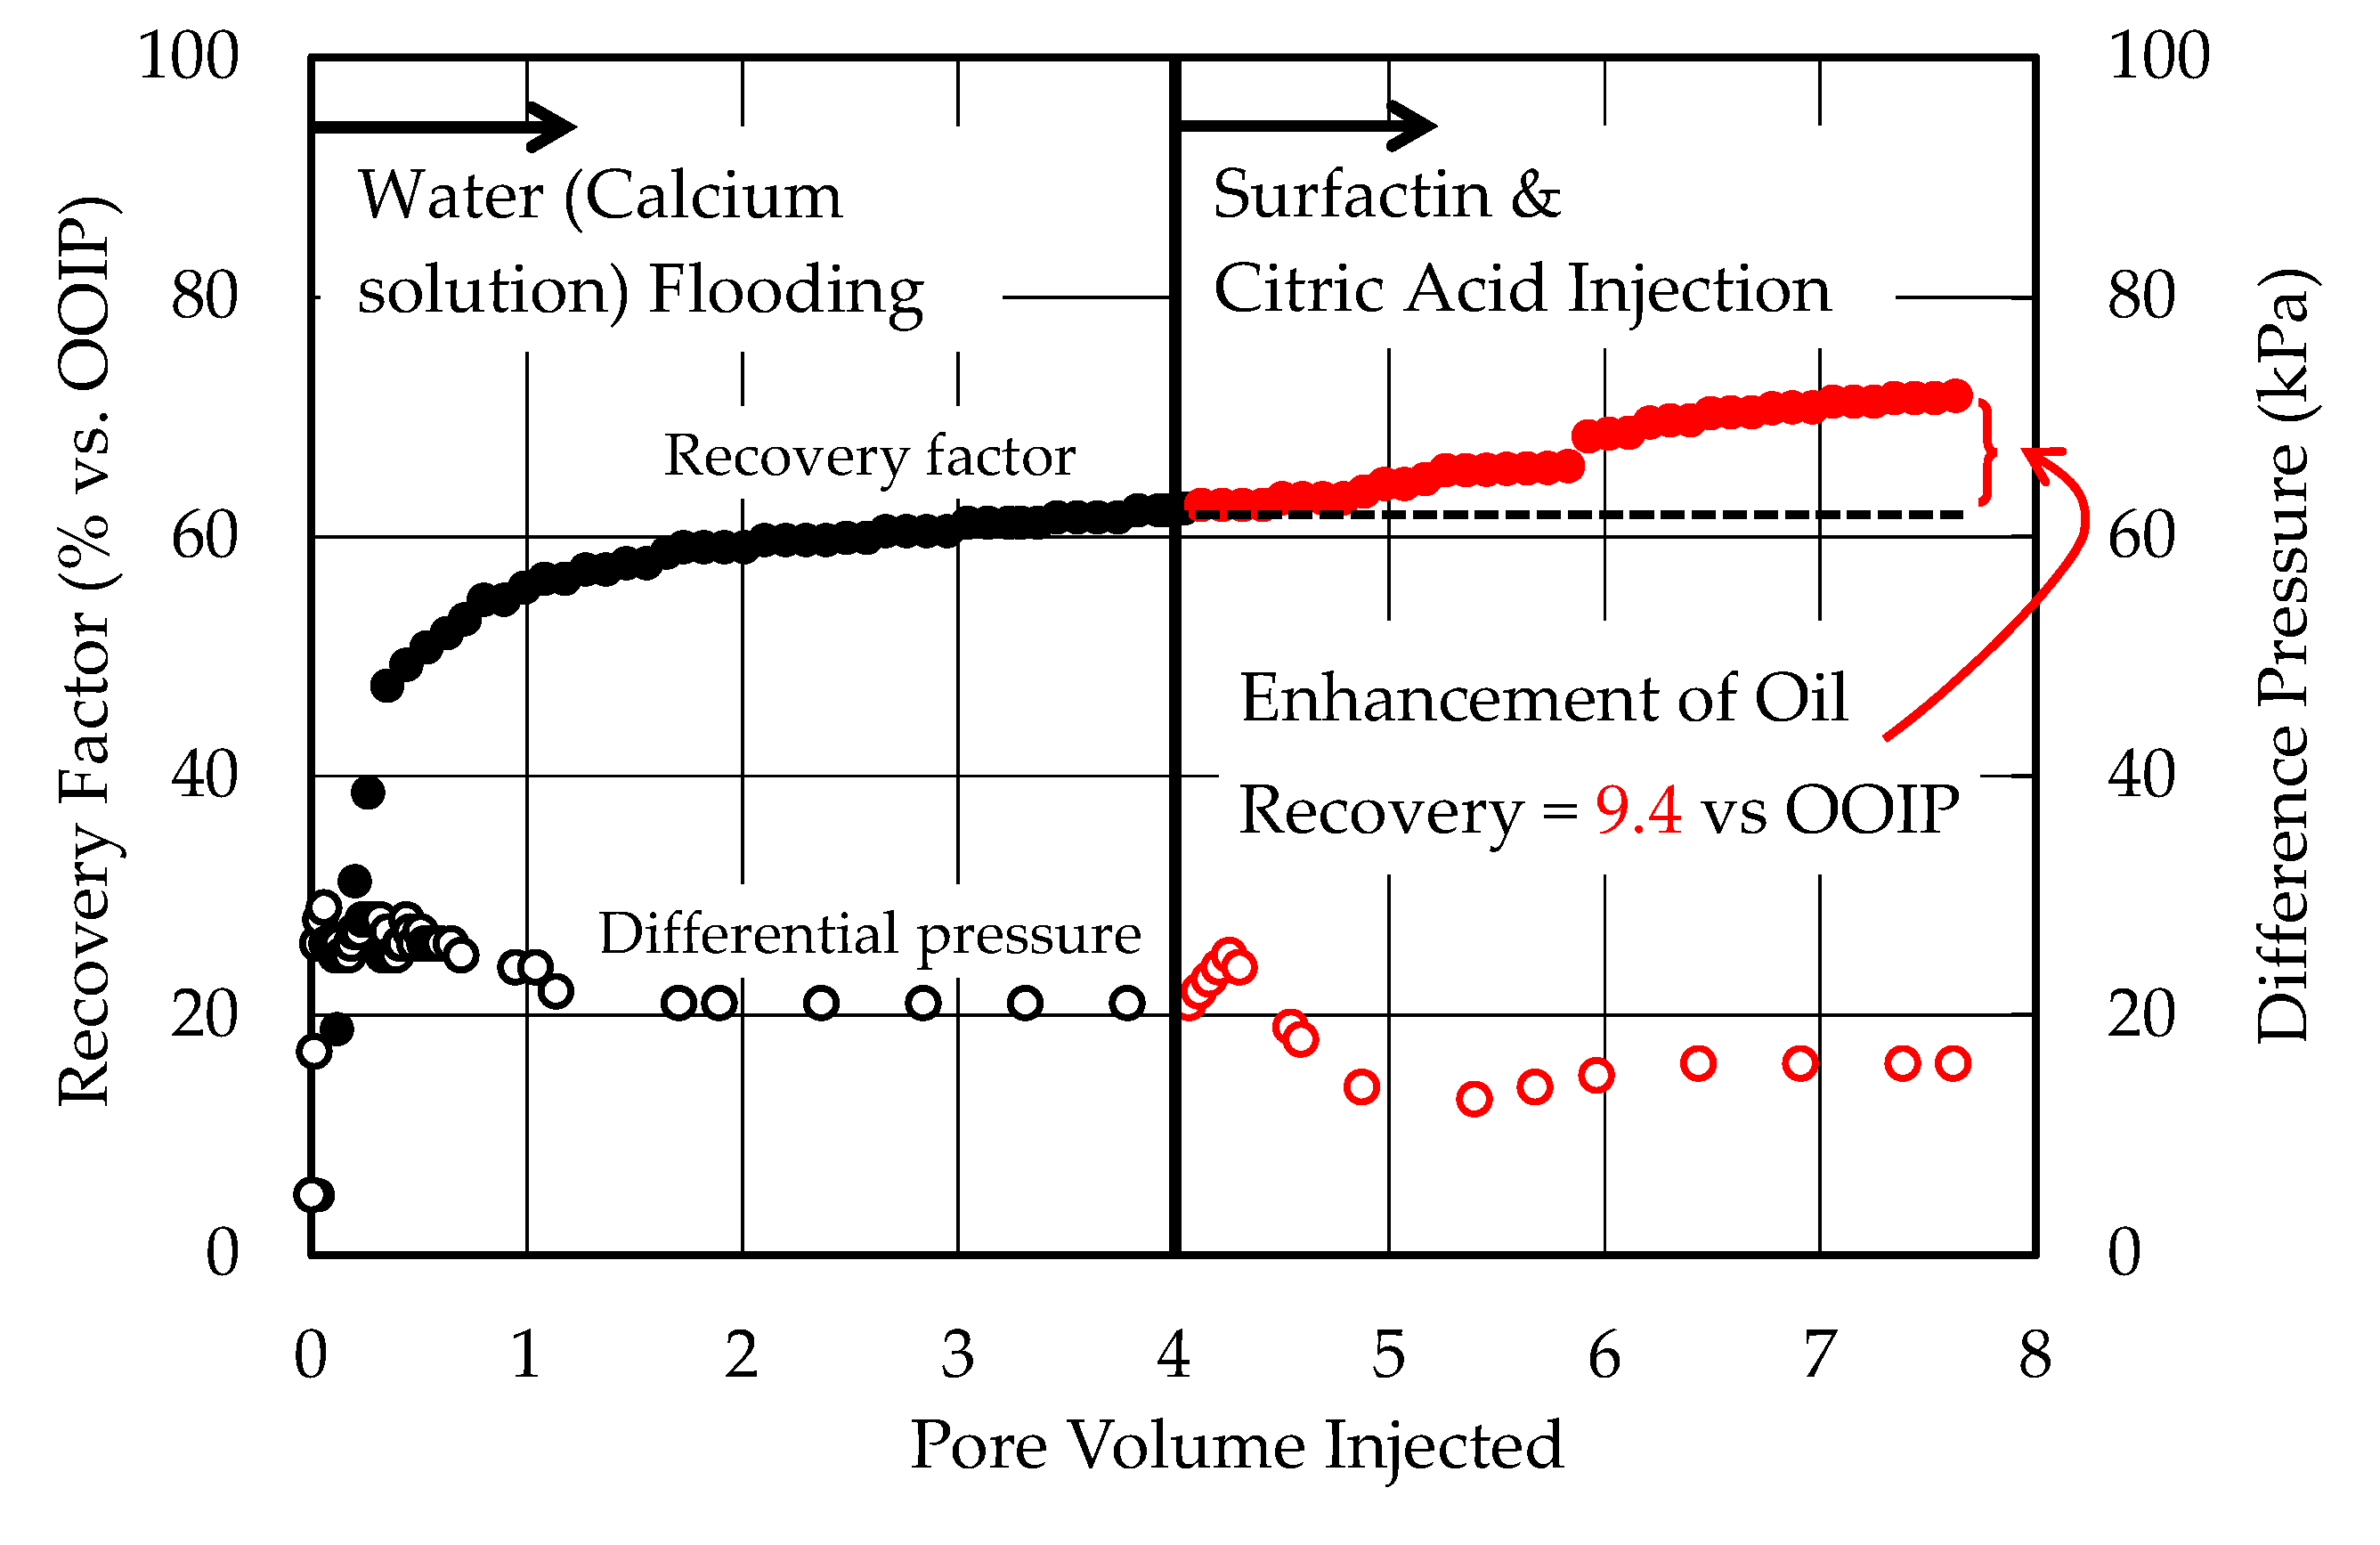
After the primary oil recovery, 0.70 mL of oil was additionally recovered from the less permeable oil reservoir by injecting 3.1 PV of synthetic brine containing surfactin and citric acid whose pH was adjusted to 7.0, as shown in Table 3. That is, 5.9% of OOIP (13.1% of residual oil) was additionally recovered from the less permeable oil reservoir. On the other hand, 0.95 mL of oil was additionally recovered from the more permeable oil reservoir by injecting 3.6 PV of synthetic brine containing surfactin and citric acid whose pH was adjusted to 7.0 after the primary oil recovery, as shown in Table 3. That is, 9.4% of OOIP (24.9% of residual oil) was additionally recovered from the more permeable oil reservoir.
Figure 7 shows the cumulative oil recovery factor during the core flooding experiment using the less permeable oil reservoir. The primary oil recovery reached a plateau of growth after 3.0 PV injection of the synthetic brine. Additional oil recovery was started after the injection of 2.0 PV of the synthetic brine containing surfactin and citric acid. The additional oil recovery was ended when 2.3 PV of that solution was injected. The pressure difference between both ends of the less permeable oil reservoir during the experiment is shown in Figure 7. The pressure difference increased up to 1.1 MPa during the injection of synthetic brine containing surfactin and citric acid from 0.75 MPa which was the pressure difference at the end of primary oil recovery. This result is in agreement with the result of the injectivity test, which was described in above.
Figure 8 shows the cumulative oil recovery factor during the core flooding experiment using the more permeable oil reservoir. The primary oil recovery reached a plateau of growth after 3.0 PV injection of the synthetic brine. Additional oil recovery was started after the injection of 0.8 PV of the synthetic brine containing surfactin and citric acid. The additional oil recovery was ended when 3.0 PV of that solution was injected. The pressure difference between both ends of the more permeable oil reservoir during the primary oil recovery and the injection of synthetic brine containing surfactin and citric acid is shown in Figure 8. The pressure difference was not increased during the injection of synthetic brine containing surfactin and citric acid into the more permeable oil reservoir as shown in the figure, while a small increase in the pressure difference was observed during the injection of synthetic brine containing surfactin and citric acid into the less permeable oil reservoir. It is assumed that the pressure difference of the more permeable oil reservoir was not increased because quantity of remaining oil in the reservoir after the primary oil recovery was smaller than that in the less permeable oil reservoir. Moreover, any increase in the pressure difference was suppressed because a greater quantity of oil was recovered from the more permeable oil reservoir. In addition, the influence of the decrease in the permeability may be reduced in the more permeable oil reservoir.
As described above, it was successfully demonstrated that the surfactin could be injected into reservoir and used for EOR by combining the surfactin with citric acid. On the other hand, more than 3 PVs of the synthetic brine containing the surfactin and citric acid was injected into the cores in both experiments until the enhancement of oil recovery was completed. It was therefore shown that a large quantity of the surfactin was necessary to complete the enhancement of oil recovery. Such behavior of oil recovery was assumed to be brought about by the adsorption of the surfactin on the rock surface. That is, the surfactin which was injected into the core was not effectively used for oil recovery at the early stage of the injection because the surfactin molecules was trapped on the rock surface due to the adsorption at that stage. After the rock surface reached the saturated adsorption state, the surfactin injected came to be effectively used for oil recovery. Consequently, oil was additionally produced after more than 1 PV of the synthetic brine containing the surfactin and citric acid was injected into the cores. The adsorption of the surfactin on the rock surface should be therefore studied in order to recover oil with smaller quantities of surfactin as a future challenge.
Figure 9 shows the photo images of the effluent fluid which was collected from the more permeable oil reservoir during the injection of synthetic brine containing surfactin and citric acid. The effluent fluid samples are shown successively in the order of times from the left side to the right side in the figure. The capacity of a tube shown in the figure was 1.5 mL, which was approximately equal to 0.1 PV. The color of effluent fluid turned to white after the injection of 0.4 PV of synthetic brine containing surfactin and citric acid. Similar phenomena were also observed with the less permeable oil reservoir. It was assumed that the emulsion was formed in the oil reservoirs by the IFT reduction which was caused by the synergistic effect of surfactin and citric acid. Both emulsion and non-emulsified oil began flow out after those phenomena had been observed.
Saito et al. [20] reported the results of core flooding experiments using the same type of surfactin as this paper used. They used surfactin solution composed of not synthetic brine but pure water as a solvent in their study. As the absolute permeability of cores used in their study was 50 md, which was different from permeability of cores used in this study, the quantity of oil remaining in the oil reservoirs after the primary oil recovery was different between both studies. We therefore compare both results based on the recovery factor not from OOIP but the residual oil in this study. Saito et al. [20] recovered 24.0% of residual oil by injecting water containing 0.3 wt % of surfactin in their study. On the other hand, 24.9% of residual oil was recovered from the more permeable oil reservoir by injecting the synthetic brine containing 0.3 wt% of surfactin and citric acid in this study. It can be therefore expected that similar or higher oil recovery will be obtained by EOR using surfactin with citric acid. The recovery factor of the experiment using the less permeable oil reservoir in this study was 13.1%, which was higher than the recovery factor (10.4%) obtained by injecting water containing 0.3 wt% of SDS in the study of Saito et al. [20]. Even though the oil recovery is affected by the permeability reduction, which is caused by the injection of mixture of surfactin and citric acid, the mixture can be expected to be more effective for EOR than SDS.
These results suggest that the citric acid is an effective additive for applying surfactin to enhanced oil recovery techniques in oil reservoirs containing divalent cations.

4. Conclusions

In this study, we investigated methods for applying surfactin to oil reservoirs containing divalent cations with a high concentration. We investigated the suitable inhibitor which prevented the formation of precipitation of surfactin calcium through turbidity measurements and injectivity tests. Also, we evaluated the influence of the inhibitors on the surfactin capacity for decreasing IFT by measuring IFT between the surfactin solution containing the chemicals and oil. Finally, the EOR potential of the surfactin solution containing the inhibitor was evaluated through the core flooding experiment. The following conclusions were obtained through this study.
  • Citric acid, trisodium citrate and pentasodium triphosphate successfully prevented the surfactin from combining with calcium ion and forming the precipitation of the surfactin calcium. In particular, citric acid and trisodium citrate inhibited the binding of surfactin with calcium ions with lower concentrations, such as 0.6 wt%.
  • Both citric acid and trisodium citrate had strong potential as co-surfactants of the surfactin because the IFT between the surfactin solution containing those inhibitors and oil was greatly decreased to less than 0.1 mN/m, which was less than one-thirtieth as compared with IFT between the pure surfactin solution and oil.
  • Trisodium citrate, however, caused significant permeability reduction in the injectivity tests, whereas citric acid could be injected into the Berea sandstone core without significant permeability reduction. The high pH value of trisodium citrate solution might cause the dissolution of ferrum and aluminum in the core and the colloids of ferrous hydroxide and aluminum hydroxide were formed in the core, which caused the significant reduction in the permeability. Citric acid was therefore selected as the best inhibitor.
  • Citric acid was subjected to the core flooding experiments as the inhibitor. While the synthetic brine containing 0.3 wt% of surfactin, 0.6 wt% of citric acid and 900 ppm of calcium ion was injected into the oil reservoir, rise in the differential pressure was not observed in the experiments using the high permeability (175 md) reservoir while a small rise in the differential pressure was observed in the experiment using the low permeability (5.9 md) reservoir. The influence of the decrease in the permeability may be reduced in more permeable oil reservoir.
  • Overall, 13.1% and 24.9% of oil remaining in the oil reservoir after the primary oil recovery was recovered from the low permeability reservoir and high permeability reservoir, respectively, by injecting the synthetic brine containing 0.3 wt% of surfactin, 0.6 wt% of citric acid and 900 ppm of calcium ion. In particular, the 24.9% recovery factor was 0.9% higher than the recovery factor obtained by injecting pure surfactin solution reported by previous work. Citric acid is also effective for enhancing the surfactin capacity for increasing the recovery factor.
  • The above results support the notion that citric acid has a dual role as the binding inhibitor and co-surfactant for the surfactin. As citric acid is an environmentally friendly and cheap chemical, it can be a promising additive which can increase the applicable reservoir and potential of surfactant EOR.
It was successfully demonstrated that the surfactin could be used for EOR by combining it with citric acid in this study; however, the EOR performance of the surfactin should be further improved. It is assumed that the adsorption of the surfactin on the rock surface is one of the influential factors on the improvement in the performance and it should be studied as a future challenge.

Author Contributions

N.M. and Y.S. designed the study and carried out all the experiments. Y.S., K.S., Y.O. and S.Y. helped with sample collection, sample analyses and valuable discussions. N.M. and Y.S. wrote and completed the manuscript considering the review comments provided by all authors. All authors have read and agreed to the published version of the manuscript.

Funding

This research was financially supported by the Kaneka Corporation, Tokyo, Japan.

Acknowledgments

The authors wish to thank Kaneka Corporation for sponsoring this study and permission to publish this work.

Conflicts of Interest

The authors declare no conflict of interest.

Nomenclature

ACross-sectional area of the core samples
KAbsolute permeability
ksSpecific permeability
kaApparent permeability
LLength of the core
QFlow rate of brine
ΔPPressure different between both ends of the core
µViscosity of the brine injected

References

  1. Mohan, K. Alkaline Surfactant Flooding for Tight Carbonate Reservoirs. Presented at the SPE Annual Technical Conference and Exhibition 2009, New Orleans, LA, USA, 4–7 October 2009. Paper SPE-129516-STU. [Google Scholar]
  2. Wang, D.; Zhang, Z.; Cheng, J.; Demin, W.; Zhenhua, Z.; Jiecheng, C.; Jingchun, Y.; Shutang, G.; Li, L. Pilot Test of Alkaline/Surfactant/Polymer Flooding in Daqing Oil Field. SPE Reserv. Eng. 1997, 12, 229–233. [Google Scholar]
  3. Clara, H.; Larry, J.C.; Lorenzo, A.; Baldonedo, A.; Jie, Q.; Dowling, P.C.; Pitts, M.J. ASP System Design for an Offshore Application in the La Salina Field, Lake Maracaibo. SPE Reserv. Eval. Eng. 2001, 6, 147–156. [Google Scholar]
  4. Pratap, M.; Gauma, M.S. Field Implementation of Alkaline–Surfactant–Polymer (ASP) Flooding: A Maiden Effort in India. Presented at the Asia Pacific Oil and Gas. Conference and Exhibition, Perth, Australia, 18–20 October 2004. Paper SPE-88455-MS. [Google Scholar]
  5. Chang, H.L.; Zhang, Z.Q.; Wang, Q.M.; Xu, Z.S.; Guo, Z.D.; Sun, H.Q.; Qiao, Q. Advances in Polymer Flooding and Alkaline/Surfactant/Polymer Processes as Developed and Applied in the People’s Republic of China. J. Pet. Technol. 2004, 58, 84–89. [Google Scholar] [CrossRef]
  6. Pitts, M.J.; Dowling, P.; Wyatt, K.; Surkalo, H.; Adams, K.C. Alkaline–Surfactant–Polymer Flood of the Tanner Field. Presented at the SPE/DOE Symposium on Improved Oil Recovery, Tulsa, OK, USA, 22–26 April 2006. Paper SPE-100004-MS. [Google Scholar]
  7. Wang, D.; Cheng, J.; Wu, J.; Demin, W.; Jiecheng, C.; Junzheng, W.; Zhenyu, Y.; Yuming, Y. Summary of ASP Pilots in Daqing Oil Field. Presented at the SPE Asia Pacific Improved Oil Recovery Conference, Kuala Lumpur, Malaysia, 25–26 October 1999. Paper SPE-57288-MS. [Google Scholar]
  8. Li, H.; Liao, G.; Han, P.; Hongfu, L.; Guangzhi, L.; Peihui, H.; Zhenyu, Y.; Xiaolin, W.; Chen Guangyu, C.; Peiqiang, J.; et al. Alkaline/Surfactant/Polymer (ASP) Commercial Flooding Test in Central Xing2 Area of Daqing Oilfield. Presented at the SPE International Improved Oil Recovery Conference in Asia Pacific, Kuala Lumpur, Malaysia, 20–21 October 2003. Paper SPE-84896-MS. [Google Scholar]
  9. Cheng, J.; Xu, D.; Bai, W. Commercial Test of ASP Flooding in Daqing Oil Field. Presented at the Abu Dhabi International Petroleum Exhibition and Conference, Abu Dhabi, UAE, 3–6 November 2008. Paper SPE-117824-MS. [Google Scholar]
  10. Hong, F.L.; Dian, P.X.; Jiang, J.; Li, H.; Xu, D.; Jiang, J.; Du, X.; Hong, J.; Jiang, Y.; Xu, Y. Performance Analysis of ASP Commercial Flooding in Central Xing2 Area of Daqing Oilfield. Presented at the SPE/DOE Symposium on Improved Oil Recovery, Tulsa, OK, USA, 20–23 April 2008. Paper SPE-114348-MS. [Google Scholar]
  11. Wang, F.; Yang, Z.; Wu, J.; Li, Y.; Wang, F.; Wu, J.; Yang, Z.; Chen, G.; Zong, L.; Peng, S. Current Status and Prospects of ASP Flooding in Daqing Oil Fields. Presented at the SPE/DOE Symposium on Improved Oil Recovery 2008, Tulsa, OK, USA, 20–23 April 2008. Paper SPE-114343-MS. [Google Scholar]
  12. Shahri, M.P.; Shadizadeh, S.R.; Jamialahmadi, M. Applicability Test of New Surfactant Produced from Zizyphus Spina-Christi Leaves for Enhanced Oil Recovery in Carbonate Reservoirs. J. Jpn. Pet. Inst. 2011, 55, 27–32. [Google Scholar] [CrossRef] [Green Version]
  13. Austad, T.; Matre, B.; Milter, J.; Saevareid, A.; Øyno, L. Chemical Flooding of Oil Reservoirs 8. Spontaneous Oil Expulsion from Oil- and Water-Wet Low Permeable Chalk Material by Imbibition of Aqueous Surfactant Solutions. Colloids Surf. A Physicochem. Eng. Asp. 1998, 137, 117–129. [Google Scholar] [CrossRef]
  14. Sheng, J.J. Status of Surfactant EOR Technology. Petroleum 2015, 1, 97–105. [Google Scholar] [CrossRef] [Green Version]
  15. Nazina, T.N.; Sokolova, D.; Shestakova, N.M.; Grigor’ian, A.A.; Mikhaĭlova, E.M.; Babich, T.L.; Lysenko, A.M.; Turova, T.P.; Poltaraus, A.B.; Feng, T.; et al. The Phylogenetic Diversity of Aerobic Organotrophic Bacteria from the Dagan High-Temperature Oil Field. Microbiology 2005, 74, 343–351. [Google Scholar] [CrossRef]
  16. Mukherjee, S.; Das, P.; Sivapathasekaran, C.; Sen, R. Antimicrobial Biosurfactants from Marine Bacillus Circulans: Extracellular Synthesis and Purification. Lett. Appl. Microbiol. 2009, 48, 281–288. [Google Scholar] [CrossRef] [PubMed]
  17. Khaled, A.E. The Effect of a New in Situ Precipitation Inhibitor on Chemical EOR. J. Pet. Explor. Prod. Technol. 2013, 3, 133–137. [Google Scholar]
  18. Zhang, J.; Nguyen, Q.P.; Flaaten, A.; Pope, G.A. Mechanisms of Enhanced Natural Imbibition with Novel Chemicals. SPE Reserv. Eval. Eng. 2009, 12, 912–920. [Google Scholar] [CrossRef]
  19. Flaaten, A.; Nguyen, Q.P.; Pope, G.A.; Zhang, G. A systematic laboratory approach to low-cost, high-performance chemical flooding. SPE Reserv. Eval. Eng. 2009, 12, 713–723. [Google Scholar] [CrossRef]
  20. Saito, M.; Sugai, Y.; Sasaki, K.; Okamoto, Y.; Ouyang, C. Experimental and Numerical Studies on EOR Using a Biosurfactant. Presented at the Abu Dhabi International Petroleum Exhibition and Conference, Abu Dhabi, UAE, 7–10 November 2016. Paper SPE-183496-MS. [Google Scholar]
  21. Mohanty, K.K.; Chandrasekhar, S. Wettability Alteration with Brine Composition in High Temperature Carbonate Reservoirs. Presented at the SPE Annual Technical Conference and Exhibition 2013, New Orleans, LA, USA, 30 September–2 October 2013. Paper SPE-166280-MS. [Google Scholar]
  22. Fathi, S.J.; Austad, T.; Strand, S. Smart Water as a Wettability Modifier in Chalk: The Effect of Salinity and Ionic Composition. Energy Fuels 2010, 24, 2514–2519. [Google Scholar] [CrossRef] [Green Version]
  23. Gupta, R.; Smith, P.G.J.; Hu, L.; Willingham, T.W.; Cascio, M.L.; Shyeh, J.J.; Harris, C.R. Enhanced Waterflood for Middle East Carbonate Cores–Impact of Injection Water Composition. Presented at the SPE Middle East. Oil and Gas. Show and Conference, Manama, Bahrain, 25–28 September 2011. Paper SPE-142668-MS. [Google Scholar]
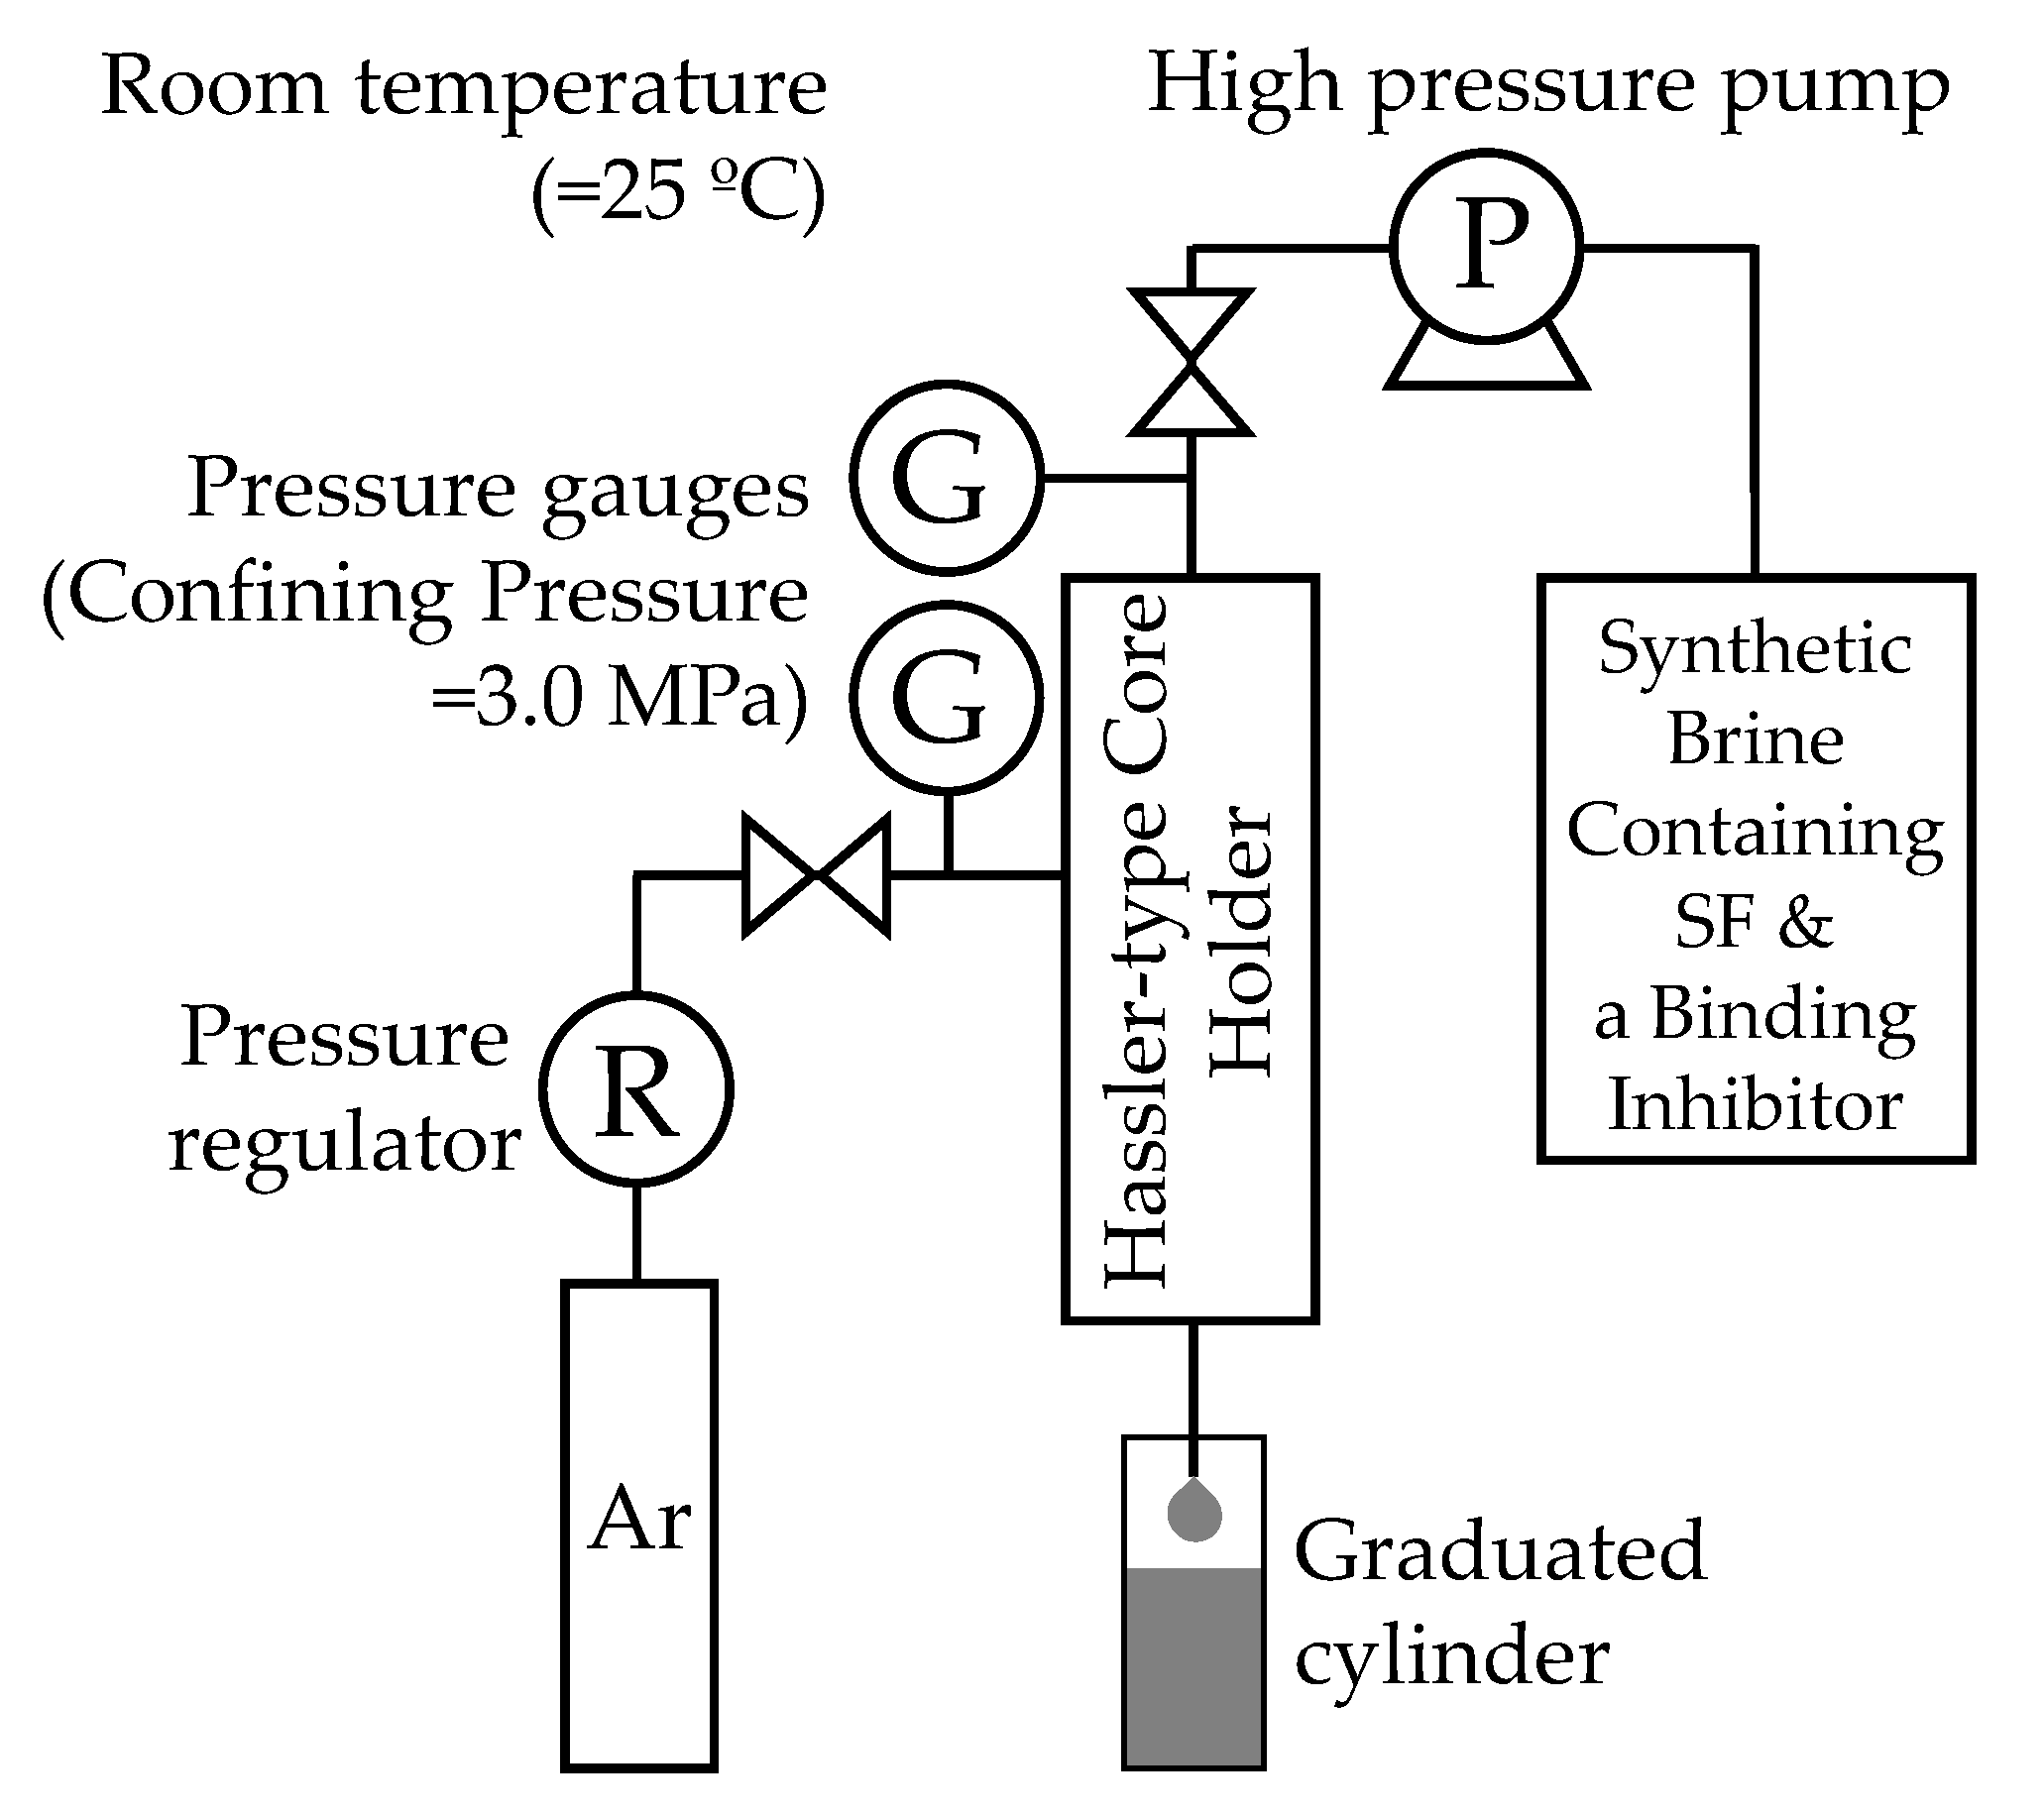
Figure 1. Schematic image of the permeability measurement system used in this study.
Energies 13 02430 g001
Figure 2. Schematic image of the core flooding system used in this study.
Energies 13 02430 g002
Figure 3. Results of turbidity measurement of the testing solution.
Energies 13 02430 g003
Figure 4. Relationship between the turbidity and concentration of the binding inhibitors.
Energies 13 02430 g004
Figure 5. IFT between the crude oil and each solution.
Energies 13 02430 g005
Figure 6. Temporal change in the specific permeability during the injection of the testing solutions.
Energies 13 02430 g006
Figure 7. Temporal change in the recovery factor and differential pressure during the core flooding experiment using less permeable oil reservoir.
Energies 13 02430 g007
Figure 8. Temporal change in the recovery factor and differential pressure during the core flooding experiment using the more permeable oil reservoir.
Energies 13 02430 g008
Figure 9. Photo images of the effluent fluid which was collected from the more permeable oil reservoir during the core flooding experiment.
Energies 13 02430 g009
Table 1. Candidates of the inhibitor examined in this study.
ClassChemicalsFinal Concentration
in the Testing Solution
Expected Effects
AlcoholsIsopropanol10.0%Enhancing solubility of
surfactin calcium
Tertiary butyl alcohol10.0%
Chelating
Agents
Citric acid (pH7.0)1.00 wt%Capturing calcium ion
Tri-sodium citrate1.00 wt%
Sodium poly-acrylate0.01 wt%
Penta-sodium triphosphate1.00 wt%
BAPTA0.10 wt%
Cationic
Surfactant
CTAB0.10 wt%Preventing SF from binding with
calcium ion by binding with SF
Ion
Exchanger
Zeolite nano particle0.05 wt%Capturing calcium ion
Table 2. Results of the surfactin injectivity tests.
Testing SolutionInitial
Permeability,
md
Apparent
Permeability,
md
Specific
Permeability
0.3%-Surfactin32.20.2580.008
0.3%-Surfactin
0.6%-Citric Acid (pH7.0)
900 ppm-Calcium
26.116.90.648
0.3%-Surfactin
0.6%-Tri-Sodium citrate
900 ppm-Calcium
27.00.5110.019
Table 3. Results of the core flooding experiments.
Type of Oil ReservoirOOIP,
mL
Oil Recovered by Primary Recovery,
mL
Primary Oil
Recovery,
%
Residual
Oil, mL
Oil
Recovered
by Surfactin
and Citric Acid Injection, mL
EOR vs. OOIP,
%
EOR vs. Residual Oil,
%
Low
Permeability
11.96.554.85.40.75.913.1
High
Permeability
10.16.362.33.81.09.424.9