Evaluation of Supply–Demand Adaptation of Photovoltaic–Wind Hybrid Plants Integrated into an Urban Environment


Abstract
:
1. Introduction
- The evaluation of supply–demand balance adaptation of PV+W hybrid plants
- The hybrid plants are integrated into an urban environment
- The results are applicable on a global scale as we have considered real weather data from hundreds of locations spread all over the world and multiple profiles for the characterisation of the demand.
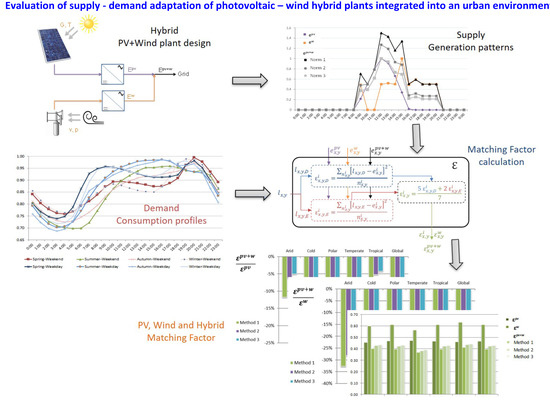
2. Methodology
- NB is the number of buildings in the relevant country or region
- is the share of available buildings in the relevant country or region, defined as those buildings where the installation of a PV+W hybrid facility would be feasible.
- CF is the capacity factor of the PV+W hybrid facility, defined for one specific period as the electricity generated by the hybrid facility in one hour divided into its installed capacity.
- is an average PV+W hybrid installed capacity.
- RHAD is the hourly aggregated demand representative for the country or area under analysis.
- Both demand profiles and generation patterns are considered on an hourly basis.
- The normalisation period for generation and demand is daily.
- The normalised demand profiles are obtained by dividing each hourly data into the respective daily maximum.
- The individual normalised PV and wind daily generation profiles are obtained by dividing each hourly data into the respective daily maximum.
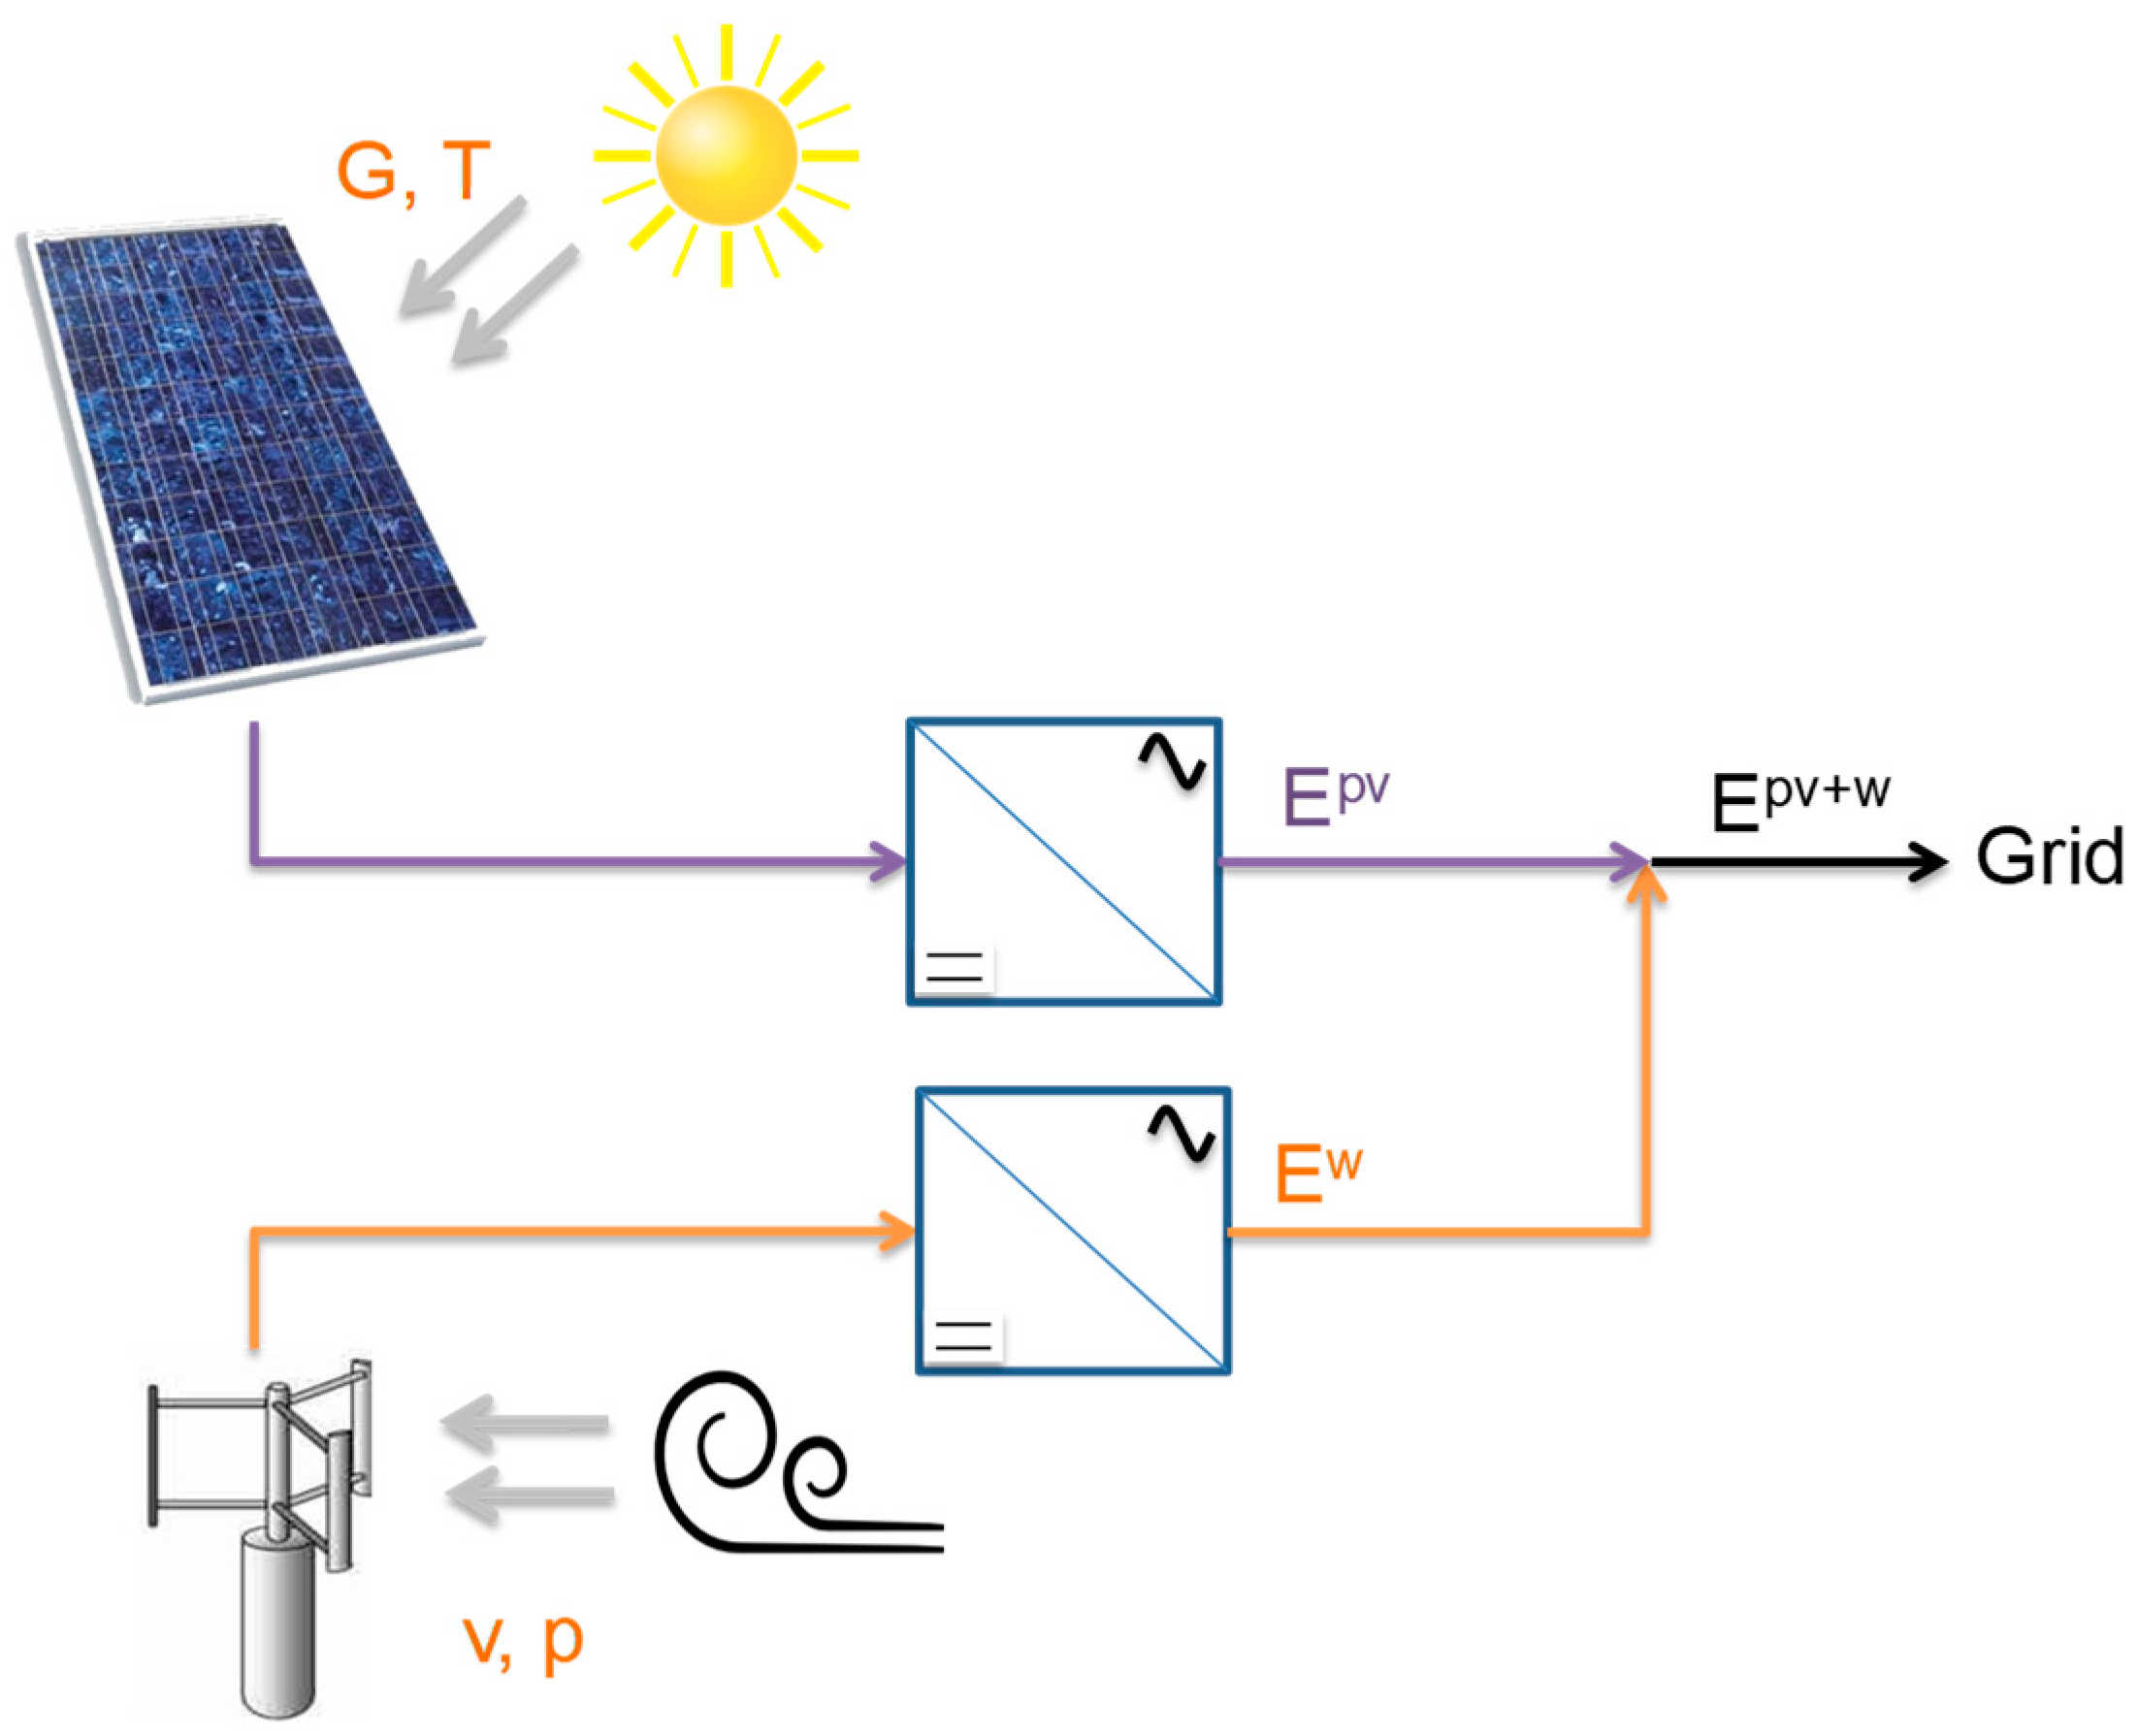
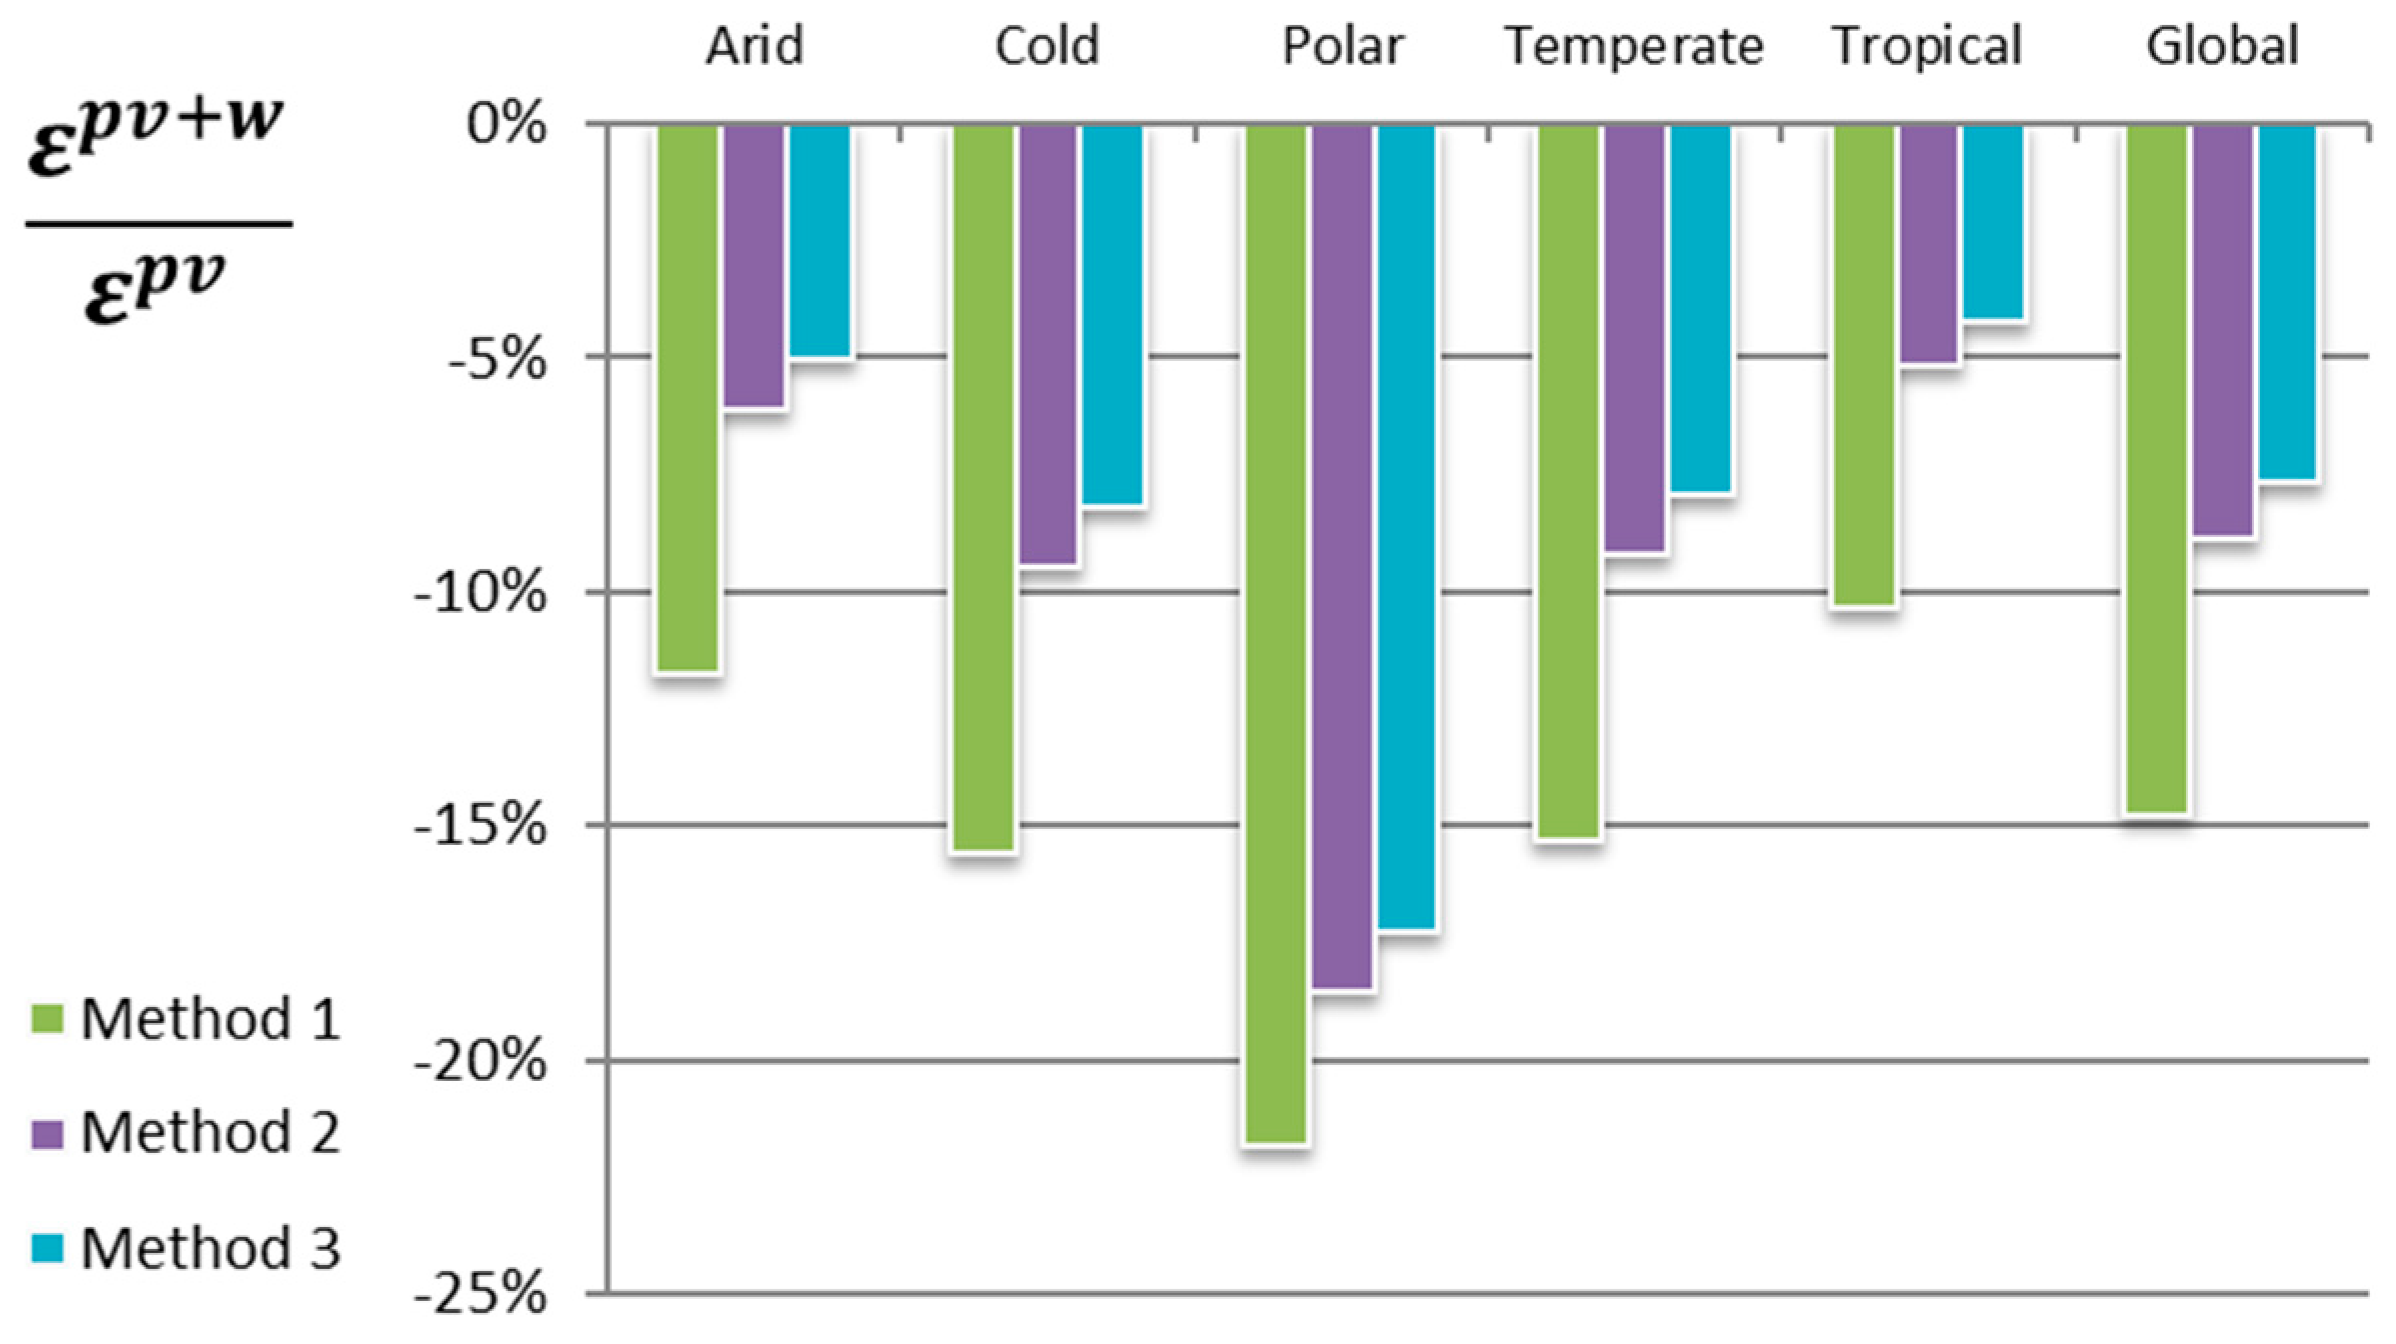
- Three normalised generation profiles for the hybrid facility are obtained as per the following methods:
- Method 1: By adding the individual PV and W (wind) normalised profiles:
- Method 2: By dividing every hourly data into the maximum value of both facilities.
- Method 3: By dividing every hourly data into the daily maximum value of the hybrid facility.
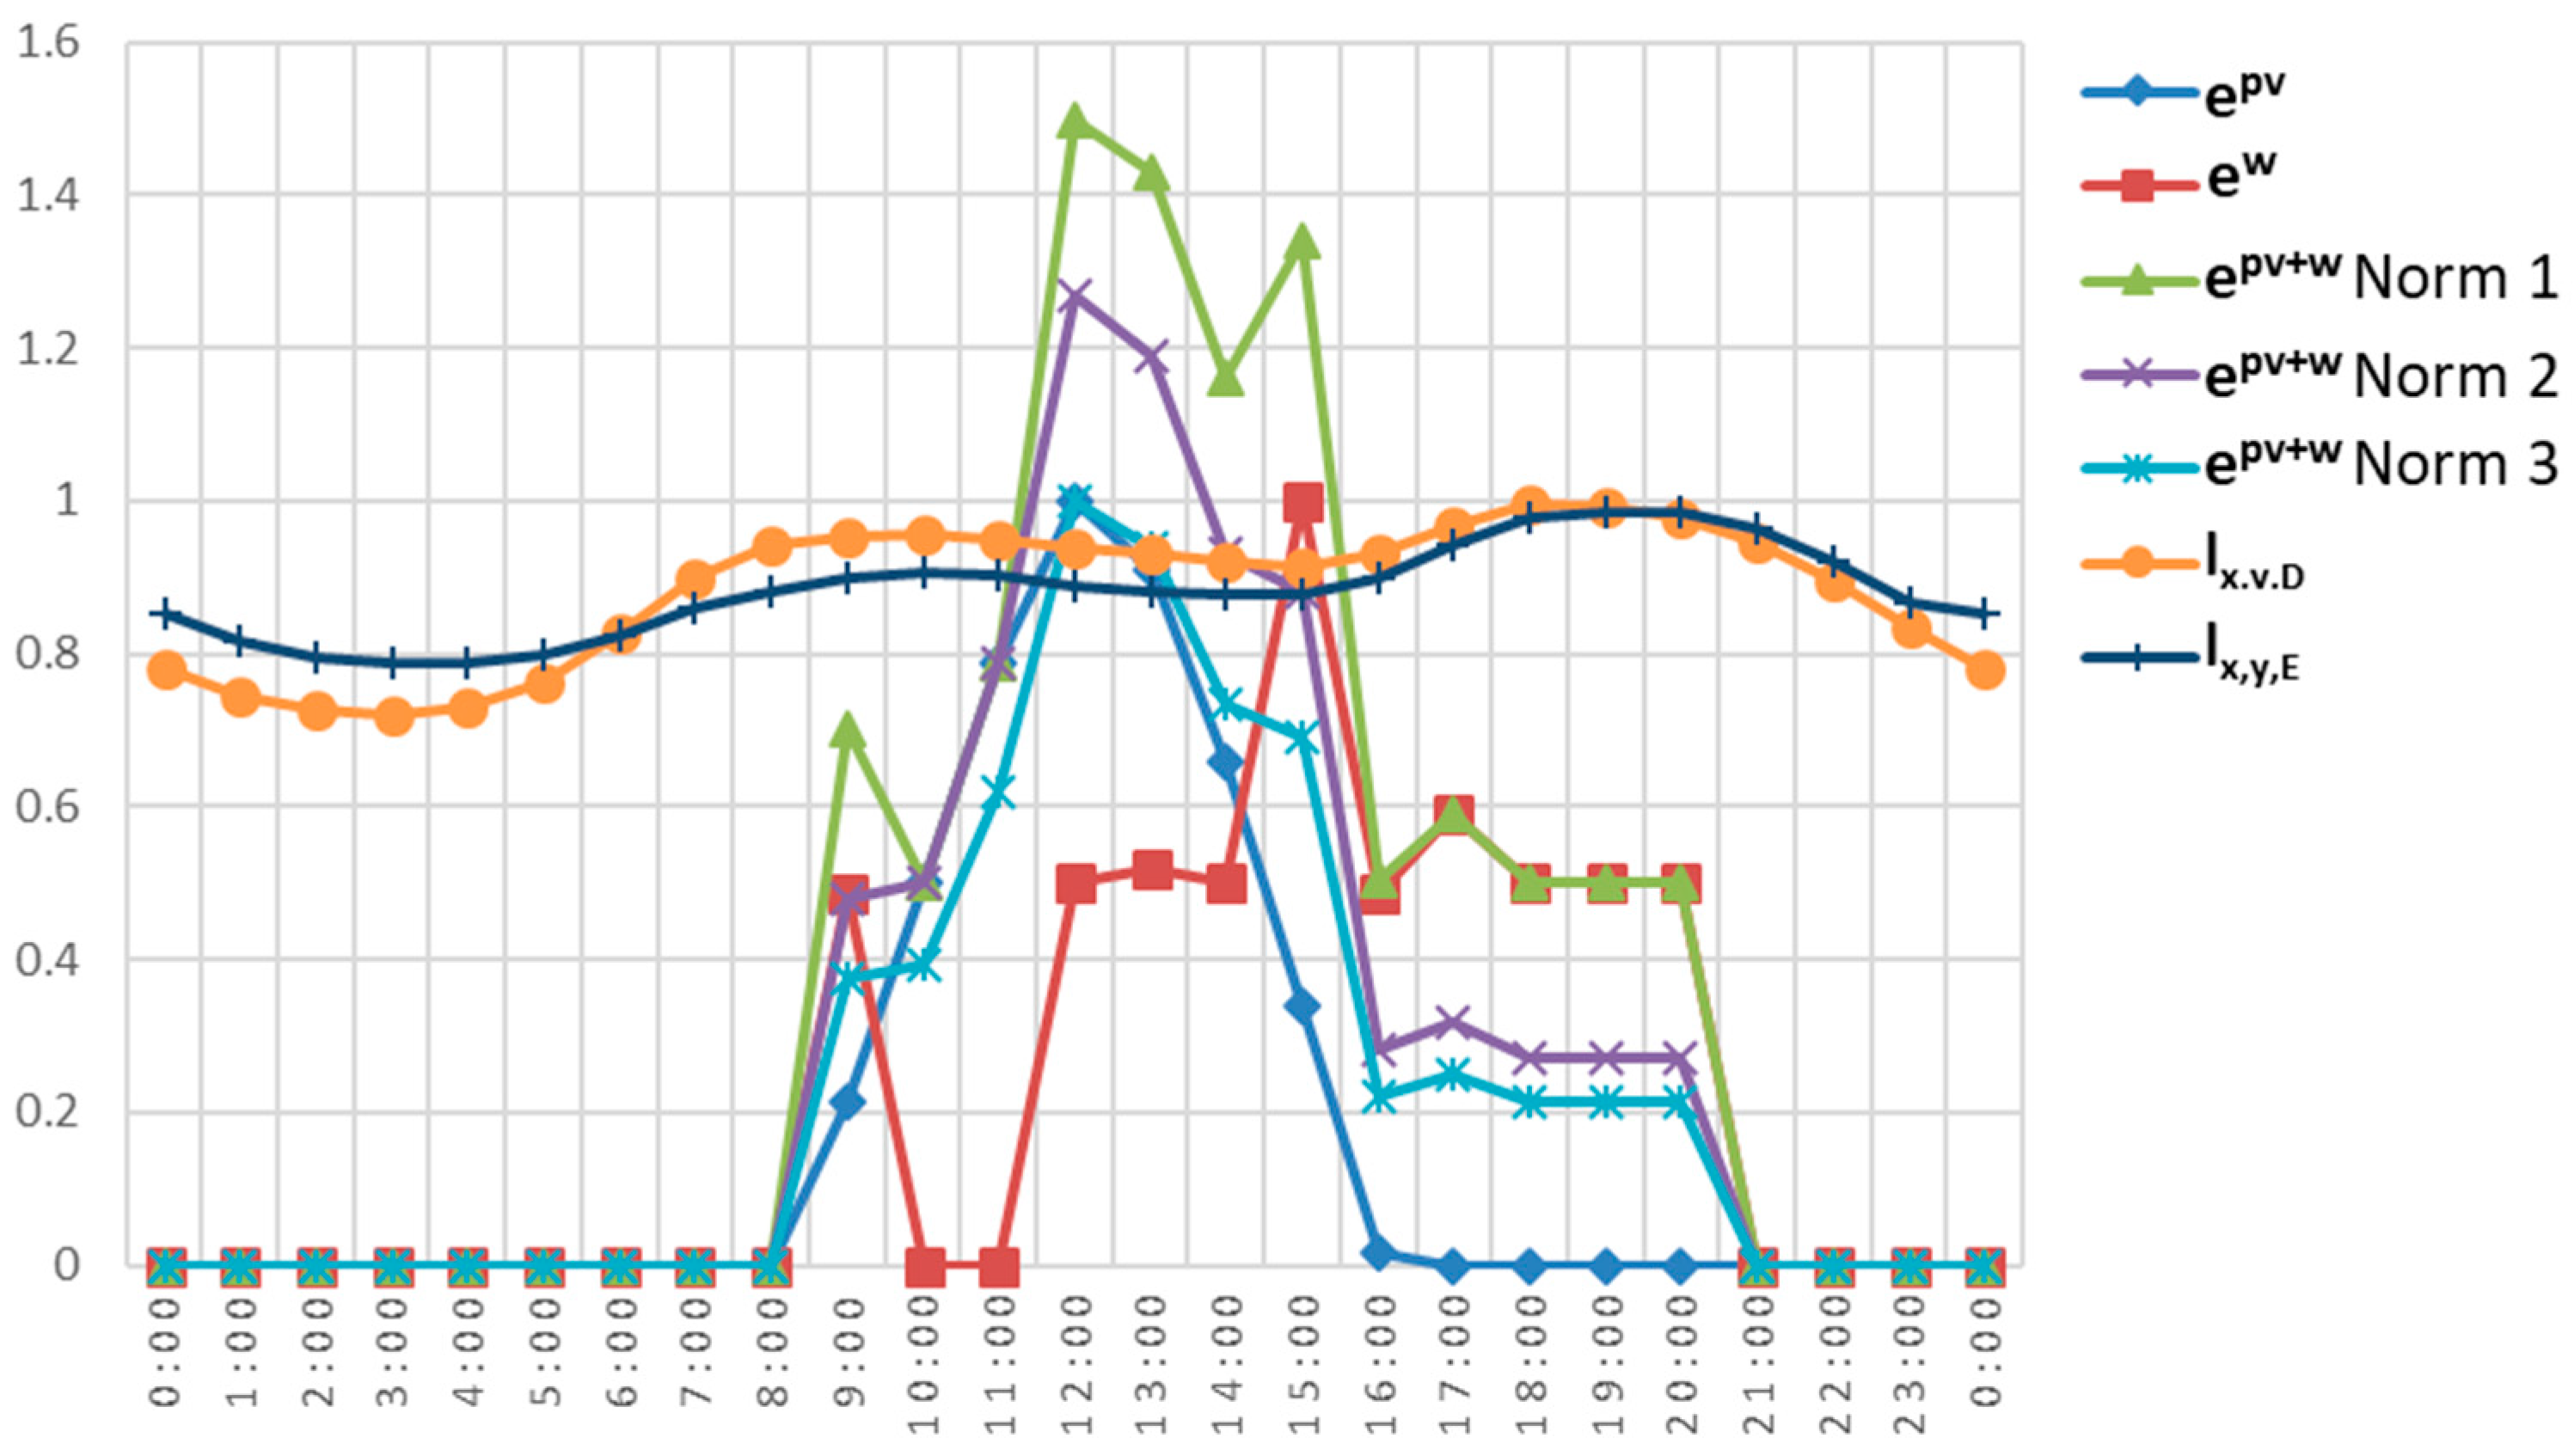
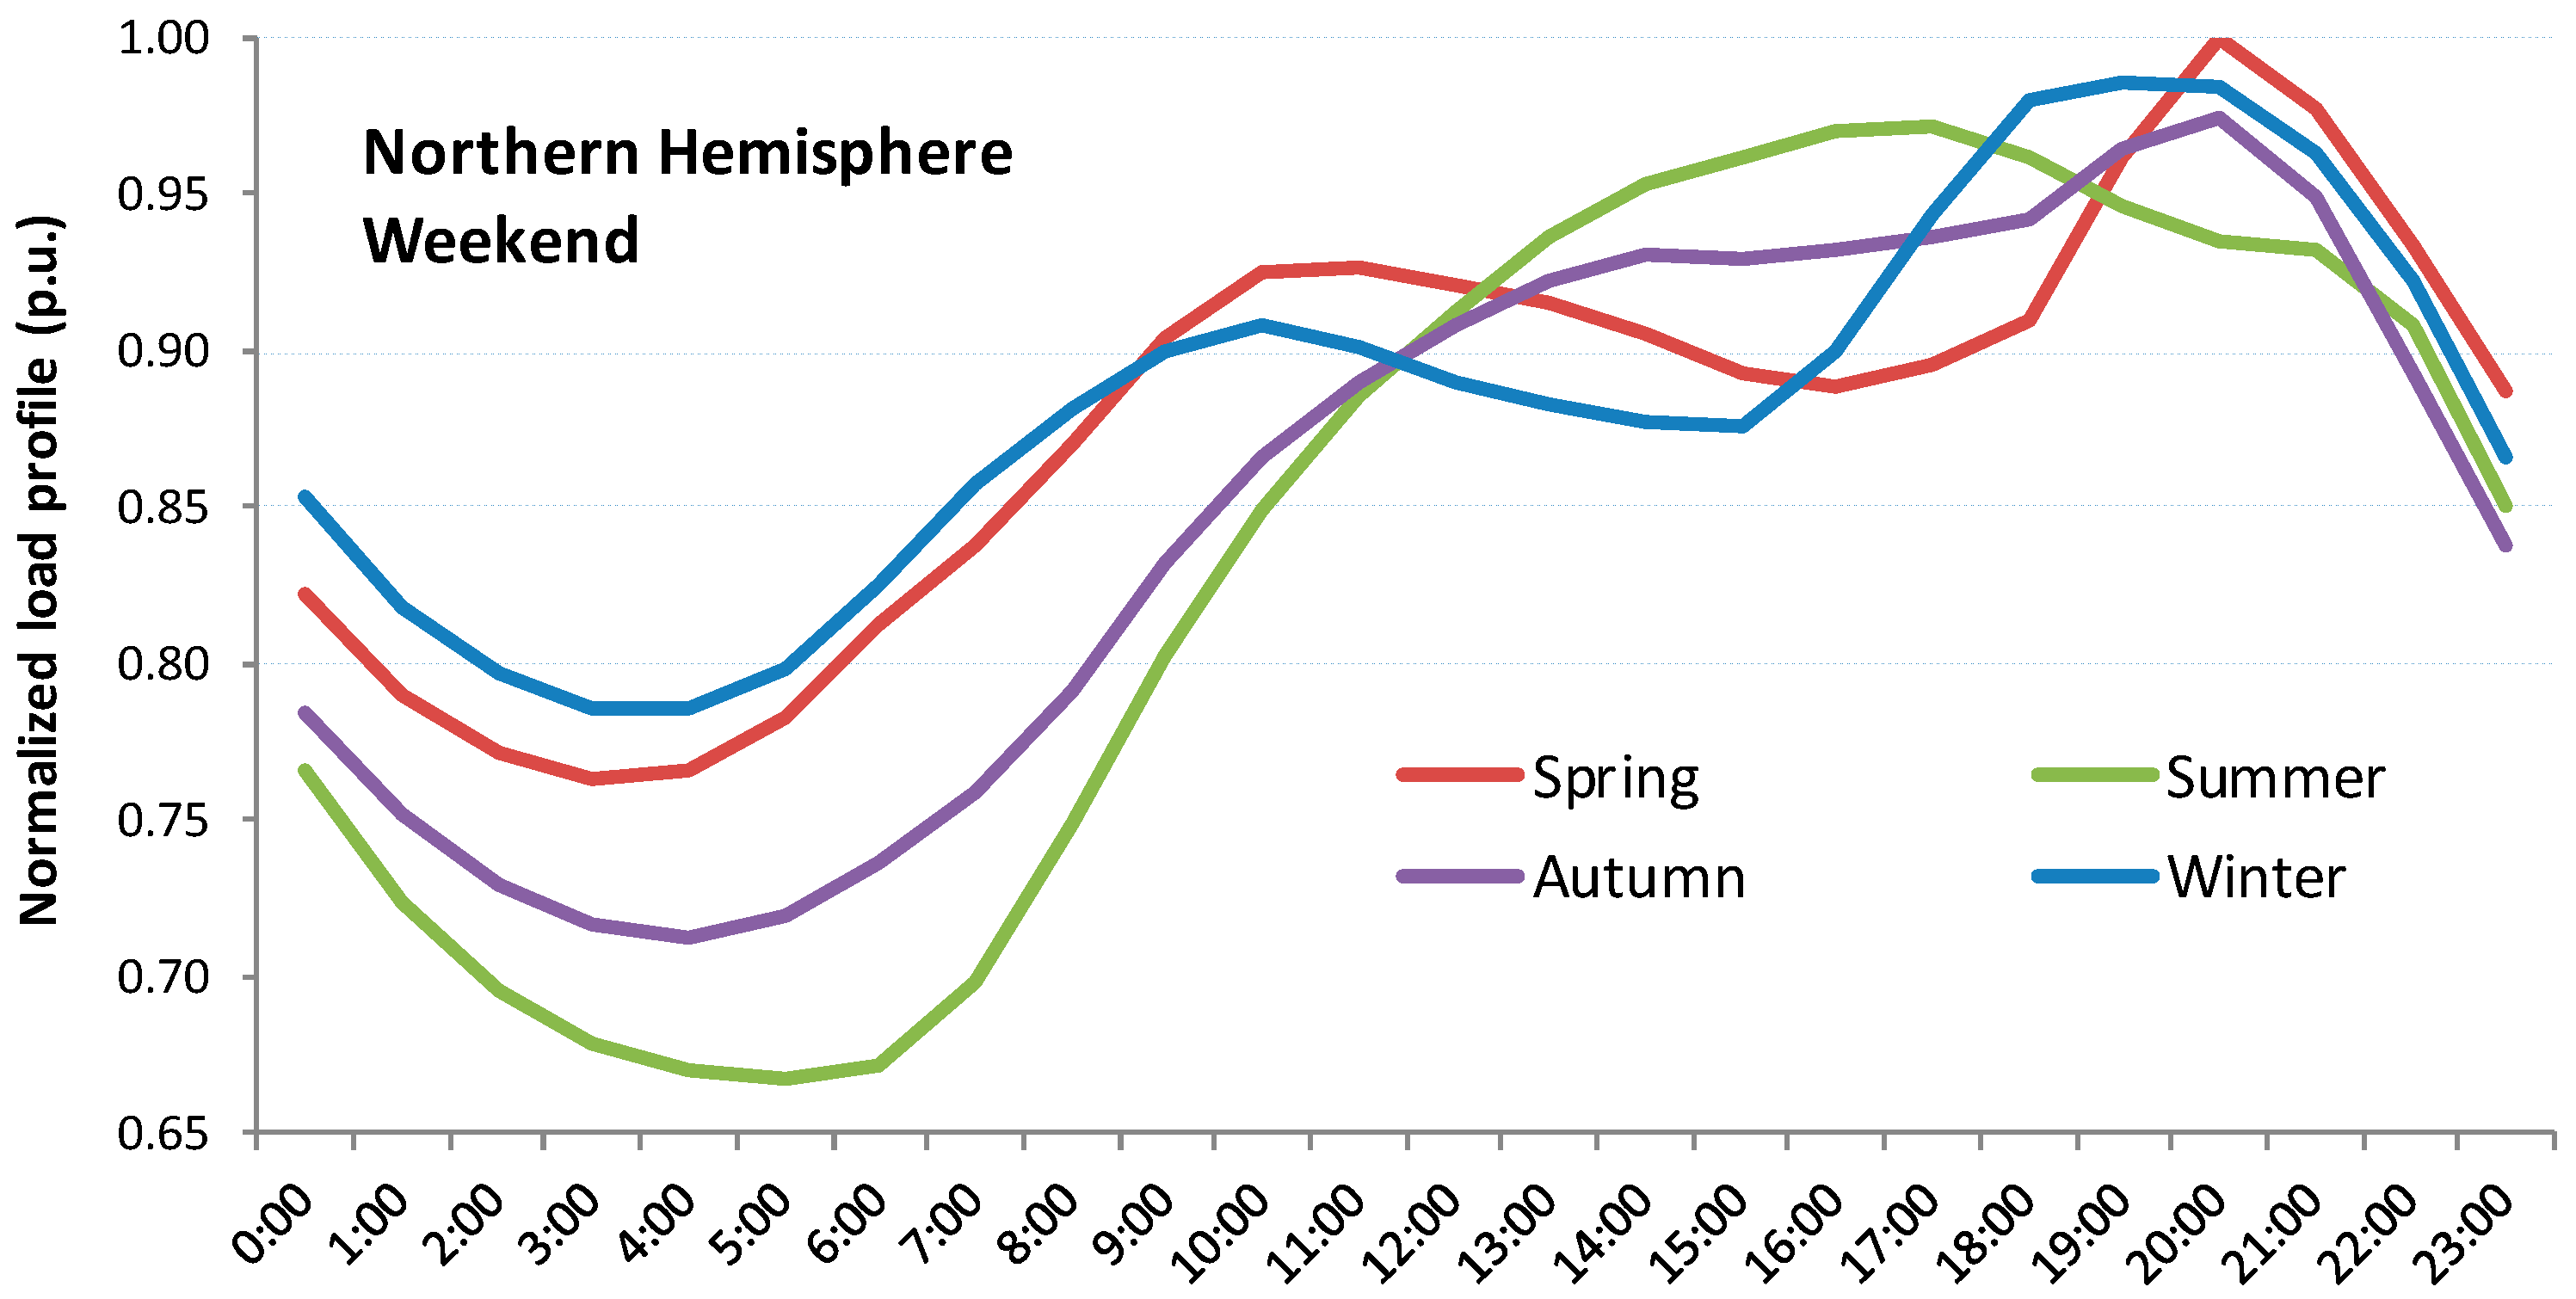
- The normalised demand hourly profiles for a weekday and for a weekend day .
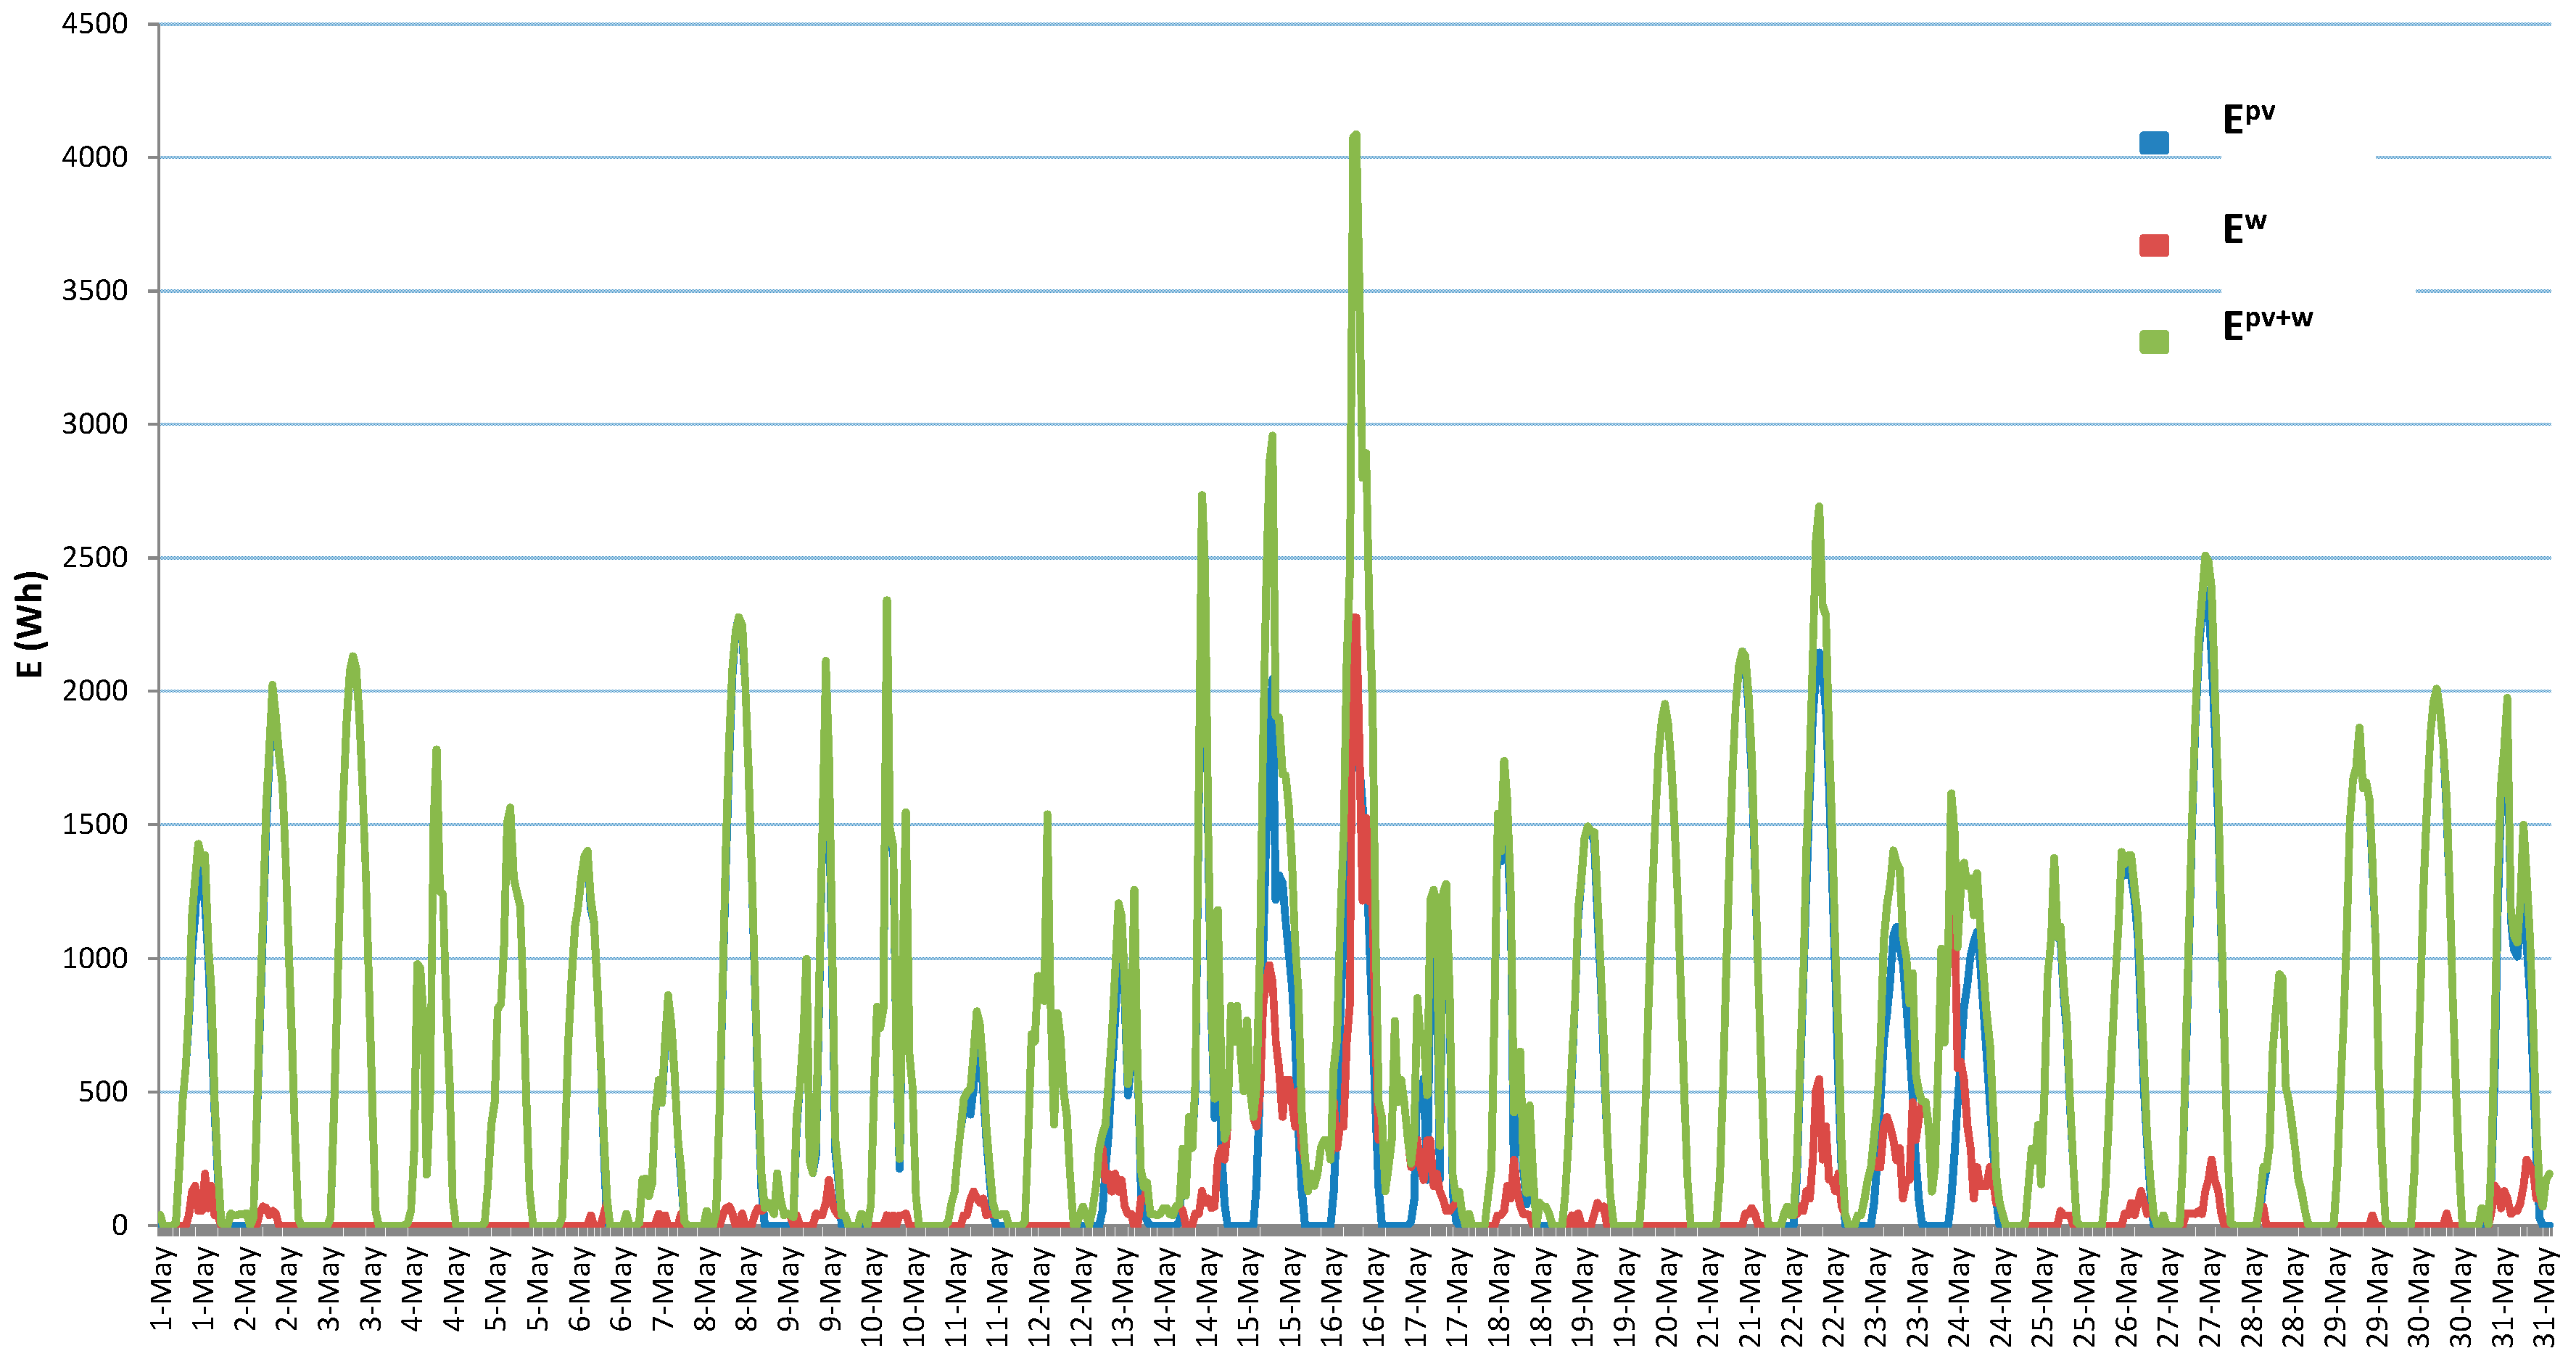
- The normalised generation hourly patterns for the PV facility and the wind one .
- Three hourly generation patterns of the hybrid facility , each one normalised according to the corresponding method.
- The relevant eight normalised demand profiles are selected according to the site location in the Northern or the Southern hemisphere (Table 4).
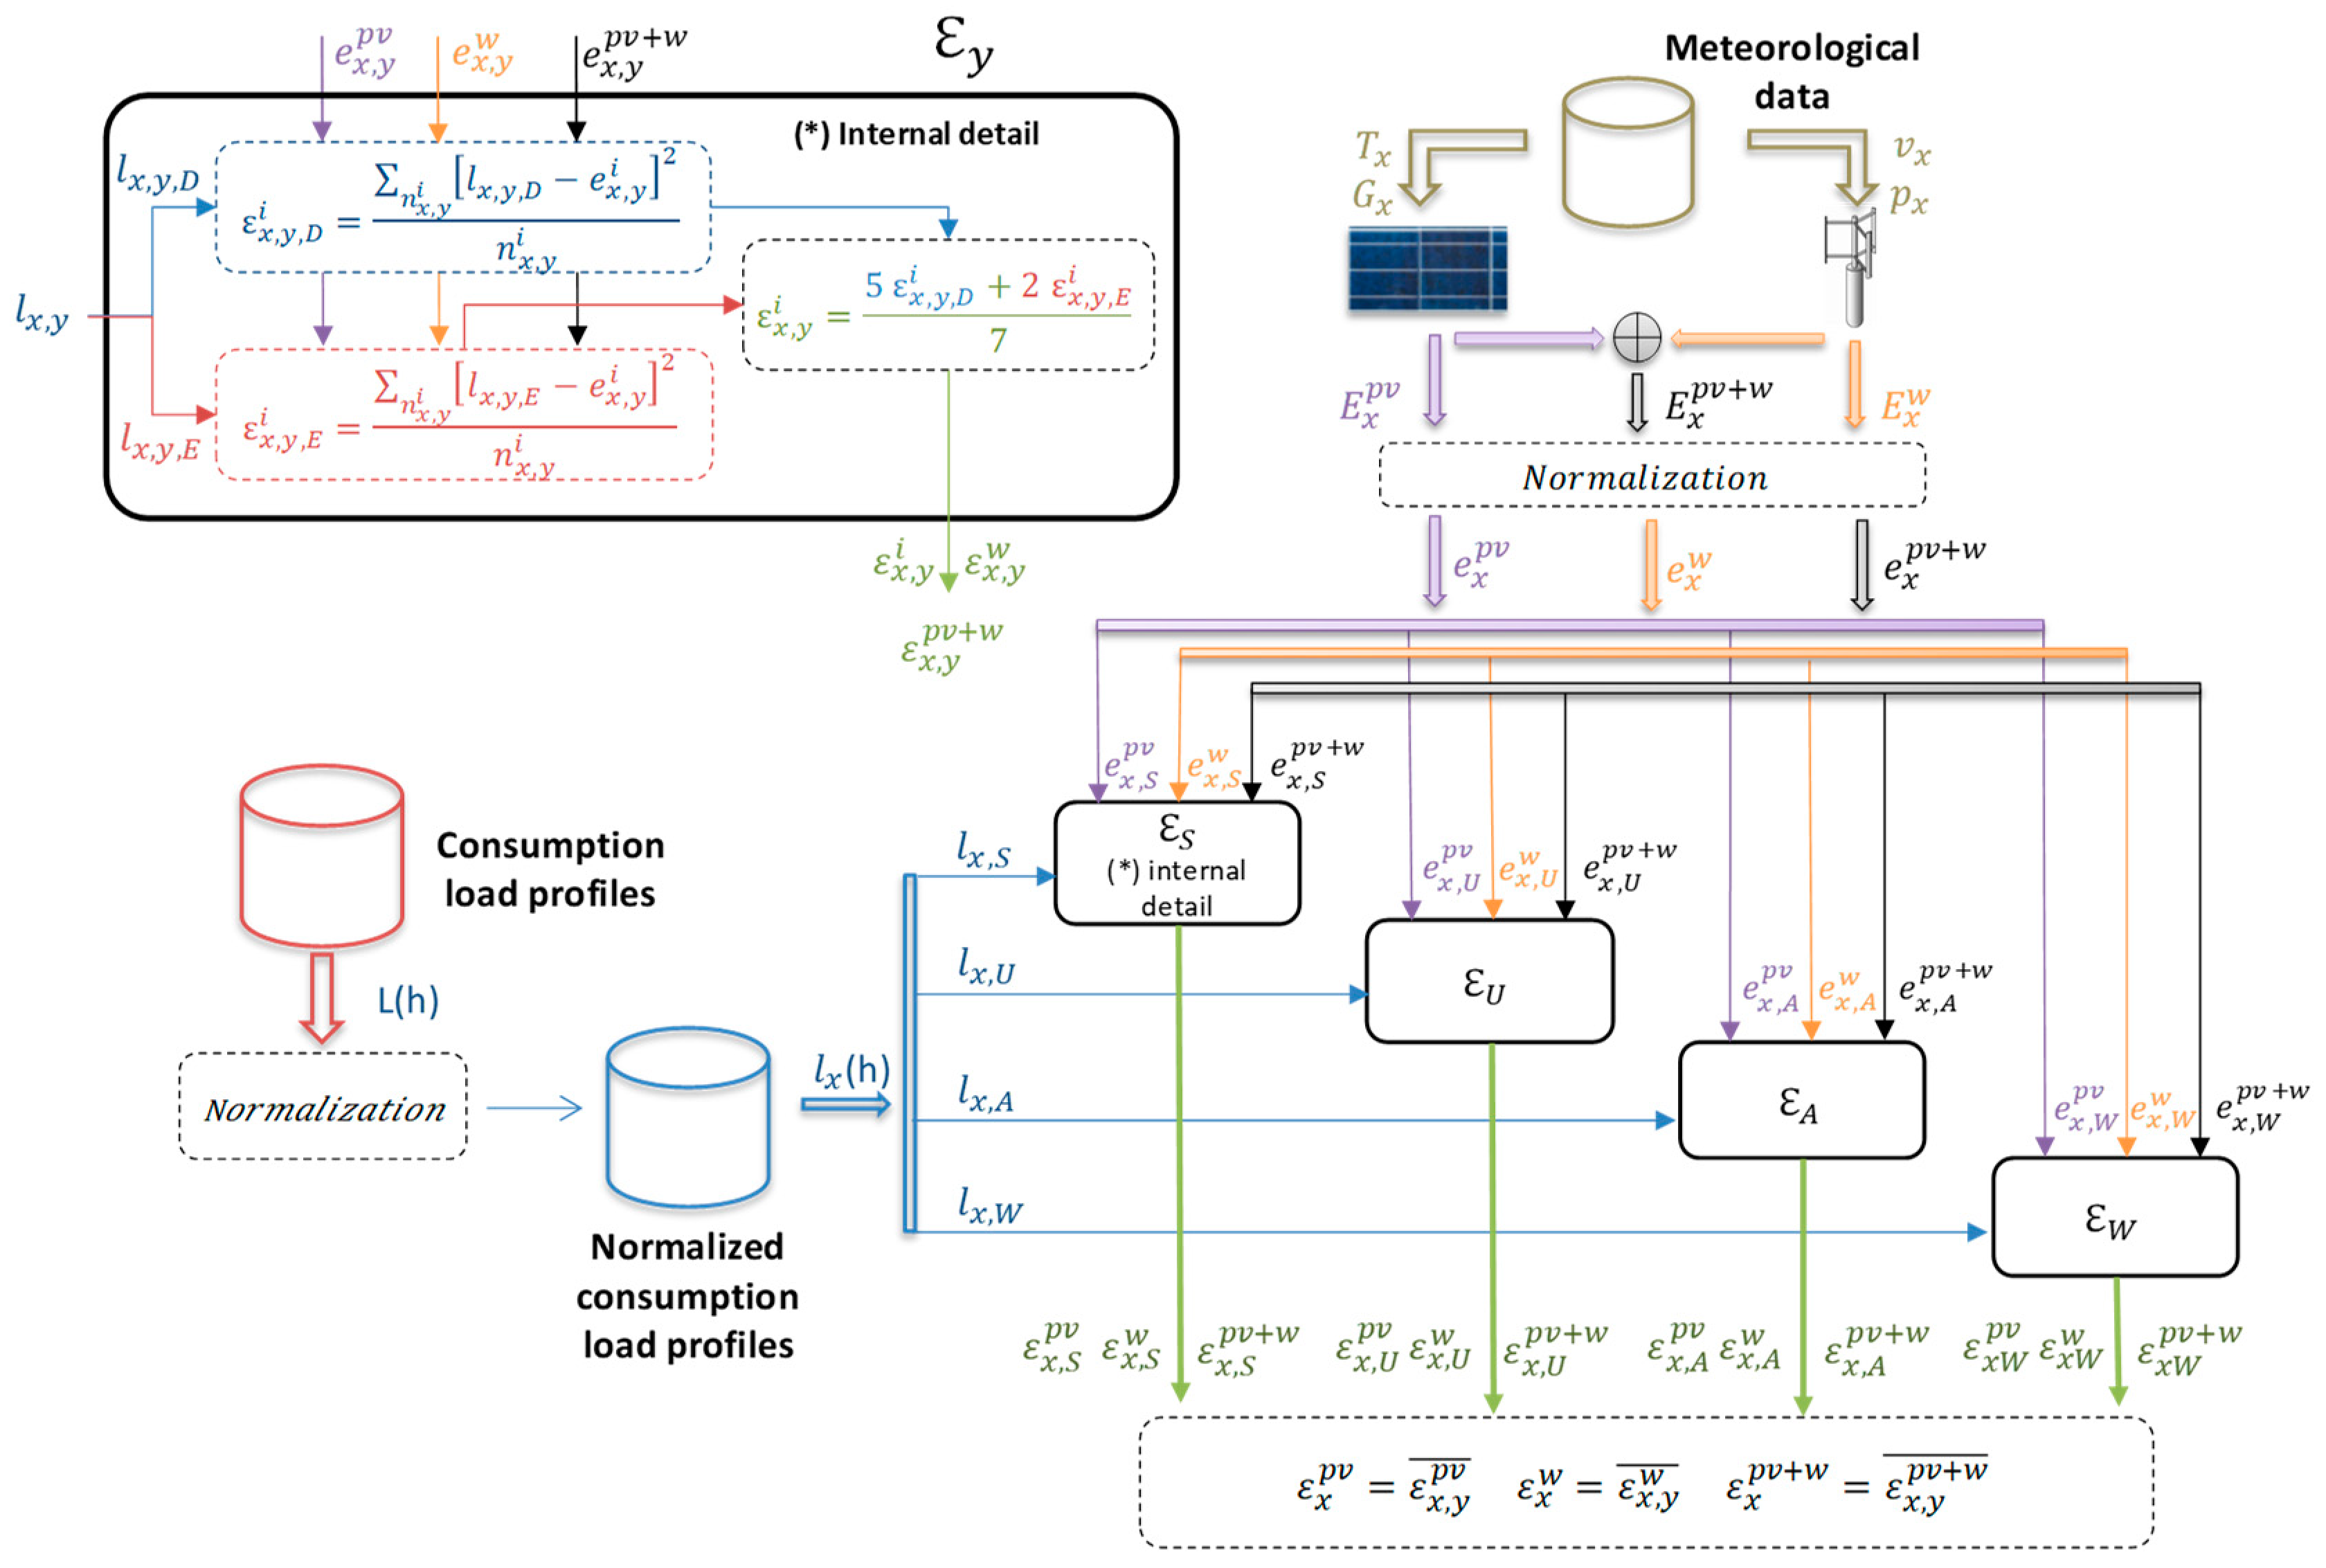
- For every annual season, ε is calculated for weekdays (5) and for weekend days (6). The weighted average value is calculated using (7):where:
- and are the matching factors in weekdays and weekend days respectively, for the facility type , placed at the location , during the season .
- is the number of hours in the season at the location .
- and are the normalised demand profiles in weekdays and weekend days respectively, at the hemisphere where is placed the location , during the season .
- is the generation pattern for the facility type , placed at the location , during the season .
- is the matching factor of the generation facility type , placed at the location , during the season .
- Finally, the yearly matching factor for each type of facility and location is obtained by averaging the factors calculated for every season as per (8):
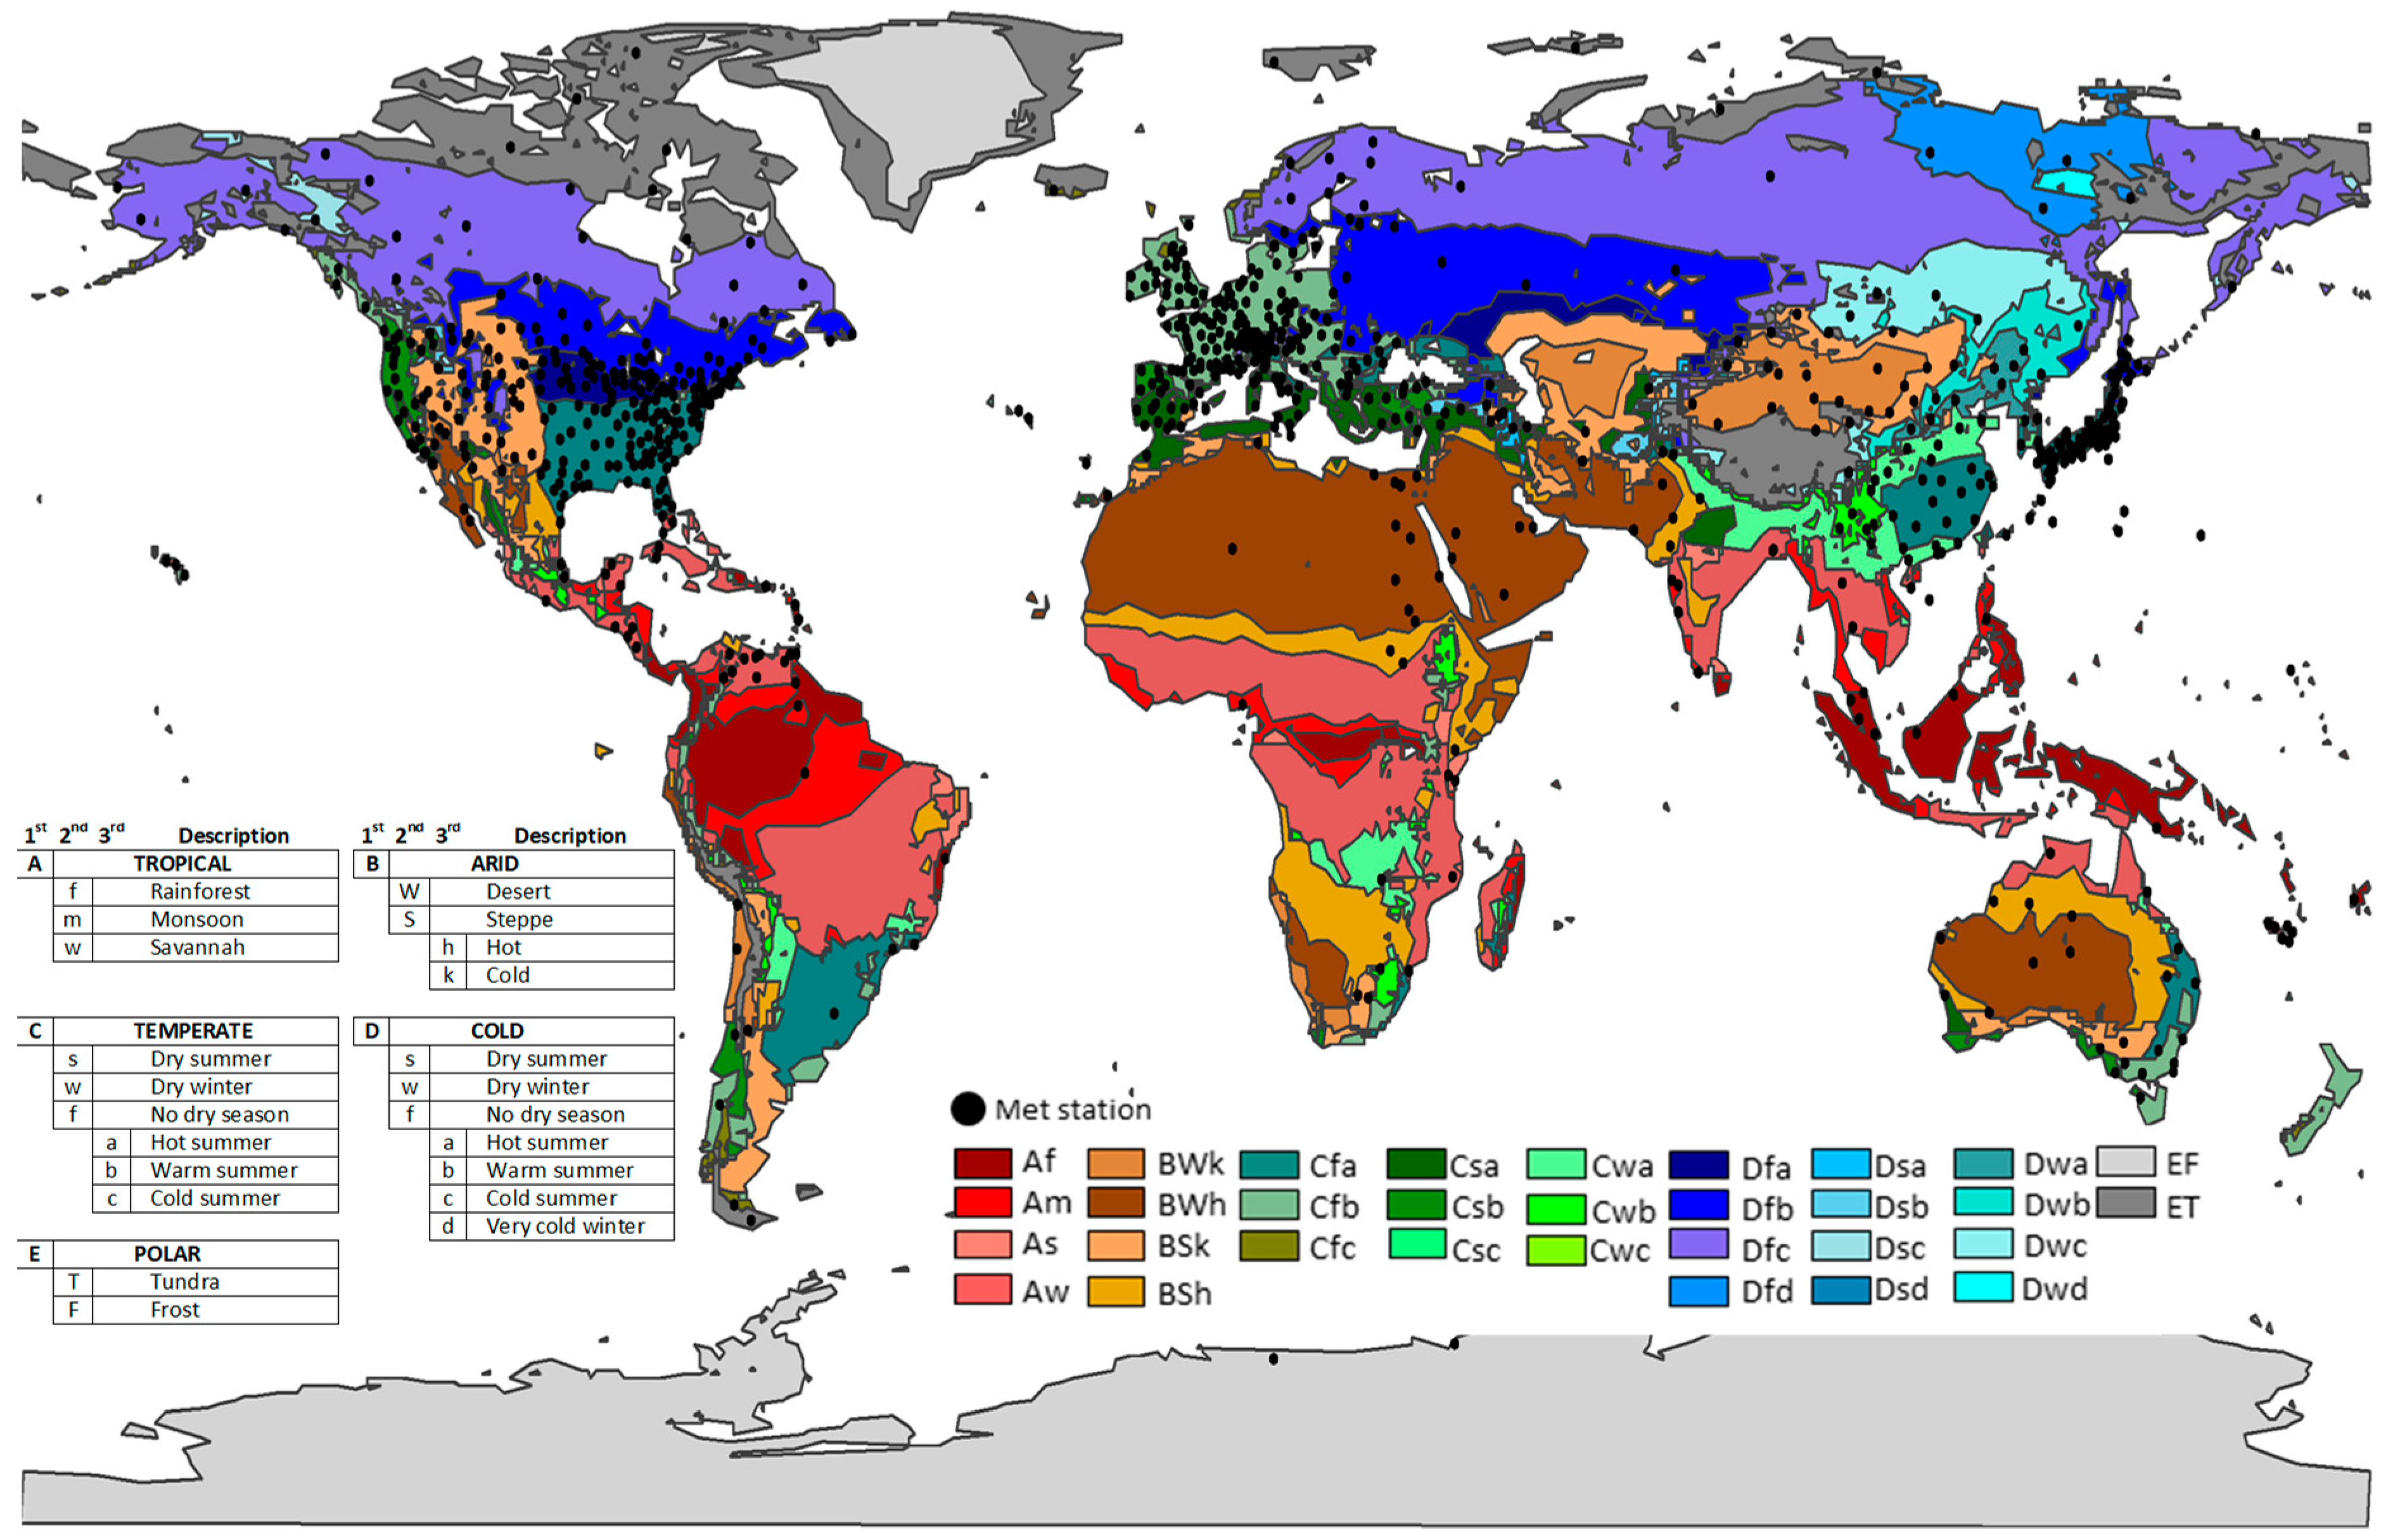
2.1. Climatic Data
2.2. Solar PV and Wind Generation Patterns
- Gx is the total solar irradiation incident on an optimally tilted solar panel.
- the surface covered by solar panels.
- η is the solar PV panel efficiency.
- is the facility performance ratio.
- is the maximum power temperature coefficient.
- is the ambient temperature (the temperature coefficient should be applied to the difference between the solar panel temperature and the standard value of 293 K. Nevertheless, as the solar temperature is not available, the correction has been applied considering the ambient temperature).
- is the output power from the power curve corresponding with the wind speed incident on the el VAWT (Figure 6).
- is the air density.
- is the time.
2.3. Demand Load Profiles
- The curves from every load profile were normalised dividing each hourly data into its respective daily maximum.
- Once normalised, the curves were separated out from the season and from weekday and weekend days.
- It was obtained average normalised curves for both hemispheres.
3. Results
3.1. Sensitivity Analysis
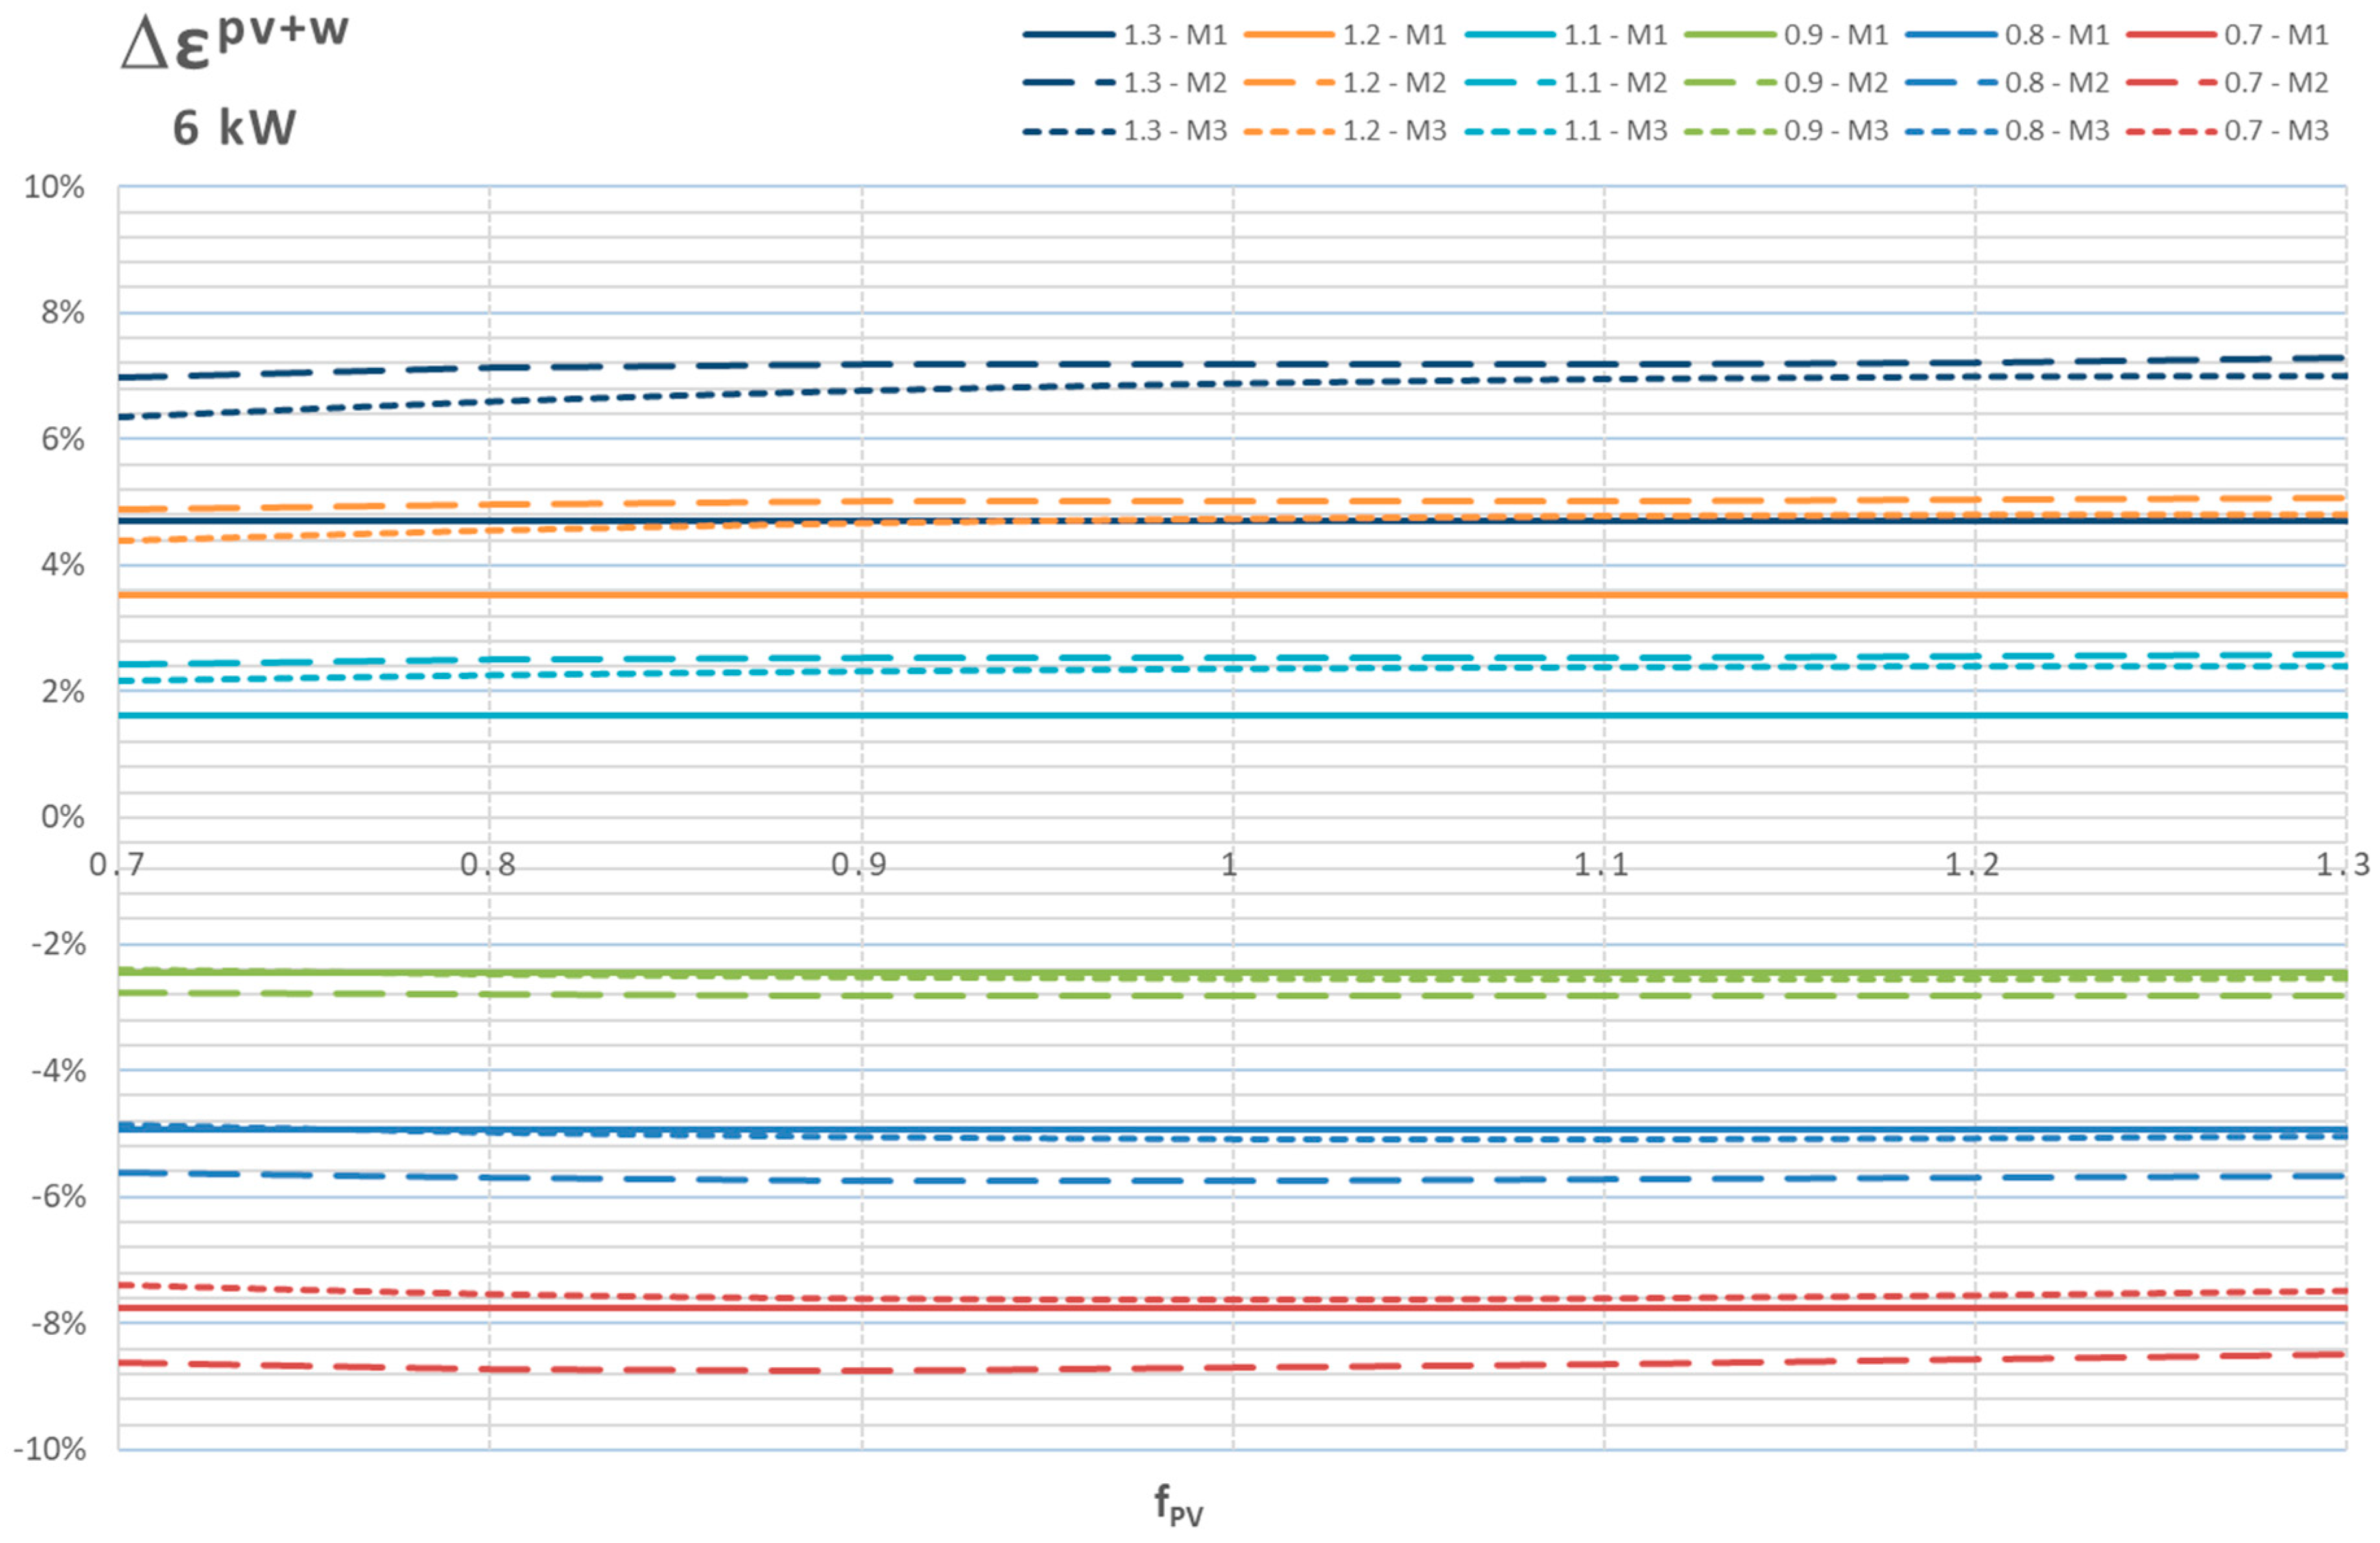
3.1.1. Sensitivity Related to Errors in the Resource Valuation
- hardly varies with changes of the irradiation for the three normalisation methods.
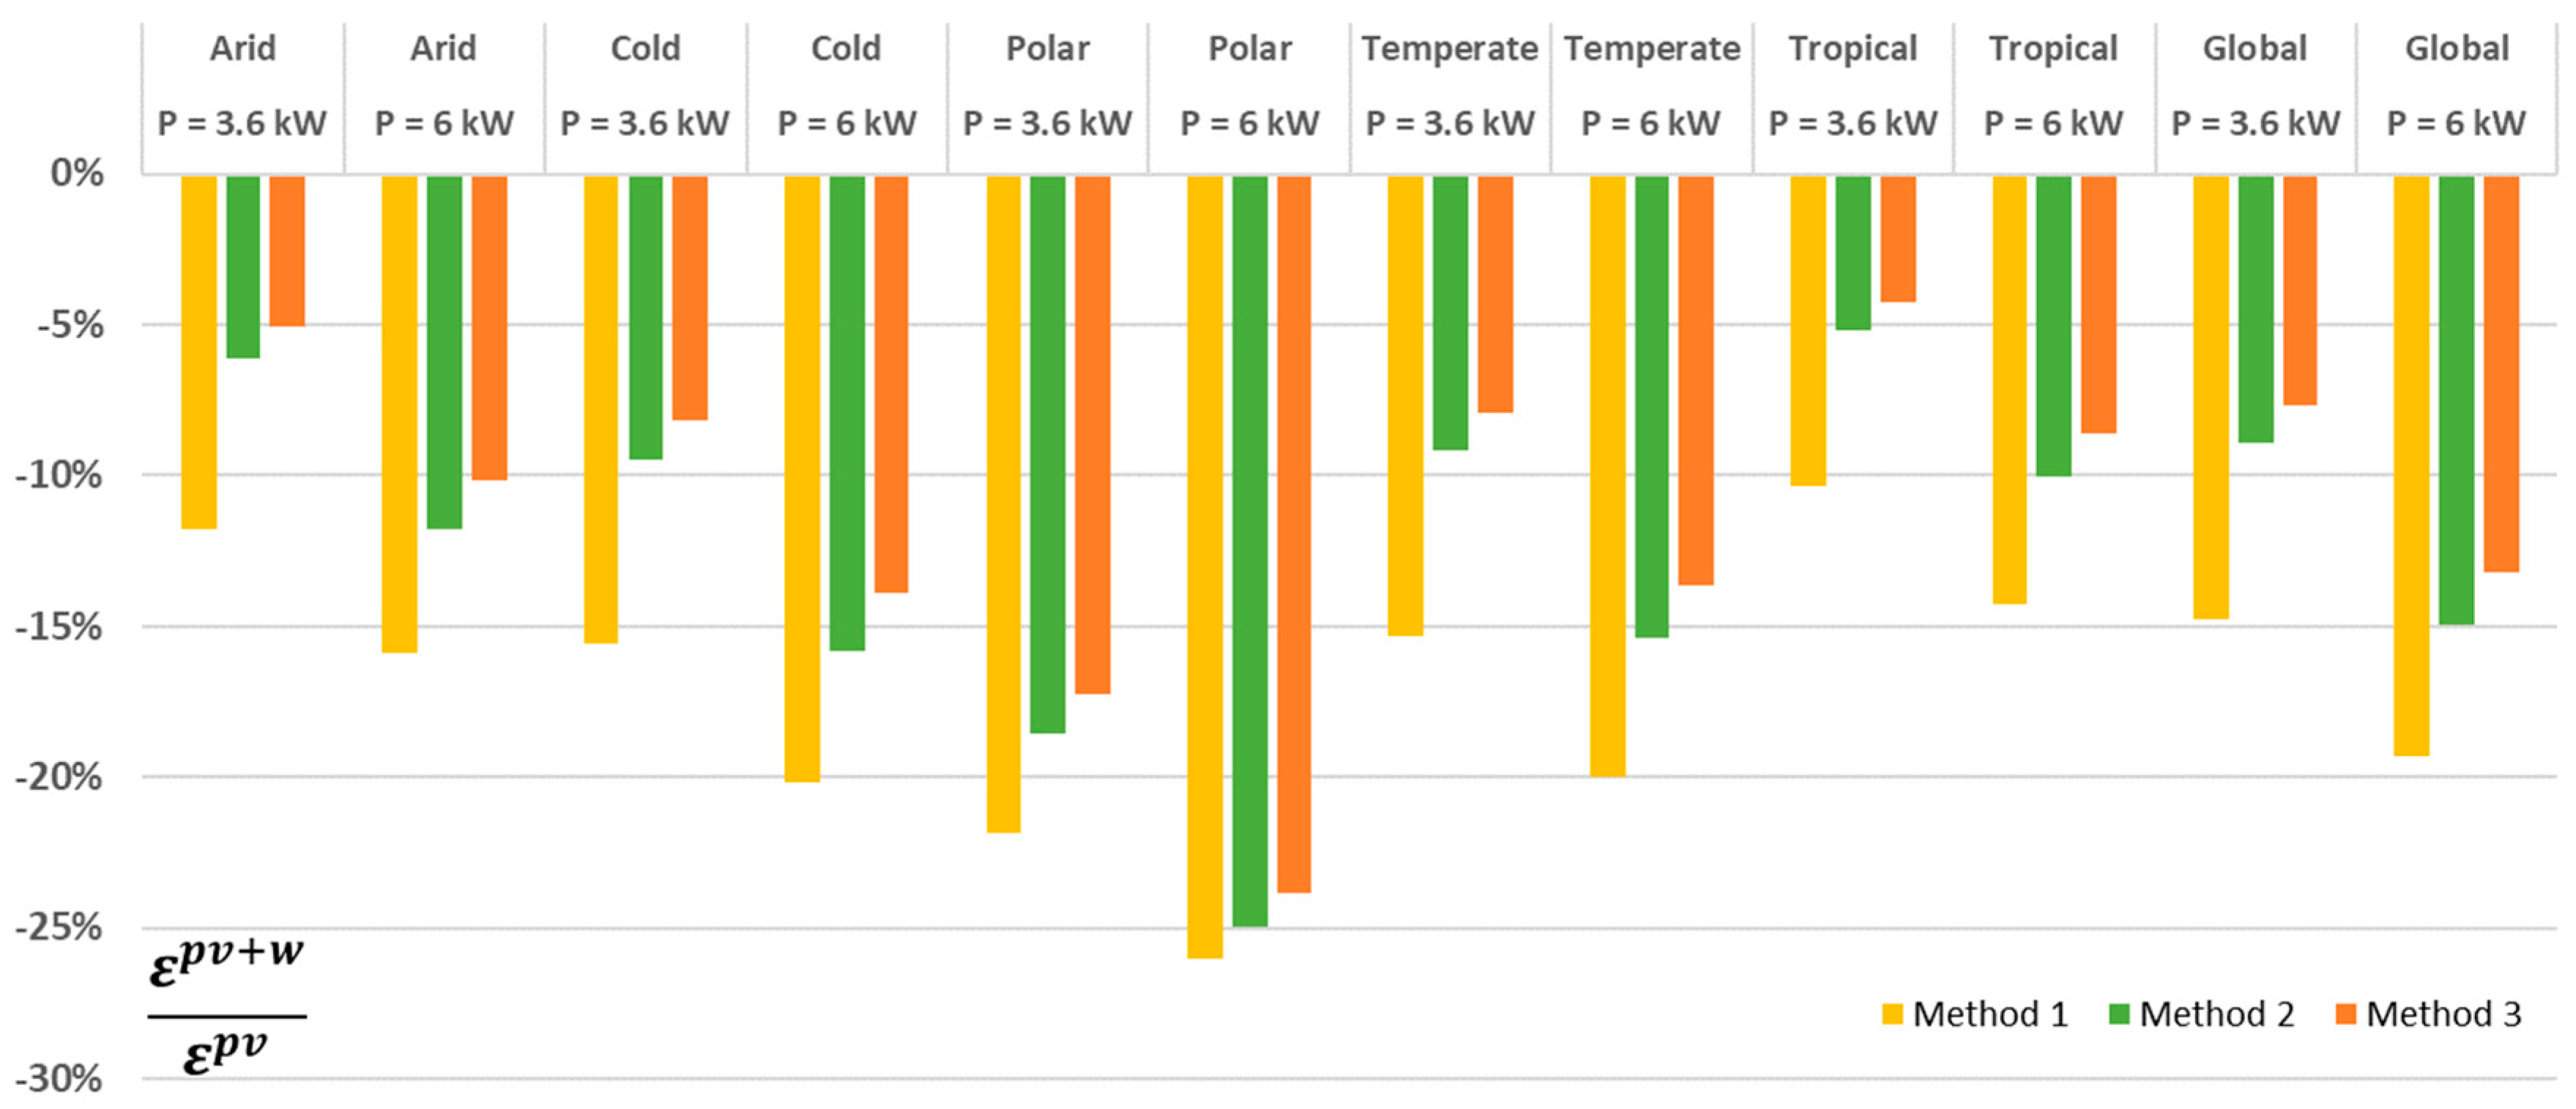
- The effect of variations in wind resource is quite limited. For increases in the mean wind speed of 30% (fw = 1.3) rises about 5%, while a decrement of 30% (fw = 0.7) produces a variation range from −5%, (normalisation method 3) to −8% (normalisation method 1).
3.1.2. Sensitivity Related to the Power Capacity of the Facilities
- A commercial solar panel manufactured with multi-crystalline silicon cells and an efficiency η of 17.5%. The rest of the solar panel characteristics are shown in the Table 9.
- 2.
- For the wind facility, a vertical-axis wind turbine generator was selected with a nameplate power capacity of 6 kW (similar to the PV facility capacity). Figure 15 shows the VAWT power curve for standard density (ρstd = 1.225 kg/cm2).
4. Discussion
5. Conclusions
Author Contributions
Funding
Acknowledgments
Conflicts of Interest
Nomenclature
| General | |
| APV | PV area |
| E | Energy generated (Wh) |
| e | Normalised energy generated |
| G | Yearly solar irradiation (insolation) in Wh/m2 incident on an optimally tilted solar panel |
| i | Facility type: PV (Photovoltaic), W (Wind) or PV+W (Hybrid) |
| L | Load electricity demand profile (Wh) |
| l | Normalised load electricity demand profile |
| P | Power (W) |
| PR | Performance ratio of the PV facility |
| PV | Photovoltaic electricity source |
| RES | Renewable Energy Source |
| Subscripts | |
| x | Location |
| y | Season: S (spring), U (summer), A (autumn), W (winter). |
| z | Day type: D (weekday), E (weekend). |
| Greeks | |
| α | Temperature coefficient of maximum power |
| ε | Matching factor |
| η | Solar panel efficiency |
| ρ | Air density |
References
- United Nations. UN Climate Change Conference Paris 2015. Available online: http://www.un.org/sustainabledevelopment/cop21/ (accessed on 9 July 2016).
- United Nations Framework Convention on Climate Change. Available online: http://unfccc.int/2860.php (accessed on 5 July 2016).
- United Nations Treaty Collection. Paris Agreement. Available online: https://treaties.un.org/pages/ViewDetails.aspx?src=TREATY&mtdsg_no=XXVII-7-d&chapter=27&lang=en (accessed on 9 July 2016).
- The US Department of Energy; Office of Energy Efficiency & Renewable Energy. The U.S. Department of Energy (DOE) SunShot Initiative. Available online: http://energy.gov/eere/sunshot/sunshot-initiative (accessed on 25 June 2016).
- The US Department of Energy; Office of Energy Efficiency & Renewable Energy. The U.S. Department of Energy (DOE) Wind Program. Available online: http://energy.gov/eere/wind/about-doe-wind-program (accessed on 25 June 2016).
- European Climate Foundation. Roadmap 2050: A Practical Guide to a Prosperous, Low Carbon Europe; European Climate Foundation: The Hague, The Netherlands, 2010. [Google Scholar]
- International Renewable Energy Agency. RESOURCE. 2018. Available online: http://resourceirena.irena.org/gateway/dashboard/ (accessed on 22 April 2018).
- REN21. Renewables 2018 Global Status Report; REN21 Secretariat: Paris, France, 2018; p. 325. [Google Scholar]
- Philipps, S.P.; Kost, C.; Schlegl, S. Up-to-Date Levelised Cost of Electricity of Photovoltaics; Fraunhofer Institute for Solar Energy Systems ISE: Freiburg, Germany, 2014. [Google Scholar]
- Energy Technology Systems Analysis Programme; International Renewable Energy Agency. Wind Power. Technology Brief; International Renewable Energy Agency: Abu Dhabi, UAE, 2016; p. 28. [Google Scholar]
- Lazard. In Levelized Cost of Energy v11; Lazard: New York, NY, USA, 2017; p. 22.
- Feldman, D.; Margolis, R.; Boff, D. Q4 2016/Q1 2017 Solar Industry Update; U.S. Department of Energy: Oak Ridge, TN, USA, 2017; p. 83.
- Huld, T.; Jäger Waldau, A.; Ossenbrink, H.; Szabo, S.; Dunlop, E.; Taylor, N. Cost Maps for Unsubsidised Photovoltaic Electricity; JRC 91937 Joint Research Centre of the European Commission: Brussels, Belgium, 2014; p. 22. [Google Scholar]
- Moné, C.; Hand, M.; Bolinger, M.; Rand, J.; Heimiller, D.; Ho, J. 2015 Cost of Wind Energy Review; NREL/TP-6A20-66861; National Renewable Energy Laboratory: Golden, CO, USA, 2017; p. 115.
- International Renewable Energy Agency. Renewable Power Generation Costs in 2017; International Renewable Energy Agency: Abu Dhabi, UAE, 2018; p. 160. [Google Scholar]
- Cayir Ervural, B.; Evren, R.; Delen, D. A multi-objective decision-making approach for sustainable energy investment planning. Renew. Energy 2018, 126, 387–402. [Google Scholar] [CrossRef]
- Patlitzianas, K.D.; Doukas, H.; Kagiannas, A.G.; Psarras, J. Sustainable energy policy indicators: Review and recommendations. Renew. Energy 2008, 33, 966–973. [Google Scholar] [CrossRef]
- Liu, G.; Li, M.; Zhou, B.; Chen, Y.; Liao, S. General indicator for techno-economic assessment of renewable energy resources. Energy Convers. Manag. 2018, 156, 416–426. [Google Scholar] [CrossRef]
- International Energy Agency. IEA Energy Technology Perspectives 2017; International Energy Agency: Paris, France, 2017. [Google Scholar]
- International Energy Agency. Technology Roadmap Wind Energy. 2013 Edition; International Energy Agency: Paris, France, 2013; p. 63. [Google Scholar]
- International Energy Agency. Technology Roadmap Solar Photovoltaic Energy. 2014 Edition; International Energy Agency: Paris, France, 2014; p. 20. [Google Scholar]
- International Renewable Energy Agency. REmap: Roadmap for a Renewable Energy Future; International Renewable Energy Agency: Abu Dhabi, UAE, 2016; p. 172. [Google Scholar]
- International Renewable Energy Agency. Renewable Energy in Cities; International Renewable Energy Agency: Abu Dhabi, UAE, 2016; p. 64. [Google Scholar]
- Karteris, M.; Slini, T.; Papadopoulos, A.M. Urban solar energy potential in Greece: A statistical calculation model of suitable built roof areas for photovoltaics. Energy Build. 2013, 62, 459–468. [Google Scholar] [CrossRef]
- Defaix, P.R.; van Sark, W.G.J.H.M.; Worrell, E.; de Visser, E. Technical potential for photovoltaics on buildings in the EU-27. Sol. Energy 2012, 86, 2644–2653. [Google Scholar] [CrossRef]
- Singh, R.; Banerjee, R. Estimation of rooftop solar photovoltaic potential of a city. Sol. Energy 2015, 115, 589–602. [Google Scholar] [CrossRef]
- Wiginton, L.K.; Nguyen, H.T.; Pearce, J.M. Quantifying rooftop solar photovoltaic potential for regional renewable energy policy. Comput. Environ. Urban Syst. 2010, 34, 345–357. [Google Scholar] [CrossRef]
- Colmenar-Santos, A.; Campíñez-Romero, S.; Pérez-Molina, C.; Mur-Pérez, F. An assessment of photovoltaic potential in shopping centres. Sol. Energy 2016, 135, 662–673. [Google Scholar] [CrossRef]
- Mohajeri, N.; Upadhyay, G.; Gudmundsson, A.; Assouline, D.; Kämpf, J.; Scartezzini, J.-L. Effects of urban compactness on solar energy potential. Renew. Energy 2016, 93, 469–482. [Google Scholar] [CrossRef] [Green Version]
- Song, X.; Huang, Y.; Zhao, C.; Liu, Y.; Lu, Y.; Chang, Y.; Yang, J. An Approach for Estimating Solar Photovoltaic Potential Based on Rooftop Retrieval from Remote Sensing Images. Energies 2018, 11, 3172. [Google Scholar] [CrossRef]
- Polo, M.-E.; Pozo, M.; Quirós, E. Circular Statistics Applied to the Study of the Solar Radiation Potential of Rooftops in a Medium-Sized City. Energies 2018, 11, 2813. [Google Scholar] [CrossRef]
- Moraitis, P.; Kausika, B.; Nortier, N.; van Sark, W. Urban Environment and Solar PV Performance: The Case of the Netherlands. Energies 2018, 11, 1333. [Google Scholar] [CrossRef]
- Toja-Silva, F.; Colmenar-Santos, A.; Castro-Gil, M. Urban wind energy exploitation systems: Behaviour under multidirectional flow conditions—Opportunities and challenges. Renew. Sustain. Energy Rev. 2013, 24, 364–378. [Google Scholar] [CrossRef]
- Araújo, A.M.; de Alencar Valença, D.A.; Asibor, A.I.; Rosas, P.A.C. An approach to simulate wind fields around an urban environment for wind energy application. Environ. Fluid Mech. 2013, 13, 33–50. [Google Scholar] [CrossRef]
- Grant, A.; Johnstone, C.; Kelly, N. Urban wind energy conversion: The potential of ducted turbines. Renew. Energy 2008, 33, 1157–1163. [Google Scholar] [CrossRef] [Green Version]
- Grieser, B.; Sunak, Y.; Madlener, R. Economics of small wind turbines in urban settings: An empirical investigation for Germany. Renew. Energy 2015, 78, 334–350. [Google Scholar] [CrossRef]
- Pagnini, L.C.; Burlando, M.; Repetto, M.P. Experimental power curve of small-size wind turbines in turbulent urban environment. Appl. Energy 2015, 154, 112–121. [Google Scholar] [CrossRef]
- Alexandru-Mihai, C.; Alexandru, B.; Ionut-Cosmin, O.; Florin, F. New Urban Vertical Axis Wind Turbine Design. INCAS Bull. 2015, 7, 67–76. [Google Scholar] [CrossRef]
- Carcangiu, S.; Montisci, A. A building-integrated eolic system for the exploitation of wind energy in urban areas. In Proceedings of the 2012 IEEE International Energy Conference and Exhibition (ENERGYCON), Florence, Italy, 9–12 September 2012; pp. 172–177. [Google Scholar]
- Pagnini, L.; Piccardo, G.; Repetto, M.P. Full scale behavior of a small size vertical axis wind turbine. Renew. Energy 2018, 127, 41–55. [Google Scholar] [CrossRef]
- Micallef, D.; van Bussel, G. A Review of Urban Wind Energy Research: Aerodynamics and Other Challenges. Energies 2018, 11, 2204. [Google Scholar] [CrossRef]
- Klima, K.; Apt, J. Geographic smoothing of solar PV: Results from Gujarat. Environ. Res. Lett. 2015, 10, 104001. [Google Scholar] [CrossRef]
- Monforti, F.; Huld, T.; Bódis, K.; Vitali, L.; D’Isidoro, M.; Lacal Arantegui, R. Assessing complementarity of wind and solar resources for energy production in Italy. A Monte Carlo approach. 2014, 63, 576–586. [Google Scholar] [CrossRef]
- Santos-Alamillos, F.J.; Pozo-Vázquez, D.; Ruiz-Arias, J.A.; Lara-Fanego, V.; Tovar-Pescador, J. Analysis of Spatiotemporal Balancing between Wind and Solar Energy Resources in the Southern Iberian Peninsula. J. Appl. Meteorol. Climatol. 2012, 51, 2005–2024. [Google Scholar] [CrossRef]
- Widen, J. Correlations Between Large-Scale Solar and Wind Power in a Future Scenario for Sweden. IEEE Trans. Sustain. Energy 2011, 2, 177–184. [Google Scholar] [CrossRef]
- Zhang, H.; Cao, Y.; Zhang, Y.; Terzija, V. Quantitative synergy assessment of regional wind-solar energy resources based on MERRA reanalysis data. Appl. Energy 2018, 216, 172–182. [Google Scholar] [CrossRef]
- Prasad, A.A.; Taylor, R.A.; Kay, M. Assessment of solar and wind resource synergy in Australia. Appl. Energy 2017, 190, 354–367. [Google Scholar] [CrossRef]
- Huber, M.; Dimkova, D.; Hamacher, T. Integration of wind and solar power in Europe: Assessment of flexibility requirements. Energy 2014, 69, 236–246. [Google Scholar] [CrossRef] [Green Version]
- Solomon, A.A.; Kammen, D.M.; Callaway, D. Investigating the impact of wind–solar complementarities on energy storage requirement and the corresponding supply reliability criteria. Appl. Energy 2016, 168, 130–145. [Google Scholar] [CrossRef] [Green Version]
- Jurasz, J.; Beluco, A.; Canales, F.A. The impact of complementarity on power supply reliability of small scale hybrid energy systems. Energy 2018, 161, 737–743. [Google Scholar] [CrossRef]
- The US Department of Energy, Office of Electricity Delivery & Energy Reliability. The Potential Benefits of Distributed Generation and the Rate-Related Issues That May Impede Its Expansion; U.S. Department of Energy: Oak Ridge, TN, USA, 2015.
- Abdmouleh, Z.; Gastli, A.; Ben-Brahim, L.; Haouari, M.; Al-Emadi, N.A. Review of optimization techniques applied for the integration of distributed generation from renewable energy sources. Renew. Energy 2017, 113, 266–280. [Google Scholar] [CrossRef]
- Ruiz-Romero, S.; Colmenar-Santos, A.; Gil-Ortego, R.; Molina-Bonilla, A. Distributed generation: The definitive boost for renewable energy in Spain. Renew. Energy 2013, 53, 354–364. [Google Scholar] [CrossRef]
- Mai, T.; Wiser, R.; Sandor, D.; Brinkman, G.; Heath, G.; Denholm, P.; Hostick, D.J.; Darghouth, N.; Schlosser, A.; Strzepek, K. Exploration of High-Penetration Renewable Electricity Futures; NREL/TP-6A20-52409-1; National Renewable Energy Laboratory: Golden, CO, USA, 2012.
- International Energy Agency. System Integration of Renewables. An update on Best Practice; International Energy Agency: Paris, France, 2018. [Google Scholar]
- Batalla-Bejerano, J.; Trujillo-Baute, E. Impacts of intermittent renewable generation on electricity system costs. Energy Policy 2016, 94, 411–420. [Google Scholar] [CrossRef]
- Delarue, E.; Van Hertem, D.; Bruninx, K.; Ergun, H.; May, K.; Van den Bergh, K. Determining the Impact of Renewable Energy on Balancing Costs, Back Up Costs, Grid Costs and Subsidies; Report for Adviesraad Gas en Elektriciteit—CREG; CREG: Brussels, Belgium, 2016. [Google Scholar]
- Hirth, L.; Ueckerdt, F.; Edenhofer, O. Integration costs revisited—An economic framework for wind and solar variability. Renew. Energy 2015, 74, 925–939. [Google Scholar] [CrossRef]
- Shang, Y. Resilient Multiscale Coordination Control against Adversarial Nodes. Energies 2018, 11, 1844. [Google Scholar] [CrossRef]
- Spanish National Statistics Centre. Buildings and Population Census; Spanish National Statistics Centre: Madrid, Spain, 2019. [Google Scholar]
- Spanish Ministry of Development. Buildings Construction Licences; Spanish Ministry of Development: Madrid, Spain, 2019. [Google Scholar]
- Eurostat. CensusHub2. 2019. Available online: https://ec.europa.eu/CensusHub2/query.do?step=selectHyperCube&qhc=false (accessed on 20 March 2019).
- U.S. Census Bureau. American FactFinder. Annual Estimates of Housing Units for the United States, Regions, Divisions, States, and Counties: April 1, 2010 to July 1, 2017. 2017 Population Estimates. Available online: https://factfinder.census.gov/faces/tableservices/jsf/pages/productview.xhtml?pid=PEP_2018_PEPANNRES&src=pt (accessed on 20 March 2019).
- U.S. Energy Information Administration. Commercial Buildings Energy Consumption Survey (CBECS); U.S. Energy Information Administration: Washington, DC, USA, 2016.
- Red Eléctrica de España, S.A. Esios. System Operator Information System. Available online: https://www.esios.ree.es/en/analysis/10004?vis=1&start_date=31-03-2016T00%3A00&end_date=31-03-2016T23%3A50&compare_start_date=30-03-2016T00%3A00&groupby=minutes10&compare_indicators=545,544 (accessed on 2 April 2018).
- ENTSO-E. Electricity in Europe 2017. Synthetic Overview of Electric System Consumption, Generation and Exchanges in 34 European Countries; ENTSO-E: Brussels, Belgium, 2018; p. 20. [Google Scholar]
- ENTSO-E. Monthly Hourly Load Values; ENTSO-E: Brussels, Belgium, 2019. [Google Scholar]
- U.S. Energy Information Administration. U.S. Electric System Operating Data; U.S. Energy Information Administration: Washington, DC, USA, 2019.
- Meteotest Genossenchaff Meteonorm, 7th ed. Available online: https://meteonorm.com/t (accessed on 10 January 2018).
- Köppen, W.; Geiger, R. Das geographische System der Klimate. In Handbuch der Klimatologie; Köppen, W., Geiger, R., Eds.; Verlag von Gebrüder Borntraeger: Berlin, Germany, 1936; Volume I, p. 44. [Google Scholar]
- Kottek, M.; Grieser, J.; Beck, C.; Rudolf, B.; Rubel, F. World Map of the Köppen-Geiger climate classification updated. Meteorol. Z. 2006, 15, 259–263. [Google Scholar] [CrossRef]
- University of Veterinary Medicine Vienna. Institute for Veterinary Public Health. World Maps of Köppen-Geiger Climate Classification. Available online: http://koeppen-geiger.vu-wien.ac.at/ (accessed on 20 June 2016).
- Duffie, J.A.; Beckman, W.A.; Worek, W.M. Solar Engineering of Thermal Processes, 4th ed.; John Wiley & Sons, Inc.: Hoboken, NJ, USA, 2013; p. 928. [Google Scholar]
- International Technology Roadmap for Photovoltaic. ITRPV 2017 Results; VDMA: Francfurt, Germany, 2018; p. 71. [Google Scholar]
- Trina Solar. Products. PC14. 72-Cell Utility Module. Available online: http://www.trinasolar.com/uk/product/PC14.html (accessed on 15 May 2016).
- Reich, N.H.; Mueller, B.; Armbruster, A.; van Sark, W.G.J.H.M.; Kiefer, K.; Reise, C. Performance ratio revisited: Is PR > 90% realistic? Prog. Photovolt. Res. Appl. 2012, 20, 717–726. [Google Scholar] [CrossRef]
- Dierauf, T.; Growitz, A.; Kurtz, S.; Becerra Cruz, J.L.; Riley, E.; Hansen, C. Weather-Corrected Performance Ratio; NREL/TP-5200-57991; National Renewable Energy Laboratory: Golden, CO, USA, 2013.
- V-AIR. Vertical Axis Wind Turbine VisionAir5. Available online: http://www.visionairwind.com/wp-content/uploads/2018/08/VisionAIR5.pdf (accessed on 6 April 2019).
- Carta González, J.A.; Calero Pérez, R.; Colmenar-Santos, A.; Castro Gil, M.-A. Centrales de Energías Renovables: Generación Eléctrica con Energías Renovables; Pearson Educación, S.A.: Madrid, Spain, 2009; p. 728. [Google Scholar]
- PJM. Data Viewer. Load. Available online: https://dataviewer.pjm.com/dataviewer/pages/public/load.jsf (accessed on 2 April 2018).
- Northwest Power Pool. Geographic NWPP Aggregated Wind Generation and Load Data. Available online: http://www.nwpp.org/our-resources/NWPP-Reserve-Sharing-Group/Geographic-NWPP-Aggregated-Wind-Generation-and-Load-Data (accessed on 2 April 2018).
- Midcontinent Independent System Operator. I. Market Reports. Available online: https://www.misoenergy.org/markets-and-operations/market-reports/#nt=%2FMarketReportType%3ASummary%2FMarketReportName%3ADaily%20Regional%20Forecast%20and%20Actual%20Load%20(xls)&t=10&p=0&s=MarketReportPublished&sd=desc (accessed on 2 April 2018).
- Coordinador Eléctrico Nacional. Operación Real. Available online: https://sic.coordinador.cl/informes-y-documentos/fichas/operacion-real/ (accessed on 1 April 2018).
- Australian Energy Market Operation. Electricity Load Profiles—Aggregated Price and Demand Data—Historical. Available online: https://www.aemo.com.au/Electricity/National-Electricity-Market-NEM/Data-dashboard#aggregated-data (accessed on 1 April 2018).
- Trina Solar. Products. PD14. 72-Cell Utility Module. Available online: http://static.trinasolar.com/sites/default/files/ES_TSM_PD14_datasheet_B_2017_web.pdf (accessed on 21 April 2018).
- Kingspan Renewable Technologies. KW6 Wind Turbine. Available online: https://www.kingspan.com/gb/en-gb/products/renewable-technologies/wind-energy/kw6-wind-turbine (accessed on 21 April 2018).
- National Distance Education University. Department of Electrical, Electronic and Control Engineering. Available online: http://www2.uned.es/personal/antoniocolmenar/publicaciones.htm (accessed on 1 May 2016).


| Topic | Reference |
|---|---|
| Smoothing resource and the correlation between the wind and solar PV resource | [42] |
| Variability and determination of regional or local wind solar complementarity or synergy | [43,44,45,46,47] |
| Determination of flexibility requirements of large-scale wind and PV penetration | [48] |
| Impact of wind solar complementarities on storage sizing and use | [49] |
| Effect of solar and wind resources complementarity in micro-hybrid system reliability | [50] |
| Variable | Spain (SP) | Europe EU28 Countries (EU) | US |
|---|---|---|---|
| NB | 10,000,000 [60,61] | 130,000,000 [62] | 142,500,000 [63,64] |
| CF | 50% | ||
| RHAD (MWh) | 30,000 [65] | 400,000 [66,67] | 430,000 [68] |
| AHIC (kW) | |||||||||||||
|---|---|---|---|---|---|---|---|---|---|---|---|---|---|
| 2 | 5 | 7.5 | 10 | ||||||||||
| Country/Region | SP | EU | US | SP | EU | US | SP | EU | US | SP | EU | US | |
| AB (% share out of total) | 5.0% | 1.7% | 1.6% | 1.7% | 4.2% | 4.1% | 4.1% | 6.3% | 6.1% | 6.2% | 8.3% | 8.1% | 8.3% |
| 7.5% | 2.5% | 2.4% | 2.5% | 6.3% | 6.1% | 6.2% | 9.4% | 9.1% | 9.3% | 12.5% | 12.2% | 12.4% | |
| 10.0% | 3.3% | 3.3% | 3.3% | 8.3% | 8.1% | 8.3% | 12.5% | 12.2% | 12.4% | 16.7% | 16.3% | 16.6% | |
| 12.5% | 4.2% | 4.1% | 4.1% | 10.4% | 10.2% | 10.4% | 15.6% | 15.2% | 15.5% | 20.8% | 20.3% | 20.7% | |
| 15.0% | 5.0% | 4.9% | 5.0% | 12.5% | 12.2% | 12.4% | 18.8% | 18.3% | 18.6% | 25.0% | 24.4% | 24.9% | |
| Hemisphere | Day | Season | |||
|---|---|---|---|---|---|
| Spring (S) | Summer (U) | Autumn (A) | Winter (W) | ||
| Northern (N) | Weekday (D) | LNSD | LNUD | LNAD | LNWD |
| Weekend (E) | LNSE | LNUE | LNAE | LNWE | |
| Southern (S) | Weekday (D) | LSSD | LSUD | LSAD | LSWD |
| Weekend (E) | LSSE | LSUE | LSAE | LSWE | |
| Characteristic | Value |
|---|---|
| Manufacturer | Trina Solar |
| Model | TSM-PC14 |
| Cell type | Si Multicrystalline |
| Maximum Power (STC conditions) | 300 W |
| Efficiency (η) | 15.5% |
| Dimensions (h × w × d) | 1956 × 992 × 40 mm3 |
| Temperature Coefficient of maximum power (α) | −0.41%/K |
| Climate Zone | n° Stations | Climate Zone | n° Stations | ||
|---|---|---|---|---|---|
| Arid | 109 | 0.89 | Tropical | 66 | 0.91 |
| BSh | 16 | 0.90 | Af | 21 | 0.89 |
| BSk | 46 | 0.86 | Am | 8 | 0.93 |
| BWh | 27 | 0.90 | As | 4 | 0.87 |
| BWk | 20 | 0.92 | Aw | 33 | 0.92 |
| Cold | 188 | 0.83 | Temperate | 459 | 0.84 |
| Dfa | 29 | 0.78 | Cfa | 192 | 0.87 |
| Dfb | 90 | 0.83 | Cfb | 162 | 0.78 |
| Dfc | 40 | 0.81 | Cfc | 4 | 0.68 |
| Dfd | 4 | 0.93 | Csa | 45 | 0.85 |
| Dsa | 1 | 1.00 | Csb | 34 | 0.87 |
| Dsb | 3 | 0.93 | Cwa | 17 | 0.91 |
| Dsc | 1 | 0.82 | Cwb | 5 | 0.96 |
| Dwa | 10 | 0.88 | |||
| Dwb | 5 | 0.88 | Polar | 32 | 0.71 |
| Dwc | 5 | 0.95 | EF | 2 | 0.33 |
| ET | 30 | 0.74 | |||
| Global | 854 | 0.84842 |
| Hemisphere | Distributor/Operator | Country |
|---|---|---|
| North | Red Eléctrica de España | Spain |
| PJM | USA–Northeast | |
| Midcontinent Independent System Operator | USA–West | |
| Northwest PowerPool | USA–Northwest | |
| South | National Electricity Coordinator | Chile |
| Australian Energy Market Operation | Western Australia |
| Climate Zone | n° Stations | Method 1 | Method 2 | Method 3 | ||||||||
|---|---|---|---|---|---|---|---|---|---|---|---|---|
| Arid | 109 | 0.46 | 0.60 | 0.40 | −12% | −33% | 0.43 | −6% | −28% | 0.43 | −5% | −27% |
| BSh | 16 | 0.46 | 0.59 | 0.40 | −12% | −32% | 0.43 | −6% | −27% | 0.43 | −5% | −26% |
| BSk | 46 | 0.46 | 0.59 | 0.39 | −14% | −33% | 0.42 | −8% | −28% | 0.43 | −6% | −27% |
| BWh | 27 | 0.45 | 0.58 | 0.40 | −12% | −31% | 0.43 | −6% | −26% | 0.43 | −5% | −25% |
| BWk | 20 | 0.45 | 0.65 | 0.42 | −6% | −35% | 0.44 | −3% | −32% | 0.44 | −3% | −32% |
| Cold | 188 | 0.47 | 0.61 | 0.40 | −6% | −35% | 0.42 | −9% | −30% | 0.43 | −8% | −29% |
| Dfa | 29 | 0.47 | 0.55 | 0.37 | −20% | −33% | 0.41 | −12% | −26% | 0.42 | −11% | −25% |
| Dfb | 90 | 0.47 | 0.60 | 0.39 | −16% | −35% | 0.42 | −10% | −30% | 0.43 | −8% | −29% |
| Dfc | 40 | 0.47 | 0.62 | 0.40 | −16% | −36% | 0.42 | −11% | −32% | 0.43 | −10% | −31% |
| Dfd | 4 | 0.47 | 0.71 | 0.46 | −4% | −37% | 0.47 | −2% | −35% | 0.47 | −1% | −35% |
| Dsa | 1 | 0.46 | 0.76 | 0.46 | 0% | −40% | 0.46 | 0% | −40% | 0.46 | 0% | −40% |
| Dsb | 3 | 0.46 | 0.65 | 0.42 | −9% | −36% | 0.44 | −4% | −32% | 0.45 | −3% | −32% |
| Dsc | 1 | 0.47 | 0.60 | 0.37 | −20% | −38% | 0.41 | −13% | −32% | 0.41 | −11% | −31% |
| Dwa | 10 | 0.47 | 0.64 | 0.42 | −10% | −35% | 0.44 | −6% | −31% | 0.44 | −5% | −31% |
| Dwb | 5 | 0.46 | 0.64 | 0.41 | −11% | -36% | 0.44 | −6% | −32% | 0.44 | −5% | −31% |
| Dwc | 5 | 0.45 | 0.68 | 0.43 | −5% | −37% | 0.44 | −2% | −35% | 0.45 | −2% | −35% |
| Polar | 32 | 0.47 | 0.56 | 0.37 | −22% | −34% | 0.38 | −19% | −31% | 0.39 | −17% | −30% |
| EF | 2 | 0.49 | 0.34 | 0.26 | −48% | −24% | 0.25 | −49% | −27% | 0.26 | −48% | −25% |
| ET | 30 | 0.47 | 0.57 | 0.37 | −20% | −34% | 0.39 | −16% | −31% | 0.40 | −15% | −30% |
| Temperate | 459 | 0.47 | 0.61 | 0.39 | −15% | −35% | 0.42 | −9% | −30% | 0.43 | −8% | −29% |
| Cfa | 192 | 0.47 | 0.60 | 0.40 | −15% | −34% | 0.43 | −8% | −29% | 0.43 | −7% | −28% |
| Cfb | 162 | 0.47 | 0.59 | 0.38 | −19% | −36% | 0.41 | −13% | −31% | 0.42 | −11% | −29% |
| Cfc | 4 | 0.47 | 0.54 | 0.35 | −25% | −35% | 0.39 | −18% | −29% | 0.39 | −16% | −28% |
| Csa | 45 | 0.46 | 0.62 | 0.41 | −11% | −35% | 0.43 | −7% | −31% | 0.43 | −6% | −30% |
| Csb | 34 | 0.46 | 0.63 | 0.41 | −12% | −36% | 0.43 | −6% | −32% | 0.44 | −5% | −31% |
| Cwa | 17 | 0.46 | 0.64 | 0.42 | −10% | −35% | 0.44 | −5% | −31% | 0.44 | −4% | −30% |
| Cwb | 5 | 0.45 | 0.67 | 0.43 | −5% | −36% | 0.44 | −2% | −34% | 0.45 | −2% | −33% |
| Tropical | 66 | 0.46 | 0.63 | 0.41 | −10% | −34% | 0.44 | −5% | −30% | 0.44 | −4% | −29% |
| Af | 21 | 0.46 | 0.62 | 0.41 | −11% | −34% | 0.43 | −6% | −29% | 0.44 | −5% | −29% |
| Am | 8 | 0.46 | 0.64 | 0.42 | −9% | −35% | 0.44 | −4% | −31% | 0.45 | −3% | −30% |
| As | 4 | 0.46 | 0.55 | 0.39 | −16% | −30% | 0.42 | −8% | −23% | 0.43 | −6% | −22% |
| Aw | 33 | 0.46 | 0.64 | 0.42 | −9% | −35% | 0.44 | −5% | −31% | 0.44 | −4% | −30% |
| Global | 854 | 0.46 | 0.60 | 0.4 | −15% | −35% | 0.42 | −8.9% | −30% | 0.43 | −7.7% | −29% |
| Characteristic | Value |
|---|---|
| Manufacturer | Trina Solar |
| Model | TSM-PD14 |
| Cell type | Si Multicrystalline |
| Maximum Power (STC conditions) | 320 W |
| Efficiency (η) | 17.5% |
| Dimensions (h × w × d) | 1960 × 992 × 40 mm3 |
| Temperature Coefficient of maximum power (α) | −0.41%/K |
© 2019 by the authors. Licensee MDPI, Basel, Switzerland. This article is an open access article distributed under the terms and conditions of the Creative Commons Attribution (CC BY) license (http://creativecommons.org/licenses/by/4.0/).
Share and Cite
Lopez-Rey, A.; Campinez-Romero, S.; Gil-Ortego, R.; Colmenar-Santos, A. Evaluation of Supply–Demand Adaptation of Photovoltaic–Wind Hybrid Plants Integrated into an Urban Environment. Energies 2019, 12, 1780. https://doi.org/10.3390/en12091780
Lopez-Rey A, Campinez-Romero S, Gil-Ortego R, Colmenar-Santos A. Evaluation of Supply–Demand Adaptation of Photovoltaic–Wind Hybrid Plants Integrated into an Urban Environment. Energies. 2019; 12(9):1780. https://doi.org/10.3390/en12091780
Chicago/Turabian StyleLopez-Rey, Africa, Severo Campinez-Romero, Rosario Gil-Ortego, and Antonio Colmenar-Santos. 2019. "Evaluation of Supply–Demand Adaptation of Photovoltaic–Wind Hybrid Plants Integrated into an Urban Environment" Energies 12, no. 9: 1780. https://doi.org/10.3390/en12091780
APA StyleLopez-Rey, A., Campinez-Romero, S., Gil-Ortego, R., & Colmenar-Santos, A. (2019). Evaluation of Supply–Demand Adaptation of Photovoltaic–Wind Hybrid Plants Integrated into an Urban Environment. Energies, 12(9), 1780. https://doi.org/10.3390/en12091780