Article

An Empirical Study on Low Emission Taxiing Path Optimization of Aircrafts on Airport Surfaces from the Perspective of Reducing Carbon Emissions

1
College of Air Traffic Management, Civil Aviation University of China, Tianjin 300300, China
2
China Civil Aviation Environment and Sustainable Development Research Center, Tianjin 300300, China
3
School of Software of Dalian University of Technology, Dalian 116620, China
4
Operation and Control Center, Shandong Airlines, Jinan 250014, China
5
Zhongshan Institute, University of Electronic Science and Technology of China, Guangdong 528400, China
*
Authors to whom correspondence should be addressed.
Energies 2019, 12(9), 1649; https://doi.org/10.3390/en12091649
Submission received: 8 April 2019 / Revised: 25 April 2019 / Accepted: 28 April 2019 / Published: 30 April 2019

Abstract

:
Aircraft emissions are the main cause of airport air pollution. One of the keys to achieving airport energy conservation and emission reduction is to optimize aircraft taxiing paths. The traditional optimization method based on the shortest taxi time is to model the aircraft under the assumption of uniform speed taxiing. Although it is easy to solve, it does not take into account the change of the velocity profile when the aircraft turns. In view of this, this paper comprehensively considered the aircraft’s taxiing distance, the number of large steering times and collision avoidance in the taxi, and established a path optimization model for aircraft taxiing at airport surface with the shortest total taxi time as the target. The genetic algorithm was used to solve the model. The experimental results show that the total fuel consumption and emissions of the aircraft are reduced by 35% and 46%, respectively, before optimization, and the taxi time is greatly reduced, which effectively avoids the taxiing conflict and reduces the pollutant emissions during the taxiing phase. Compared with traditional optimization methods that do not consider turning factors, energy saving and emission reduction effects are more significant. The proposed method is faster than other complex algorithms considering multiple factors, and has higher practical application value. It is expected to be applied in the more accurate airport surface real-time running trajectory optimization in the future. Future research will increase the actual interference factors of the airport, comprehensively analyze the actual situation of the airport’s inbound and outbound flights, dynamically adjust the taxiing path of the aircraft and maintain the real-time performance of the system, and further optimize the algorithm to improve the performance of the algorithm.

1. Introduction

With the rapid growth of traffic flow in the civil aviation transportation industry, the operation of major airports in China has become increasingly congested, and the operational safety and efficiency problems of airport surfaces have become increasingly serious. At the same time, the amount of pollutants emitted by flight operations has gradually increased, bringing immeasurable pressure to the future atmospheric environment. In order to develop air transport sustainably, the realization of a safe, efficient, and environmentally friendly new aircraft operation method has become an important means to maintain the sustainable development of air transport. In this context, the use of scientific methods and efficient path planning can reduce aircraft taxiing time, avoid aircraft taxiing conflicts, improve the overall operation efficiency of the airport, reduce aircraft fuel consumption, and promote the construction of green airports.
Many national and international scholars have investigated taxi path optimization and pollutant emissions of aircrafts on airport surfaces. In 2013, Landry et al. [1] used complex network theory to dynamically detect and resolve conflicts encountered on taxiways and runways, improve the operational efficiency of the airport surface, and ensure the safety of the aircraft. However, the simulation of the model is complex and cannot meet real-time. In 2014, Ravizza [2] studied aircraft path planning in airport surface considering time and fuel consumption, and introduced a sequence diagram-based algorithm to solve this problem. This method increases the authenticity of the model and more accurately estimates the aircraft taxi time. Finally, the purpose of reducing taxi time and reducing fuel consumption was achieved. In 2015, to solve the comprehensive optimization problem of combining runway scheduling and ground motion problems, Weiszer et al. [3] used the multi-objective optimization method. The proposed evolutionary algorithm is based on improved congestion distance, taking into account delay costs and fuel prices. Noticeably, price range uncertainties are defined by preference. In 2016, Ortega Alba [4] summarized current state-of-the-art energy use behaviors and airport trends, and analyzed major energy sources and consumers as well as the application of energy and energy efficiency measures. The airport energy indicators have been established. In 2016, Li and Lv [5,6] analyzed the monitoring data of Hongqiao Airport, and used SVM (Support Vector Machine) to classify and traject the taxiing aircraft in airport surface. The application of data mining technology to the prediction of airport surface taxiing time, taxiing hotspots, and the determination of conflict areas were studied. In 2016, Przemysław, P. [7] studied models and computer software tools for implementing dynamic taxi route selection modules, which can use conflict points to describe airport congestion. The proposed taxi route selection system is integrated with the previously developed system to enable it to be implemented in the routing module in A-SMGCS (Advanced-Surface Movement Guidance and Control System). In 2017, a study by Li and Zhang established fuel consumption and emission calculation models of single-engine taxi, tow-outs, and APU (Auxiliary Power Unit) electric taxi [8]. In this study, the authors analyzed the types of pollutants emitted by aircraft engines, introduced the calculation model of fuel consumption and emissions under the standard landing and take-off cycle (LTO) and aircraft all-engine taxi mode. The fuel consumption and emission correction model was used to correct changes in fuel consumption and emission coefficients caused by external temperature, air pressure, and humidity during the aircraft taxiing stage. Taking Shanghai Hongqiao Airport as an example, pollutant emissions of various aircraft types under different taxiing modes were calculated. The results showed that single-engine taxi and APU electric taxi can reduce HC, CO, and NOx (hydrocarbon, Carbondioxide, and nitrogen oxides) emissions during the aircraft taxiing phase. The tow-outs taxi has little effect on NOx emissions, but can significantly reduce HC and CO emissions. In 2017, Chen et al. [9] considered that the route and schedule generated by taxi time prediction may not be flexible under the uncertain factors such as changing weather conditions, operating scenarios and pilot behavior, and based on multi-objective fuzzy rules. This uncertainty is quantified based on historical aircraft taxi data. In 2018, Zhu et al. [10] used the Shanghai Hongqiao Airport scene monitoring data to study the number of different departure aircraft in the apron and taxiing system under the condition of runway capacity limitation, flight departure rate, departure taxi time, and runway utilization. A departure aircraft taxi time prediction model was established to develop a reasonable launch control strategy for the departing aircraft during the peak hour of the airport without reducing the runway efficiency; ultimately, it reduces aircraft taxiing time and reduces aircraft fuel consumption and pollutant emissions [11,12,13].
Most traditional taxi path optimization studies have been based on the shortest taxi path, or model optimization based on the shortest taxi time—assuming aircrafts have equal speed taxiing conditions [14,15,16,17]. The constructed path optimization model is simple and easy to solve. However, limitations exist in the large gap between the model and the actual taxiing situation of the aircraft. In fact, due to the presence of the turning section of the airport surface, the speed profile of the aircraft changes and the deceleration during a large turning will cause additional taxiing time. The exact class algorithm has many applications in recent path planning studies because it can fully consider various airport surface limiting factors and find the optimal solution [18,19,20,21,22]. However, there are many variables in this kind of algorithm model; the algorithm is complex, and the calculation amount is huge. It is generally difficult to obtain the global optimal solution in an acceptable time [23,24,25,26]. Therefore, this paper comprehensively considers the factors such as the taxiing distance of the aircraft, the large number of turns in the taxiing and the collision avoidance, and conducts path planning research on the aircraft that taxis in the airport surface to reduce the total taxiing time of the aircraft, save aviation fuel and reduce the amount of gaseous pollutants emitted in the taxiing stage of the aircraft. Although this method lacks robustness, it is more realistic than others. The proposed method is faster than other complex algorithms considering multiple factors, and has higher practical application value.

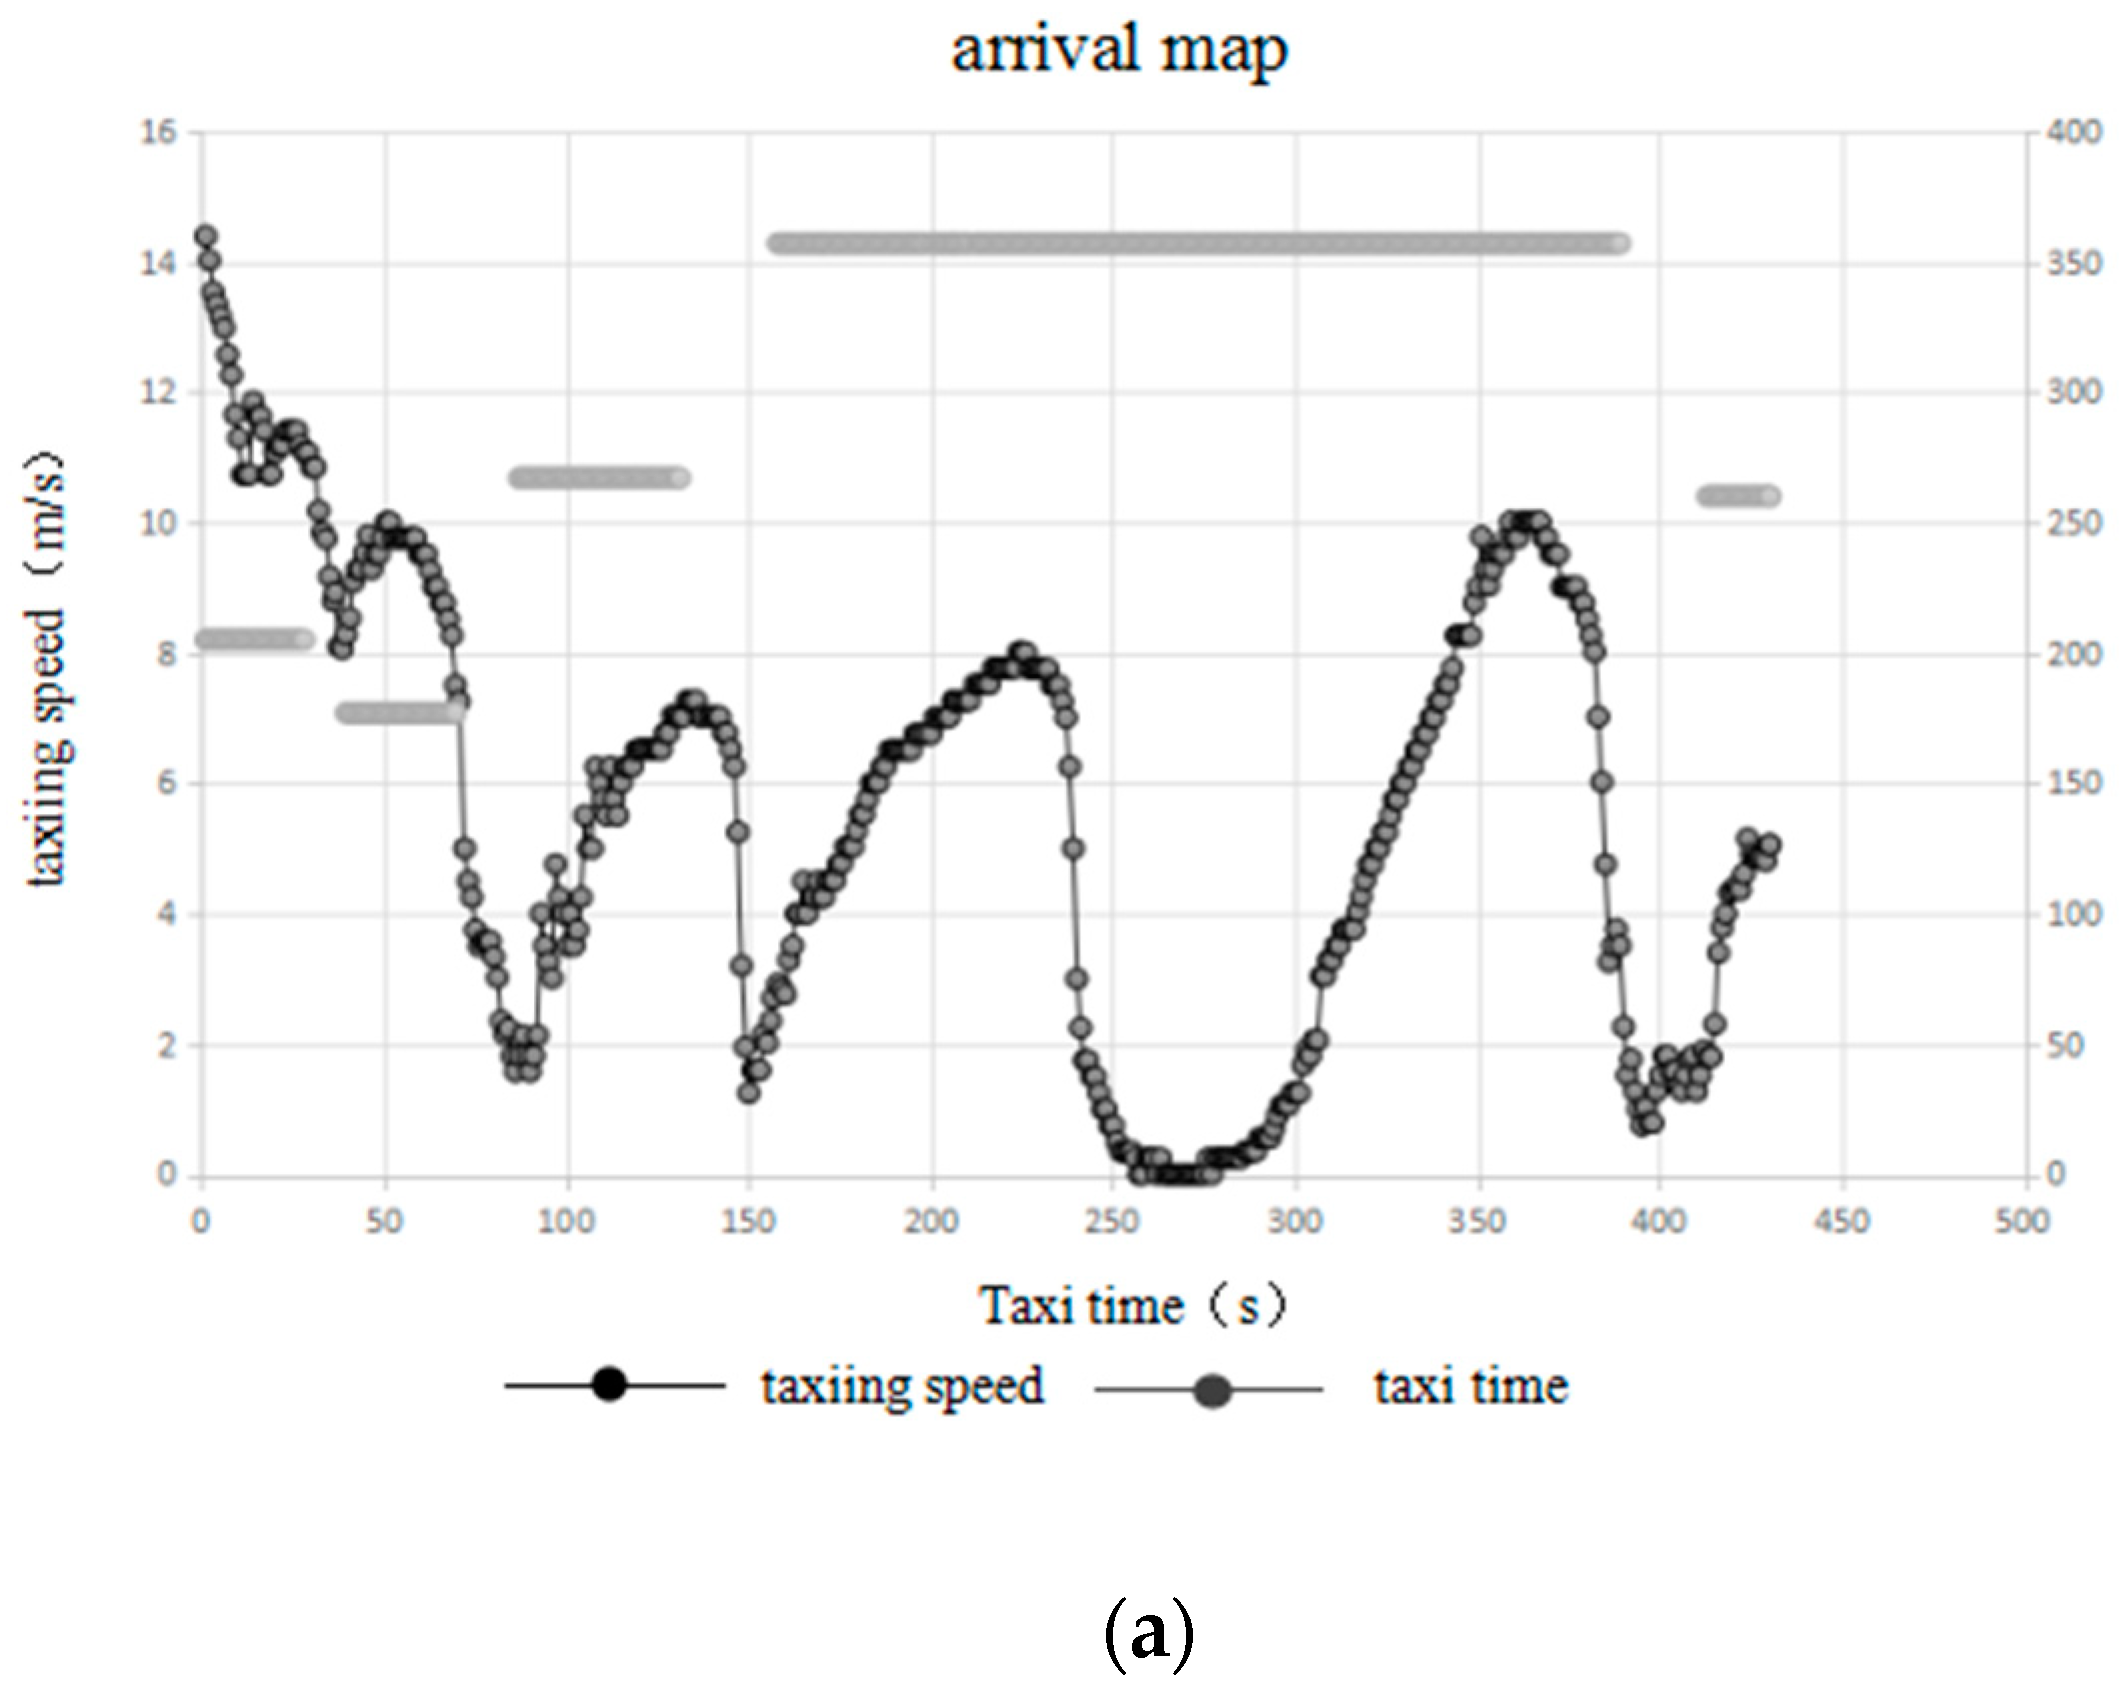
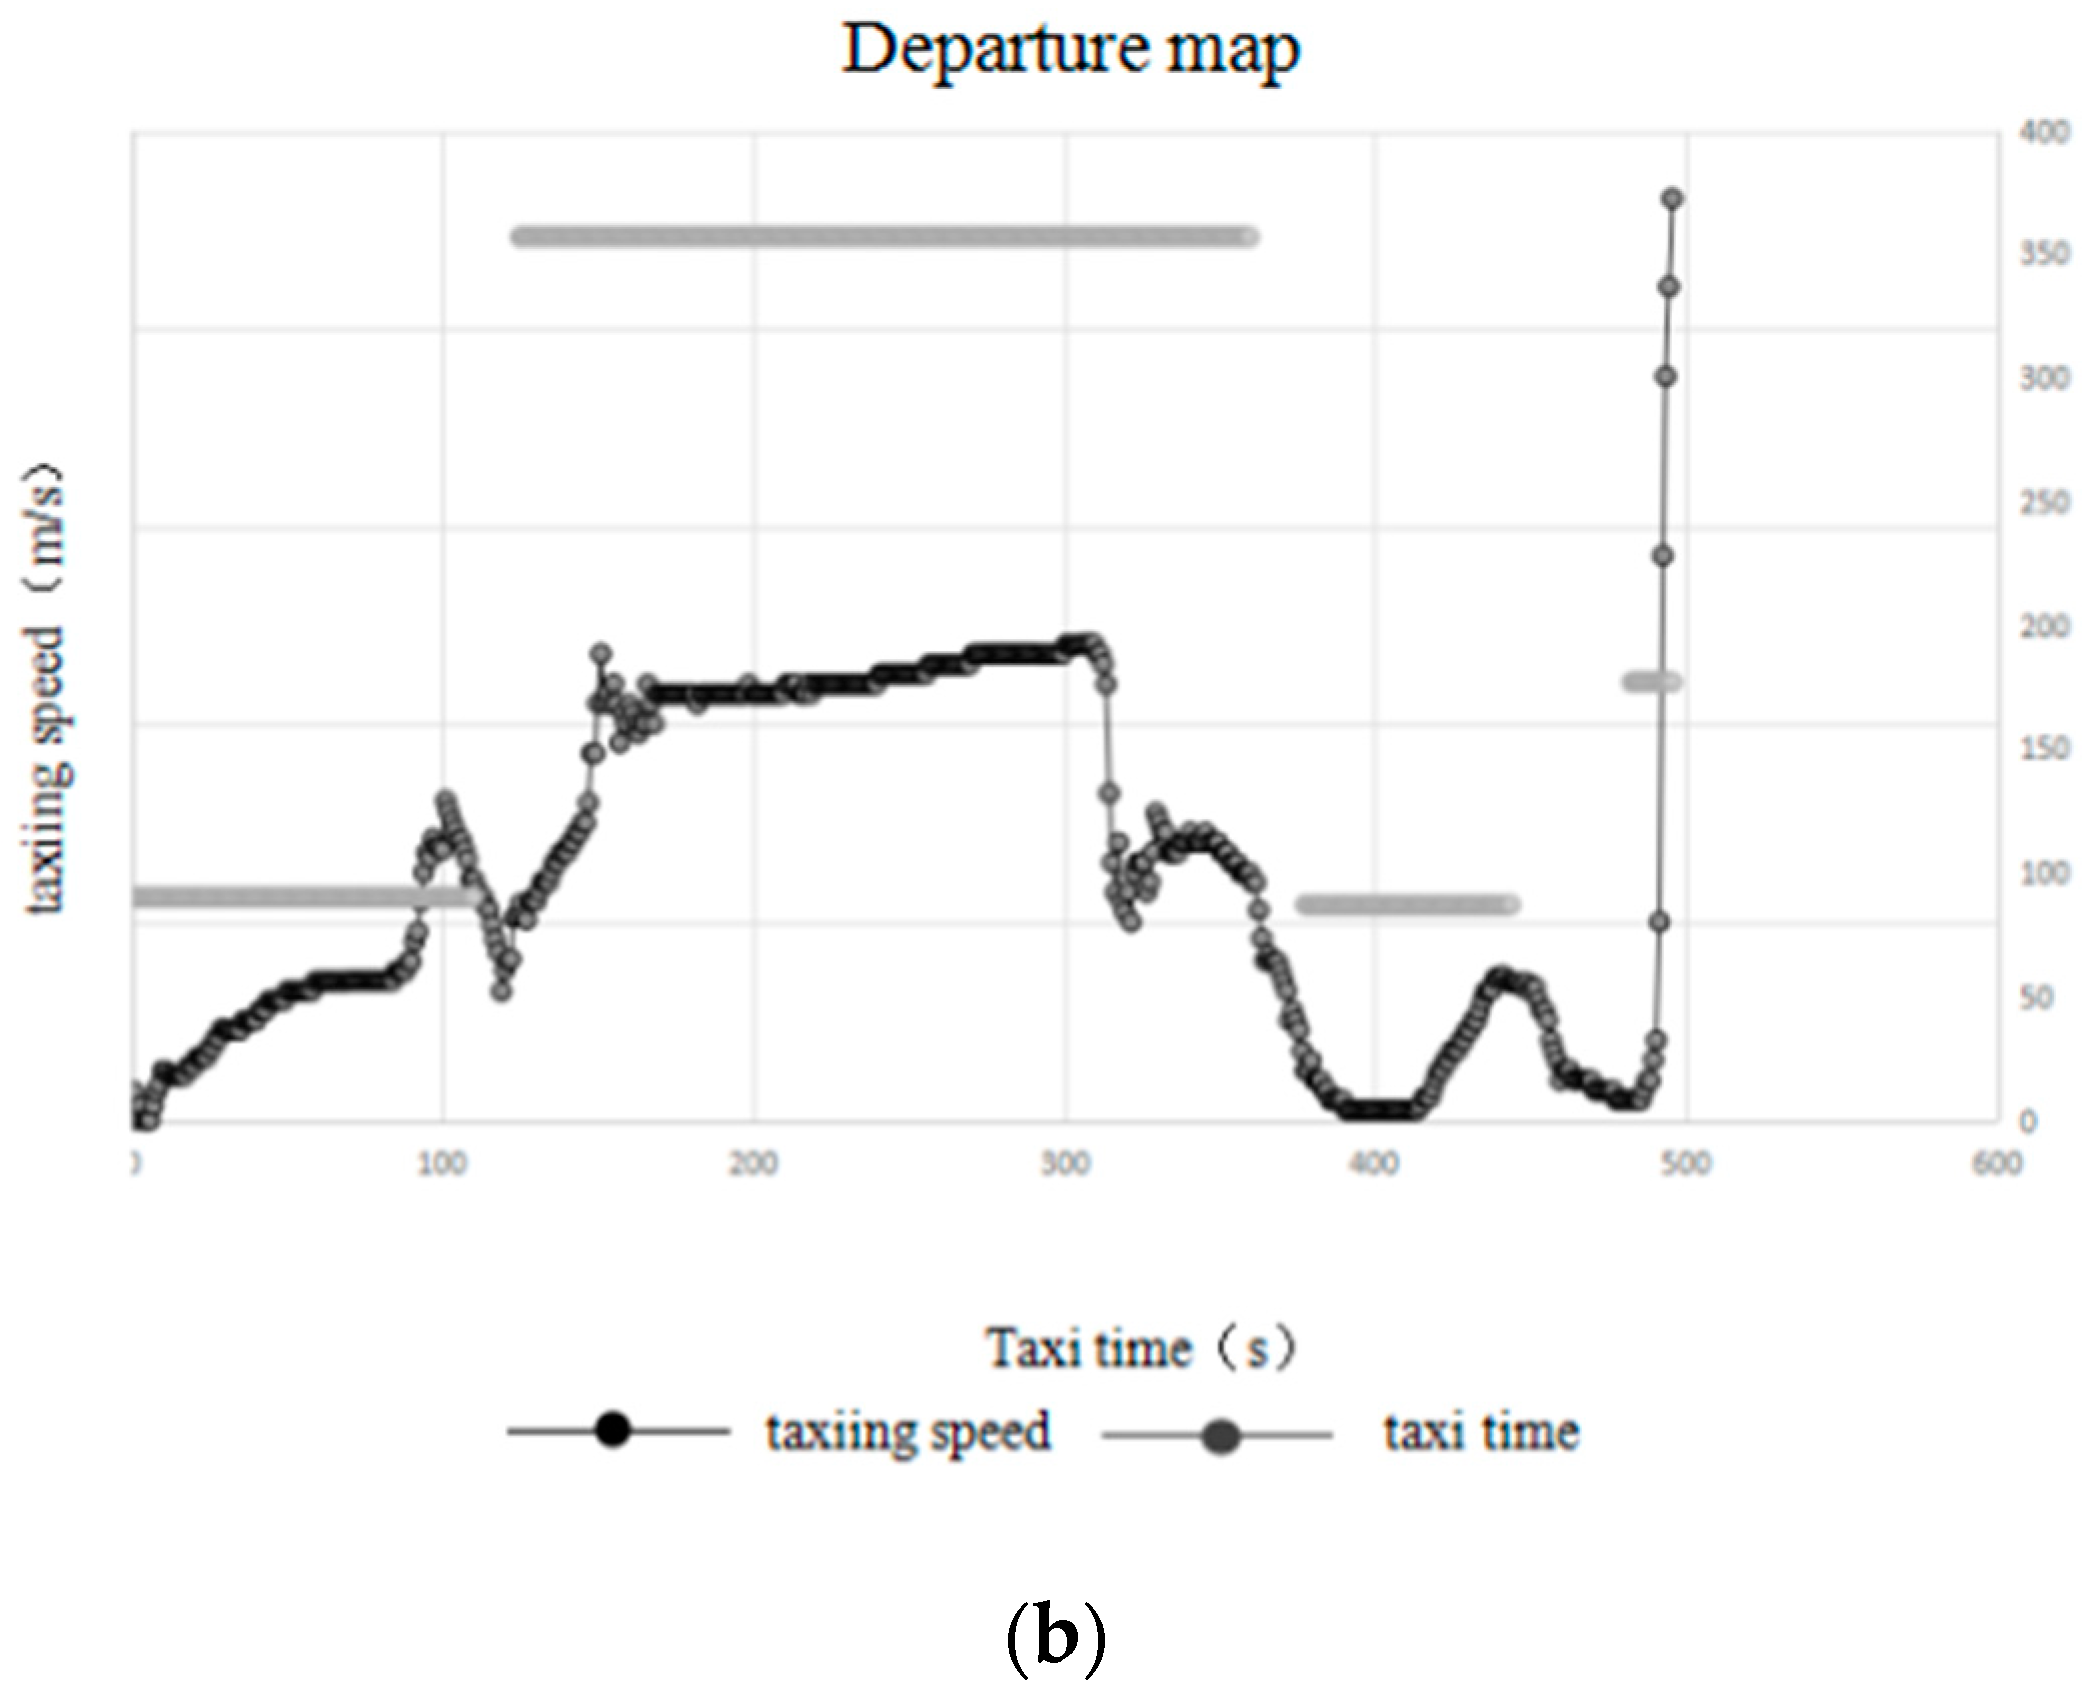
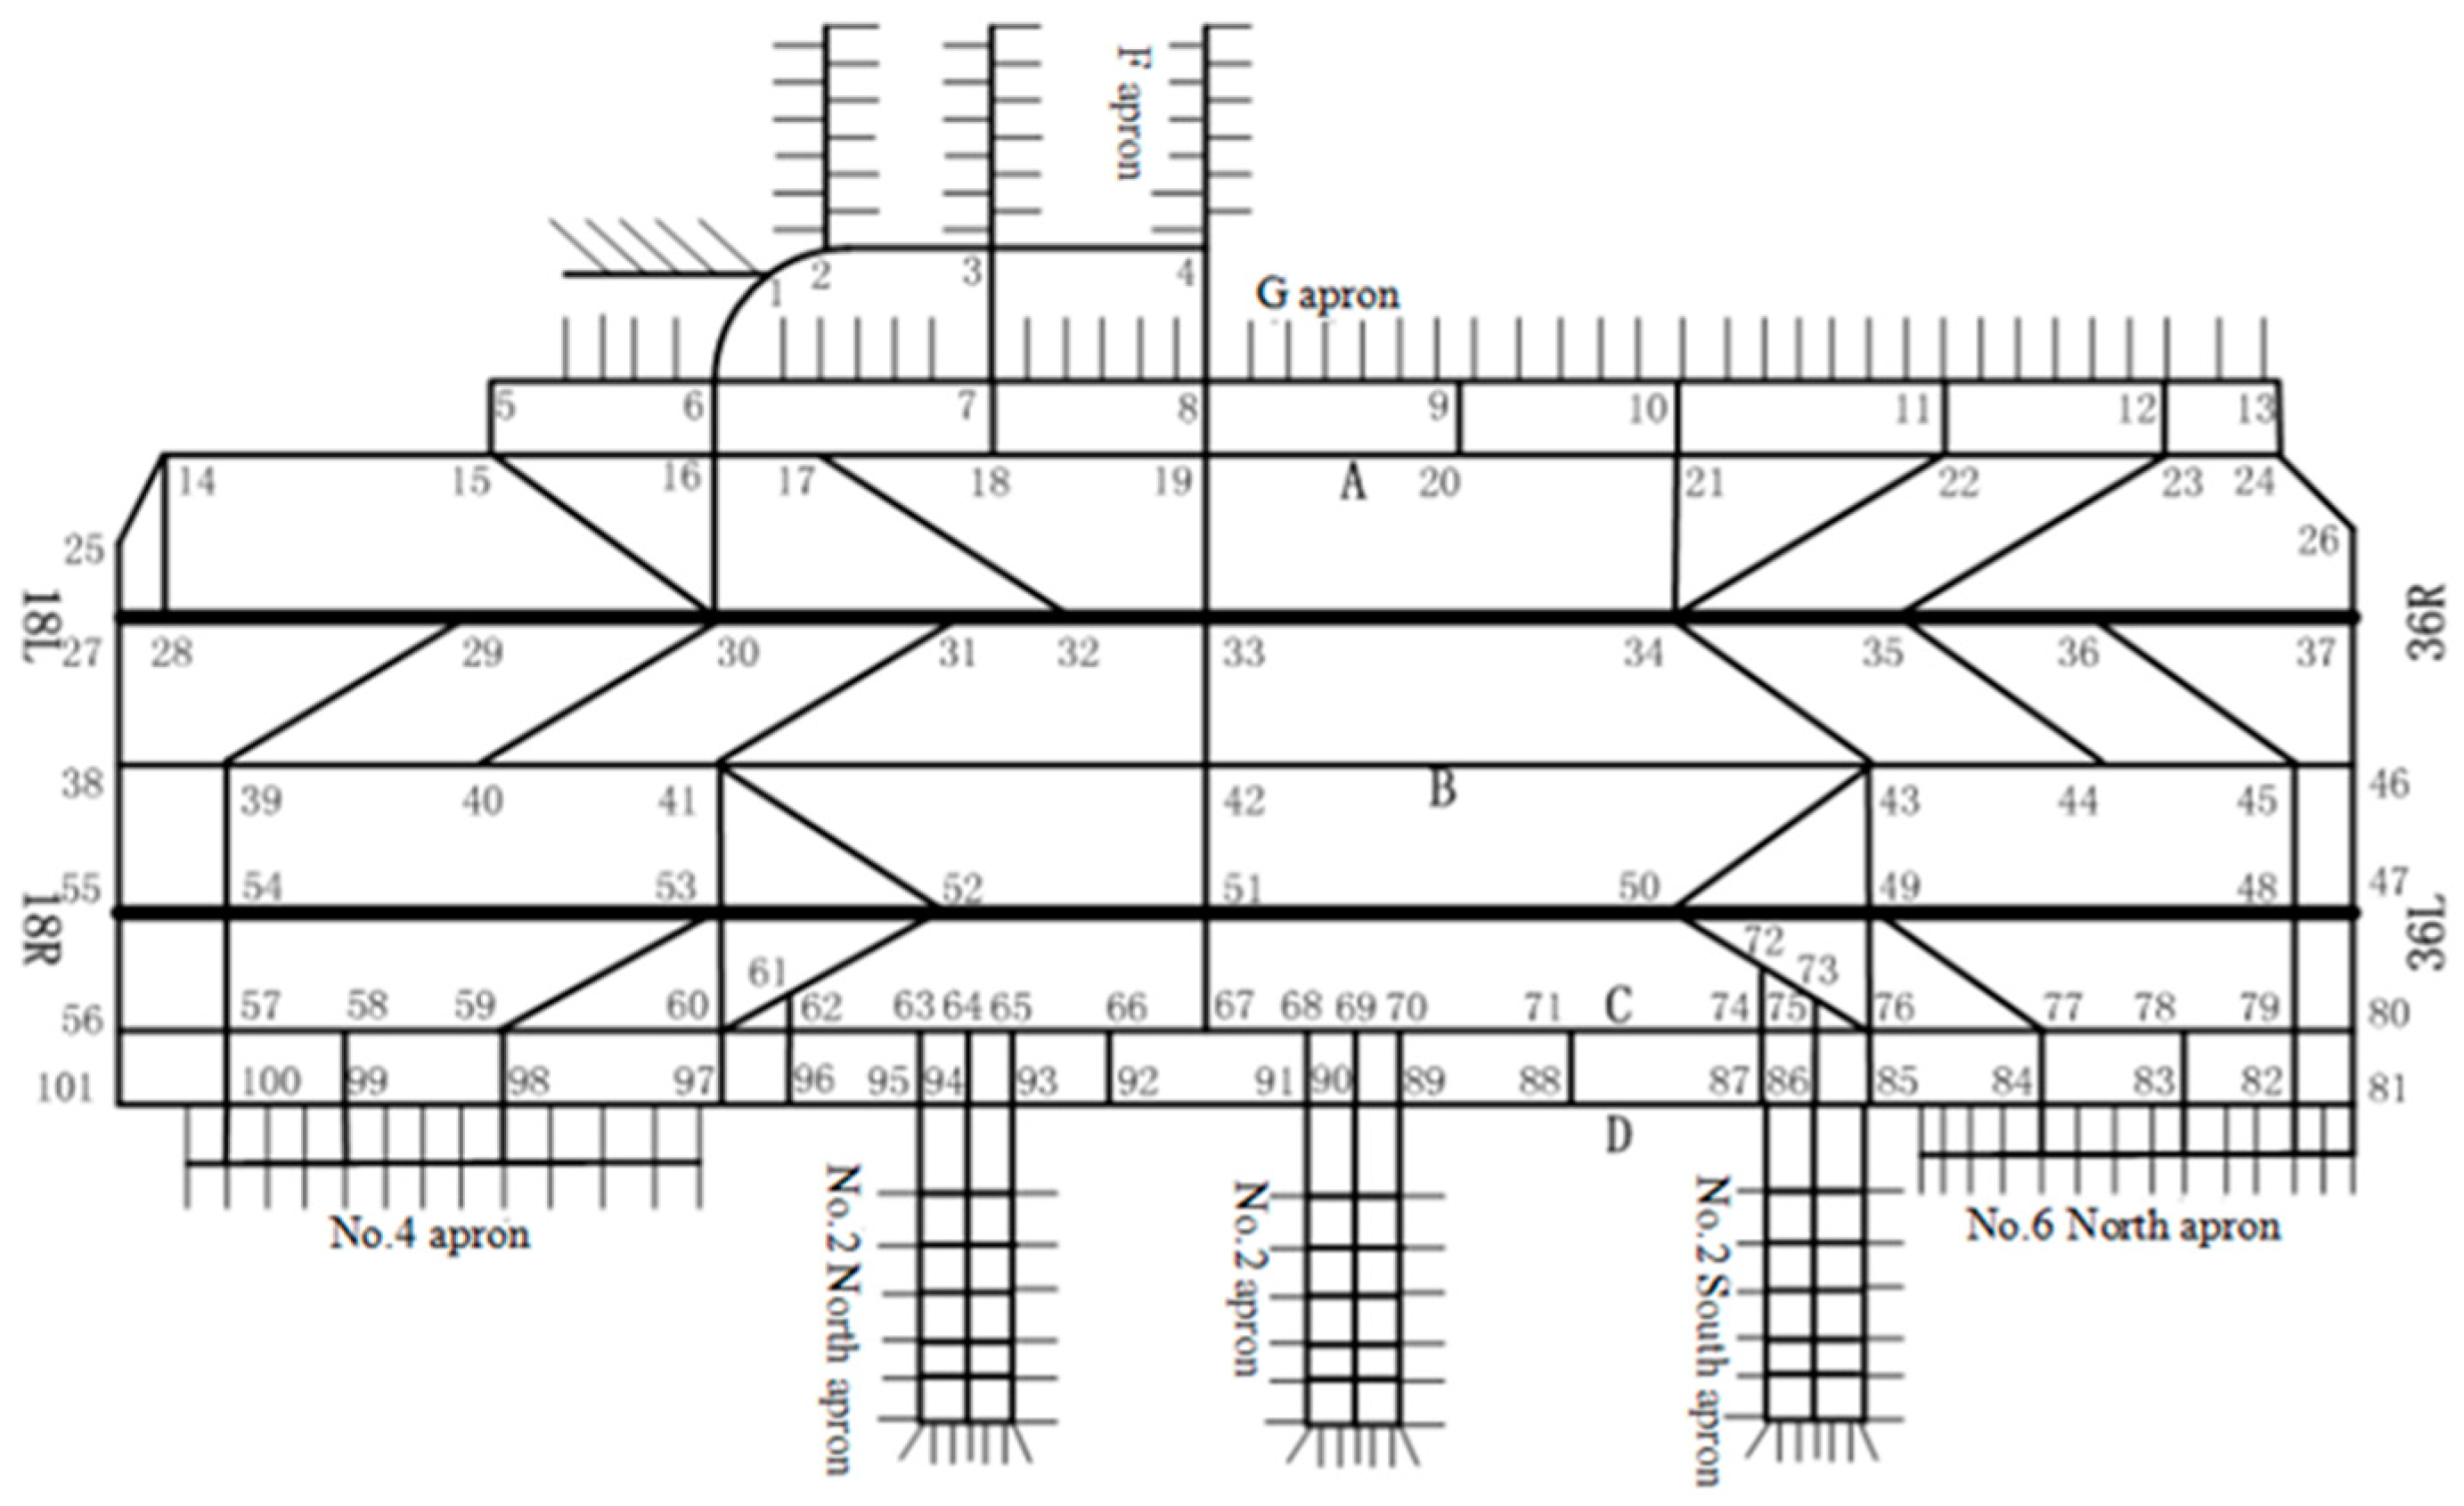
2. Analysis of Airport Surface Movement of the Aircraft

In this paper, we first analyzed taxiing aircrafts’ motion on airport surfaces, and then established the aircraft taxiway path planning model. Figure 1 shows surveillance data covering the movement status of a typical arriving and departing aircraft [5,6], which was used to analyze the motion state of an aircraft on airport surfaces.
In Figure 1a,b, the horizontal axis is the time axis. The left and right longitudinal axes measure the speed and heading, respectively (Figure 1a,b). The aircraft taxied at a relatively high speed ~10 m/s, when there was no demand for steering and effect of conflict on airport surfaces. The aircraft with flight track number 991 arrived with relatively large steering at 80 s, 150 s, and 390 s of its taxiing time, and the aircraft’s taxiing speed during the turnaround period decreased to less than 2 m/s. Around 270 s of its taxiing time, aircraft 991 stopped evacuation due to taxi conflict on the path, during which the aircraft’s speed was reduced to zero. The departure aircraft with flight track number 2091 performed relatively large steering at 120 s, 370 s, and 470 s of its taxiing time. The taxiing speed was also significantly reduced during these times. For around 400 s of its taxi time, this aircraft queued before entering the runway, where its speed decreased to zero.
Analysis of the data showed that the taxiing time of the arrival and departure aircrafts on airport surfaces was not only directly affected by the taxiing distance factor, but was also closely related to instances of large steering and collision avoidance during the taxiing process. Therefore, this paper comprehensively considers the aircraft’s taxiing distance, number of large steers during taxiing, and conflict avoidance. The study also covers path planning of aircraft taxiing in order to reduce the total aircraft taxiing time on airport surfaces, save aviation fuel, reduce gas emissions during aircraft taxiing, and improve air quality around the airport.

3. Establishing the Path Planning Model

Airport taxiway systems comprise very complicated networks. The taxiway system can be resolved into a node and edge G = (V, E) network model, when optimization is performed for aircraft taxi paths on airport surfaces. In the network model, V represents the set of nodes in the taxiway system; it consists of intersections between taxiways a intersections between taxiways and runways, parking position, runway ends, etc. E represents the set of edges connecting each node within the taxiway system, and consists of the taxiway segments between adjacent nodes in the taxiway system.

3.1. Setting Model Variables

Let P = { 1 , 2 , 3 , , r } be the set of aircrafts for the required planning. Among them, the arrival aircraft is represented by A, and the departure aircraft is represented by D, A , D P . The set R = { R 1 , R 2 , , R r } represents the airport surface taxi path for each aircraft. The taxi path R k ( 1 k r ) of any aircraft k consists of a set of ordered nodes { N 1 k , N 2 k , , N q k } . If the number of airport network model nodes V is M, then there are: q M ; N j k V , j = 1, 2, … , q; ( N j k , N j + 1 k ) E , j = 1, 2, … , q − 1.
To avoid the complications of character expressions, when the nodes “ N i ”, “ N j ”, etc. appear as subscripts of the characters, they are simplified by “i” and “j”. This replacement is only for writing format needs, and the meaning remains unaltered. The following define the variables used in the path optimization model:
x i j k = 1 : indicates that the aircraft k passes the node N i of the taxiway, and then taxis to the next neighboring node N j , otherwise x i j k = 0 ;
s i j is the length of the taxiway section between two adjacent nodes N i and N j in the taxiway system;
t j k is the moment of entering the taxiway node N j during aircraft k taxiing;
t s is the minimum safety interval between two aircrafts that successively pass through the same node;
t d is the deceleration taxi time on the landing runway after the aircraft k has landed;
y i k = 1 , indicates the taxiway node N i in the taxi path of the aircraft k, otherwise y i k = 0 ;
t i j k is the taxi time used by the aircraft k to taxi from the taxiway node N i to the next adjacent node N j ;
v k is the taxi speed when the aircraft k is taxiing on the airport surface;
t o k is the initial taxiing moment of aircraft k in the taxiway system. The node N o represents the initial taxiing point of the aircraft within the taxiway system. For the arriving aircraft, N o represents the initial point of quick vacated taxiway, for the departing aircraft, N o represents gates;
t e k is the termination taxiing time of aircraft k in the taxiway system. Node N e indicates the aircraft’s termination taxiing point in the taxiway system. For the arriving aircraft, N e denotes the parking position. For the departing aircraft, N e denotes end of the departure runway.

3.2. Building Objective Functions

The purpose of this paper is to reduce aircraft emissions during its taxi stage. The aircraft’s thrust during taxiing is described by the taxiing thrust state ( 7 % F ) [9]. Hence, aircraft emissions positively correlate with taxiing time; thus, the objective of path planning is to minimize the total taxiing time of all aircrafts on airport surfaces. The established objective function is:
min T = k = 1 r i = N 1 N M j = N 1 N M x i j k t i j k + k = 1 r n k t n
The above formula contains two items: the first item is the time it takes for the aircraft to taxi either way. Where x i j k is a decision variable defined in Section 3.1, which is 1 or 0 depending on whether the edge ( N i , N j ) is the taxi path for aircraft k, and t i j k is the time at which the aircraft k taxis from the taxiway node N i to the next adjacent node N j , and can be expressed as:
t i j k = s i j / v k
The second term is the time it takes the aircraft to make large steering at each node where a turn is needed. Where n k denotes the total number of turns aircraft k has accumulated on the taxi path, and t n denotes the time it takes for aircraft k to average each turn. The number of turns n k for aircraft k during taxiing is determined by the following formula:
n k = j = N 2 k N q 1 k n u m j k
where node N j { N 2 k , N 3 k , , N q 1 k } , n u m j k = 1 or 0. When aircraft k passes through the steering angle θ j k of node N j and reaches the preset threshold c r i , i.e., θ j k c r i , it is considered that when the aircraft passes through the node N j , a large steering is performed to make the recorded value n u m j k = 1 , otherwise, n u m j k = 0 , n k is the cumulative value of the n u m j k values of the nodes on aircraft k’s taxi path.
To solve the aircraft steering angle θ k at each node, the cosine theorem can be used for calculation. Assume that aircraft k on the airport’s surface starts taxiing at node N u , and continues taxiing through nodes N v and N w . The airport surface coordinates of the three nodes are currently ( x u , y u ) , ( x v , y v ) , and ( x w , y w ) . θ v k is used to indicate the angle by which aircraft k turns through node N v . By applying the cosine theorem, we can see that angle θ v k turns at the node N v :
θ v k = π arccos ( x w x v ) 2 + ( y w y v ) 2 + ( x v x u ) 2 + ( y v y u ) 2 ( x w x u ) 2 ( y w y u ) 2 2 ( x w x v ) 2 + ( y w y v ) 2 ( x v x u ) 2 + ( y v y u ) 2

3.3. Construction of Aircraft Taxiing Dynamic Model

For arriving aircrafts, t d indicates the time needed to decelerate and vacate from the runway after landing, enter the quick vacated taxiway, or by-pass taxiway. The moment the high-speed taxiway or the by-pass runway is entered, is the moment when taxiing begins, which is represented by the Equation (5):
t o k = E T O A k + t d
For departing aircrafts, the moment of pushback from the apron is the moment taxi begins, which is represented by the Equation (6):
t o k = E O B T k
If aircraft k’s taxi path is R k = { N 1 k , N 2 k , , N q k } , the initial taxiing point is N o = N 1 k , and the initial taxiing time is t o k , then the time R k when aircraft k taxis to any node N k j on its path t j k is:
t j k = t o k + ( N 1 k , N 2 k ) ( N j 1 k , N j k ) t i j k + n k t n
where ( N 1 k , N 2 k ) ( N j 1 k , N j k ) t i j k represents the total time spent by aircraft k from the node N 1 k taxi to node N j k accumulated on each taxi segment; n k * t n indicates the time taken by the nodes that requiring a large steer when the aircraft k is taxied from node N 1 k to node N j k ; n k * indicates the number of accumulated steers by aircraft k from N 1 k taxi to N j k ; t n indicates the time taken by each aircraft k for steering. n k * can refer to Equation (3), which is represented by the Equation (8):
n k = j = N 2 k N j 1 k n u m j k
The moment when any aircraft taxis to any node N j k , on path R k can be obtained by Equation (7). Having determined the aircraft’s taxiing time through each node, we can use the taxiway network system nodes as the object of operation to construct the constraint function, and add constraints to the path planning model in Section 3.2 to avoid the problem of taxi conflict in the path planned by the model.

3.4. Building Constraint Functions

Aircraft taxi collision on airport surfaces can be divided into three types: intersection conflict, head-on conflict, and tail conflict. During aircraft taxiing, in order to prevent the front plane’s engine vortex from affecting the rear plane, both aircrafts must meet the requirements of vortex separation. Table 1 shows the vortex separation standards.
During the aircraft’s taxi path planning, to avoid taxi conflicts and meet the vortex separation requirements, constraints must be placed on the objective function to ensure the safety and feasibility of the planned taxi path.
The distance parameter is inconvenient when the taxiway network node is the operating object for the path planning model constraint. Therefore, vortex separation standards in Table 1, given in the form of distance, must be converted into the time separation between aircraft. According to relevant regulations by the Civil Aviation Administration, the maximum speed of an aircraft during its taxi on airport surfaces should not exceed 50 km/h (13.8 m/s). According to the data analyzed in Section 1, the linear taxiing speed of aircrafts on airport surfaces was conservatively taken as 10 m/s. The vortex separation t s in the form of time is as shown in Table 2.

3.4.1. Intersection Conflict and Vortex Separation Constraints

Intersection conflicts occur when two aircraft cross over the same taxiway network node, with/without meeting safety separations. The intersection conflict and vortex separation problems can be constrained at the same time. This is achieved by controlling the time separation t of two consecutive aircrafts k1 and k2, passing through the same taxiway network node t s . Intersection conflict between aircrafts can be prevented and the vortex separation requirement can be met. The constraints are:
t j k 2 t j k 1 t s
In the formula: k 1 , k 2 P , k 1 k 2 , N j R k 1 R k 2 . Among them, t j k 1 ,   t j k 2 can be obtained by Equation (7).

3.4.2. Head-on Conflict Constraint

Head-on collision is the confrontation between two opposing aircrafts occupying the same taxiing path, in the taxiway network at the same time. The head-on conflict caused by two aircrafts is more difficult to resolve. This type of conflict should be avoided as much as possible. Therefore, the two opposing aircrafts k1 and k2 should satisfy the following formula:
( x i j k 1 t i k 1 x j i k 2 t i k 2 ) ( x i j k 1 t j k 1 x j i k 2 t j k 2 ) > 0
In the formula: k 1 , k 2 P , k 1 k 2 , ( N i , N j ) R k 1 , ( N j , N i ) R k 2 . Equation (10) indicates that if aircraft k1 passes the taxiing path ( N i , N j ) , and aircraft k2 passes the taxiing path ( N j , N i ) , then aircraft k1 must first pass through both nodes N i and N j ; otherwise, if aircraft k2 passes first through node N j , then it must also pass first through node N i .

3.4.3. Tail Conflict

Tail conflict refers to two aircraft traveling in the same direction, while occupying the same taxi path, in the taxiway network at the same time. These aircrafts thus surpass the phenomenon caused by the rear and front planes catching up, or the problem of small safety separations. Two aircrafts k1 and k2, traveling in the same direction, should satisfy the following formula:
( x i j k 1 t i k 1 x i j k 2 t i k 2 ) ( x i j k 1 t j k 1 x i j k 2 t j k 2 ) > 0
In the formula: k 1 , k 2 P , k 1 k 2 , ( N i , N j ) R k 1 , ( N j , N i ) R k 2 . Equation (11) shows that if both aircrafts pass through taxiway ( N i , N j ) , then the aircraft passing first through node N i , must also pass first through node N j .

4. Solving the Path Planning Model

The airport surface taxi path planning model for aircrafts, established in this paper, has many complex variables and formulas, with some nonlinear equations. The traditional algorithm is difficult to solve. Genetic algorithms have high searchability and strong robustness, and are widely applied to path planning problems such as highway traffic and drones [14,15]. Genetic algorithms are based on populations and not single-point searches, and can generate multiple extreme values from different points at the same time. Obtaining a local optimal solution of the path planning model is not easy; therefore, the genetic algorithm was used to solve it.

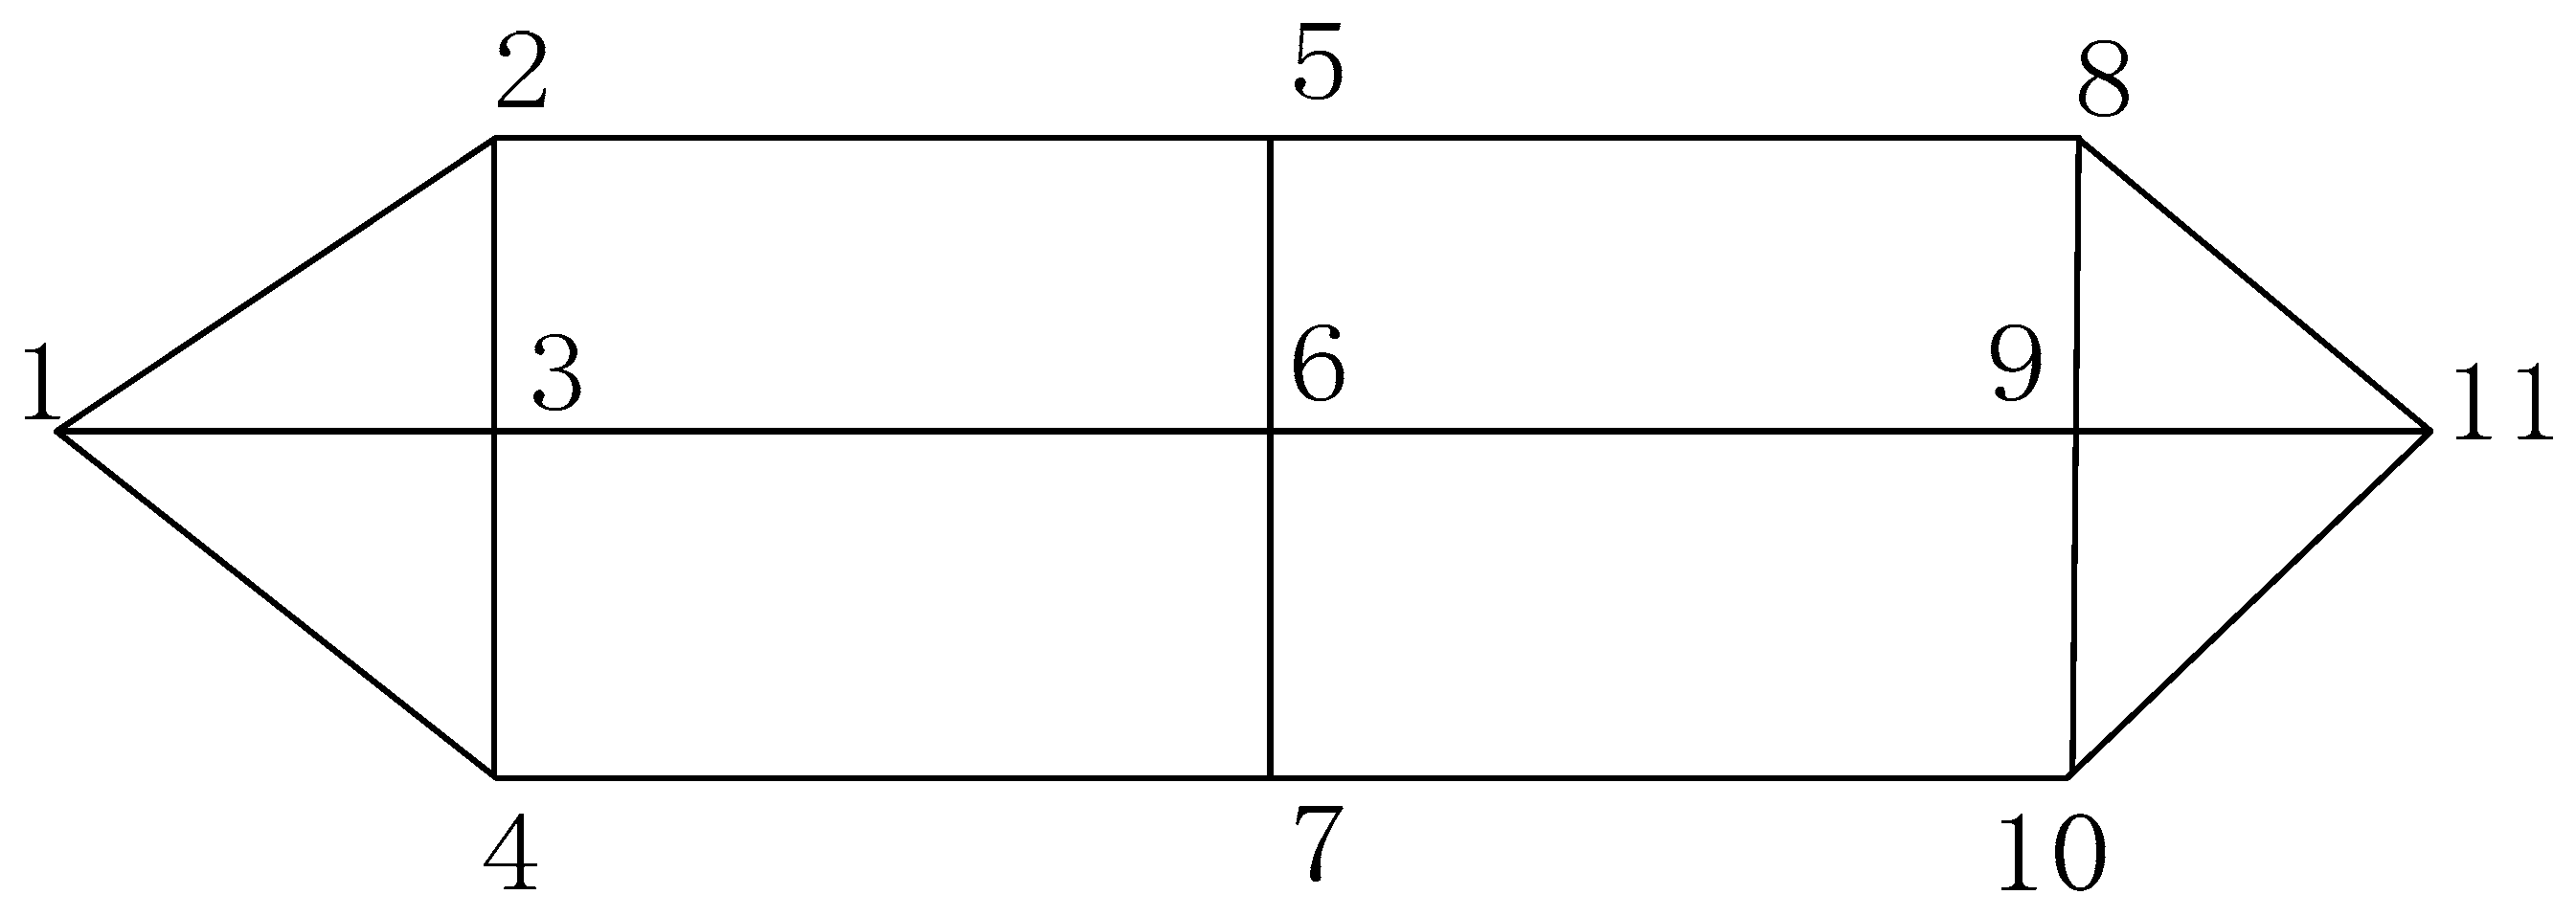
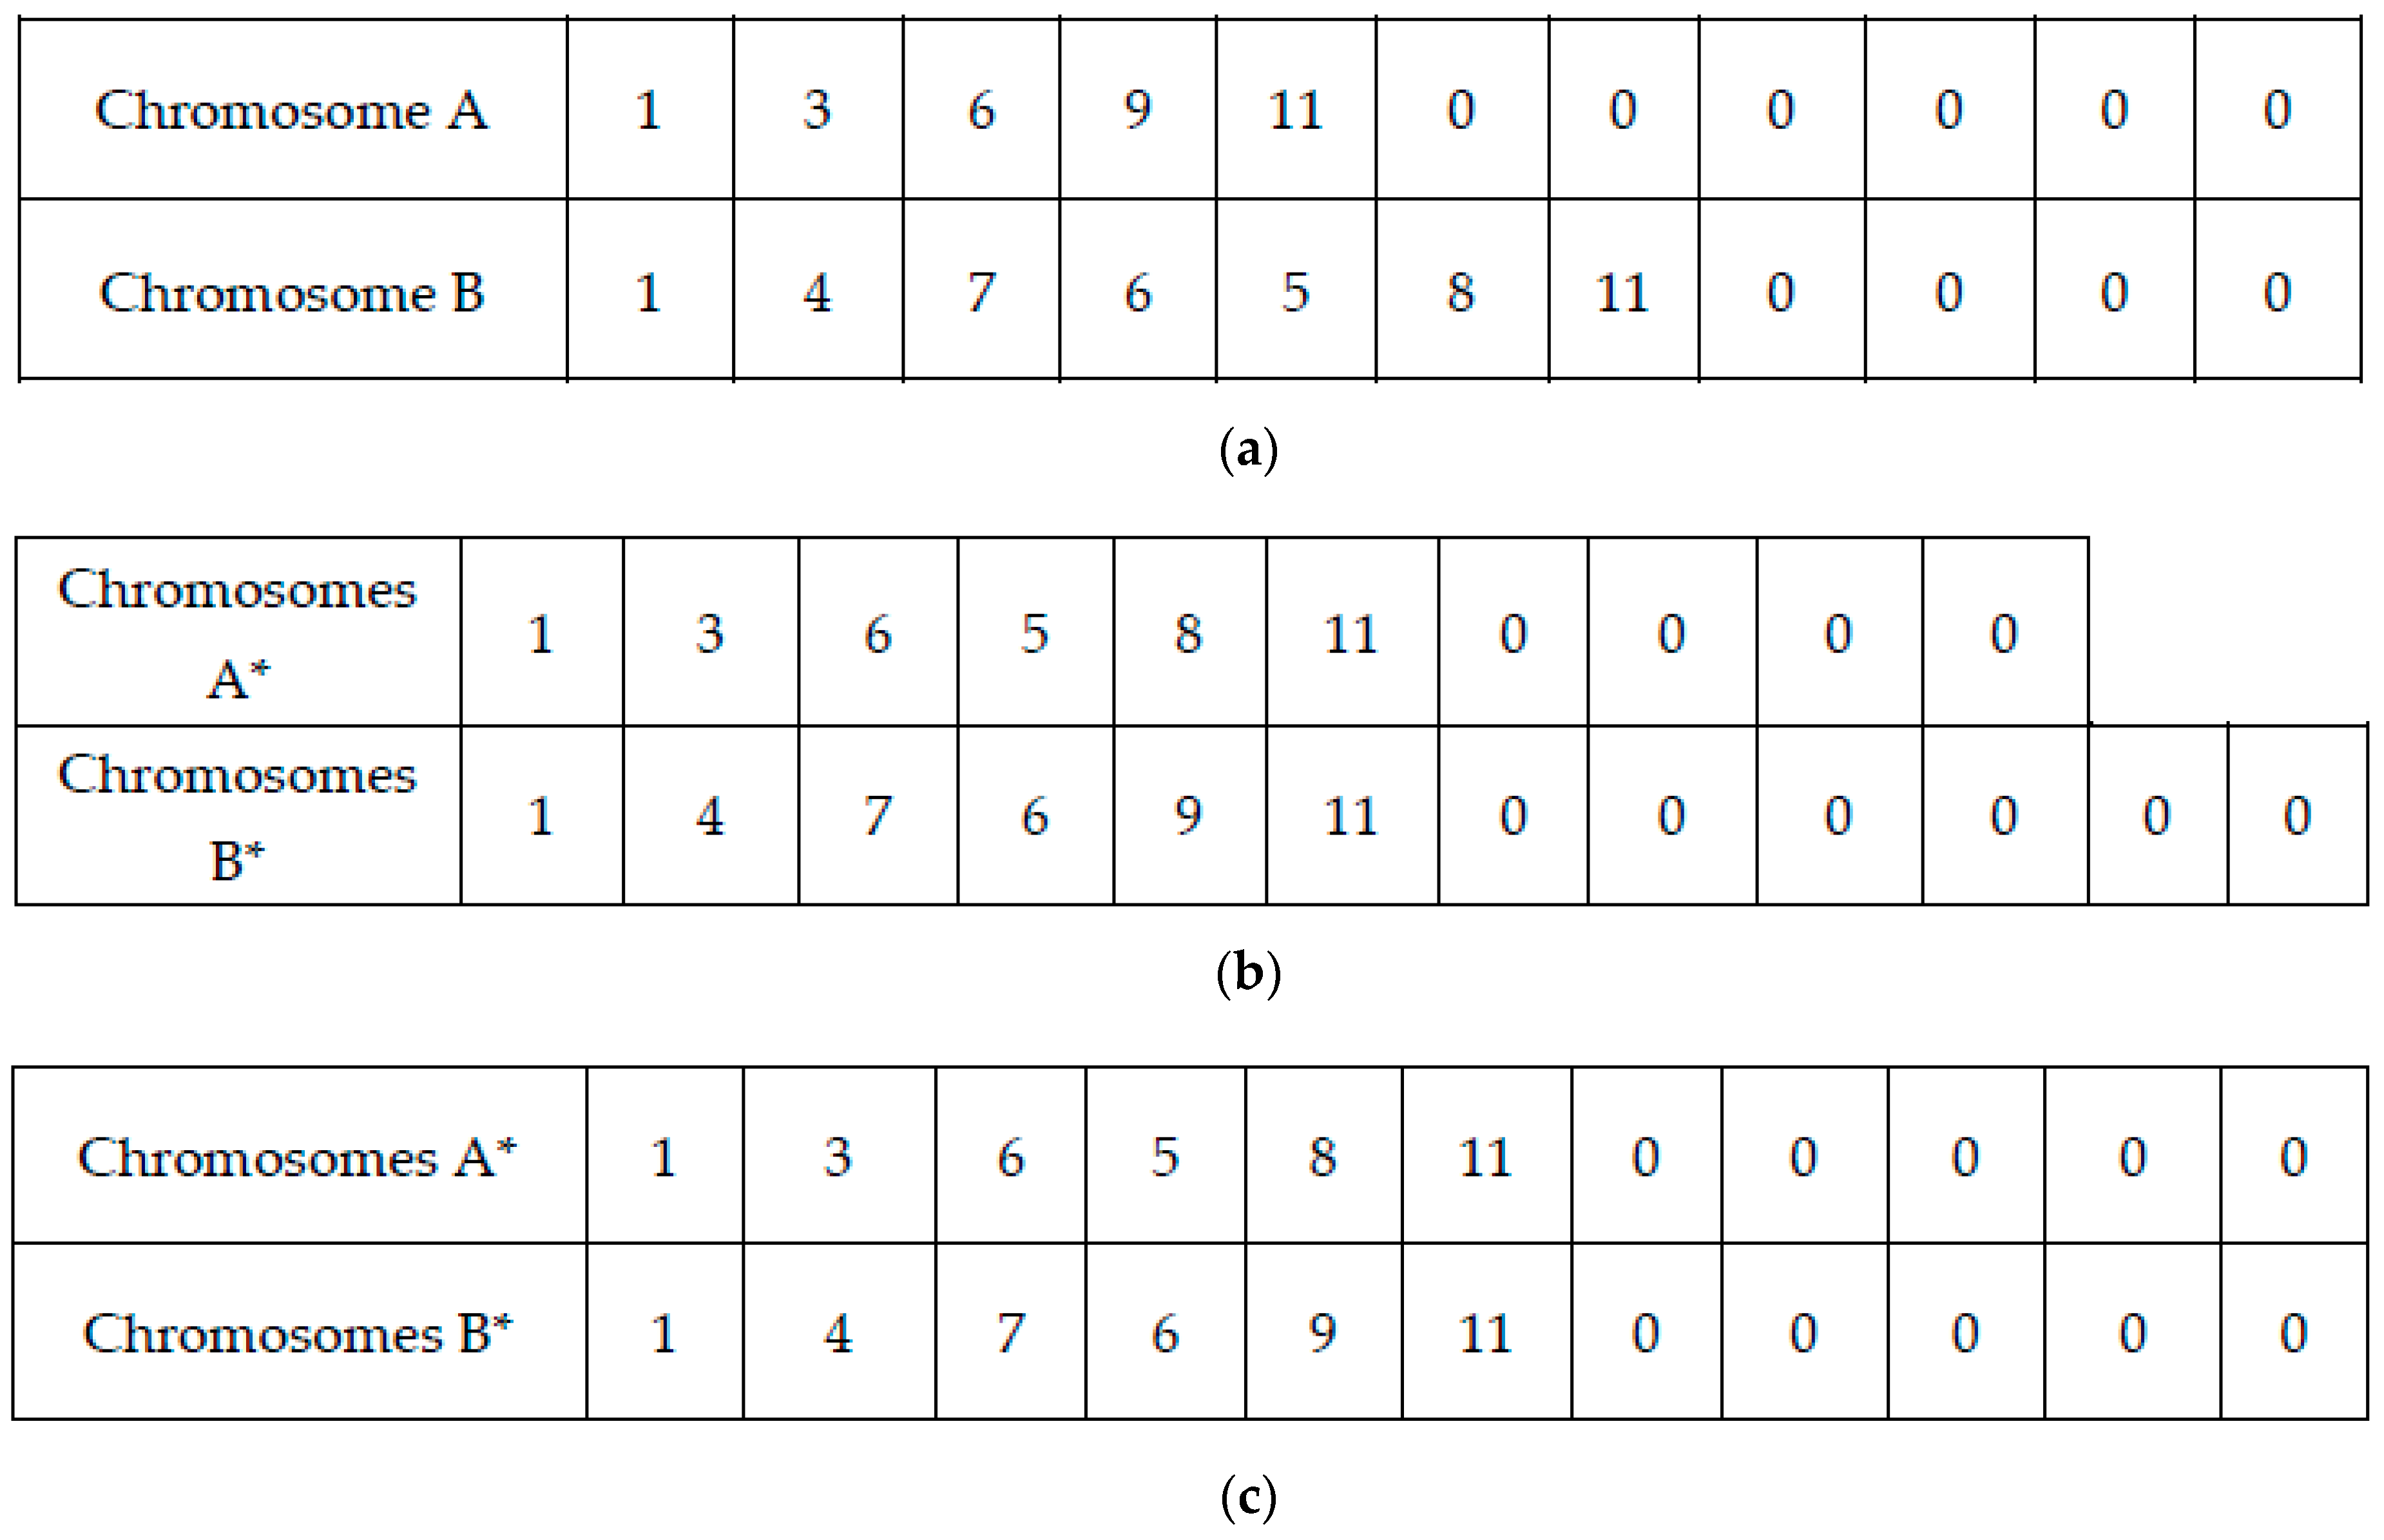
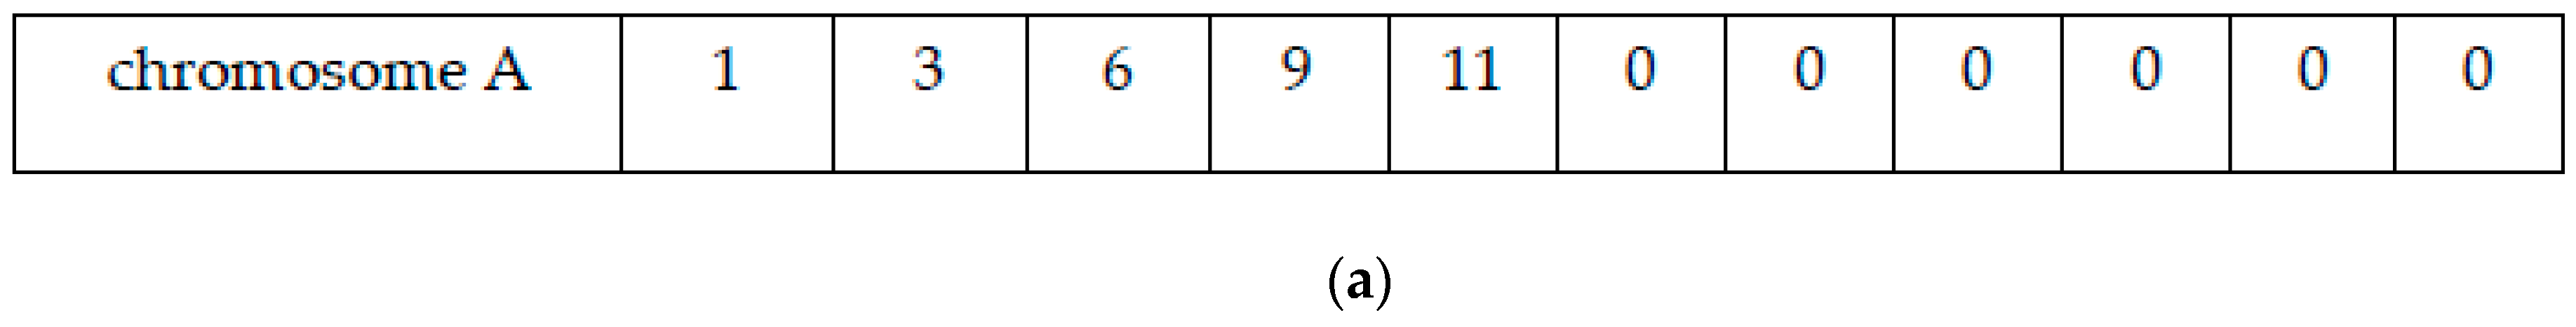
4.1. Chromosome Coding and Initial Population Generation

When genetic algorithms are used to solve the taxi path planning model, chromosome encoding is firstly required. Genetic algorithms generally have binary encoding, floating-point encoding, symbol encoding, and other encoding methods. Based on the specific requirements of this model, floating-point encoding was used (real value encoding method).
Figure 2 is a simplified illustration of a taxiway network, and an example illustrating chromosome encoding. First, the nodes in the taxiway system were given real values such as 1, 2, 3, …, 10, 11, etc. The order of these real values indicated the genetic sequence of a chromosome, and also corresponded to the representation of an aircraft’s taxi path on airport surfaces.
If the length of the chromosome is set to 10, and the aircraft taxis from node “1” to node “11”, then chromosome A shown in Figure 3 is an effective chromosome, and chromosome A indicates that the aircraft’s taxi path is 1 4 7 10 11 , less than 10 bits are filled with “0” in the back.
Iterative optimization of genetic algorithms is not based on a single chromosome, it is based on the population of multiple chromosomes. This paper used computer-generated random generation methods to form the initial population. First, sequence numbers of all nodes in the taxiway system were randomized; then, the illegal chromosomal sequences formed in the random sorting were eliminated. That is, the chromosomal sequences that were subject to taxiing path jumps were eliminated, and a certain number of initial feasible solutions were generated.

4.2. Selecting the Operation and Fitness Function

In this paper, the roulette method was used to select the operator performing chromosome selections. This method generates the individual population according to the fitness value as the selected variable, where individuals with large fitness values have a high probability of being selected. However, this does not only select individuals with large fitness values, as this would generate a unitary population and limit the algorithm’s rapid convergence to the local optimal solution.
The fitness function is a measure to evaluate an individual’s fitness value. The evaluation function that was established in this paper, did not only require chromosome encoding fitness values of the aircraft with a smaller taxiing time, but also effectively eliminated chromosome coding in those aircrafts with taxiing conflicts. According to the above requirements, the fitness function z was constructed as follows.
Construct an equivalent taxi time function z first:
z = k = 1 r i = N 1 N M j = N 1 N M x i j k t i j k + k = 1 r n k t n + M max [ ( t j k 2 t j k 1 ) , 0 ] + M max [ ( x i j k 1 t i k 1 x j i k 2 t i k 2 ) ( x i j k 1 t j k 1 x j i k 2 t j k 2 ) , 0 ] + M max [ ( x i j k 1 t i k 1 x i j k 2 t i k 2 ) ( x i j k 1 t j k 1 x i j k 2 t j k 2 ) , 0 ]
where M is the penalty coefficient, which is a value much larger than the normal taxiing time T = k = 1 r i = N 1 N M j = N 1 N M x i j k t i j k + k = 1 r n k t n . The calculation result z of Equation (12) is the total aircraft taxiing time of airport surface taxiing; if intersection conflicts, head-on conflicts, or tail conflicts existed in the taxi paths represented by this population of chromosomes, a very large z-value would be obtained due to the penalty coefficient M.
Let the fitness function be: f i = 1 / z i , so that the fitness value of chromosome i is obtained, and the larger the taxiing time, the smaller the fitness value of a population of chromosomes. According to the proportion of fitness values, the distribution probability of each chromosome population was selected. The formula is:
p i = f i / f i
This type of equation shows that the probability of a highly-adapted genome is selected. If the population is N, then randomly selected N times will form the next generation of new populations.

4.3. Crossover Operations

Commonly-used crossover operators include single-point, two-point, and multi-point crossings. Chromosomes in this article represent the taxi path of an aircraft on the airport’s surface. Chromosome order represents the order of nodes passing through the aircraft’s taxi path. To ensure that cross-replicated chromosomes still have practical significance, this paper used a special single-point crossover operator. The crossover steps are as follows:
Randomly select a pair of chromosomes from the population as the chromosomes to be crossed with a certain crossover probability p c (generally a large probability).
Compare two chromosomal genes to investigate the possibility of identifying identical taxiing node genes in the two chromosomes, except for the start node and termination node. If there are no identical taxiing node genes, then select a pair of new chromosomes and compare them. However, if the same taxiing node gene exists, one of the same taxiing nodes is randomly selected first, and the gene sequence behind this node is exchanged.
This article uses the same chromosome taxiing node rather than the same length node as the allele, thus the length of the two chromosomes after the crossover may not be equal. After the crossover, if the progeny chromosome has more digits than the parent chromosome, the extra “0” is removed from the end of the progeny chromosome; if the progeny chromosome has fewer cipher digits than the parent, the progeny chromosome occupies the “0” at the end.
This allowed us to detect whether there were repeated taxiing nodes before and after the newly generated chromosome pair cross points. If no repeated node were detected, then it must be an effective chromosome, and the crossover operation ends. If a repeating node exists, then the aircraft would repeat the round-trip taxiing on the taxiing path, indicating that the progeny chromosome generated by the crossover operation had no practical meaning, the crossover operation is invalid, and the “1” operation is performed again.
Still referring to the simplified taxiway network in Figure 2, the two chromosomes A and B were randomly selected, as shown in Figure 4a, except that the starting and terminating nodes had the same taxiing node “6”. Then the gene sequence was exchanged after node “6”, thus changing A and B into two new taxi paths, A* and B*, as shown in Figure 4b. Then, “1” and “0” bits were added at the end of the new individual A* and B*, respectively, as shown in Figure 4c. The two chromosomes had no identical nodes before and after node “6”, thus this crossover operation was effective. Chromosomes A* and B* reserve the basic characteristics of their parent chromosomes; however, they are new individuals representing the new taxiing path.

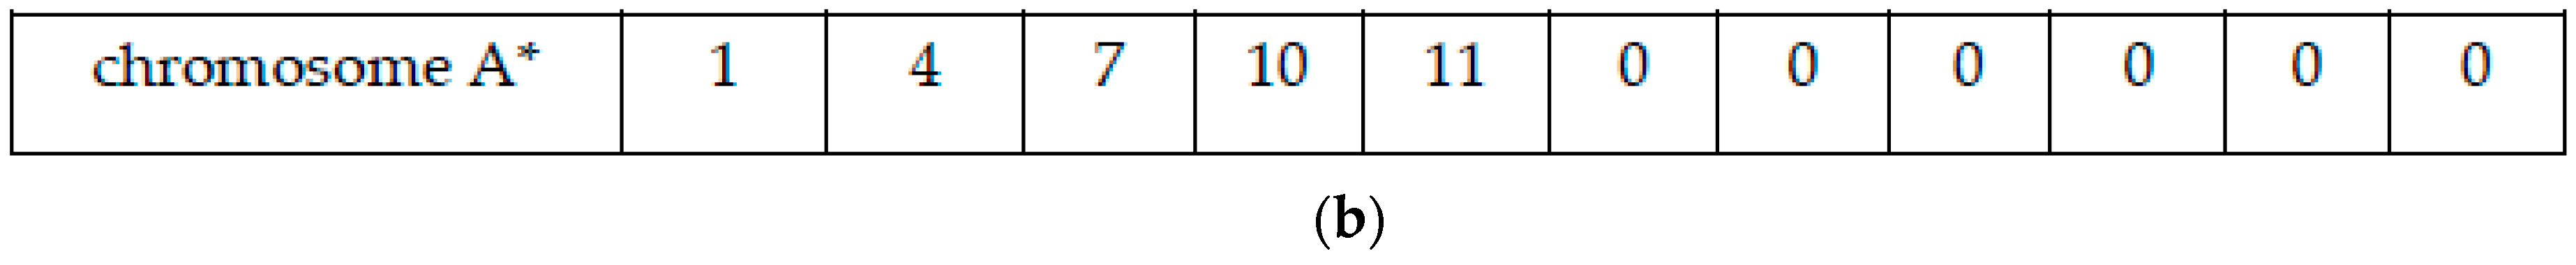
4.4. Mutation Operation

After population cross-selection, in order to improve the local algorithm’s searchability and maintain the population’s diversity, it was necessary to perform chromosome mutation operations on the population. Common mutation operators included single-point and multi-point mutations. In this model, chromosome sequences represent the aircraft’s taxiing path; therefore, their ordering sequence characterized the sequence of the nodes passing through the taxiing path. The traditional mutation method changes single or several nodes within a chromosome, which cannot improve the local algorithm’s searchability and maintain the population’s diversity. It also destroys the generated taxi path and affects population convergence.
Therefore, in the solution of this model, the mutation operation selects chromosomes for mutation from the population based on the mutation probability p m (generally less), and then replaces it with a randomly generated reasonable taxi path as a new chromosome (Figure 5). This can also be understood as a multi-point variation in the broad sense, although the new chromosome produced by this variation method is quite different from the original chromosome, it can supplement new gene sequences, effectively avoiding the loss of certain genes due to the selection of crossover operations and maintaining the population diversity.

5. Emulation Experiment

5.1. Data Description

In this article, we used the Shanghai Hongqiao Airport as an example for simulation analysis. Figure 6 shows the network diagram of the taxiway at Hongqiao Airport. The airport is a two-runway airport, 18R/36L is mainly used for departure. It is 3300 m in length and 60 m in width. For arrivals, 18L/36R was used. It is 3400 m in length and 45 m in width. The airport has four main taxiways parallel to the runways A, B, C, and D. It also includes quick-vacate taxiways, by-pass taxiways, and apron taxiways.
According to the airport surveillance radar data at Hongqiao Airport, the 1 h traffic during peak hours includes 40–50 aircrafts. We took 20 real flight sequences within 30 min of a busy period to record monitoring data as an example; thereby, aircraft taxiway planning analysis was performed. Due to wind direction, the 18R and 18L runways were used for departure and arrival, respectively. The starting and ending moments of the flights are shown in Table 3.

5.2. Parameter Settings

During path planning, the initial taxiing time t o k of each aircraft k in the taxiway system remained unchanged at the starting time (Table 3); according to the relevant regulations of the Civil Aviation Administration and the airport operational data analysis, the linear taxi speed of the aircraft was set to 10 m/s. Since the data did not have aircraft type items, assuming that flights in Table 3 were all medium aircraft, then the vortex separation was t s = 20 s .
High-speed taxiways vacating and runway angles are 25° to 45°, typically 30°. When the aircraft turns to a high-speed vacate taxiway, taxiing speed is high; therefore, it is not considered as large steering, and a large steering critical angle c r i = 45 was set. For the Airbus A320, for example, it takes 30–60 s to achieve 90° steering during taxiing. Therefore, it is assumed that the time taken by an aircraft to make a large steer is t n = 30 s .
Departure flights still originate from their respective original aprons in Table 3, and terminate at the 18R runway end; the flight’s arrival begins at the original high-speed vacate taxiway of the 18L runway, and ends at the original apron in Table 3. Without changing the above conditions, only taxiing path optimization for each aircraft on the airport surface is now performed.
The genetic algorithm was used to solve the established taxi path optimization model. Eight feasible taxiing paths were randomly generated for each aircraft, and the aircraft taxiing paths were randomly combined. The initial population number was set to 100, the crossover and mutation probabilities were set to Pc = 0.6 and Pm = 0.1, respectively, and the number of iterations was 100 generations. We then used the MATLAB7.9.0 software for programming.

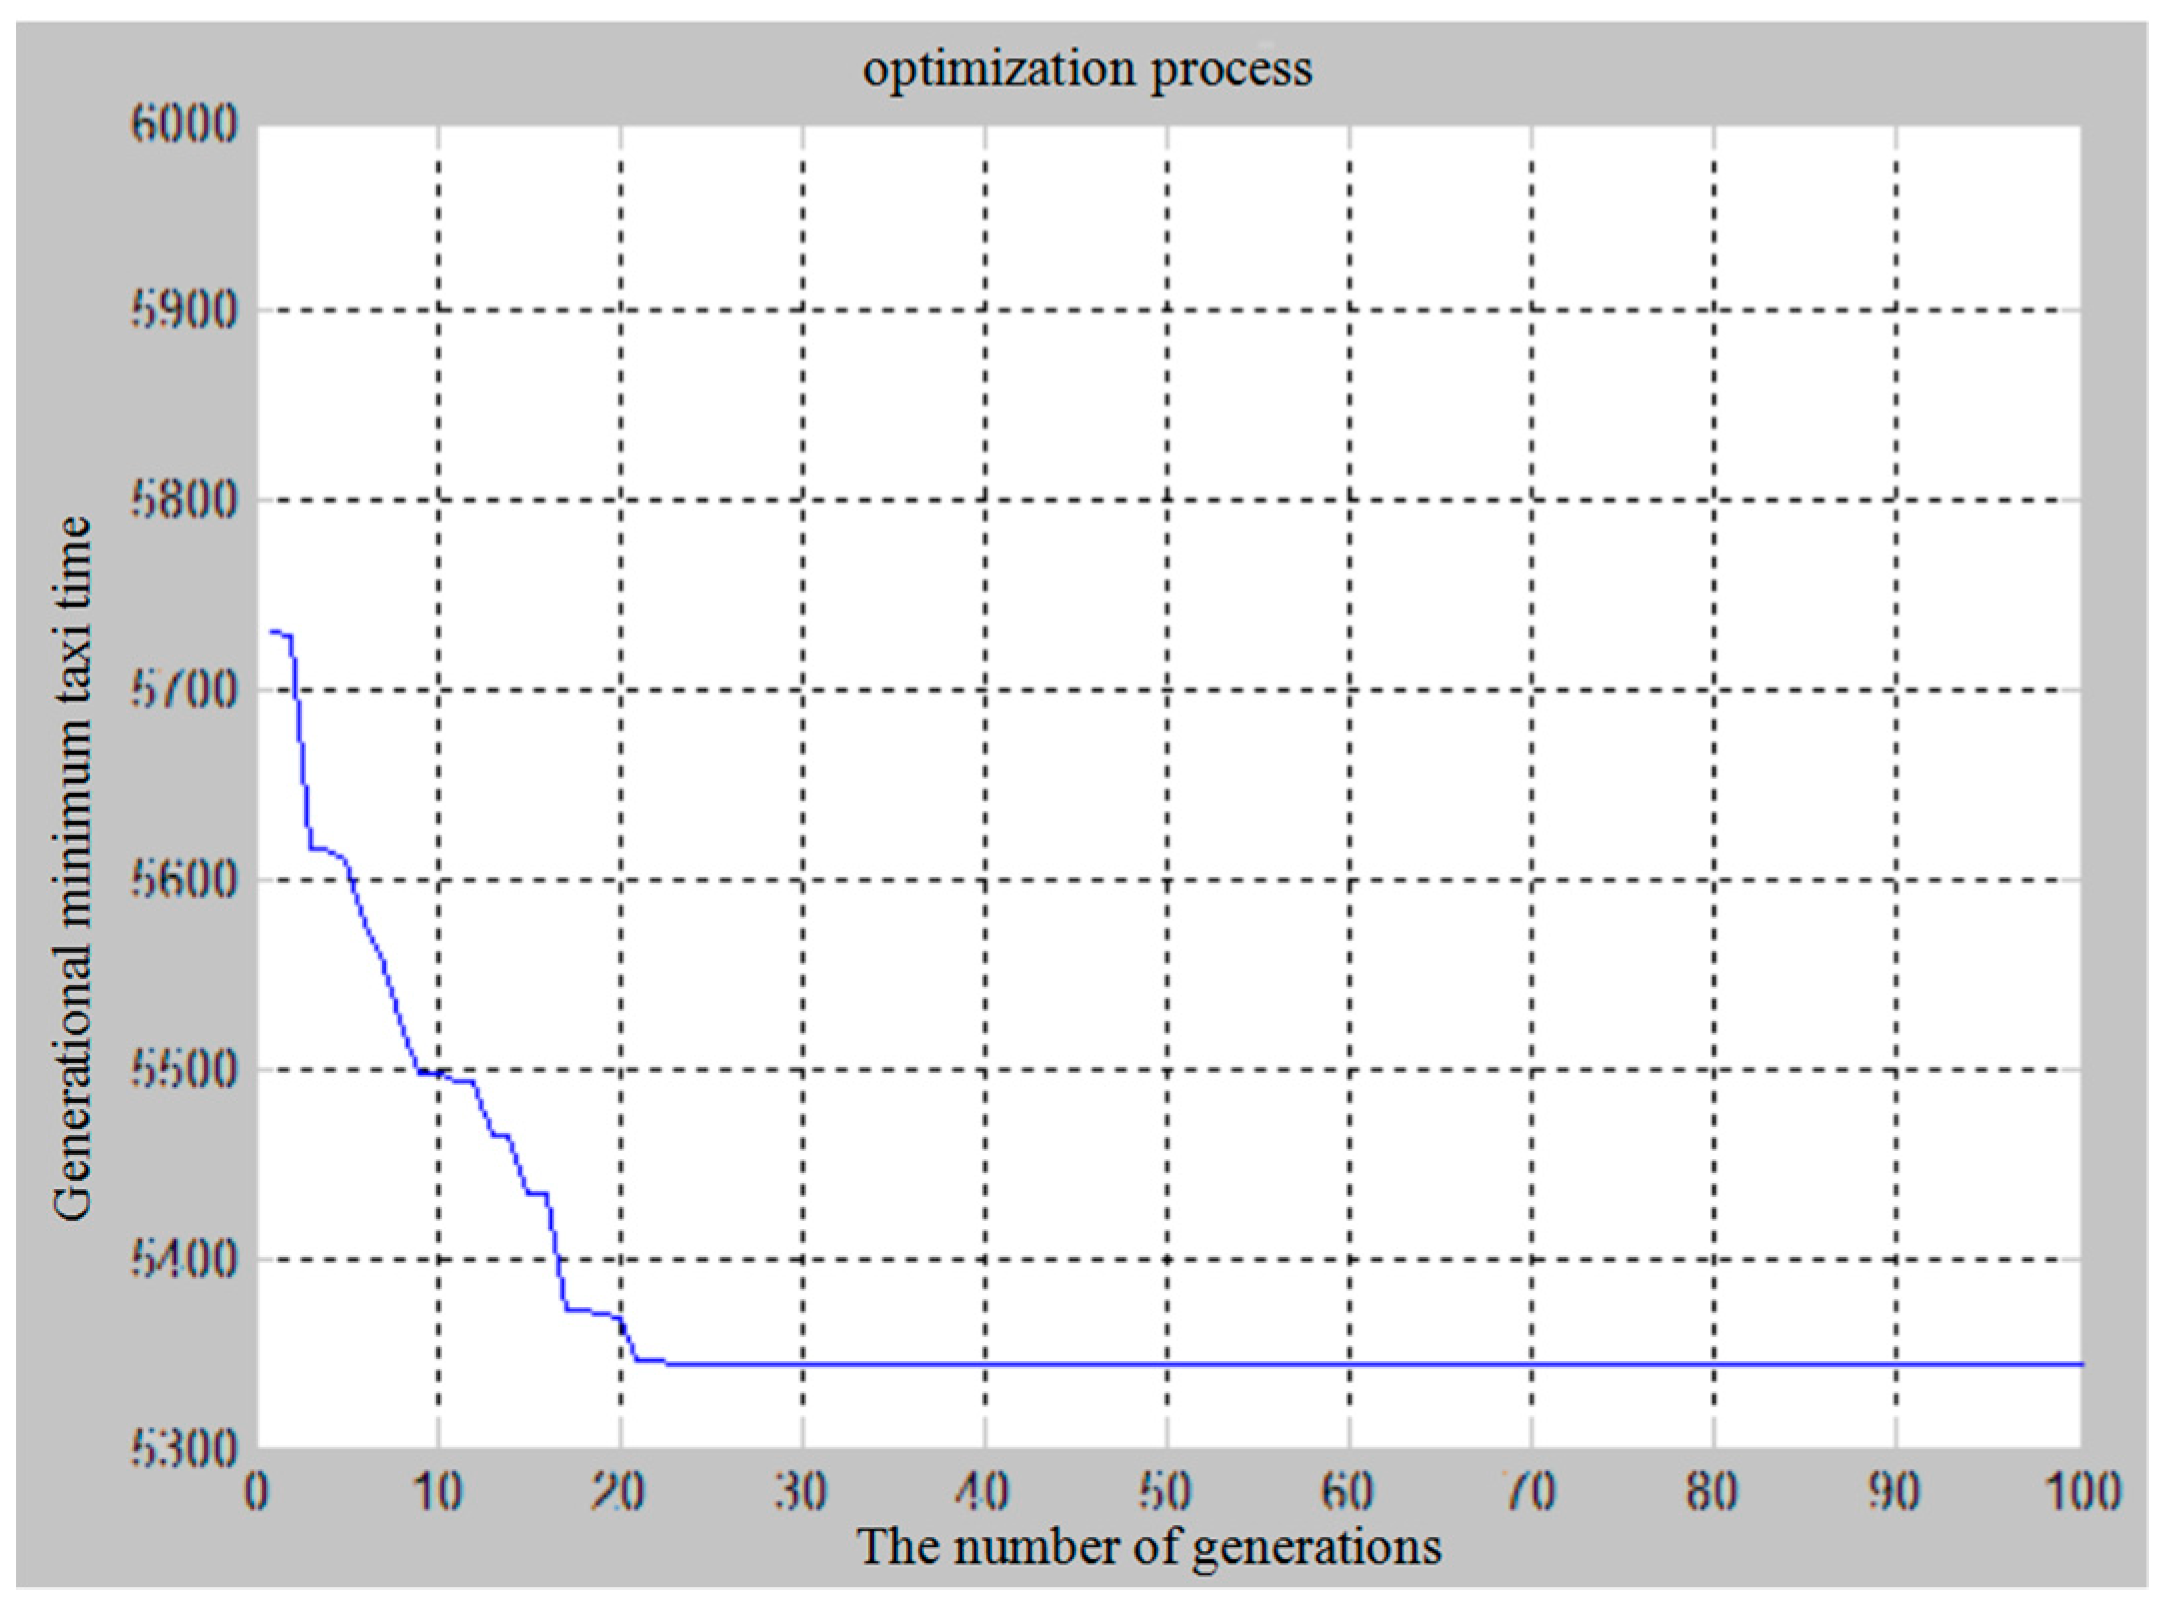
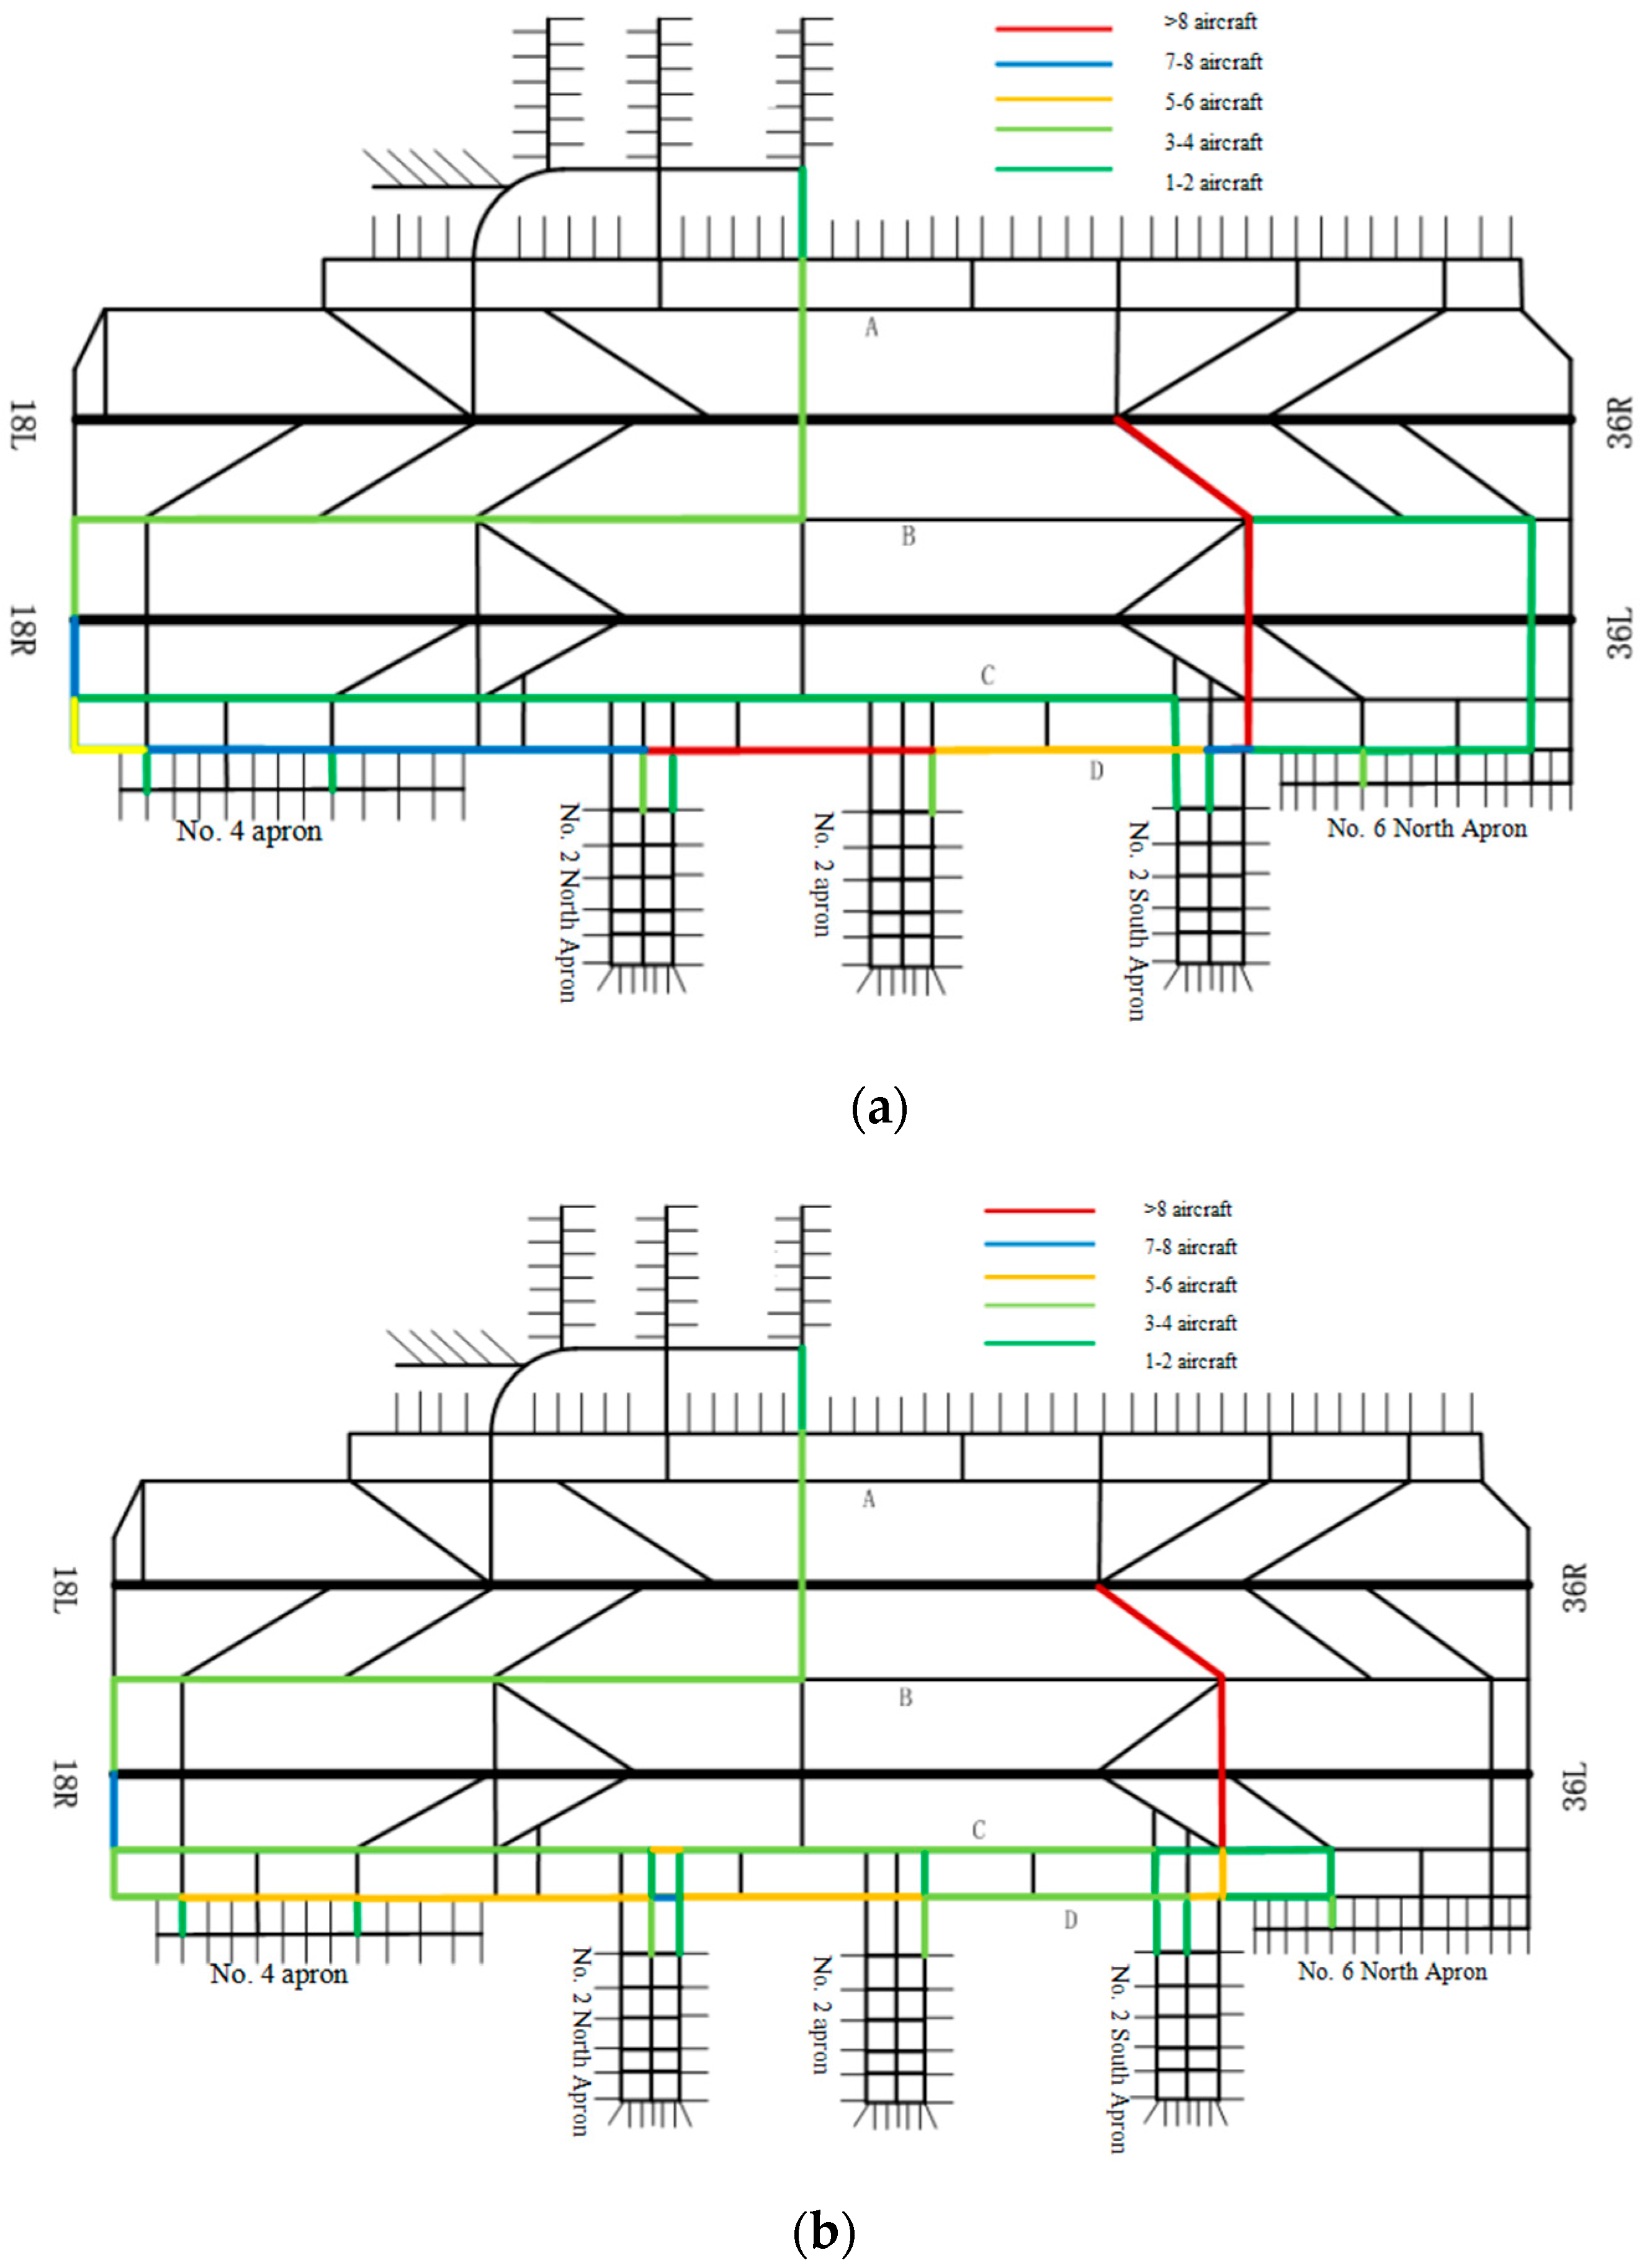
5.3. Analysis of Results

Figure 7 shows optimal solution curves for each generation in the genetic algorithm. After optimizing the 100-generation iterative genetic algorithm, the total taxiing time of 20 aircrafts on the airports surface converged to 5343 s, and the average aircraft taxiing time was about 267 s. Among them, the total taxiing distance was 38,728 m, and the number of turns was 49.
The taxiing path for each aircraft and the time it took the aircraft to pass through each node after path optimization are shown in Appendix A. Appendix A recorded the nodes that passed through the aircraft taxi path planning, and the time of entry into the node. For the non-steering node on the aircraft’s taxi path, it was considered that aircrafts taxi into the node and then directly out, occupying the node for only a certain moment. For the steering node on the aircraft’s taxi path, it was considered that after the aircraft taxied into the node, it took 30 s to perform the steering operation, after which the aircraft taxis out the node.
Taxi data before and after optimization of 20 aircraft paths listed in Table 3 were satisfied. The comparison results are shown in Table 4.
Comparing statistical data from Table 4 shows that the total taxiing distance and number of aircraft turns after path optimization were reduced. However, the impact on total taxiing time reduction was not significant and taxi collision avoidance was the major factor for reducing total taxiing time.
In Table 3, there are 17 aircrafts whose parking positions were the 2nd, 4th, and 6th aprons on the west side of runway 18R/36L. Among them, 16 aircraft’s arrival and departure taxiing was in the D main taxiways, that is, the taxi paths were between nodes 81–101, and only one aircraft with flight track number 3676 used the C master taxiway, the taxiing route segment between nodes 56–80. This mode of airport operation caused aircrafts on the D main taxiway to run slowly, with frequent conflicts, and the average taxi speed was low, while the C main taxiway was obviously underutilized.
The model built in this paper was based on a conflict avoidance path planning model with the shortest taxi time. Therefore, the planned taxi path was different from the actual running path of the airport, and the airport taxiway system resources were fully utilized. Among the taxiing paths planned by the model, 10 of the 17 arrival and departure aircrafts on the north apron were assigned D main taxiways, and seven were assigned C main taxiways, in order to avoid the problem of taxi path conflict between aircrafts, and so that aircrafts on the planned path could meet the vortex separation requirements. Figure 8 shows the number of taxi aircraft on each taxiway before and after path optimization. The data show that the airport taxiway resource allocation was more reasonable post taxi path optimization.

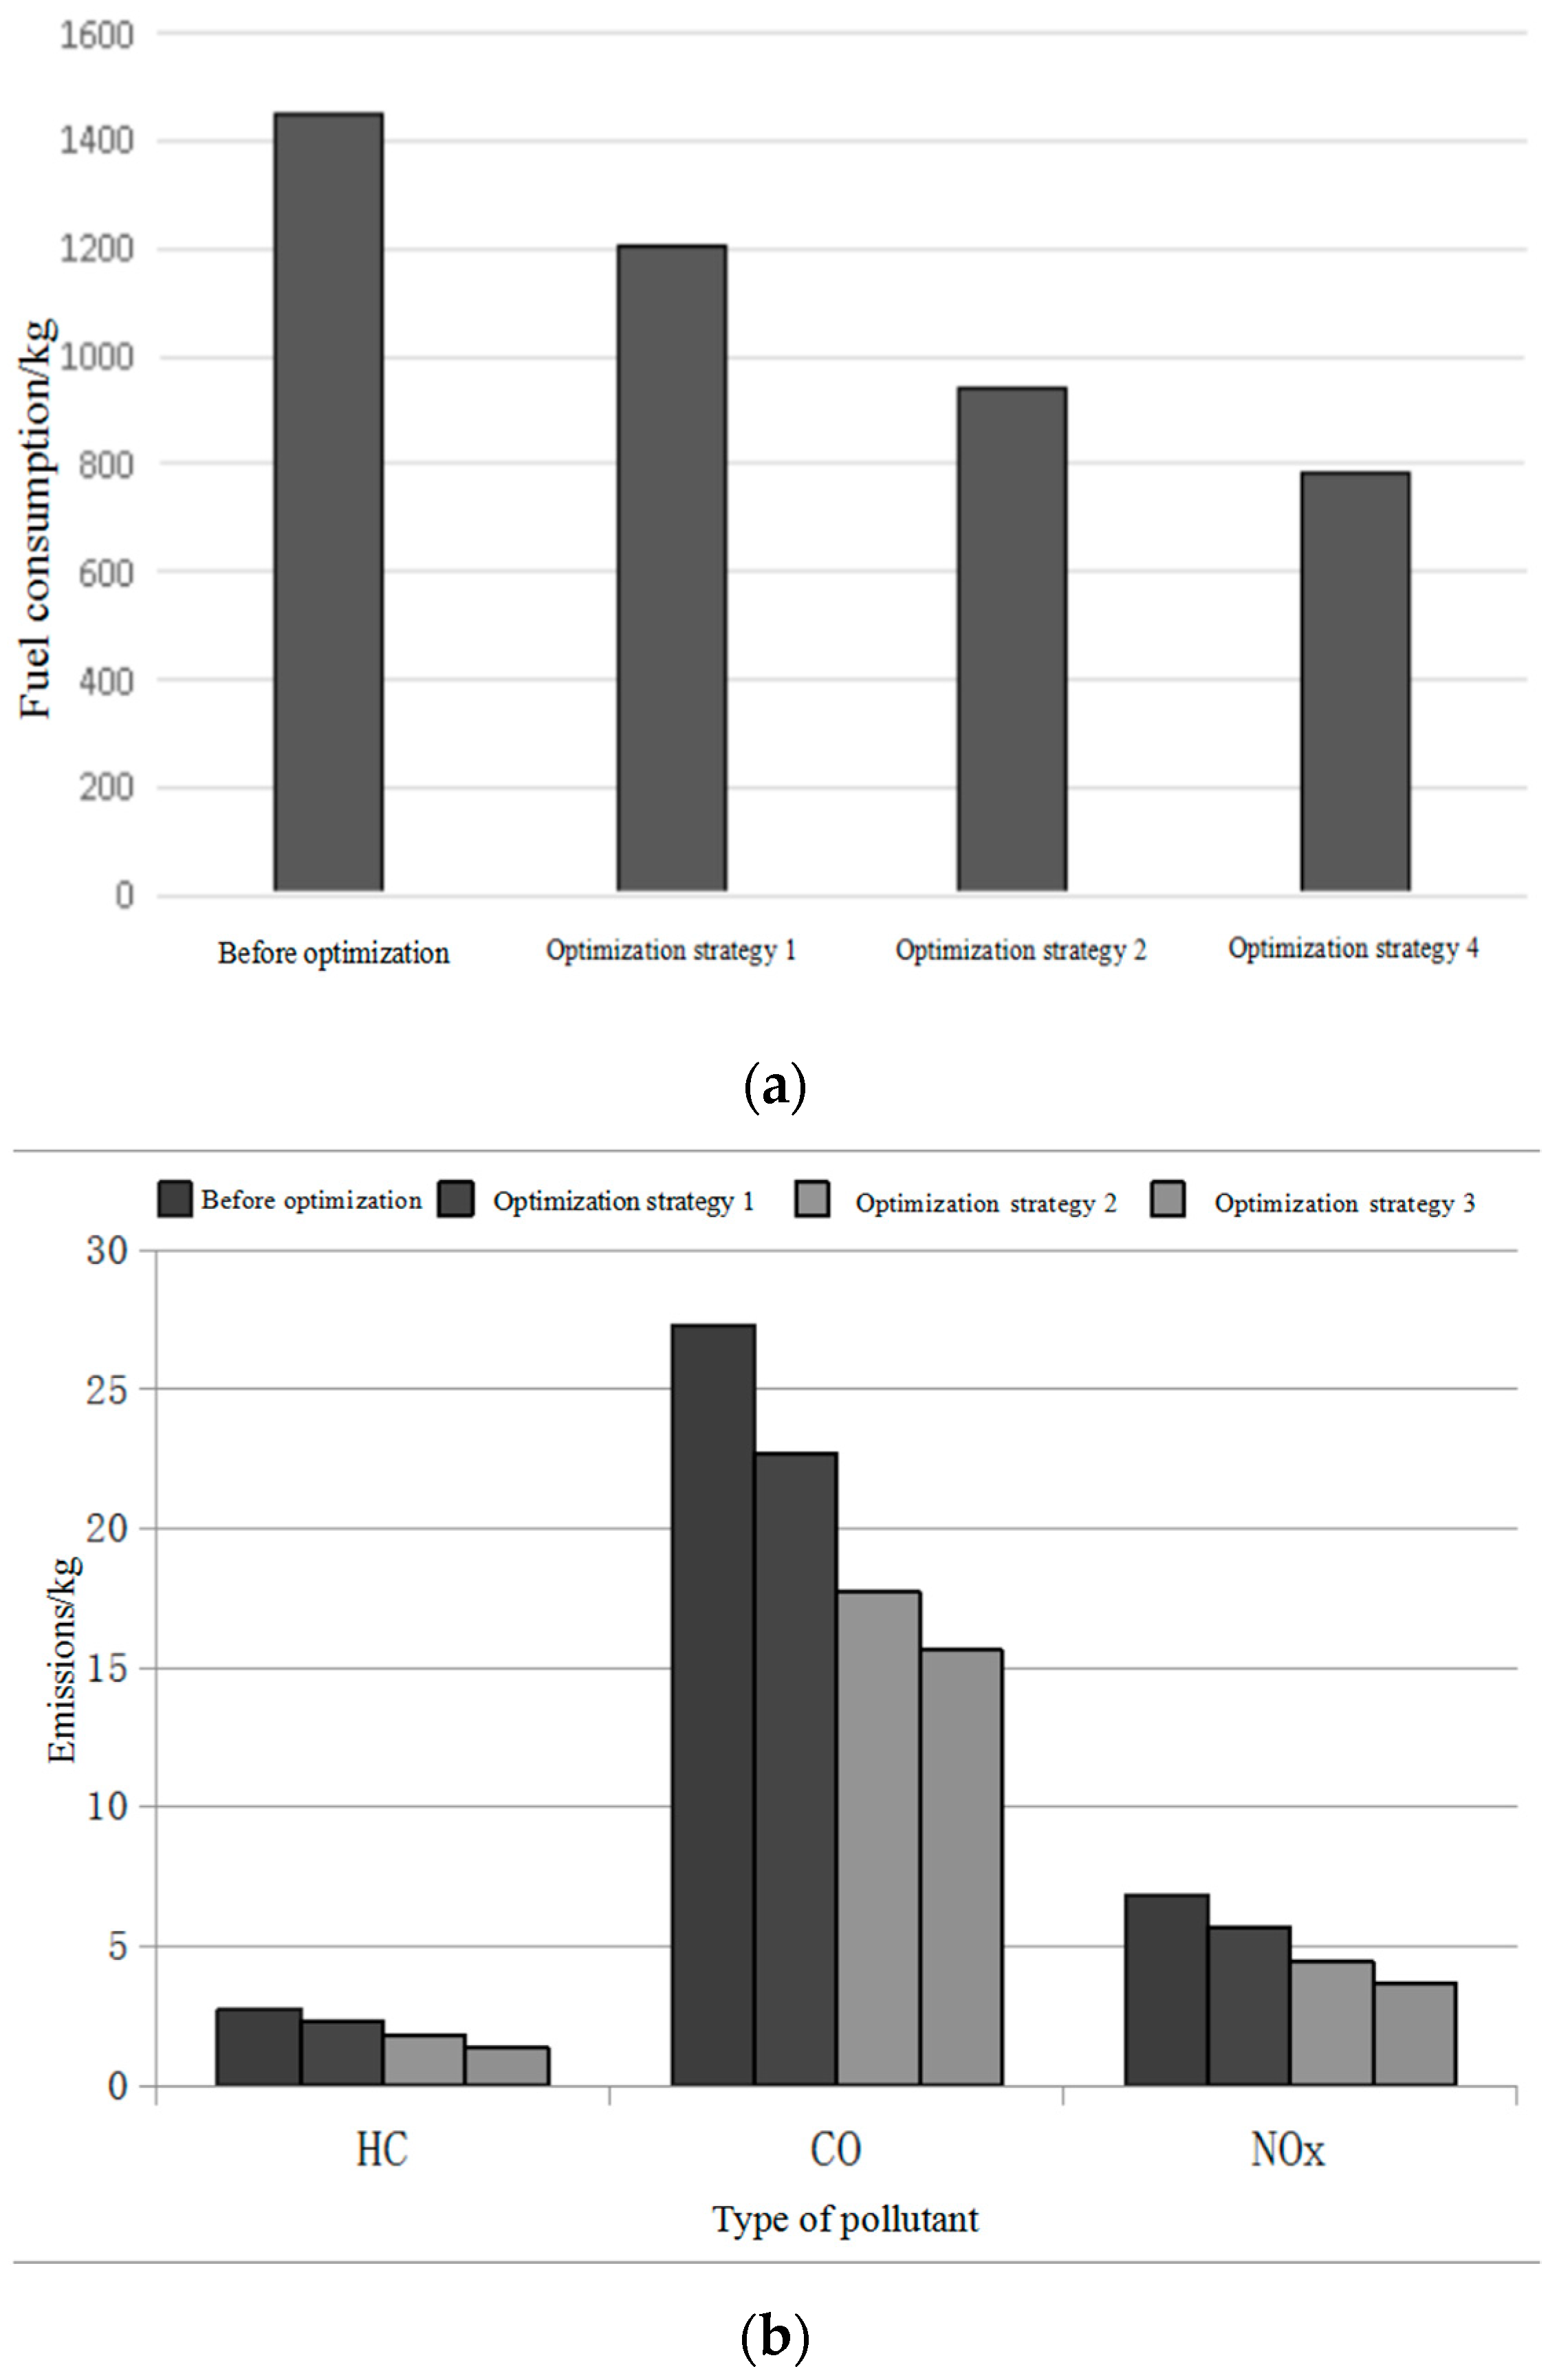
6. Comprehensive Optimization Strategy and Fuel Consumption Calculation

Various aircraft taxiing modes have been studied within the local research environment. In addition to two-engine taxiing, aircrafts have three low-emission airport surface taxiing modes. Among them, single-engine and electric taxiing speeds are the same as the all-engine taxiing mode [7]. Therefore, while path planning for aircrafts on airport surfaces is carried out, aircrafts can also implement a comprehensive optimization strategy using a low-emission taxiing mode, such as single-engine taxiing or electric-driven taxiing.
To plan the taxiing path of the aircraft on the airport surface, we then used the 20 aircrafts mentioned in Section 5 to apply the path planning model and the solution algorithm established in this chapter. At the same time, the aircrafts were considered to adopt the conditions of full engine taxiing, single-engine taxiing, and electric taxiing. Using the fuel consumption and emissions calculation model under various taxiing methods [7], we calculated the total fuel consumption and emissions of all aircrafts in the airport taxiing stage before and after optimization of different combination strategies. The fuel flow rate and pollutant emission factor of the aircrafts were based on the B736-700 model. The calculation results for total fuel consumption and pollutant emissions from the 20 aircrafts are shown in Figure 9a,b.
In Figure 9, “Before Optimization” indicates that no optimization strategy was implemented, at this time, total fuel consumption and emissions of all aircraft were the largest. “Optimization Strategy 1” indicates that the aircrafts had conducted the taxi path planning under the all-engine taxiing mode. The data show that after implementing taxi path planning
For aircrafts on the airport surface, the total fuel consumption and emissions of all aircrafts were reduced by about 17% compared with before optimization. “Optimization Strategy 2 and Optimization Strategy 3” indicate that the aircraft had planned the taxi path in the single-engine taxi mode and the electric drive taxi mode, respectively. This model is a comprehensive optimization strategy for low-emission taxiing and taxi path planning. The data also indicated that total fuel consumption and emissions of all aircraft were reduced by 35% and 46%, respectively, compared with before optimization. The calculations show that the comprehensive optimization strategy is more effective in energy saving and emission reductions during the aircrafts taxiing stage.

7. Conclusions

In this paper, the motion data of aircrafts were analyzed using monitoring data. Factors such as the taxiing distance of the aircraft, the number of large turns in the taxiing, and conflict avoidance were comprehensively considered. The aircraft path optimization model, with the shortest total time of aircraft taxiing on airport surfaces, was established—the aircraft taxiing dynamic model. According to this model, possible conflict problems in the path optimization model were constrained. Finally, the genetic algorithm was used to solve the model, and the crossover and mutation operators of the traditional genetic algorithm were improved. The simulation was carried out with real flight data, and the energy-saving and emission-reducing effects of the aircraft’s path planning during the taxiing stage were analyzed and calculated. The results showed that, after aircraft’s taxi path optimization, the aircraft’s total taxiing distance and steering times were reduced, taxiing conflict was avoided, taxiing time was relatively reduced, and the overall speed of the aircraft’s taxiing in airport surface was increased, which improved the airport’s operating efficiency, which in turn reduced fuel consumption and pollutant emissions during the taxiing phase. Compared with traditional optimization methods that do not consider turning factors, energy saving and emission reduction effects were more significant. The proposed method is faster than other complex algorithms considering multiple factors, and has higher practical application value.
Aircraft taxi path planning requires a high degree of rationality, accuracy, real-time, and reliability. Due to factors such as development time constraints, this paper has certain limitations. Mainly reflected in the proposed method, although it can give the path of the airport surface with free collision and the shortest taxi time, but in the actual taxiing process, the aircraft cannot ensure that the route is strictly followed, and it is possible to generate new conflicts. How to dynamically adjust the path of the aircraft under the premise of ensuring real-time performance needs further study. The future work needs to be improved by increasing the actual interference factors of the airport, comprehensively analyzing the actual situation of the airport’s arrival and departure flights, dynamically adjusting the taxiing path of the aircraft and maintaining the real-time performance of the system, and further optimizing the algorithm to improve the algorithm’s operation speed and accuracy and greatly improve the performance of the algorithm.

Author Contributions

Writing: N.L.; Providing case and idea: Y.S., J.Y. and J.-C.L.; Revising and editing: H.-f.Z. and S.T.

Funding

This research was funded by the national key R&D program, grant number “No.2016YFB0502405”; the National Natural Science Foundation, grant number “No.71801215”; the National Social Science Foundation, grant number “No.13CGL005”.

Acknowledgments

We are grateful to Zhongshan City Science and Technology Bureau Project (No. 2017B1015) and 2018 Zhongshan Innovation and Development Research Center.

Conflicts of Interest

The authors declare no conflict of interest.

Appendix A

Table A1. The taxiing path of each aircraft, and the moment when the aircraft passes through each node.
Flight Track NumberPath Node (Passing Node Time (s))
61789 (49,842 s)– > 90 (49,880 s)– > 91 (49,888 s)– > 92 (49,907 s)– > 93 (49,925 s)– > 94 (49,933 s)– > 95 (49,941 s)– > 96 (49,956 s)– > 97 (49,973 s)– > 98 (49,997 s)– > 99 (50,017 s)– > 100 (50,048 s)– > 10 (50,061 s)– > 56 (50,099 s) – > 55 (50,117 s)
8344 (49,916 s)– > 8 (49,931 s)– > 19 (49,940 s)– > 33 (49,964 s)– > 42 (49,982 s)– > 41 (50,084 s)– > 40 (50,114 s)– > 39 (50,160 s)– > 38 (50,173 s)–>55 (50,222 s)
258734 (50,039 s)– > 43 (50,072 s)– > 49 (50,120 s)– > 76 (50,138 s)– > 85 (50,146 s)– > 86 (50,184 s)– > 87 (50,192 s)– > 88 (50,212 s)– > 89 (50,230 s)– > 90 (50,238 s)– > 91 (50,246 s)– > 92 (50,265 s)– > 93 (50,283 s)– > 94 (50,291 s)– > 95 (50,299 s)– > 96 (50,314 s)– > 97 (50,331 s)– > 98 (50,355 s)– > 99 (50,375 s)– > 100 (50,407 s)
988 (5,0055 s)– > 19 (50,064 s)– > 33 (50,088 s)– > 42 (50,106 s)– > 41 (50,208 s)– > 40 (50,238 s)– > 39 (50,284 s)– > 38 (50,297 s)– > 55 (50,346 s)
13234 (50,173 s)– > 43 (50,206 s)– > 49 (50,254 s)– > 76 (50,272 s)– > 85 (50,280 s)– > 86 (50,318 s)– > 87 (50,326 s)– > 88 (50,346 s)– > 89 (50,364 s)– > 90 (50,372 s)– > 91 (50,380 s)– > 92 (50,399 s)– > 93 (50,417 s)– > 94 (50,425 s)– > 95 (50,433 s)– > 96 (50,448 s)– > 97 (50,465 s)– > 98 (50,489 s)
8088 (50,276 s)– > 89 (50,294 s)– > 90 (50,302 s)– > 91 (50,310 s)– > 92 (50,329 s)– > 93 (50,348 s)– > 94 (50,356 s)– > 95 (50,364 s)– > 96 (50,379 s)– > 97(50,396 s)– > 98(50,419 s)– > 99(50,439 s)– > 100(50,471 s)– > 101 (50,483 s)– > 56 (50,521 s)– > 55 (50,539 s)
289434 (50,323 s)– > 43 (50,356 s)– > 49 (50,404 s)– > 76 (50,422 s)– > 77 (50,479 s)– > 84 (50,517 s)
343393 (50,438 s)– > 94 (50,476 s)– > 95 (50,484 s)– > 96 (50,498 s)– > 97 (50,516 s)– > 98 (50,539 s)– > 99 (50,559 s)– > 100 (50,591 s) – > 101 (50,603 s)– > 56 (50,641 s)– > 55 (50,659 s)
136834 (50,443 s)– > 43(50,476 s)– > 49(50,524 s)– > 76(50,542 s)– > 75 (50,578 s)– > 74 (50,587 s)– > 71 (50,605 s)– > 70 (50,624 s) – > 69 (50,632 s)– > 68 (50,640 s)– > 67 (50,650 s)– > 66 (50,659 s)– > 65 (50,677 s)– > 64 (50,685 s)– > 94 (50,723 s)
33989 (50,472 s)– > 90 (50,510 s)– > 91 (50,518 s)– > 92 (50,537 s)– > 93 (50,555 s)– > 94 (50,563 s)– > 95 (50,571 s)– > 96 (50,586 s) – > 97 (50,603 s)– > 98 (50,627 s)– > 99 (50,647 s)– > 100 (50,678 s)– > 101 (50,691 s)– > 56 (50,729 s)– > 55 (50,747 s)
170434 (50,565 s)– > 43 (50,598 s)– > 49 (50,646 s)– > 76 (50,664 s)– > 75 (50,700 s)– > 74 (50,709 s)– > 71 (50,727 s)– > 70 (50,746 s) – > 69 (50,754 s)– > 68 (50,762 s)– > 67 (50,772 s)– > 66 (50,781 s)– > 65 (50,799 s)– > 64 (50,807 s)– > 94 (50,845 s)
152734 (50,704 s)– > 43 (50,737 s)– > 49 (50,785 s)– > 76 (50,803 s)– > 85 (50,811 s)– > 86 (50,849 s)
367687 (50,757 s)– > 74 (50,765 s)– > 71 (50,813 s)– > 70 (50,832 s)– > 69 (50,840 s)– > 68 (50,848 s)– > 67 (50,858 s)– > 66 (50,867 s) – > 65 (50,886 s)– > 64 (50,894 s)– > 63 (50,902 s)– > 62 (50,916 s)– > 60 (50,933 s)– > 59 (50,957 s)– > 58 (50,977 s)– > 57 (51,008 s)– > 56 (51,021 s)– > 55 (51,069 s)
172734 (50,825 s)– > 43 (50,858 s)– > 49 (50,906 s)– > 76 (50,924 s)– > 85 (50,932 s)– > 84 (50,987 s)
271293 (50,898 s)– > 65 (50,906 s)– > 64 (50,944 s)– > 63 (50,952 s)– > 62 (50,966 s)– > 60 (50,983 s)– > 59 (51,007 s)– > 58 (51,027 s) – > 57 (51,059 s)– > 56 (51,071 s)– > 55 (51,119 s)
92534 (50,940 s)– > 43 (50,973 s)– > 49 (51,021 s)– > 76 (51,039 s)– > 85 (51,047 s)– > 86 (51,085 s)– > 87 (51,093 s)– > 88 (51,113 s) – > 89 (51,131 s)– > 90 (51,139 s)– > 91 (51,147 s)– > 92 (51,166 s)– > 93 (51,184 s)– > 94 (51,192 s)
357089 (50,961 s)– > 70 (50,969 s)– > 69(51,007 s)– > 68(51,015 s)– > 67 (51,025 s)– > 66 (51,033 s)– > 65 (51,052 s)– > 64 (51,060 s) – > 63(51,068 s)– > 62(51,083 s)– > 60 (51,099 s)– > 59 (51,123 s)– > 58 (51,144 s)– > 57 (51,175 s)– > 56 (51,188 s)– > 55(51236 s)
16394 (51,065 s)– > 8 (51,080 s)– > 19 (51,089 s)– > 33 (51,113 s)– > 42 (51,131 s)– > 41 (51,233 s)– > 40 (51,263 s)– > 39 (51,309 s) – > 38 (51,322 s)– > 55 (51,371 s)
43834 (51,075 s)– > 43 (51,108 s)– > 49 (51,156 s)– > 76 (51,174 s)– > 77 (51,231 s)– > 84 (51,269 s)
151034 (51,214 s)– > 43 (51,247 s)– > 49 (51,295 s)– > 76 (51,313 s)– > 85 (51,321 s)– > 86 (51,359 s)

References

  1. Landry, S.J.; Chen, X.W.; Nof, S.Y. A decision support methodology for dynamic taxiway and runway conflict prevention. Decis. Support Syst. 2013, 55, 165–174. [Google Scholar] [CrossRef]
  2. Ravizza, S.; Atkin, J.; Burke, E.K. A more realistic approach for airport ground movement optimisation with stand holding. J. Sched. 2014, 17, 507–520. [Google Scholar] [CrossRef]
  3. Weiszer, M.; Chen, J.; Stewart, P. Preference-Based Evolutionary Algorithm for Airport Runway Scheduling and Ground Movement Optimisation. In Proceedings of the IEEE International Conference on Intelligent Transportation Systems, Las Palmas, Spain, 15–18 September 2015. [Google Scholar]
  4. Ortega Alba, S.; Manana, M. Energy Research in Airports: A Review. Energies 2016, 9, 349. [Google Scholar] [CrossRef]
  5. Li, N.; Lv, H. Method to Find out Path of Aircraft on Surface Based on Surface Movement Radar Data. Aeronaut. Comput. Tech. 2016, 46, 6–9. [Google Scholar]
  6. Lv, H. The Analysis of Aircraft Taxiing and Prediction Study Based on Surveillance Data. Master’s Thesis, Civil Aviation University of China, Tianjing, China, 2016. [Google Scholar]
  7. Przemysław, P.; Skorupski, J. Aircraft Taxi Route Choice in Case of Conflict Points Existence. In Proceedings of the 16th International Conference on Transport Systems Telematics, Warsaw, Poland, 16–19 March 2016. [Google Scholar]
  8. Li, N.; Zhang, H. Calculating aircraft pollutant emissions during taxiing at the airport. Acta Sci. Circumst. 2017, 37, 1872–1876. [Google Scholar]
  9. Chen, J.; Weiszer, M.; Zareian, E. Multi-Objective Fuzzy Rule-Based Prediction and Uncertainty Quantification of Aircraft Taxi Time. In Proceedings of the 20th International Conference on Intelligent Transportation Systems, Yokohama, Japan, 16–19 October 2017. [Google Scholar]
  10. Zhu, X.; Li, N.; Sun, Y.; Zhang, H.; Wang, K.; Tsai, S.-B. A Study on the Strategy for Departure Aircraft Pushback Control from the Perspective of Reducing Carbon Emissions. Energies 2018, 11, 2473. [Google Scholar] [CrossRef]
  11. Ding, J.; Li, X.; Li, Q. Optimal Scheduling Model for Hub Airport Taxi Based on Improved Ant Colony Collaborative Algorithm. J. Comput. Appl. 2010, 30, 1000–1003. [Google Scholar] [CrossRef]
  12. Chiba, R.; Arai, T.; Ota, J. Integrated Design for Automated Guided Vehicle Systems Using Cooperative Co-evolution. Adv. Robot. 2010, 24, 25–45. [Google Scholar] [CrossRef]
  13. Ren, C. Driverless Vehicle Path Planning Based on Genetic Algorithm Technology Research. Master’s Thesis, Tianjin University, Tianjing, China, 2015. [Google Scholar]
  14. Tang, J.; Shi, W.; Meng, L. Time-Dependent Dynamic Vehicle Routing Based on Genetic Algorithm. Geomat. Inf. Sci. Wuhan Univ. 2008, 8, 875–879. [Google Scholar]
  15. Tsai, S.-B. Using the DEMATEL Model to Explore the Job Satisfaction of Research and Development Professionals in China’s Photovoltaic Cell Industry. Renew. Sustain. Energy Rev. 2018, 81, 62–68. [Google Scholar] [CrossRef]
  16. Lee, Y.C.; Hsiao, Y.C.; Peng, C.F.; Tsai, S.B.; Wu, C.H.; Chen, Q. Using Mahalanobis-Taguchi System, Logistic Regression and Neural Network Method to Evaluate Purchasing Audit Quality. Proc. Inst. Mech. Eng. Part B J. Eng. Manuf. 2015, 229, 3–12. [Google Scholar] [CrossRef]
  17. Lee, Y.C.; Chen, C.Y.; Tsai, S.B.; Wang, C.T. Discussing green environmental performance and competitive strategies. Pensee 2014, 76, 190–198. [Google Scholar]
  18. Liu, B.; Li, T.; Tsai, S.B. Low carbon strategy analysis of competing supply chains with different power structures. Sustainability 2017, 9, 835. [Google Scholar] [CrossRef]
  19. Qu, Q.; Tsai, S.B.; Tang, M.; Xu, C.; Dong, W. Marine ecological environment management based on ecological compensation mechanisms. Sustainability 2016, 8, 1267. [Google Scholar] [CrossRef]
  20. Lee, Y.C.; Wang, Y.C.; Chien, C.H.; Wu, C.H.; Lu, S.C.; Tsai, S.B.; Dong, W. Applying revised gap analysis model in measuring hotel service quality. SpringerPlus 2016, 5, 1191. [Google Scholar] [CrossRef]
  21. Wang, J.; Yang, J.M.; Chen, Q.; Tsai, S.B. Collaborative Production Structure of Knowledge Sharing Behavior in Internet Communities. Mob. Inf. Syst. 2016, 2016, 8269474. [Google Scholar] [CrossRef]
  22. Tsai, S.B.; Lee, Y.C.; Guo, J.J. Using modified grey forecasting models to forecast the growth trends of green materials. Proc. Inst. Mech. Eng. Part B J. Eng. Manuf. 2014, 228, 931–940. [Google Scholar] [CrossRef]
  23. Tsai, S.B.; Zhou, J.; Gao, Y.; Wang, J.; Li, G.; Zheng, Y.; Ren, P.; Xu, W. Combining FMEA with DEMATEL Models to Solve Production Process Problems. PLoS ONE 2017, 12, 0167710. [Google Scholar] [CrossRef]
  24. Ge, B.; Jiang, D.; Gao, Y.; Tsai, S.B. The influence of legitimacy on a proactive green orientation and green performance: A study based on transitional economy scenarios in China. Sustainability 2016, 8, 1344. [Google Scholar] [CrossRef]
  25. Wang, J.; Yang, J.; Chen, Q.; Tsai, S.B. Creating the sustainable conditions for knowledge information sharing in virtual community. SpringerPlus 2016, 5, 1019. [Google Scholar] [CrossRef]
  26. Tang, Z.; Zhu, X.; Xia, Z. Taxi Routing Update Algorithm for A-SMGCS with Taxi Time Delay. Sci. Technol. Eng. 2017, 17, 326–332. [Google Scholar]
Figure 1. Approach and departure aircraft movement state diagram. (a) Arrival aircraft and (b) departure aircraft.
Energies 12 01649 g001aEnergies 12 01649 g001b
Figure 2. Simple taxiway network diagram.
Energies 12 01649 g002
Figure 3. Chromosome A.
Energies 12 01649 g003
Figure 4. Operation diagram of chromosome crossover. (a) Chromosome A and B before crossing; (b) chromosomes A* and B* after crossing; and (c) chromosome A* and B* after complement and delocation.
Energies 12 01649 g004
Figure 5. Operation diagram of chromosome mutation. (a) Chromosome A before mutation; and (b) chromosome A* after mutation.
Energies 12 01649 g005aEnergies 12 01649 g005b
Figure 6. Network diagram of taxiway at Hongqiao Airport.
Energies 12 01649 g006
Figure 7. The minimum taxiing time curve generated using the genetic algorithm.
Energies 12 01649 g007
Figure 8. Number of aircraft taxiing on various taxi paths before and after path optimization. (a) Before optimization; and (b) after optimization.
Energies 12 01649 g008
Figure 9. Aircraft fuel consumption (a), and emissions (b) under different optimization strategies.
Energies 12 01649 g009
Table 1. Vortex separation Standards for aircrafts on airport surfaces (m).
The Front PlaneThe Rear Plane
Light Medium Heavy
Light200200200
Medium200200200
Heavy300300300
Table 2. Surface taxi, aircraft time vortex separation (s).
The Front PlaneThe Rear Plane
LightMediumHeavy
Light202020
Medium202020
Heavy303030
Table 3. Airport Flight Schedules.
FlightFlight Tracking NumberArrival and Departure TypeApron LocationTaxiing Start and End Time (s)
1617departureNo. 2 apron49,837~50,135
2834departureF apron49,916~50,333
32587arrivalNo. 4 apron50039~50,455
498departureG apron50,055~50,533
5132arrivalNo. 4 apron50,173~50,621
680departureNo. 2 apron50,276~50,665
72894arrivalNo. 6 apron50,323~50,543
83433departureNo. 2 North Apron50,433~50,743
91368arrivalNo. 2 North Apron50,443~50,740
10339departureNo. 2 apron50,467~50,852
111704arrivalNo. 2 North Apron50,565~51,010
121527arrivalNo. 2 South Apron50,704~50,855
133676departureNo. 2 South Apron50,752~51,128
141727arrivalNo. 6 apron50,825~51,030
152712departureNo. 2 North Apron50,893~51,078
16925arrivalNo. 2 North Apron50,940~51,216
173570departureNo. 2 apron50,956~51,348
181639departureF apron51,065~51,465
19438arrivalNo. 6 apron51,075~51,280
201510arrivalNo. 2 South Apron51,214~51,344
Table 4. Comparison of important data before and after aircraft path optimization.
Before OptimizationAfter Optimization
Total taxiing distance (m)39,65038,728
Total number of turns5249
Total taxi time (s)64235343
Number of flights using the C main taxiway17
Number of flights using the D main taxiway1610
The number of slow down or stop to avoidance conflict60

