Article

Total Organic Carbon Enrichment and Its Impact on Pore Characteristics: A Case Study from the Niutitang Formation Shales in Northern Guizhou

1
School of Energy Resource, China University of Geosciences (Beijing), Beijing 100083, China
2
Key Laboratory of Marine Reservoir Evolution and Hydrocarbon Enrichment Mechanism, Ministry of Education, Beijing 100083, China
3
Key Laboratory of Strategy Evaluation for Shale Gas, Ministry of Land and Resources, Beijing 100083, China
*
Author to whom correspondence should be addressed.
Energies 2019, 12(8), 1480; https://doi.org/10.3390/en12081480
Submission received: 15 March 2019 / Revised: 7 April 2019 / Accepted: 15 April 2019 / Published: 18 April 2019
(This article belongs to the Special Issue Development of Unconventional Reservoirs)

Abstract

:
This study analyzes samples from the Lower Cambrian Niutitang Formation in northern Guizhou Province to enable a better understanding of total organic carbon (TOC) enrichment and its impact on the pore characteristics of over-mature marine shale. Organic geochemical analysis, X-ray diffraction, scanning electron microscopy, helium porosity, and low-temperature nitrogen adsorption experiments were conducted on shale samples. Their original TOC (TOCo) content and organic porosity were estimated by theoretical calculation, and fractal dimension D was computed with the fractal Frenkel–Halsey–Hill model. The results were then used to consider which factors control TOC enrichment and pore characteristics. The samples are shown to be dominated by type-I kerogen with a TOC content of 0.29–9.36% and an equivalent vitrinite reflectance value of 1.72–2.72%. The TOCo content varies between 0.64% and 18.17%, and the overall recovery coefficient for the Niutitang Formation was 2.16. Total porosity of the samples ranged between 0.36% and 6.93%. TOC content directly controls porosity when TOC content lies in the range 1.0% to 6.0%. For samples with TOC < 1.0% and TOC > 6.0%, inorganic pores are the main contributors to porosity. Additionally, pore structure parameters show no obvious trends with TOC, quartz, and clay mineral content. The fractal dimension D1 is between 2.619 and 2.716, and D2 is between 2.680 and 2.854, illustrating significant pore surface roughness and structural heterogeneity. No single constituent had a dominant effect on the fractal characteristics.

1. Introduction

Organic matter (OM) in shale refers to material abundant in organic carbon generated or retained in the shale through deep burial and increasing thermal maturity, including kerogen, bitumen, solid bitumen, residual OM, pyrobitumen, and char [1,2]. OM receives considerable attention in shale gas exploration and exploitation because of its essential role in hydrocarbon generation and in organic pore formation and development [3,4].
Total organic carbon (TOC) content is a key parameter for characterizing a shale reservoir and is an indicator of shale gas potential. However, previous studies adopted various values for the lower limit for TOC in a viable resource. For example, the principal gas-productive section of the Ohio Shale had at least 2.0% TOC, which enabled the shale gas system to become the first source of commercial gas production in North America [5]. The minimum TOC of an exploration target shale pay should be 2.5–3.0% [6]. The source rock in the core producing area of the Barnett Shale system had a present-day TOC of over 1.0% [7]. In south China, shale gas “sweet spots” are characterized by high TOC content, usually higher than 3.0% [8]. However, TOC content decreases gradually during hydrocarbon generation and expulsion, and the TOC values mentioned above are present-day TOC or residual TOC and, thus, are lower than the original TOC (TOCo) values [3,9,10]. Conclusions based on the present-day TOC cannot accurately reflect the original geochemical characteristics of thermally over-mature organic matter and may underestimate hydrocarbon generation potential [7,11]. Investigations were, therefore, undertaken into using TOC recovery to evaluate the effective shale gas layer [7,12,13]. Furthermore, previous studies did not investigate type-I kerogen in detail. Consequently, the original TOC value and distribution in marine shale with type-I kerogen and the factors controlling both still need to be clarified.
Organic matter starts to generate nanopores once it reaches a threshold thermal maturity. These nanopores are indispensable for shale gas adsorption [2,4]. Different methods are employed to calculate and analyze organic porosity and its contributions to total porosity. One category is the examination of images through processes such as two-dimensional (2D) image processing [14,15,16] and three-dimensional (3D) image reconstruction [17]. The other category is theoretical calculation, including low-field NMR [18,19], rock physics models [20,21], and calculations based on the mass balance principle [3,7,12,13,22]. However, the contributions of organic pores to total porosity vary significantly, and there is, thus, much discussion of the controlling factors of organic porosity and total porosity [14,23,24,25]. Although the results are not consistent, it is clear that there are complex relationships between the evolution of porosity and geological parameters. Moreover, pore structure parameters (specific surface area, pore volume, pore size distribution, and fractal dimension) and an understanding of their relationships with porosity are indispensable for fully characterizing pores [16,26,27].
The Lower Cambrian Niutitang Formation shale in north Guizhou Province, southwest China was identified as a promising shale gas target zone due to its remarkable TOC content and uniform distribution [28]. However, previous studies focused on the composition, pore structure, and gas adsorption of the shale [16,19,28,29,30] in the study area, and a limited number examined the characteristics of the original organic matter, its porosity evolution, its pore structure, and the relationships between them. Consequently, the objectives of this paper are (1) to conduct original TOC content recovery and organic porosity estimation, and (2) to characterize the pore structure and clarify how organic matter influences the pore characteristics. The understanding obtained with this study may be conducive to the evaluation of marine shale in the over-mature stage.

2. Geological Setting

The study area is in northern Guizhou, and well YX1 is located in northwestern Fenggang County (Figure 1). Tectonically, the northern Guizhou area evolved along with the Yangtze Platform, which experienced multiple periods of tectonic movement (from the Xuefeng movement to the Himalayan movement), resulting in complex geology [31]. These tectonic movements resulted in northeast (NE)- and north-northeast (NNE)-orientated folds and faults. The study area mainly features trough-like folds striking NE and NNE. The formation of S-shaped or Z-shaped single folds is attributed to tectonic deformation dominated by compression and facilitated by strike-slip. Their presence indicates that the geological conditions under which the area developed are complicated [31,32]. Differently trending faults intersect each other. The dip angles of faults are relatively steep, including some well-preserved upright fault planes [33].
The Lower Cambrian succession in the Upper Yangtze Platform was deposited during a major marine transgression from southeast to northwest. It is mainly composed of carbonaceous shale, and calcareous shale, carbonate, and siltstone. The black shale thickens southeastward; the present thick black shale in Sichuan, western Hunan and Hubei, Chongqing, and Guizhou province can be interpreted as being deposited in an open marine platform to marine shelf environment, while the deposits at the western margin of the Upper Yangtze Platform, which are dominated by terrestrial clastics and carbonates, are indicative of a littoral environment [28,35].
Occurrences of the Niutitang Formation in the study area can be subdivided into two members: (1) the lower member (LM), mainly consisting of carbonaceous shale, siliceous shale, and black shale with relatively high TOC content. It lies at depths of 1996–2031 m and is 35 m thick; (2) the upper member (UM), mainly consisting of organic-poor argillaceous mudstone and silty mudstone. It lies at depths of 1921–1996 m and is 75 m thick (Figure 2).

3. Samples and Methods

3.1. Samples and Experiments

Sixty-two samples were collected from the Lower Cambrian Niutitang Formation in YX1 well (Figure 1) with the depth from 1921 m to 2031 m (Figure 2), including 31 samples from the lower member (LM) and 31 samples from the upper member (UM). The core samples of the LM are dominated by black siliceous shale and carbonaceous shale, while the UM is mainly gray to dark-gray argillaceous shale and silty shale [34]. Measurements including organic geochemistry, optical microscopy, X-ray diffraction, scanning electron microscopy (SEM), nitrogen adsorption, and helium pycnometry were performed on samples. The methods used in this study were described thoroughly in Reference [36]; thus, they are not fully presented in this paper. Table 1 lists experiments and measurements conducted on each sample.

3.2. Calculation for Original TOC and Organic Porosity

Claypool’s Equation is considered to be useful [3,7,11], but the original production index (PIo) used for calculation was assumed by the researchers; thus, the transfer ratio (TR) of kerogen was unreliable. Both hydrogen index (HI) and original hydrogen index (HIo) were used to compute the TR, which was more reliable [13]. However, this calculation method ignores the mass change of source rock triggered by hydrocarbon generation and expulsion. Thus, rock mass ratio was taken into consideration [12], but the HIo determination was not applicable for over-mature shale. As a result, the first step of their method was revised, and the method is presented in detail below.
Firstly, the original hydrogen index (HIo) was calculated by Equation (1).
HIo = (750 × S + 450 × L + 125 × V + 50 × I)/100,
where S, L, V, and I are volume percentages of sapropelinite, liptinite, vitrinite, and inertinite, respectively, on a mineral matter-free basis [11].
The TR refers to the degree of kerogen transformation due to hydrocarbon generation. Hydrogen index (HI) and original hydrogen index (HIo) can be used to determine TR using Equation (2) [37].
TR = [1200 × (HIoHI)]/[HIo × (1200 − HI)].
The expulsion efficiency, f, refers to the ratio of the hydrocarbon expulsion amount to the total hydrocarbon generation amount, which can be expressed by Equation (3).
f = 1 – [S1 × (1 − TR)]/(S2 × TR).
The definition of mass conversion factor w is the ratio of present-day rock mass to original rock mass [12]; the factor can be obtained from Equation (4).
w = 1 − 0.833 × TOC/100.
Then, TOCo is determined using Equation (5).
TOCo = TOC [1 − α × f × TR × (1 − 0.833 × TOC/100)],
where the scaling parameter α refers to the proportion of convertible carbon to total carbon, and α = HIo/1200.
Finally, organic porosity Φorg is obtained from Equation (6).
Φorg = t × (TOCo × α × f × w) × ρb/ρk,
where t stands for the carbon equivalent mass of kerogen, t = 1.2; and ρb and ρk are the bulk density of source rock and kerogen density, respectively. The type-I kerogen density is 1.45 g/cm3 [38].

3.3. Fractal Theory

A fractal dimension (D) can characterize pore geometry by evaluating complexity and irregularity of both pore surface and structure [39,40,41]. In this study, fractal dimensions can be determined using the Frenkel–Halsey–Hill (FHH) method, together with the N2 adsorption isotherm data. The FHH model can be expressed by the following equation:
ln(V/V0) = A × [ln(ln(P0/P)] + C,
where V is the volume of adsorbed gas molecules at the equilibrium pressure P, V0 is the volume of monolayer coverage, A is the power-law exponent depending on D and the mechanism of adsorption, and P0 is the saturation pressure of the gas. A is derived from the slope of linear regression equation in the plot of lnV versus ln(ln(P0/P)). The fractal dimension D derives from the two following expressions: D = A + 3 and D = 3A + 3.

4. Results

4.1. Organic Geochemistry and Petrography

Figure 2 shows that the TOC contents of the Niutitang shale samples have a wide range of 0.29% to 9.36%; the upper and lower members average 0.69% and 5.93%, respectively. Only one sample from the upper member has a TOC value of over 2.0%. The bitumen reflectance (BRo) value ranges from 1.47% to 2.56%, corresponding to vitrinite reflectance between 1.72% and 2.72% with a mean of 2.19% as calculated with the conversion equation [42]. The majority (60–84%) of the organic matter is sapropelinite, while liptinite accounts for 15–37%. The amounts of vitrinite and inertinite are quite small, 0–3% and 0–2%, respectively. Table 2 presents the calculated type index (TI) and shows that only two samples have a TI lower than 80, indicating that the Niutitang shale is dominated by type-I kerogen. This finding is consistent with previous studies [28,34].
Table 3 illustrates some of the main characteristics of the relative mineral composition obtained with X-ray diffraction (XRD) analysis. The samples mainly contain quartz, feldspar, carbonate, pyrite, and clay (illite, mixed-layer illite/smectite, and chlorite). The quartz content ranges from 20.3% to 54.5% with an average of 37.8%. The clay mineral content ranges from 8.7% to 47.1% and comprises illite (50–100%), mixed-layer illite/smectite (0–29%), and chlorite (0–31%). In eight of the 11 samples from the lower member of the Niutitang Formation, the only clay mineral is illite, revealing that the lower member entered the post-mature stage, with vitrinite reflectance >2.0% [43]. The other samples contain illite, chlorite, and mixed-layer illite/smectite, in which 10% comprises smectite layers, indicating a highly mature stage [43,44]. The relationships between thermal maturity and clay mineral type and content ensure that the equivalent vitrinite reflectance (EqVRo) values calculated by the fitting equation [42] are relatively reasonable. Furthermore, the pyrite content lies in the range of 1.3% to 13.8%; the mean pyrite contents of the upper and the lower member are 3.3% and 10.2%, respectively. Generally, pyrite forms in an anoxic environment [15]; thus, it can be taken as evidence that the lower member of Niutitang Formation had a stagnant, anoxic depositional environment [34].

4.2. Estimation of Original TOC and Organic Porosity

Table 2 presents the results of original TOC reconstruction and organic porosity estimation. The HIo ranges from 640.75 mg/gTOC to 689.5 mg/gTOC with a mean of 660.75 mg/gTOC. The TR values are over 95%, indicating that the organic matter present is approaching the end of hydrocarbon generation [3]. The low S2 values suggest that the source rock has almost no hydrocarbon generation potential (Table 4). Additionally, the high expulsion efficiency reveals that there is a minute quantity of remaining hydrocarbon. The TOCo values for the upper member are between 0.64% and 1.91% with a mean of 1.15%, and those for the lower member range from 10.66% to 18.17% and average 14.02%, significantly higher than the upper member. S2 was between 4.14 mg/g (rock) and 125.28 mg/g (rock). The parameters in Table 5 demonstrate that a considerable amount of hydrocarbon was generated and expelled during thermal maturation. Furthermore, the recovery coefficient (the ratio of TOCo to TOCpd) is between 2.02 and 2.28 with an average of 2.16. TOCo has a good positive correlation with TOCpd, indicating that all of the samples experienced similar changes in TOCo.
The organic porosity derived from TOCo is shown in Table 5. Values for the upper member range from 0.85% to 2.67% and average 1.55%, whereas those for the lower member are between 12.84% and 22.59% with a mean of 16.94%. The two members had different capacities for generating organic pores due to the marked discrepancy in TOCo between them. However, the calculated organic porosity is merely a theoretical value.

4.3. Total Porosity

The helium porosity of the Niutitang shale in the study area ranges from 0.36% to 6.93% with a mean of 2.61%. That of the upper member lies in the range of 0.36% to 2.49% with a mean of 1.01%, while that of the lower member varies from 2.26% to 6.93% with a mean of 4.36%. Figure 3a shows how porosity changes with TOC. When the TOC is lower than 1.0%, the points are scattered; when the TOC is between 1.0% and 6.0%, porosity is positively correlated with TOC; when the TOC content exceeds 6.0%, the positive trend between these two parameters becomes negative, which is consistent with the findings of some previous studies [20,24,25,45]. However, it is noteworthy that sample 47 had a TOC content of 6.86% and a porosity of 6.93%, which differs from the negative trend illustrated by Figure 3a. A possible explanation for this phenomenon is that sample 47 has a relatively high brittle mineral content, as evidenced by the well-developed fractures seen in its SEM image (Figure 3b); fractures are less developed in the other samples.

4.4. N2 Adsorption

4.4.1. N2 Adsorption–Desorption Isotherm

The nitrogen adsorption–desorption isotherms from this study are presented in Figure 4. The isotherms of all the Niutitang Formation shale samples can be classed as type IV in the International Union of Pure and Applied Chemistry (IUPAC) classification system [46,47]. These isotherms have no plateau within the high relative pressure interval and are characterized by pronounced hysteresis loops due to capillary condensation within mesopores [46]. The adsorption volume is low and rises slowly in the low relative pressure range, but the isotherms became steep in the high relative pressure interval (p/p0 > 0.9).
Although the degree of development of hysteresis loops varies, samples 7, 15, and 33 can be considered type H3 and the rest of samples type H4 (Figure 4) according to the IUPAC classification system, suggesting the existence of slit- or plate-like pores [46]. The hysteresis loops also indicate that ink-bottle pores are rare in the samples. Cylindrical pores, slit-like pores, and wedge-like pores are open pores that are conducive to gas flow, while ink-bottle pores can adsorb gas [47]. Consequently, the sorption capacity of these samples may be low.

4.4.2. Pore Structure

Values for pore structure parameters derived from the nitrogen adsorption isotherms are shown in Table 6. The Brunauer–Emmett–Teller (BET) specific surface area ranges from 5.08 m2/g to 25.31 m2/g with a mean of 16.21 m2/g. The micropore surface area computed by the t-plot method ranges from 0.96 m2/g to 7.78 m2/g with an average of 4.85 m2/g. The calculated Barrett–Joyner–Halenda (BJH) total pore volume varies between 0.013 cm3/g and 0.029 cm3/g and averages 0.019 cm3/g, while the micropore volume lies in the range 0.0004–0.0037 cm3/g with a mean of 0.0024 cm3/g. The average pore diameter varies between 6.18 nm and 12.62 nm with an average of 7.45 nm, indicating that the Niutitang Formation shale is dominated by mesopores.
Figure 5 shows all of the samples to have similar pore size distributions except for sample 7, which shows no significant peak and, thus, has a relatively uniform pore distribution. As a result, this sample exhibits the smallest BET surface area and pore volume and the largest average pore size. Other samples tend to be unimodal with a major peak in the pore size of 2–3 nm, revealing that they are dominated by mesopores. Additionally, a small but non-negligible amount of macropores are present.

4.5. Fractal Characteristics

The FHH plots for the shale samples are presented in Figure 6. The presence of two distinct linear segments in these plots at P/P0 ranges of 0–0.5 and 0.5–1 suggests that the fractal characteristics vary within those two relative pressure ranges; thus, the fractal dimensions D1 and D2 were acquired from the two linear intervals, respectively. Table 7 gives the slopes of the linear regression equations A1 and A2 and the fractal dimension values D1 and D2. By using the equation D = 3A + 3, the D1 values of samples 7 and 52 were calculated to be less than 2, which is unreasonable because the fractal dimension lies in the range 2 to 3 with increasing irregularity and complexity [39]. As a result, fractal dimensions calculated with the equation D = A + 3 are used for further analysis and discussion.
The D1 values range from 2.619 to 2.716 with an average value of 2.684, and the D2 values range from 2.680 to 2.854 with a mean of 2.813. The results illustrate that both the pore surfaces and structures of the shales are highly irregular and heterogeneous. Moreover, a good positive correlation between D1 and D2 can be observed in Figure 7, revealing that D1 and D2 were both suitable for characterizing pore structures in the Niutitang Formation shale. This finding is consistent with a previous study focusing on the Lower Silurian Longmaxi Formation shale [27]. The higher D2 values suggest that, with rising pore diameter, the pore surface of the shale becomes rougher and the pore structure more complicated.

5. Discussion

5.1. TOC Recovery

Hydrocarbon generation is a result of organic matter decomposition with increasing thermal maturity [6]; thus, original TOC decreases gradually due to the loss of the convertible part of the organic matter. As more than three-quarters of the samples entered the over-mature stage, the HI values of the LM samples dropped to below 1 mg/g (Table 4), illustrating that a large amount of hydrocarbon was generated and expelled.
In addition, 13 samples have a recovery coefficient between 2.02 and 2.28, showing little variation. However, the present-day TOC of the LM is markedly higher than that of the UM. Four LM samples with high present-day TOC had much higher TOCo, while nine UM samples with low present-day TOC (<1.0%) had relatively low TOCo. This indicates that TOC enrichment was dependent on the sedimentary environment. Previous studies characterized paleo-environments on the basis of productivity proxies and redox condition proxies [34,48,49]. For example, upwelling and hydrothermal events triggered a remarkable increase in paleo-productivity during LM deposition and showed that the redox conditions evolved from anoxic with euxinic intervals during LM deposition to oxic conditions with anoxic intervals upward [34]. In this study, mineral compositions are used to characterize the sedimentary environment. Firstly, quartz content is positively correlated with TOC in the LM samples but has a weak negative correlation with TOC in the UM samples (Figure 8). Quartz of biogenic origin has a positive correlation with TOC, whereas the correlation between terrigenous detrital origin quartz and TOC is negative [50,51]. Thus, the quartz source of the LM was dominantly authigenic, while that in the UM had both terrigenous inputs and an authigenic source. Secondly, the average pyrite contents of the UM and the LM shale are 3.4% and 10.3%, respectively. These results also indicate that the LM was deposited in a reducing environment with relatively stagnant water mass and that this transformed into an oxidizing environment upward.

5.2. Porosity and Controlling Factors

Organic matter decomposes during thermal maturation, leading to the formation of hydrocarbons and intraparticle organic pores [4], and migrated organic matter develops secondary pores as it cracks at high maturity [52]. Nanoporosity evolutionary sequence includes the formation stage (0.60% < VRo < 2.0%), the development stage (2.0% < VRo < 3.5%), and the conversion or destruction stage (VRo > 3.5%) [53]. However, no general trend between organic porosity and maturity was observed when VRo > 0.9% in the Woodford shale [14]. In this study, organoporosity was calculated with the method presented in Reference [12]. There is no obvious relationship between the calculated organoporosity and EqVRo (Figure 9). Because of the marked differences in the TOC of the two members, samples from the LM had higher organoporosity (over 10%) than those from the UM. Thus, both total porosity and organic porosity had no direct relationship with thermal maturity, and other factors like TOC content should be given more consideration when characterizing shale porosity.
Figure 3a reveals the relationship between total porosity and TOC. Total porosity is positively correlated with TOC when 1.0% < TOC < 6.0%, after which the trend changes. A similar pattern was reported in other studies; for example, there was a change in a positive correlation at TOC = 5.5% in the Marcellus shale from North America [24], TOC = 5.0% in the Qiongzhusi Formation from southern Sichuan Basin [45], and TOC = 12% in the Permian shale from eastern China [25].
The contribution of per-gram organic carbon content to total porosity can be derived from the slope of the linear regression equation in a plot of total porosity versus TOC. For samples with 1.0% < TOC < 6.0%, the TOC contribution is 0.93% (Figure 3a), which is greater than in Lower Silurian shale in southern China (0.72%) [23] and higher than in Lower Cambrian shale in the southern Sichuan Basin (0.40%) [45]. However, these values may be invalid because they are based on limited samples; further study is needed to determine the contribution made by TOC content. For samples with TOC < 1.0% and TOC > 6.0%, organic pores make less of a contribution to porosity. Figure 10 shows that the recovery coefficient and calculated organoporosity have no obvious relationship with porosity, indicating that inorganic pores are the main contributors to porosity. When TOC < 1.0%, the volume of organic pores is too small to influence the porosity. The porosity decreasing when TOC > 6.0% may be attributable to mechanical compaction [24,25]. A previous study showed that Young’s modulus values of kerogen, clay, and quartz were 10 GPa, 15–45 GPa, and 50–70 GPa, respectively [54], and an association between significant lowering of the kerogen modulus and organic pore development was illustrated. The immature kerogen modulus was 15–20 GPa, whereas kerogen in the gas window had a smaller modulus of 7–12 GPa [54]. This is one reason why fewer organic pores can be observed in the SEM images (Figure 11). Another possible explanation is that the organic matter seen in the SEM images is depositional organic matter, which mainly consists of kerogen and seldom yields pores [52]. Lastly, some micropores and fine mesopores cannot be clearly observed; thus, the insufficient magnification of the SEM images may be a factor [7].
The relationships between quartz, clay minerals, and total porosity are presented in Figure 12. Total porosity has a slight negative correlation with quartz content in the lower member but no obvious relationship with it in the Upper member. Similar findings were obtained from analysis of Devonian–Mississippian shale in western Canada, showing that total porosity had a negative correlation with biogenic quartz due to the loss of pores with a diameter of less than 10 nm [50]. Furthermore, quartz of detrital origin with angular grain boundaries is more likely to form interparticle pores, which are mainly macropores and mesopores, leading to a positive correlation between detrital quartz and total porosity [23,31].
The total porosity has a good negative correlation with clay content. Previous studies proposed that clay minerals increase total porosity [51,55]. Additionally, the lattice of randomly oriented clay mineral platelets forms a “house of cards” structure [14], contributing to the preservation of linear and triangular pores. However, for shale layers, higher clay content may weaken their capacity to resist compaction, which will cause a pronounced decrease in porosity. Clay-associated pores form with increasing clay content, but more pores, including organic pores and mineral pores, vanish during the mechanical compaction resulting from high clay content. As a result, the contribution of clay-associated pores to total porosity may be negligible [25]. Hypotheses regarding this phenomenon are preliminary and need further confirmation.

5.3. Pore Structure and Fractal Characterization

5.3.1. Factors Controlling Pore Structure

Figure 13 illustrates the relationships among the pore structure parameters of the shale samples. Specific surface area is significantly correlated with total pore volume (R2 = 0.81) and micropore volume (R2 = 0.96), which agrees with previous studies on highly mature marine shale [27,40,51,56]. Additionally, the average pore size exhibits a negative correlation with total pore volume and specific surface area (Figure 13a,b). Samples with smaller average pore diameters tend to possess more micropores and mesopores, leading to a higher pore volume and specific surface area. Micropores may be a more significant contributor to the specific surface area than are mesopores.
The relationships between shale constituents and pore structure parameters are shown in Figure 13. The slightly positive relationships between TOC content and total surface area, micropore surface area, total pore volume, and micropore volume seen in Figure 13c,d suggest that TOC is not the major contributor to these structural parameters in the samples. However, previous studies drew different conclusions, finding that specific surface area and pore volume have a significantly positive correlation with TOC content [27,40,57]. An examination of the SEM images of the samples used in those studies reveals that this correlation may be attributable to the presence of a large amount of well-preserved organic pores. Organic pores are limited in the samples considered in the current study, as seen in the SEM images, yielding a different outcome.
The moderate negative trends between quartz content and total surface area and total pore volume shown in Figure 13e,f reveal that quartz content does not exert a significant influence on pore structure in this study. Biogenetic quartz has smooth rims, which tend to form less interparticle porosity. In addition, quartz tends to provide less pore volume [58].
Specific surface area and total pore volume have a slightly negative relationship with clay content (Figure 13g,h), which is in agreement with some previous studies [25,26,58]. On the one hand, the specific surface area values of clay minerals vary considerably. For example, montmorillonite and mixed-layer illite/smectite have relatively high specific surface areas of 76.4 m2/g and 30.8 m2/g, respectively, but chlorite and illite have smaller surface areas of 11.7 m2/g and 7.1 m2/g [59]. As presented in Section 4.1, the clay content of these samples is dominated by illite (average 78%), which makes less of a contribution to the surface area. On the other hand, parts of clay-associated pores that are not protected from brittle minerals will be deformed by mechanical compaction. Thus, the specific surface area and total pore volume show little correlation with clay mineral content. To conclude, no simple relationship is seen between pore structure and shale composition in this study.

5.3.2. Characteristics and Controlling Factors of Fractal Dimension

Figure 14 shows the relationship between the fractal dimensions D1 and D2 and the constituents of the shale. Neither D1 nor D2 shows an obvious correlation with quartz content. This is because the quartz particles have smooth surfaces, resulting in a relatively smooth and regular overall surface and microstructure (Figure 14a). D1 and D2 exhibit no clear correlation with clay content (Figure 14b). The layered and flocculent structures of clay minerals increase the specific surface area of pores [58]; however, in this study, the samples have high illite content due to high thermal maturity, and the contribution is not significant. The lack of a relationship between mineral composition and fractal dimension indicates that mineral composition is not the major factor influencing fractal dimension.
Figure 14c shows a slight increase in D1 with rising TOC content and a moderately positive correlation between D2 and TOC content. Organic-rich shale tends to develop more nanopores due to kerogen decomposition during thermal maturation [3,52]. These nanopores form a complicated pore network, resulting in higher fractal dimensions [16,26]. However, limited organic pore development occurred in these samples due to their kerogen type; thus, the positive correlation between fractal dimension and TOC content is not significant in this study. In sum, the sedimentary environment and thermal maturation control the shale constituents, and no single constituent dominates the fractal characteristics.
The relationship between the fractal dimensions and the pore structure parameters is also shown in Figure 14. D1 and D2 have positive linear correlations with surface area, and D1 has a better correlation with both total surface area (Figure 14d) and micropore surface area than does D2 (Figure 14e). This is because D1 represents the surface fractal dimension, which is dependent on the pore surface area [39]. Figure 14f exhibits a good linear correlation between fractal dimension and average pore size. As previous studies illustrated, a smaller pore size will not only increase the complexity and heterogeneity of the pore structure, but will also generate a rougher surface [16,27].
Moreover, the fractal dimension shows no obvious correlation with total pore volume (Figure 14g) but a better correlation with micropore volume (Figure 14h). On the one hand, the specific surface area is well correlated with pore volume; thus, samples with a higher fractal dimension have a larger pore volume. On the other hand, micropores are the major contributors to pore structure complexity and surface roughness. Thus, the correlation of the fractal dimension with micropores will be better than with other pores. Furthermore, the observation that both D1 and D2 have a pronounced correlation with the pore structure parameters reveals that fractal dimensions can be applied to characterize pore structure.

6. Conclusions

In this paper, the TOC distribution, pore structure, and evolutionary characteristics of Niutitang Formation shales from the northern Guizhou Province in southwest China were investigated using a series of experiments, mass balance calculations, and FHH theory. The following conclusions were drawn:
(1)
The organic matter was dominated by type-I kerogen with a total organic carbon (TOC) content of 0.29–9.36%, averaging 0.69% and 5.93% in the upper and the lower members, respectively. The equivalent vitrinite reflectance (EqVRo) values ranged from 1.72% to 2.72% with a mean of 2.19%. The original TOC content values of the upper member were between 0.64% to 1.91% with a mean of 1.15%, while those of the lower member ranged from 10.66% to 18.17% and averaged 14.02%. The overall TOC recovery coefficient for the Niutitang formation was 2.16, indicating good hydrocarbon generation potential and that it is a promising exploration prospect. The sedimentary environment was shown to be the dominant factor in both present-day TOC and the original TOC distribution.
(2)
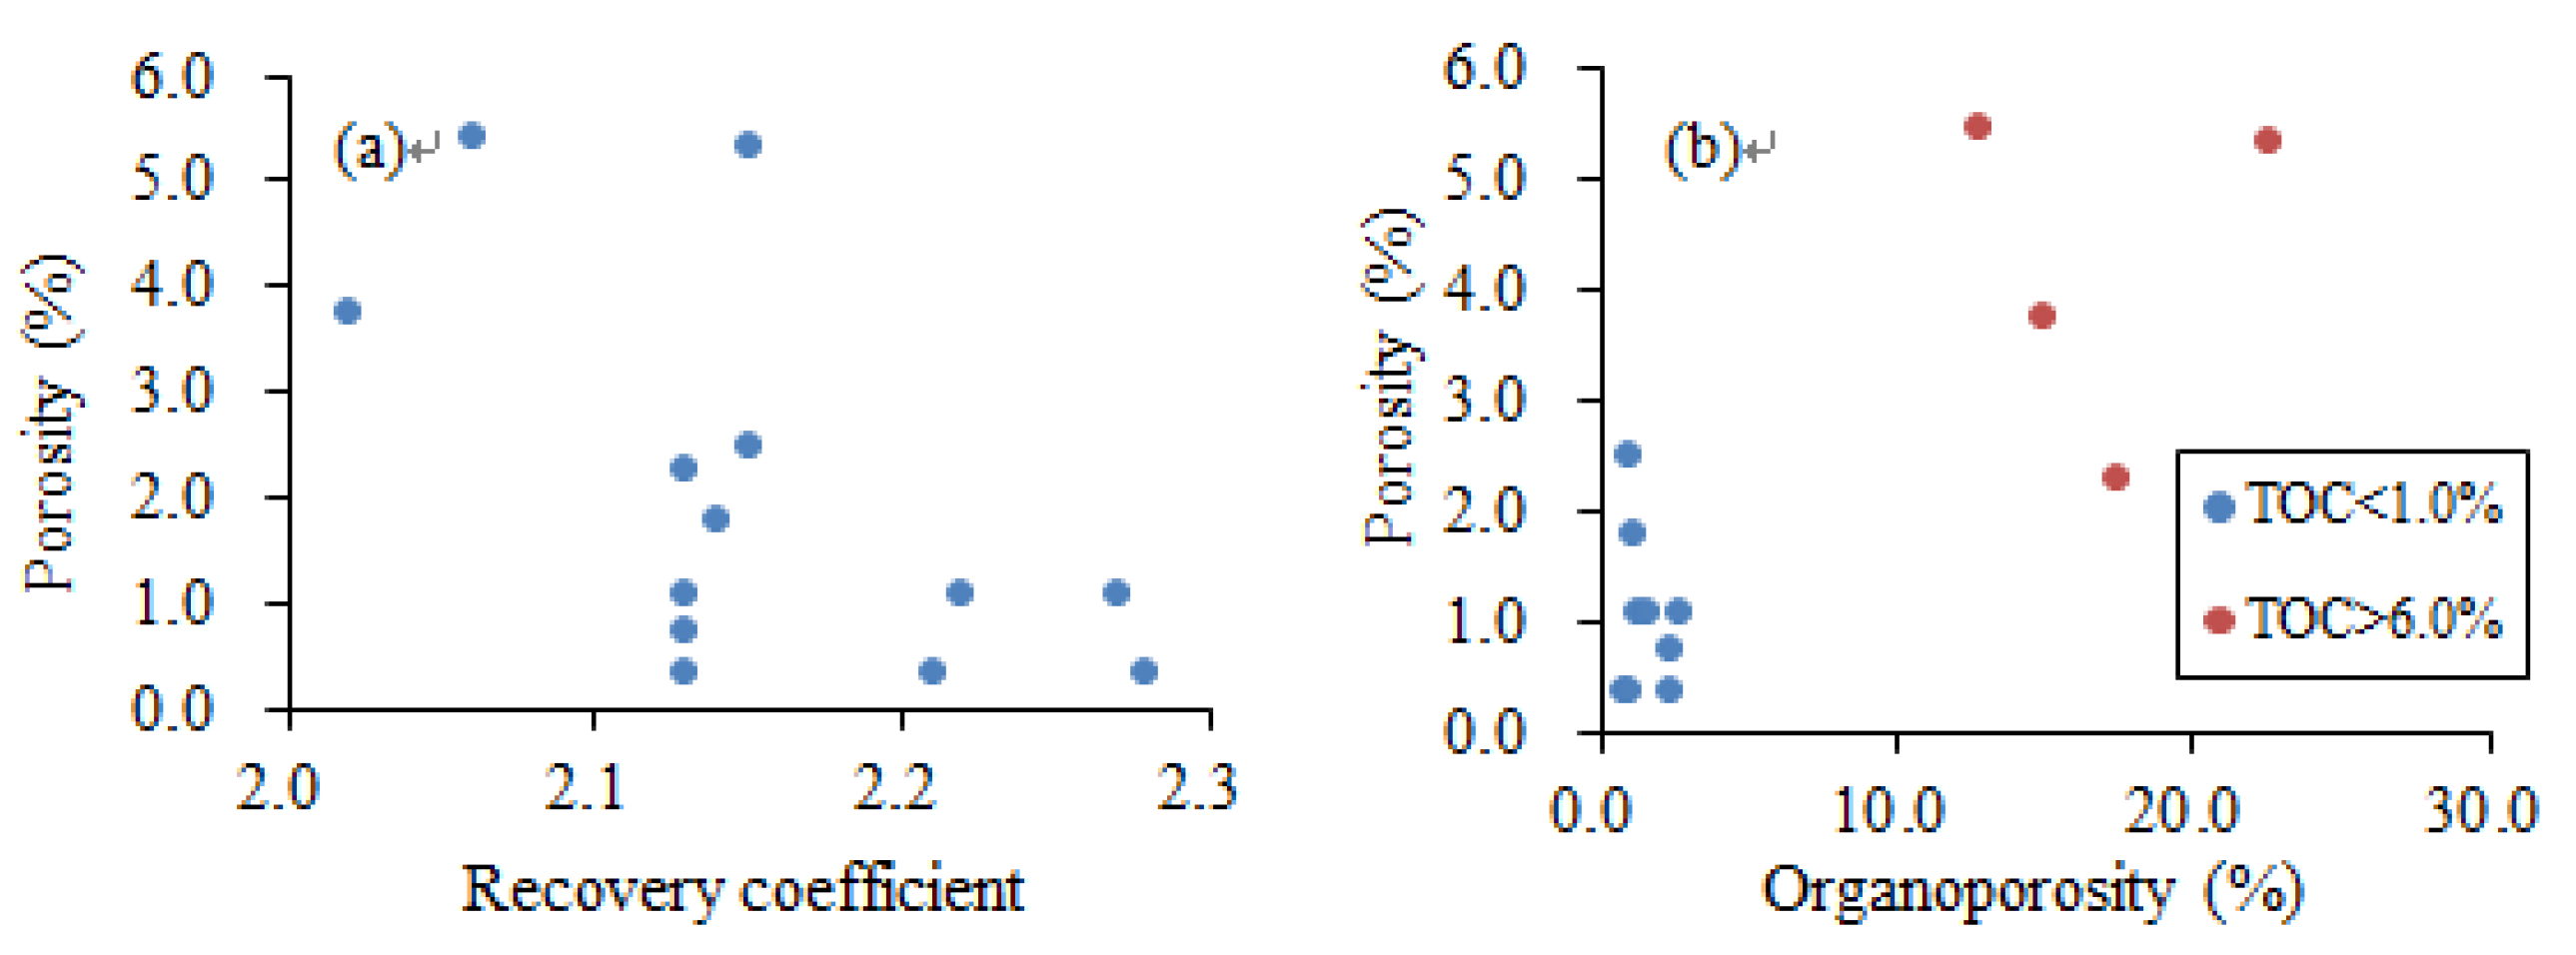
The total porosity of the Niutitang shale ranged from 0.36% to 6.93% with a mean of 2.61%. This ranged from 0.36% to 2.49% with a mean of 1.01% in samples from the upper member and 2.26% to 6.93% with a mean of 4.36% in samples from the lower member. When TOC was below 1.0%, porosity had no correlation with it; when TOC was between 1.0% and 6.0%, porosity was positively correlated with it; when TOC < 1.0% and TOC > 6.0%, porosity had no obvious correlation with it. This indicates that, when within a certain range, TOC was a significant controlling factor in porosity. The calculated organic porosity was higher than the measured total porosity, and the relationship between porosity and mineral composition was found to be indirect.
(3)
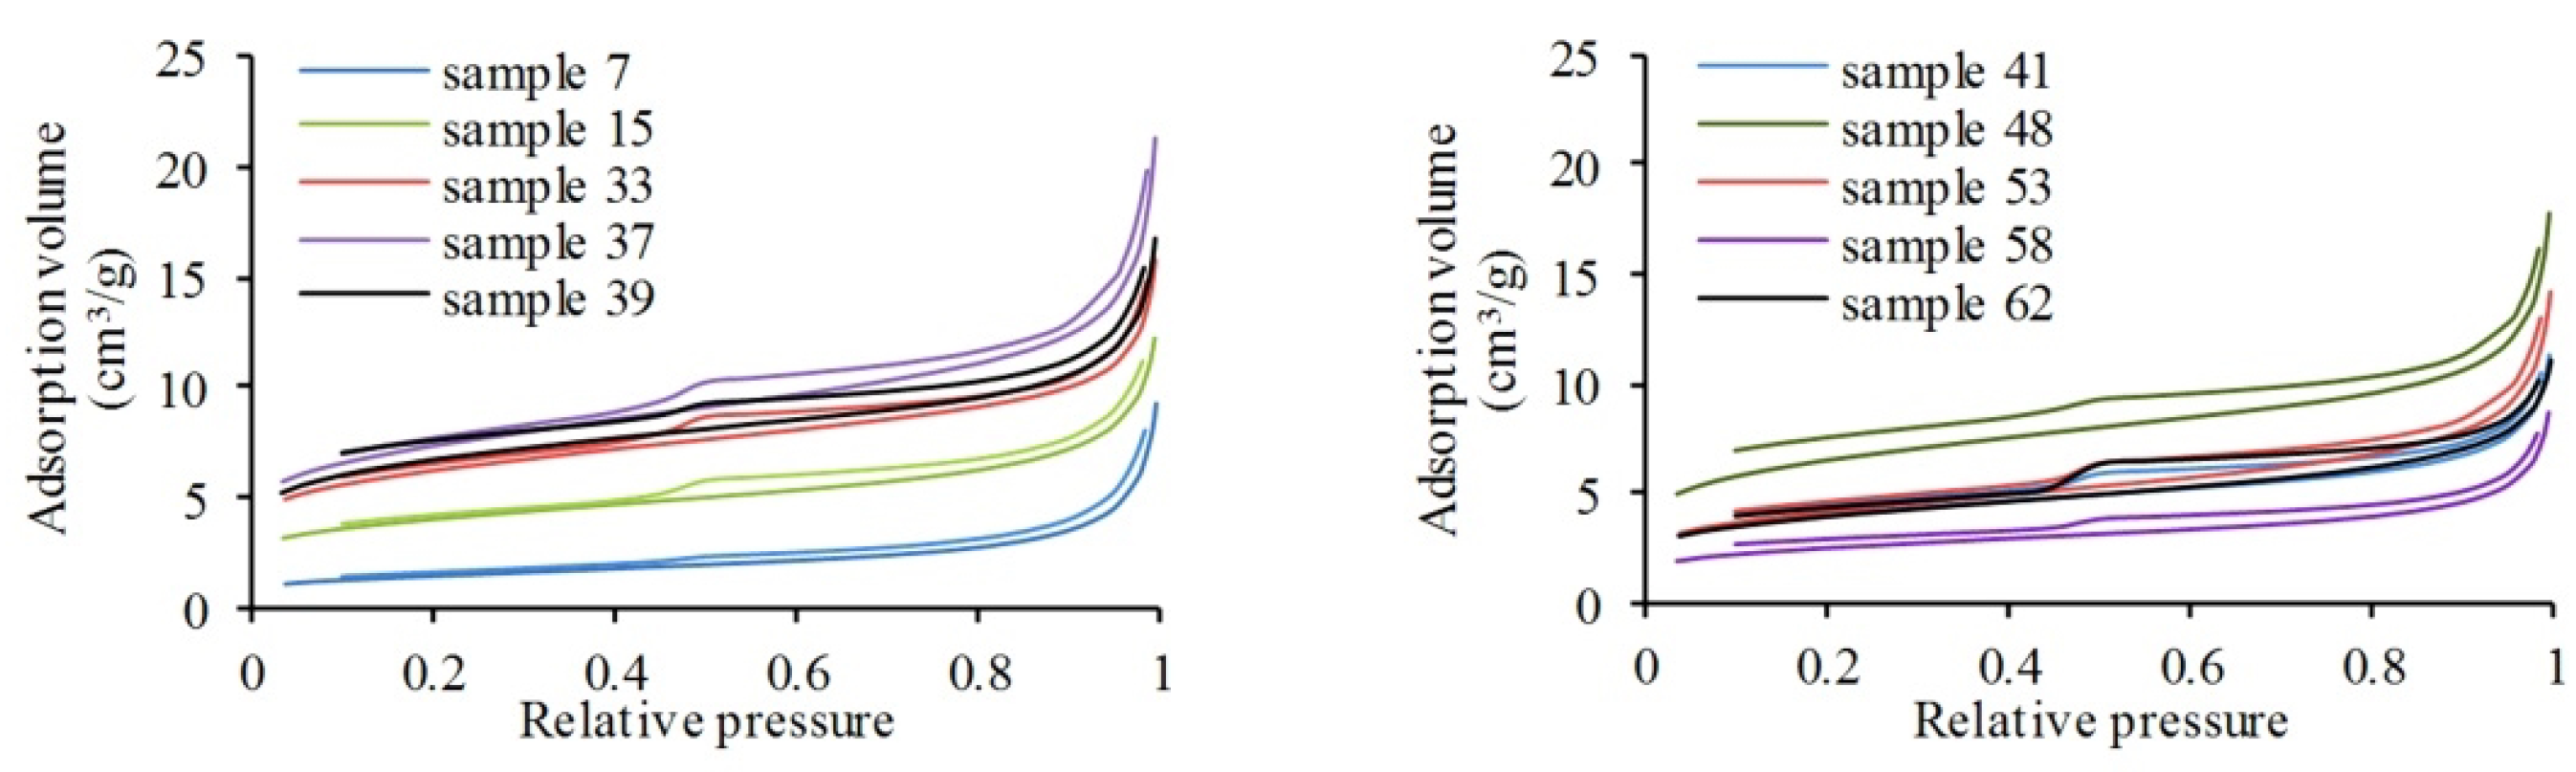
The nitrogen adsorption isotherms of all of the Niutitang Formation shale samples were type IV, with hysteresis loops identified as type H3 and type H4, suggesting the existence of slit- or plate-like pores. The BET specific surface area ranged from 5.08 m2/g to 25.31 m2/g, total pore volume from 0.013 cm3/g to 0.029 cm3/g, and average pore diameter from 6.18 nm to 12.62 nm. Pore structure parameters showed no obvious correlation with the composition of the shale.
(4)
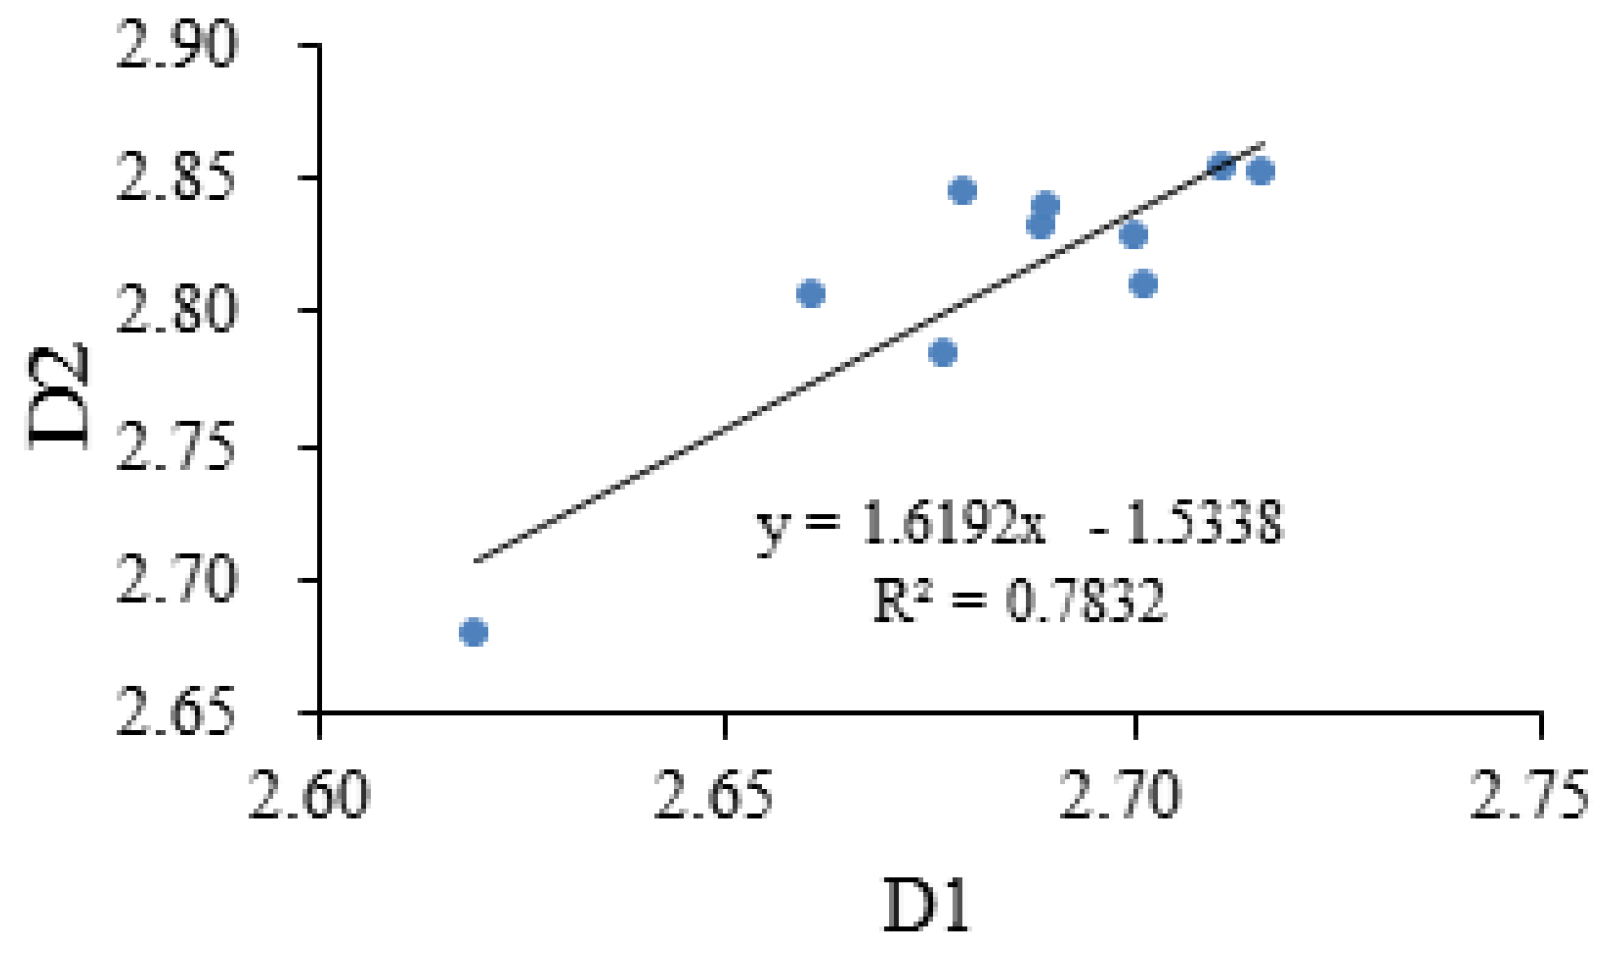
The D1 values ranged from 2.619 to 2.716, with an average value of 2.684, and the D2 values ranged from 2.680 to 2.854, with a mean of 2.813. The irregularity of both the pore surface and structure indicated good gas sorption capacity. Sedimentary environment and thermal maturation were shown to control the constituents of the shale, and no single constituent dominated its fractal characteristics.

Author Contributions

L.L. and S.T. conceived and designed the experiments; L.L. and Z.X. performed the experiments; L.L. wrote the paper; Z.X. and S.T. revised the paper.

Funding

This work was financially supported by the National Science and Technology Major Project of China (grant No. 2017ZX05035001-003).

Acknowledgments

The authors gratefully acknowledge the China National Administration of Coal Geology for sample support and their permission to publish the results of this study.

Conflicts of Interest

The authors declare no conflicts of interest.

References

  1. Jacob, H. Classification structure genesis and practical importance of natural solid oil bitumen (“migrabitumen”). Int. J. Coal Geol. 1989, 11, 65–79. [Google Scholar] [CrossRef]
  2. Ko, L.T.; Ruppel, S.C.; Loucks, R.G.; Hackley, P.C.; Zhang, T.; Shao, D. Pore-types and pore-network evolution in Upper Devonian-Lower Mississippian Woodford and Mississippian Barnett mudstones: Insights from laboratory thermal maturation and organic petrology. Int. J. Coal Geol. 2018, 190, 3–28. [Google Scholar] [CrossRef]
  3. Jarvie, D.M.; Hill, R.J.; Ruble, T.E.; Pollastro, R.M. Unconventional shale-gas systems: The Mississippian Barnett Shale of north-central Texas as one model for thermogenic shale-gas assessment. AAPG Bull. 2007, 91, 475–499. [Google Scholar] [CrossRef]
  4. Loucks, R.G.; Reed, R.M.; Ruppel, S.C.; Jarvie, D.M. Morphology, Genesis, and Distribution of Nanometer-Scale Pores in Siliceous Mudstones of the Mississippian Barnett Shale. J. Sediment. Res. 2009, 79, 848–861. [Google Scholar] [CrossRef]
  5. Curtis, J.B. Fractured shale-gas systems. AAPG Bull. 2002, 86, 1921–1938. [Google Scholar]
  6. Bowker, K.A. Barnett Shale gas production, Fort Worth Basin: Issues and discussion. AAPG Bull. 2007, 91, 523–533. [Google Scholar] [CrossRef]
  7. Jarvie, D.M. Shale Resource Systems for Oil and Gas: Part 1—Shale-gas Resource Systems, In Shale Reservoirs—Giant Resources for the 21st Century, Breyer, J.A., Ed.; AAPG: Tulsa, OK, USA, 2012; pp. 69–87. [Google Scholar]
  8. Zou, C.; Dong, D.; Wang, Y.; Li, X.; Huang, J.; Wang, S.; Guan, Q.; Zhang, C.; Wang, H.; Liu, H.; et al. Shale gas in China: Characteristics, challenges and prospects (II). Adv. Pet. Explor. Dev. 2016, 43, 182–196. [Google Scholar] [CrossRef]
  9. Tan, J.; Horsfield, B.; Mahlstedt, N.; Zhang, J.; Boreham, C.J.; Hippler, D.; van Graas, G.; Tocher, B.A. Natural gas potential of Neoproterozoic and lower Palaeozoic marine shales in the Upper Yangtze Platform, South China: Geological and organic geochemical characterization. Int. Geol. Rev. 2015, 57, 305–326. [Google Scholar] [CrossRef]
  10. Li, Q.; Pang, X.; Li, B.; Zhao, Z.; Shao, X.; Zhang, X.; Wang, Y.; Li, W. Discrimination of effective source rocks and evaluation of the hydrocarbon resource potential in Marsel, Kazakhstan. J. Pet. Sci. Eng. 2018, 160, 194–206. [Google Scholar] [CrossRef]
  11. Dang, W.; Zhang, J.; Tang, X.; Chen, Q.; Han, S.; Li, Z.; Du, X.; Wei, X.; Zhang, M.; Liu, J.; et al. Shale gas potential of Lower Permian marine-continental transitional black shales in the Southern North China Basin, central China: Characterization of organic geochemistry. J. Nat. Gas Sci. Eng. 2016, 28, 639–650. [Google Scholar] [CrossRef]
  12. Chen, Z.; Jiang, C. A revised method for organic porosity estimation in shale reservoirs using Rock-Eval data: Example from Duvernay Formation in the Western Canada Sedimentary Basin. AAPG Bull. 2016, 100, 405–422. [Google Scholar] [CrossRef]
  13. Modica, C.J.; Lapierre, S.G. Estimation of kerogen porosity in source rocks as a function of thermal transformation: Example from the Mowry Shale in the Powder River Basin of Wyoming. AAPG Bull. 2012, 96, 87–108. [Google Scholar] [CrossRef]
  14. Curtis, M.E.; Cardott, B.J.; Sondergeld, C.H.; Rai, C.S. Development of organic porosity in the Woodford Shale with increasing thermal maturity. Int. J. Coal Geol. 2012, 103, 26–31. [Google Scholar] [CrossRef]
  15. Tian, H.; Pan, L.; Zhang, T.; Xiao, X.; Meng, Z.; Huang, B. Pore characterization of organic-rich Lower Cambrian shales in Qiannan Depression of Guizhou Province, Southwestern China. Mar. Pet. Geol. 2015, 62, 28–43. [Google Scholar] [CrossRef]
  16. Gu, Y.; Ding, W.; Yin, M.; Jiao, B.; Shi, S.; Li, A.; Xiao, Z.; Wang, Z. Nanoscale pore characteristics and fractal characteristics of organic-rich shale: An example from the lower Cambrian Niutitang Formation in the Fenggang block in northern Guizhou Province, South China. Energy Explor. Exploit. 2018, 37, 273–295. [Google Scholar] [CrossRef]
  17. Bai, B.; Elgmati, M.; Zhang, H.; Wei, M. Rock characterization of Fayetteville shale gas plays. Fuel 2013, 105, 645–652. [Google Scholar] [CrossRef]
  18. Jia, Z.; Xiao, L.; Chen, Z.; Liao, G.; Zhang, Y.; Wang, Z.; Liang, C.; Guo, L. Determining shale organic porosity and total organic carbon by combining spin echo, solid echo and magic echo. Microporous Mesoporous Mater. 2018, 269, 12–16. [Google Scholar] [CrossRef]
  19. Sun, W.; Zuo, Y.; Wu, Z.; Liu, H.; Xi, S.; Shui, Y.; Wang, J.; Liu, R.; Lin, J. Fractal analysis of pores and the pore structure of the Lower Cambrian Niutitang shale in northern Guizhou province: Investigations using NMR, SEM and image analyses. Mar. Pet. Geol. 2019, 99, 416–428. [Google Scholar] [CrossRef]
  20. Wang, Y.; Huang, J.; Li, X.; Dong, D.; Wang, S.; Guan, Q. Quantitative characterization of fractures and pores in shale beds of the Lower Silurian, Longmaxi Formation, Sichuan Basin. Nat. Gas Ind. B 2015, 2, 481–488. [Google Scholar] [CrossRef]
  21. Xu, Z.; Shi, W.; Zhai, G.; Clay, C.; Zhang, X.; Peng, N. A rock physics model for characterizing the total porosity and velocity of shale: A case study in Fuling area, China. Mar. Pet. Geol. 2019, 99, 208–226. [Google Scholar] [CrossRef]
  22. Yu, H.; Wang, Z.; Rezaee, R.; Zhang, Y.; Han, T.; Arif, M.; Johnson, L. Porosity estimation in kerogen-bearing shale gas reservoirs. J. Nat. Gas Sci. Eng. 2018, 52, 575–581. [Google Scholar] [CrossRef]
  23. Tian, H.; Pan, L.; Xiao, X.; Wilkins, R.W.T.; Meng, Z.; Huang, B. A preliminary study on the pore characterization of Lower Silurian black shales in the Chuandong Thrust Fold Belt, southwestern China using low pressure N2 adsorption and FE-SEM methods. Mar. Pet. Geol. 2013, 48, 8–19. [Google Scholar] [CrossRef]
  24. Milliken, K.L.; Rudnicki, M.; Awwiller, D.N.; Zhang, T. Organic matter-hosted pore system, Marcellus Formation (Devonian), Pennsylvania. AAPG Bull. 2013, 97, 177–200. [Google Scholar] [CrossRef]
  25. Pan, L.; Xiao, X.; Tian, H.; Zhou, Q.; Chen, J.; Li, T.; Wei, Q. A preliminary study on the characterization and controlling factors of porosity and pore structure of the Permian shales in Lower Yangtze region, Eastern China. Int. J. Coal Geol. 2015, 146, 68–78. [Google Scholar] [CrossRef]
  26. Yang, R.; He, S.; Yi, J.; Hu, Q. Nano-scale pore structure and fractal dimension of organic-rich Wufeng-Longmaxi shale from Jiaoshiba area, Sichuan Basin: Investigations using FE-SEM, gas adsorption and helium pycnometry. Mar. Pet. Geol. 2016, 70, 27–45. [Google Scholar] [CrossRef]
  27. Shao, X.; Pang, X.; Li, Q.; Wang, P.; Chen, D.; Shen, W.; Zhao, Z. Pore structure and fractal characteristics of organic-rich shales: A case study of the lower Silurian Longmaxi shales in the Sichuan Basin, SW China. Mar. Pet. Geol. 2017, 80, 192–202. [Google Scholar] [CrossRef]
  28. Han, S.; Zhang, J.; Li, Y.; Horsfield, B.; Tang, X.; Jiang, W.; Chen, Q. Evaluation of Lower Cambrian Shale in Northern Guizhou Province, South China: Implications for Shale Gas Potential. Energy Fuels 2013, 27, 2933–2941. [Google Scholar] [CrossRef]
  29. Zhang, J.; Fan, T.; Li, J.; Zhang, J.; Li, Y.; Wu, Y.; Xiong, W. Characterization of the Lower Cambrian Shale in the Northwestern Guizhou Province, South China: Implications for Shale-Gas Potential. Energy Fuels 2015, 29, 6383–6393. [Google Scholar] [CrossRef]
  30. Li, T.; Tian, H.; Xiao, X.; Cheng, P.; Zhou, Q.; Wei, Q. Geochemical characterization and methane adsorption capacity of overmature organic-rich Lower Cambrian shales in northeast Guizhou region, southwest China. Mar. Pet. Geol. 2017, 86, 858–873. [Google Scholar] [CrossRef]
  31. Wu, Z.; Zuo, Y.; Wang, S.; Chen, J.; Wang, A.; Liu, L.; Xu, Y.; Sunwen, J.; Cao, J.; Yu, M.; et al. Numerical study of multi-period palaeotectonic stress fields in Lower Cambrian shale reservoirs and the prediction of fractures distribution: A case study of the Niutitang Formation in Feng’gang No. 3 block, South China. Mar. Pet. Geol. 2017, 80, 369–381. [Google Scholar] [CrossRef]
  32. Li, X.; Jiang, Z.; Wang, P.; Song, Y.; Li, Z.; Tang, X.; Li, T.; Zhai, G.; Bao, S.; Xu, C.; et al. Porosity-preserving mechanisms of marine shale in Lower Cambrian of Sichuan Basin, South China. J. Nat. Gas Sci. Eng. 2018, 55, 191–205. [Google Scholar] [CrossRef]
  33. Wang, R.; Gu, Y.; Ding, W.; Gong, D.; Yin, S.; Wang, X.; Zhou, X.; Li, A.; Xiao, Z.; Cui, Z. Characteristics and dominant controlling factors of organic-rich marine shales with high thermal maturity: A case study of the Lower Cambrian Niutitang Formation in the Cen’gong block, southern China. J. Nat. Gas Sci. Eng. 2016, 33, 81–96. [Google Scholar] [CrossRef]
  34. Li, J.; Tang, S.; Zhang, S.; Xi, Z.; Yang, N.; Yang, G.; Li, L.; Li, Y. Paleo-environmental conditions of the Early Cambrian Niutitang Formation in the Fenggang area, the southwestern margin of the Yangtze Platform, southern China: Evidence from major elements, trace elements and other proxies. J. Asian Earth Sci. 2018, 159, 81–97. [Google Scholar] [CrossRef]
  35. Tan, J.; Horsfield, B.; Mahlstedt, N.; Zhang, J.; di Primio, R.; Vu, T.A.T.; Boreham, C.J.; van Graas, G.; Tocher, B.A. Physical properties of petroleum formed during maturation of Lower Cambrian shale in the upper Yangtze Platform, South China, as inferred from PhaseKinetics modelling. Mar. Pet. Geol. 2013, 48, 47–56. [Google Scholar] [CrossRef]
  36. Xi, Z.; Tang, S.; Wang, J.; Yi, J.; Guo, Y.; Wang, K. Pore Structure and Fractal Characteristics of Niutitang Shale from China. Minerals 2018, 8, 163. [Google Scholar] [CrossRef]
  37. Dahl, H.J.A.B. Quantitative hydrocarbon potential mapping and and organofacies study in the Greater Balder Area, Norwegian North Sea. In Proceedings of the 6th Petroleum Geology Conference; Dore, A.G., Vining, B.A., Eds.; Petroleum Geology: London, UK, 2005; pp. 1317–1329. [Google Scholar]
  38. Rahman, R.R.F.K.A.M. Specific gravity as a kerogen type and maturation indicator with special reference to amorphous kerogens. J. Pet. Geol. 1983, 6, 179–194. [Google Scholar]
  39. Yao, Y.; Liu, D.; Tang, D.; Tang, S.; Huang, W. Fractal characterization of adsorption-pores of coals from North China: An investigation on CH4 adsorption capacity of coals. Int. J. Coal Geol. 2008, 73, 27–42. [Google Scholar] [CrossRef]
  40. Yang, F.; Ning, Z.; Liu, H. Fractal characteristics of shales from a shale gas reservoir in the Sichuan Basin, China. Fuel 2014, 115, 378–384. [Google Scholar] [CrossRef]
  41. Bu, H.; Ju, Y.; Tan, J.; Wang, G.; Li, X. Fractal characteristics of pores in non-marine shales from the Huainan coalfield, eastern China. J. Nat. Gas Sci. Eng. 2015, 24, 166–177. [Google Scholar] [CrossRef]
  42. Charles, R.; Landis, J.R.C. Maturation and bulk chemical properties of a suite of solid hydrocarbons. Org. Geochem. 1995, 22, 137–149. [Google Scholar]
  43. Dellisanti, F.; Pini, G.A.; Baudin, F. Use of T max as a thermal maturity indicator in orogenic successions and comparison with clay mineral evolution. Clay Miner. 2018, 45, 115–130. [Google Scholar] [CrossRef]
  44. Ola, P.S.; Aidi, A.K.; Bankole, O.M. Clay mineral diagenesis and source rock assessment in the Bornu Basin, Nigeria: Implications for thermal maturity and source rock potential. Mar. Pet. Geol. 2018, 89, 653–664. [Google Scholar] [CrossRef]
  45. Wang, F.; Guan, J.; Feng, W.; Bao, L. Evolution of overmature marine shale porosity and implication to the free gas volume. Pet. Explor. Dev. 2013, 40, 819–824. [Google Scholar] [CrossRef]
  46. Sing, K.S.W. Reporting physisorption data for gassolid systems with special reference to the determination of surface area and porosity. Pure Appl. Chem. 1985, 57, 603–619. [Google Scholar] [CrossRef]
  47. Labani, M.M.; Rezaee, R.; Saeedi, A.; Hinai, A.A. Evaluation of pore size spectrum of gas shale reservoirs using low pressure nitrogen adsorption, gas expansion and mercury porosimetry: A case study from the Perth and Canning Basins, Western Australia. J. Pet. Sci. Eng. 2013, 112, 7–16. [Google Scholar] [CrossRef]
  48. Liu, J.; Yao, Y.; Elsworth, D.; Pan, Z.; Sun, X.; Ao, W. Sedimentary characteristics of the Lower Cambrian Niutitang shale in the southeast margin of Sichuan Basin, China. J. Nat. Gas Sci. Eng. 2016, 36, 1140–1150. [Google Scholar] [CrossRef]
  49. Zhang, J.; Fan, T.; Algeo, T.J.; Li, Y.; Zhang, J. Paleo-marine environments of the Early Cambrian Yangtze Platform. Palaeogeogr. Palaeoclimatol. Palaeoecol. 2016, 443, 66–79. [Google Scholar] [CrossRef]
  50. Bustin, R.M.; Cui, X.; Ross, D.J.K.; Murthy Pathi, V.S. Impact of shale properties on pore structure and storage characteristics. In Proceedings of the SPE Shale Gas Production Conference, Fort Worth, TX, USA, 16–18 November 2008; pp. 1–28. [Google Scholar]
  51. Chalmers, G.R.L.; Ross, D.J.K.; Bustin, R.M. Geological controls on matrix permeability of Devonian Gas Shales in the Horn River and Liard basins, northeastern British Columbia, Canada. Int. J. Coal Geol. 2012, 103, 120–131. [Google Scholar] [CrossRef]
  52. Robert, G.; Loucks, R.M.R. Scanning-Electron-Microscope petrographic evidence for distinguishing organic-matter pores associated with depositional organic matter versus migrated organic matter. GCAGS J. 2014, 3, 51–60. [Google Scholar]
  53. Chen, J.; Xiao, X. Evolution of nanoporosity in organic-rich shales during thermal maturation. Fuel 2014, 129, 173–181. [Google Scholar] [CrossRef]
  54. Zargari, S. Effect of Thermal Maturity on Nanomechanical Properties and Porosity in Organic Rich Shales (a Bakken Shale Case Study). Ph.D. Thesis, Colorado School of Mines, Ann Arbor, MI, USA, 2015. [Google Scholar]
  55. Mastalerz, M.; Schimmelmann, A.; Drobniak, A.; Chen, Y. Porosity of Devonian and Mississippian New Albany Shale across a maturation gradient: Insights from organic petrology, gas adsorption, and mercury intrusion. AAPG Bull. 2013, 97, 1621–1643. [Google Scholar] [CrossRef]
  56. Xi, Z.; Tang, S.; Li, J.; Zhang, Z.; Xiao, H. Pore characterization and the controls of organic matter and quartz on pore structure: Case study of the Niutitang Formation of northern Guizhou Province, South China. J. Nat. Gas Sci. Eng. 2019, 61, 18–31. [Google Scholar] [CrossRef]
  57. Gu, Y.; Wan, Q.; Qin, Z.; Luo, T.; Li, S.; Fu, Y.; Yu, Z. Nanoscale Pore Characteristics and Influential Factors of Niutitang Formation Shale Reservoir in Guizhou Province. J. Nanosci. Nanotechnol. 2017, 17, 6178–6189. [Google Scholar] [CrossRef]
  58. Li, A.; Ding, W.; He, J.; Dai, P.; Yin, S.; Xie, F. Investigation of pore structure and fractal characteristics of organic-rich shale reservoirs: A case study of Lower Cambrian Qiongzhusi formation in Malong block of eastern Yunnan Province, South China. Mar. Pet. Geol. 2016, 70, 46–57. [Google Scholar] [CrossRef]
  59. Ji, L.; Zhang, T.; Milliken, K.L.; Qu, J.; Zhang, X. Experimental investigation of main controls to methane adsorption in clay-rich rocks. Appl. Geochem. 2012, 27, 2533–2545. [Google Scholar] [CrossRef]
Figure 1. (a) Location of Guizhou Province; (b) location of Northern Guizhou area; (c) location of the study area and well location (Modified from Reference [34]).
Energies 12 01480 g001
Figure 2. Lithological profile and total organic carbon (TOC) content of well YX1 section.
Energies 12 01480 g002
Figure 3. Relationship between total porosity and TOC content (a) and SEM image of sample 47 (b). In Figure 3a, red dots represent samples with TOC values over 6.0%, green dots represent samples with TOC values between 1.0% and 6.0%, and blue dots represent samples with TOC values below 1.0%.
Energies 12 01480 g003
Figure 4. Nitrogen adsorption–desorption isotherms.
Energies 12 01480 g004
Figure 5. Pore width distribution of samples.
Energies 12 01480 g005
Figure 6. Plots of lnV vs. ln(ln(P0/P)) obtained from the N2 adsorption isotherms of two typical shale samples: (a) sample 7 and (b) sample 15. In Figure 6a,b, red dots indicate the P/P0 range of 0.5–1, and blue dots indicate the P/P0 range of 0–0.5.
Energies 12 01480 g006
Figure 7. Relationship between D1 and D2.
Energies 12 01480 g007
Figure 8. Relationship between TOC and quartz content.
Energies 12 01480 g008
Figure 9. Relationship between total porosity and equivalent vitrinite reflectance (EqVRo).
Energies 12 01480 g009
Figure 10. (a) Relationship between porosity and recovery coefficient; (b) relationship between porosity and organoporosity.
Energies 12 01480 g010
Figure 11. (a) Organic pores in sample 5; (b) Organic matter in sample 59.
Energies 12 01480 g011
Figure 12. Effects of mineral composition on total porosity: (a) quartz; (b) clay minerals.
Energies 12 01480 g012
Figure 13. Relationship among structure parameters (a,b) and effects of shale composition on structure parameters (c–h); in (b) and (e–h), specific surface area (SSA) refers to total SSA, pore volume (PV) refers to total PV.
Energies 12 01480 g013aEnergies 12 01480 g013b
Figure 14. Relationship between fractal dimensions and shale composition (a–c) and relationship between fractal dimensions and structure parameters (d–h).
Energies 12 01480 g014
Table 1. Experiments and measurements conducted on samples.
Sample No.Depth(m)Organic GeochemistryMineralogyMicroscopyPetrophysics
TOCBRo MCREXRDSEMNAPorosity
11921.65
21924.32
31927.22
41930.09
51933.27
61936.30
71939.32
81939.94
91943.16
101946.58
111949.36
121951.14
131954.38
141957.38
151959.00
161959.52
171960.30
181963.92
191966.73
201969.61
211971.14
221974.76
231977.42
241980.36
251981.65
261983.20
271985.65
281989.96
291991.39
301993.35
311995.31
321996.57
331996.75
341998.56
351999.31
362000.81
372002.05
382003.02
392004.65
402005.64
412006.20
422007.20
432008.57
442010.33
452012.37
462013.73
472014.53
482014.80
492016.80
502017.21
512019.31
522021.43
532021.50
542022.38
552023.15
562023.98
572024.13
582025.90
592026.19
602028.36
612029.86
622030.00
Note: TOC: total organic carbon content; BRo: bitumen reflectance values; MC: maceral composition; RE: Rock-Eval tests; XRD: X-ray diffraction; SEM: scanning electron microscopy; NA: nitrogen adsorption; Porosity: helium porosity.
Table 2. Sample thermal maturity and maceral.
Sample IDDepthBRoEqVRoSLVITITypeHIo
m%%%%%%mgHC/gTOC
11921.651.521.77 71252280I627.50
31927.221.471.72 76211283.75I653.75
51933.271.882.10 ///////
81939.941.531.78 70272181I649.50
101946.58//69282180.5I637.50
121951.142.342.52 80181187.25I682.75
161959.521.882.10 66321180.25I640.75
181963.921.962.17 72271084.75I662.75
191966.732.562.72 60372176II1619.50
211971.142.062.27 ///////
231977.421.842.06 76202282.5I603.50
271985.652.472.64 68292180I640.50
291991.391.721.95 78202086.5I677.50
301993.35//76221185.25I670.75
321996.571.962.17 80172186I679.50
351999.312.192.39 ///////
382003.02//76212184I667.50
422007.21.681.92 66321180.25I634.25
442010.331.741.97 77211185.75I673.75
472014.532.00 2.21 76231086.75I674.75
502017.211.862.08 82162088.5I689.50
522021.432.432.61 71262181.5I652.50
562023.981.751.98 84151090.75I698.75
592026.192.332.51 70263179.75II1646.25
612029.862.412.59 76222085.5I671.50
Note: ID = identifier; BRo = bitumen reflectance; EqVRo = equivalent vitrinite reflectance, EqVRo = 1.09 × BRo − 0.41; S = sapropelinite, L = liptinite, V = vitrinite, I = inertinite, TI = type index, TI = 100 × %S + 50 × %L − 75 × %V − 100 × % I, and TI > 80, 80 > TI > 0, and TI < 0 indicate Type I, Type II, and Type III, respectively. HIo = original HI.
Table 3. Mineralogical composition of the shale samples.
SampleDepthQFCalDolPyCI/SItChI/S Ratio
IDm%Relative Percent (%)
11921.65 37.9 9.62.1 /1.7 47.1 /7327/
31927.22 38.4 9.62.8 /3.1 44.1 17612210
51933.27 40.2 10.4//2.7 46.7 /6931/
71939.32 41.0 9.42.7/1.3 45.6 nnnn
81939.94 39.4 9.72.6 /1.3 47.0 /7327/
101946.58 37.8 13.13.7 /2.8 40.8 /7129/
121951.14 39.4 9.61.5 /2.9 46.6 /6931/
151959.00 37.4 102.4 03.8 46.4 nnnn
161959.52 39.7 9.42.3 /2.6 44.5 12602810
181963.92 38.3 9.42.0 /3.9 44.0 22552310
191966.73 36.1 9.69.6 2.1 3.0 39.7 17572610
211971.14 37.1 9.51.1 /4.2 44.6 10642610
231977.42 36.9 10.40.9 /2.5 46.1 24502610
271985.65 33.7 10.2/17.5 8.6 29.9 2668610
291991.39 33.2 13.4/11.6 5.0 36.8 2377/10
331996.75 30.3 17.61.4 14.9 9.0 26.7 2269910
351999.31 32.6 16.12.8 12.0 12.3 24.2 /100//
372002.05 33.8 15.41.8 15.5 12.4 21.1 nnnn
382003.02 27.1 17.49.9 13.3 12.3 20.0 /100//
392004.65 29.4 16.23.1 15.8 12.0 22.6 nnnn
422007.20 36.4 12.35.0 6.1 13.8 21.9 /100//
442010.33 54.5 12.5/5.1 8.4 18.2 /100//
472014.53 36.3 16.11.0 26.9 8.4 10.3 /100//
482014.80 58.7 16.81.2 2.4 9.0 11.9 nnnn
502017.21 43.2 23.2/9.3 10.3 14.0 /100//
532021.50 20.3 9.22.1 51.1 7.9 8.7 /100//
562023.98 42.0 16.68.1 3.8 8.5 21.0 2971/10
582025.90 52.6 15.90.7 2.7 8.3 19.8 nnnn
592026.19 52.3 16.3/5.7 7.8 18.0 /100//
612029.86 29.8 8.86.7 26.1 11.4 15.5 496/10
622030.00 33.1 8.55.7 23.5 12.2 15.4 nnnn
Note: Q = quartz, F = feldspar, Cal = calcite, Dol = dolomite, Py = pyrite, C = clay minerals, I/S = illite/smectite mixed layer, It = illite, Ch = chlorite, n = no available data, “/” = not detected.
Table 4. Rock-Eval data and HI of samples.
Sample DepthTmaxS1S2S3HI
IDm°Cmg/gmg/gmg/gmgHC/gTOC
11921.654420.01 0.06 0.46 13.33
31927.224360.04 0.46 0.62 53.49
51933.275930.01 0.01 0.57 2.78
81939.944450.01 0.01 0.29 3.03
101946.585970.01 0.01 0.43 3.33
121951.146000.01 0.02 0.31 6.90
161959.525730.01 0.01 0.42 2.70
181963.924260.01 0.01 0.50 1.30
191966.73364<0.010.01 0.40 2.04
211971.14600<0.010.02 0.38 1.75
231977.425240.01 0.02 0.47 4.00
271985.65512<0.010.02 0.46 5.00
291991.395300.01 0.02 0.46 2.38
301993.35/////
321996.57536<0.010.01 0.76 0.25
351999.315140.01 0.02 0.50 0.58
382003.02523<0.010.01 0.80 0.17
422007.2309<0.010.01 0.61 0.17
442010.335720.01 0.01 0.65 0.16
472014.53555<0.010.01 0.58 0.15
502017.215410.01 0.02 0.60 0.30
522021.435860.01 0.01 1.21 0.12
562023.98524<0.010.01 0.93 0.17
592026.19581<0.010.01 0.81 0.13
612029.866000.01 0.01 1.02 0.19
Note: Tmax: maturity parameter based on the temperature at which the maximum amount of pyrolyzate (S2) is generated from the kerogen in a rock sample; S1: free hydrocarbons present in the rock (mg HC/g of rock); S2: remaining generation potential (mg HC/g of rock); S3: oxidizable carbon, (mg CO2/g rock); HI: hydrogen index.
Table 5. TOCo calculation, total porosity, and organic porosity estimation.
SampleDepthTRαfρgρbTOCTOCoΦorgΦ
IDmg/cm3%
11921.650.990 0.540 0.998 2.82 2.79 0.45 0.93 1.28 1.07
31927.220.963 0.556 0.997 2.80 2.78 0.86 1.78 2.41 0.72
81939.940.998 0.541 0.998 2.82 2.75 0.33 0.71 0.94 2.49
101946.580.998 0.539 0.998 2.78 2.77 0.30 0.63 0.85 0.36
121951.140.996 0.569 0.998 2.79 2.78 0.29 0.66 0.93 0.36
161959.520.998 0.534 0.998 2.82 2.77 0.37 0.79 1.04 1.77
181963.920.999 0.552 0.999 2.78 2.77 0.77 1.70 2.31 0.36
231977.420.997 0.553 0.999 2.81 2.78 0.50 1.00 1.52 1.07
291991.390.999 0.565 0.999 2.82 2.79 0.84 1.91 2.67 1.07
442010.330.999 0.534 0.999 2.63 2.53 6.44 12.88 14.90 3.75
502017.210.999 0.562 0.9992.64 2.58 6.67 14.22 17.44 2.26
522021.430.999 0.575 0.9992.75 2.60 8.47 18.17 22.59 5.32
612029.860.999 0.539 0.9992.76 2.61 5.17 10.66 12.84 5.43
Note: TR = transformation ratio, α = scaling parameter, f = expulsion efficiency, ρg = grain density, ρb = bulk density, Φorg = organic porosity, Φ = total porosity.
Table 6. Pore structure parameters for shale samples. BET—Brunauer–Emmett–Teller.
Sample IDDepthBET Surface AreaMicropore AreaPore VolumeMicropore VolumeAverage Pore Width
mm2/gm2/gcm3/gcm3/gnm
71939.325.08450.96530.0142610.00043612.6157
151959.0013.84644.45820.01710.0021037.3046
321996.7521.40447.21420.0211440.0034056.1846
362002.0525.31488.0550.029470.003797.0011
382004.6523.10187.77560.0221710.0036716.2249
402005.6413.88114.07630.0157340.0019036.7046
472014.8022.57016.5070.0245690.0030366.4965
522021.4314.54053.45140.0207490.001597.5187
572025.908.71112.34490.0125450.0010918.036
612030.0013.67463.69780.0156420.0017246.3833
Table 7. Fractal dimensions of pores obtained from N2 adsorption of the shale samples.
SampleDepthP/P0: 0–0.5P/P0: 0.5–1
ID(m)R2A1D1R2A2D2
A + 33A + 3 A + 33A + 3
71939.32 0.9998−0.3812.6191.8580.9971−0.3202.6802.039
151959.00 0.9972−0.2992.7012.1040.9996−0.1912.8092.427
331996.75 0.9946−0.2892.7112.1330.9983−0.1462.8542.563
372002.05 0.9951−0.3002.7002.1000.9979−0.1732.8282.483
392004.65 0.9881−0.2842.7162.1470.9984−0.1492.8512.553
412006.20 0.9912−0.3112.6892.0660.9994−0.1692.8312.492
482014.80 0.9890−0.3112.6892.0680.9973−0.1622.8382.515
532021.50 0.9957−0.3392.6611.9820.9983−0.1952.8052.416
582025.90 0.9937−0.3232.6772.0300.9990−0.2152.7852.354
622030.00 0.9952−0.3212.6792.0380.9906−0.1562.8442.533

