Experimental Investigation of Power Signatures for Cavitation and Water Hammer in an Industrial Parallel Pumping System


 ,
,  ,
,  and
and
Abstract
:1. Introduction
2. The Cascade Pumping System
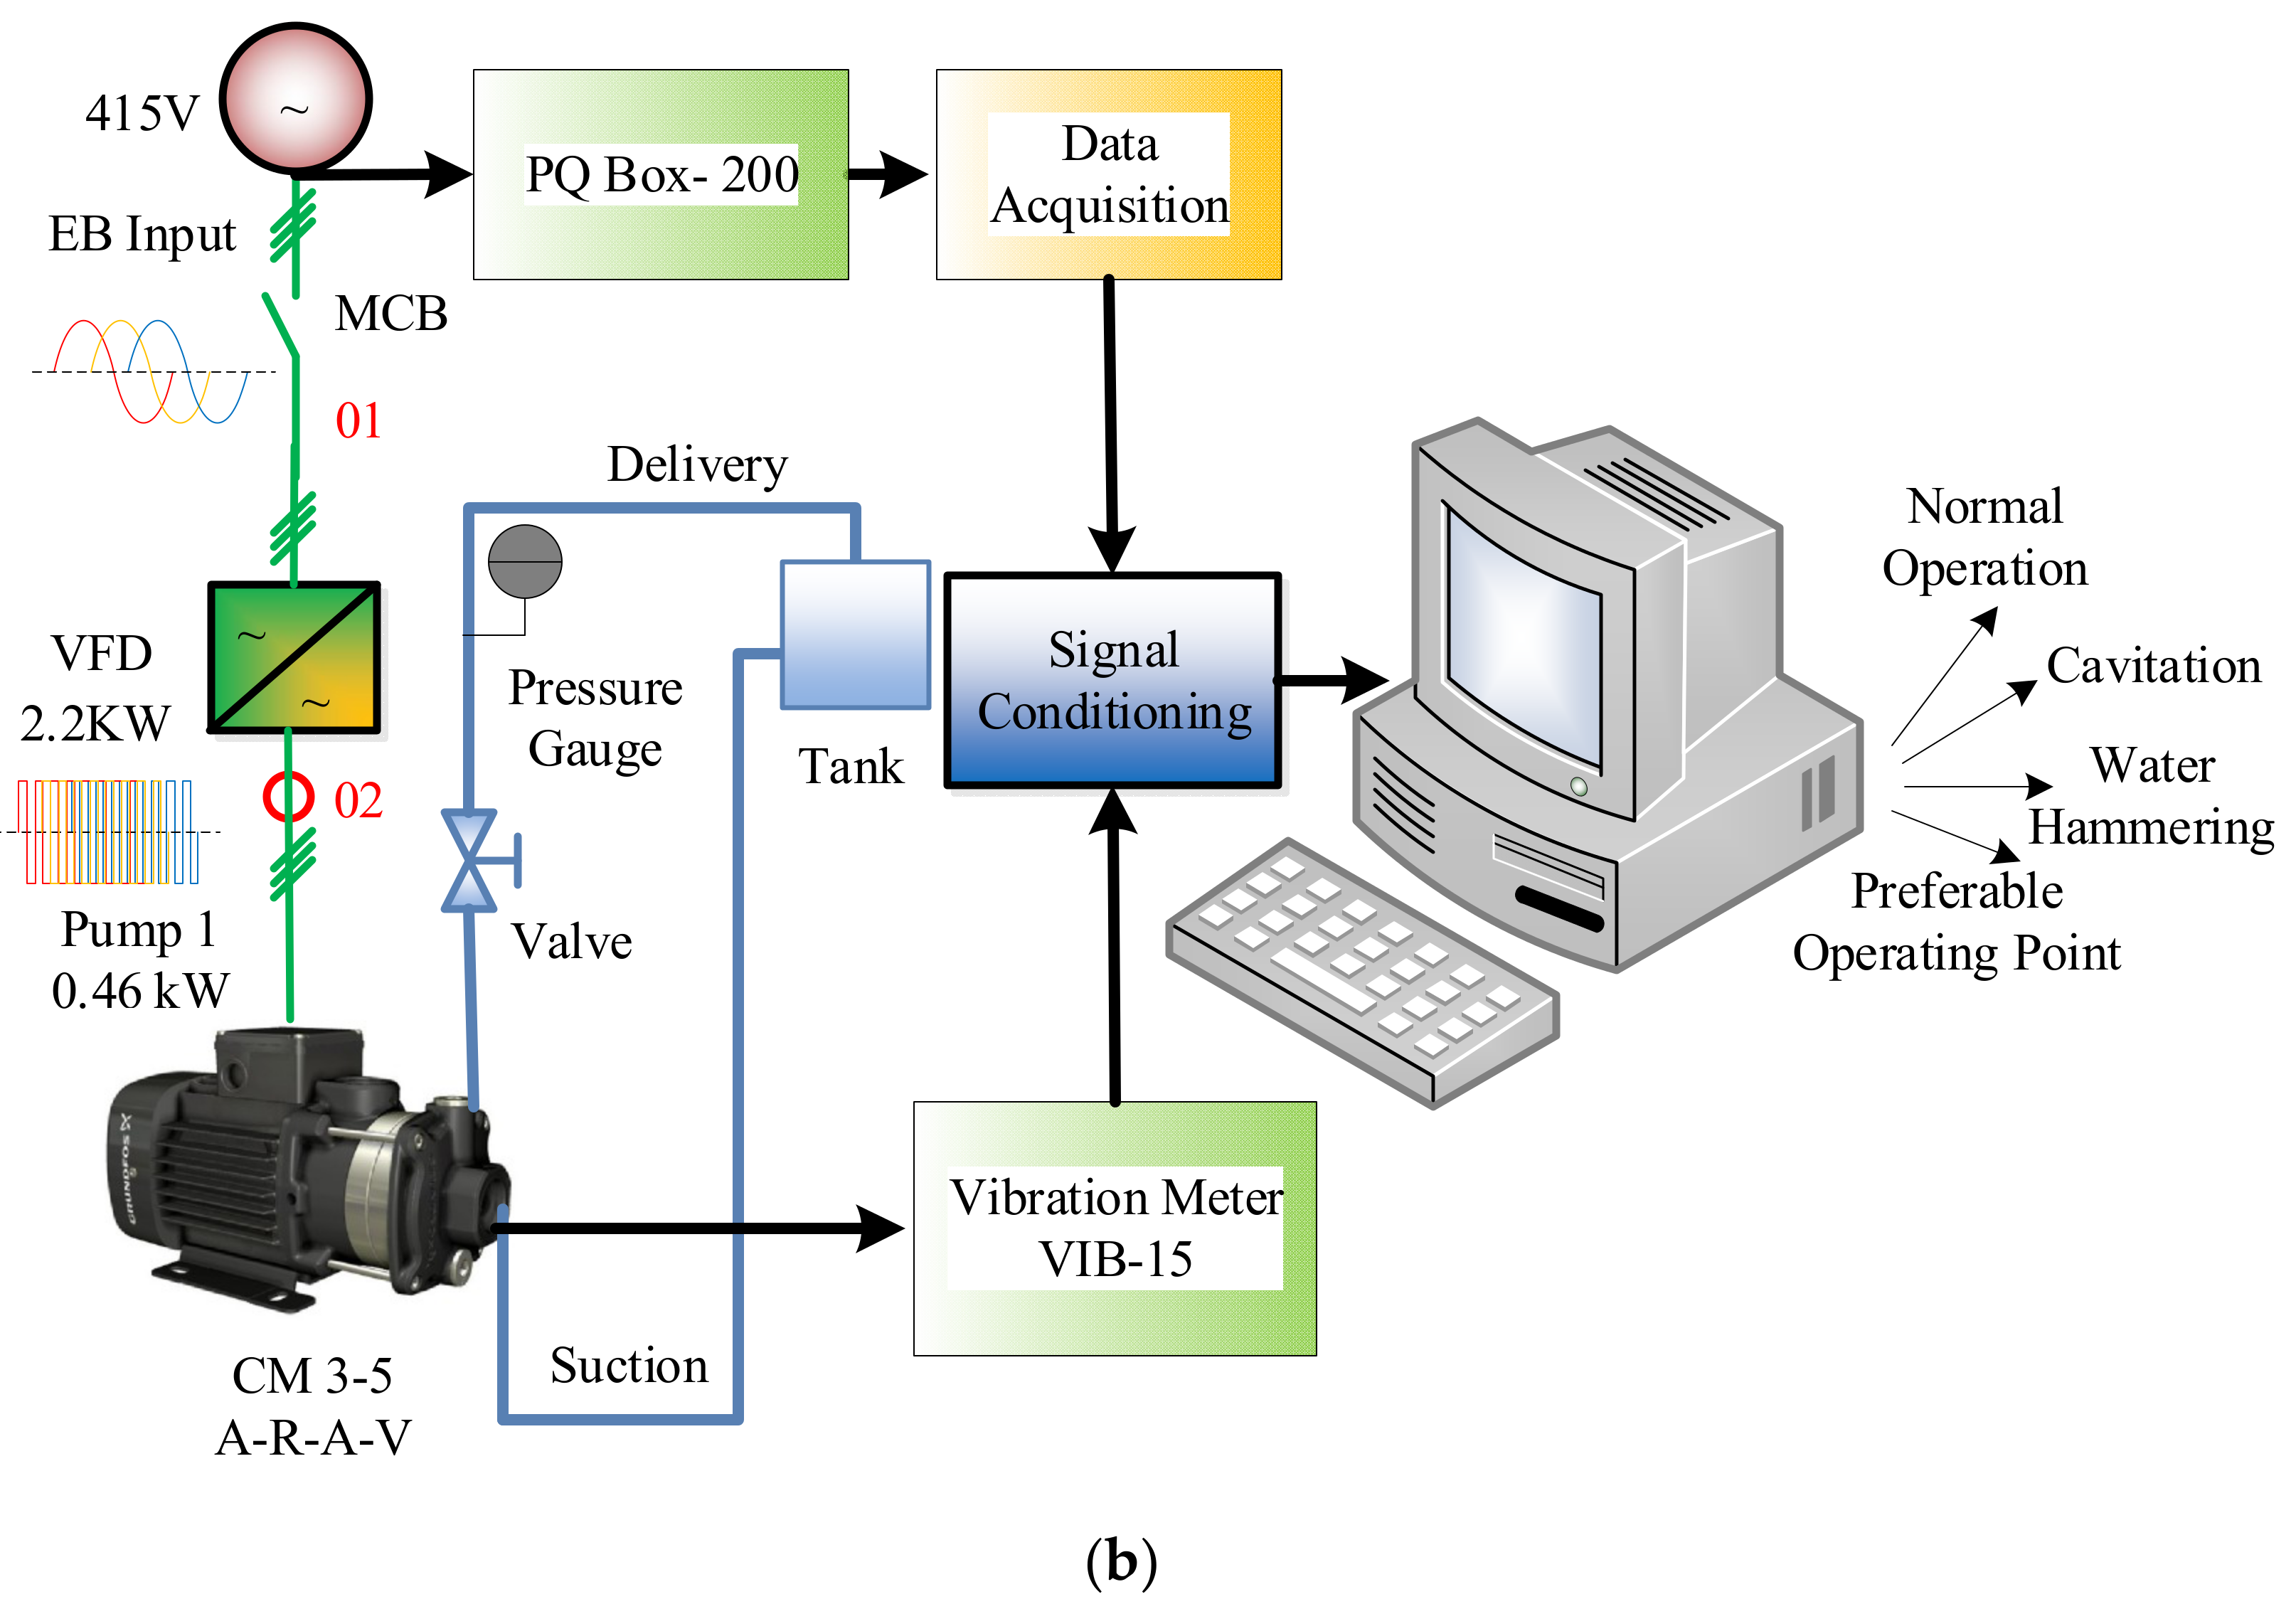
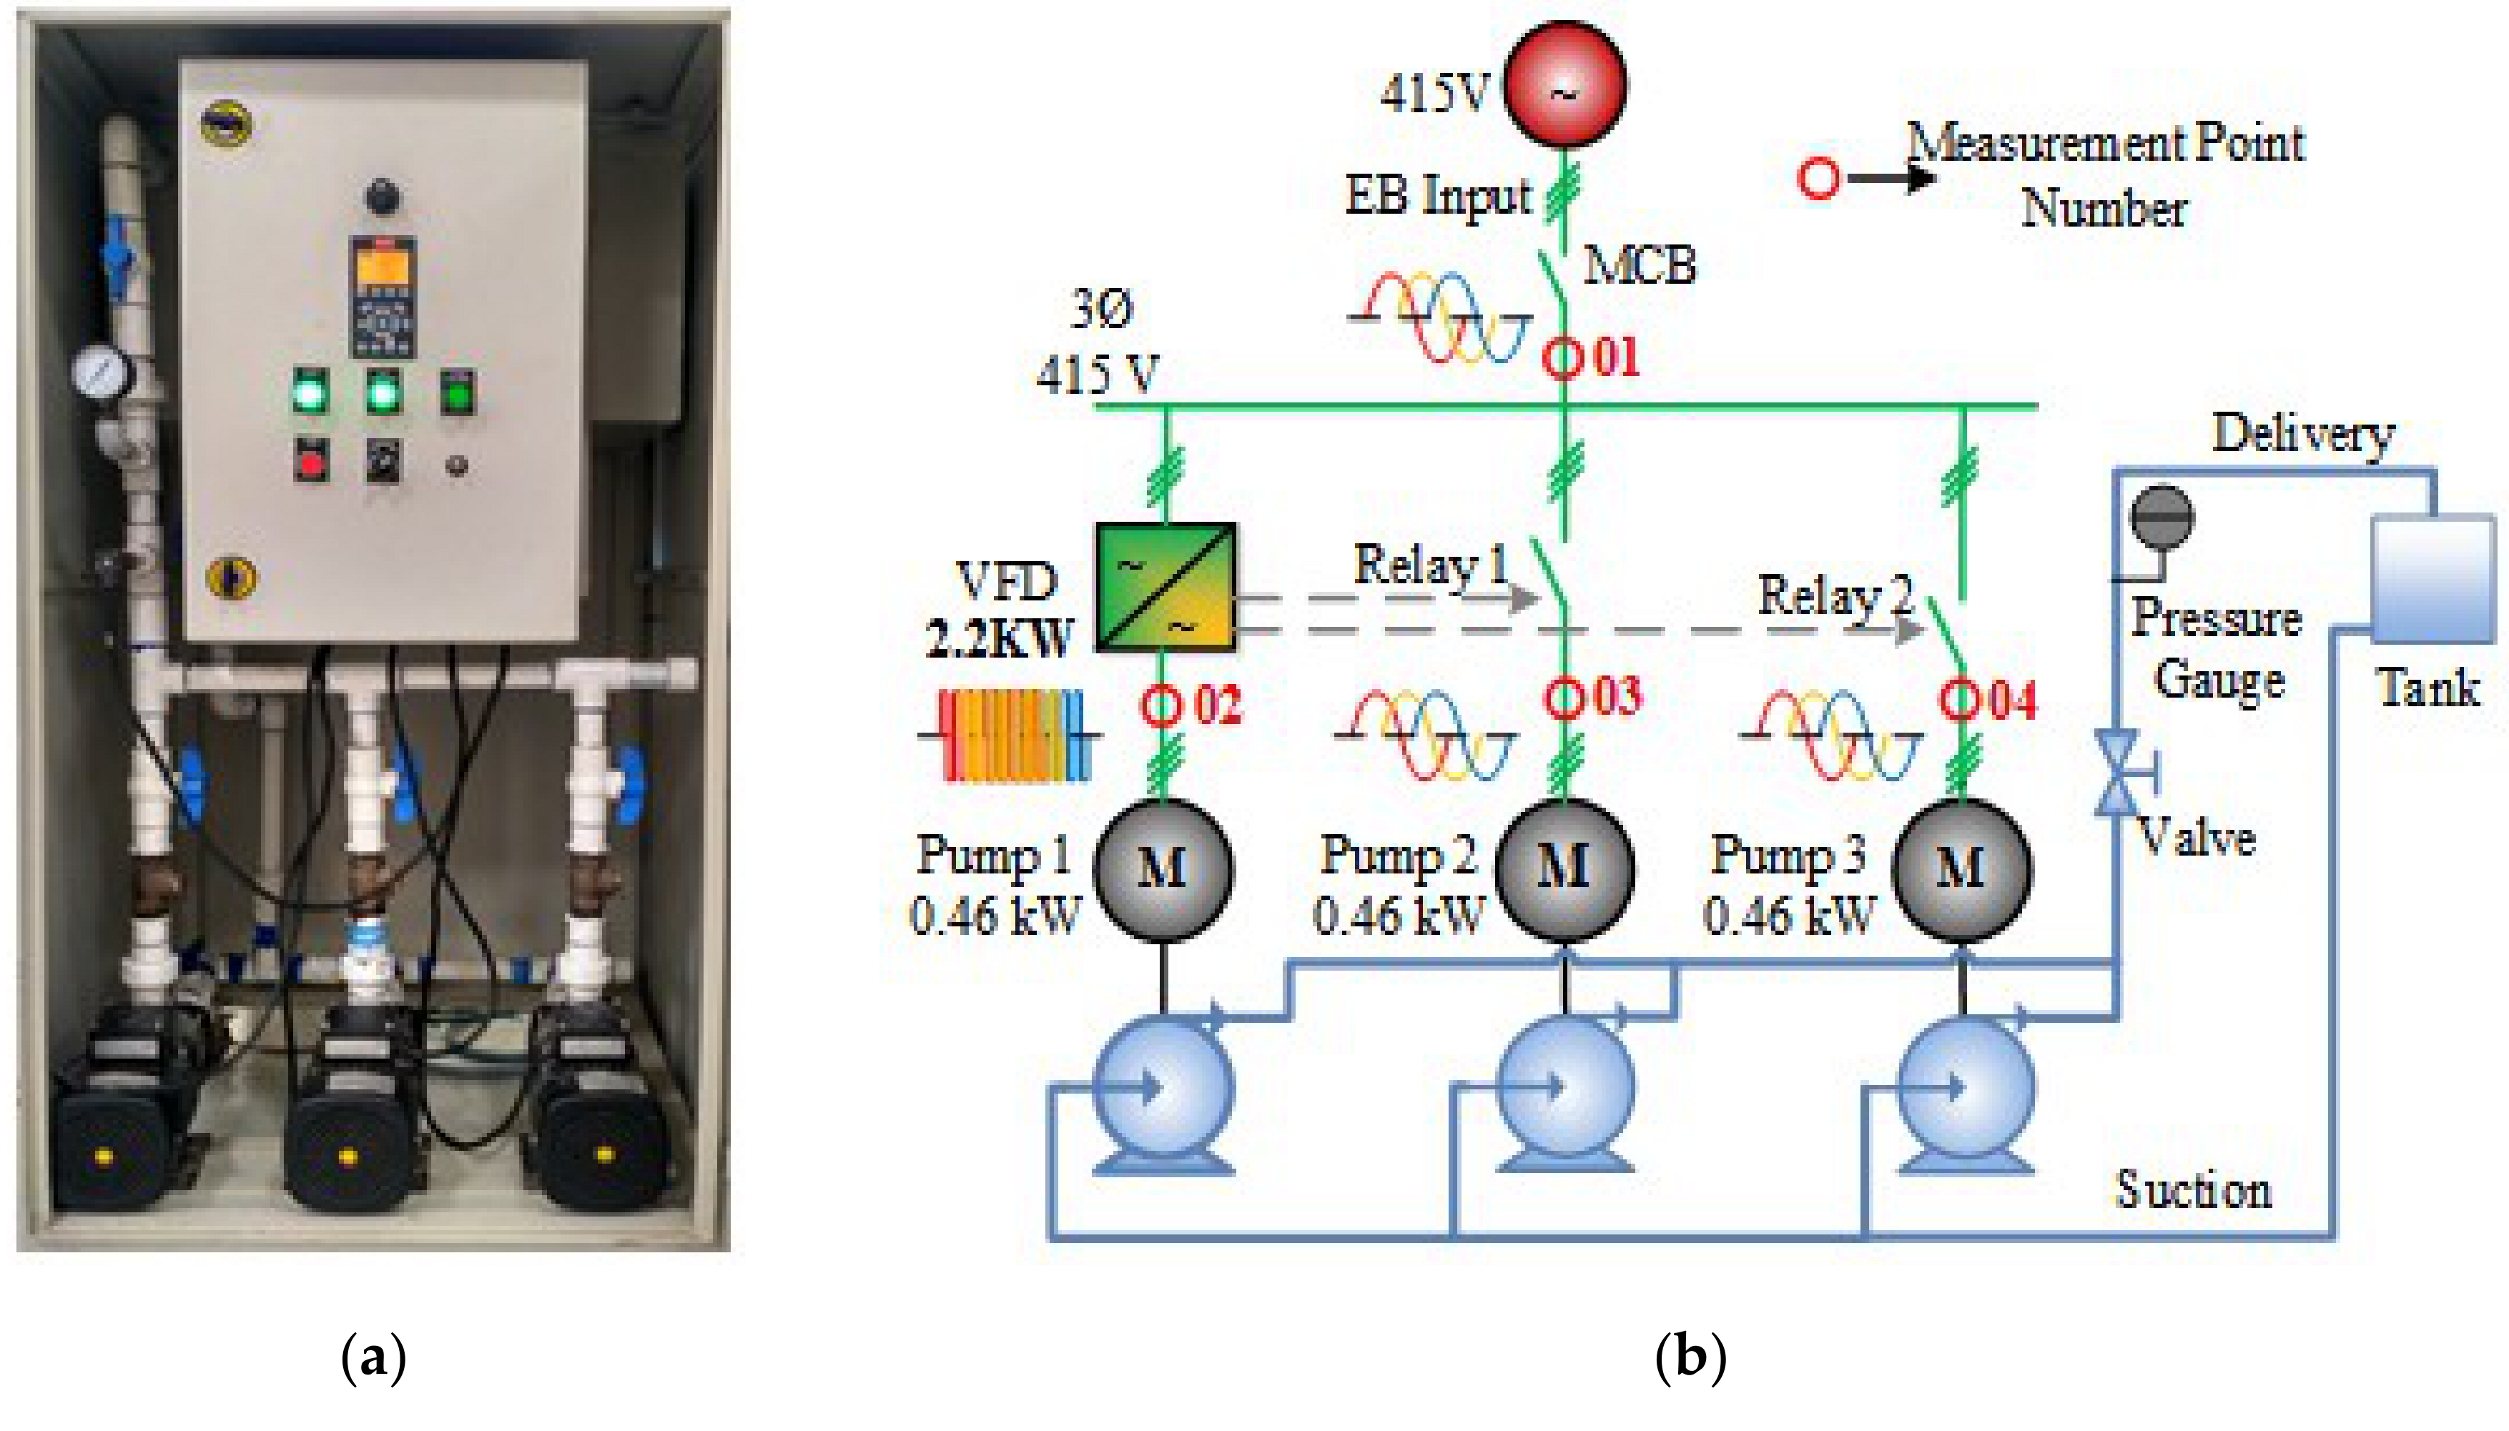
2.1. System Description
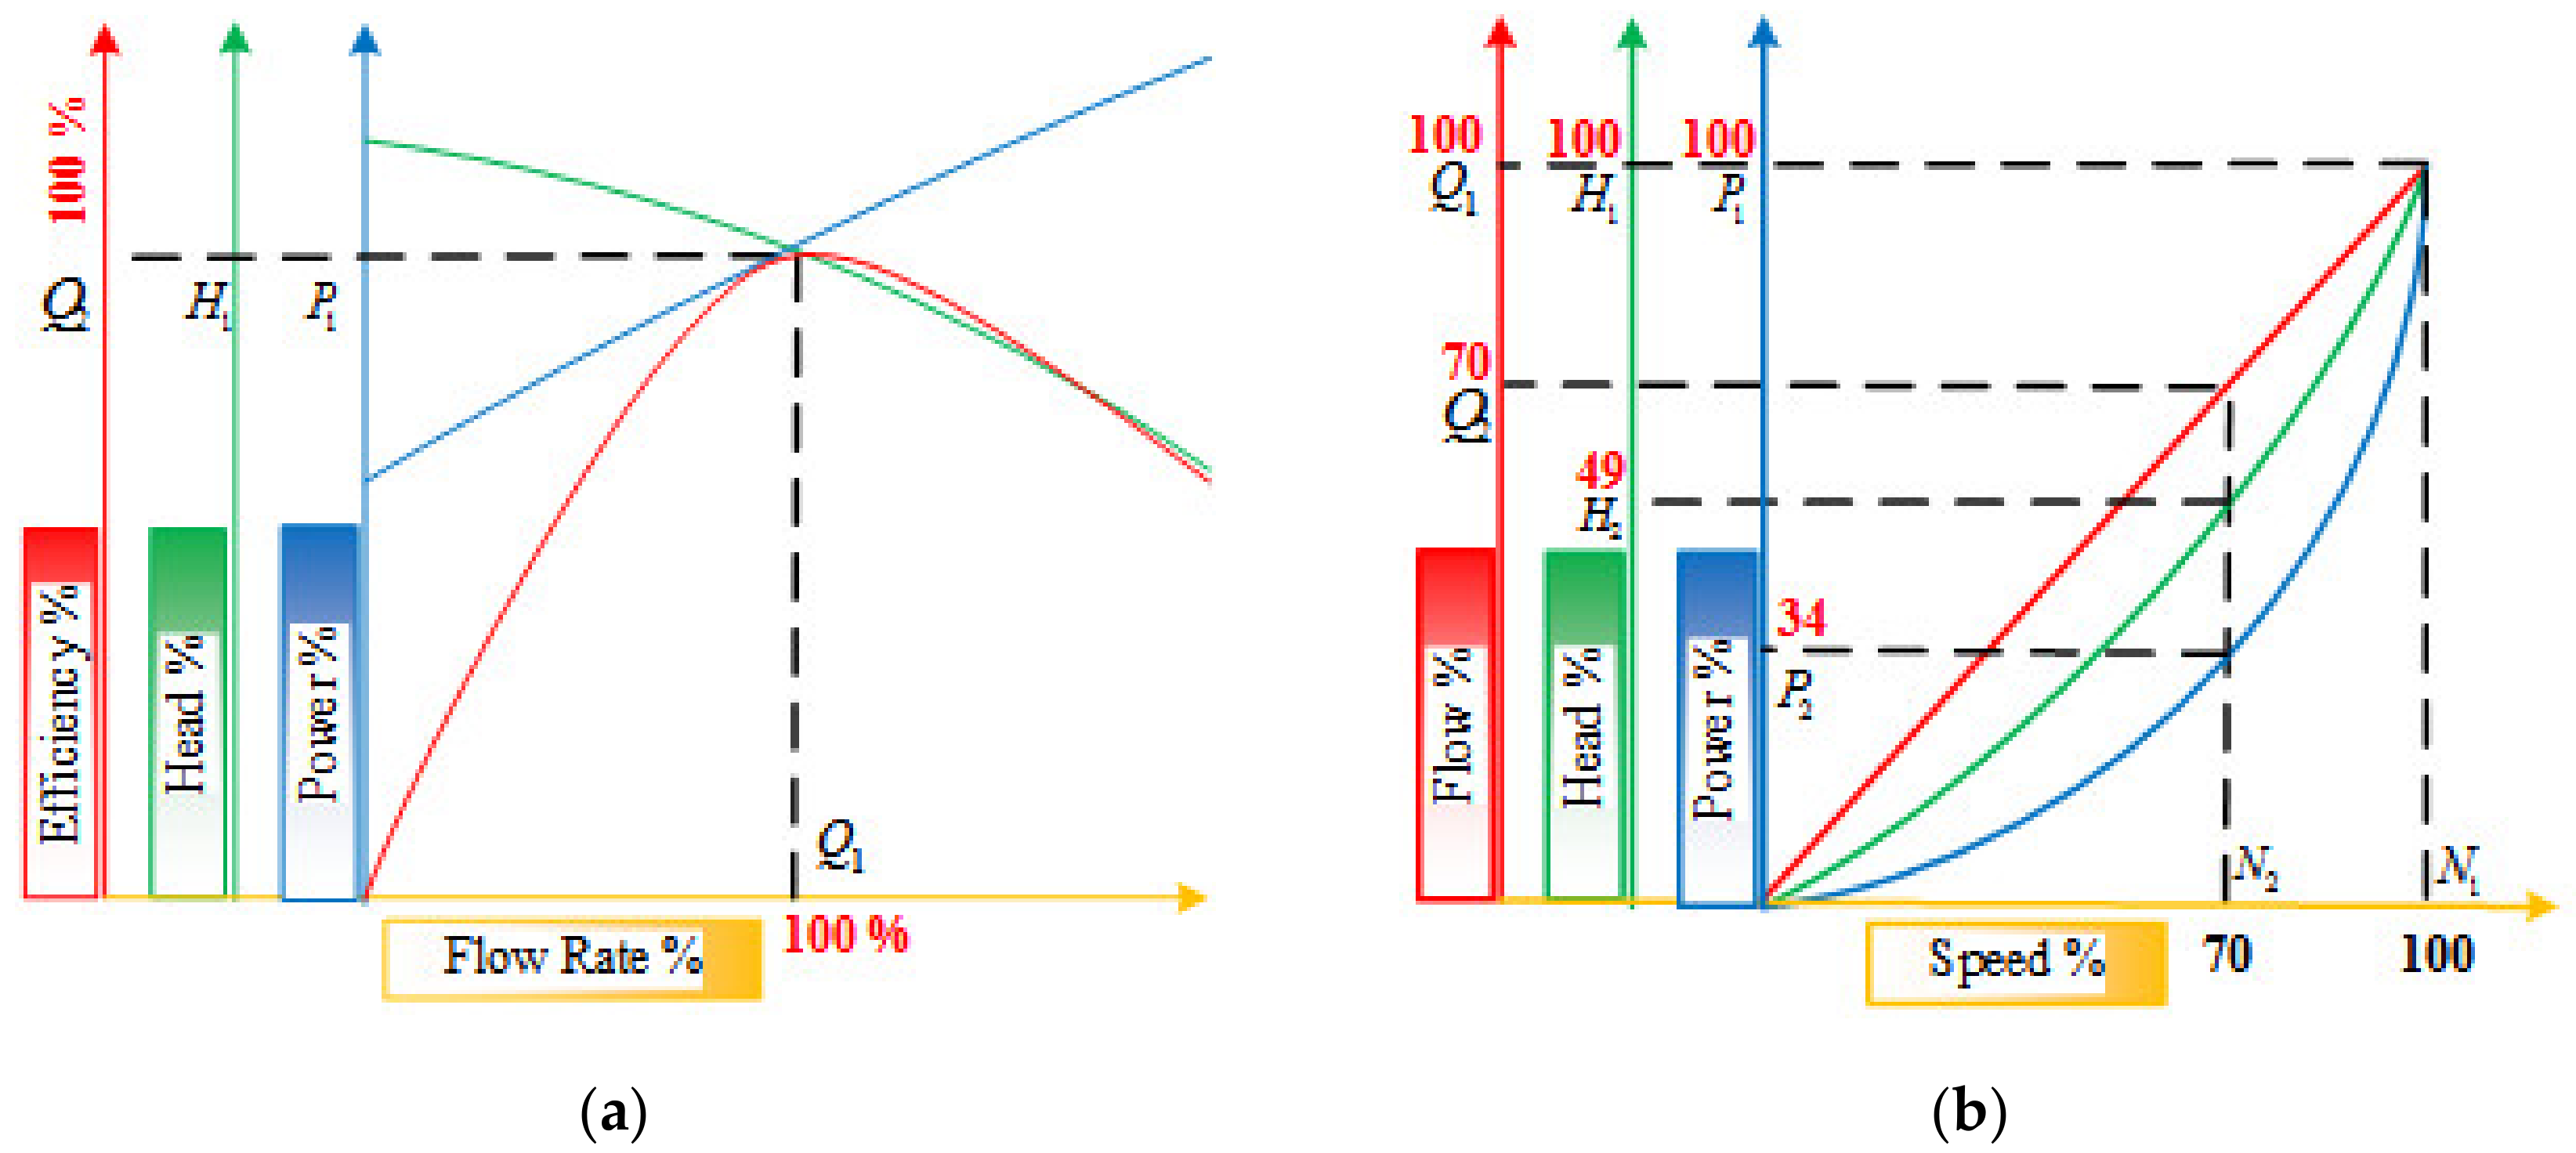
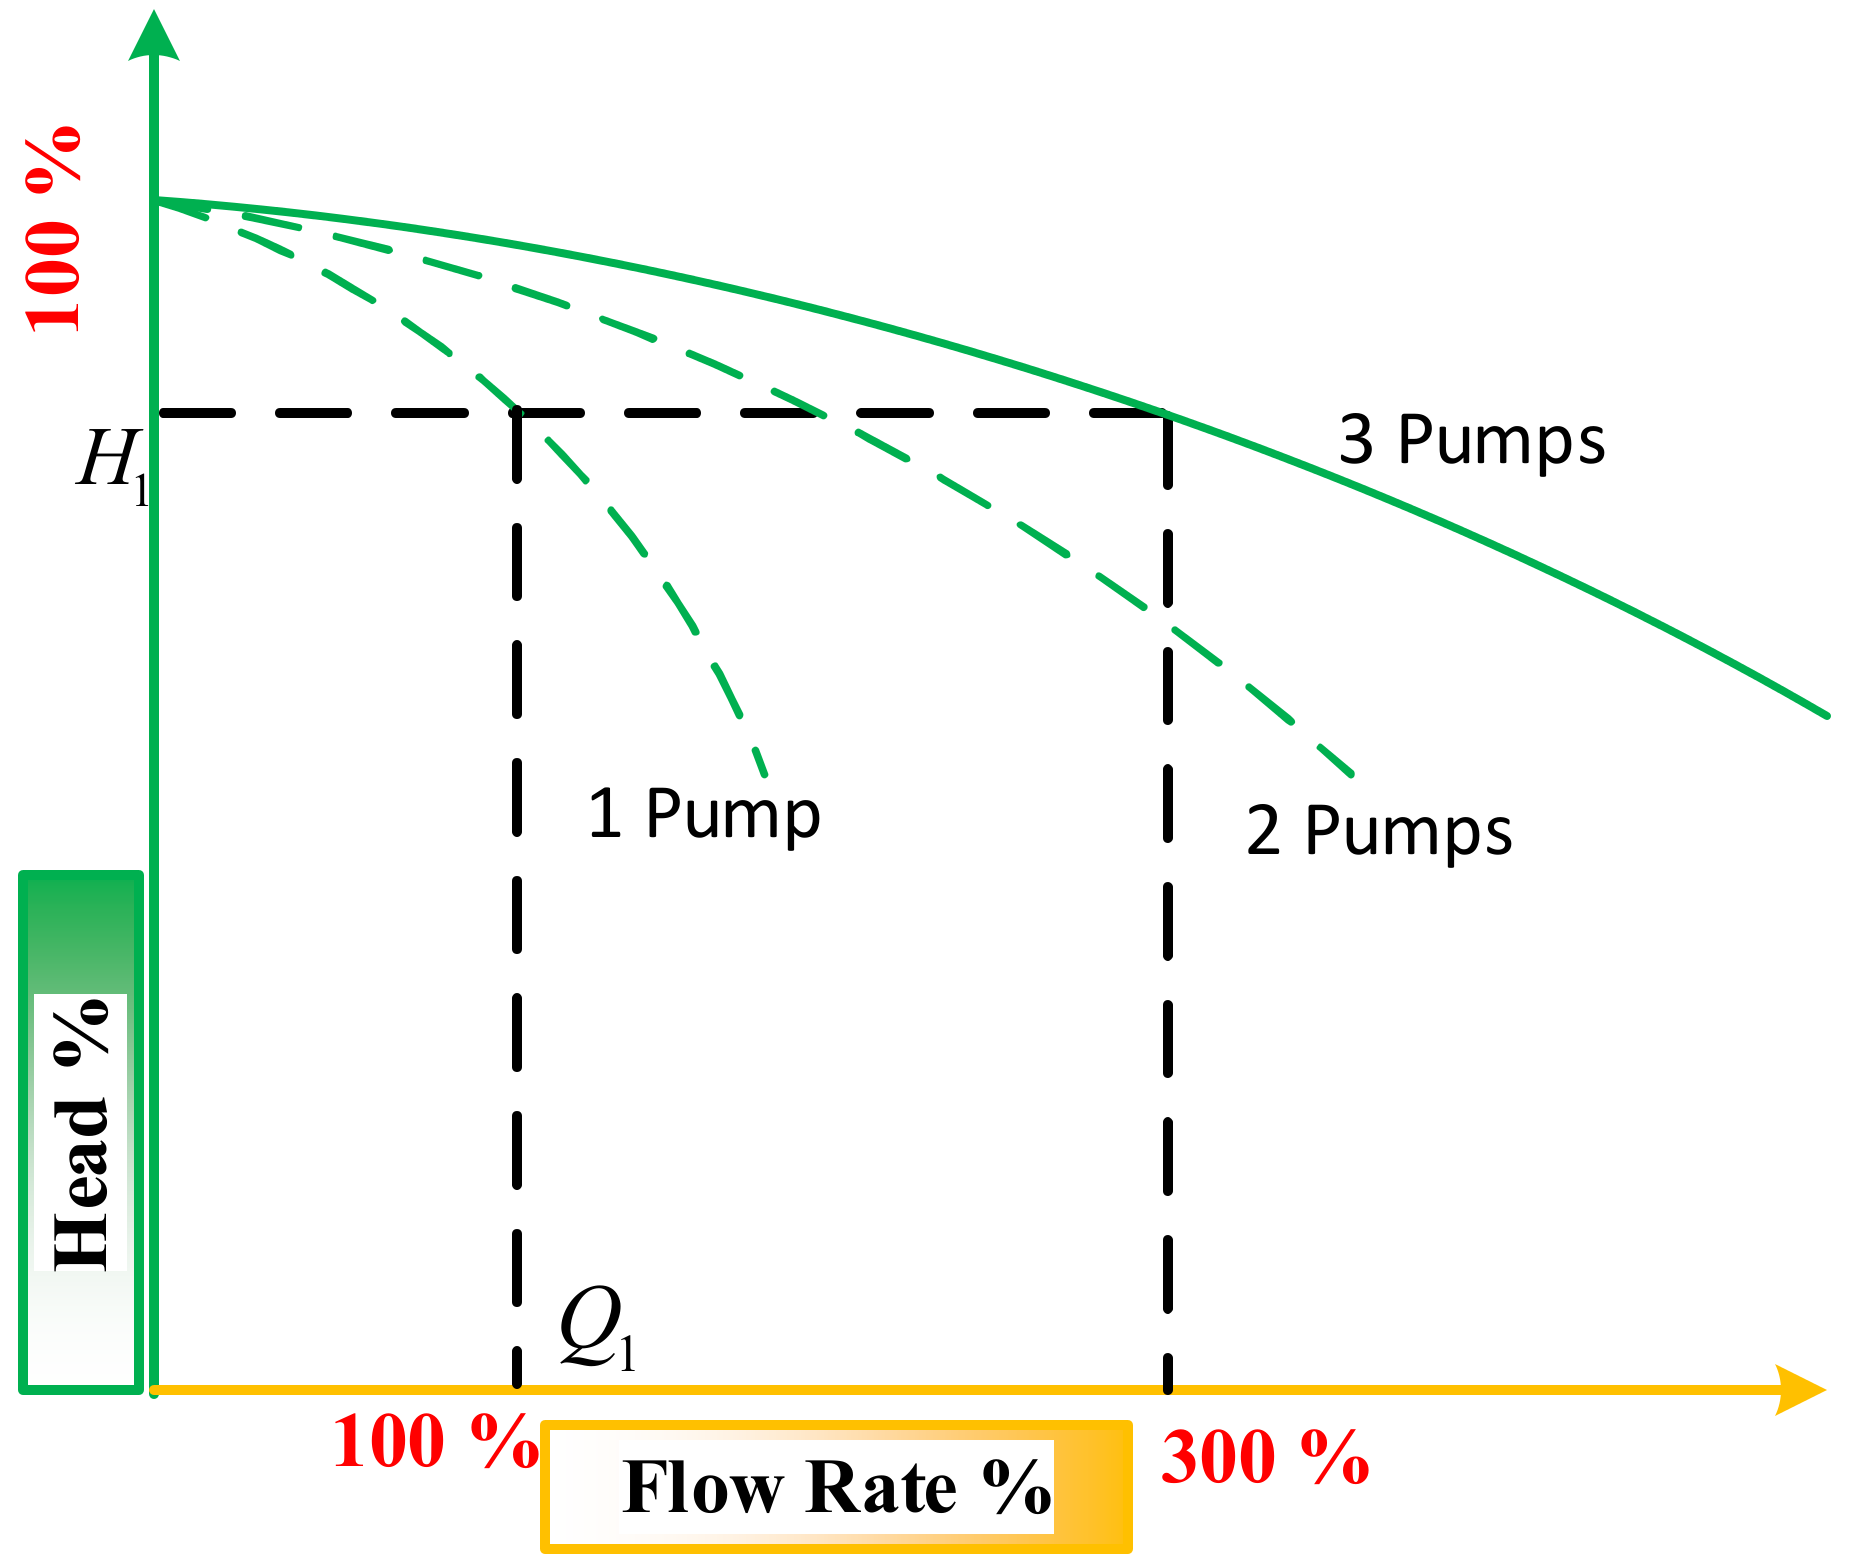
2.2. Pumping System Modeling
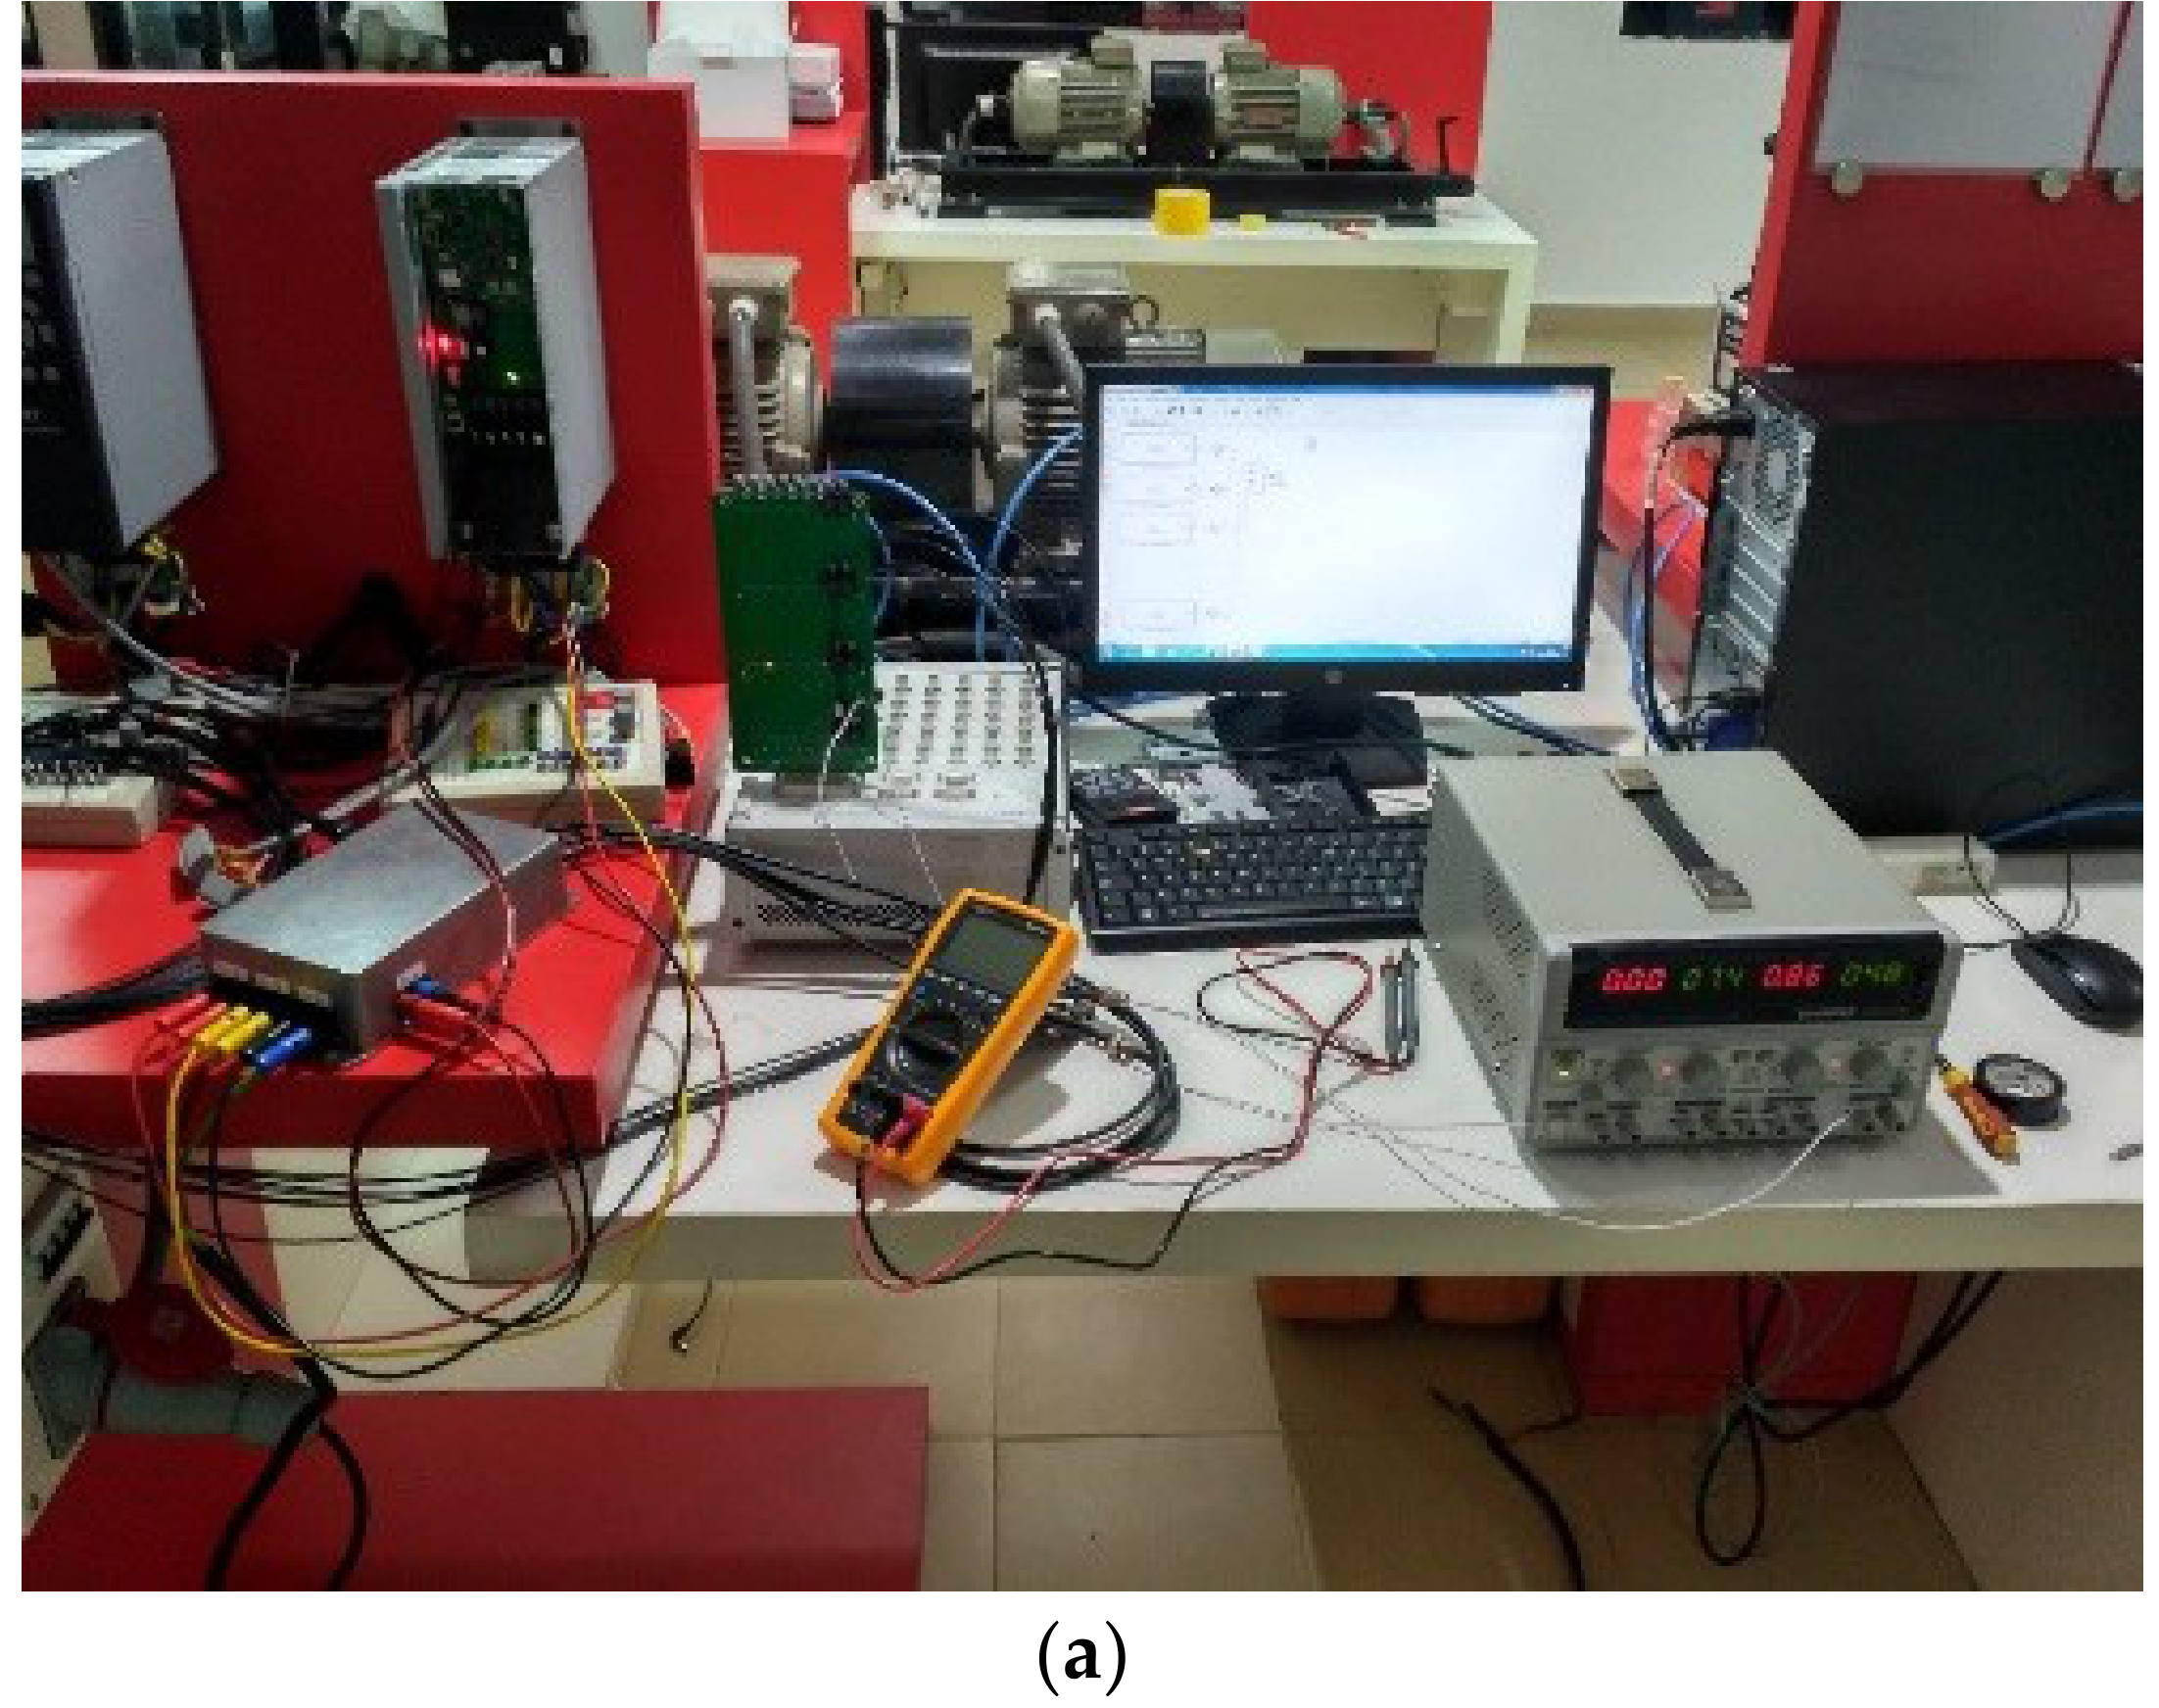
3. Experimental Test with Cascaded Industrial Variable Frequency Drives Pumping System
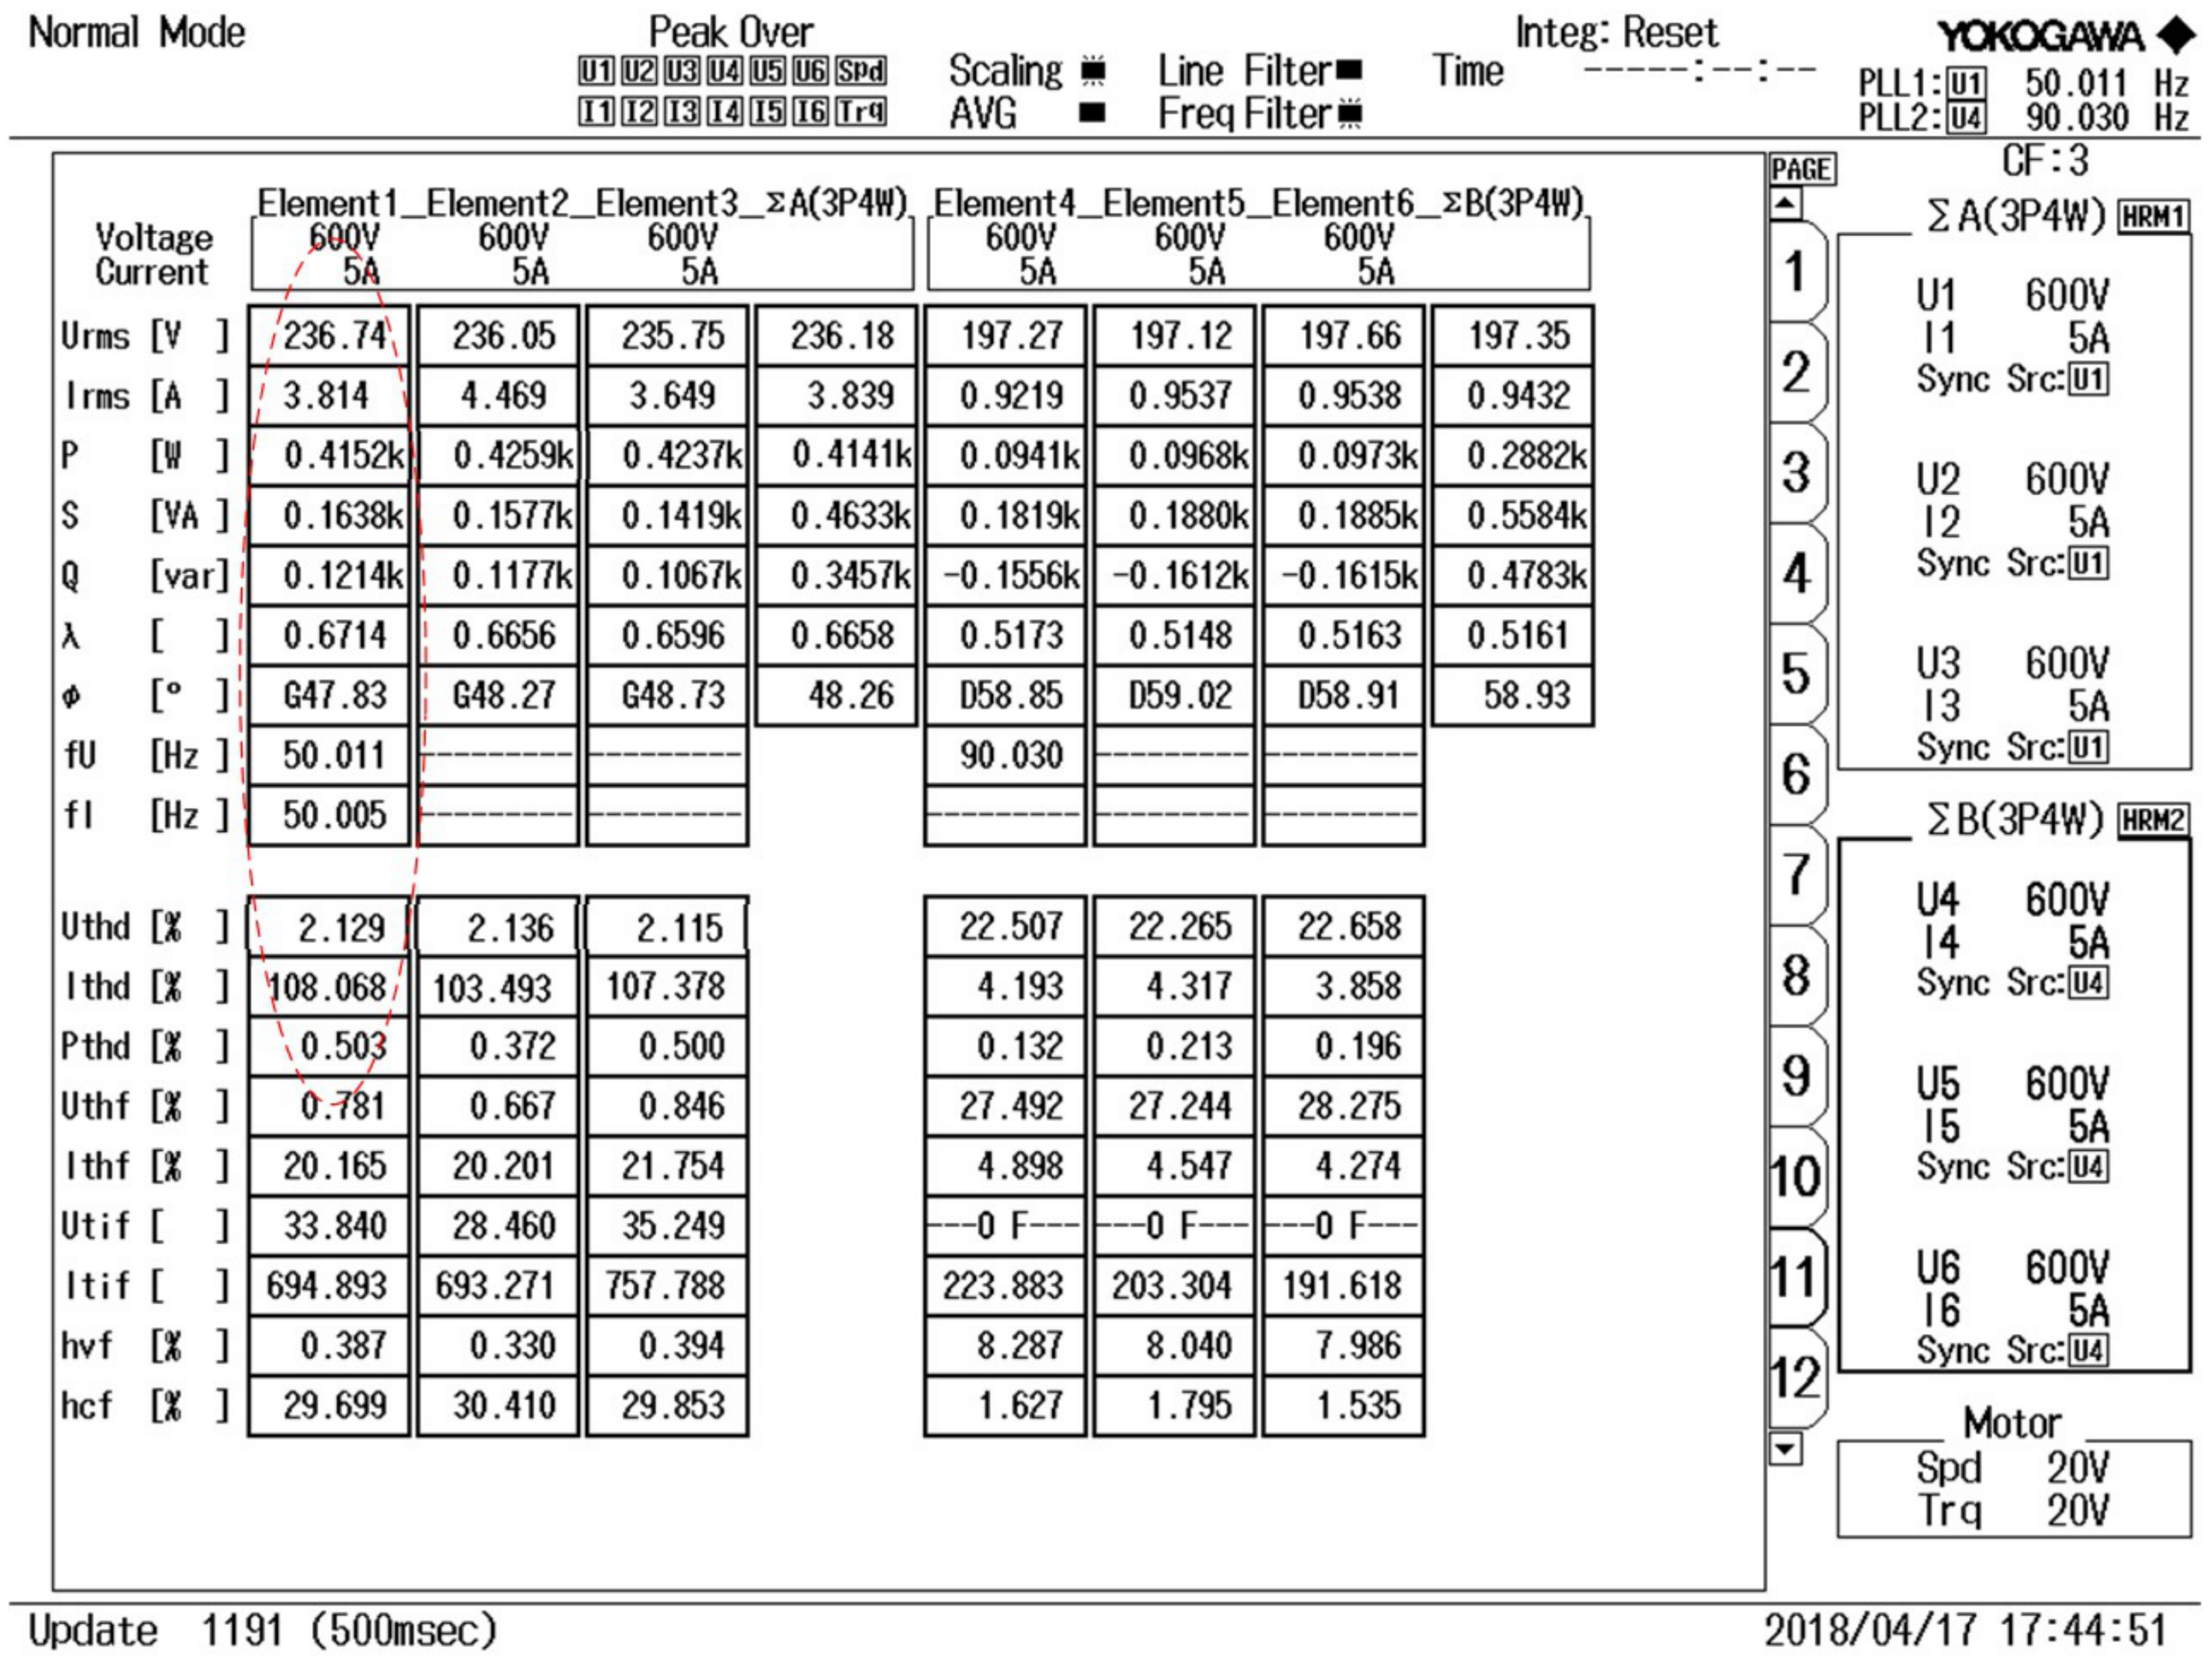
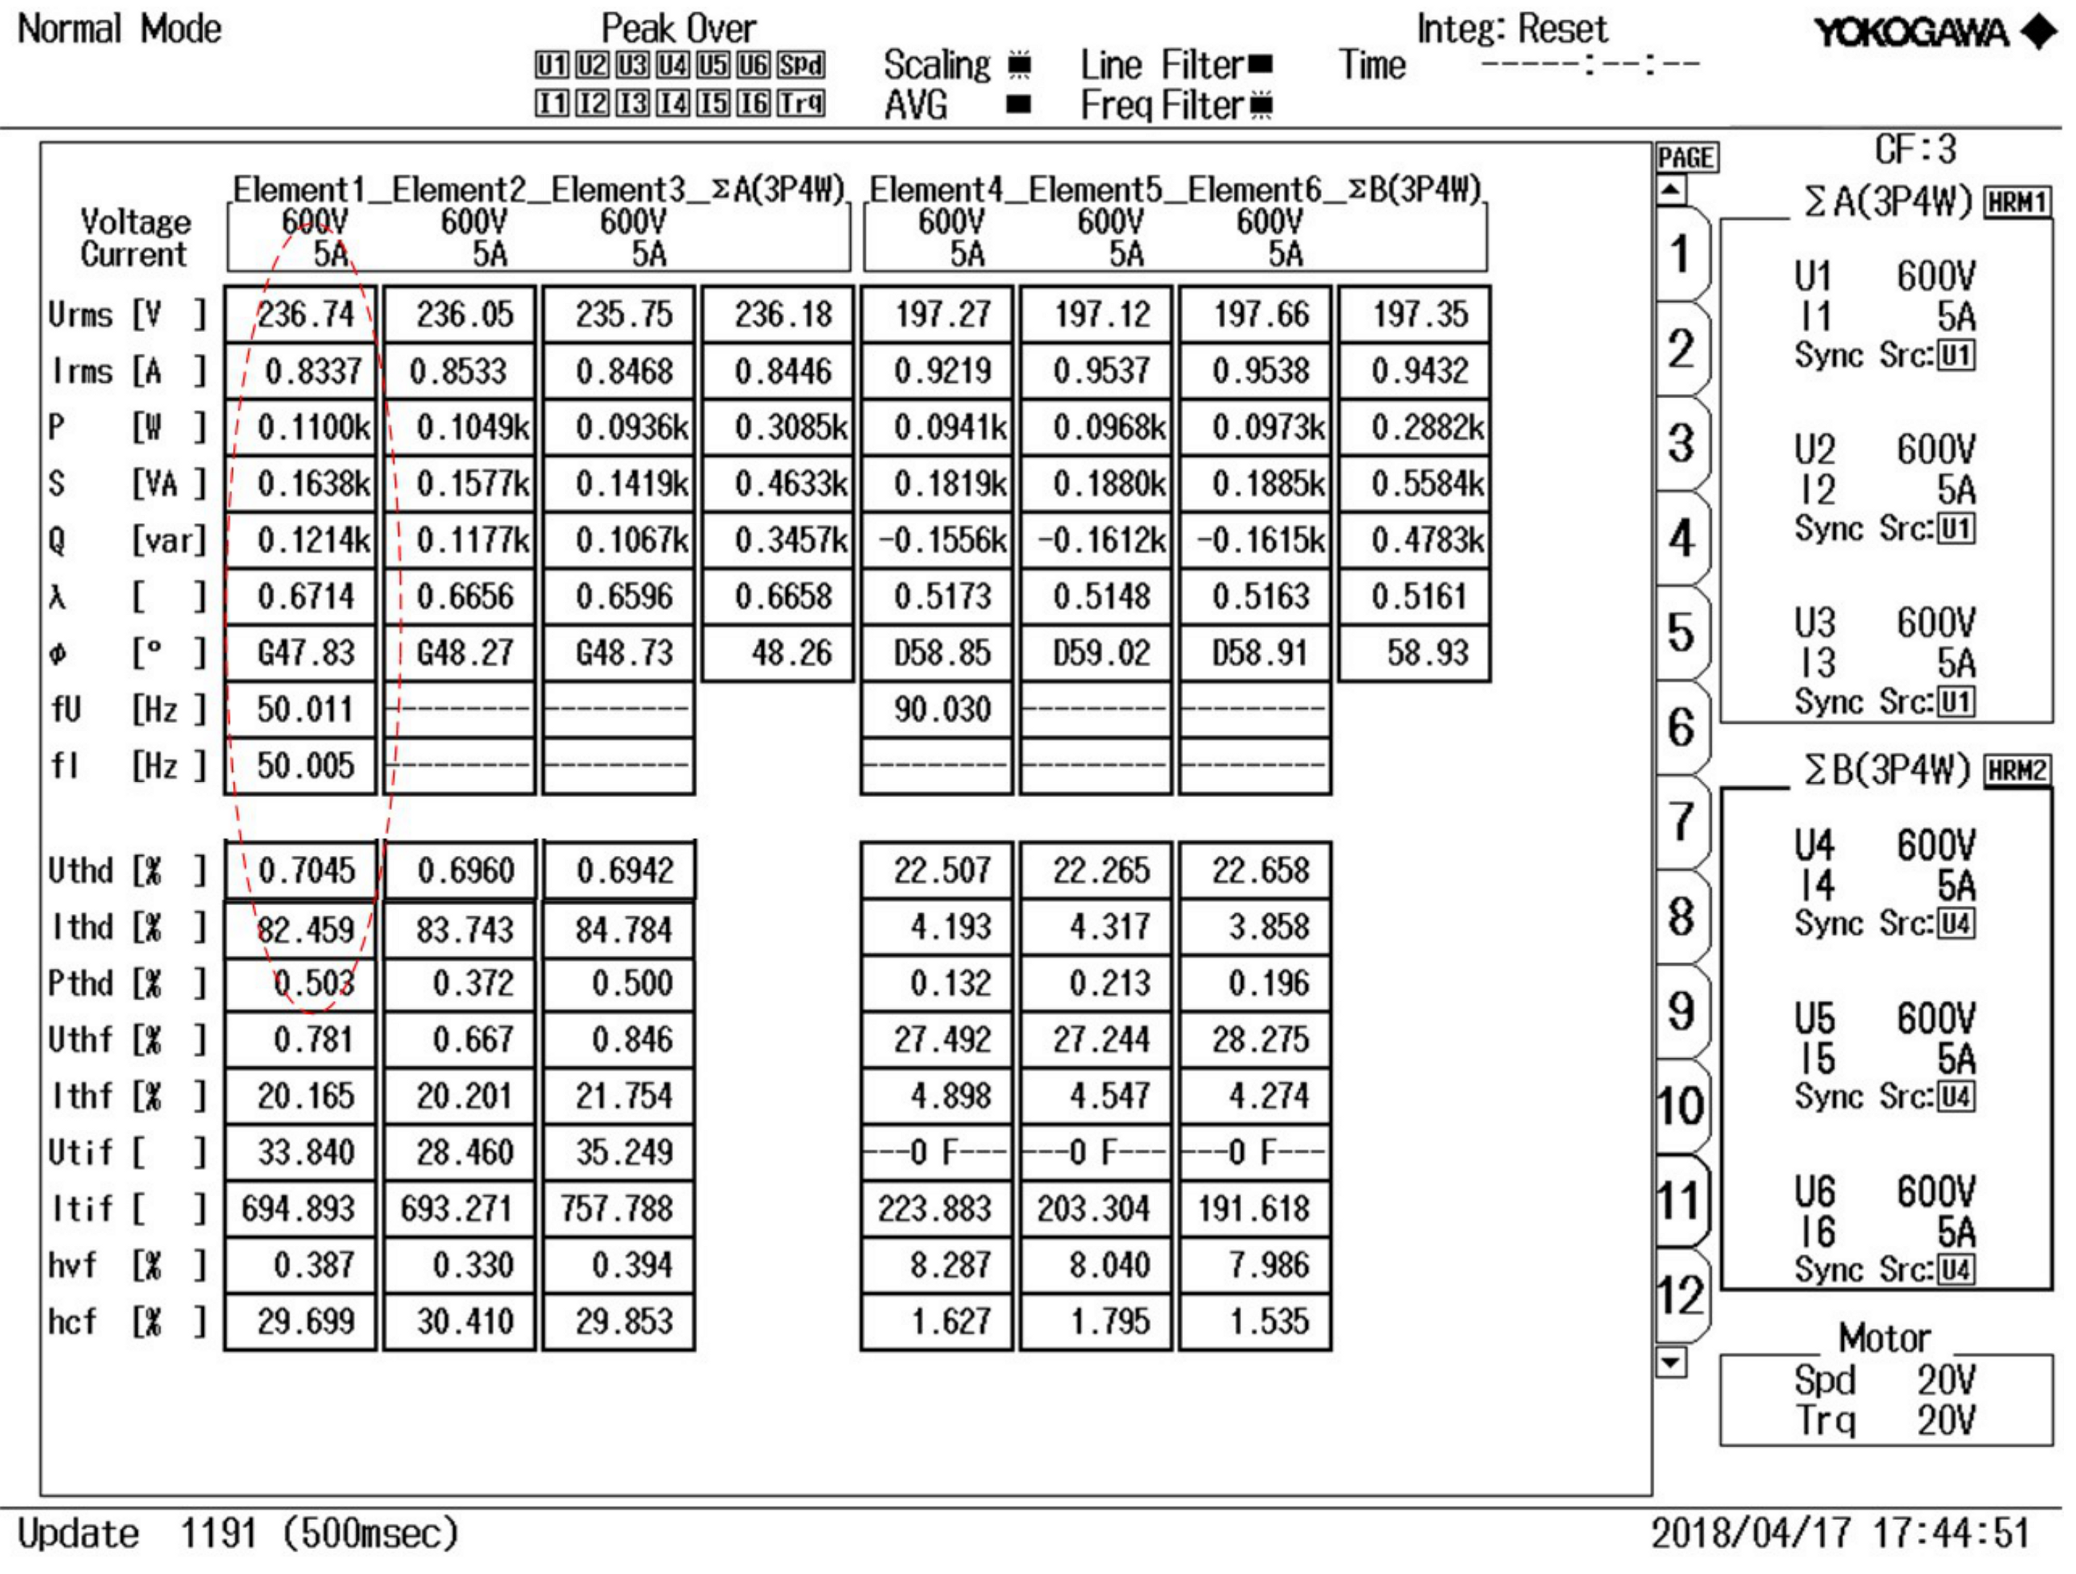
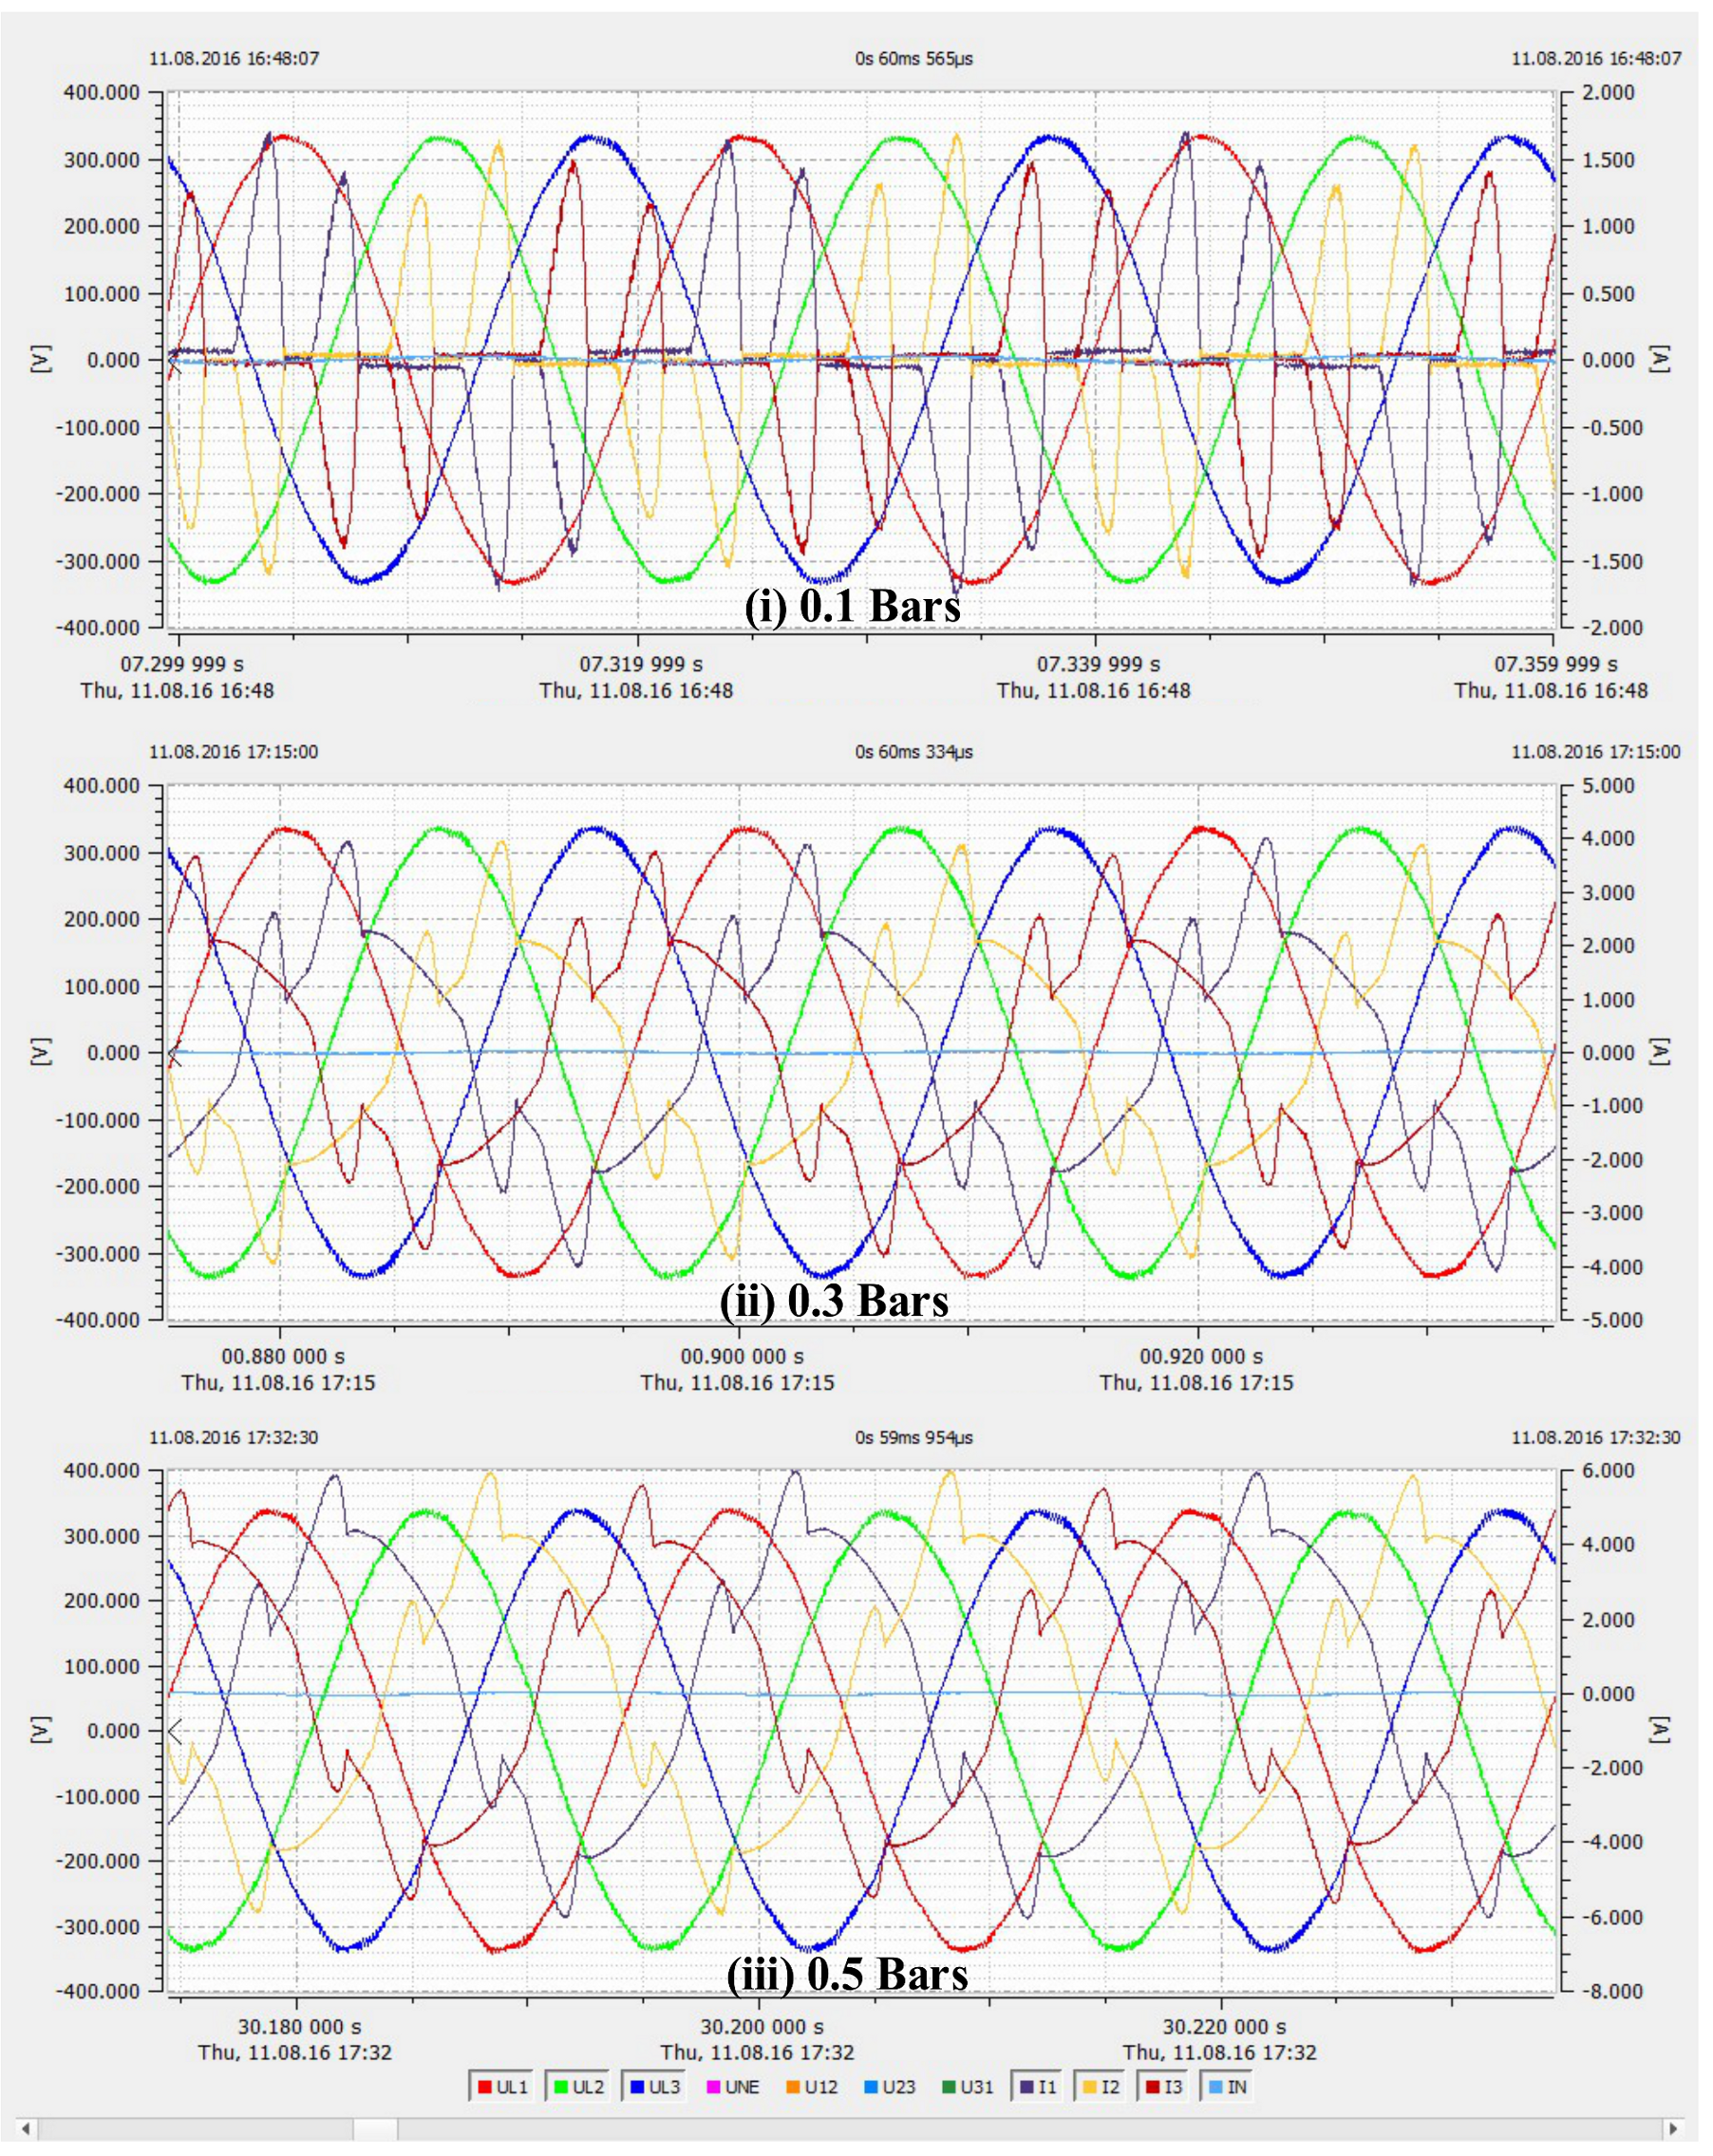
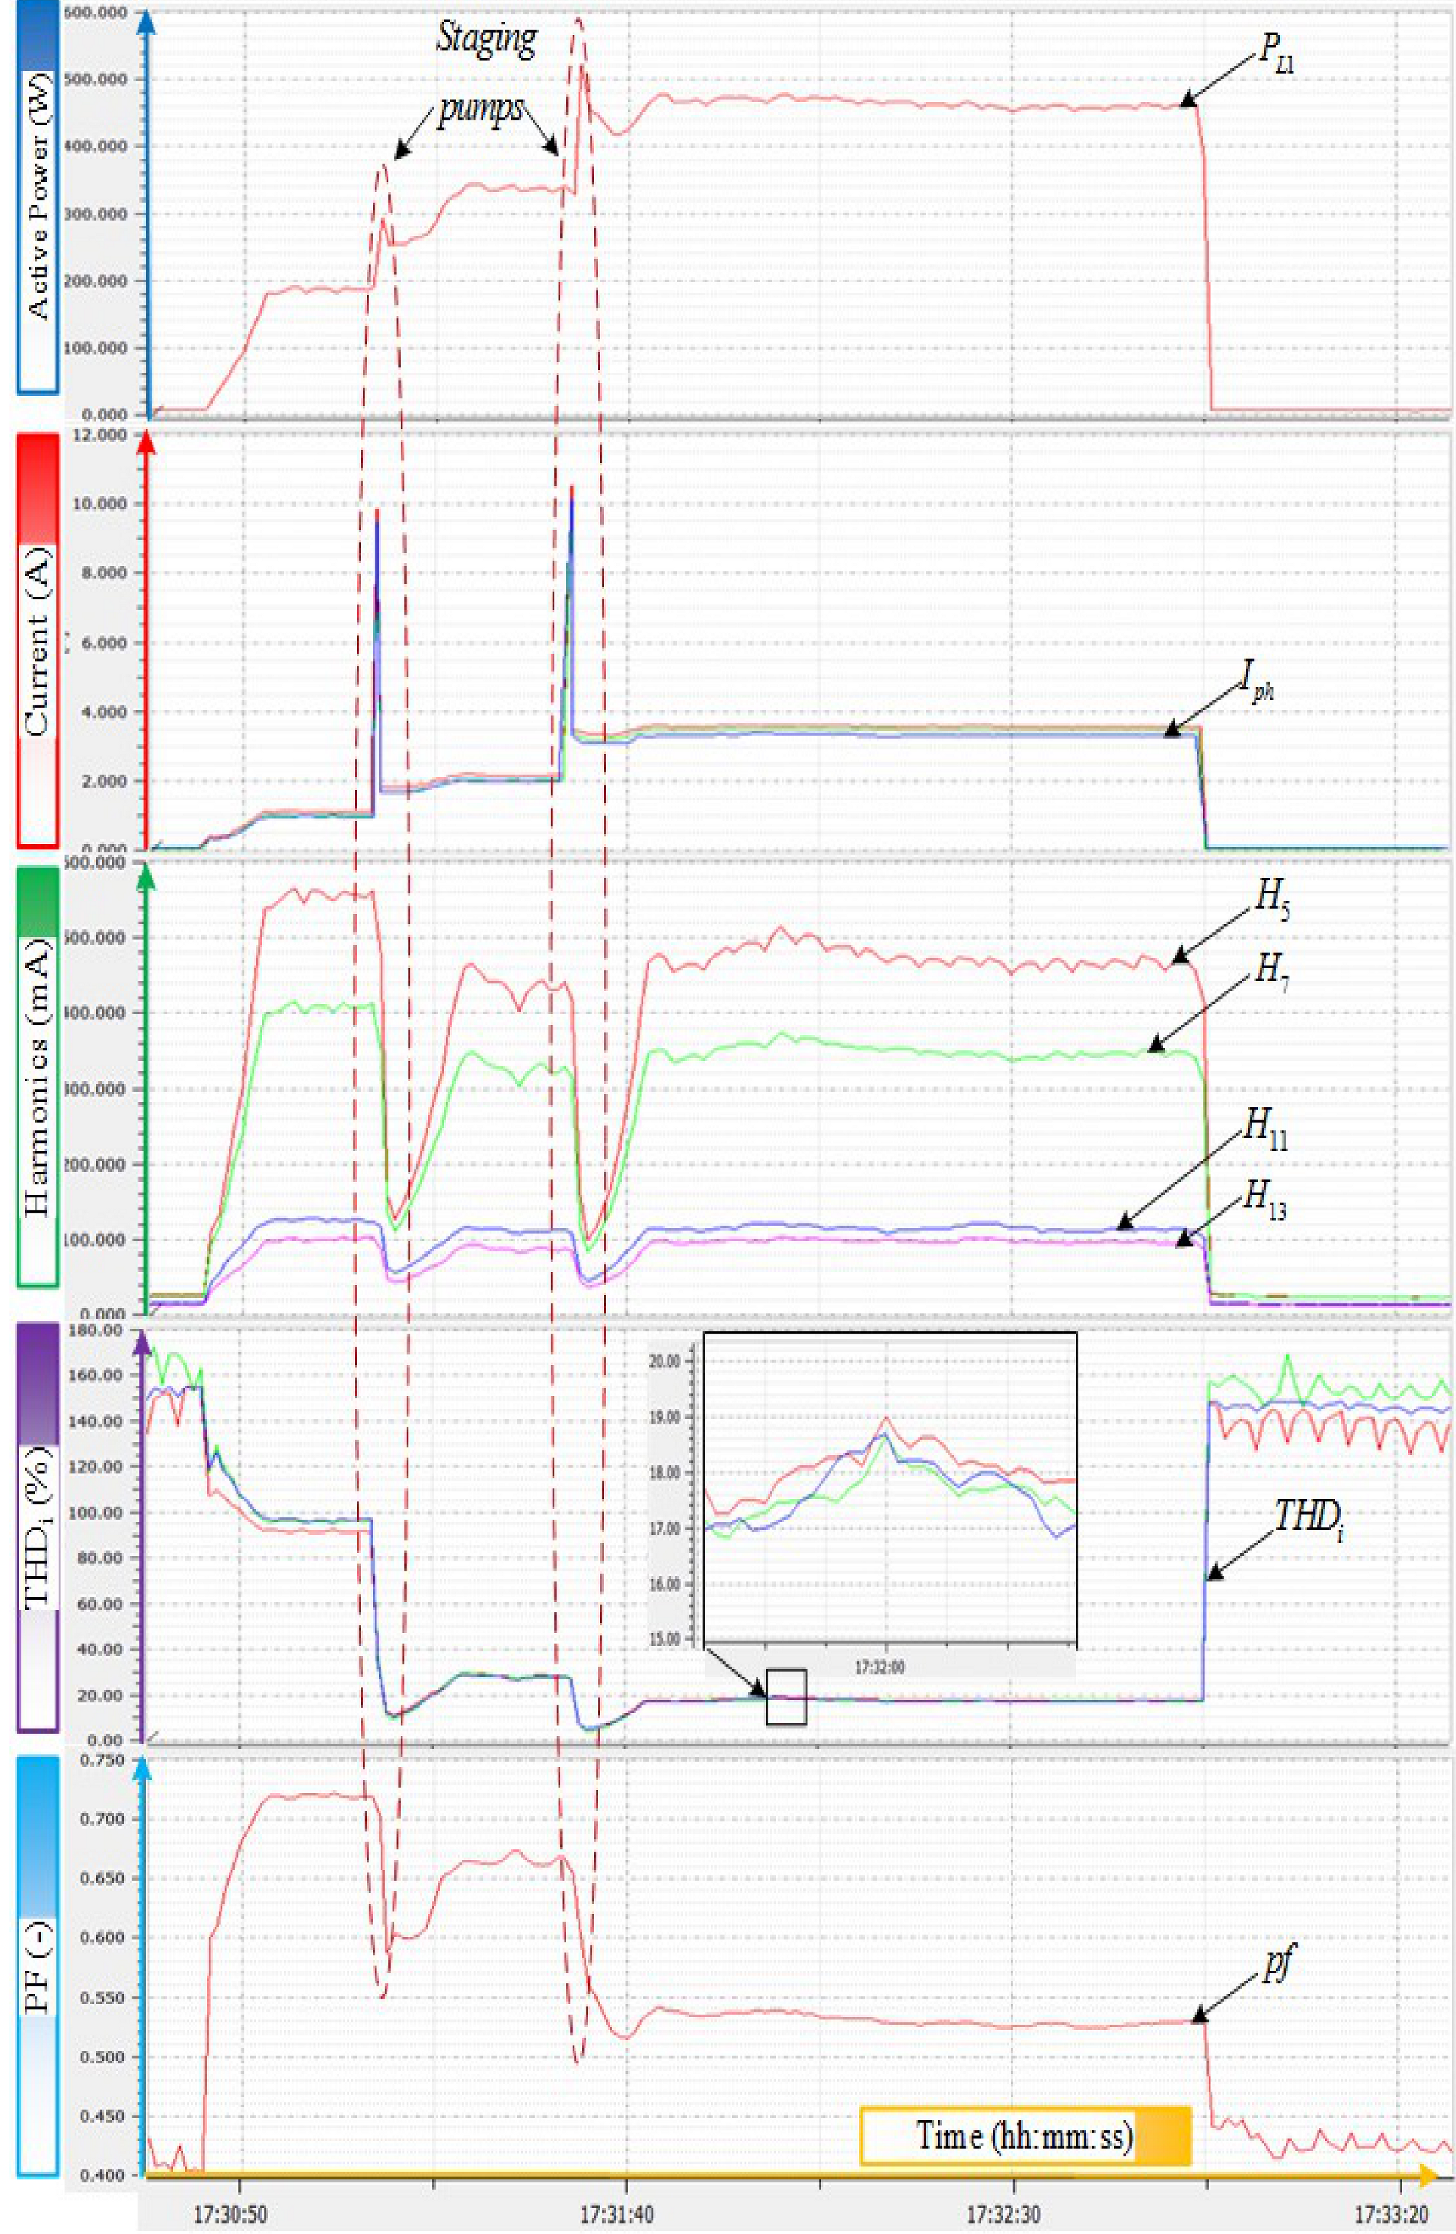
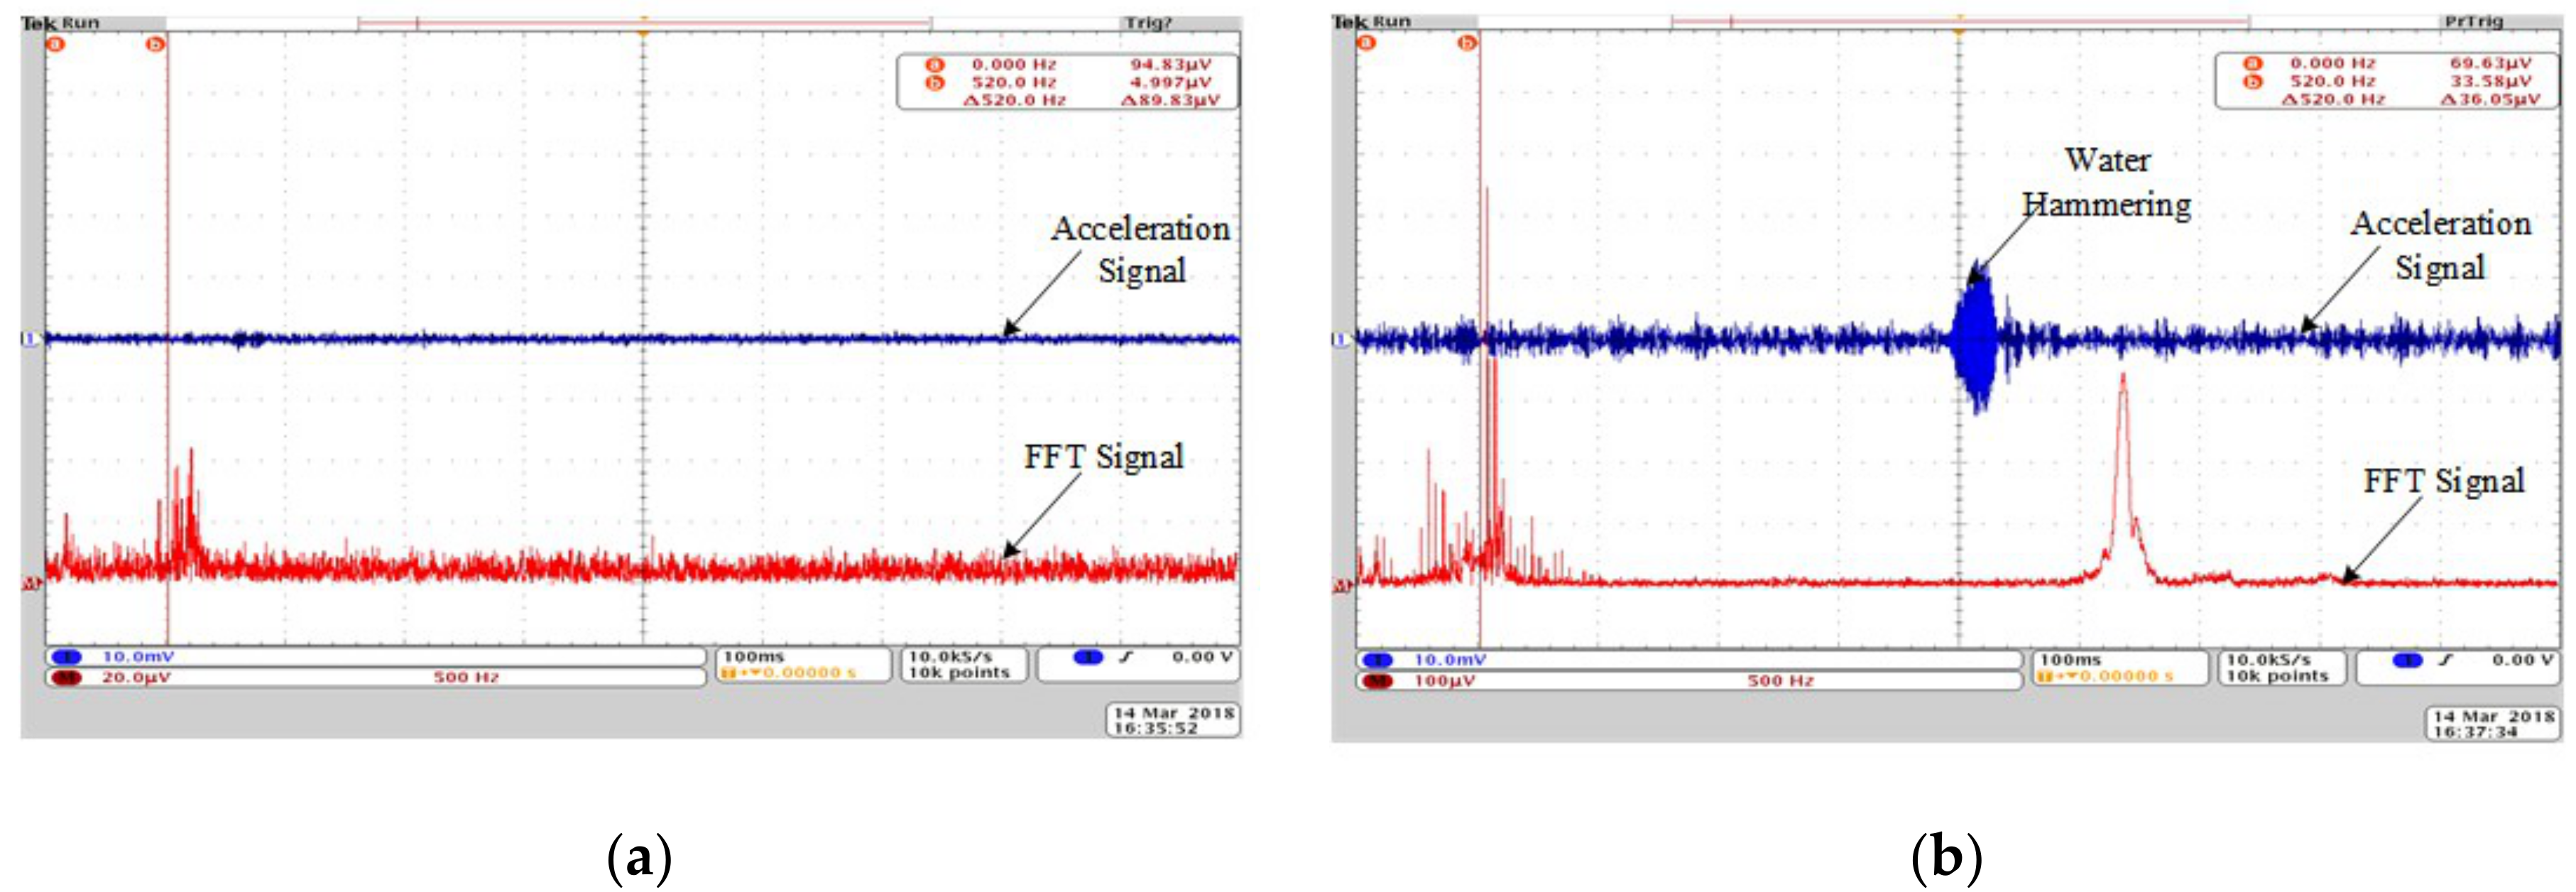
4. Experimental Power Quality Signatures
nv = 5, 7, 11, 13, 17, 19,…, where p = 6
5. Conclusions
Author Contributions
Funding
Acknowledgments
Conflicts of Interest
Nomenclature
| Q | Flow rate (m3/h) |
| P | Power input (W) |
| G | Gravitational constant |
| H | Pump head (m) |
| N | Rotational speed of pump (rpm) |
| F | Motor frequency (Hz) |
| K | Dynamic head coefficient |
| T | Time (s) |
| V | Volume of liquid (m3) |
| D | Pump impeller diameter (mm) |
| a,b | Experimental coefficients |
| VFD | Variable frequency drive |
| VSD | Variable speed drive |
| Differential pressure | |
| p | Pump |
| v | VFD |
| sys. | Pumping system |
| m | Motor |
| h | Hydraulic |
| t | Total value |
| S | Specific energy |
| st | Static |
| dyn | Dynamic |
| in | Input to VFD |
| in,t | Total input to multiple VFDs |
| j | Number of pumps connected parallel |
| o | Outlet pressure |
| i | Inlet pressure |
| Efficiency (%) | |
| Density of the liquid (Kg/m3) |
References
- Robinson, C.; Dilkina, B.; Hubbs, J.; Zhang, W.; Guhathakurta, S.; Brown, M.A.; Pendyala, R.M. Machine learning approaches for estimating commercial building energy consumption. Appl. Energy 2017, 208, 889–904. [Google Scholar] [CrossRef]
- ETSU; CETIM; Reeves DT; NESA; Darmstadt TU. Study on Improving the Energy Efficiency of Pumps. 2001. Available online: http://www.jakob-albertsen.dk/komposit/Darmstadtrapport.pdf (accessed on 3 April 2019).
- Wang, Z.; Qian, Z. Effects of concentration and size of silt particles on the performance of a double-suction centrifugal pump. Energy 2017, 123, 36–46. [Google Scholar] [CrossRef]
- Shankar, V.K.A.; Umashankar, S.; Paramasivam, S.; Hanigovszki, N. A comprehensive review on energy efficiency enhancement initiatives in centrifugal pumping system. Appl. Energy 2016, 181, 495–513. [Google Scholar] [CrossRef]
- Diefenderfer, J.; Arora, V.; Singer, L.E. International Energy Outlook 2016 Liquid Fuels. Doe/Eia-0484; 2016; pp. 202–586. Available online: https://www.eia.gov/outlooks/ieo/pdf/0484 (accessed on 3 April 2019).
- Abdelaziz, E.A.; Saidur, R.; Mekhilef, S. A review on energy saving strategies in industrial sector. Renew. Sustain. Energy Rev. 2011, 15, 150–168. [Google Scholar] [CrossRef]
- Yildiz, B.; Bilbao, J.I.; Sproul, A.B. A review and analysis of regression and machine learning models on commercial building electricity load forecasting. Renew. Sustain. Energy Rev. 2017, 73, 1104–1122. [Google Scholar] [CrossRef]
- Chang, W.; Chang, J.W.; Yin, H.; Wang, W.J.; Chung, H.Y.; Chang, Y.C.; Chen, H.C. Energy-saving algorithm for pumping systems based on fuzzy decision making. In Proceedings of the IEEE International Conference on Systems, Man, and Cybernetics (SMC), Seoul, South Korea, 14–17 October 2012; pp. 2395–400. [Google Scholar] [CrossRef]
- Ahonen, T.; Tamminen, J.; Viholainen, J.; Koponen, J. Energy efficiency optimizing speed control method for reservoir pumping applications. Energy Effic. 2014, 8, 117–128. [Google Scholar] [CrossRef]
- Ge, Z.; Song, Z.; Ding, S.X.; Huang, B. Data Mining and Analytics in the Process Industry: The Role of Machine Learning. IEEE Access 2017, 5, 20590–20616. [Google Scholar] [CrossRef]
- Najafi, M.; Auslander, D.M.; Bartlett, P.L.; Haves, P.; Sohn, M.D. Application of machine learning in the fault diagnostics of air handling units. Appl. Energy 2012, 96, 347–358. [Google Scholar] [CrossRef]
- Campana, P.E.; Li, H.; Yan, J. Dynamic modelling of a PV pumping system with special consideration on water demand. Appl. Energy 2013, 112, 635–645. [Google Scholar] [CrossRef]
- Wen, L.; Li, X.; Gao, L.; Zhang, Y. A New Convolutional Neural Network-Based Data-Driven Fault Diagnosis Method. IEEE Trans. Ind. Electron. 2018, 65, 5990–5998. [Google Scholar] [CrossRef]
- Daut, M.A.M.; Hassan, M.Y.; Abdullah, H.; Rahman, H.A.; Abdullah, M.P.; Hussin, F. Building electrical energy consumption forecasting analysis using conventional and artificial intelligence methods: A review. Renew. Sustain. Energy Rev. 2017, 70, 1108–1118. [Google Scholar] [CrossRef]
- Alobaidi, M.H.; Chebana, F.; Meguid, M.A. Robust ensemble learning framework for day-ahead forecasting of household based energy consumption. Appl. Energy 2018, 212, 997–1012. [Google Scholar] [CrossRef]
- Zhao, L.; Wang, X. A Deep Feature Optimization Fusion Method for Extracting Bearing Degradation Features. IEEE Access 2018, 6, 19640–19653. [Google Scholar] [CrossRef]
- Li, C.; Zhang, W.; Peng, G.; Liu, S. Bearing Fault Diagnosis Using Fully-Connected Winner-Take-All Autoencoder. IEEE Access 2017, 6, 6103–6115. [Google Scholar] [CrossRef]
- Fan, C.; Xiao, F.; Zhao, Y. A short-term building cooling load prediction method using deep learning algorithms. Appl. Energy 2017, 195, 222–233. [Google Scholar] [CrossRef]
- Mocanu, E.; Nguyen, P.H.; Gibescu, M.; Kling, W.L. Deep learning for estimating building energy consumption. Sustain. Energy Grids Netw. 2016, 6, 91–99. [Google Scholar] [CrossRef]
- Čudina, M. Detection of cavitation phenomenon in a centrifugal pump using audible sound. Mech. Syst. Sig. Process. 2003, 17, 1335–1347. [Google Scholar] [CrossRef]
- Nandi, S.; Toliyat, H.A.; Li, X. Condition monitoring and fault diagnosis of electrical motors—A review. IEEE Trans. Energy Convers. 2005, 20, 719–729. [Google Scholar] [CrossRef]
- Bhowmik, P.S.; Pradhan, S.; Prakash, M. Fault diagnostic and monitoring methods of induction motor: A review. Int. J. Appl. Control Electr. Electron. Eng. 2013, 1, 1–18. [Google Scholar]
- Godoy, W.F.; da Silva, I.N.; Goedtel, A.; Palácios, R.H.C. Evaluation of stator winding faults severity in inverter-fed induction motors. Appl. Soft Comput. 2015, 32, 420–431. [Google Scholar] [CrossRef]
- Viholainen, J. Energy-Efficient Control Strategies for Variable Speed Driven Parallel Pumping Systems Based on Pump Operation Point. Energy Effic. 2014, 6, 495–509. [Google Scholar] [CrossRef]


| Parameters | Values | Parameters | Values |
|---|---|---|---|
| Rated Power | 0.46 kW | Voltage | 415 V |
| Rated Speed | 2887 RPM | Frequency | 50 Hz |
| Flow rate | 3.1 m3/h | Phase | 3 Phase |
| Head | 2.02 bars | VFD Power | 2.2 kW |
| VFD | Danfoss (FC202) | Grundfos Pump | CM3-5ARAV |
| Set Pressure | Pump 1 (VFD) | Pump 2 (DOL) | Pump 3 (DOL) |
|---|---|---|---|
| 0.1 Bars | ✓ | • | • |
| 0.3 Bars | ✓ | ✓ | • |
| 0.5 Bars | ✓ | ✓ | ✓ |
| Set Pressure | Pumps ON | P1 | P2 | P3 | Total (Watts) |
|---|---|---|---|---|---|
| 0.1 Bars | P1 | 100 | - | - | 100 |
| 0.3 Bars | P1 | 180 | - | - | 180 |
| P1+P2 | 60 | 170 | - | 330 | |
| 0.5 Bars | P1 | 160 | - | - | 160 |
| P1+P2 | 80 | 180 | - | 360 | |
| P1+P2+P3 | 50 | 180 | 170 | 400 |
| Set Pressure | Pumps ON | P1 | P2 | P3 | Total (Watts) |
|---|---|---|---|---|---|
| 0.1 Bars | P1 | 104 | - | - | 104 |
| 0.3 Bars | P1 | 92 | - | - | 92 |
| P1+P2 | 25 | 5 | - | 30 | |
| 0.5 Bars | P1 | 96 | - | - | 96 |
| P1+P2 | 25 | 5 | - | 30 | |
| P1+P2+P3 | 6 | 5 | 5 | 16 |
| Parameters | Normal Condition | Cavitation | Water Hammering |
|---|---|---|---|
| Acceleration (g) | 0.05 | 0.07 | 1.1 |
| Velocity (mm/s) | 0.3 | 0.5 | 1.2 |
| Displacement (µm) | 4 | 5 | 40 |
| Faults (Target Value) | No-Fault | Cavitation | Water Hammering | |||
|---|---|---|---|---|---|---|
| Voltage (V) | 410 | 411.0 | 407.57 | 406.22 | 402.37 | 403.12 |
| Current (I) | 2.13 | 2.45 | 3.74 | 3.83 | 0.84 | 0.82 |
| Power Drawn (kW) | 0.29 | 0.31 | 0.42 | 0.41 | 0.12 | 0.11 |
| Voltage THD (%) | 0.90 | 0.86 | 2.01 | 2.10 | 0.81 | 0.70 |
| Current THD (%) | 61.44 | 59.77 | 108.70 | 108.70 | 72.70 | 81.40 |
| Pump speed (rpm) | 2883 | 2904 | 2450 | 2530 | 2750 | 2742 |
| Differential Pressure (m) | 106.4 | 110.2 | 92.2 | 93.7 | 135.3 | 129.1 |
| Flow rate (m3/h) | 1.5 | 1.42 | 2.23 | 2.17 | 0.92 | 1.10 |
© 2019 by the authors. Licensee MDPI, Basel, Switzerland. This article is an open access article distributed under the terms and conditions of the Creative Commons Attribution (CC BY) license (http://creativecommons.org/licenses/by/4.0/).
Share and Cite
Arun Shankar, V.K.; Subramaniam, U.; Padmanaban, S.; Holm-Nielsen, J.B.; Blaabjerg, F.; Paramasivam, S. Experimental Investigation of Power Signatures for Cavitation and Water Hammer in an Industrial Parallel Pumping System. Energies 2019, 12, 1351. https://doi.org/10.3390/en12071351
Arun Shankar VK, Subramaniam U, Padmanaban S, Holm-Nielsen JB, Blaabjerg F, Paramasivam S. Experimental Investigation of Power Signatures for Cavitation and Water Hammer in an Industrial Parallel Pumping System. Energies. 2019; 12(7):1351. https://doi.org/10.3390/en12071351
Chicago/Turabian StyleArun Shankar, V.K., Umashankar Subramaniam, Sanjeevikumar Padmanaban, Jens Bo Holm-Nielsen, Frede Blaabjerg, and S. Paramasivam. 2019. "Experimental Investigation of Power Signatures for Cavitation and Water Hammer in an Industrial Parallel Pumping System" Energies 12, no. 7: 1351. https://doi.org/10.3390/en12071351
APA StyleArun Shankar, V. K., Subramaniam, U., Padmanaban, S., Holm-Nielsen, J. B., Blaabjerg, F., & Paramasivam, S. (2019). Experimental Investigation of Power Signatures for Cavitation and Water Hammer in an Industrial Parallel Pumping System. Energies, 12(7), 1351. https://doi.org/10.3390/en12071351