Article

Viability Evaluation of Three Grass Biofuels: Experimental Study in a Small-Scale Combustor

1
Industrial Engineering School, University of Vigo, Campus Lagoas-Marcosende, s/n, 36310 Vigo, España
2
VSB-TU Ostrava, Centre ENET, Bulk Solid Centre, 17. listopadu 15, 708 33 Ostrava, Czech Republic
*
Author to whom correspondence should be addressed.
Energies 2019, 12(7), 1352; https://doi.org/10.3390/en12071352
Submission received: 2 January 2019 / Revised: 29 March 2019 / Accepted: 30 March 2019 / Published: 9 April 2019

Abstract

:
This experimental study focusses on the viability of three low-grade biofuels in small-scale biomass units of 7–12 kW The tested materials were homemade grass pellets (gp1 and gp2) and a mixture of leaves and woody pellets (lp50) that were made without binders and completely characterized in terms of their chemical and physical properties (proximate analysis, elementary composition, ash content, flowability, etc.). The results obtained with the non-commercial fuels were compared with commercial wood pellets (wp). The viability study comprised the operational parameter influences, such as primary and secondary airflow, fuel consumption, etc., together with the impact of those parameters on the main problems in combustion (concentration and particle distribution, fouling and slagging). The results revealed that the biomass whose behavior during combustion induced fewer particulate emissions and deposits was the mixed fuel, made of 50% leaf + 50% wood pellet (lp50). Contrary to the grass-based pellets, lp50 has the possibility of being used in commercial devices with the incorporation of processes during the manufacturing that improve their properties.

1. Introduction

Rising fossil fuel prices, increased concern about the environment and climate change, and increased dependence on energy [1] have all led to a growing interest in the production of sustainable energy. Biomass is one of the most important sources and it is widely used for heat and power production, especially in the EU countries [1]. The increase in demand of raw material for pellet production has increased the price of sawdust and given rise to a very competitive situation. To cope with these strong demands, people have begun to look for new sources of biomass for fuel production [2]. In recent years, small scale combustion technologies that use pellets as fuel have become a commercial alternative, particularly in Europe [3,4]. Currently there are companies that produce boilers exclusively designed to burn grass pellets, and others have been adapted to different raw materials [5].
The increase in biomass demand has led the search for new production sources and to guarantee their availability and supply. The availability of biomass from wood is increasingly limited and this situation has caused the hunt for new agroforestry residues [6,7]. Numerous studies have been focused on the investigation of new fuel properties to use as biomass. Royo et al. utilized four different agropellets made of residual agricultural biomass for studying the combustion properties using of each them in a laboratory fixed bed reactor, obtaining satisfactory results. This research work helps researchers make choices related to the design and operation of facilities for the utilization of agricultural residues biomass [8]. Verma et al., due to a growing market for sunflower husks in Belgium, Ukraine, and Poland, decided to compare them with other fuels (wood, apple pomace, peat…) in a residential pellet boiler, reaching efficiency values of up to 92.4% in the best case scenario [5,9]. Sampson et al. used biomass from agriculture, such as switchgrass and energy crops, and they verify the viability of their production with low cost and reduction of greenhouse effect because they have an important potential to displace fossil fuels [10]. Gonzalez et al. investigated the combustion of pellets made with different agricultural residues (forest, tomato plant, cardoon, and olive bone) for domestic heat production. They also investigated the mixture of these fuels in different percentages. In this study some combustion parameters have been analyzed and it was determined that the behavior of the residues is similar to that of the forest pellet. Besides, they verified that the optimum residue mixture was forest (25%) and tomato (75%) [11]. Regueiro et al. analyzed the viability of three non-commercial fuels (barley pellet, leaf pellet (100%), and a mixture with leaf pellet (25%) and wood pellet (75%)) through the study of different combustion parameters. They concluded that the first two options were a bad alternative. Nevertheless, the last one could be a good an option, although its commercialization it needs the incorporation of additives to improve the fuel properties. The particulate matter (PM) emissions for the low-grade biofuels were between 257 mg/Nm3 and 325 mg/Nm3, 17 mg/Nm3 and 43 mg/Nm3, and 22 mg/Nm3 and 53 mg/Nm3 for pellet made of barley, leaf, and a mixture of 25% leaf/–75% wood, respectively [12]. Andreasen and Larsen studied straw pellet combustion and compared their results with wood pellets. They verified that these kinds of pellets without antislag agents cause important problems with slag formation, the amount of dust in the fuel causes operational problems and increase the emissions, making the straw pellets unsuitable for some of the tested boilers [13]. Olsson et al. [14] investigated combustion with peat and wheat straw pellets. Results were compared with those of wood pellets, the latter being the one that presented the best efficiencies. Furthermore, straw pellet after-flame smouldering resulted released high concentrations of compounds that are hazardous to environment and human being health, such as carbon monoxide and nitrogen oxides. In some studies carried out it has been verified that the desired properties for any fuel are low ash content, low slagging tendency, and high calorific value [15,16,17]. Nevertheless, delimbing and defoliation in trees are used for producing fuels of better quality because of the ash content reduction [18].
The boiler efficiency, gaseous and particle emissions, or fouling and slagging vary according to the fuel quality, operating conditions, and the technologies used [6,7,17,19,20,21]. Focusing on fuel, there are a number of properties with important relevance, such as, physical and chemical features, mass and energy density, calorific value, chemical composition, and total amount of ash and moisture [22]. Numerous studies have focused on different operational parameters and their influence on combustion. Some authors verified that the fuel quality is truly important for guaranteeing low emissions and a good burning process [3,23]. Eskilsson et al. verified that the design and control of a biomass combustor depends on the fuel calorific value [24]. Mohon Roy et al. tested grass pellets and proved that the emissions were always less than 400 mg/Nm3. In addition, they found a correlation between the NOx emissions and the nitrogen fuel content [25]. Other studies conducted in small scale boilers and combustors with commercial fuels provided concentrations between 13 mg/Nm3 to 34 mg/Nm3 [26,27,28,29]. Finally, numerous studies have found that high concentrations of silicon (an element with a low melting point) along with alkali metals, especially potassium, are the prerequisites for the onset and progression of slagging and fouling phenomena [9,18,20,30,31]. In other studies, it was found that Si, Ca, Mg, K, and P had a higher tendency for slagging because of their low melting points. In cases in which alkaline metals are mixed with Cl and S, a new problem appears in the facilities, corrosion [32,33].
Previous works have burnt non-commercial biomass in specific boilers or modified existing boilers. In this particular study, three never before used grass-based types of fuels (gp1, gp2, and lp50) are tested in an experimental burner. The objective is to carry out a complete study of the suitability of each one to be used in commercial devices, comprising the influence of the main operating conditions together with the evaluation of results relative to the most important combustion problems (particulate matter—PM concentration and distribution, slagging and fouling). Through a deep investigation, the authors aim to evaluate the commercial viability of these novel and low-grade biofuels.

2. Materials and Methods
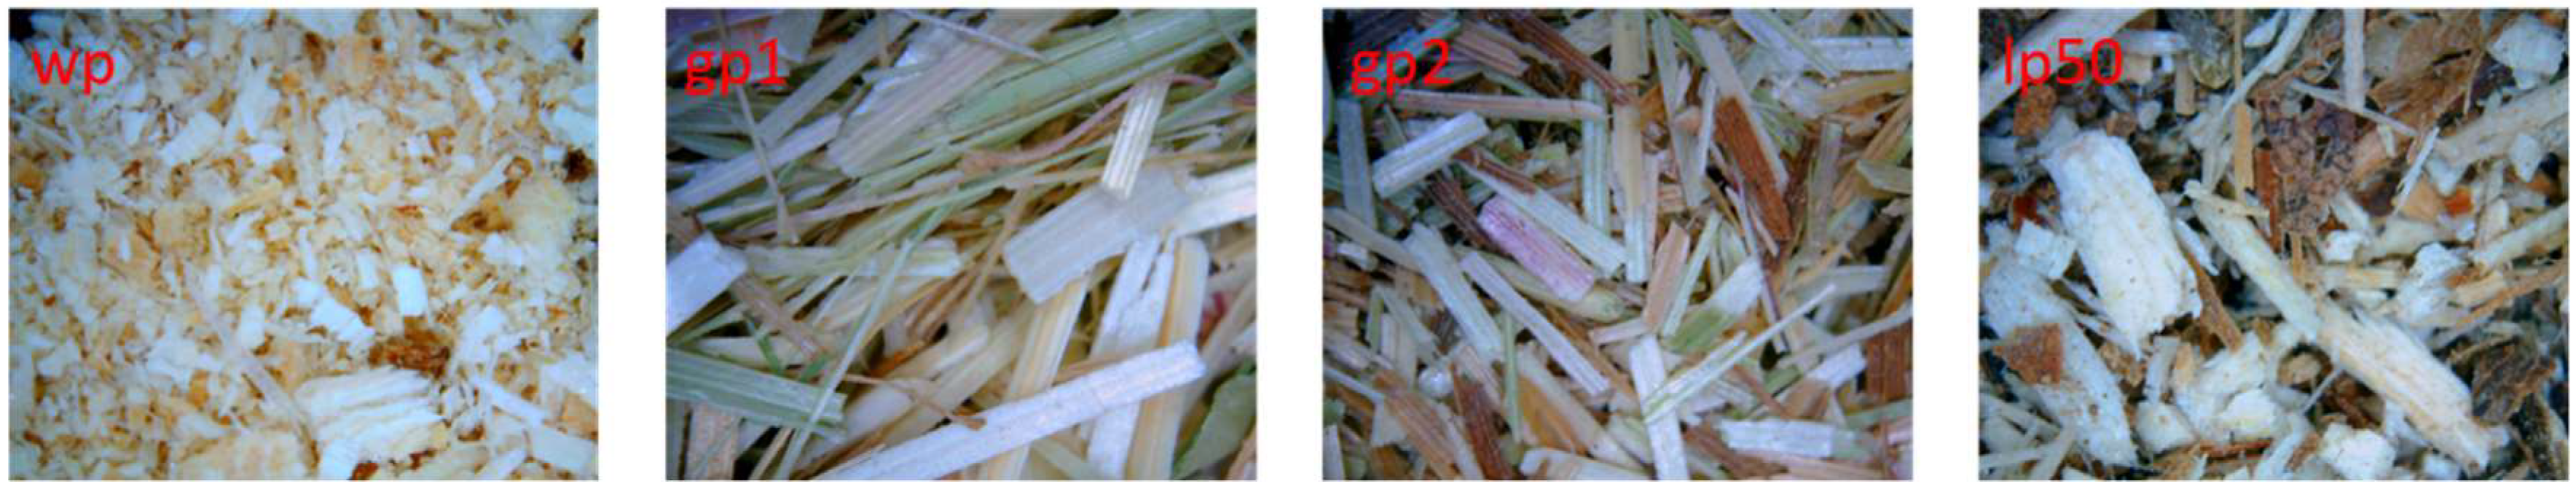
2.1. Fuels

In this study, four different fuels were used (Figure 1). One is a commercial wood pellet marked as wp (Biomac Ltd., Unicov, Czech Republic, pellet diameter 6 mm) and the other three are non-commercial pellets that have not been used so far. Two of them are made of grass: gp1-tall oat grass (Avena sativa) and gp2-bent grass (Agrostis bacillata) and the other consists of a mixture of 50% urban pruning residue (leaves) and 50% spruce sawdust (lp50). The input raw materials for the evaluated wood pellets (wp) were spruce sawdust.
The grasses were grown separately on single-breeding sowing areas in Moravian-Silesian Region of the Czech Republic. These areas are the sandy-loam soil (type brown-soil). Nitrogen fertilization was carried out in the autumn and in the spring. The samples were harvested in harvest maturity by the combine harvester in one phase in August (2017). Tall oat grass is a sturdy, perennial cultural grass growing in separate bunches, reaching a height over 150 cm. It is a broadly widespread species, growing especially in lowland to foothills, meadows, and pastures. Bent grass is a medium-height (100 cm) winter perennial grass with short underground stems. It is used as a supplementary species in extensive permanent meadows and pasture grassland on heavier soils and wetlands. These grasses were dried to 15% moisture for pelletization (see below in the text). Tree leaves from the parks located in Ostrava in the Czech Republic (Moravian-Silesian Region) were used for the next sample (Figure 1—marked as lp50—50% urban leaves and 50% spruce sawdust from sawmill operations). The leaves were mainly from trees such as maple (Acer pseudoplatanus), European ash (Fraxinus excelsior), and chestnut (Aesculus hippocastanum) and were collected by the leaf collector machine (vacuum sweepers) of OZO Ltd., Ostrava, Czech Republic in Autumn 2017. These leaves and spruce sawdust were dried to 14% moisture (for pelletization).
Table 1 provides a detailed proximate, elemental, and ash analysis, and different fouling indexes have been calculated. Observing the data contained in the table, in relation to the proximate analysis, the percentage of moisture, volatiles, and char are quite similar in all fuels, highlighting noticeable variations among the ash percentage. Whereas wp fuel takes a value of 0.57% in accordance with previous studies [34,35,36,37], non-commercial fuels (gp1, gp2 and lp50) present higher amounts than other sources [20], even reaching 5.97% for gp1. Independently of the used fuel, the analyzed ash is formed fundamentally by silicon, calcium, and potassium [18]. In addition, it contains important amounts of phosphorus, Sulphur, Chlorine, and Iron.
In this research, different theoretical indexes have been calculated to make an approximation of the facility behavior with each of the tested-fuels. The indexes do not give definitive results but an approximation to have a general idea. Based on the alkaline index, the possibility of fouling with wp is eminent because its value in all cases is higher than 0.17 [38]. The acid to basic ratios varied between 0.42 to 2.37; therefore, the tendency to form slagging will be medium for non-commercial and low for commercial fuels [39]. However, based on the slag ratio [40], the tendency to form slagging is high for wp and lp50, (slag ratio < 65) and low for gp1 and gp2, (slag ratio > 72). In relation with the fouling ratio, the tendency to form fouling is high for all fuels except wp. For wood pellet, this index is very high according to Pronobis et al. [41].

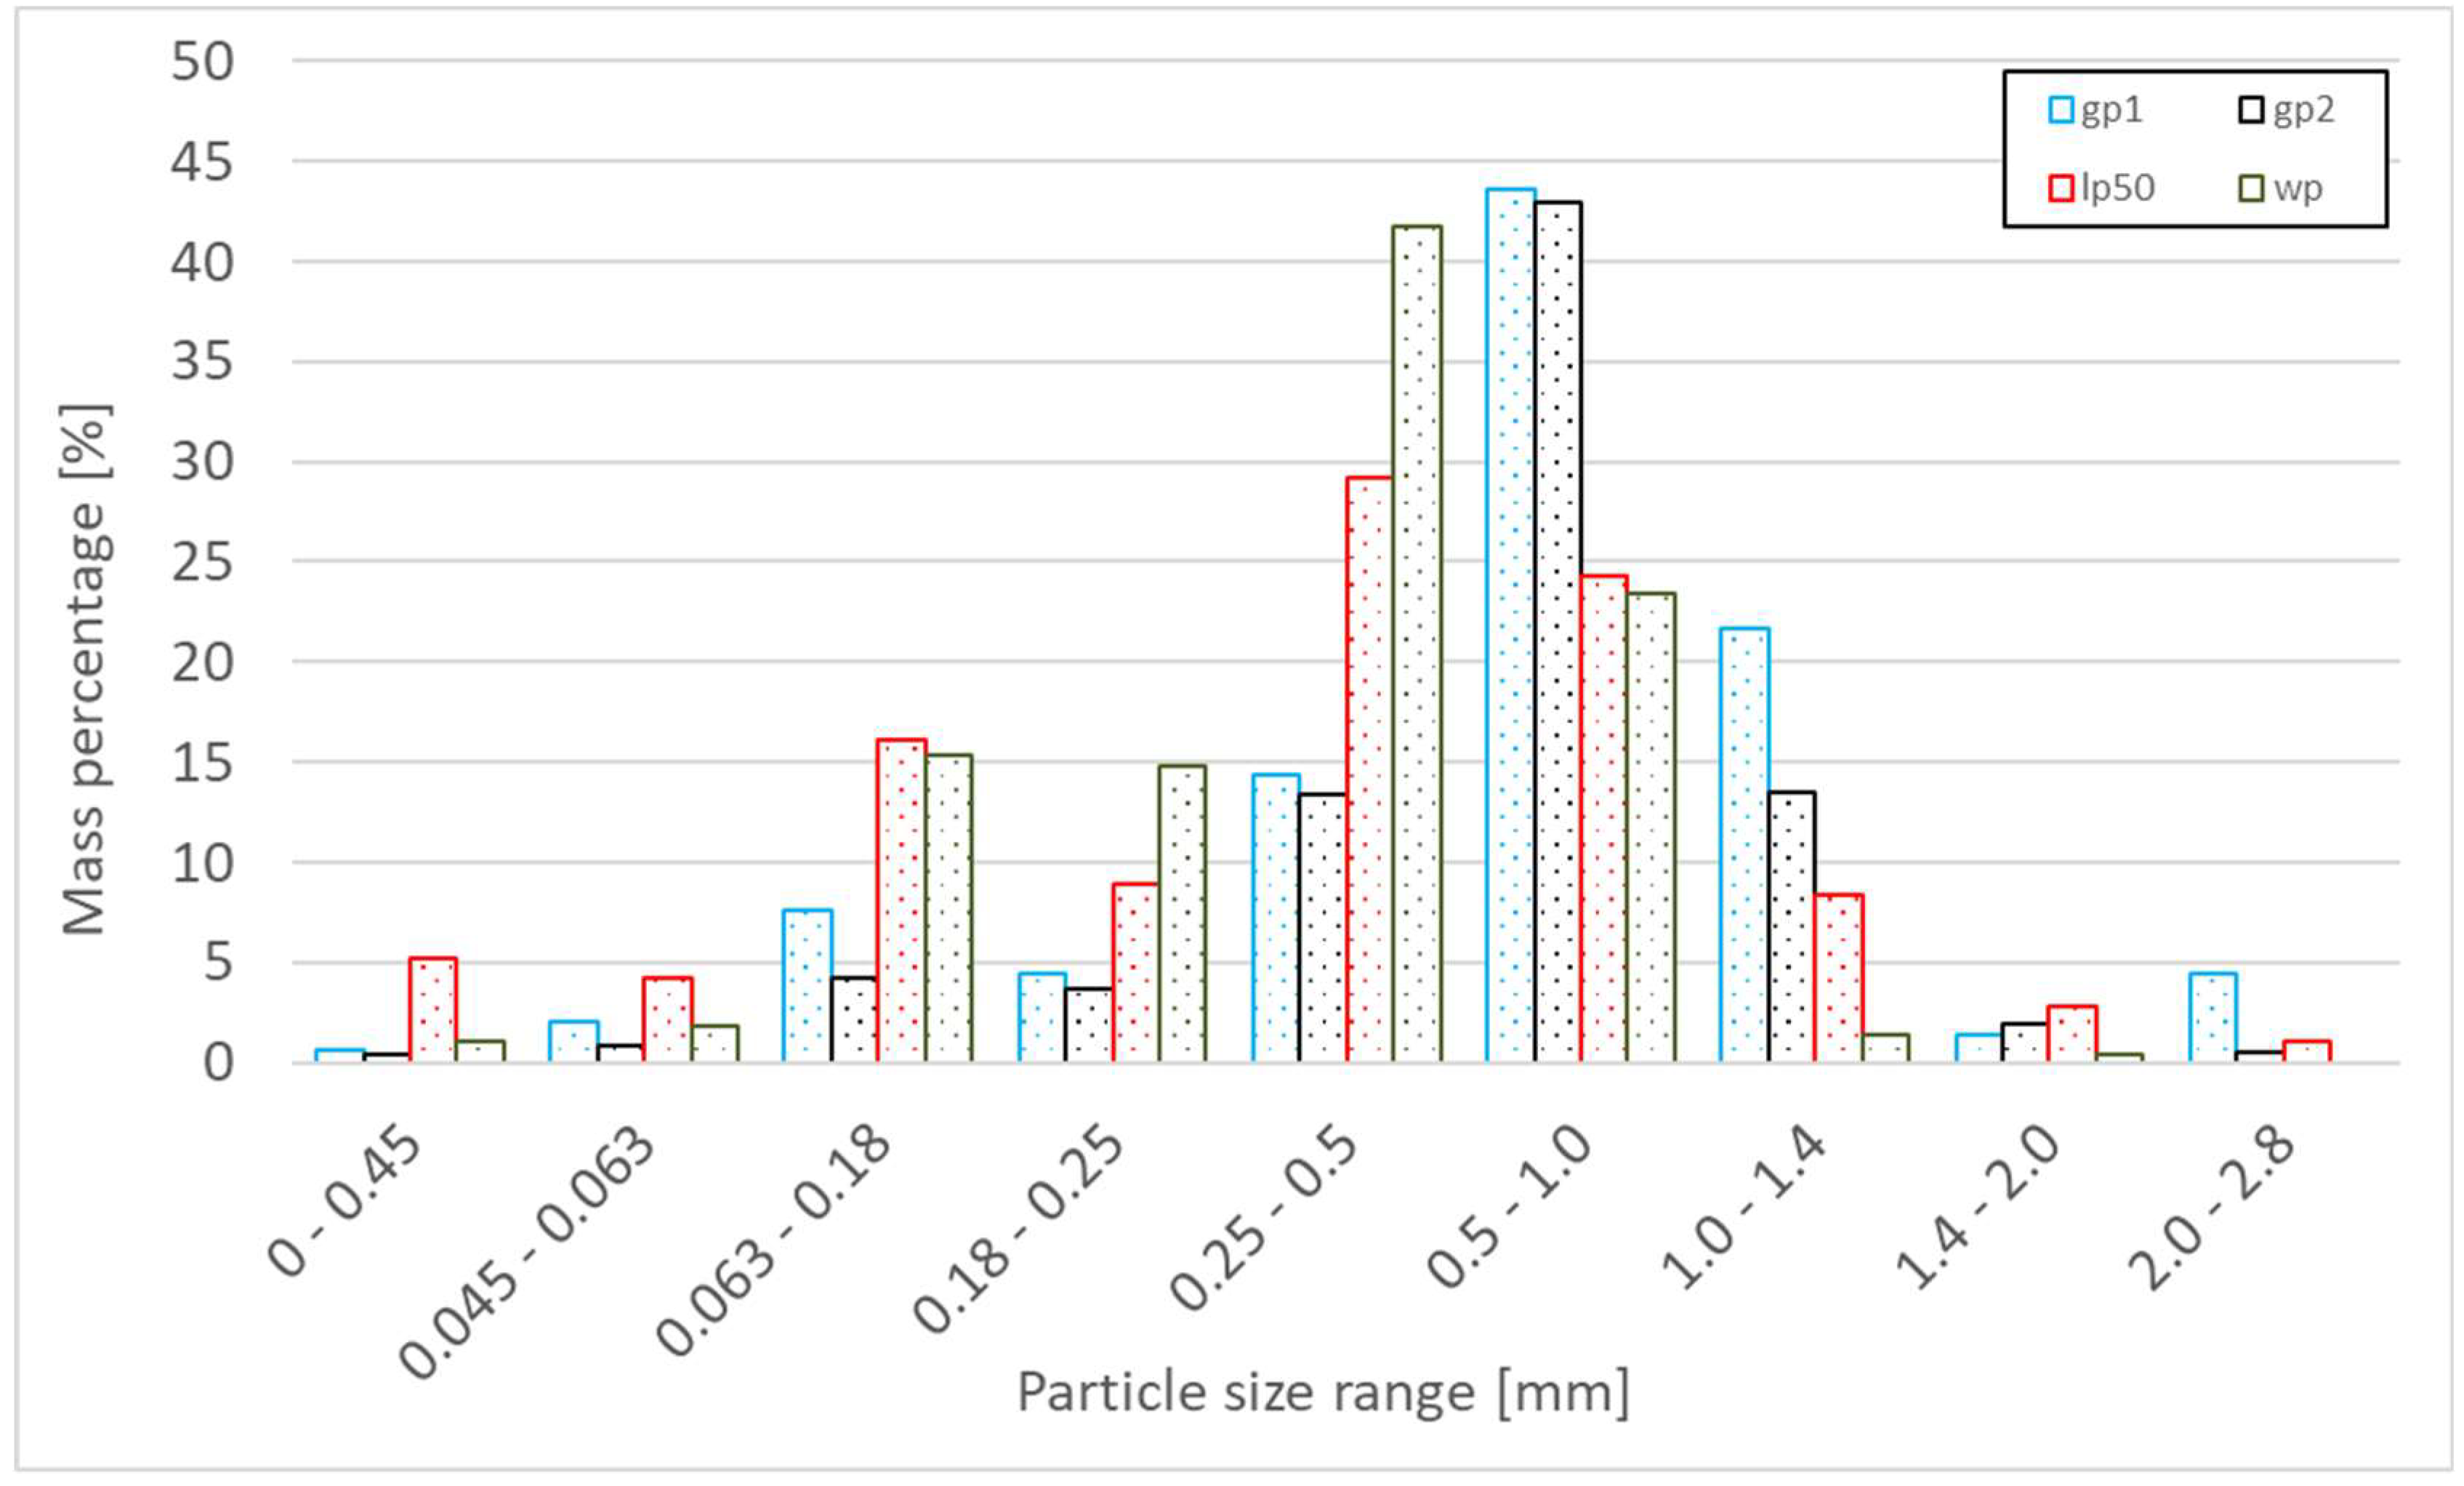
2.2. Particle Size Distribution, Flowability and Shear Properties of Raw Input Materials and Pelletization

The basic characteristics such as flowability and shear properties were determined for raw input grasses, leaves, and spruce sawdust mixtures from which the pellets were made to predict their processing possibilities.
For particle size analysis, a Retsch (Haan, Germany) AS 200 Control vibrating machine (20 min, amplitude 4 mm) with standard sieves (DIN ISO 3310-1) was used. The moisture content was determined by moisture analyzer Excellence Plus HX204 (Mettler Toledo, Greifensee, Switzerland).
Optimum flowability for alternative fuels in input bulk form is crucial in the manufacturing process. The pelletization process itself can be divided into several steps. The first is the discharge of bulk materials from the hopper, flow into the feed frame by screw conveyor, die filling, compression, and cutting pellets. Each of these steps has a specific set of conditions such as flow rate, stresses, equipment surface, etc. The flowability of bulk input materials is therefore one of the important process parameters. In this study, three methods for flowability evaluation were used. The traditional flowability methodology measurement of angle of repose (AoR), as well as Carr’s index [42] and the Hausner ratio [43] calculated from bulk and tapped densities were determined. The third flowability method was the shear test [44]. The comparison of flowability for those alternative materials provides critical insight into their use for the pelletizing process.
A patented device (Zenegero) for angle of repose measurement was used [45]. The input raw materials were poured into the cell while gradually creating the pile. Then, the drive makes the cell rotate around its vertical axis and the camera successively records a pile of all eight sides. The results were evaluated by software. The classification system of the bulk materials flowability according to the angle of repose is shown in Table 2 [46].
Carr’s index (CI) and the Hausner ratio (HR) are given by Equations (1) and (2). Where ρT is tapped density and ρB is the bulk density of raw materials. Classification of bulk materials flowability according to the calculated values CI and HR is shown in Table 3.
C I =   ρ T ρ B ρ T · 100 [ % ]
H R =   ρ T ρ B [ ]
When tapped density was evaluated the cylinder was filled with a certain mass of raw materials. The initial volume was measured in three parallels and poured densities were calculated. After 10, 250, 500, and 1250 taps the corresponding volume was read. As the difference in all cases between V500 and V1250 was smaller than 2 mL, the V1250 was used to calculate tapped density.
The flow index (ffc) was calculated from internal friction measurements. The friction parameters (effective angle of internal and wall friction) were measured by the Schulze ring shear tester (RST 01, Wolfenbuttel, Germany) according to ASTM D6773 [44]. The flow index (ffc) is the ratio of major consolidation stress (σ1) to unconfined yield strength (σc). Material was classified according to rules developed by Jenike, as performed in previous work [12]. Flow characteristics were determined at room temperature 23 °C ± 1 °C and the relative humidity was 46% ± 2%.
All input energy grasses, leaves, and spruce sawdust were dried in Binder oven at 40 °C (Model FED 400, Tuttlingen, Germany) and then crushed in a hammer grinder (Green Energy 9FQ 50, Uhersky Brod, Czech Republic). A laboratory pellet press with a flat die was used for pelletization (KAHL 14-175, Amandus Kahl GmbH & Co. KG, Reinbek, Germany). One and the same die was used in identical conditions for all the pellets. Pellets were made with a diameter of 6 mm, aiming to have the same dimensions that the commercial wood biomass. No binders were added in this study.

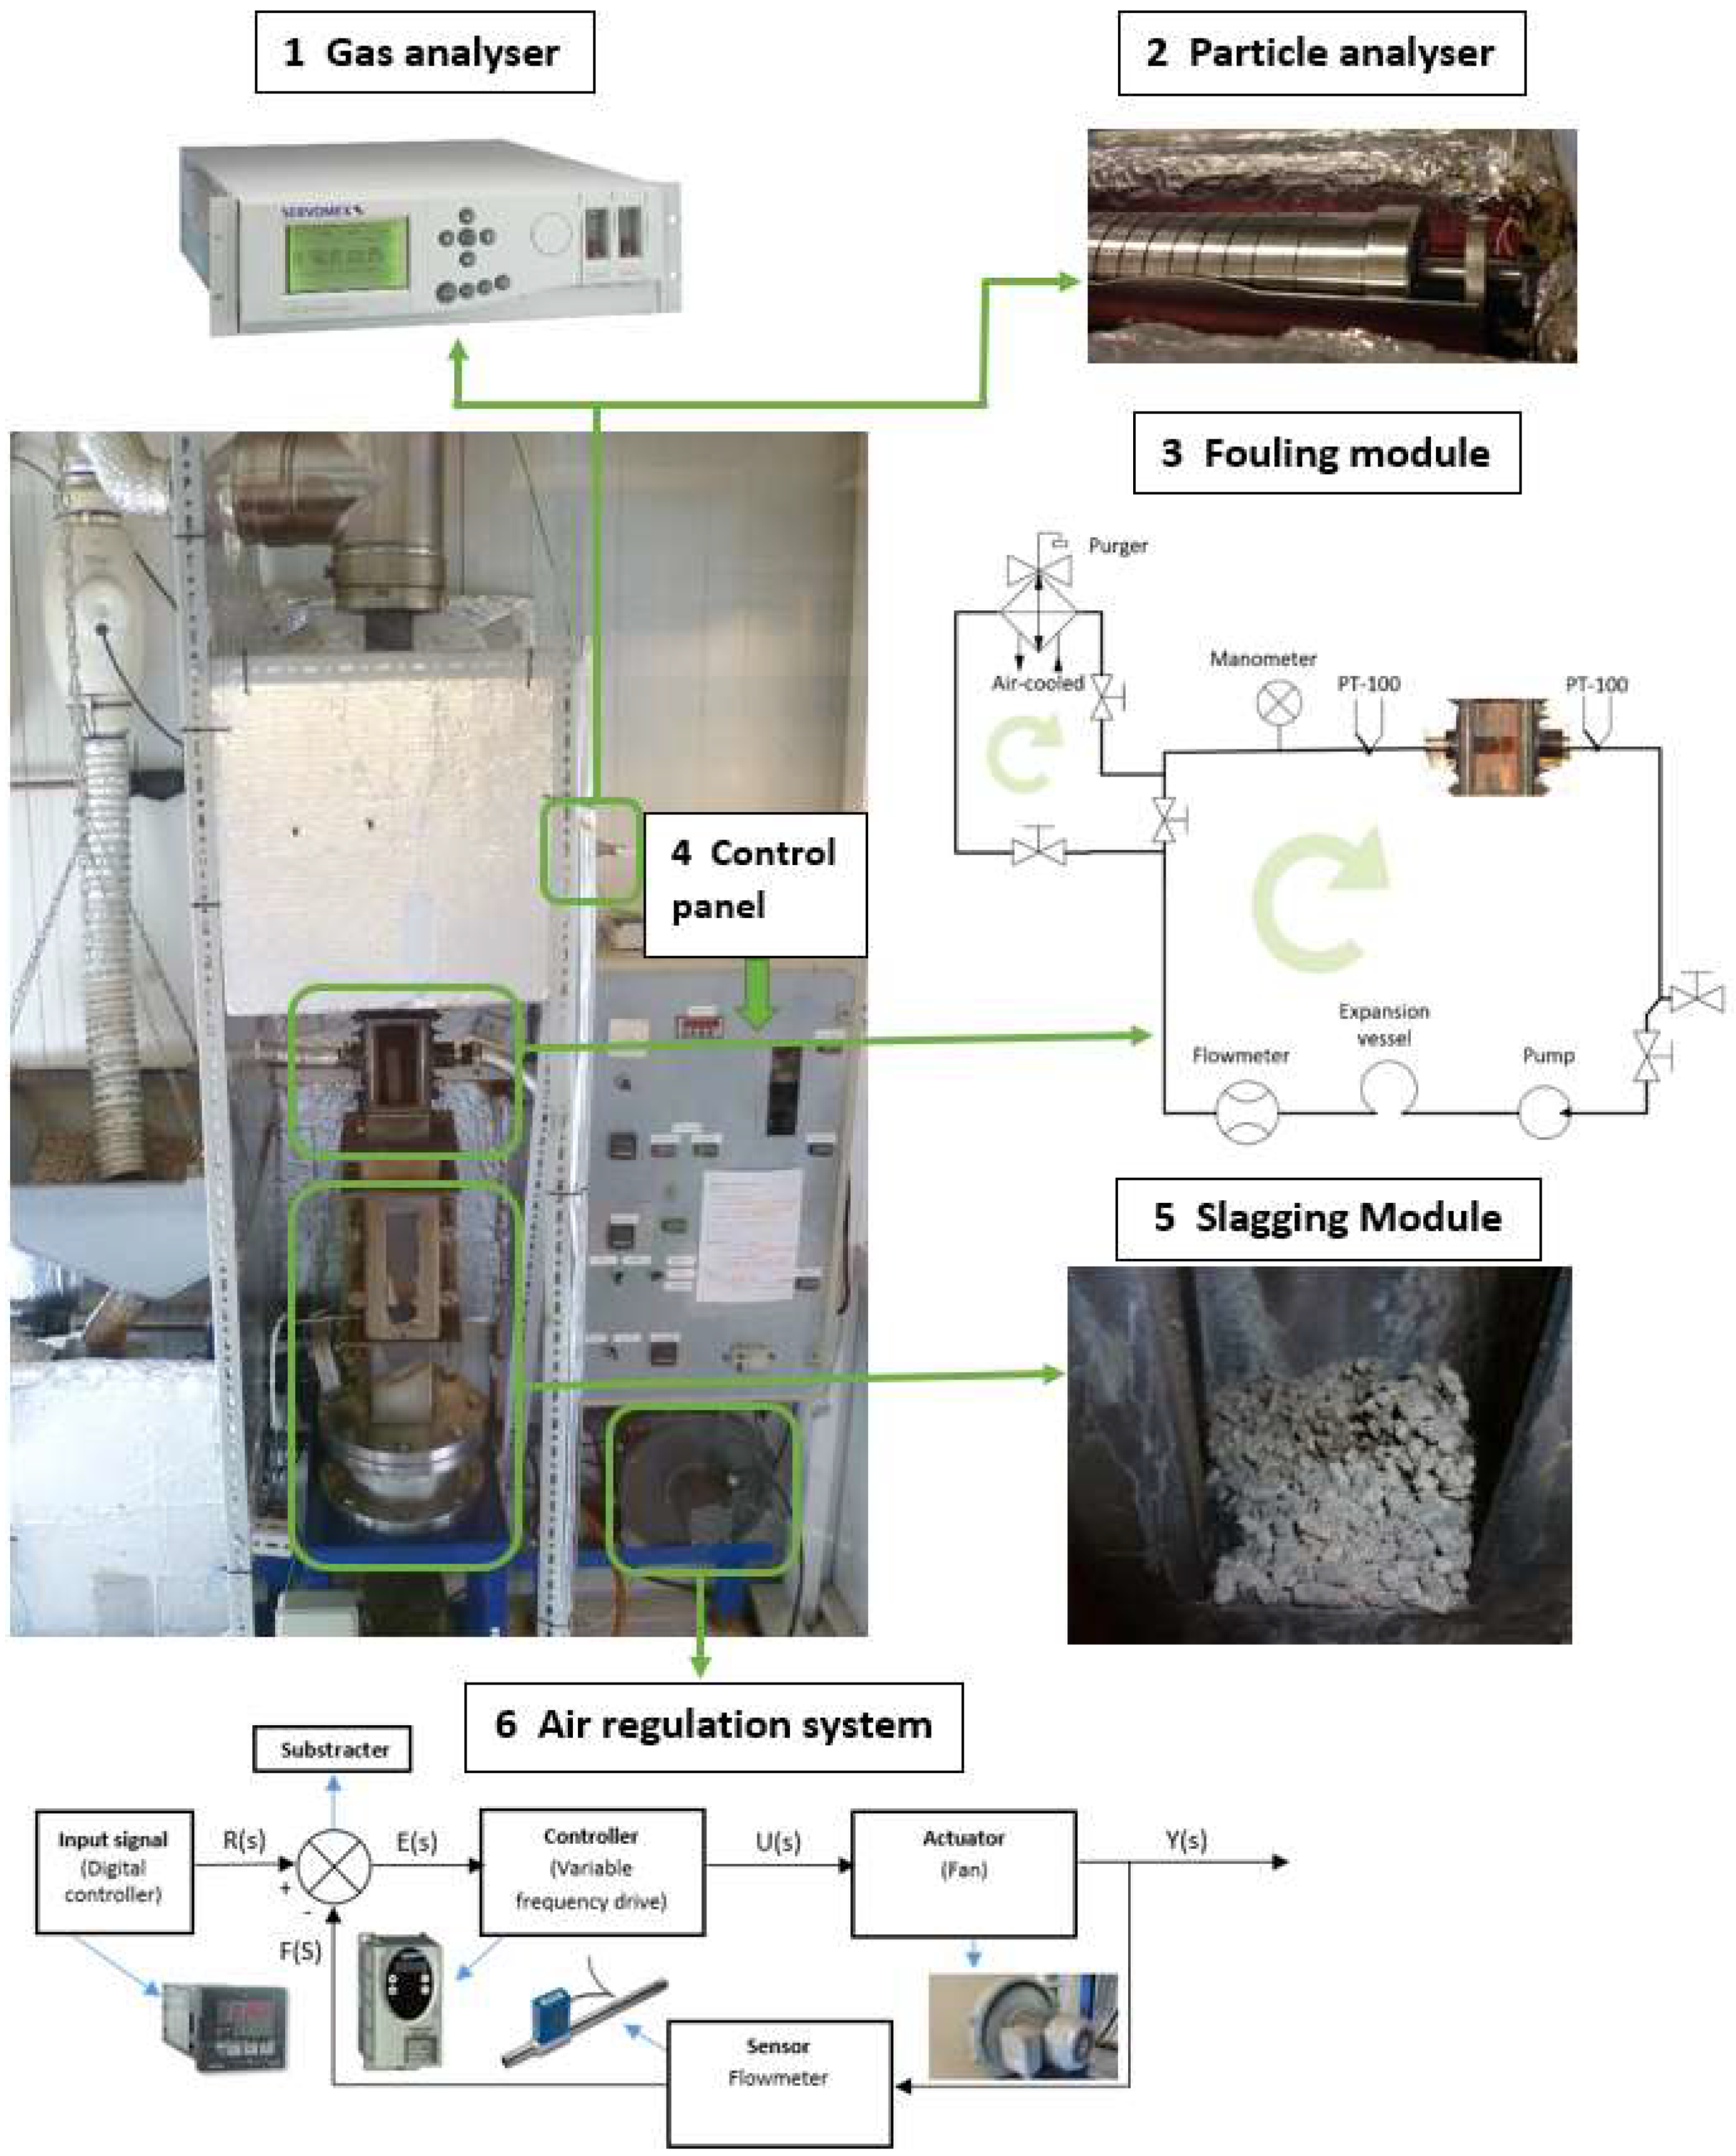
2.3. Experimental Biomass Combustor and Measurement Equipment

The general scheme of the combustor with its different sections is represented in Figure 2. In addition, Figure 2 emphasizes certain parts of the installation important for development of the tests. The burning plant is a biomass small-scale combustor with underfeed fixed bed and air staging (with primary and secondary air inlets), supplying thermal power between 5 kW and 12 kW (300 kW/m2–900 kW/m2).
The facility, with modular structure, has two air inlets: the primary entrance ( m 1 ˙ ) located at the bottom, and the secondary inlet ( m 2 ˙ ) between the burner and the deposition sampling module. The primary air goes into the burner through a grate, being responsible for initiating combustion and allowing the fuel reaction in the bed. The access of secondary air is through a module that has 44 holes each with a diameter of 4.4 mm uniformly distributed along its inner perimeter. The mass flow rate is controlled by a closed loop circuit in both cases. The scheme of the feeding air regulation is represented in detail in Figure 2 (detail 1): the air is supplied by a centrifugal fan and the flow is measured with a flow meter sensor (VPF.R200.100); the fan speed is controlled by a variable frequency drive (Altivar 31), connected to a digital PID controller (Omrom E5CK) that allows one to set the desired flow.
The fuel enters the combustion chamber through a screw activated with an electrical motor, which can work both manually or automatically, using a timer. A load cell is used to determine the mass. The fouling module is situated just above the secondary air inlet and allows one to study deposition over a probe that simulates a boiler heat exchanger. In Figure 2 (detail 2), the deposition sampling module with its refrigeration circuit has been represented. The water sampling-probe is located inside the module and its diameter is 25 mm. The cooling circuit counts with two PT100 are responsible for measuring the inlet and outlet sampling probe temperature. A detailed description of the installation has been carried out in a previous study [36].
Just above the fouling module, along the chimney module, there are two gas outlets for sampling: one leads to a particle impactor (Dekati DLPI with 13 scales) and the other to the gas analyzer (SERVOMEX 4900). These two measurement systems have been represented in Figure 2 (details 3 and 4). At its top, the facility counts with a dilution module, where the exhaust gases are mixed with a stream of ambient air to reduce their temperature, ensuring it is less than 200 °C.

2.4. Experimental Methodology

To determine the stability period and the optimum parameters for the facility, a series of preliminary tests were carried out. The total duration of each is related to the fuel characteristics, especially ash content [12]. The total duration of the tests carried out in this study was 2 h and 30 min, consisting of an initial transient period of 45 min, a stationary period of 1 h and 30 min, and a shutdown of 15 min for each combustion. During the tests, the type of fuel used (wp, gp1, gp2, lp50) and the air staging ratios between primary and secondary air (30–70%; 40–60% and 50–50%) were modified.
A thirteen-stage Dekati DLPI low-pressure impactor, was used to measure the concentration and distribution of released particulate matter (PM). To avoid condensation in the gas stream, the sampling lines were heated to 130 °C. Aluminium filters were used in each stage for PM collection, and they received a thermal treatment before and after each test according to the standard norm UNE-303-5:2012. In these tests, a totalizator was not employed [36].
To determine the gas composition, a SERVOMEX 4900 gas analyzer was used that facilitates %O2, %CO, %CO2, and vpm NOx measurements. The sampled gas-flow has to be conditioned before being sent to the analyzer to reduce moisture and remove soot particles [47].
In this research, a study of combustion residue deposition over the heat exchangers was carried out. With this purpose, the facility counts with a deposition probe, which acts as a water-cooled mono-tube exchanger, located inside the deposition module. Apart from this, the slagging formation has also been investigated. The methodology for collection and treatment of fouling and slagging depositions has been explained in previous works [35,36]; these methodologies distinguish the “attached mass” from the “deposited mass” in heat exchanger deposits, and the “grate ash” from the “sintered deposits” for slagging samples.
Apart from deposition, slagging formation has also been investigated. For this, the facility was thoroughly cleaned before each test. Once finished, a representative amount of ash that had accumulated in the combustion chamber and in the ashtray was collected. The residues were separated into two fractions as well. On one hand, “grate ash” considers the sum of all collected ash in the ashtray together with some of the ash left in the combustion chamber trapped between the slagging. On the other hand, “sintered deposits” are collected entirely in the combustion chamber and consist of molten ash. Once samples were separated, they were introduced to a furnace for 200 min at 550 °C. Both masses were measured before and after being introduced it in the furnace. Once the thermal treatment has been carried out, all organic matter is volatilized. This way, the total inorganic matter can be determined.

3. Results and Discussion

This section is divided in five subheadings. It provides a concise and precise description of the experimental results, their interpretation as well as the experimental conclusions that can be drawn.

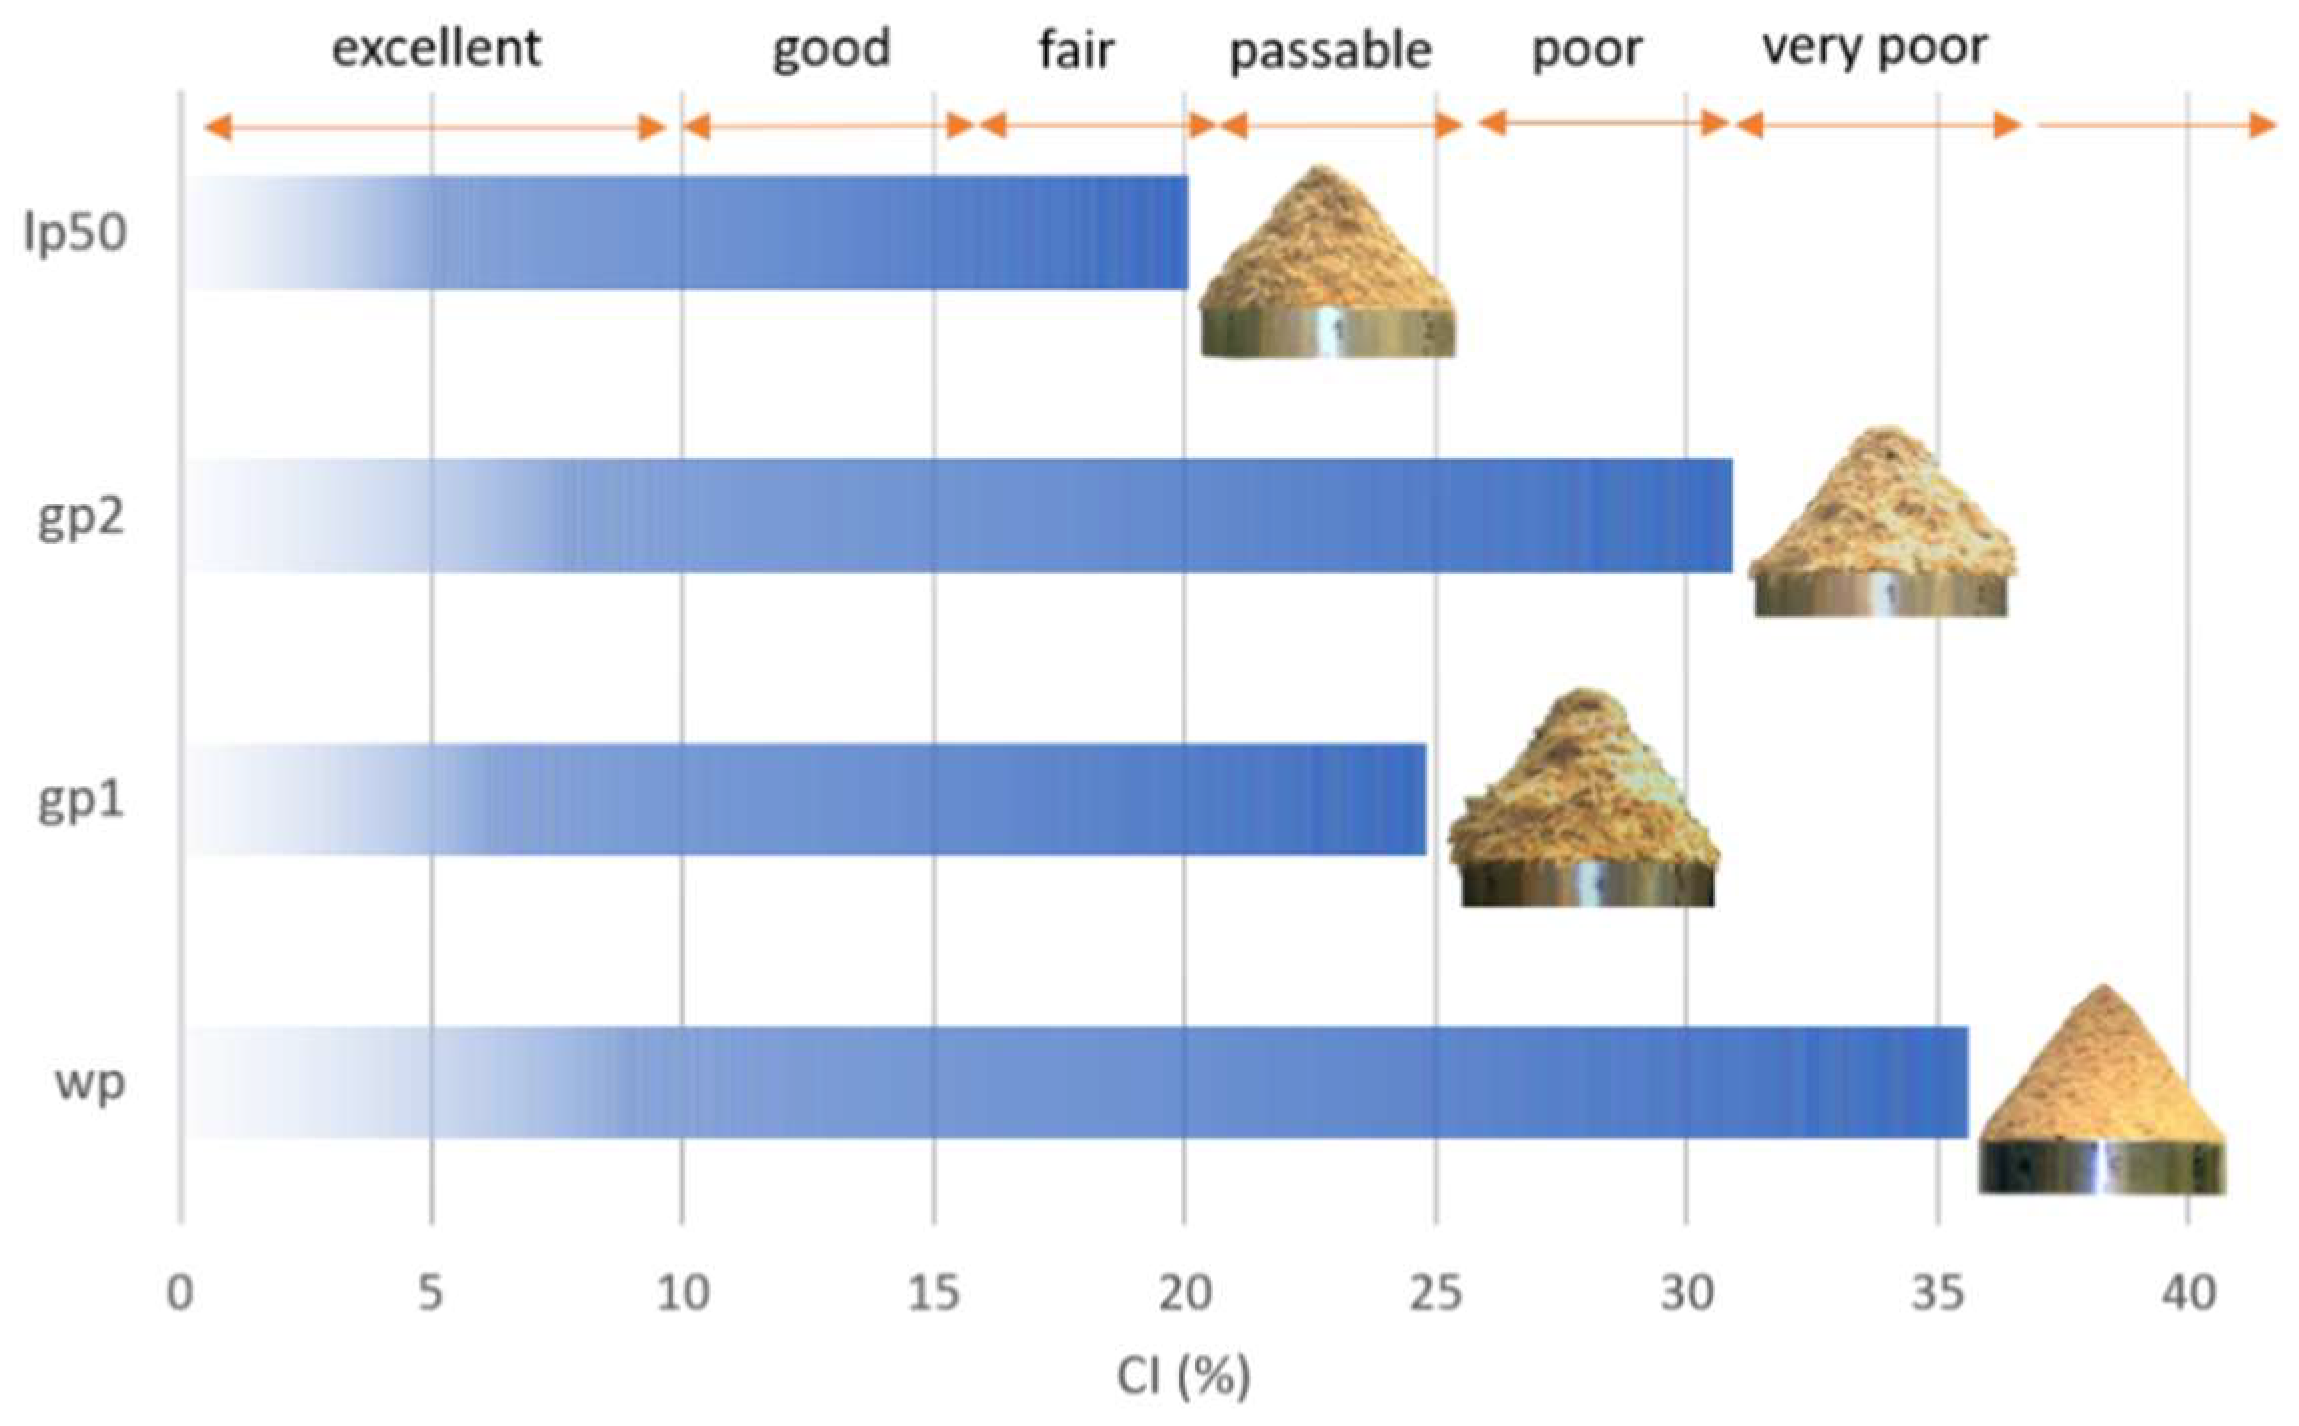
3.1. Particle Size Distribuiton, Flowability and Shear Properties of Raw Materials

A series of experiments were carried out to evaluate the flowability and shear properties of alternative biomass materials. Several important aspects were investigated through these characteristics when the materials interact with storage, crushing, pelletizing, and another handling equipment. The input raw materials (fuels) were characterized by particle size distributions, which are shown in Figure 3.
From the particle size distribution results, it is evident that the sample of tall oat grass (gp1) slightly differs from the bent grass sample (gp2). All samples have the largest proportion of particles in the range of 0.5 mm–1.0 mm. Finer particles contain samples of leaves (pl50) and spruce sawdust (wp). Moisture content for raw input tall oat grass (gp1) was 8.3% ± 1.5%, the bent grass (gp2) 7.5% ± 1.8%, the spruce sawdust (wp) 8.6% ± 1.9%, and mixture 50% leaves and 50% spruce sawdust (lp50) 7.9% ± 1.8%.
Table 4 summarizes flowability measurements according to the angles of repose and densities (CI and HR) for raw input materials. AoR values are between 49° and 53°. Lower AoR values generally indicate better flow. All raw material samples were in one mode in total. There were no differences in flowability regime according the AoR. Poor flow which needs to be subjected to vibration, was predicted.
The flowability tests show that energy grass (gp1 and gp2) has relatively good flow compared to traditional spruce sawdust. From the results it is clear that the CI and HR methods could be suitable as alternative pelletizing material flowability tests.
Figure 4 shows Carr’s index for raw materials with angle of repose photos of the tested samples. The high angles of repose values are obvious. Due to low sensitivity, the AoR method is rather inappropriate for the flowability classification mode (for these types of alternative materials).
In contrast, according to the CI classification, each of the samples is in a different mode. Spruce sawdust exhibits the worst flow (wp), and the best mixture is lp50. Samples gp1 and lp50 showed passable and fair flow according to the CI and HR methods. This meant that those materials were well designed for pelletization. Energy grasses (especially gp1) could therefore improve spruce sawdust flow if alternative mixtures were created.
Table 5 summarizes the friction parameters of the raw input materials and flow index. The value of the effective angle of internal friction for gp2 is lower than for other materials. This is closely related to the flow index, which is the highest for gp2 and therefore shows free flowing material as well as gp1. The wall friction angle is another important friction parameter. It indicates situations when the alternative material is in contact with stainless-steel surfaces (silos, hopper, transport routes, etc.). The results show that the lowest wall friction angle is for gp2, and the highest is for wp. gp2 and wp mixing would contribute to easier flow of material in contact with stainless-steel surfaces.

3.2. Stability of the Combustion Unit

The facility repeatability using fuels with a high ash content (≈ 6%) was verified in a previous study [12]. Table 6 shows all tests carried out in this study with their duration and optimal parameters. A series of preliminary tests were conducted to determine the optimum operating characteristics for each fuel. These tests were carried out to avoid the two most common problems in these kinds of facilities. First, to prevent switched off in the installation, avoid faults that generate fluctuations in the gaseous emissions from the combustion. On the other hand, the optimal characteristics were determined to prevent large accumulations of ash in the combustion chamber that can be dragged and increase the concentration of PM.
According to data in Table 1, the duration was directly related to ash content, being particularly low when fuels with a high ash content were used. The same tendencies have been established in other studies with similar ash content to this investigation [12,48].
In connection with the combustion parameters, the same total airflow of 20 m3/h was used, so that for low primary air staging, the amount of supplied air is sufficient for combustion to take place without disturbance. In addition, the air staging was varied to study the effect of using different distributions in the results. With the non-commercial pellets, which have an ash percentage of 6%, it has been possible to use three different air staging levels. Nevertheless, with the commercial pellets, it was not possible to use more than 30% of primary air, because higher primary air percentages resulted in high power that could damage physical system components.
Continuous measurement of the oxygen in flue gas for the performed tests of the three non-commercial pellets have been presented in Figure 5. In the case of the commercial wp, the stability of the facility with the established duration has been proven in other studies [36]. In this study, tests were carried out with different air staging; nevertheless, stability was checked with φ = 50%, due to this primary air staging being the most prone to introduce instability. Analyzing the data contained in Figure 5, it can be seen that the installation has good stability for the period of time established for each fuel. The rest of the tests were verified, and they present good stability.
The facility is very versatile, allowing studies of varied nature to be performed [34,35,37,49]. In some of these studies its repetitiveness has been verified not only with commercial fuels [36] but also with special fuels that have high ash content [12].

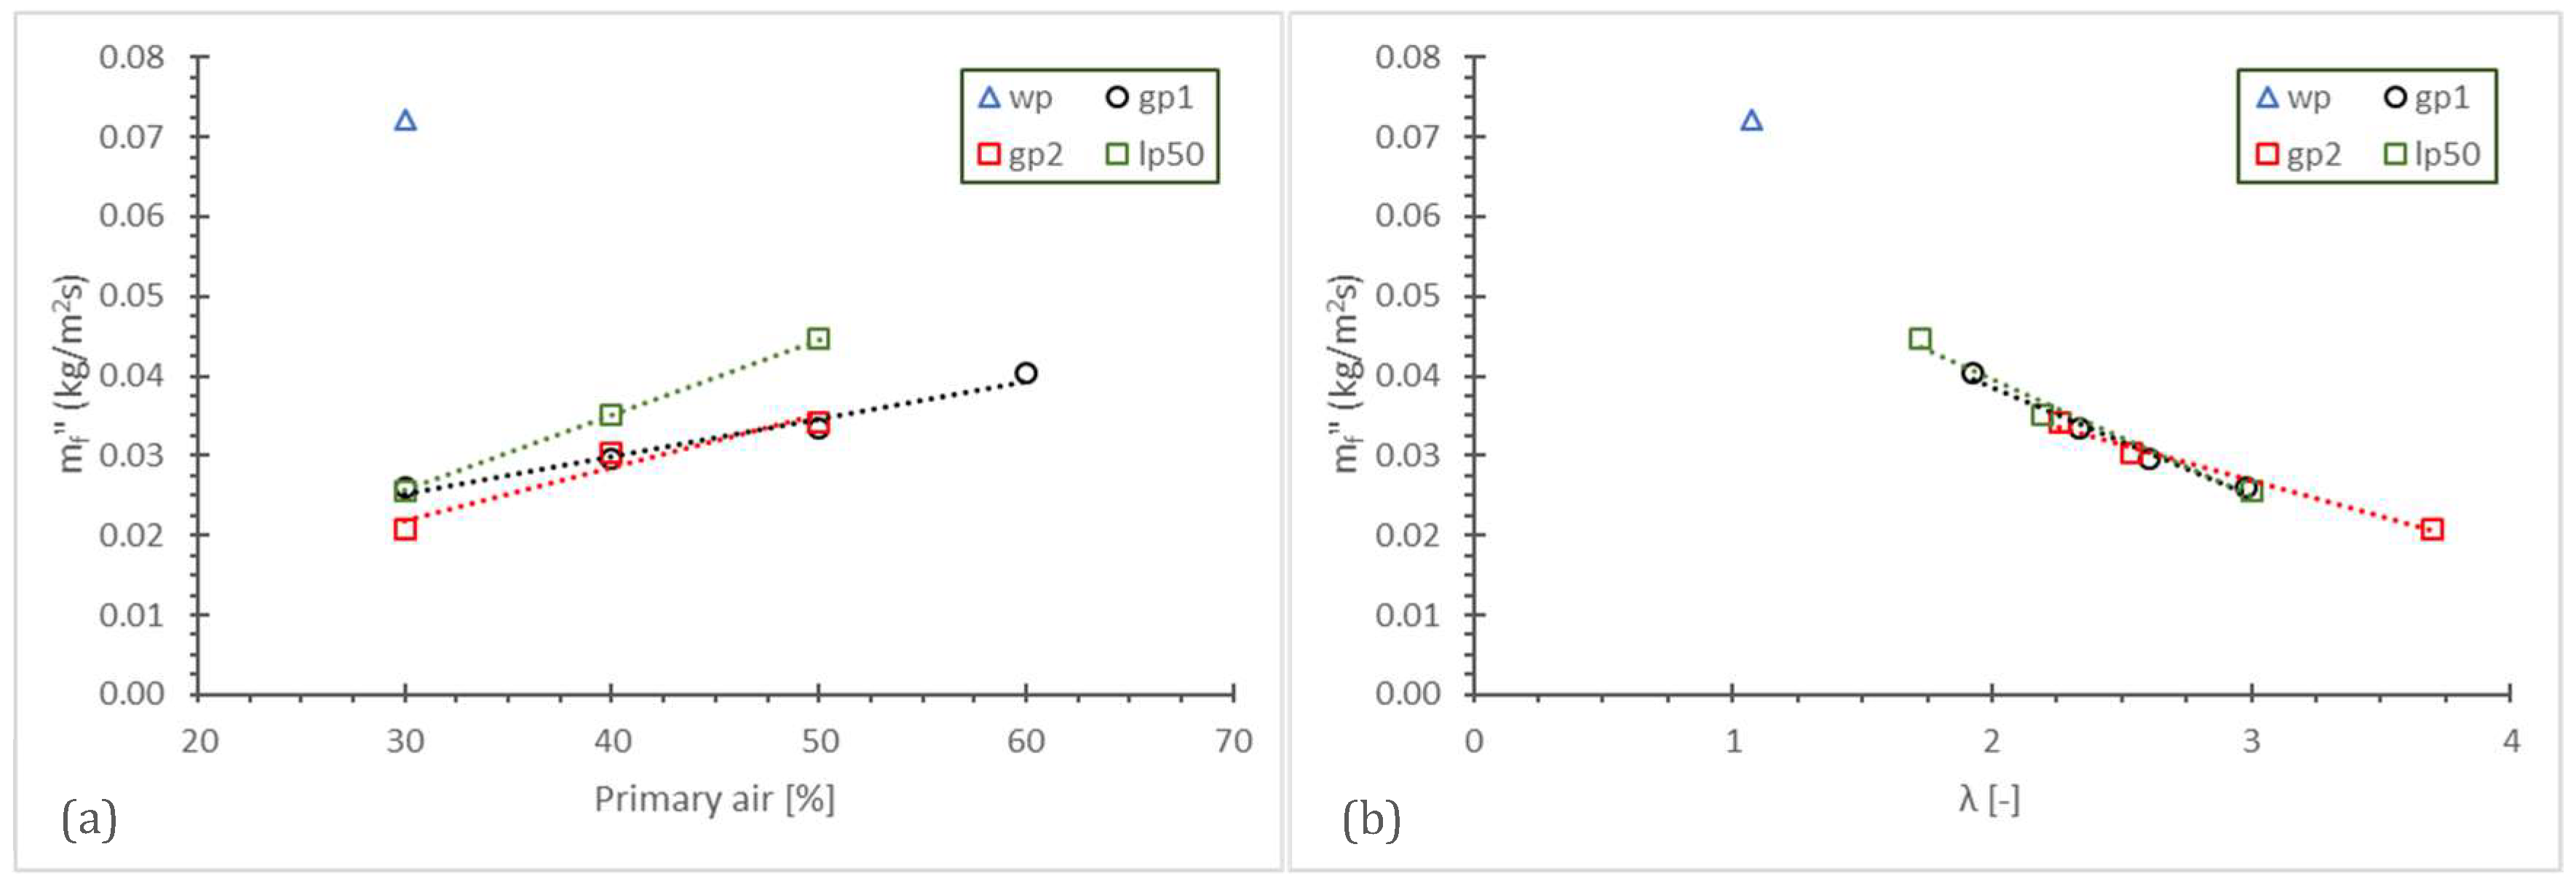
3.3. Combustion Parameters

Normally the primary air staging in commercial biomass burners and boilers is located between 30% to 50% [50,51]. In this study, the air staging is being varied between 30% and 50%, except for one test where 60% was employed.
In this section, the relation between primary air flow and burning rate is studied. A series of tests with four different fuels (wp, gp1, gp2, lp50) was carried out, varying the air staging (30% primary-70% secondary, 40–60% and 50–50%). The results are depicted in Figure 6a. Observing the trend lines for the three non-commercial fuels, it can be verified that an increase in primary air produces an incremental change in fuel consumption. In turn, higher fuel intake is translated into more power delivered by the facility, since the calorific power of the tested fuels is similar.
Comparing the obtained results with commercial and non-commercial wood pellets, it can be seen that for the same amount of primary air flow, the fuel consumption of wp was up to three times higher. This difference in fuel demand is directly related to the ash content: larger amounts of ash in the fuel imply slower consumption for the same air inlet conditions. Furthermore, this graph allows one to explain why tests with commercial wood pellets were limited to air staging lower than 30%. If an increase in air staging involves an increase in fuel consumption and thermal power output, then, higher percentages of primary air will produce out-of-range power for the facility.
Comparing the three non-commercial fuels, evaluation in the same test conditions verified that the lp50 burning rate is the highest. Accordingly, it can be said that lp50 behaviors better related to the abovementioned information.
Analyzing all data contained in Figure 6b suggests that the combustion for non-commercial fuels was produced in air-excess conditions. However, wp presents virtually stoichiometric conditions (lambda value close to 1). As a general trend, it can be verified that higher air excess produces lower burning rates. Comparing the non-commercial fuels, based on the data contained in Figure 6b, the gp2 fuel has the worst behavior because of the high lambda value for low burning rates.

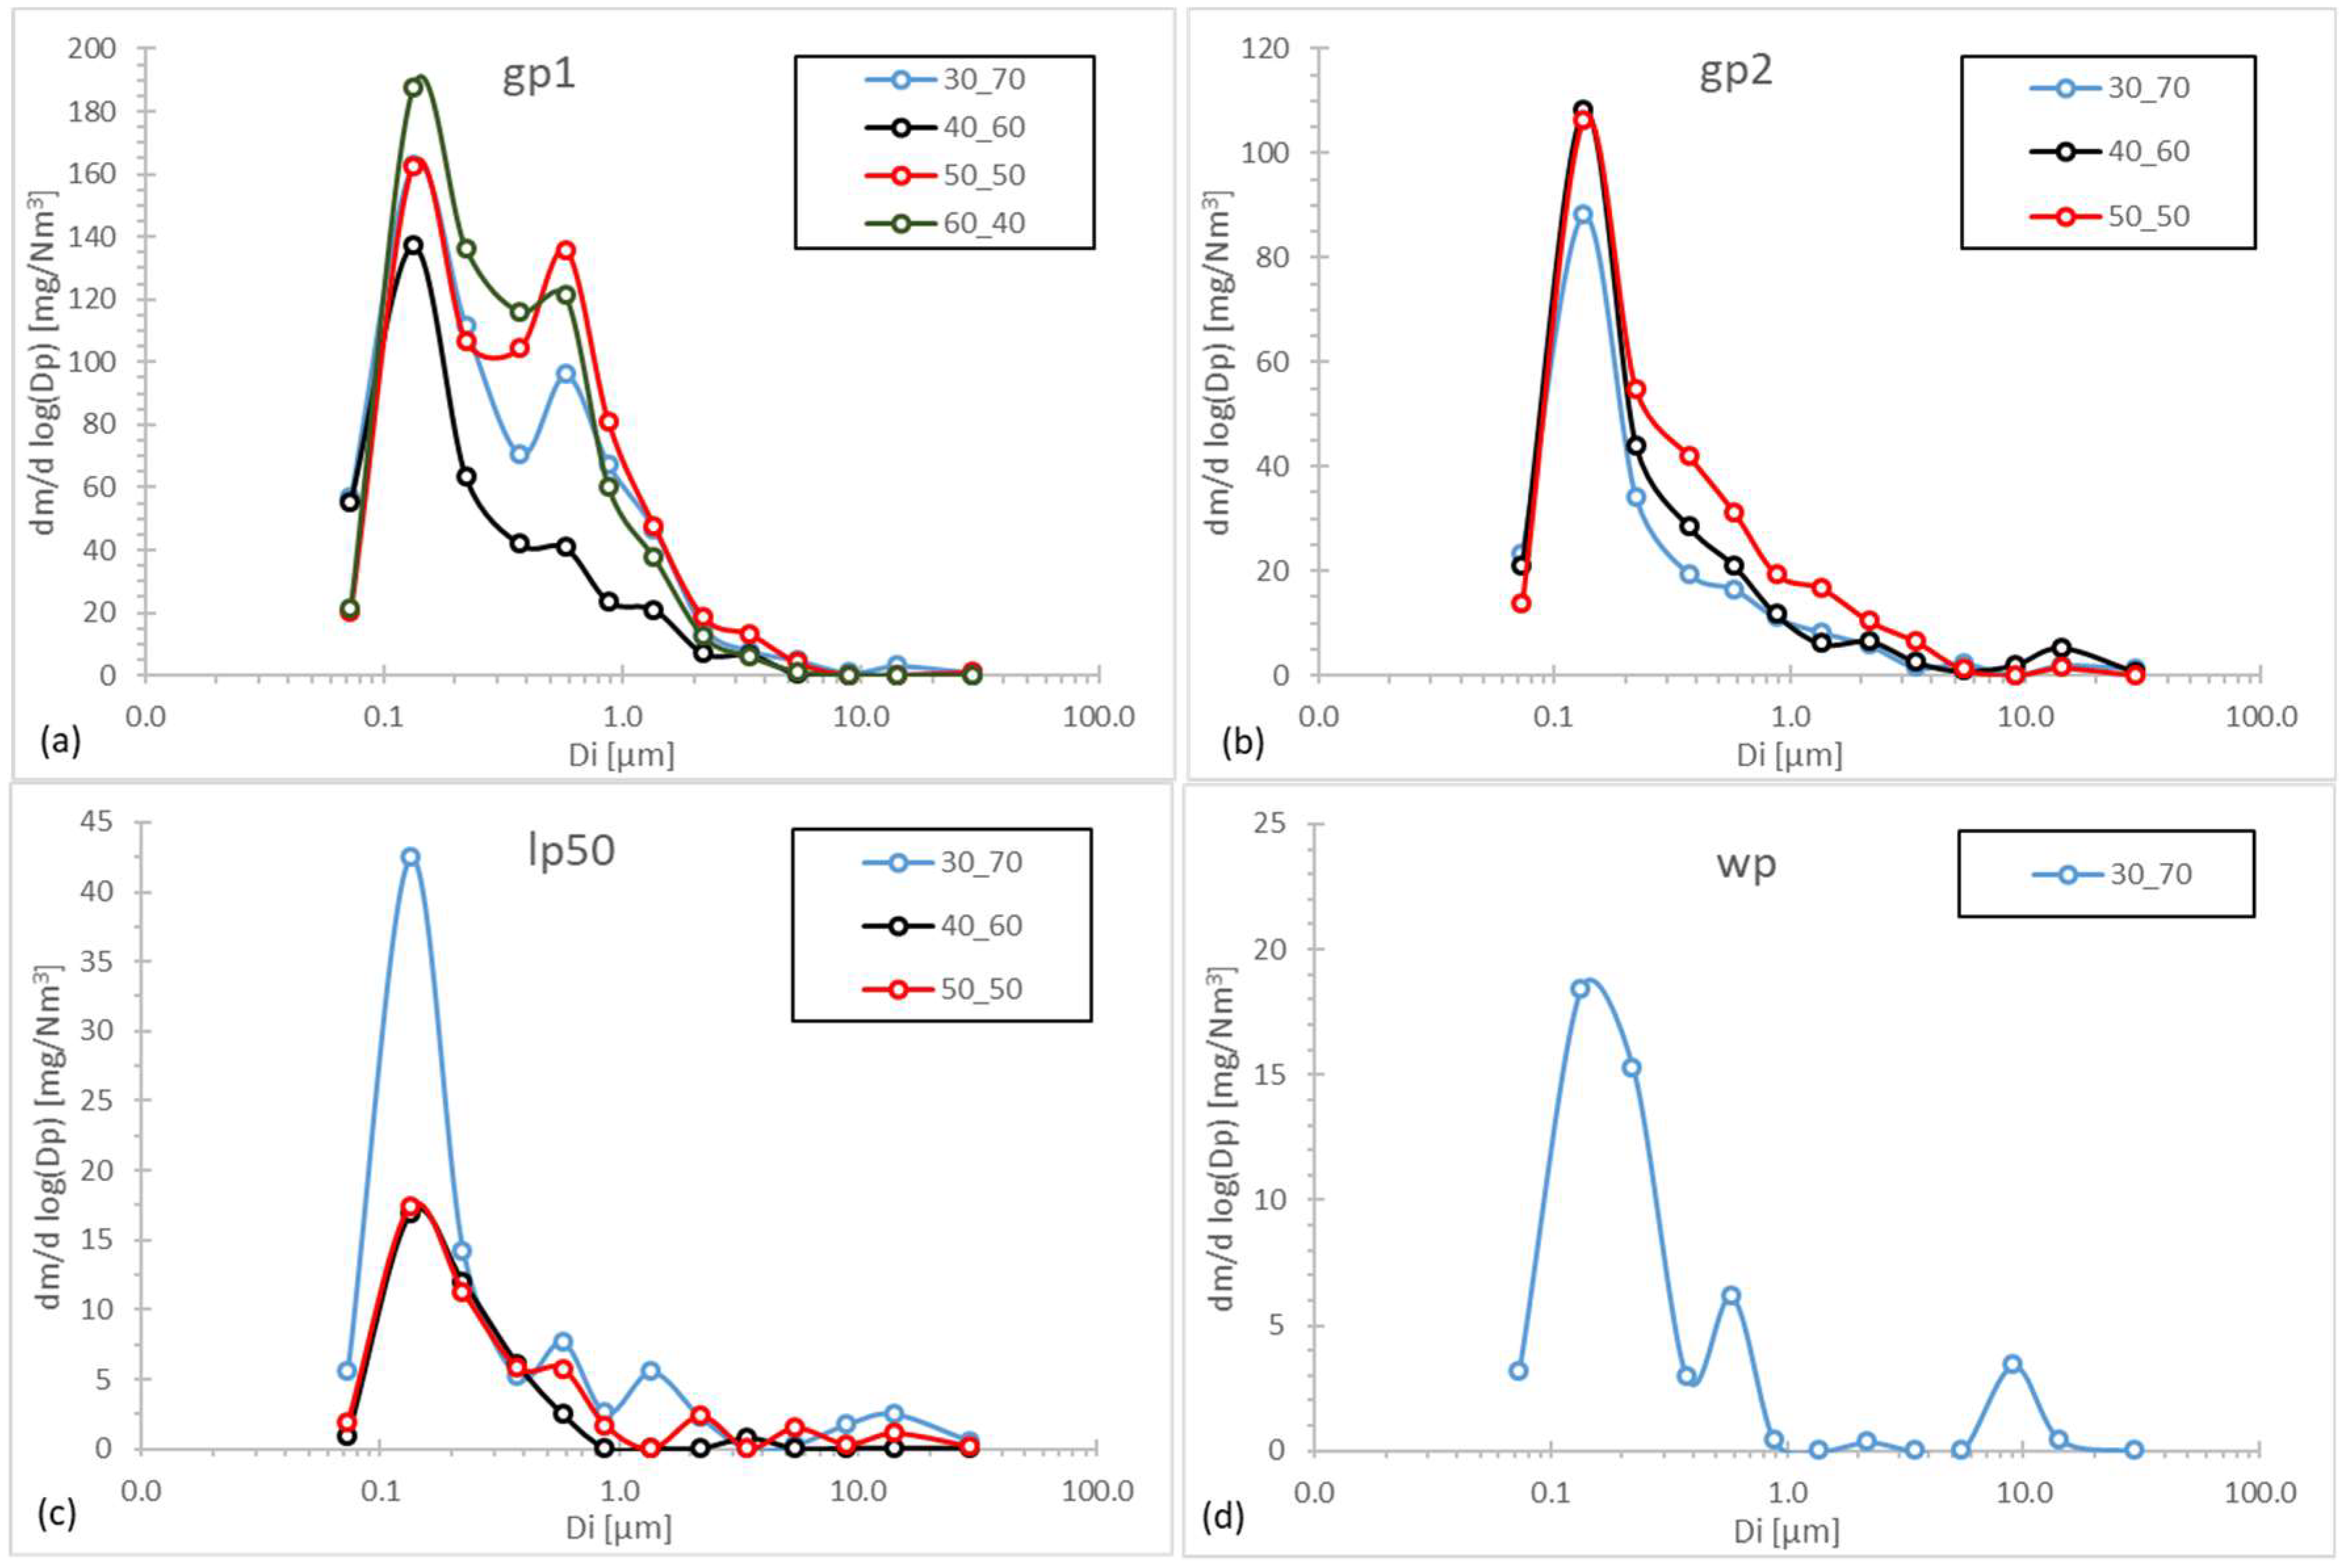
3.4. Particulate Matter Emissions

The particle concentration ranges for three non-commercial fuels were established. Observing the obtained results in Figure 7, the particle concentration for commercial wood pellets was similar to other studies (approximately 15 mg/Nm3) [35]. For non-commercial fuels, the ranges were 260.4–517.0 mg/Nm3, 125.7–140.7 mg/Nm3, and 16.3–39.5 mg/Nm3 for gp1, gp2, and lp50, respectively. The gp1 presented the worst behavior with the highest particle concentration.
In Figure 8, each graph shows the particle distribution for the tested fuels. Along with reviewed literature, there are numerous works related to particle distribution using commercial wood pellets [52,53]. In these studies, it has been determined that the majority of particles generated in biomass combustion have diameters smaller than 1 μm [52,53,54]. In addition, their distribution may be unimodal or bimodal depending on the position of the sampling point relative to the bed [52]. However, results relative to non-commercial fuels have not been found.
In this particular facility, using wp, the observed tendencies agreed with previous works: the released PM is less than 1 μm, and the distribution is unimodal with a particle peak between 30 nm–100 nm [36]. The same results are provided in Figure 8d. Furthermore, this study allows for the establishment of the PM distribution for the three non-commercial fuels, of which there are no results so far. By analyzing the results contained in Figure 8a–c, it can be verified that, independent of the fuel used, the particles are always smaller than 1 μm. However, gp2 and lp50 have unimodal distributions with the peak located between 30 nm–100 nm; nevertheless, gp1 is bimodal, showing the greatest concentrations between 70 nm–200 nm and 370 nm–590 nm.

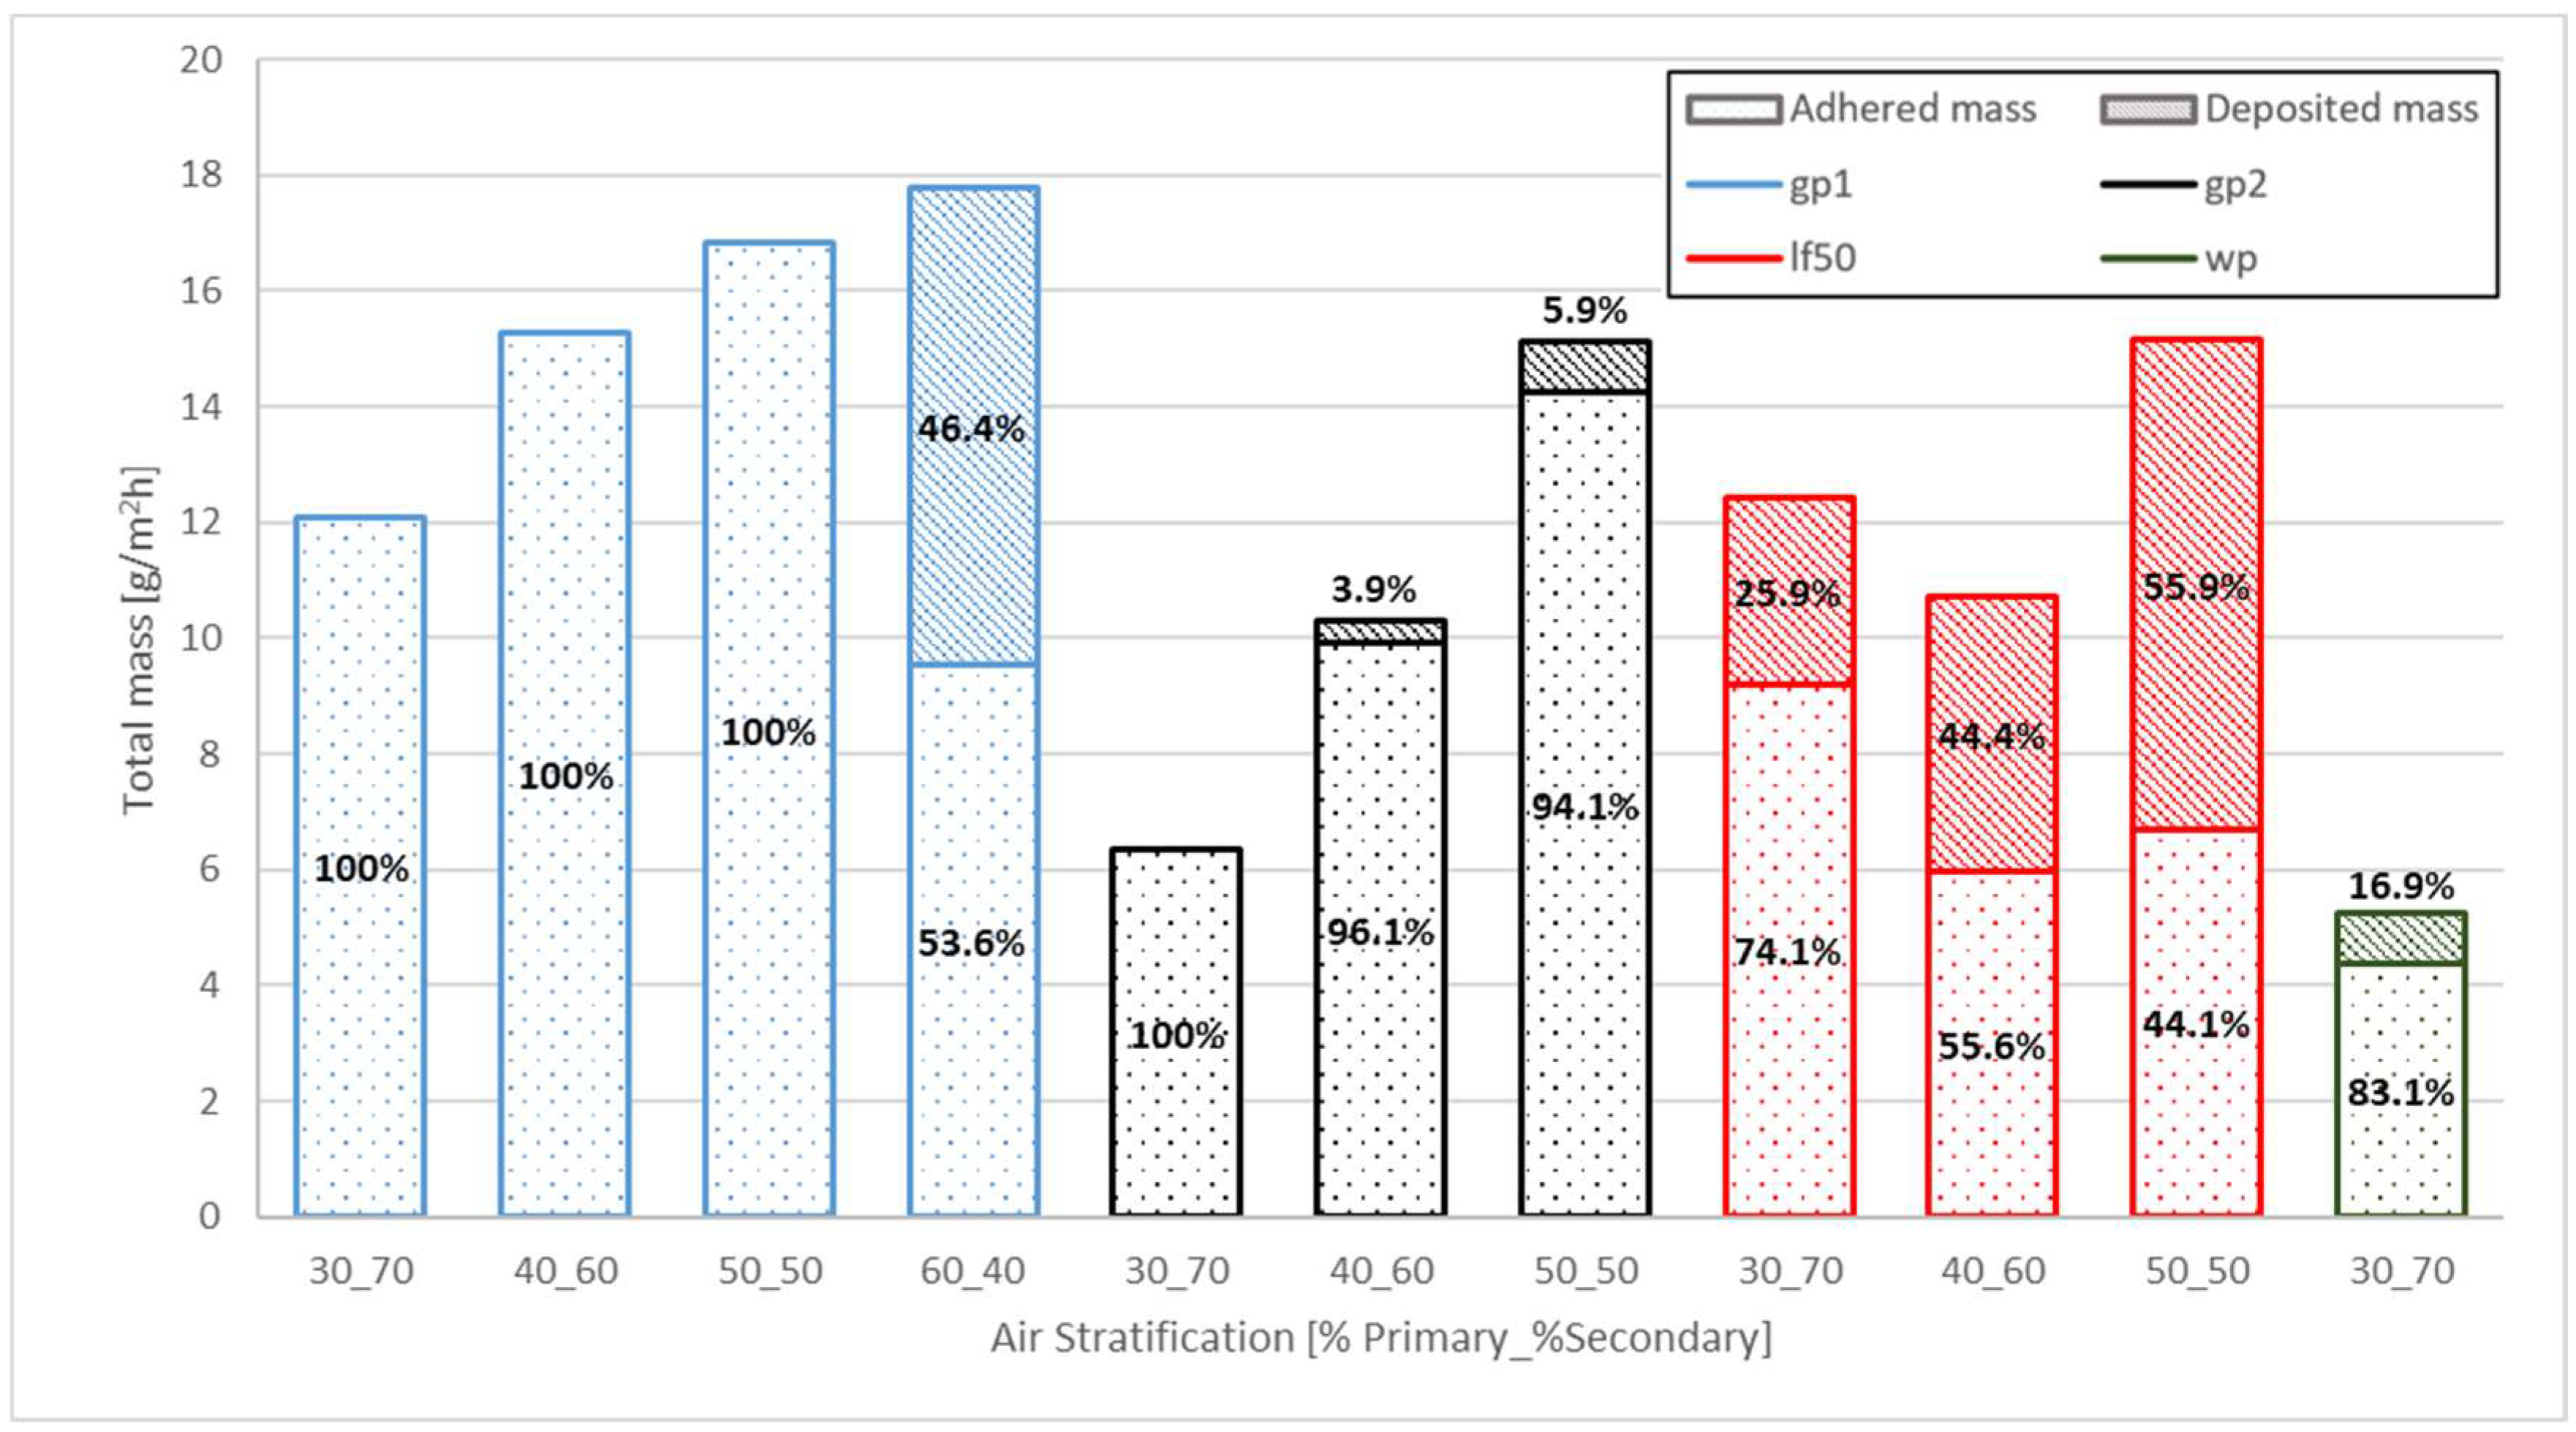
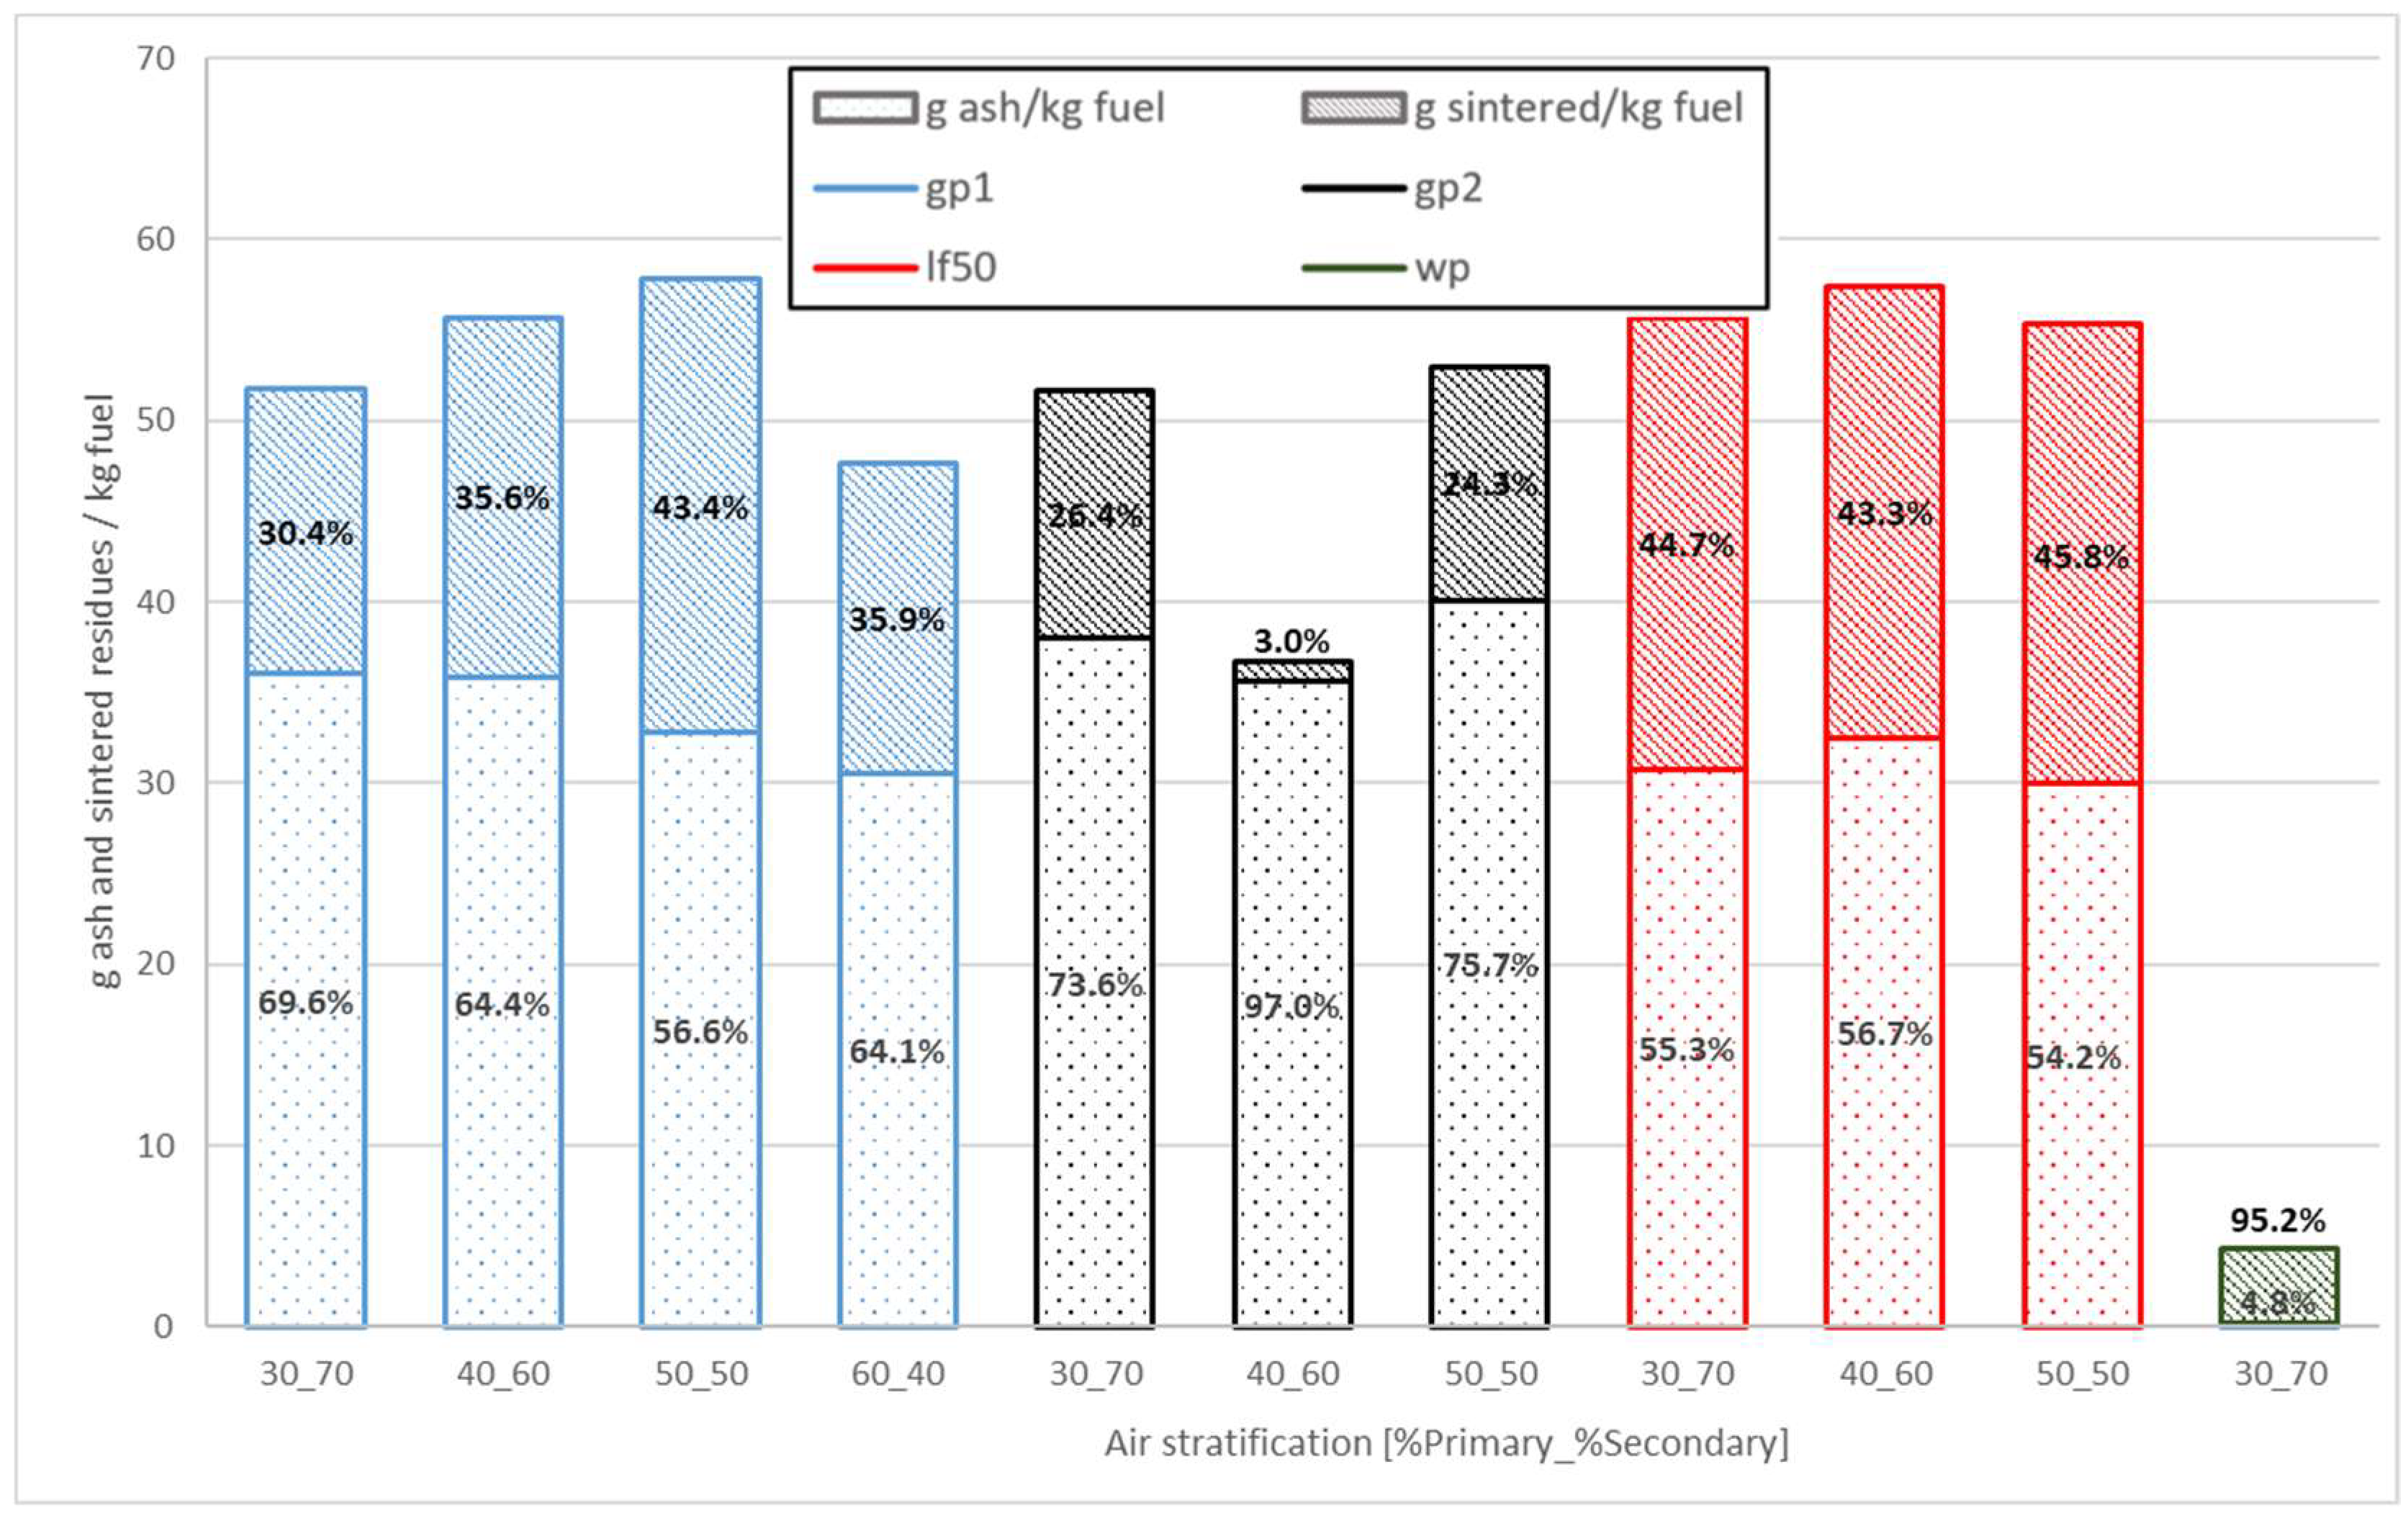
3.5. Fouling and Slagging

Fouling results for the four fuels used in this study are shown in Figure 9. The air staging has a significant influence; thus, using the same fuel and total flow, the fouling value increases as the air staging also increments. Other studies have revealed that not only the air staging increases but also the increasing total air flow increases the fouling rate [35]. In relation to the percentage of each type of collected sample (adhered and deposited mass), it was difficult to find a clear tendency. However, as a general trend, the percentage of adhered mass to the total mass decreases as the air staging increases.
It was found that fuel properties are the determining factors in the total amount of fouling [55], which are also closely related to the percentage of deposited and adhered mass over the heat exchanger [35]. The adhered mass is only in contact with the exchanger walls and consists mainly of potassium and chlorine. However, the deposited mass is formed essentially of silicon, magnesium, and iron, placed over the adhered mass layer [34,49].
As in the previous section, the ranges of fouling rates were established, both for commercial wp pellets and non-commercial fuels, aiming to determine the suitability of the latter in commercial boilers. The calculated intervals were from 12.1 mg/Nm3 to 17.8 mg/Nm3, 6.3 mg/Nm3 to 15.1 mg/Nm3 and 10.7 mg/Nm3 to 15.2 mg/Nm3 for gp1, gp2 and lp50, respectively. In relation to this parameter, none of the analyzed fuels presented an excessive amount of fouling matter compared with the commercial fuels. Therefore, based on the obtained results, the fuels would be suitable for commercial equipment. However, it was demonstrated that the fuel with better behavior in terms of fouling deposition is still the wp, whereas the worst is gp1.
Connecting the experimental results to the fouling and alkali indexes calculated in Table 1, verifies that the values of the theoretical indexes, according to Jenkins et al. [38], fit the real case. However, this is not completely true for those calculated on the basis of the theory proposed by Pronobis et al. [41].
Focusing on the slagging phenomenon, measurements of collected matter (grate ash and sintered deposits) are depicted in Figure 10. The results show a remarkable amount of slagging formed during tests with non-commercial fuels, compared to the low presence for wp. Values for total slagging measured with non-commercial fuels ranged from 47.6 g/kg–57.8 g/kg fuel for gp1; 36.7 g/kg–51.6 g/kg fuel for gp2; and 55.3 g/kg–57.4 g/kg fuel for lp50. As mentioned, these values are considerably larger than wp values (4.31 g/kg fuel), being influenced by the higher ash content of the non-commercial raw fuels. This experimental behavior is consistent with the theoretical basic-to-acid ratios calculated in Table 1, whose analysis suggested that wp presented the lowest slag formation probability.

4. Conclusions

This research comprises a viability study for three non-commercial biomass pellets in an experimental biomass combustor with low power. The combustion unit is very versatile, allowing for the study of numerous parameters (primary and secondary air flow, fuel flow, air excess…) and the main problems present in these kinds of facilities (concentration and distribution of particles, fouling and slagging). The results obtained were compared with commercial wood pellets. The main conclusions that can be drawn from the study are presented below:
  • For each fuel, transitory-stationary-shut down periods for test combustions were established, their duration being directly related to the raw fuel ash content.
  • The results revealed that increasing the amount of primary air increases the fuel consumption and thermal power of the installation. For the same amount of total air, the fuel consumption was up to three times higher using a commercial fuel. In relation to the operation parameters, it was also found that for higher air excess, the burning rates were the lowest.
  • The concentration and distribution of particles was analyzed. Regarding the distribution, it was proven that most particles were less than 1 µm. However, the concentration (normalized at 6% O2) varied from 260.4 mg/Nm3 to 517 mg/Nm3, 125.7 mg/Nm3 to 140.7 mg/Nm3 and 16.3 mg/Nm3 to 39.5 mg/Nm3 for gp1, gp2 and lp50 fuels, respectively.
  • Both total fouling and adhered mass were found to increase with primary air. Fouling ranges were stablished for the three non-commercial pellets, being 12.1 mg/Nm3 to 17.8 mg/Nm3, 6.3 mg/Nm3 to 15.1 mg/Nm3 and 10.7 mg/Nm3 to 15.2 mg/Nm3 for gp1, gp2 and lp50, respectively.
The study performed allowed the establishment of a series of relationships between different combustion parameters. Additionally, value ranges for the most important combustion problems were determined for three non-commercial pellets, which had never been used until now. By analyzing the obtained results, it has been concluded that the lp50 fuel could be suitable for commercial boilers after incorporating additives to improve its quality.

Author Contributions

A.R. and R.P.-O. performed the tests and collaborated in the manuscript write up. L.J. prepared the non-commercial pellets for testing. D.P. supervised the test and the artiche writing. J.Z. designed and performed the experiments with raw materials. J.N. analyzed the data.

Acknowledgments

This research was funded by the programme INTERREG V-A España-Portugal 2014-2020 (POCTEP) and co-financed by the European Regional Development Fund (FEDER) number (0015_BIOMASA AP_1_E). Also supported by the Ministry of Education, Youth and Sports of the Czech Republic under OP RDE grant number CZ.02.1.01/0.0/0.0 /16_019/0000753 “Research centre for low-carbon energy technologies” and it was conducted within the framework of the project LO1404: Sustainable development of ENET Centre).

Conflicts of Interest

The authors declare no conflict of interest.

Abbreviations

The following abbreviations and symbols are used in this article.
AoRangle of repose [°]
CICarr’s index [–]
DLPIDekati low pressure impactor
ffcflow index
gp1tall oat grass pellet
gp2bent grass pellet
HRHausner ratio [–]
lp50mixed pellet (50% leaves–50% wood)
m 1 " ˙ primary air mass flow [kg/m2s]
m 2 " ˙ secondary air mass flow [kg/m2s]
PMparticulate matter
RST 01Schulze ring shear tester
wpwood pellet
δeeffective angle of internal friction
λair excess [-]
ρBbulk density [kg/m3]
ρTtapped density [kg/m3]
σ1major consolidation stress [kPa]
σcunconfined yield strength [kPa]
Φangle of wall friction [°]
φair staging [%]

References

  1. Luque, R.; Herrero-Davila, L.; Campelo, J.M.; Clark, J.H.; Hidalgo, J.M.; Luna, D.; Marinas, J.M.; Romero, A.A. Biofuels: A technological perspective. Energy Environ. Sci. 2008, 1, 542–564. [Google Scholar] [CrossRef]
  2. Helby, P.; Börjesson, P.; Hansen, A.C.; Roos, A.; Rosenqvist, H.; Takeuchi, L. Market Development Problems for Sustainable Bio-Energy Systems in Sweden: (The BIOMARK Project); Lund University: Lund, Sweden, 2004. [Google Scholar]
  3. Vinterbäck, J. Pellets 2002: The first world conference on pellets. Biomass Bioenergy 2004, 27, 513–520. [Google Scholar] [CrossRef]
  4. Koppejan, J.; Van Loo, S. The Handbook of Biomass Combustion and Co-Firing; Routledge: Abingdon-on-Thames, UK, 2012. [Google Scholar]
  5. Verma, V.; Bram, S.; Gauthier, G.; De Ruyck, J. Performance of a domestic pellet boiler as a function of operational loads: Part-2. Biomass Bioenergy 2011, 35, 272–279. [Google Scholar]
  6. Kristensen, E.F.; Kristensen, J.K. Development and test of small-scale batch-fired straw boilers in Denmark. Biomass Bioenergy 2004, 26, 561–569. [Google Scholar] [CrossRef]
  7. Dias, J.; Costa, M.; Azevedo, J. Test of a small domestic boiler using different pellets. Biomass Bioenergy 2004, 27, 531–539. [Google Scholar] [CrossRef]
  8. Royo, J.; Canalís, P.; Quintana, D.; Díaz-Ramírez, M.; Sin, A.; Rezeau, A. Experimental study on the ash behaviour in combustion of pelletized residual agricultural biomass. Fuel 2019, 239, 991–1000. [Google Scholar]
  9. Verma, V.; Bram, S.; Gauthier, G.; De Ruyck, J. Evaluation of the performance of a multi-fuel domestic boiler with respect to the existing European standard and quality labels: Part-1. Biomass Bioenergy 2011, 35, 80–89. [Google Scholar] [CrossRef]
  10. Sampson, R.; Drisdelle, M.; Mulkins, L.; Lapointe, C.; Duxbury, P. The Use of Switchgrass Pellets as a Greenhouse Gas Offset Strategy; Natural Resources Canada: Ottawa, ON, Canada, 2000. [Google Scholar]
  11. González, J.F.; González-Garcoía, C.M.; Ramiro, A.; González, J.; Sabio, E.; Gañán, J.; Rodroíguez, M.A. Combustion optimisation of biomass residue pellets for domestic heating with a mural boiler. Biomass Bioenergy 2004, 27, 145–154. [Google Scholar] [CrossRef]
  12. Regueiro, A.; Jezerská, L.; Patiño, D.; Pérez-Orozco, R.; Nečas, J.; Žídek, M. Experimental Study of the Viability of Low-Grade Biofuels in Small-Scale Appliances. Sustainability 2017, 9, 1823. [Google Scholar] [CrossRef]
  13. Andreasen, P.; Larsen, M.G. Straw Pellets as Fuel in Biomass Combustion Units; Chariton Valley Resource Conservation and Development, Inc.: Centerville, IA, USA, 1996. [Google Scholar]
  14. Olsson, M. Wheat straw and peat for fuel pellets—Organic compounds from combustion. Biomass Bioenergy 2006, 30, 555–564. [Google Scholar] [CrossRef]
  15. Lehtikangas, P. Quality properties of pelletised sawdust, logging residues and bark. Biomass Bioenergy 2001, 20, 351–360. [Google Scholar] [CrossRef]
  16. Obernberger, I.; Thek, G. Physical characterisation and chemical composition of densified biomass fuels with regard to their combustion behaviour. Biomass Bioenergy 2004, 27, 653–669. [Google Scholar] [CrossRef]
  17. Öhman, M.; Nordin, A.; Hedman, H.; Jirjis, R. Reasons for slagging during stemwood pellet combustion and some measures for prevention. Biomass Bioenergy 2004, 27, 597–605. [Google Scholar] [CrossRef]
  18. Lindström, E.; Larsson, S.H.; Boström, D.; Öhman, M. Slagging characteristics during combustion of woody biomass pellets made from a range of different forestry assortments. Energy Fuels 2010, 24, 3456–3461. [Google Scholar] [CrossRef]
  19. Werther, J.; Saenger, M.; Hartge, E.-U.; Ogada, T.; Siagi, Z. Combustion of agricultural residues. Prog. Energy Combust. Sci. 2000, 26, 1–27. [Google Scholar] [CrossRef]
  20. Öhman, M.; Boman, C.; Hedman, H.; Nordin, A.; Boström, D. Slagging tendencies of wood pellet ash during combustion in residential pellet burners. Biomass Bioenergy 2004, 27, 585–596. [Google Scholar] [CrossRef]
  21. Nussbaumer, T.; Hustad, J. Overview of biomass combustion. In Developments in Thermochemical Biomass Conversion; Springer: New York, NY, USA, 1997; pp. 1229–1243. [Google Scholar]
  22. Verma, V.; Bram, S.; De Ruyck, J. Small scale biomass heating systems: Standards, quality labelling and market driving factors—An EU outlook. Biomass Bioenergy 2009, 33, 1393–1402. [Google Scholar] [CrossRef]
  23. Fiedler, F. The state of the art of small-scale pellet-based heating systems and relevant regulations in Sweden, Austria and Germany. Renew. Sustain. Energy Rev. 2004, 8, 201–221. [Google Scholar] [CrossRef]
  24. Eskilsson, D.; Rönnbäck, M.; Samuelsson, J.; Tullin, C. Optimisation of efficiency and emissions in pellet burners. Biomass Bioenergy 2004, 27, 541–546. [Google Scholar] [CrossRef]
  25. Roy, M.M.; Dutta, A.; Corscadden, K. An experimental study of combustion and emissions of biomass pellets in a prototype pellet furnace. Appl. Energy 2013, 108, 298–307. [Google Scholar] [CrossRef]
  26. Johansson, L.S. Characterisation of Particle Emissions from Small-Scale Biomass Combustion. Ph.D. Thesis, Chalmers Tekniska Högsk, Gothenburg, Sweden, 2002. [Google Scholar]
  27. Gaegauf, C.; Wieser, U.; Macquat, Y. In Field investigation of nanoparticle emissions from various biomass combustion systems. In Proceedings of the International Seminar on Aerosol from Biomass Combustion, Langenbruck, Switzerland, 27 June 2001; pp. 81–85. [Google Scholar]
  28. Sippula, O. Fine Particle Formation and Emissions in Biomass Combustion; Report Series in Aerosol Science; University of Eastern Finland: Kuopio, Finland, 2010; p. 108. [Google Scholar]
  29. Obernberger, I.; Brunner, T.; Bärnthaler, G. Fine particulate emissions from modern Austrian small-scale biomass combustion plants. In Proceedings of the 15th European Biomass Conference & Exhibition, Berlin, Germany, 7–11 May 2007; pp. 1546–1557. [Google Scholar]
  30. Gilbe, C.; Lindström, E.; Backman, R.; Samuelsson, R.; Burvall, J.; Ohman, M. Predicting slagging tendencies for biomass pellets fired in residential appliances: A comparison of different prediction methods. Energy Fuels 2008, 22, 3680–3686. [Google Scholar] [CrossRef]
  31. Gilbe, C.; Ohman, M.; Lindström, E.; Boström, D.; Backman, R.; Samuelsson, R.; Burvall, J. Slagging characteristics during residential combustion of biomass pellets. Energy Fuels 2008, 22, 3536–3543. [Google Scholar] [CrossRef]
  32. Mediavilla, I.; Fernández, M.; Esteban, L. Optimization of pelletisation and combustion in a boiler of 17.5 kW th for vine shoots and industrial cork residue. Fuel Process. Technol. 2009, 90, 621–628. [Google Scholar] [CrossRef]
  33. Heschel, W.; Rweyemamu, L.; Scheibner, T.; Meyer, B. Abatement of emissions in small-scale combustors through utilisation of blended pellet fuels. Fuel Process. Technol. 1999, 61, 223–242. [Google Scholar] [CrossRef]
  34. Febrero, L.; Granada, E.; Patiño, D.; Eguía, P.; Regueiro, A. A comparative study of fouling and bottom ash from woody biomass combustion in a fixed-bed small-scale boiler and evaluation of the analytical techniques used. Sustainability 2015, 7, 5819–5837. [Google Scholar] [CrossRef]
  35. Regueiro, A.; Patiño, D.; Granada, E.; Porteiro, J. Experimental study on the fouling behaviour of an underfeed fixed-bed biomass combustor. Appl. Therm. Eng. 2017, 112, 523–533. [Google Scholar] [CrossRef]
  36. Regueiro, A.; Patiño, D.; Porteiro, J.; Granada, E.; Míguez, J.L. Effect of Air Staging Ratios on the Burning Rate and Emissions in an Underfeed Fixed-Bed Biomass Combustor. Energies 2016, 9, 940. [Google Scholar] [CrossRef]
  37. Rashidian, B.; Al-Abdeli, Y.M.; Patiño, D.; Guzzomi, F.G.; Yeoh, G.H. Effect of freeboard deflectors in the fixed bed combustion of biomass. Appl. Therm. Eng. 2016, 103, 543–552. [Google Scholar] [CrossRef]
  38. Jenkins, B.; Baxter, L.; Miles, T. Combustion properties of biomass. Fuel Process. Technol. 1998, 54, 17–46. [Google Scholar] [CrossRef]
  39. Teixeira, P.; Lopes, H.; Gulyurtlu, I.; Lapa, N.; Abelha, P. Evaluation of slagging and fouling tendency during biomass co-firing with coal in a fluidized bed. Biomass Bioenergy 2012, 39, 192–203. [Google Scholar] [CrossRef] [Green Version]
  40. Tchapda, A.H.; Pisupati, S.V. A review of thermal co-conversion of coal and biomass/waste. Energies 2014, 7, 1098–1148. [Google Scholar] [CrossRef]
  41. Pronobis, M. Evaluation of the influence of biomass co-combustion on boiler furnace slagging by means of fusibility correlations. Biomass Bioenergy 2005, 28, 375–383. [Google Scholar] [CrossRef]
  42. Carr, R.L. Evaluating flow properties of solids. Chem. Eng. 1965, 18, 163–168. [Google Scholar]
  43. Traina, K.; Cloots, R.; Bontempi, S.; Lumay, G.; Vandewalle, N.; Boschini, F. Flow abilities of powders and granular materials evidenced from dynamical tap density measurement. Powder Technol. 2013, 235, 842–852. [Google Scholar] [CrossRef]
  44. Schulze, D. Powders and Bulk Solids. Behaviour, Characterization, Storage and Flow; Springer: New York, NY, USA, 2008; pp. 35–74. [Google Scholar]
  45. Gelnar, D.; Zegzulka, J.; Šooš, Ĺ.; Nečas, J.; Juchelková, D. Validation Device and Method of Measuring Static and Dynamic Angle of Discharge. Patent 306123, 8 April 2015. [Google Scholar]
  46. Šimek, M.; Grünwaldová, V.; Kratochvíl, B. Comparison of Compression and Material Properties of Differently Shaped and Sized Paracetamols. KONA Powder Part. J. 2017, 34, 197–206. [Google Scholar] [CrossRef] [Green Version]
  47. Khodaei, H.; Guzzomi, F.; Yeoh, G.H.; Regueiro, A.; Patiño, D. An experimental study into the effect of air staging distribution and position on emissions in a laboratory scale biomass combustor. Energy 2017, 118, 1243–1255. [Google Scholar] [CrossRef]
  48. Cardozo, E.; Erlich, C.; Alejo, L.; Fransson, T.H. Combustion of agricultural residues: An experimental study for small-scale applications. Fuel 2014, 115, 778–787. [Google Scholar] [CrossRef]
  49. Febrero, L.; Granada, E.; Regueiro, A.; Míguez, J.L. Influence of combustion parameters on fouling composition after wood pellet burning in a lab-scale low-power boiler. Energies 2015, 8, 9794–9816. [Google Scholar] [CrossRef]
  50. Liu, H.; Chaney, J.; Li, J.; Sun, C. Control of NOx emissions of a domestic/small-scale biomass pellet boiler by air staging. Fuel 2013, 103, 792–798. [Google Scholar] [CrossRef]
  51. Nussbaumer, T. Combustion and co-combustion of biomass: Fundamentals, technologies, and primary measures for emission reduction. Energy Fuels 2003, 17, 1510–1521. [Google Scholar] [CrossRef]
  52. Fernandes, U.; Costa, M. Formation of fine particulate matter in a domestic pellet-fired boiler. Energy Fuels 2013, 27, 1081–1092. [Google Scholar] [CrossRef]
  53. Wiinikka, H.; Gebart, R.; Boman, C.; Boström, D.; Öhman, M. Influence of fuel ash composition on high temperature aerosol formation in fixed bed combustion of woody biomass pellets. Fuel 2007, 86, 181–193. [Google Scholar] [CrossRef]
  54. Wiinikka, H.; Gebart, R. Critical parameters for particle emissions in small-scale fixed-bed combustion of wood pellets. Energy Fuels 2004, 18, 897–907. [Google Scholar] [CrossRef]
  55. Theis, M.; Skrifvars, B.-J.; Hupa, M.; Tran, H. Fouling tendency of ash resulting from burning mixtures of biofuels. Part 1: Deposition rates. Fuel 2006, 85, 1125–1130. [Google Scholar] [CrossRef]
Figure 1. Raw input materials used in pelletization, designed as: wp-wood pellets; gp1-tall oat grass; gp2-bent grass; lp50-mixed pellets made of 50% leaves and 50% wood.
Energies 12 01352 g001
Figure 2. Scheme of the main facility with details of the different auxiliary measurement equipment.
Energies 12 01352 g002
Figure 3. Particle size range distribution of raw input materials.
Energies 12 01352 g003
Figure 4. Carr’s index for raw input materials with angle of repose images.
Energies 12 01352 g004
Figure 5. Stability and temporal evolution of the facility for tests with total supplied air of 0.459 kg/m2s, φ = 50% and three different pellets (gp1, gp2 and lp50) using the O2 evolution along the tests.
Energies 12 01352 g005
Figure 6. Relation of burning rate with air staging φ (a) and air excess-λ (b) for the tested fuels. The total supplied air was 0.459 kg/m2s, varying the air staging for portions of primary air ϕ = 30%, 40%, 50% and 60%.
Energies 12 01352 g006
Figure 7. PM concentration for each fuel. The air staging is specified on the x-axis, as [%primary air _ %secondary air] and the total airflow used was 459 kg/m2s.
Energies 12 01352 g007
Figure 8. Particulate matter distribution for each test. The total airflow is 0.459 kg/m2s. The air staging is specified in the legend as [%primary air _ %secondary air]. Each graph represents one fuel: (a) gp1; (b) gp2; (c) lp50 and (d) wp.
Energies 12 01352 g008
Figure 9. Deposited and attached mass for each fuel with char. The air stratification is specified on the x axis, as [%primary air _ %secondary air]. The percentage of each type of deposition is specified on the bar. The total airflow was 0.459 kg/m2s.
Energies 12 01352 g009
Figure 10. Slagging measurements without char. Ash and sintered is specified related to the total amount of fuel. The air stratification is specified on the x-axis, as [%primary air _ %secondary air]. The total air flow was 0.459 kg/m2s.
Energies 12 01352 g010
Table 1. Proximate analysis, ash analysis, elemental analysis, and fouling index for the four pellets used (wp, gp1, gp2, and lp50).
Proximate Analysis * (wt %)Ash Analysis (wt.% of Dry Ash)
wpgp 1gp 2lp50 wpgp 1gp 2lp50
Moisture6.415.596.9110.44Na2O2.940.170.190.10
Volatile68.8066.3265.0161.98MgO8.292.432.294.01
Char24.2322.1322.3121.65Al2O36.960.861.1310.04
Ash0.575.975.775.94SiO217.1235.0862.5851.96
Elemental Analysis ** (wt %)P2O53.657.203.821.83
C48.2446.7147.5149.70SO39.765.023.892.41
H6.946.346.676.71Cl3.278.981.220.25
N0.260.830.550.48K2O20.3233.5517.954.77
O a44.5646.1245.2643.11CaO23.355.575.6919.28
S b-- -TiO20.390.070.060.38
Fouling IndexCr2O3--0.02-
Alkali index7.561.200.610.18MnO1.080.210.190.62
Fe2O32.180.780.784.16
Base to acid ratio2.371.180.420.52ZnO0.170.050.040.08
Rb2O--0.01-
Slag ratio33.6079.9887.7265.44SrO-0.030.030.12
ZrO2--0.08-
Fouling ratio55.1539.797.662.52BaO0.50---
PbO--0.01-
* (wet basis); ** (dry ash free basis); a determined by difference; b out of detection limit.
Table 2. Flow properties and angle of repose.
Angle of Repose [°]Flow Property
25–30Excellent
31–35Good
36–40Fair-aid not needed
41–45Passable-may hang up
46–55Poor-must agitate, vibrate
56–65Very poor
>66Very, very poor
Table 3. Flow characteristics evaluated by Carr’s index (CI) and the Hausner ratio (HR) for raw input materials [42,43].
CI [%]HR [–]Flow Diagnosis
≤101.00–1.11Excellent/very free flow
11–151.12–1.18Good/free flow
16–201.19–1.25Fair
21–251.26–1.34Passable
26–311.35–1.45Poor/cohesive
32–371.46–1.59Very poor/very cohesive
>38>1.60Very, very poor/approx. non-flow
Table 4. Flowability of raw input materials according to angle of repose (AoR), Carr’s index (CI), and the Hausner ratio (HR).
Raw
Input Material
AoR [°]Flowability
-AoR
CI [–]Flowability
-CI
HR [–]Flowability
-HR
wp52.1 ± 1.1Poor-must be agitated, vibrated35.6Very poor/ very cohesive1.6Very poor/approx. non-flow
gp152.8 ± 0.824.8Passable1.3Passable
gp250.2 ± 0.930.9Poor/cohesive1.4Poor/cohesive
lp5051.1 ± 1.220.1Fair1.3Passable
Table 5. Friction parameter results. δe-effective angle of internal friction, ϕ-wall friction angle, ffc-flow index.
Raw Input Materialδe [°]Φ [°]ffc [-]Flowability Classification
wp46.713.37Easy flowing
gp133.011.815Free flowing
gp227.59.017Free flowing
lp5045.012.66Easy flowing
Table 6. Characteristics of the tests performed in this study for the four fuels used.
FuelTransient +Stability + Shutdown = Total Duration [min]Primary Air [%]Secondary Air [%]Total Air [m3/h]
Wood pellet (wp)45 + 180 + 15 = 240307020
Grass pellet 1-tall oat (gp1)45 + 90 + 15 = 150307020
406020
505020
Grass pellet 2-bent (gp2)45 + 90 + 15 = 150307020
406020
505020
50% leaf + 50% wood (lp50)45 + 90 + 15 = 150307020
406020
505020

