Article

An Online Coordinated Charging/Discharging Strategy of Plug-in Electric Vehicles in Unbalanced Active Distribution Networks with Ancillary Reactive Service in the Energy Market

1
Department of Electrical and Computer Engineering, Curtin University, Perth 6102, Australia
2
College of Electrical Engineering, Shanghai University of Electric Power, Shanghai 200090, China
*
Author to whom correspondence should be addressed.
Energies 2019, 12(7), 1350; https://doi.org/10.3390/en12071350
Submission received: 14 February 2019 / Revised: 29 March 2019 / Accepted: 2 April 2019 / Published: 8 April 2019

Abstract

:
The global acceptance and off-grid charging of plug-in electric vehicles (PEVs) are expected to grow tremendously in the next few years. Uncoordinated PEV charging can cause serious grid issues such as overloading of transformers and unacceptable voltage drops. Single-phase residential charging can also initiate or contribute to voltage unbalance conditions in the distribution networks. A potential solution and key challenge for PEV integration is shifting of the charging activities to off-peak periods. This paper proposes a new PEV coordination approach based on genetic algorithm (GA) optimization to perform online centralized charging and discharging considering transformer loading and node voltage magnitude and unbalance profiles. It allows PEV as source of active and reactive power to participate in energy market based on different prices during a day, without any degradation. Finally, the impacts of uncoordinated and the proposed GA coordinated PEV charging/discharging strategy are simulated for a real unbalanced Western Australian distribution network in the Perth solar city over 24 h.

1. Introduction

1.1. Motivation

The popularity of using PEVs globally as an alternative to traditional petroleum product-fueled automobiles is increasing due to the environmental concerns and economics [1]. Reference [2] reports that a PEV yearly fuel savings in comparison with an internal-combustion-engine (ICE) is more than $700 due to its more energy efficient operation. However, uncoordinated charging behaviors and unpredictable PEV penetration in networks can lead to severe impacts on the grid performance such as voltage regulation and unbalance problems [3,4,5]. Previously traditional methods for voltage mitigation and unbalance issues such as online tap changer (OLTC), voltage regulators (VRs), fixed or switched shunt capacitors and energy storages devices were applied on the feeder [6,7,8]. However, the traditional techniques have some problems that can make them ineffective. Issues like infrequent response to rapid fluctuations due to the mechanical limitations of OLTCs, further failure points as a result of using switched capacitors and high storage prices are among these uncommercial solutions [6]. Reference [1] mentioned that the configuration of the distribution network may change in upcoming years. Consequently, it is challenging to find the optimal location of reactive power compensators in the feeder. Furthermore, it is not beneficial for the utility to pay additional costs for installing new reactive power controllers. For voltage regulation, some researchers have tried to develop a control method for present distribution voltage management devices such as DSTATCOM or VR [7], while others have investigated the possibility of controlling the active and reactive power injection from distribution generation (DG) by using centralized and decentralized techniques [8,9] to moderate the voltage issues in networks [10]. These investigations revealed that not only researchers but also the utilities are motivated to find new and practical approaches for the issues associated with voltage variations and grid performance.

1.2. Literature Review and Related Works

Recently, many studies have been focusing on different control methods that use bidirectional PEV inverters as distributed energy resources [11]. They have shown that the PEV inverter for V2G operation can contribute to reactive power compensation and voltage profile regulation. This can be more efficient in terms of investment and technical feasibility. Reference [12] has addressed the potential opportunity for coordinated charging and discharging of PEVs to provide voltage unbalanced factor (VUF) improvement. Reference [13] emphasizes the significance of preventing voltage unbalance conditions caused by current variations [14].
Nevertheless, references [15] and [3,16] have mentioned that though PEVs have the ability to accomplish energy storage functions in the electric network, the degradation of battery storage is still a concern that needs to be considered. Reference [17] mentioned that voltage regulation in contrast to frequency regulation due to frequent charging and discharging of batteries, cannot affect batteries’ lifetime much. These minimal effects motivate the users to profit from providing voltage regulation [11]. Reactive power compensation can support the grid to maintain power quality and reliability and increase the active power transfer limits as well [17]. Reference [18] has shown the V2G reactive support of on-board chargers does not have any consequences on a battery’s life due to the structure of the charger design. Reference [19] has proposed that independent inverters for voltage improvement by using reactive power capability may affect the active power, so the profit of consumers will be decreased. Moreover, references [19,20] show that the control of reactive power in low voltage distribution networks is less effective than in medium and high voltage networks. As a result, considering voltage maintenance in the end node/bus users in distribution networks needs to be investigated [21]. There are limited references such as [22] and [23] that consider the co-operation between PVs and energy storage in unbalanced networks. However, there is not enough information on PEV inverters to reduce and improve the voltage in the unbalanced system which is examined in this research work.
In recent times, some references such as [24] and [25] have investigated the possibility of using PEVs as a source of reactive power in the reactive market by considering objective functions like minimizing total payment costs and losses in the network, while others have tried to use synchronous generators as a main source for the reactive power [26]. Reference [27] presented a strategic marketplace for reactive power ancillary services for generators/synchronous condensers by considering uniform price auctions and modifying the load flow model. Reference [2] revealed that the reactive power market is not of interest to utilities because the cost of reactive power is much lower than the cost of energy production. However, local sources and distributed generators (DG) can contribute to voltage maintenance in the end node/bus users or rural areas due to the high length (R/X ratio) in LV distribution networks. According to [28], reactive power losses are almost ten times or more in heavily loaded conditions than active power losses due to the nature of distribution lines, so they need to be placed close to the end users. In addition, utilities provide customers with the required reactive power for their electrical apparatus such as washing machines, microwaves and refrigerators at no charge. PEVs might readily supply these locally desired reactive power loads without the need for remote VAR transmission. By considering these local reactive power requirements and their important role in network stability, it is possible to encourage the reactive power producer to maximize his own profits and get benefits from the supply. In a fair market based on supply and demand, reactive power can be valued with appropriate incentives where it is not enough in the grid, although recently some researchers have investigated the capability of PEV inverters as ancillary services for voltage regulation, however there are not many studies considering P and Q in optimal PEV scheduling based on price.
In this paper, a PEV inverter can operate in active power as well as active power/reactive power mode. It means the PEV can inject reactive power based on its price while charging and it can be a way to encourage customers to participate in ancillary support by considering their profits from selling reactive power. The main finding of this study in comparison with previous research is related to the cost associated with the reactive power injection for ancillary services. Many studies have investigated the PEV charging/discharging strategies and its reactive power injection, however, they have not considered the price. As mentioned above, this approach aims at providing ancillary services and customer satisfaction by selling reactive power. In addition, this proposed method ensures that sufficient supplies of reactive power are available at all locations throughout the feeder.
Based on the integration of PEVs as active and reactive power providers in the market, this paper presents an online GA-based PEV coordination charging/discharging strategy for an unbalanced three-phase four-wire LV distribution network. The main contributions of the paper are summarized below:
  • A simple practical PEV-controlled strategy for ancillary voltage support. This online approach aims to minimize the cost and provide ancillary voltage support by making optimal charging/discharging decisions.
  • Customer satisfaction and overall network VUF reduction. Different from the conventional centralized online PEV battery charging technology, the proposed approach relies on centralized PEV charging and discharging, by providing PEV inverter reactive power injections at selected nodes based on variable pricing/contract scenarios for selling reactive power to improve node voltage profiles, reduce the overall network VUF and the total system cost.
  • Solution Justification. Detailed MATLAB simulations were performed for a real 74 node unbalanced Western Australian distribution network to show the impacts of uncoordinated and the proposed GA coordinated PEV charging/discharging strategy on the individual nodes and the overall network over 24 h. The validity of the proposed strategy are proved and presented in the Results section of the paper.
This paper is organized as follows: Section 2 explains system modeling and proposed strategies, Section 3 focuses on problem formulation and explains the objective functions when inverted interface PEV operate in active power mode (OL-C-TP) and active/reactive power mode (OL-C-TPQ) respectively. Section 4 explains all the steps of the proposed method. The test system, simulation results, discussion and conclusions are presented in Section 5, Section 6 and Section 7, respectively.

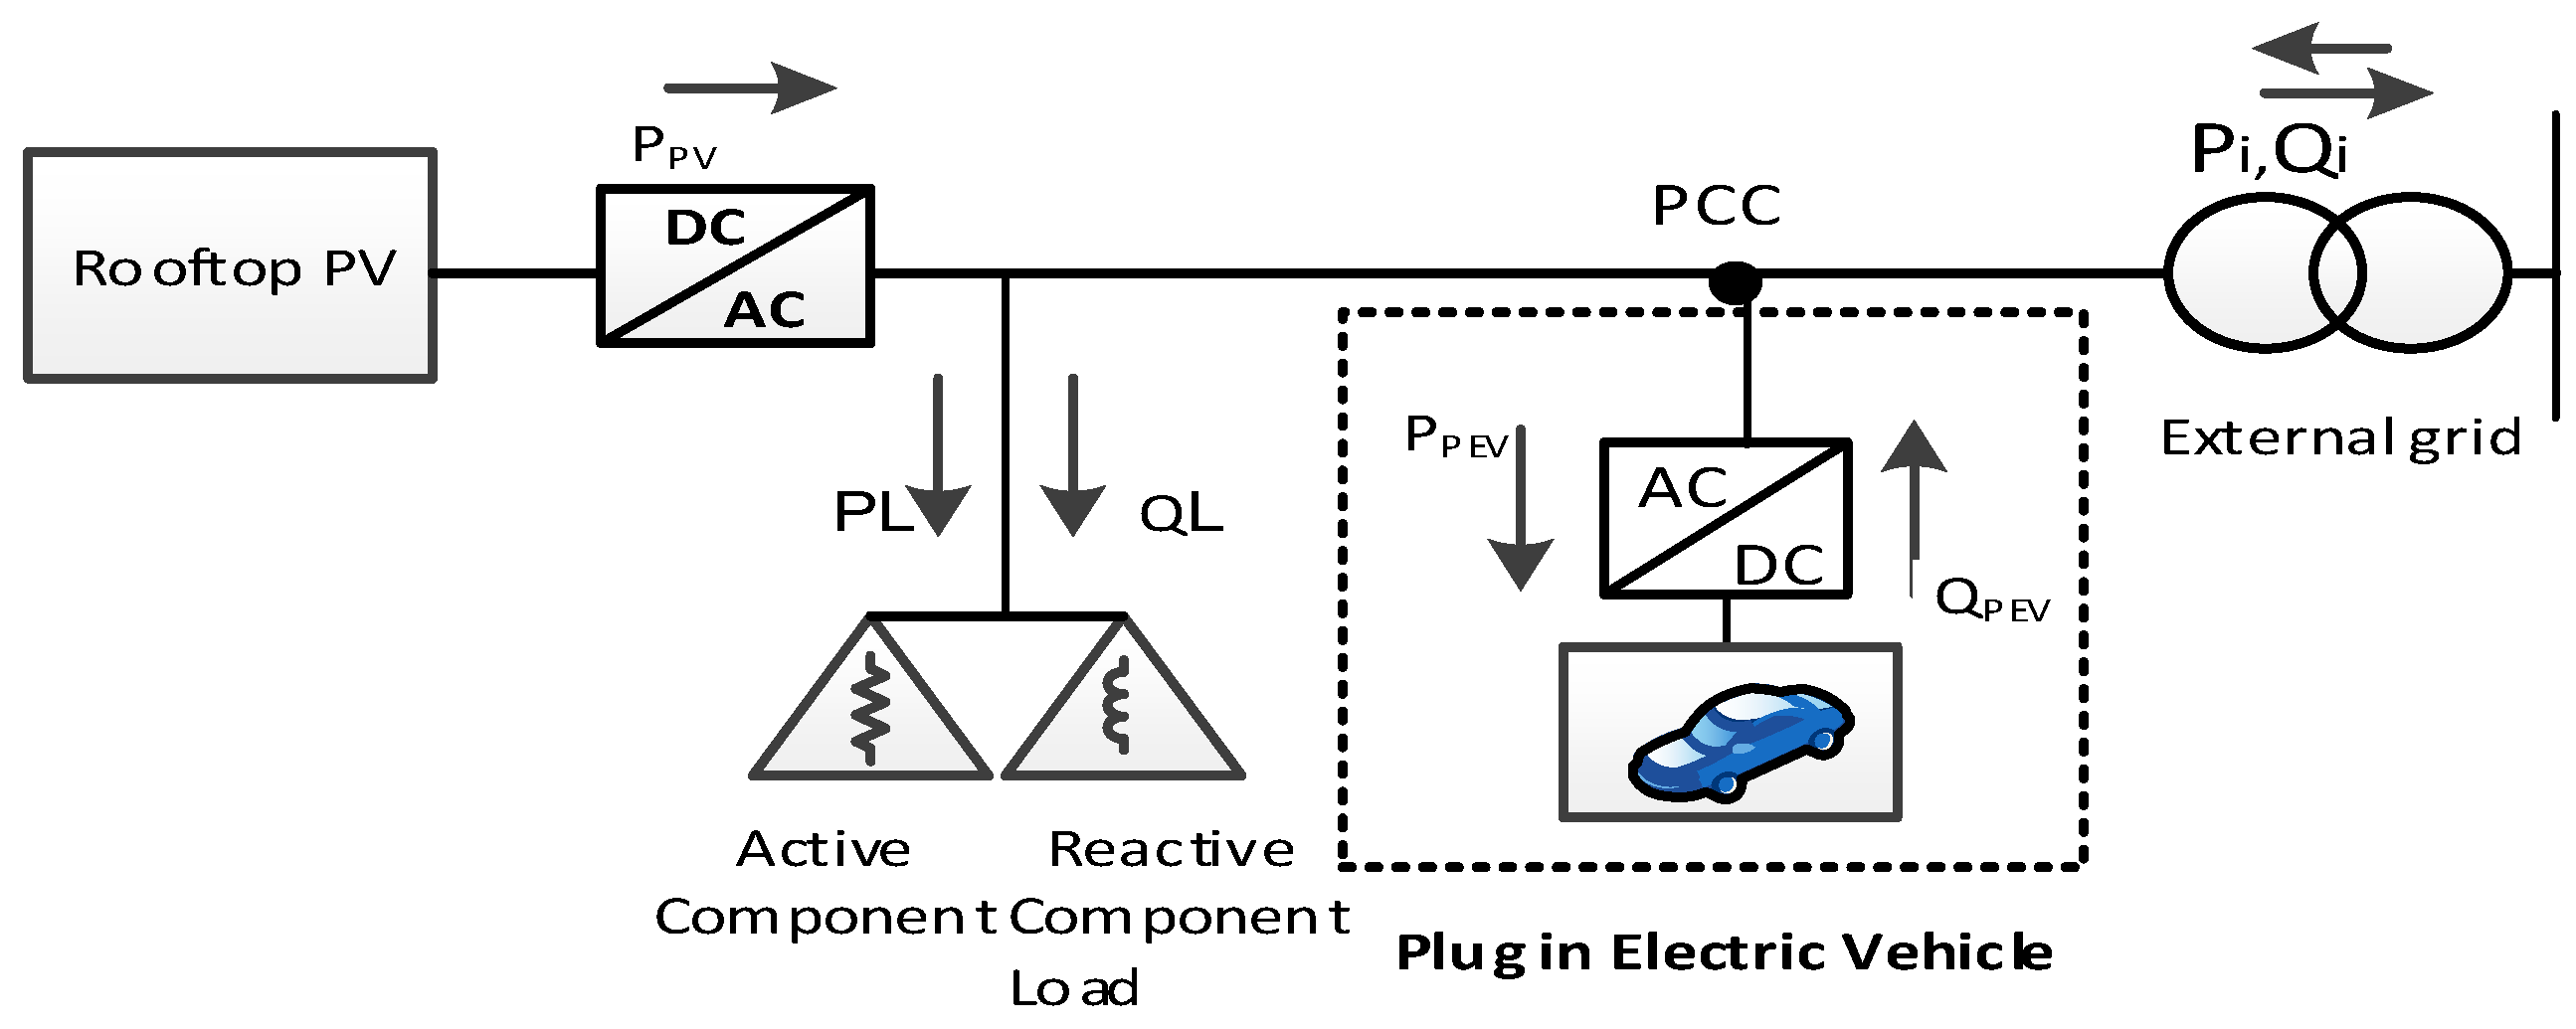
2. System Modelling and Proposed Strategies

2.1. PEV Capability Analysis as Reactive Power Providers in Marketor

Generally, when discussing electricity prices and energy markets, the reactive power market is not considered. However, PEV inverters with their bidirectional power transfer ability can produce both active and reactive power, so there is an opportunity to participate with the reactive power in the energy market [25]. Many studies like [29] and [30] have investigated coordinating PEVs to charge during off-peak hours to prevent overloading of distribution transformers and reduce electricity bills. However, there has not been much focus on the PEV reactive power market for reactive compensation. Reactive power plays an effective role in ensuring secure and reliable power system operation. It helps improve the voltage regulation and the transfer power without battery degradation. According to [31], transferring reactive power over a long distance is difficult due to the high losses from the wires, so it is more effective for the reactive power supplier to be close to the local area where needed. This availability issue limits the number of suppliers in the market. An instructive solution to ensure the availability of sufficient reactive power generators in different areas and time periods is considering the pricing for reactive power. This can encourage the customers to enter the market and contribute to the voltage control in the network. In addition, it can increase the reliability and efficiency of the grid [31] and provides more profits for consumers with PEVs. There are limited research studies like [17] focusing on the day ahead pricing of reactive power based on contracts between grid and commercial reactive power compensators. This reference shows the small reactive power providers like PEVs can follow the commercial contracts which can be obtained using historical data, to provide ancillary services.

2.2. Proposed PEV Inverter Control Strategies

This paper presents an online cost minimization model by optimal coordination of PEVs based on day-ahead price signals, which also performs voltage regulation during the morning and evening hours considering the high penetration of distributed PV. Each residential node with a PEV and a rooftop PV system is connected to the distribution network at the point of common coupling (PCC) as shown in Figure 1.
Based on the reactive capability of a PEV inverter for voltage regulation and active power compensation in this paper, centralized PEV charging/discharging coordination is performed using the following two inverter control strategies:
(1) Optimal Online Charging based on P-Control Strategy (OL-C-TP)—Only Active Power Consumption
This method is based on the conventional P-Control strategy without any PEV reactive power injections. The idea is to make smart PEV battery-charging decisions to prevent line/transformer overloading (due to extreme PEV charging), under-voltage (during peak-load hours) and over-voltage (due to PV generation) conditions while it also reduces generation cost and controls VUF. The active power balance at each PCC node k can be calculated by Equation (1) (see Figure 1). Equation (1) demonstrates that the values of P ( t , k ) will be positive for exporting and negative for importing power:
P ( t , k ) = P PV ( t , k ) P PEV ( t , k ) P L ( t , k )
where k is the node number while P PV ( t , k ) , P PEV ( t , k ) and P L ( t , k ) are the active power for solar PV, PEV and load connected to node k at time t. Usually the reactive power does not have significant impacts on the performance of distribution networks due to the high R/X ratio. So, most attentions are aimed to manage P rather than Q. Therefore, generally the intention is to attain near-unity power factor [32]. For the OL-C-TP strategy, the power factor of PEV inverter is assumed to be unity, consequently no absorption or injection of reactive power happens.
(2) Optimal online Charging/Discharging Control based on PQ-Control Strategy (OL-CD-TPQ)—both Active Power Consumption and Reactive Power Injection
The conventional centralized P control by considering constraints in the network can improve the system by naturally shifting the charging time of PEVs to lower price times. However, due to the distributed single-phase and relatively high PEV active power consumptions, voltage fluctuation and unbalance problems occur, especially at the end-feeder locations. In this regard, a second centralized PEV coordination method that relies on the P/Q consumption/injection control is proposed and investigated. This approach also performs centralized voltage quality improvement by reactive discharging of PEV batteries at selected single-phase residential houses based on day-ahead reactive power price signals for offering voltage regulation. This method is more effective, especially for the end users of the network:
Performing centralized and coordinated PEV charging/discharging (OL-CD-TPQ) for active/reactive power consumption/injection at selected nodes for further voltage regulation and VUF reduction based on energy prices for both active and reactive power.
Selling reactive power using the PEV discharging at the selected centrally managed nodes by motivating consumers to enter the market and cooperate with the utility.
In this scenario, the active power and reactive power outputs for PEV inverter can be calculated by Equations (2) and (3). Equation (4) states the reactive power balance at node k at the PCC and the active power balance can be calculated by (1) as explained in the previous section. Like P ( t , k ) , the Q ( t , k ) will be positive when power is being exported or negative when being imported:
P P EV ( t , k ) = S PEV ( t , k ) · c o s θ
Q PEV ( t , k ) = S PEV ( t , k ) · s i n θ
Q ( t , k ) = Q P E V ( t , k ) Q L ( t , k )
where, S PEV ( t , k ) , θ   a n d   Q L ( t , k ) are the apparent power for PEV, power factor angle and load reactive power requirements, respectively, at each node k at time t.

3. Problem Formulation

3.1. Multi-Objective Function for OL-C-TP with Cost Minimization

The selected objective function of Equation (5) for centralized online PEV coordination in unbalanced system is the minimization of total costs associated with system losses ( F c o s t L o s s ) , energy costs related to active power generation ( F c o s t g e n ) , and the cost of voltage unbalance deviation at pole buses ( F c o s t V U F ) over the 24 h period by selecting the PEVs to connect per phase at each time interval ( t ) , in order to reduce the total cost as well as considering constraints. This objective function only covers the first step of this research (P-Control strategy). This will then be completed to include reactive power injection in the next section (Section 3.2, Equation (9)):
m i n   F C o s t G 2 V = { F c o s t L o s s ( t ) + F c o s t g e n ( t ) + F c o s t V U F ( t ) } ; for   t = 0 , Δ t , 2 Δ t 24   h
F c o s t L o s s ( t ) = a , b , c k = 1 N n o d e K E P l o s s ( t , k )   = a , b , c k = 1 N n o d e K E R ( k , k + 1 ) | ( V ( t , k + 1 ) V ( t , k ) | Y ( k , k + 1 ) ) 2
F c o s t g e n ( t ) = a , b , c k = 1 N n o d e { K P ( t ) P ( t , k )   i f   P ( t ) 0 K S ( t ) P ( t , k )   i f   P ( t ) < 0 }
F c o s t V U F ( t ) = k = 1 N n o d e K V U F ( t ) | V ( t , k ) V + ( t , k ) |
where, Δ t is the time interval and set as 15 min in this study, k is the node number and N n o d e is the total number of nodes, a, b, and c are phase numbers, K E is the cost per kWh of losses from [33,34]; while R ( k , k + 1 ) and Y ( k , k + 1 ) are the resistance and admittance of line between nodes k and k + 1; K P ( t ) and K S ( t ) are the costs per kWh of imported energy generation based on a variable price (this paper considers the winter weekdays in Table 1 [35,36] as shown in Section 6), and exported from solar from [37], respectively. K V U F ( t ) is the penalty for sequence voltage deviation of VUF from their optimal value, to coordinate voltage magnitude and balance profile improvements at time t. In this paper, the rate of VUF deviation is assumed similar to the rate of voltage violation due to the peak generation [22,32]. In support of these objectives, the symmetrical component is used in this paper to simultaneously optimize the level of the voltage magnitude and balance profiles.
In three-phase distribution systems, the voltage unbalance concerns are mainly related to unequal voltage magnitudes and/or the phase angles. According to IEC standards [38], VUF can be calculated by % V U F = | V V + | where V and V + are the immediate negative and positive sequence voltages. In this paper, the backward-forward sweep (BFS) method is implemented for calculating load flow and bus voltages which is known to be suitable for radial and unbalanced distribution systems [39].

3.2. Multi Objective Function for OL-CD-TPQ with Cost Minimization and Ancillary Support

To manage multiple PEV charging and discharging activities in unbalanced distribution networks, the objective function of Equation (5) has been improved by adding ( F c o s t Q , V 2 G ( t ) ) and defined based on day-ahead price signals for offering voltage regulation services. To achieve the best system performance, the total objective in the energy market consists of minimizing of daily operating costs due to power losses, energy generation to charge PEVs, voltage unbalance deviation at pole buses and maximizing of reactive power consumption. Accordingly, the cost function is defined as:
m i n F C o s t G 2 V / V 2 G = { F c o s t L o s s ( t ) + F c o s t g e n ( t ) + F c o s t V U F ( t ) F c o s t Q , V 2 G ( t ) } , for   t = 0 , Δ t , 2 Δ t 24   h
where:
F c o s t Q , V 2 G ( t ) = a , b , c k = 1 N n o d e K Q ( t ) Q i ( t , k ) = a , b , c k = 1 N n o d e K Q ( t ) [ Q P E V ( t , k ) Q L ( t , k ) ]
K Q ( t ) is the cost per cent/kvarh of reactive power export at time t which is assumed in this paper as 10% of the active power price of Table 1. The negative sign ‘–’ in Equation (9) corresponds to exporting reactive power. Equations (5) and (9) are subject to a number of technical constraints in Equations (11)–(15) that will be considered for the operation of smart grid with PEV charging and discharging activities, to offer ancillary voltage support:
• Upper limit on the power demand to prevent overloading conditions from PEV charging and discharging:
k = 1 N n o d e [ P l o a d ( t , k ) + P P E V ( t , k ) P P V ( t , k ) ] P m a x ( t )
where:
P m a x ( t ) = k = 1 N n o d e m a x { P l o a d ( t , k ) }
P l o a d ( t , k ) and P PEV ( t , k ) are the real power of load and PEV charging at node k at each time interval Δ t , respectively. P l o a d ( t , k ) is determined from the daily P curve (Table 1). Equation (13) demonstrates the availability of PEVs. A schedule is valid only if PEV is connected to the grid at the corresponding time step while the consumed active power P E V ( t , k ) is zero:
{ P E V ( t , k ) = 0 , is   not   connected P E V ( t , k ) = 1 , is   connected
  • Upper limit for maximum node voltage deviation ( Δ V m a x ) , which is typically set by the utility:
    Δ V ( t , k ) = | V ( t , k ) 1 | Δ V m a x , for   k = 1 , , N n o d e
  • Upper limit for maximum voltage unbalance factor ( V U F m a x ) that can also be set by the utility:
    V U F ( t , k ) = | V ( t , k ) V + ( t , k ) | V U F m a x , for   k = 1 , , N n o d e
In this paper, the upper limit is V U F m a x = 1.

4. Proposed Online Optimal Controlled PEV Charging/Discharging Approach

4.1. GA Applied at Each Time Slot (Δt)
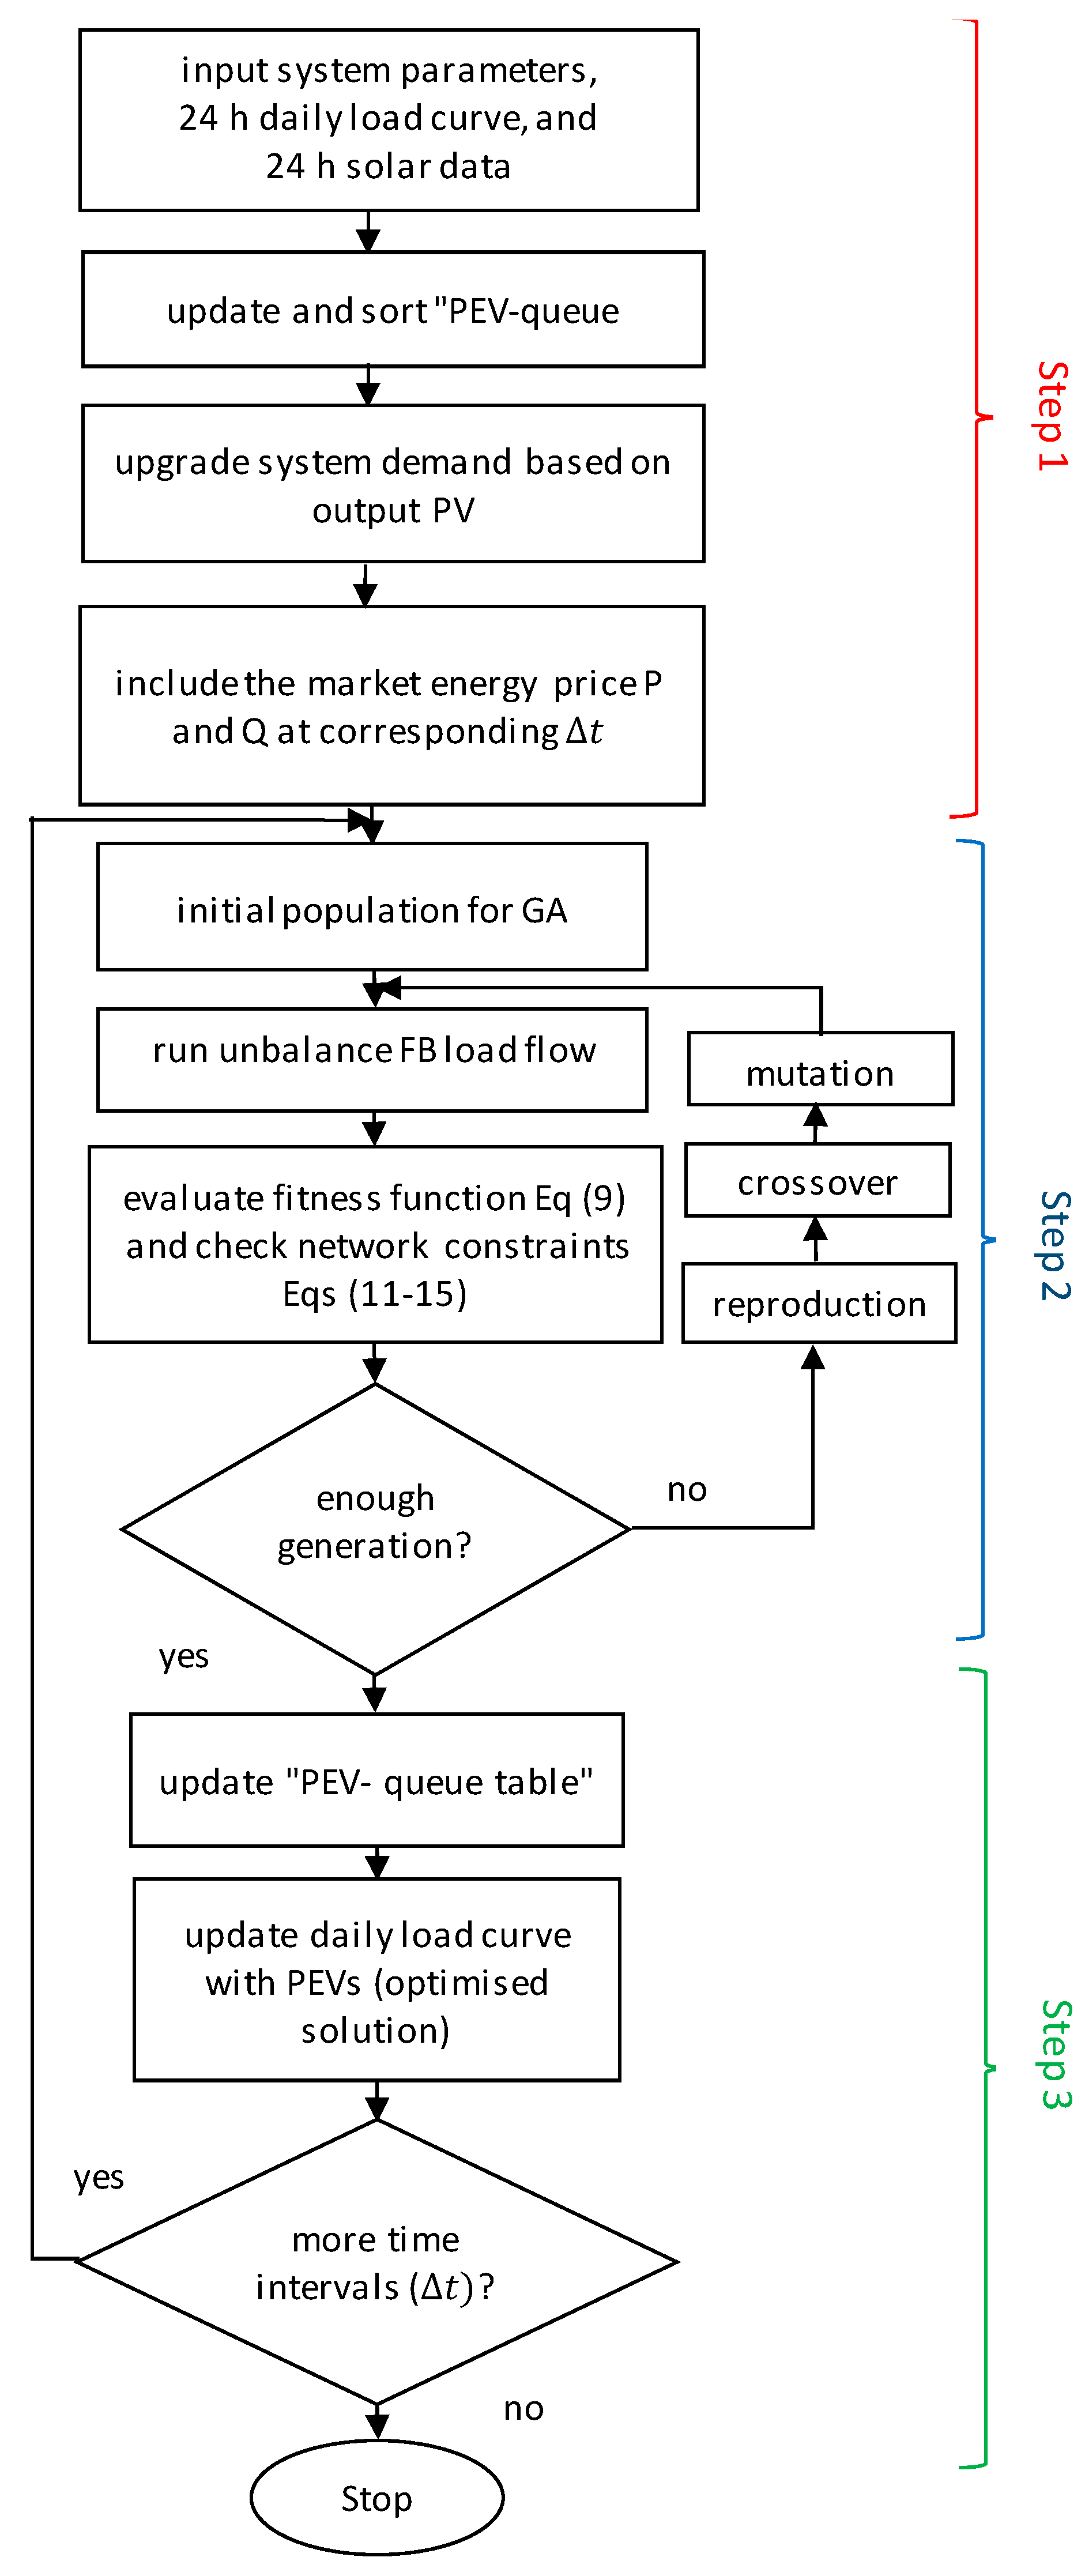
In order to solve PEV charging/discharging problem for ancillary voltage support, a GA optimization is selected to simultaneously consider multi-objective functions with several constraints [40]. The flowchart of the proposed online optimal PEV charging/discharging is shown in Figure 2 and consists of the following three steps:
Step 1:
In this step the required input information including daily load curve, PV status, PEV data (e.g., arrival and departure time, location, charging duration and battery size), and the market energy prices of P and Q will be provided.
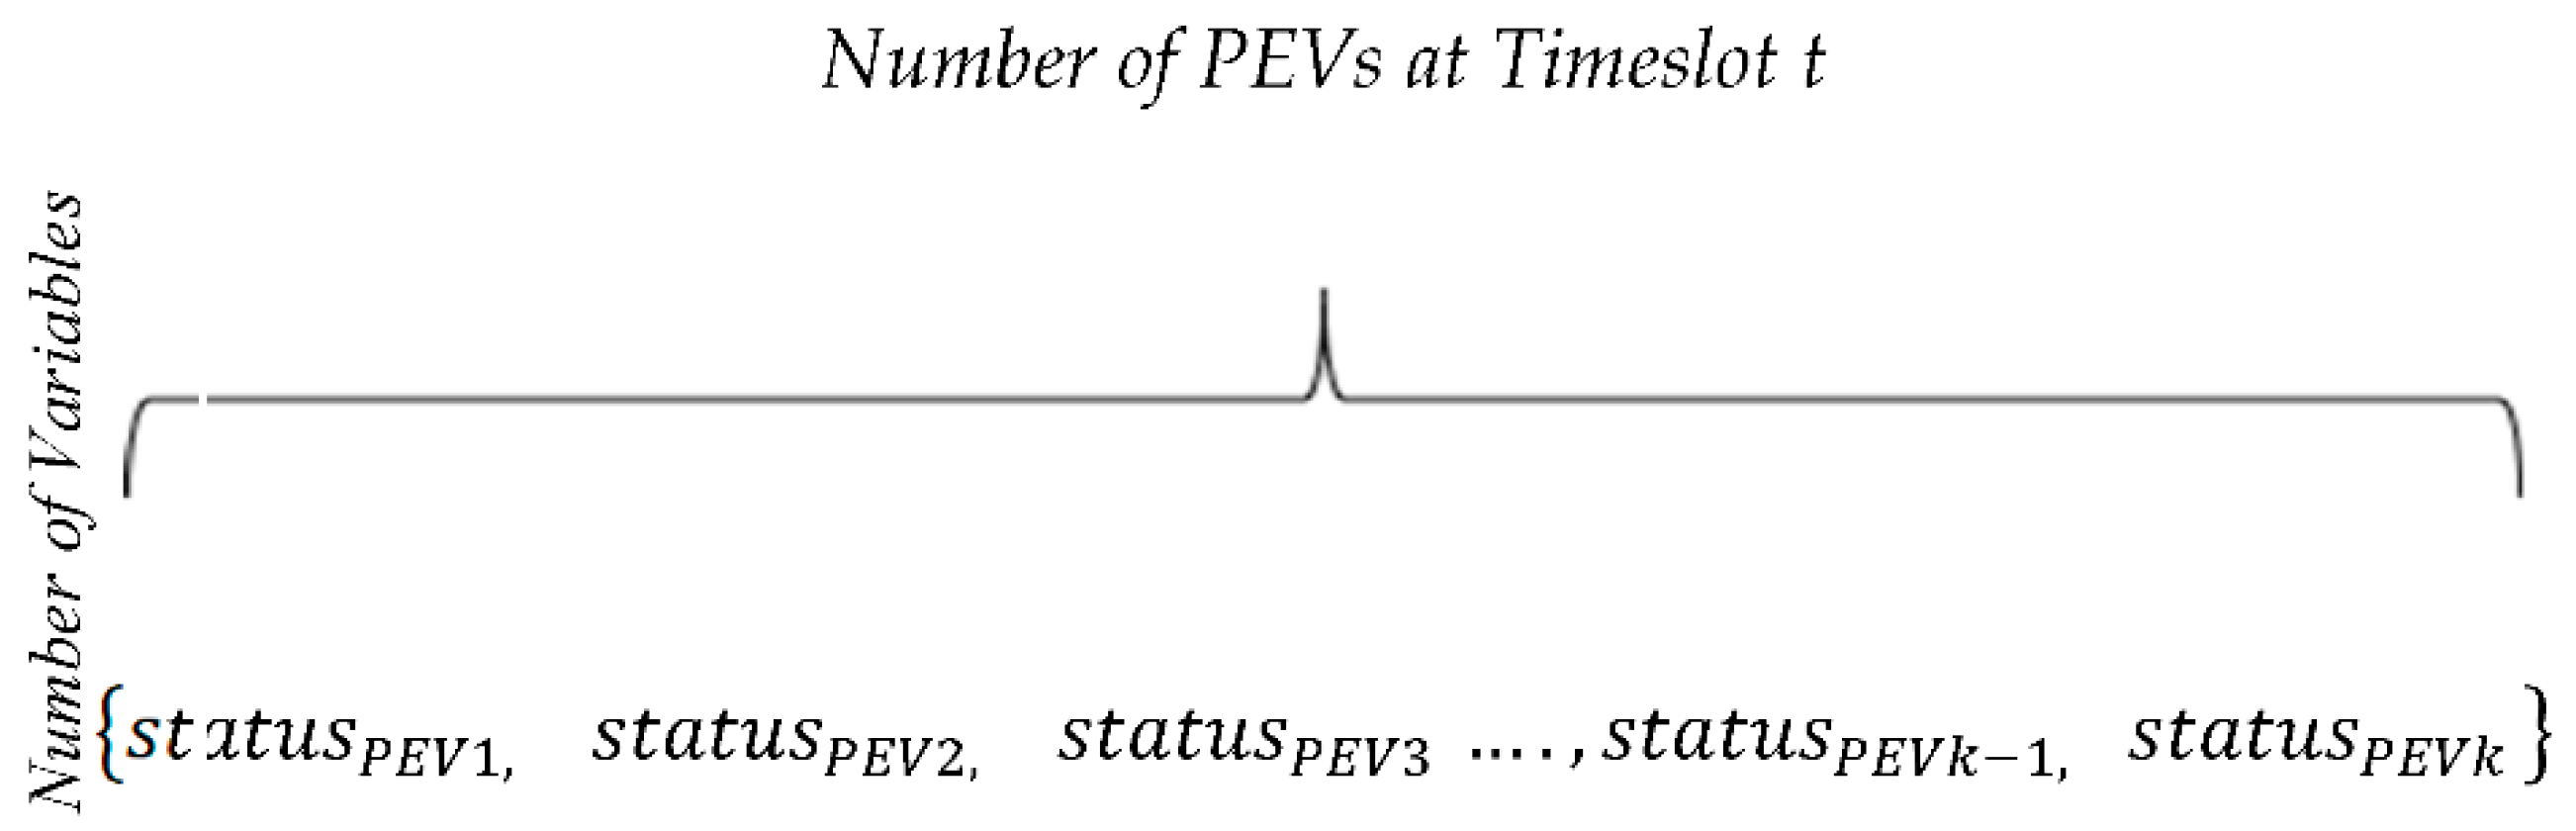
Step 2:
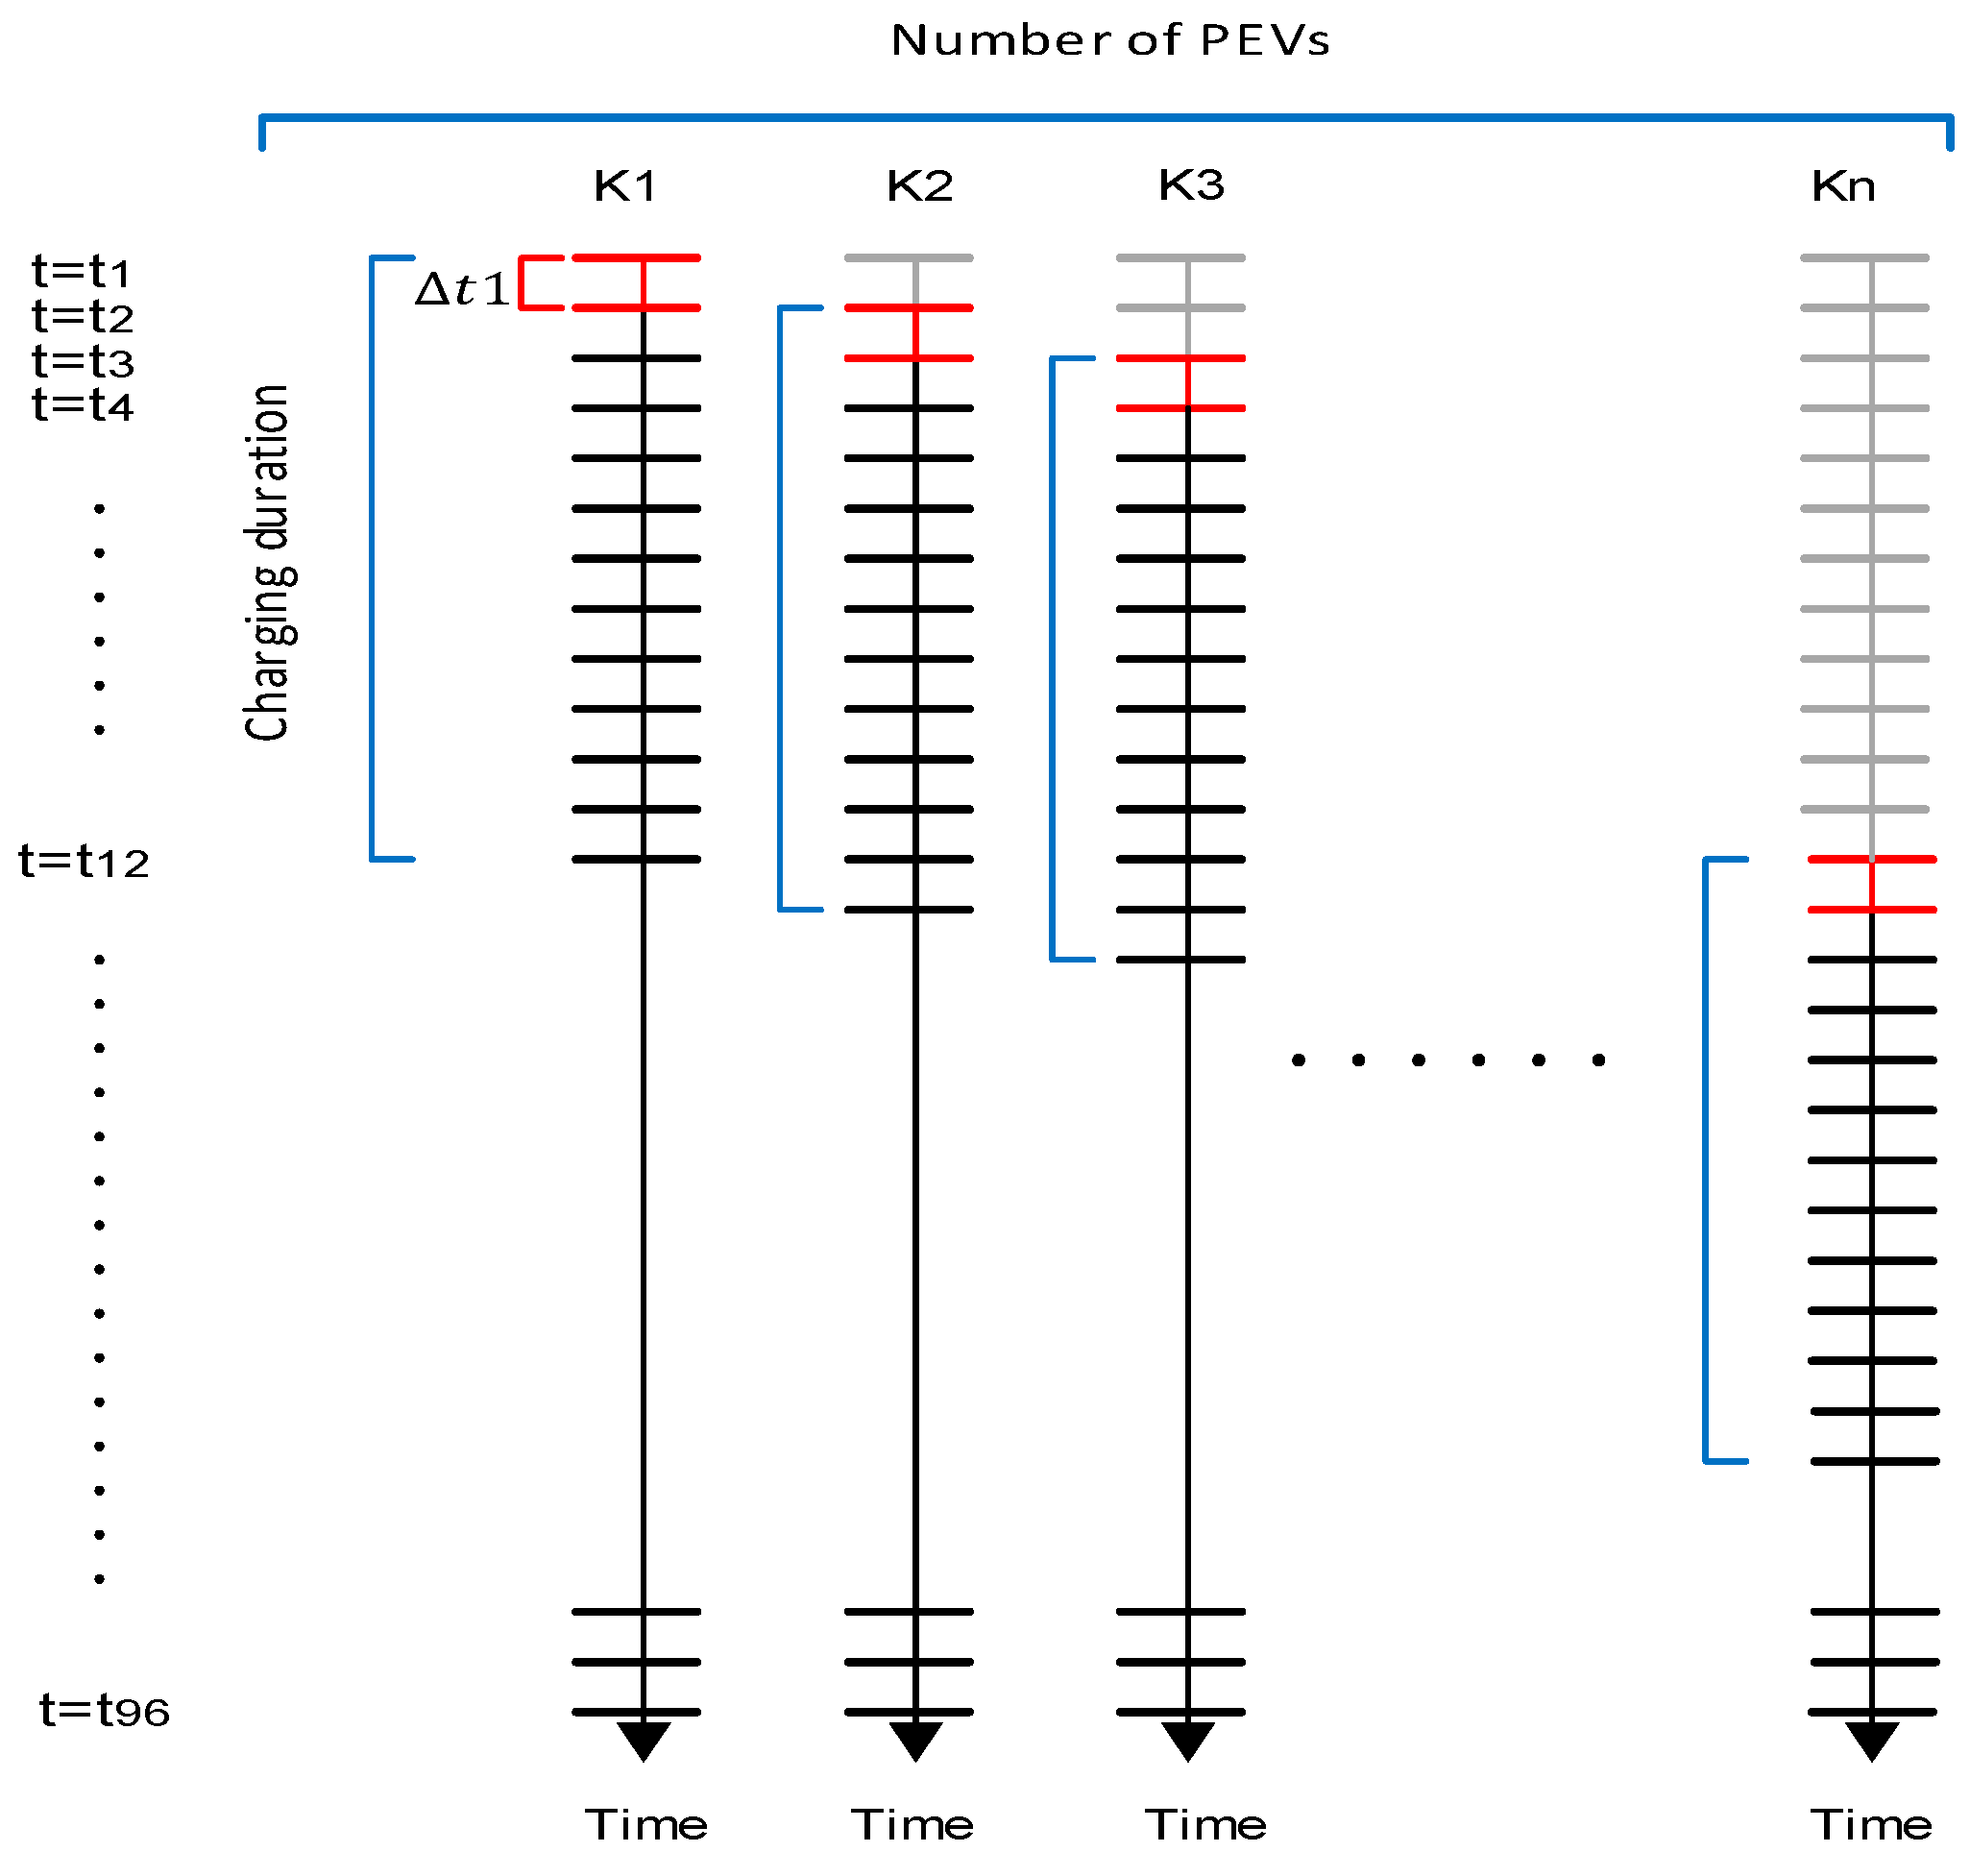
Based on Step 1, GA optimization is then started: The large random initial population is created to increase the convergence rate to the global solution. Then, the unbalanced load flow is run for each individual evaluated by objective function and grid constraints. Figure 3 shows the configuration of GA chromosomes in this study. As the objective function in this paper is minimizing the total system cost and reducing voltage deviation in unbalance network, the control variables in this optimization are the position (status) of all PEVs. The number “0” displays a PEV has not been charged yet or already finished whereas number “1” indicates the PEVs are being charged. For tracing each PEV’s status including their plugged in and plugged out times, initial and requested SOCs as well as battery sizes, a queue table (Q-table) is generated in Figure 4 After plugging a new P P E V ( t , k ) , the Q-table will be updated. This is done by performing GA optimization.
Step 3:
After the GA process when the maximum iteration is achieved, the result shows the optimal status of PEV charging/discharging at the first time slot, so the information of PEV Q-table and daily load curve with optimized solution will be updated and move to the next time slot which is ( Δ t = Δ t + 15   min ) .

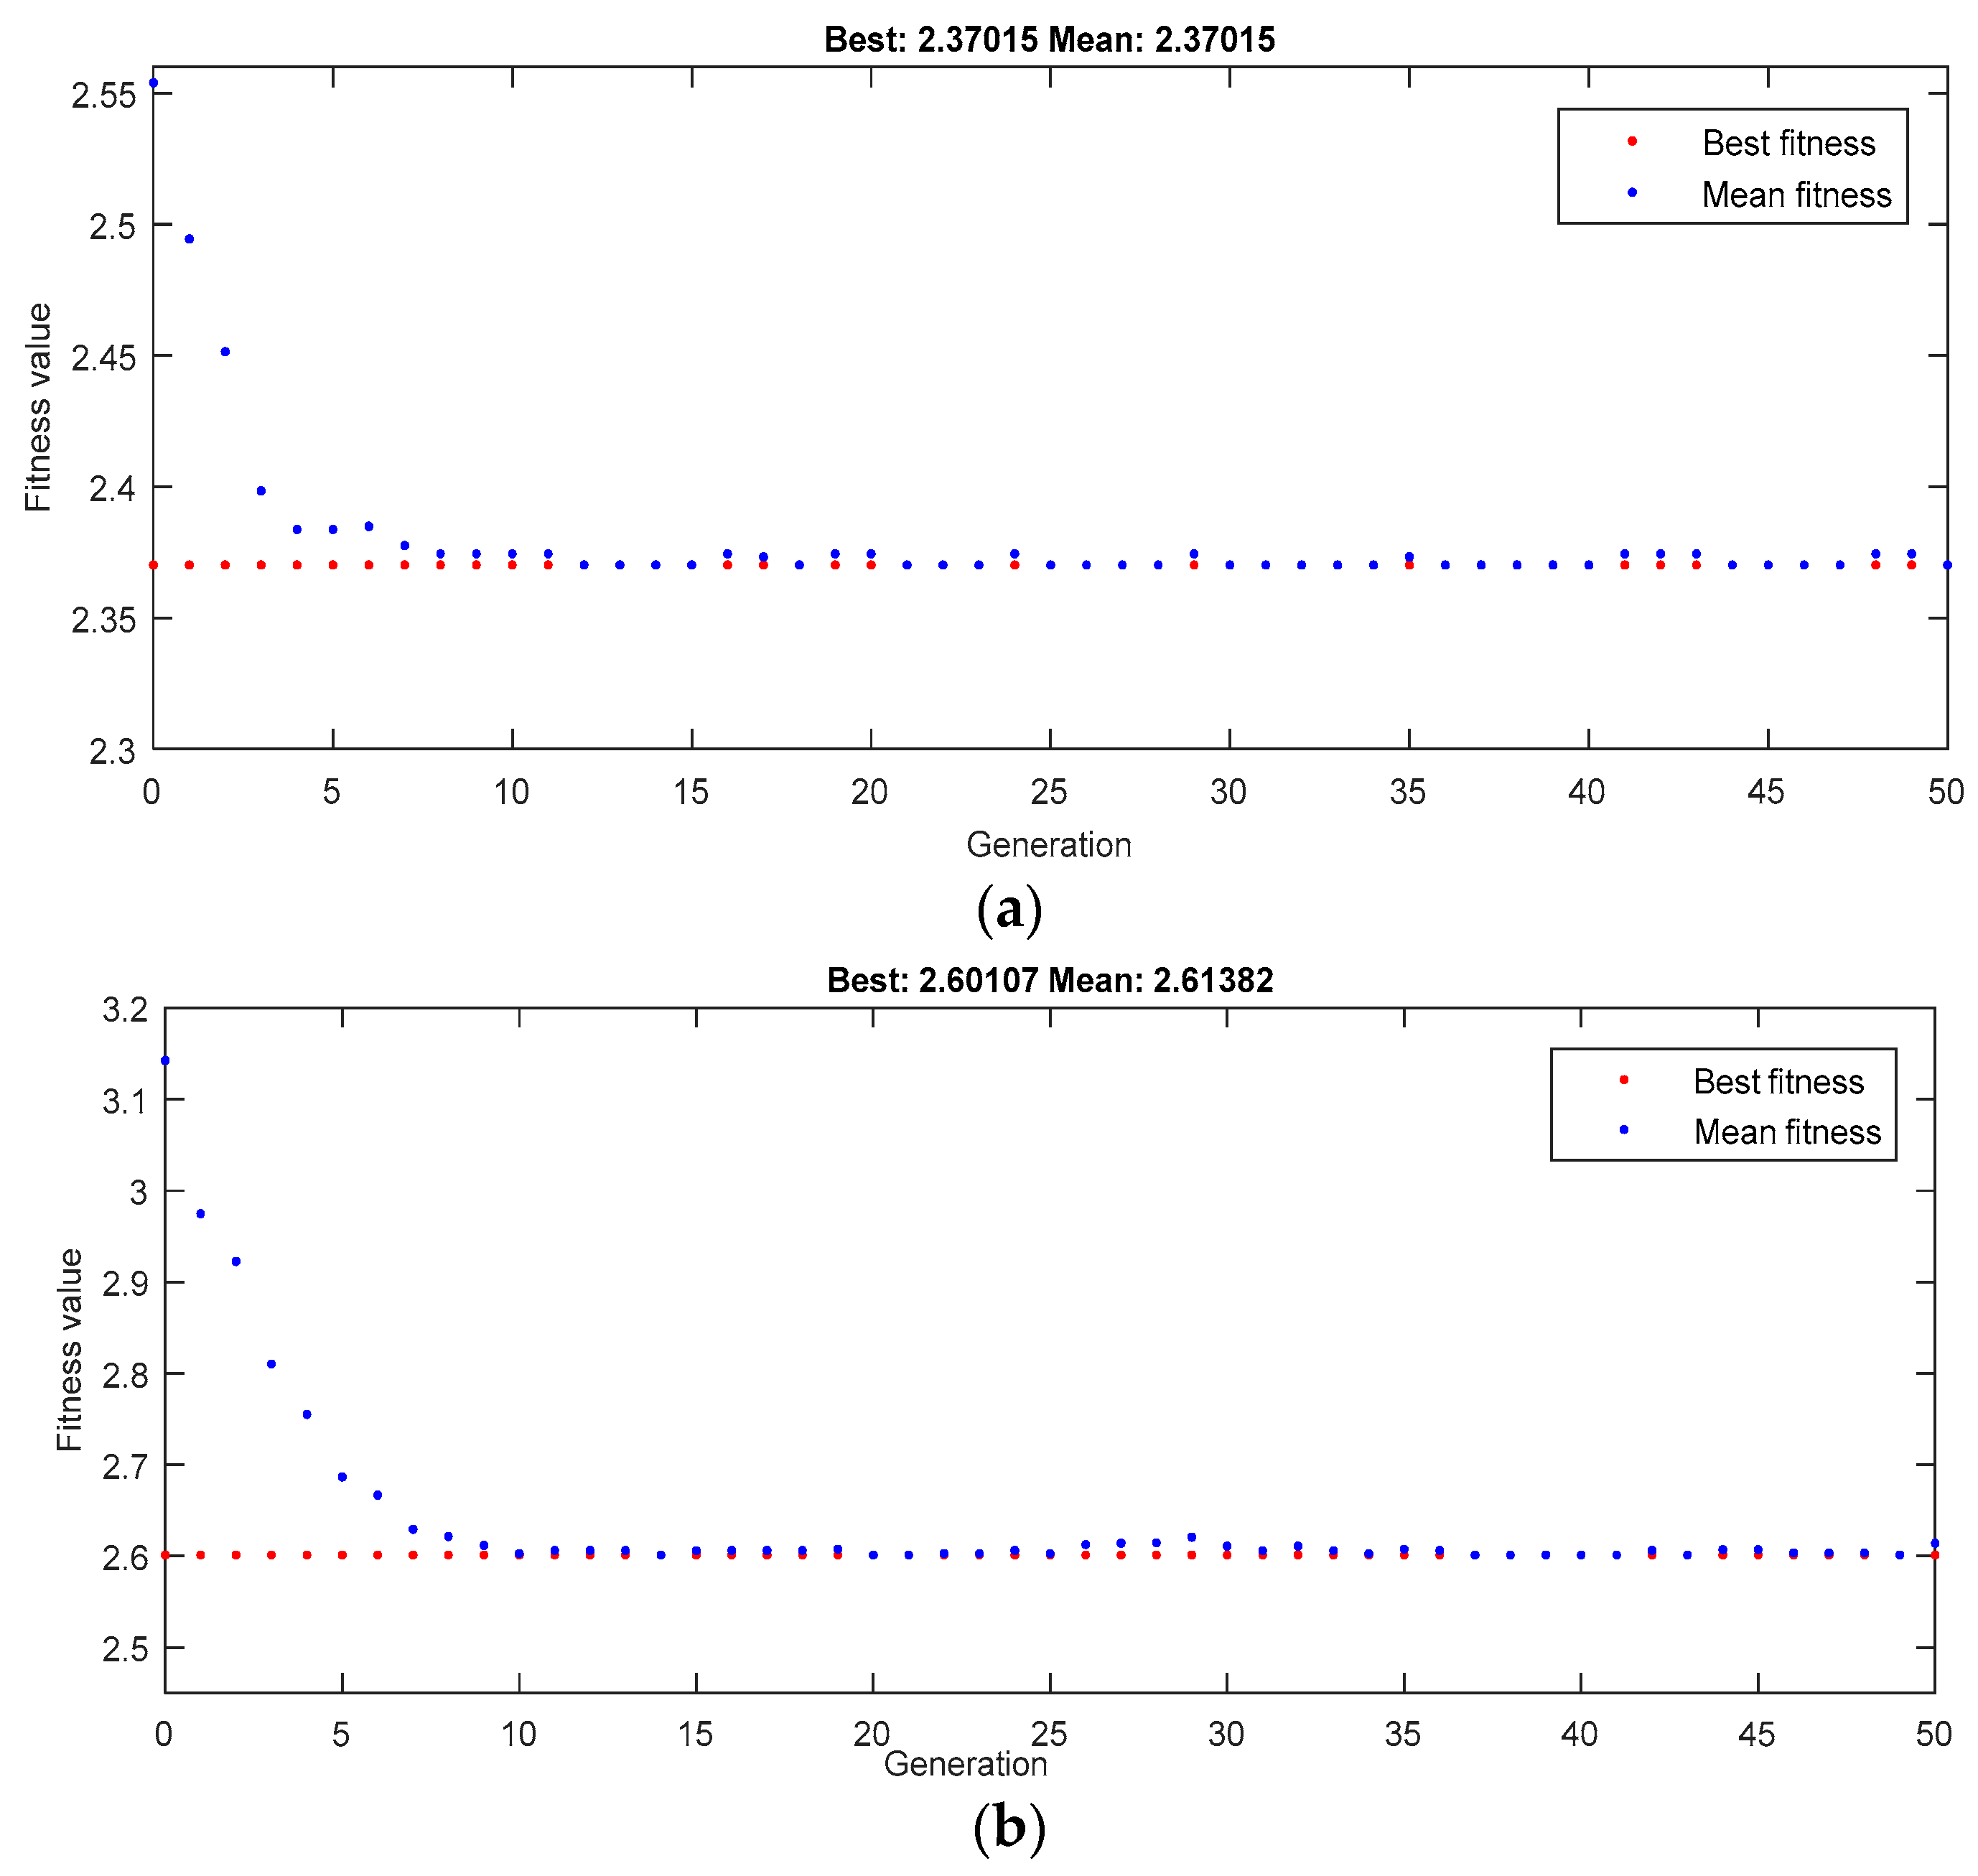
4.2. GA Optimization Process over 24 h

Figure 4 demonstrates the proposed GA optimization schematic for charging/discharging PEVs in unbalanced system during 24 h (96 time slots). t shows the time steps through the optimization based on 15 min while k shows the different number of buses connected to the PEVs. For example in the first time step Δ t 1 , t1 shows the optimized time and start time for charging/discharging a PEV connected to bus k1 while t12 displays the finishing time of PEV charging with 3 h charging duration considered in this paper (12 slots).
The details of each time step of optimization are applied through Section 4.1. As the time progresses, the algorithm updates the information and gets ready to schedule the next time step. Figure 4 shows even though schedules are prepared for several time steps (24 h = 96 time slots), charging/discharging decisions are considered in the current 15 min time step. In this Figure, red color shows the present time step while grey and black colors are previous and future steps which are not carried out through the process.

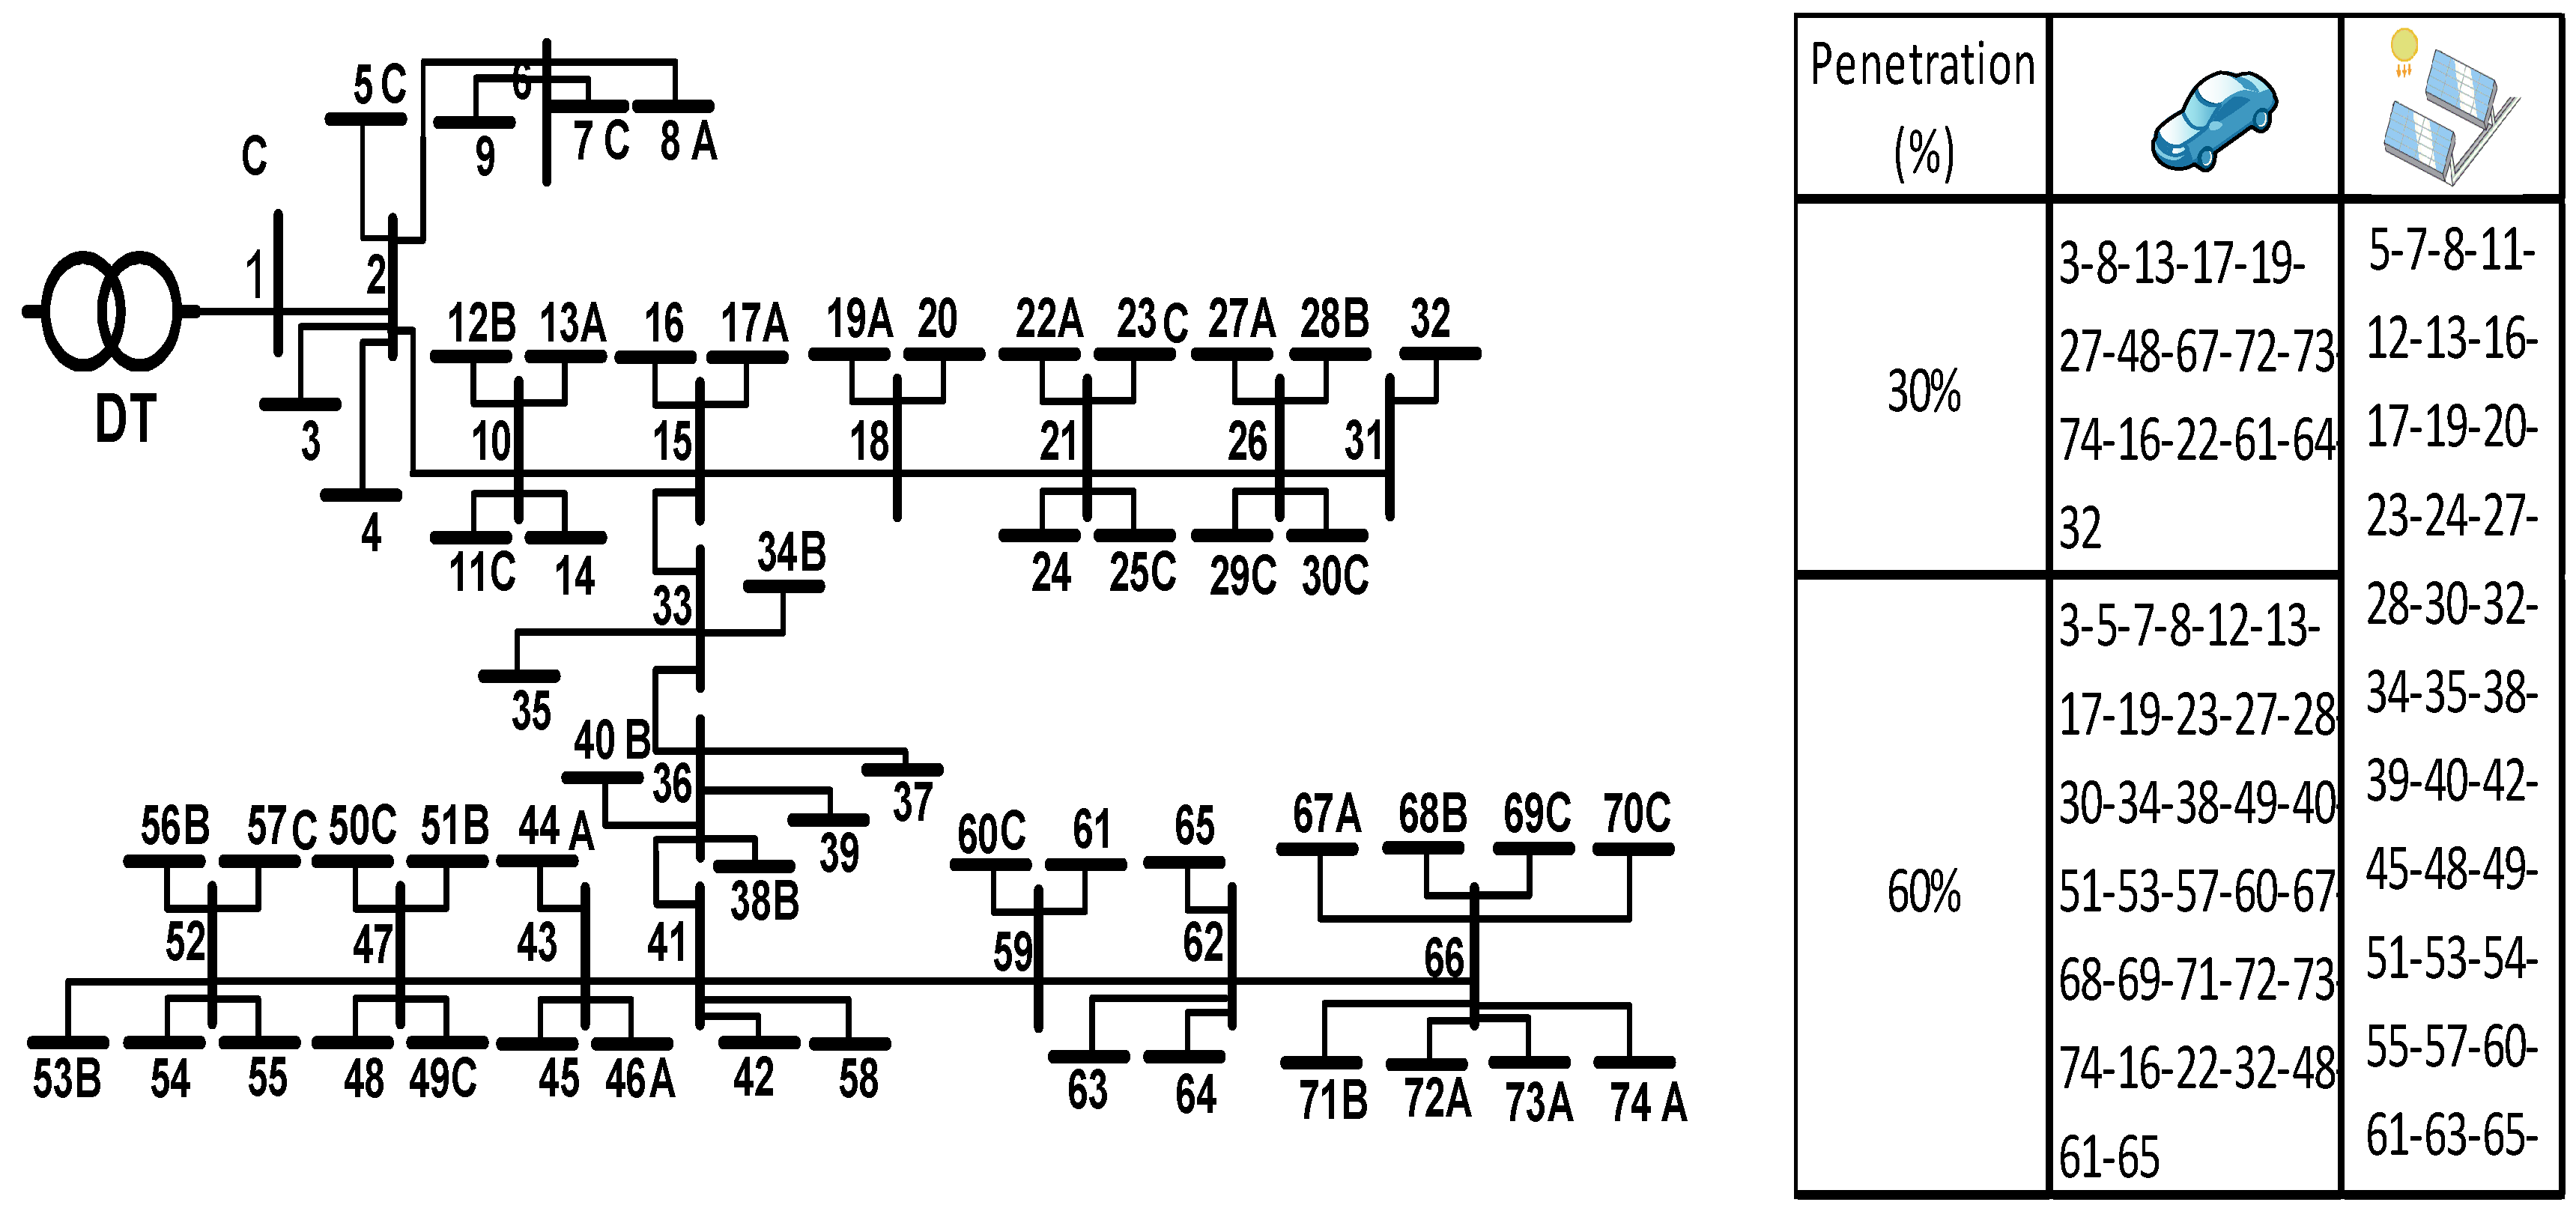
5. Three-Phase Test Distribution System

Figure 5 illustrates the three-phase four-wire distribution system studied in this paper. The feeder model is within the Perth solar city high penetration PV trial run by the regional transmission and distribution network services provider of Western Power (Perth, WA, Australia) [32,41]. The 415/240 V network is supplied by a 200 kVA 22 kV/415 V distribution transformer and includes 74 nodes that feed 56 active residential customers. This is a fairly unbalanced network with 11 houses connected to phase A, 11 houses to phase B and 12 houses to phase C in addition to 22 three-phase customers. The network of Figure 5 is also populated with PEVs through the single and three-phase residential feeders. The corresponding net distribution transformer load on phases A, B and C are 63.2%, 70.9% and 76.7%, respectively.

6. Simulation Results

The simulations of this section are performed using the real network LV distribution model of Figure 5. To increase the level of voltage unbalance, the penetration of rooftop PVs and the residential load demands are reduced by 27% in one of the phases of the network (Phase-C) as demonstrated in Figure 6a. Simulations are performed for the four cases of Table 2 (Case A, B, C and D). Case A presents the base scenario without any PEVs (Figure 6a,b). Case B reveals the uncoordinated PEVs charging with a time step of Δ t = 15 min during the 24 h period (Figure 7a–d). In Case C, online coordination of PEV charging is simulated considering minimization of total cost and VUF for ancillary voltage support on different phases in LV residential feeders (Figure 7e–h). The voltage upgrading by selling reactive power from PEVs are investigated in Case D (Figure 7i–l).
In order to evaluate the performance of the proposed PEV coordination approach and its impacts on the network (Figure 5), the following assumptions and definitions are considered:
  • Total of 24 h with time intervals of ∆t = 15 min;
  • The battery specification uses a Nissan Leaf battery pack per PEV with a capacity of 24 kWh [34] and charge duration of 3 h. For charging devices, a power rate of 5.6 kW at each hour is assumed;
  • Each consumer is assumed to have two PEVs which are randomly plugged in at residential loads (houses) between 8 a.m.–11 a.m. and 4 p.m.–7 a.m. The lower and upper limits for the battery state-of-charge (SOC) are 20% and 90%;
  • As the authors could not access any real price format for reactive power in the market, 10% of the active power price is used as an assumption.

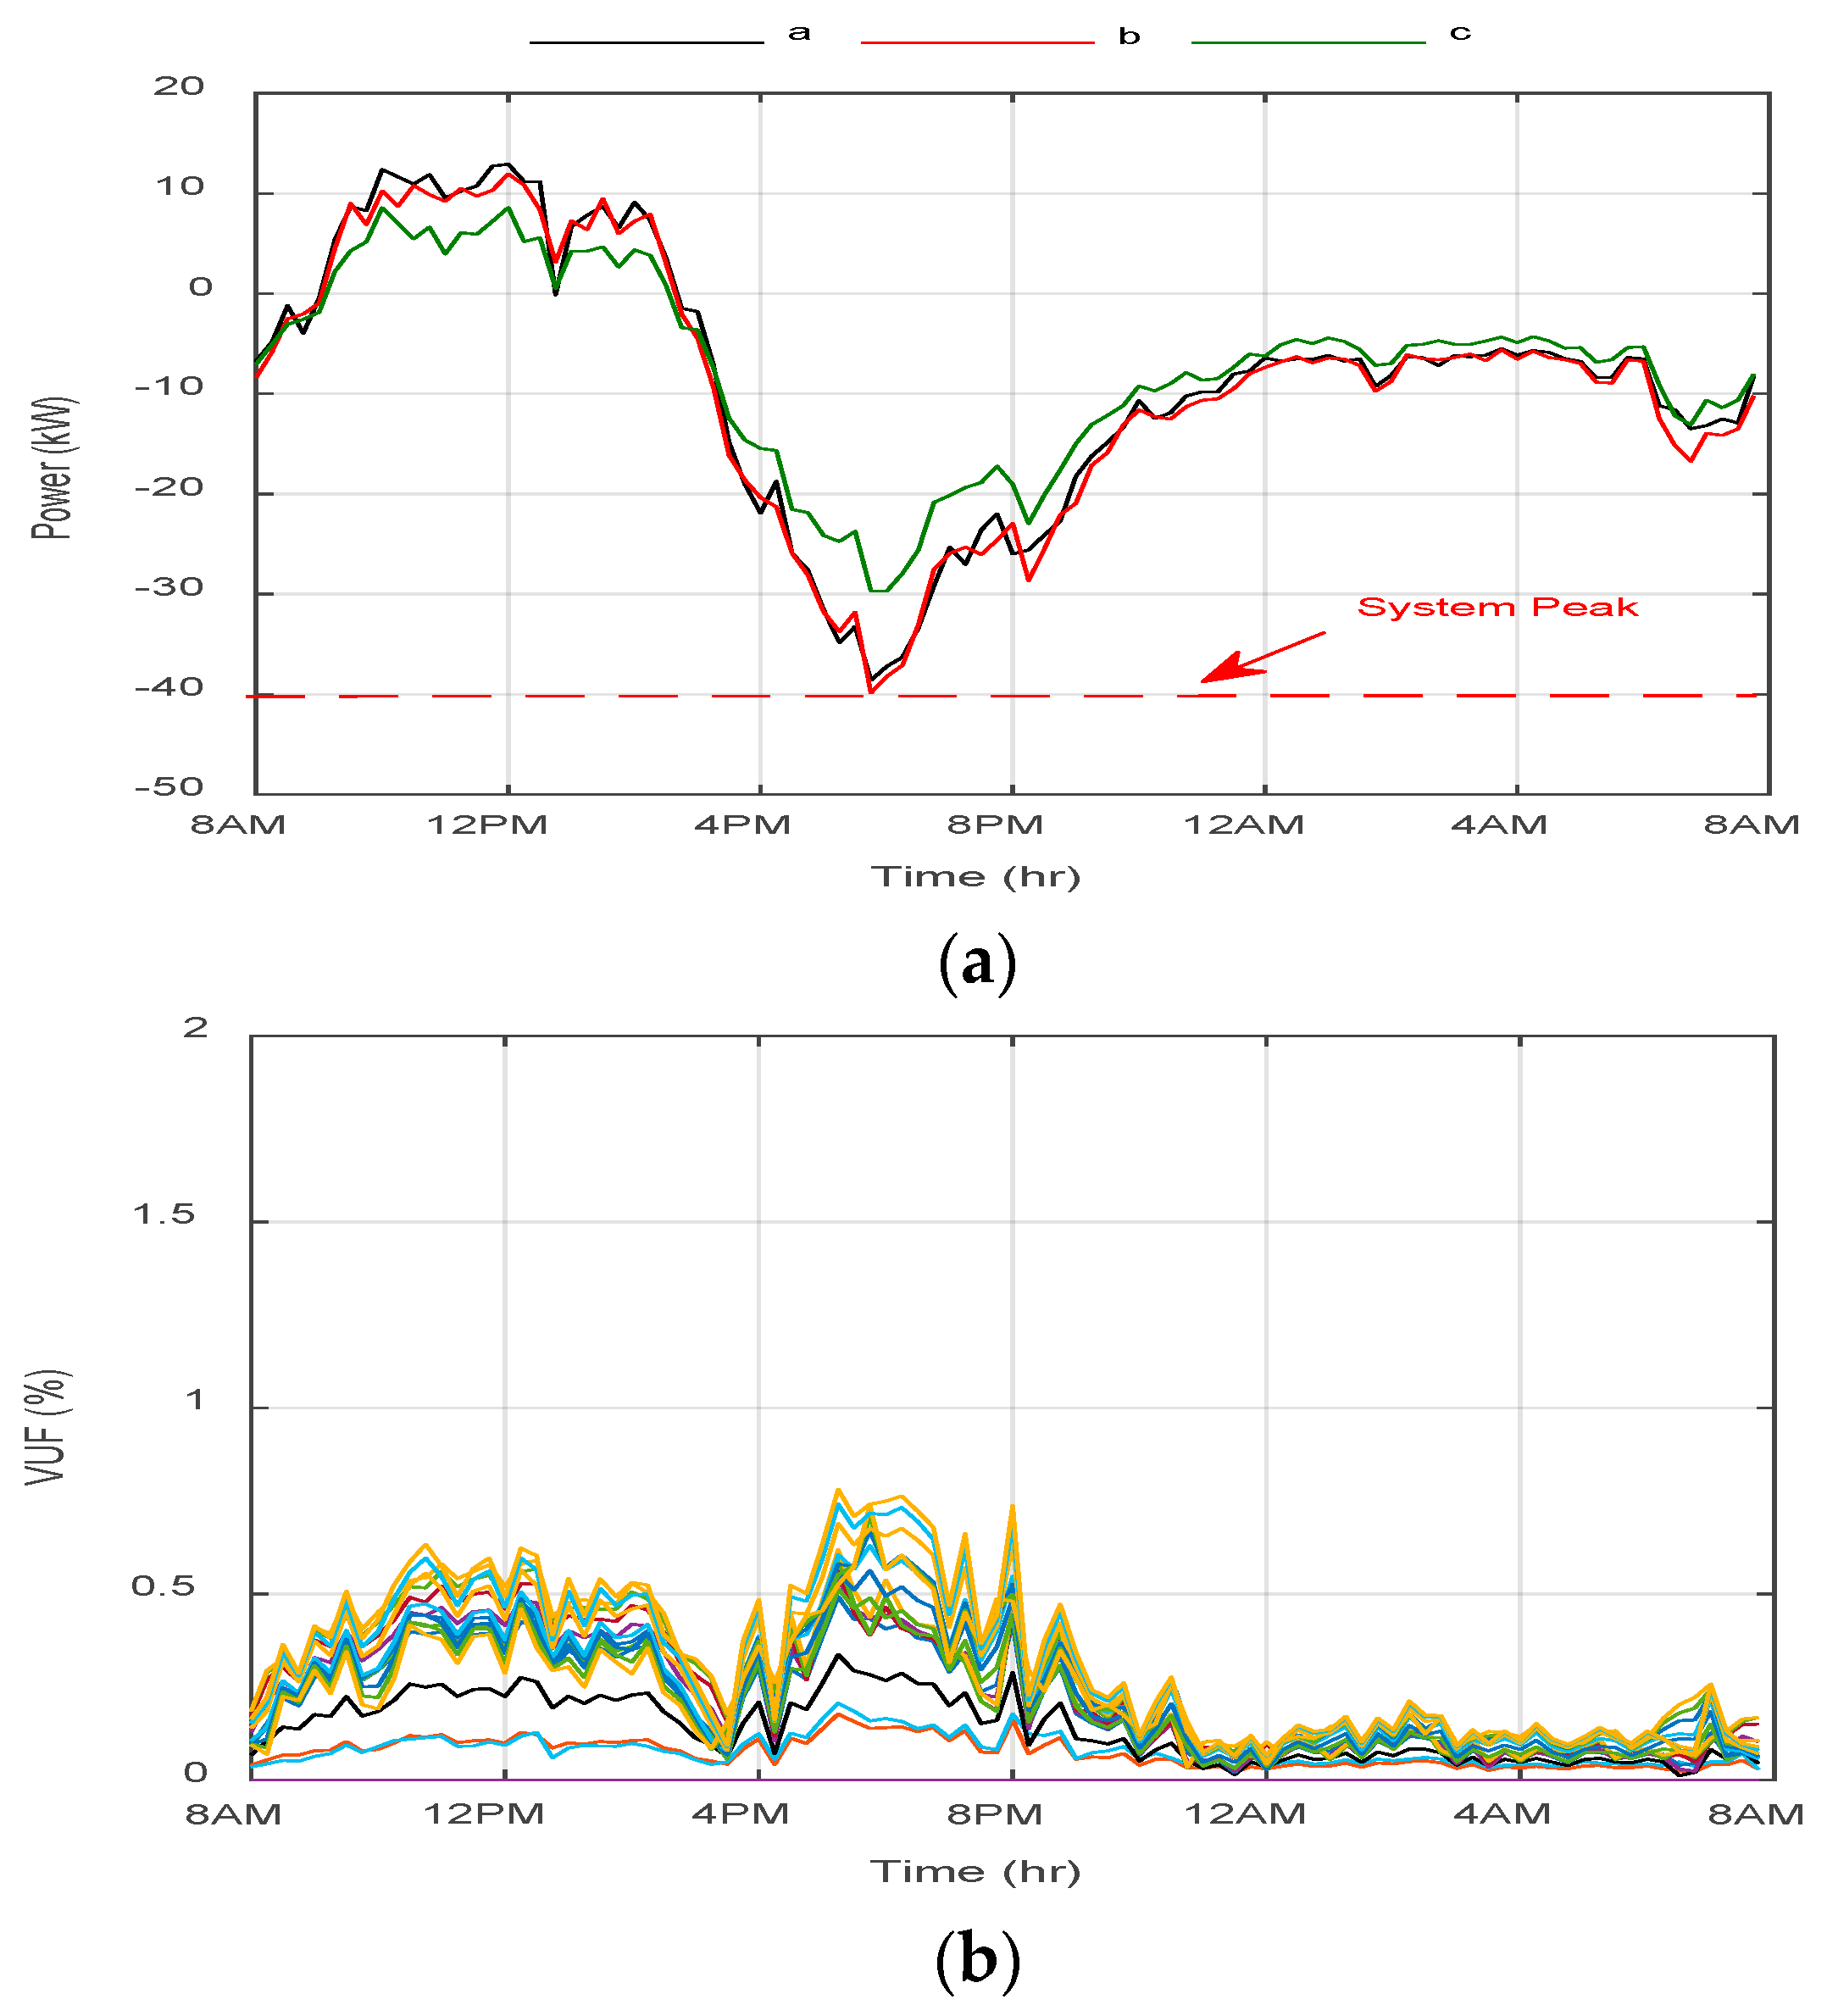
6.1. Base Case with No PEVs (Case A)

Figure 6a shows the power demand for the unbalanced LV residential feeder with PVs but without any PEVs in different phases (a, b, and c) which are shown in black, red and green, respectively. The residential loads in phases C and B consist of local loads and PV outputs. Nevertheless, only half of the residences on phase C are considered to have PV systems for unbalanced conditions. The import and export demands are presented with negative and positive powers, respectively. Besides, Figure 6b displays the network unbalance where each line displays the VUF profile over 24 h at one of the poles. The peak demand and the maximum VUF of the network are between 5:00 p.m.–7:00 p.m., at −40 kW and 0.8%, respectively. Whereas, the maximum VUF during peak PV generation hours is 0.5936% due to the reverse power flow. The voltages of each phase are revealed in Table 3.

6.2. Uncoordinated PEV Charging (Case B)

In this case, it is supposed that customers will quickly charge their PEVs when they arrive home in the morning and/or afternoon hours. PEVs are allowed to be charged as quickly as possible between 8–11 a.m. and 4–7 p.m. without considering any system constraints. Consequently, the vehicle charging mainly happens at the peak demand periods that can result in transformer overloading in different phases (a, b, and c), high VUFs and poor voltage profiles on phases A and B as shown in Figure 7a–d.
According to Table 3, the system power consumption increases during the peak hours and causes significantly higher peaks in the three phases (Figure 7a). In addition, as the rooftop PVs are connected to some of the residential houses, the total network is fairly unbalanced at morning and evening peak hours (Figure 7b). The individual voltages at the PCCs of all houses on phases A and B are shown in Figure 7c,d. During the peak time, the voltages of some nodes fall below the designated minimum threshold of 0.87, due to the vehicle demand. As a result, in all uncoordinated conditions, high generation cost and energy losses are happened as well. The daily energy cost can be calculated by:
Daily   Cost   of   Generation = m = 1 96 generation   Cost   ( m Δ t )

6.3. Coordinated Based on OL-C-TP (Case C)

In this scenario, the coordination strategy of OL-C-TP proposed in Section 2 is used to solve the optimization problem of Equations (5)–(8). The idea is to coordinate PEV charging at each time interval ∆t to improve the overall VUF and reduce the generation cost of system considering the overloading and voltage quality constraints of Equations (11)–(15). In comparison with case B, general improvement in terms of system performance and operational cost is observed (Table 3). Simulation results indicate that the VUF at all nodes are improved and limited to 0.56% and 1.03% during the morning and evening peak hours as shown in Figure 7f. However, Figure 7h shows the voltage profile of phase B during the peak load periods when the voltage magnitudes of some nodes have reached 0.89 pu. In addition, the peak import power on phases B and C are still a little bit over the limit of −40 kW, so it is observed that this case may not be justified for downstream consumers in the networks.

6.4. Coordinated Based on OL-CD-TPQ (Case D)

In this case, the PEV inverters are allowed to absorb/inject active and reactive power simultaneously based on the proposed OL-CD-TPQ strategy of Section 2. It means each PEV has an ability to share its capacity to charge P and discharge Q at the same time based on price signals for minimizing the cost operation and further improvement of voltage regulation and more reduction of VUF. According to Table 3, the total cost of charging PEVs and generation is $115.5 per day which consists of four components, i.e., $118.0 for active power generation, $−3.03 per day for reactive generation from PEVs and the rest for losses and VUF penalties. Compared with Case C, it certainly offers a better solution in terms of both grid operation and for consumers with the total payment reduced from $126.9 to $115.5. Furthermore, the voltages at all buses kept within the system limit (Figure 7k,l), the peak power consumption is above the limit (Figure 7i) and VUF have also been reduced (Figure 7j). From Table 3, the maximum VUF is 0.8% at the peak hours and 0.6% in the morning. In comparison with Case C, the maximum VUF and the worst voltage are significantly improved. To show the effectiveness the proposed mothed the convergence characteristic plot of case D for three separate 15 min are presented in Figure 8a–c between 5:15 p.m.–6 p.m. These figures demonstrate the convergence of the best value and mean value of fitness function with maximum 50 generation.

7. Conclusions

This paper has developed an online and coordinated PEV charging/discharging strategy to minimize the total cost of generation, energy losses and to improve the performance of unbalanced four-wire LV system with high PV penetrations. The proposed method allows PEV owners to generate reactive power for ancillary voltage service and participate in energy market. Two different PEV coordination strategies (OL-C-TP and OL-CD-TPQ) are considered and detailed simulations are presented for the Western Australian Distribution network of Figure 5. The main conclusions are:
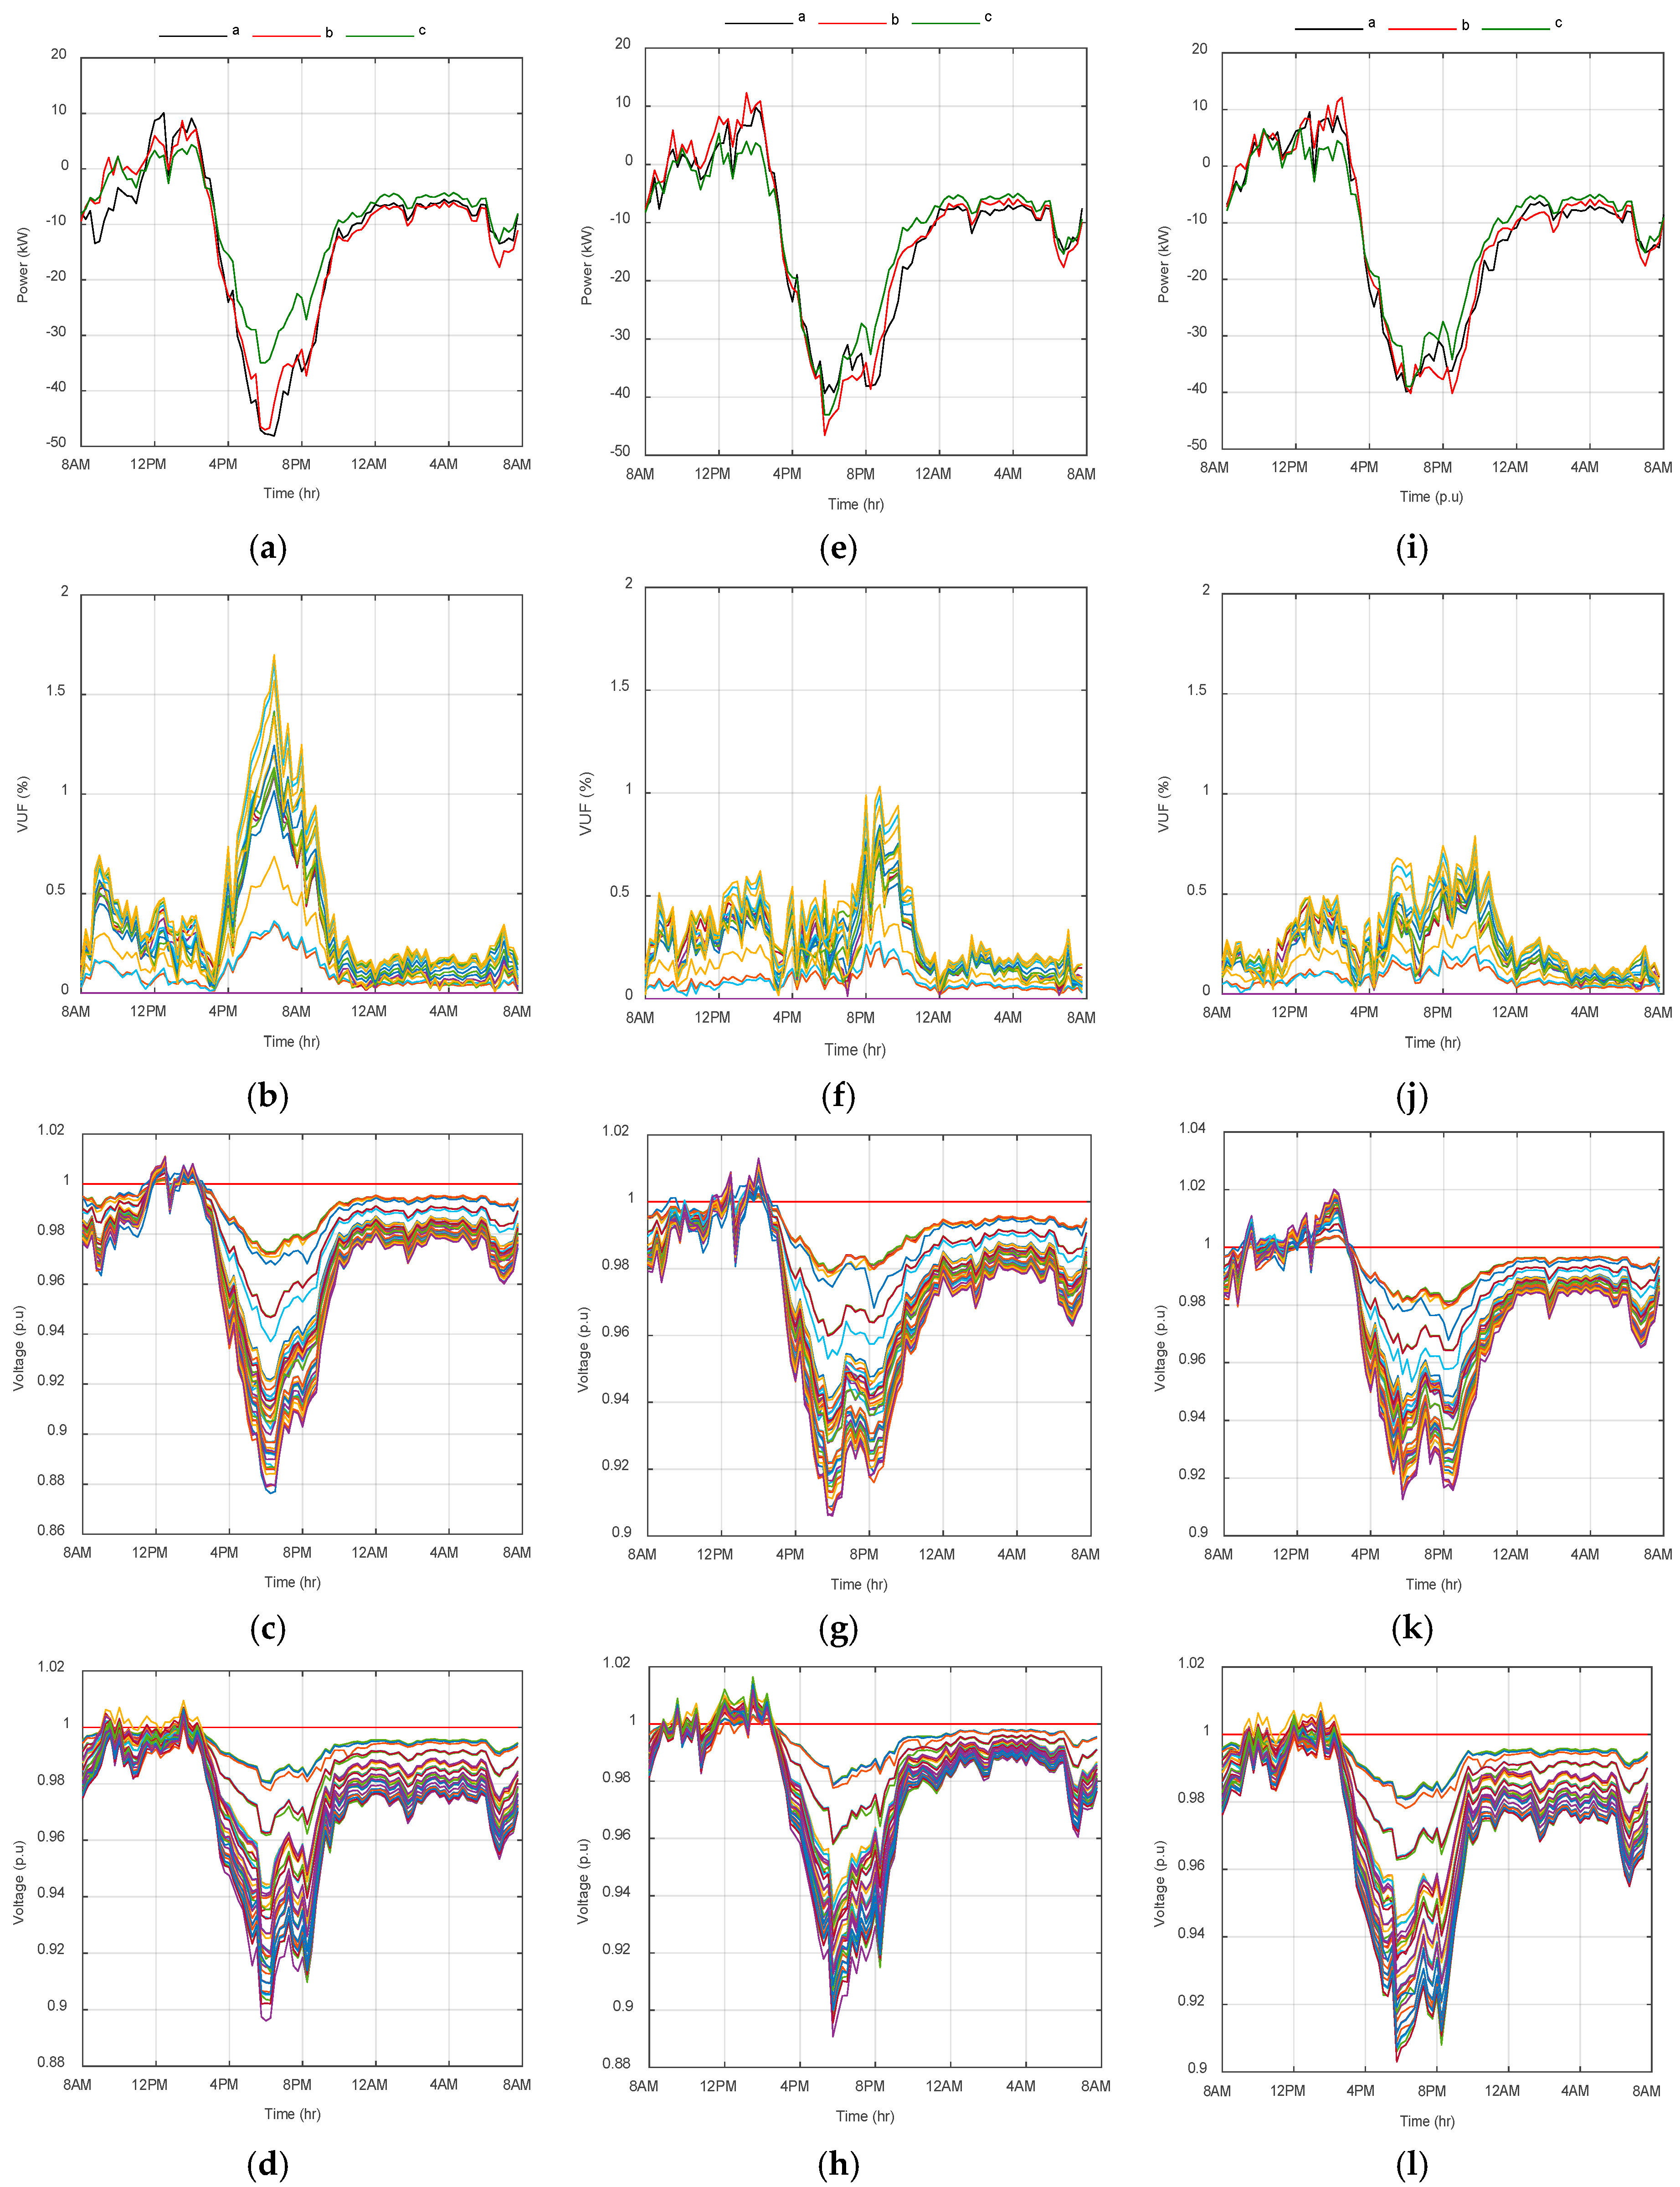
  • Uncontrolled PEV charging has negative impacts on the network demand, VUF and voltage profile as shown in Figure 7a–d. Extreme voltage variations are observed for phase A in the evening, especially during the peak hours while the max VUF is above the designated upper limit.
  • The online PEV charging coordination (OL-C-TP) strategy in conjunction with overloading and voltage constraints minimizes the total cost and limits the voltage fluctuations as shown in Figure 7e–h. This is done by quickly charging as many vehicles as possible while keeping the remaining vehicles in a PEV-queue table and serving them during the off-peak load hours. This method is not guaranteed to reduce the total cost without considering penalties and constraints. The shifted PEVs are successfully charged and the total cost will be decreased.
  • The online PEV coordination (OL-CD-TPQ) strategy also minimizes the VUF and voltage fluctuations as shown in Figure 7i–l. Based on the proposed method, the total cost decreases for consumers (i.e., customer benefits) and the system performance is improved (i.e., utility preference) with the objective function lower than the OL-C-TP strategy. It verifies the feasibility of PEVs to participate in energy market and provide ancillary services.

Author Contributions

N.J. is the main researcher who prepared this paper. She contributed to the sections on modeling of the system, designing intelligent algorithm and optimization. In addition as a first author she is writing the main parts of the paper including simulation results. X.S. and S.D. contributed by drafting and making valuable comments and modifications.

Funding

This research received no external funding.

Acknowledgments

This work is supported by School of Electrical Engineering, Computing and Mathematical Sciences, Curtin University. In addition, the first author is awarded two competitive Australian Government Research Training Program Scholarships to support her research and would like to acknowledge their contributions to this work as the result of the research program. This research was supported by the first author’s supervisor Arindam Ghosh who provided insight and valuable comments that assisted the research.

Conflicts of Interest

The authors declare no conflict of interest.

References

  1. Schleicher-Tappeser, R. How renewables will change electricity markets in the next five years. Energy Policy 2012, 48, 64–75. [Google Scholar] [CrossRef]
  2. Kesler, M.; Kisacikoglu, M.C.; Tolbert, L.M. Vehicle-to-grid reactive power operation using plug-in electric vehicle bidirectional offboard charger. IEEE Trans. Ind. Electron. 2014, 61, 6778–6784. [Google Scholar] [CrossRef]
  3. Ungar, E.; Fell, K. Plug In, Turn On, and Load Up. IEEE Power Energy Mag. 2010, 8, 30–35. [Google Scholar] [CrossRef]
  4. Lopes, J.A.P.; Soares, F.J.; Almeida, P.M.R. Integration of Electric Vehicles in the Electric Power System. Proc. IEEE 2011, 99, 168–183. [Google Scholar] [CrossRef]
  5. Hoog, J.D.; Alpcan, T.; Brazil, M.; Thomas, D.A.; Mareels, I. Optimal Charging of Electric Vehicles Taking Distribution Network Constraints Into Account. IEEE Trans. Power Syst. 2015, 30, 365–375. [Google Scholar] [CrossRef]
  6. Liu, X.; Aichhorn, A.; Liu, L.; Li, H. Coordinated control of distributed energy storage system with tap changer transformers for voltage rise mitigation under high photovoltaic penetration. IEEE Trans. Smart Grid 2012, 3, 897–906. [Google Scholar] [CrossRef]
  7. Aziz, T.; Hossain, M.; Saha, T.; Mithulananthan, N. VAR planning with tuning of STATCOM in a DG integrated industrial system. IEEE Trans. Power Deliv. 2013, 28, 875–885. [Google Scholar] [CrossRef]
  8. Džafić, I.; Jabr, R.A.; Halilovic, E.; Pal, B.C. A sensitivity approach to model local voltage controllers in distribution networks. IEEE Trans. Power Syst. 2014, 29, 1419–1428. [Google Scholar] [CrossRef]
  9. Li, H.; Li, F.; Xu, Y.; Rizy, D.T.; Adhikari, S. Autonomous and adaptive voltage control using multiple distributed energy resources. IEEE Trans. Power Syst. 2013, 28, 718–730. [Google Scholar] [CrossRef]
  10. Cheng, L.; Chang, Y.; Huang, R. Mitigating voltage problem in distribution system with distributed solar generation using electric vehicles. IEEE Trans. Sustain. Energy 2015, 6, 1475–1484. [Google Scholar] [CrossRef]
  11. Kisacikoglu, M.C.; Ozpineci, B.; Tolbert, L.M. Effects of V2G reactive power compensation on the component selection in an EV or PHEV bidirectional charger. In Proceedings of the 2010 IEEE Energy Conversion Congress and Exposition (ECCE), Atlanta, GA, USA, 12–16 September 2010; pp. 870–876. [Google Scholar]
  12. Jabalameli, N.; Masoum, M.A.; Deilami, S. Optimal online charging of plug-in electric vehicles considering voltage unbalance factor. In Proceedings of the 2017 IEEE Power & Energy Society General Meeting, Chicago, IL, USA, 16–20 July 2017; pp. 1–5. [Google Scholar]
  13. Sechilariu, M.; Wang, B.; Locment, F. Building Integrated Photovoltaic System With Energy Storage and Smart Grid Communication. IEEE Trans. Ind. Electron. 2013, 60, 1607–1618. [Google Scholar] [CrossRef]
  14. Shahnia, F.; Ghosh, A.; Ledwich, G.; Zare, F. An approach for current balancing in distribution networks with rooftop PVs. In Proceedings of the 2012 IEEE Power and Energy Society General Meeting, San Diego, CA, USA, 22–26 July 2012; pp. 1–6. [Google Scholar]
  15. Yilmaz, M.; Krein, P.T. Review of the impact of vehicle-to-grid technologies on distribution systems and utility interfaces. IEEE Trans. Power Electron. 2013, 28, 5673–5689. [Google Scholar] [CrossRef]
  16. Zhou, C.; Qian, K.; Allan, M.; Zhou, W. Modeling of the cost of EV battery wear due to V2G application in power systems. IEEE Trans. Energy Convers. 2011, 26, 1041–1050. [Google Scholar] [CrossRef]
  17. Wu, C.; Mohsenian-Rad, H.; Huang, J.; Jatskevich, J. PEV-based combined frequency and voltage regulation for smart grid. In Proceedings of the 2012 IEEE PES Innovative Smart Grid Technologies (ISGT), Washington, DC, USA, 16–20 January 2012; pp. 1–6. [Google Scholar]
  18. Kisacikoglu, M.C.; Ozpineci, B.; Tolbert, L.M. EV/PHEV bidirectional charger assessment for V2G reactive power operation. IEEE Trans. Power Electron. 2013, 28, 5717–5727. [Google Scholar] [CrossRef]
  19. Stetz, T.; Marten, F.; Braun, M. Improved low voltage grid-integration of photovoltaic systems in Germany. IEEE Trans. Sustain. Energy 2013, 4, 534–542. [Google Scholar] [CrossRef]
  20. Carvalho, P.M.; Correia, P.F.; Ferreira, L.A. Distributed reactive power generation control for voltage rise mitigation in distribution networks. IEEE Trans. Power Syst. 2008, 23, 766–772. [Google Scholar] [CrossRef]
  21. Kabir, M.; Mishra, Y.; Ledwich, G.; Dong, Z.Y.; Wong, K.P. Coordinated control of grid-connected photovoltaic reactive power and battery energy storage systems to improve the voltage profile of a residential distribution feeder. IEEE Trans. Ind. Inform. 2014, 10, 967–977. [Google Scholar] [CrossRef]
  22. Akhavan-Rezai, E.; Shaaban, M.F.; El-Saadany, E.F.; Karray, F. Managing demand for plug-in electric vehicles in unbalanced LV systems with photovoltaics. IEEE Trans. Ind. Inform. 2017, 13, 1057–1067. [Google Scholar] [CrossRef]
  23. Alam, M.J.E.; Muttaqi, K.M.; Sutanto, D. Alleviation of neutral-to-ground potential rise under unbalanced allocation of rooftop PV using distributed energy storage. IEEE Trans. Sustain. Energy 2015, 6, 889–898. [Google Scholar] [CrossRef]
  24. Farahani, H.F.; Shayanfar, H.; Ghazizadeh, M. Incorporation of plug in hybrid electric vehicle in the reactive power market. J. Renew. Sustain. Energy 2012, 4, 053123. [Google Scholar] [CrossRef]
  25. Rabiee, A.; Farahani, H.F.; Khalili, M.; Aghaei, J.; Muttaqi, K.M. Integration of plug-in electric vehicles into microgrids as energy and reactive power providers in market environment. IEEE Trans. Ind. Inform. 2016, 12, 1312–1320. [Google Scholar] [CrossRef]
  26. Blaabjerg, R.T.F.; Liserre, M.; Timbus, A.V. Overview of control and grid synchronization for distributed power generation systems. IEEE Trans. Ind. Electron. 2006, 53, 1398–1409. [Google Scholar] [CrossRef]
  27. Zhong, J.; Bhattacharya, K. Toward a competitive market for reactive power. IEEE Trans. Power Syst. 2002, 17, 1206–1215. [Google Scholar] [CrossRef]
  28. Kisacikoglu, M.C. Vehicle-to-Grid (V2G) Reactive Power Operation Analysis of the EV/PHEV Bidirectional Battery Charger. Ph.D. Thesis, University of Tennessee, Knoxville, TN, USA, 2013. [Google Scholar]
  29. Nafi, N.S.; Ahmed, K.; Gregory, M.A. A novel vehicle to grid load management scheme based on WiMAX-WLAN in smart grids. In Proceedings of the 2015 IEEE Wireless Communications and Networking Conference (WCNC), New Orleans, LA, USA, 9–12 March 2015; pp. 2149–2154. [Google Scholar]
  30. Lund, H.; Kempton, W. Integration of renewable energy into the transport and electricity sectors through V2G. Energy Policy 2008, 36, 3578–3587. [Google Scholar] [CrossRef]
  31. Papalexopoulos, A.D.; Angelidis, G.A. Reactive power management and pricing in the California market. In Proceedings of the 2006 IEEE Mediterranean Electrotechnical Conference (MELECON 2006), Malaga, Spain, 16–19 May 2006; pp. 902–905. [Google Scholar]
  32. Jayasekara, N.; Masoum, M.A.; Wolfs, P.J. Optimal Operation of Distributed Energy Storage Systems to Improve Distribution Network Load and Generation Hosting Capability. IEEE Trans. Sustain. Energy 2016, 7, 250–261. [Google Scholar] [CrossRef]
  33. Haidar, A.M.; Muttaqi, K.M. Effects of PEV penetration on voltage unbalance. In Plug in Electric Vehicles in Smart Grids; Springer: Singapore, 2015; pp. 279–307. [Google Scholar]
  34. AEMC. Possible Future Retail Electricity Price Movements: 1 July 2012to 30 June 2015; Electricity Price Trends Report; Australian Energy Market Commission: Sydney, Australia, March 2013.
  35. Hajforoosh, S.; Masoum, M.A.; Islam, S.M. Online optimal variable charge-rate coordination of plug-in electric vehicles to maximize customer satisfaction and improve grid performance. Electr. Power Syst. Res. 2016, 141, 407–420. [Google Scholar] [CrossRef]
  36. Smart Power Tariff. Available online: https://www.synergy.net.au/Your-home/Manage-account/Solar-connections-and-upgrades (accessed on 1 July 2018).
  37. Weckx, S.; Driesen, J. Load balancing with EV chargers and PV inverters in unbalanced distribution grids. IEEE Trans. Sustain. Energy 2015, 6, 635–643. [Google Scholar] [CrossRef]
  38. Rajakaruna, S.; Shahnia, F.; Ghosh, A. Plug in Electric Vehicles in Smart Grids; Springer: Singapore, 2016. [Google Scholar]
  39. Madjissembaye, N.; Muriithi, C.M.; Wekesa, C. Load Flow Analysis for Radial Distribution Networks Using Backward/Forward Sweep Method. J. Sustain. Res. Eng. 2017, 3, 82–87. [Google Scholar]
  40. Alonso, M.; Amaris, H.; Germain, J.G.; Galan, J.M. Optimal charging scheduling of electric vehicles in smart grids by heuristic algorithms. Energies 2014, 7, 2449–2475. [Google Scholar] [CrossRef]
  41. Jabalameli, N.; Masoum, M.A.S.; Deilami, S. Optimal online charging of electric vehicles considering voltage unbalance factor. In Proceedings of the IEEE Power and Energy Society General Meeting (PES), Chicago, IL, USA, 16–20 July 2017. [Google Scholar]
  42. Gosbell, V.J.; Herath, H.; Perera, S.; Robinson, D. Sources of error in unbalance measurements. In Australasian Universities Power Engineering Conference (AUPEC) 2002: Producing Quality Electricity for Mankind; Monash University Publishing: Melbourne, Australia, 2002. [Google Scholar]
Figure 1. Connection of a residential node with PV and PEV to the grid.
Energies 12 01350 g001
Figure 2. Solution flowchart of the proposed PEV charging/discharging by GA at each time slot.
Energies 12 01350 g002
Figure 3. Proposed GA structure of variables (chromosomes).
Energies 12 01350 g003
Figure 4. GA optimization scheme for the proposed PEV charging/discharging over 24 h.
Energies 12 01350 g004
Figure 5. The practical three-phase four-wire 74 nodes distribution system in the Perth solar city, Western Australia [42] with illustration of buses which have rooftop PV systems or PEVS. Single-phase nodes are represented with both node and phase number.
Energies 12 01350 g005
Figure 6. (a) The distribution transformer loading with 27% demand reduction on Phase-C and (b) VUF of Figure 2.
Energies 12 01350 g006
Figure 7. Simulation results on system demand, VUF, voltages phases A and B: (ad) Case B; (eh) Case C; (il) Case D.
Energies 12 01350 g007
Figure 8. Convergence characteristics of proposed method at each time interval between 5:15 p.m.–6 p.m.: (a) 5:15–5:30 p.m.; (b) 5:30–5:45 p.m.; (c) 5:45–6 p.m.
Energies 12 01350 g008aEnergies 12 01350 g008b
Table 1. Time of use tariffs in Western Australia [36].
Time of DayWinter Weekdays (cent/kWh)Summer Weekdays (cent/kWh)Weekends (cent/kWh)
7 a.m.–11 a.m.53.3726.6422.08
11 a.m.–5 p.m.26.6453.3722.08
5 p.m.–9 p.m.53.3726.6426.64
9 p.m.–7 a.m.13.8613.8613.86
Table 2. Simulated PEV Charging/Discharging Scenarios.
Coordination StrategySimulation Results
Case ABase case without PEVsFigure 6a,b
Case BUncoordinated PEVs chargingFigure 7a–d
Case CCoordinated based on OL-C-TPFigure 7e–h
Case DCoordinated based on OL-CD-TPQFigure 7i–l
Table 3. Optimization results including the VUFs of all nodes of Figure 5.
Operation ConditionComparison of Simulation Results
Time of the DayNumber of PEVsPV (%)Worst VUF (%)Worst Voltage (p.u)Generation Cost ($/Day)Q Generation ($/Day)Total Cost ($/Day)
abc3phabcabc
Base caseBase Case A without any PEVs; Figure 6a,b
Morning 8AM–11AM00004543270.631.11187.7088.78
Evening 4PM–7PM00000.780.90.91
Scenario 1 (60% PEVs penetration)Case B1: Uncoordinated PEVs; Figure 7a–d
Morning 8AM–11AM11111204543270.7111136.20137.4
Evening 4PM–7PM11111201.690.90.91
Case C1: Optimal online charge control based on P-Control Strategy (OL-C-TP); Figure 7e–h
Morning 8AM–11AM11111204543270.56111125.80126.9
Evening 4PM–7PM11111201.030.90.91
Case D1: Optimal online charge/discharge control based on PQ-Control Strategy (OL-CD-TPQ); Figure 7i–l
Morning 8AM–11AM11111204543270.61111118−3.038115.5
Evening 4PM–7PM11111200.80.90.91
Scenario 2 (30% PEVs penetration)Case B2: Uncoordinated PEVs
Morning 8AM–11AM110054543270.96111268.20283.1
Evening 4PM–7PM110052.140.90.91
Case C2: Optimal online charge control based on P-Control Strategy (OL-C-TP)
Morning 8AM–11AM110054543270.541112340256.2
Evening 4PM–7PM110051.410.90.91
Case D2: Optimal online charge/discharge control based on PQ-Control Strategy (OL-CD-TPQ)
Morning 8AM–11AM110054543270.6111230.5−9.5224
Evening 4PM–7PM110050.960.90.91

