1. Introduction
Induction motor-based drive systems are the most widely used prime movers in industry, accounting for about 2/3 of industrial power consumption, or 40% of overall energy usages [
1]. Any faults in the system can influence manufacturing activities, consume extra energy and even cause unplanned shutdowns. Therefore, the condition monitoring of induction motor-based drive systems has been an active research topic, and various monitoring techniques have been developed that aim to detect and diagnose incipient faults at an early stage, and hence avoid the losses due to deficiency operations and unexpected shutdowns.
As shown in general review papers [
2,
3], a wide range of techniques have been investigated by many researchers in recent years. Amongst these condition-monitoring techniques, motor current signature analysis (MCSA) still dominates the main area of research and is the most promising technique for motor rotor fault diagnosis. This is certainly due to the evident advantage that it can be implemented using low-cost instruments. In addition, the fact that MCSA can be performed with easy installation, without interruption to the machine operation, and be monitored remotely, giving comprehensive diagnostic information, and with the pre-existing theoretical support, it gives considerable advantages over the other popular methods, such as vibro-acoustic monitoring or temperature monitoring. Thus, MCSA has been applied in a number of applications for detecting motor-related faults, such as motor cage failures [
4], breakage of rotor bars and end rings, short-circuiting of stator windings, bearing cracks and air-gap eccentricity [
5,
6]. The adoption of MCSA has also promoted development in the controlling systems of induction motor drive with ideas such as sensorless control and fault-tolerant control [
7,
8,
9,
10]. In recent years, with the advancement of machine learning techniques such as the artificial neural network (ANN) [
11], different motor faults can be automatically detected and classified, hence making the MCSA more practical in industrial applications.
However, it should be noted that most current studies adopt discrete Fourier transform (DFT)-based amplitude spectrum analysis to extract the weak diagnostic features in the measured signal. As the spectrum has an inherent drawback of noise inclusion, the MCSA based on the DFT-based spectrum tends to be sensitive to noise as well and cause high errors in detection and diagnosis results. To overcome this deficiency, new signal processing methods have been continuously investigated in many recent studies.
Firstly, the discrete wavelet transform (DWT) method has been applied to analyse the motor current during a load reduction or during a transient change of speed [
12,
13,
14]. It has been shown that DWT is effective in detecting local gear faults of varying severity. Additionally, DWT has also been used to analyse the current signals from start-up transients and new fault indicators have also been investigated [
15], resulting in an impressive performance in discriminating between different motor faults. Secondly, the empirical mode decomposition (EMD) has also been found to be capable of detecting faults in motors during transient operation stages [
16]. These achievements have shown that more accurate diagnosis can be achieved through these newer methods. However, more efforts are required in interpreting the detected features to provide more general rules for applying this method widely. As an example [
17], DWT may be preceded by DFT due to the fact that accurate results can only be gained in DWT with appropriate tuning of parameters.
Currently, most applications still mainly employ DFT-based methods because of the inherent connections between the Fourier transform and the physical periodicities of rotating machines. One attractive research interest to researchers is the diagnosis of using the phase information from DFT. In [
18], the phase rather than the modulus of the Fourier transform of current signals is explored to detect and diagnose broken rotor bar faults. The results show that using the phase of the Fourier transform allows the detection of one broken rotor bar when the motor operates under a low load (25% of rated load), but the method’s robustness decreases for the incipient fault of a half-broken rotor bar.
Higher order spectra (HOS) are powerful signal processing tools that have shown significant advantages over traditional spectral analyses because of their capabilities of nonlinearity identification, phase information retention and Gaussian noise elimination [
19,
20]. The utilisation of HOS techniques in condition monitoring has been reported in previous works [
20,
21,
22]. From the analysis of motor vibration signals, it has been shown that multidimensional HOS measures can encompass more accurate information than traditional two-dimensional spectral (amplitude and power spectra) measures in achieving accurate diagnostics.
Particular attention should be given to the work by Saidi et al. [
23,
24] in which they used the diagonal slice of a conventional bispectrum (CB) from induction motor stator current signals, which combines the information from both the magnitude and the phase. It was claimed that the results were more accurate in the detection of broken rotor bars even when the motor was operating under a low level of shaft load (i.e., zero-load condition). However, there are some doubts regarding this claim because the bispectrum slices show unconvincing peaks at the sidebands even for a load of 25%. Moreover, the bispectrum estimation is obtained by averaging the signal only a few times, which is certainly not enough to obtain reliable estimations from a statistical point of view because of inevitable noise contamination.
An earlier study by Gu et al. [
25] using the motor current for the fault diagnosis of a reciprocating compressor has revealed that random noise can be significantly suppressed with a new data processing method, called modulation signal bispectrum (MSB). The MSB is an effective extension of the conventional bispectrum (CB) for characterising modulation signals as it holds not only the basic properties of HOS, but also gives a sparser presentation of complicated sidebands. Especially, the application of MSB is fully supported by the motor current signal model developed in the paper. Following the success of using MSB for diagnosing the faults in reciprocating compressors, the method has been further improved so that the influences of the carrier magnitude at the supply fundamental frequency is eliminated from MSB slices of interest, achieving faster MSB analysis for accurate sideband estimation. These have led to significant results in detecting and diagnosing different faults in multistage gearboxes and electrical motors [
26,
27,
28,
29,
30].
However, these new investigations mainly rely on the magnitude information of MSB for fault diagnosis. The use of MSB coherences, which also contain a wealth of information for detection and diagnosis in more complicated motor current signals from multiple rotating processes, has not yet been fully explored in the diagnosis process. Therefore, this paper will study the utilisation of coherences alongside a clarification of the key differences between the CB and MSB in order to provide a basis for effective selection of signal processing methods in MCSA.
Following this introduction, the paper contains five more sections.
Section 2 studies the motor current signal models due to rotor faults including BRBs and eccentric rotors with the inclusion of phase information of different mechanical and electrical components. This is essential in applying CB and MSB to the signal effectively.
Section 3 presents the definition and implementation of CB and MSB based on the current model in
Section 2. A simulation study is performed in
Section 4 to quantify the performances of CB and MSB in detecting and diagnosing different types of nonlinearities, including amplitude modulation (AM), phase modulation (PM) and phase coupling (PC).
Section 5 presents comparative studies based on measured signals from three different motor-driven systems. Finally, key conclusions are drawn in
Section 6.
2. Instantaneous Current Signal for Rotor Faults
A motor current signal model for rotor faults (broken rotor bars) was presented in [
31,
32] to explain the roots of sideband components at
. This model has been further extended in [
24,
29,
32,
33] when applying MSB analysis in the detection and diagnosis of mechanical equipment faults downstream. To assist the analysis of IES signals using bispectra, the phase quantities in the model are examined in this section.
When a fault, such as a broken rotor bar or eccentric rotor, presents in a rotor system, it will cause an additional oscillatory load to the motor. Such oscillatory loads can lead to an additional current component, denoted by
, showing up in the stator winding and interacting with the main magnetic fields between the stator and rotor. Supposing that the additional current is a sinusoidal wave with a frequency
and an associated current wave with an amplitude
and phase angle
, it can be expressed as
Because of the coupling between magnetic field and load oscillations due to this current, the measured instantaneous current can be expressed as in [
25,
30,
33,
34]:
where
denotes the root mean squared (RMS) amplitudes of the supply current at the frequency of
;
is the phase of flux linkage;
,
and
are the phases of the equivalent winding impedance
and its lower and upper deviations of
and
, respectively; and
and
are the moduli of sideband components due to speed oscillations:
where
is the number of pole pairs,
is the linkage flux,
is slippage and
J is the inertia of the rotor system of the motor.
By combining the two lower sidebands in Equation (2), the current signal is simplified to show the three typical terms of a modulation signal, which are the fundamental, the lower and the higher sidebands:
where the phases
relate to magnetic fields and the phase difference
is
Equations (2) and (5) show that the lower sideband amplitude is caused by two different types of physical processes which have the same frequency but different phases.
According to Equation (2), it can be summarised that:
The rotor fault causes additional current components, including the lower and upper sideband components; for example, for BRBs and for eccentric rotor faults, which can be shown in the spectrum of the current signal.
The amplitudes of the sidebands can be affected by rotor inertia, load change, power factor and machine impedance. In particular, the amplitude of the original fault current , shown in the lower sideband, is suppressed due to speed oscillations. This means that the interference needs to be eliminated to obtain the amplitude of and thus achieve accurate and reliable estimation of fault severity.
The phases of the sidebands are related to not only the same factors as their magnitudes, but also to the phase variation of the fault current. In
Section 3, it will be shown that the phase variation can be eliminated with an appropriate phase mixture of sidebands and the carrier, and therefore, the spectrum can be accurately estimated.
3. Conventional Bispectrum and Modulation Signal Bispectrum
Sideband components are usually very small due to the attenuation of large inertia,
, as shown in Equations (3) and (4), which will be demonstrated in
Section 5. The estimation of them by spectrum analysis can be very erroneous because these small amplitudes in normal spectra are subject to various random noise which is inevitable in measurement systems and motor operating processes. This section presents the conventional bispectrum (CB) and modulation bispectrum (MSB) to investigate how they can suppress this noise to highlight the behaviour of the sidebands due to rotor faults.
3.1. Conventional Bispectrum (CB)
According to [
19], the conventional bispectrum of two frequency components,
and
, can be defined in the frequency domain as
where
is the DFT of a discrete time current signal
, which is calculated as follows:
and the second-order measure of the power spectrum of
can be estimated by the formula
where
is the complex conjugate of
and
is the expectation operator, showing that a statistical averaging operation is necessary for the spectrum estimation process. The power spectrum is a linear transform and is a function of the frequency index
.
Note that, unlike the second-order measures, the third-order measure of CB is a complex quantity in that it contains both magnitude and phase information of the original signal . If the frequency components at , and are independent, each frequency will be characterised by statistically independent random phases distributed uniformly over . After statistical averaging denoted by the expectation operator in Equation (7), the bispectrum will tend towards zero due to the random phase mixing effect. In this way, random noise and noncoupling contents can be effectively suppressed, and hence, an optimised estimation of the triple product can be obtained. This means that a data set with long time span is required to allow sufficient averaging and hence realise these unique properties of CB.
On the other hand, if the three spectral components, i.e.,
,
and
, are nonlinearly coupled to each other, the total phase of these three components is not random anymore. In specific terms, these phases have the following relationship:
Consequently, the statistical averaging will not lead to a zero value in the bispectrum. This nonlinear coupling will result a peak at the bifrequency in the bispectrum.
With this definition, the CB phase of BRB current signals presented in Equation (5) can be examined for the situation of a modulating component at about 25 Hz. Such a situation is equivalent to abnormalities, such as a misalignment-induced speed oscillation, on a four-pole induction motor under zero-load operation. In this case, the frequencies are related by
Hz and the overall phase of CB can be obtained by substituting the phases of the three terms in Equation (5) into Equation (10), yielding:
In Equation (11), the phases for the flux and the fault are different for different measured data segments, even though the phases for impedance changes are fixed. As the overall phase is random, the average operation will cause the CB to be close to zero. This shows that the CB is not a good candidate for detecting the modulation process of the motor current signal expressed in Equation (5).
To avoid the influence of large-magnitude components in the CB and to measure the degree of coupling between coupled components, a normalised form of the bispectrum or bicoherence is usually used and is defined as
As shown in Equation (12), the amplitude of bicoherence is bounded between 0 and 1. In addition, it is independent of the magnitude of the triple product of the DFT amplitudes. A value close to 1 means that the nonlinear interactions among the frequency combinations of , and is strong or the noise influence is small. On the other hand, a value of near 0 implies an absence of interactions between the components or simply random noise. Therefore, based on this normalised amplitude of the bicoherence, nonlinear interactions can be detected with corresponding reliability. Moreover, it is also a useful indicator for noise influence on coupled components.
3.2. Modulation Signal Bispectrum (MSB)
To overcome the deficiency of CM in dealing with modulation signals of Equations (2) or (5), a modulation signal bispectrum (MSB) is developed based on the definition in [
25] and an original idea in [
35], which is expressed in the frequency domain as:
It shows that MSB takes into account both
and
concurrently for characterising the nonlinear modulation coupling in signals. A bispectral peak will be clearly presented at the bifrequency
if
and
are both present due to nonlinear coupling between
and
. Therefore, this definition is more accurate and effective in representing the modulation signals. Obviously, this frequency connection is quite different from that described by CB.
The total phase of the MSB in Equation (13) is
when the two components
and
are coupled, their phases are related by
By substituting Equation (15) into Equation (14), the phase of MSB will be zero and its magnitude will be the product of the four magnitudes, which is the maximum of the complex product. Therefore, a bispectral peak will appear at . Note that Equation (13) now takes into account both and simultaneously for measuring the nonlinearity of modulation signals. This result in a more accurate and sparse representation of the sideband characteristics of modulation signals.
With this definition, the MSB phase of BRB current signals presented in Equation (5) can be obtained as follows:
It shows that the MSB phase of motor current signals relates just to the machine parameters, including the impedance phase and the fault phase difference , but not the fault phase nor the magnetic flux phase . This leads to the fact that the phase of the MSB will be constant when the motor is operating under steady conditions. In other words, the MSB is independent of the angular position of the motor rotor or the start point of a signal collected. This will allow sufficient averages in MSB estimation to be performed using a data set collected or framed at any time instant through a Welch method. The average thus will suppress random noise and non-modulating components to obtain a reliable estimation of the MSB and any hidden modulating signals.
In contrast, the phase of CB applied to signals in Equation (11) is not independent of the signal segments used. It means that the average process in estimating the CB will lead to an uncertain result. Instead, it will vary with segment sequences used, and in an extreme case, it will give rise to zeroes if the phases of the data segments are distributed uniformly between . Therefore, CB is not very suitable for analysing motor current signals.
For the cases when rotor faults are originated from speed or load oscillations, such as a misaligned shaft, rotor eccentricity or gear tooth breakages, the MSB phase is simplified by excluding the second term in Equation (2):
i.e., the phase will be close to
. Especially, when the impedance phase changes are within the sample amplitude, the MSB phase will be a constant value of
, showing that the modulation due to pure speed oscillation is very close to the phase modulation process.
Similar to the CB coherence in Equation (12), a normalised form of the MSB or modulation signal bispectrum bicoherence can be defined as
to measure the degree of coupling and noise suppression between three components in the same way as the CB for more reliable detection.
Because of these distinctive properties of MSB in characterising modulation signals, it has been investigated extensively by the authors of [
26,
27,
28,
29,
36] for motor current signal-based fault detection and diagnosis, resulting in new MSB-based sideband estimators (MSB-SE) [
33], excluding carrier influences and characterising the modulation effects only.
4. Numerical Evaluation
To evaluate the performance of both the MSB and the CB in characterising the interactions between different frequency components of a nonlinear modulation signal, a numerical signal is generated according to Equation (19). This signal consists of three typical processes: phase modulation (PM), amplitude modulation (AM) and phase coupling (PC), which are the basic processes included in many real signals in the field of condition monitoring:
where the carrier frequency,
Hz with a magnitude of 1, is much higher than the other induced signals which mimic the basic features of a motor current signal. The PM has three components:
Hz, with amplitudes:
a, 0.4
a and 0.2
a (
) at
and
, respectively. In the meantime, the phases of these three modulators are coupled according to
with random phases
and
, which are set to 0.5 and 1.0 rad, respectively, to give a different MSB phase value from that of the PM and AM. This means that this PM process is also a harmonic phase coupling process in that the frequency components are harmonics and the phases are connected by either a summation or a difference. There may also be nonharmonic PC processes, such as
Hz, because the frequency components are not harmonically connected, but the phase exists in the same relationship as PC. The AM has a magnitude of
with a frequency of
Hz. Furthermore, there is an additional PC process which has magnitudes of
for all three components at the frequencies
Hz, with the same phase relationship
as that of the PM process. In addition,
is a Gaussian noise of −36 dB added to the signal to show the noise suppression capabilities of the MSB. Because of the noise, the simulated signal components will have the signal-to-noise ratios (SNR) of −6.55 dB, −18 dB and −10.2 dB for the PM, AM and PC processes, respectively.
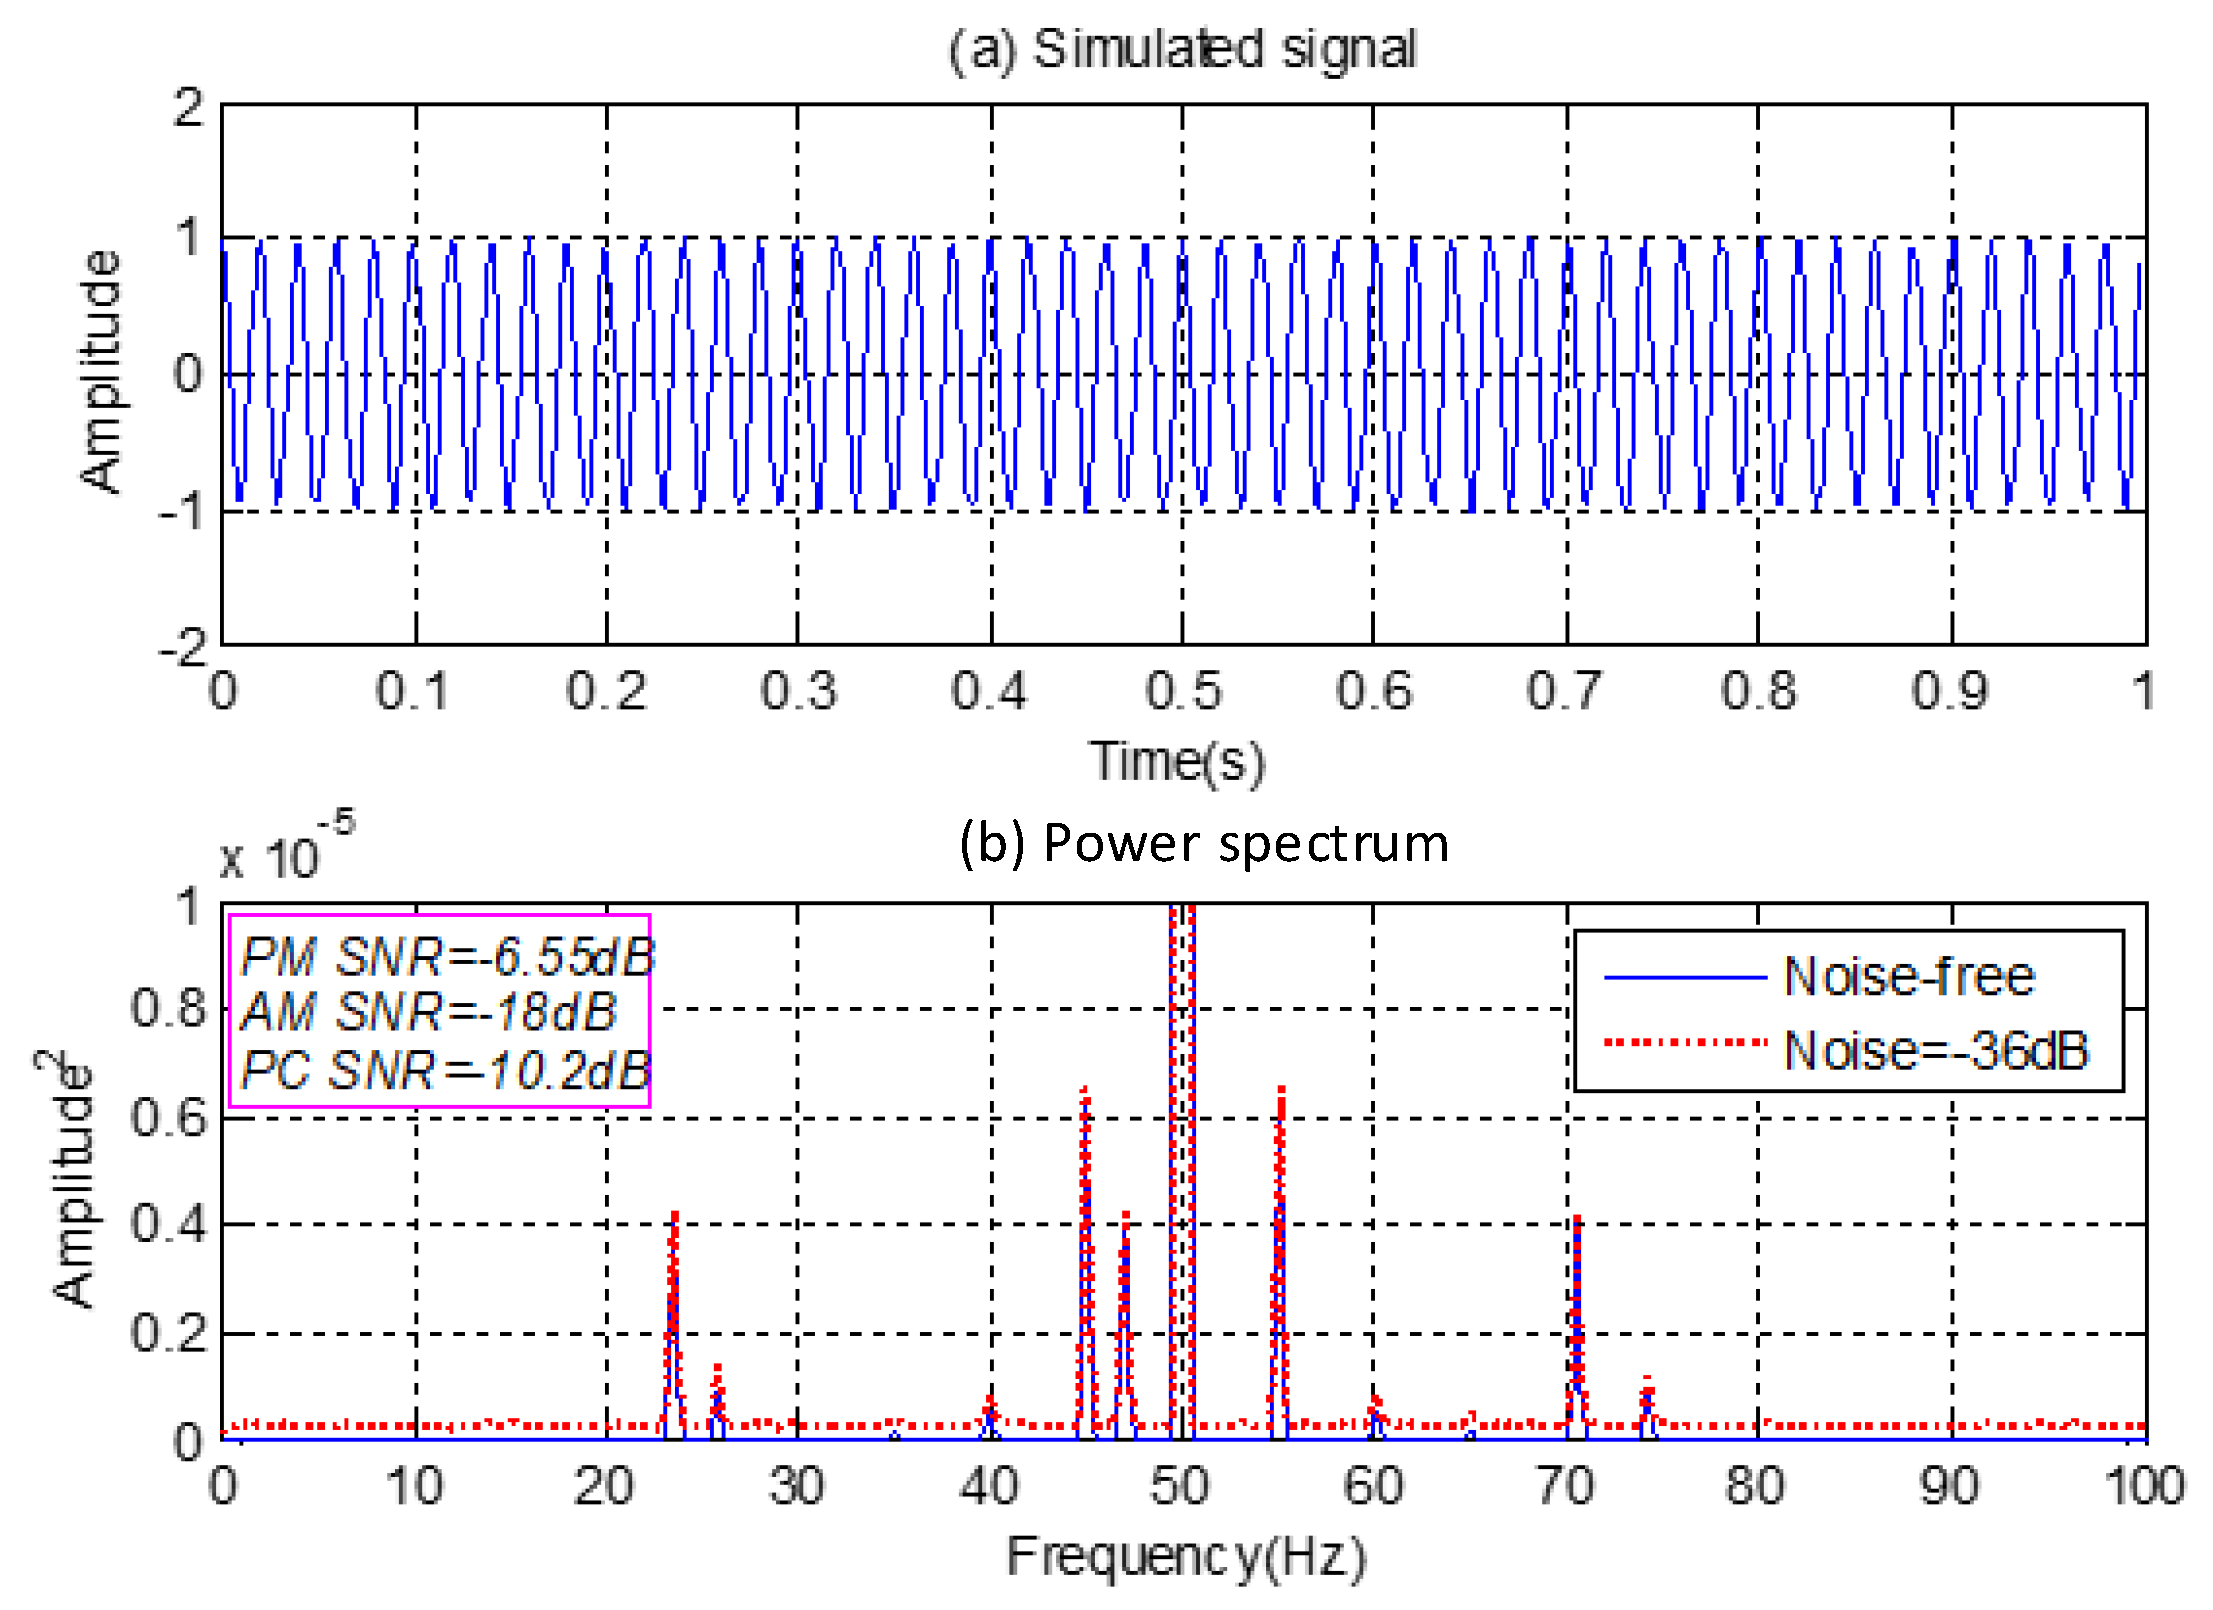
Figure 1a shows a small section of the signal with 409,600 samples, allowing for good averages when a 1024-point segment is used for fast Fourier transform (FFT), and a frequency resolution of 0.25 Hz is obtained when the sampling frequency is at 512 Hz. As seen in
Figure 1a, the time-domain waveform is dominated by the sinusoidal carrier component of the supply fundamental frequency, very similar to a measured motor current signal. After converting it to the frequency domain, all the components induced can be clearly observed in the power spectrum in
Figure 1b, which is magnified to show the small components of interest. The peaks of the sidebands are those at
Hz, indicating the PM process; those at
Hz for the AM process; and those at
Hz for the PC process. However, due to the additive noise, the higher order harmonics of the PM process cannot be resolved in the power spectrum and the magnitudes corresponding to different frequencies are higher than that of the noise-free power spectrum. Because of this magnitude difference, it is understandable that a method based on power spectrum will give rise to uncertainties in quantifying the fault severity.
Moreover, it is not possible to determine from the power spectrum whether there are any phase connections between the components and if they are from PM, AM or PC, which is useful information to diagnose the sources of the fault. Fortunately, the MSB is a promising tool to answer these questions and to overcome the noise problem.
4.1. MSB Analysis Results
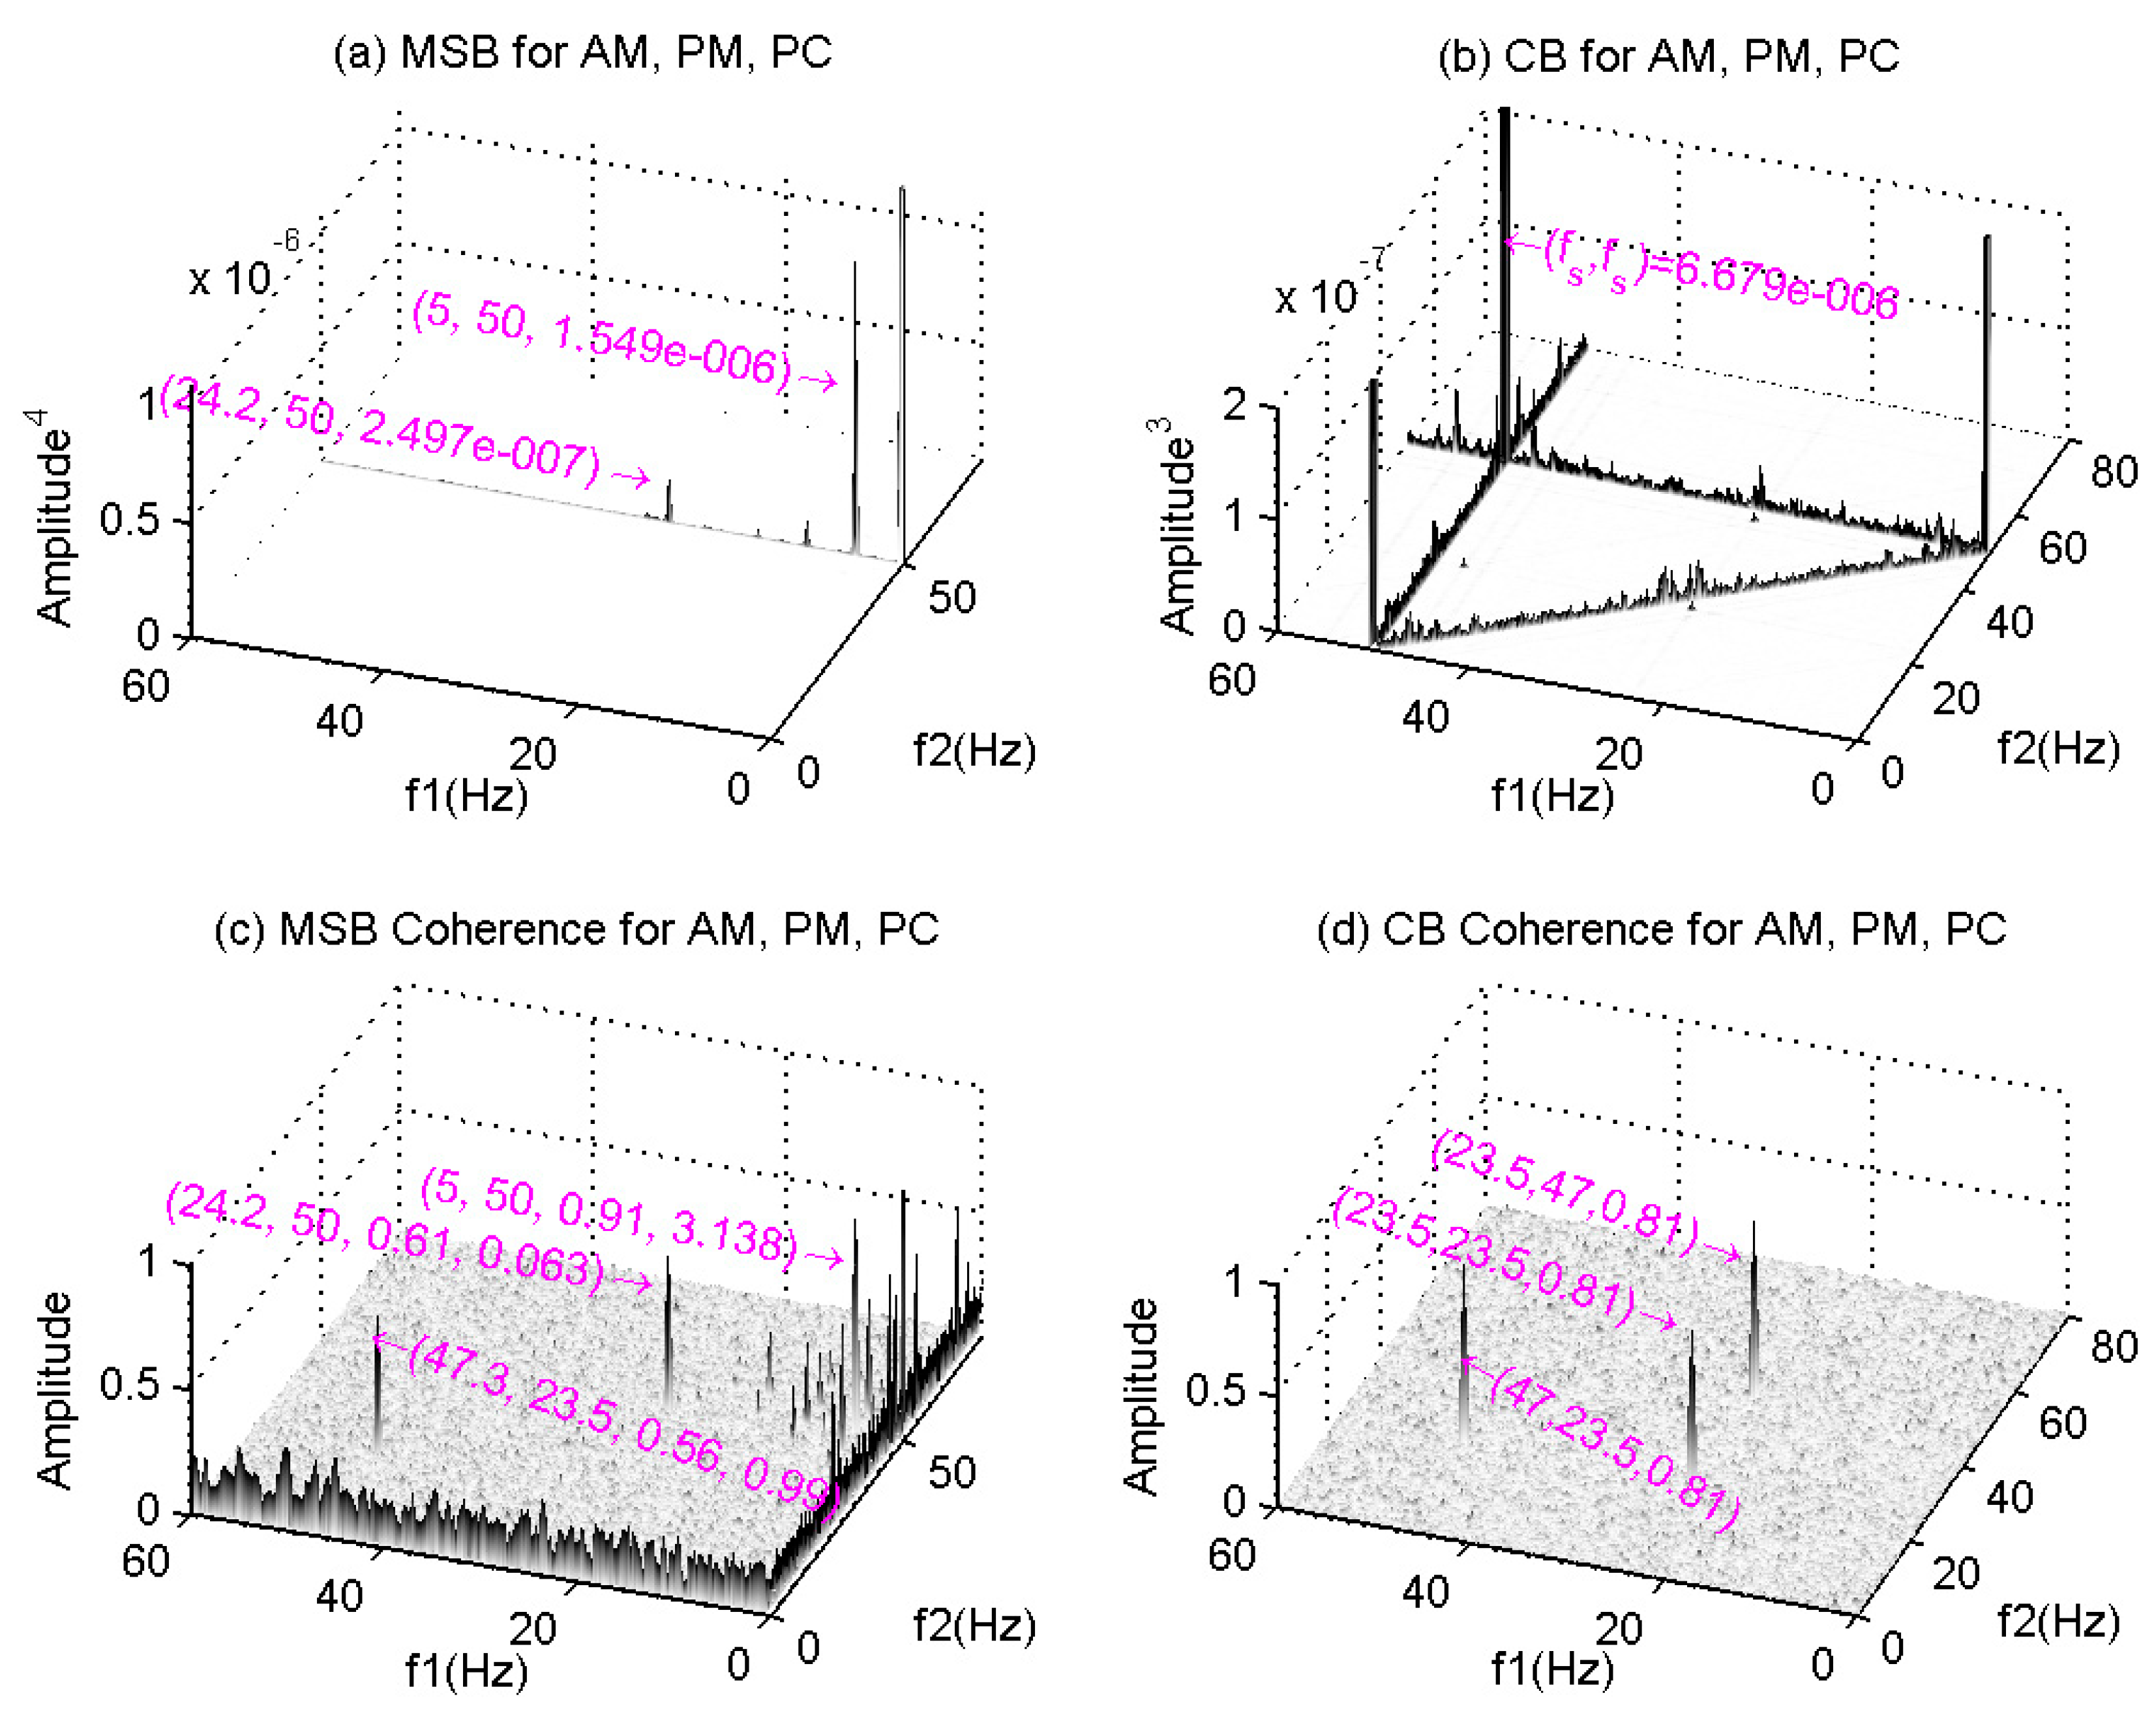
Figure 2 shows MSB and CB results and their corresponding coherences for the simulated signal, which are obtained by using the same weighting windows, size and averages as that of the power spectrum shown in
Figure 1 in performing FFT. The MSB magnitude in
Figure 2a shows five visible peaks at bifrequencies: (0, 50) Hz, (5, 50) Hz, (10, 50) Hz, (15, 50) Hz and (24.2, 50) Hz. Although some of these peaks are tiny, they can be made more visible in the corresponding bifrequencies of the MSB coherence in
Figure 2c, showing that the MSB coherence is good at differentiating small components because of normalisation. Similarly, the PC component cannot be seen in the MSB because of its very low magnitude at its possible carrier of
Hz. However, there is a distinctive peak at the bifrequency (47.3, 23.5) Hz in the MSB coherence, which is clearly related to the PC component. It means that
Hz is the equivalent carrier,
Hz is the lower sideband and 70.5 Hz is the upper sideband. Regarding the phase connection of the MSB at this bifrequency, it can be calculated according to Equation (14) as
rad, which is very close to the phase value of 0.99 shown in
Figure 2c.
This confirms that the MSB is also able to detect the harmonic PC components. In addition, the MSB phase values are 3.138 rad and 0.063 rad for the PM and AM, respectively (phases are opposed at two sidebands for a pure AM process, whereas the phases are in line but with a difference of for a pure PM process). This shows that the MSB can differentiate between different nonlinear interactions and hence can provide good detection performance even with a very low SNR.
4.2. CB Analysis Results
On the other hand, the CB magnitude in
Figure 2b shows three distinctive peaks at (50, 0) Hz, (0, 50) Hz and (50, 50) Hz, which means that they are all related to the 50 Hz component. However, the CB coherence shows no peaks at these corresponding bifrequencies. Therefore, these peaks are not due to true coupling, but are the product effects of the very high magnitudes at 50 Hz. These peaks will become smaller when more averaging is carried out because the phase relationship does not meet the phase relationship in Equation (10).
For the same reasons, the peaks observable at (50, 50 ± 5.0) and (50 ± 5.0, 50) are not due to true coupling either and will disappear after sufficient averaging. So, even if they are related to the PM, they cannot be relied on for characterising the PM as the magnitude will change with different averaging processes and times.
However, CB coherence does show three peaks at (23.5, 23.5) Hz, (23.5, 47.0) Hz and (47.0, 23.5) Hz. This shows that the CB can detect the PC process. By checking the CB magnitudes carefully in
Figure 2b, three tiny peaks at these frequencies can indeed be observed. This means that the peaks with small magnitudes may be undetectable by the CB magnitude when the signal has large carrier components, which is often the circumstance of motor current signals.
In general, the CB is unable to detect either PM or AM reliably and hence is not suitable for characterising the motor current signals expressed in
Section 2. Moreover, it cannot produce adequate results for the motor current signals with large carrier magnitudes.
4.3. MSB-Based Fault Diagnosis
To understand the MSB capability for further analysis of motor current signals in quantifying fault severity, its magnitude characteristics are examined by comparing them with that of the power spectrum.
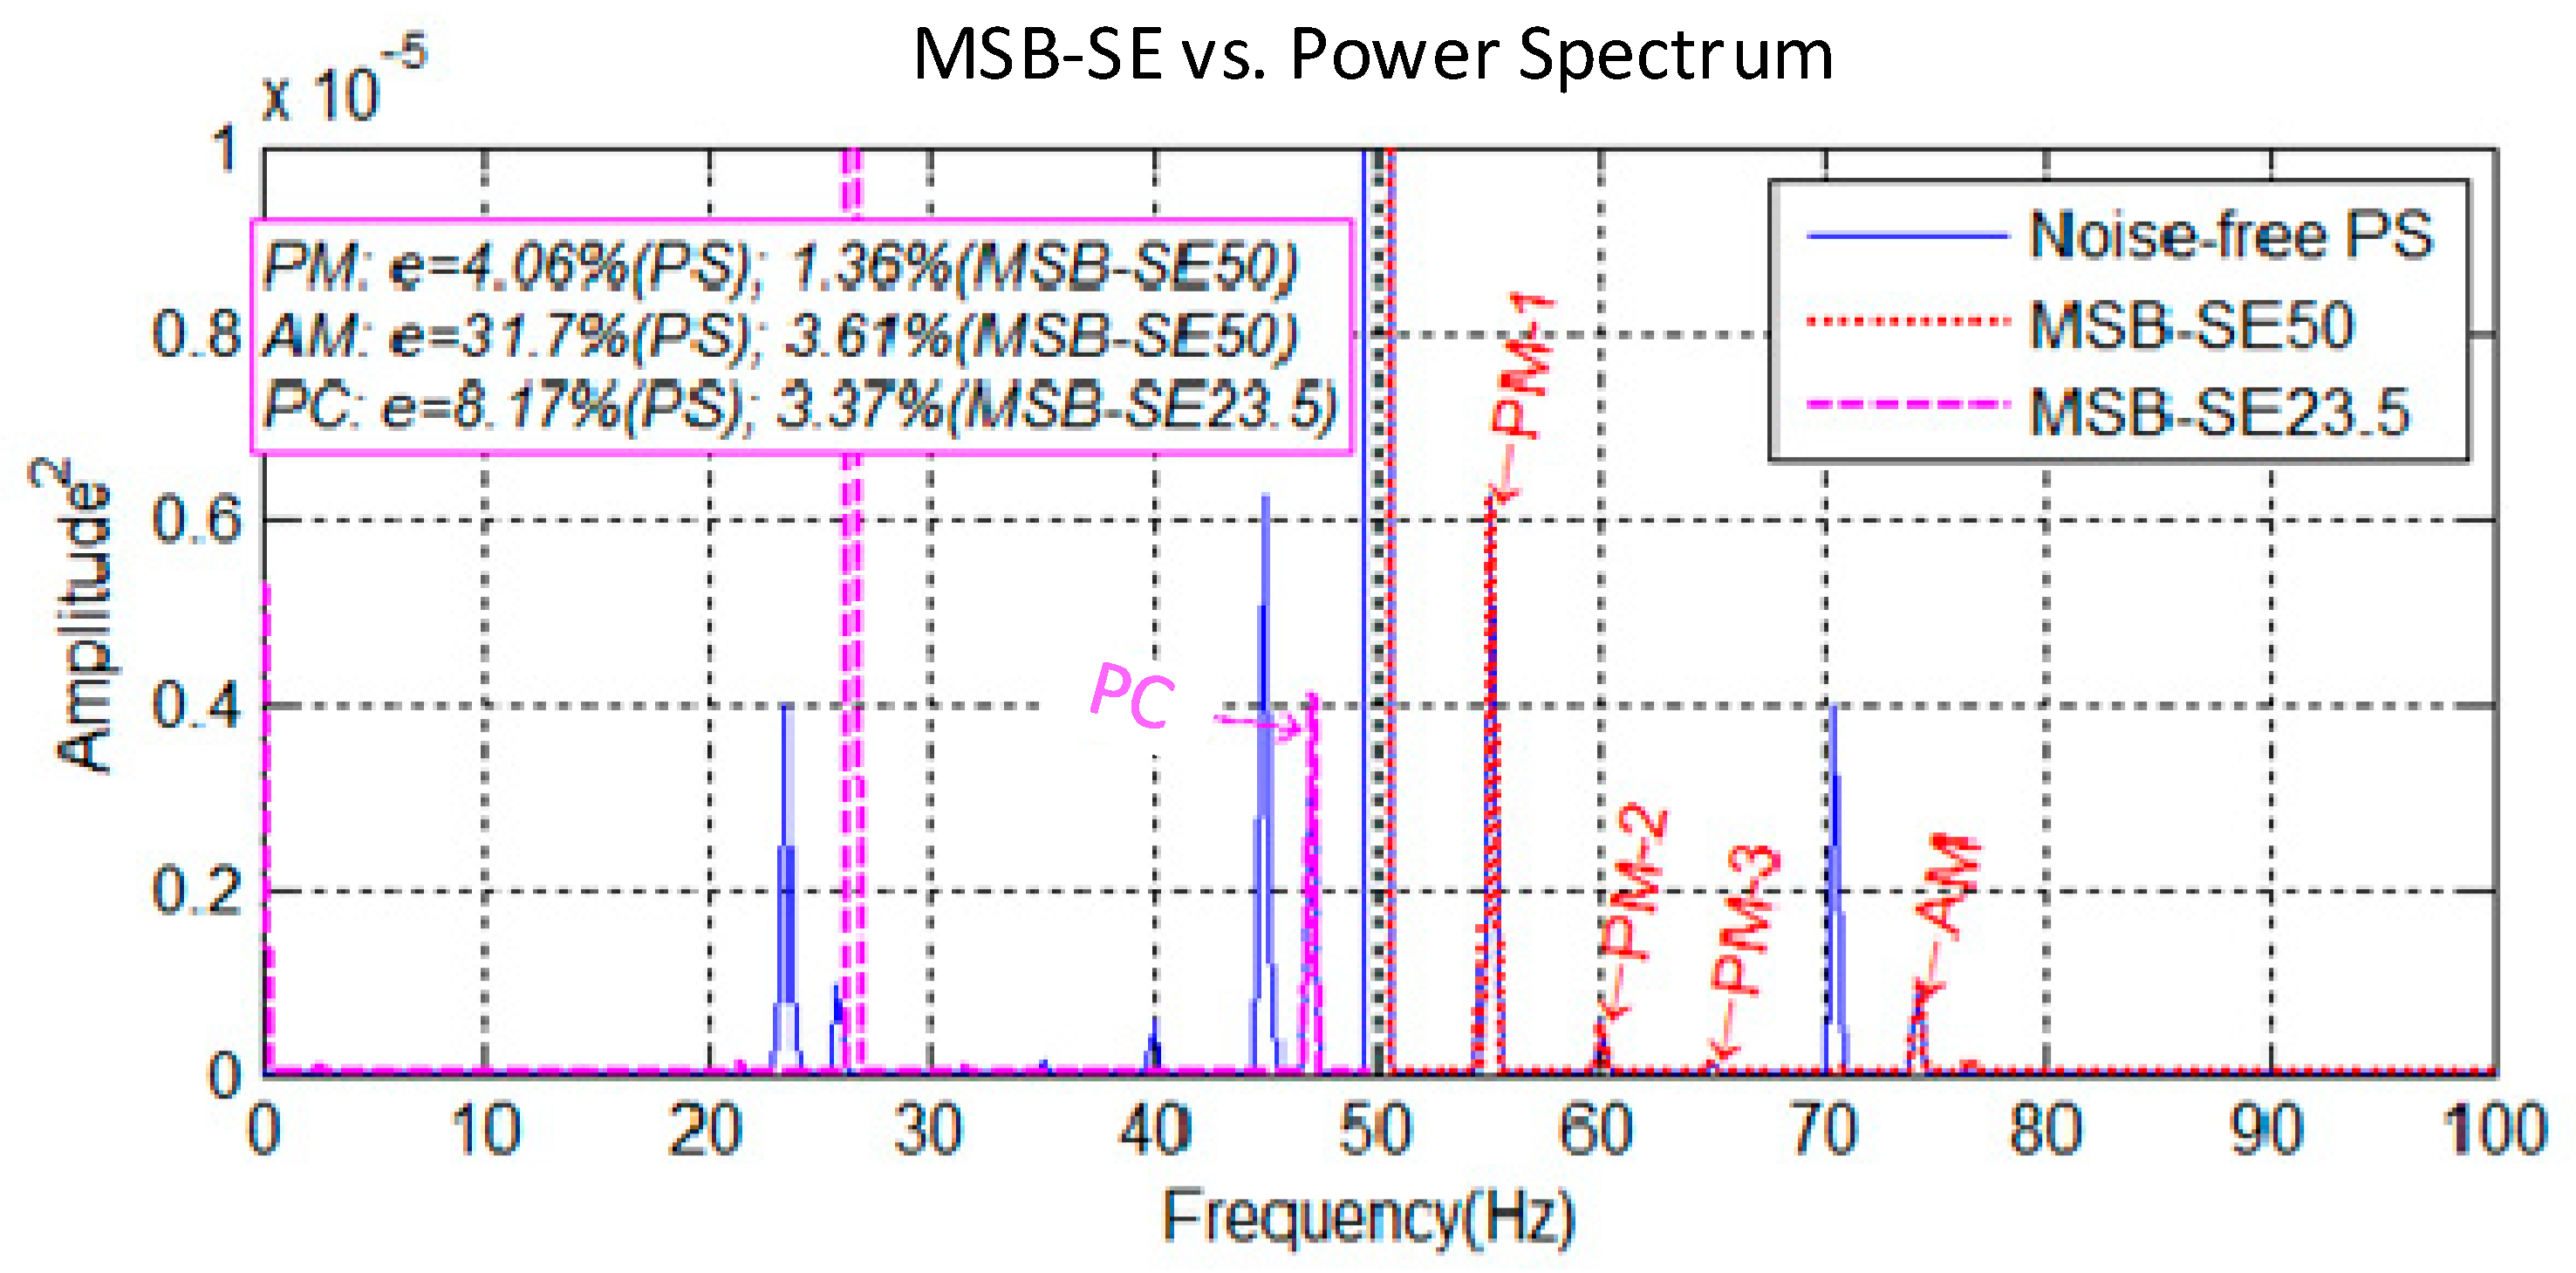
Figure 3 shows a direct comparison between MSB slices and the power spectrum, with MSB-SE50 denoting the MSB slice at 50 Hz and MSE-23.5 denoting the slice 23.5 Hz, respectively. These slices are obtained by dividing the MSB slices using the root mean squared magnitudes at (0, 50) Hz and (0, 23.5) Hz, respectively. This means that their peak values do not include the carrier, but quantify the modulation effect, i.e., only the magnitudes of the sidebands. Therefore, it is referred to as an MSB-based sideband estimator and abbreviated as MSB-SE. In addition, the MSB-SE can be calculated just at a single slice of interest, which will reduce the computational requirement for a full MSB significantly. It allows the possibility of online implementation of MSB with little modification to the hardware resources used for analysis based on the power spectrum.
It can be seen in
Figure 3 that all the peaks due to PM and AM can be determined by MSB-SE50, but only the second peak of the PC can be determined by MSB-SE23.5. Nevertheless, these identified peaks show very close magnitudes to that of the noise-free power spectrum, showing that the MSB has excellent performance in suppressing noise for obtaining accurate magnitude estimation. By comparing the magnitude estimation error through a Monte Carlo method, it is shown that the MSB produces a very accurate estimation of the sidebands. In particular, the sideband of the power spectrum produces an error as high as 31.7% for the AM, which has an SNR as low as −18 dB. This error will lead to unsatisfactory results for fault diagnosis. Conversely, the MSB has only a 3.61% error and thus will produce more reliable results.
In addition, the estimation accuracy differences are also indicated by the peak values of the MSB coherence. For the two peaks from PM, the coherence value is 0.91, as shown in
Figure 2c, and its magnitude estimation error is at 1.36%, whereas the AM has a coherence value of 0.61 and its estimation error is 3.15%, higher than that of PM estimation. In other words, the coherence value can also give an indication of the MSB magnitude accuracy, which is in line with the capability of nonlinear detections.
It is also worth noting that the error for the PC is nearly as high as that of the AM, although its SNR is only −10.2 dB, which is 7.8 dB higher than that of the AM component. This is because its carrier is also influenced by the noise to the same degree as the sidebands. On the other hand, the carrier of the AM has a much higher signal-to-noise ratio, which helps its associated sidebands in obtaining a better estimation. This also means that the CB will have lower performance in suppressing noise because it uses the triple product, the same process that the MSB uses to resolve the PC.
Overall, the MSB is able to detect all the coupling processes by its coherence and produces a more accurate estimation of coupling levels with its magnitude. Therefore, it will be effective in processing the motor current signals. On the other hand, the CB is good at identifying the PC process, but has poorer performance in suppressing noise. In addition, it is also inefficient in finding modulation processes.
Special attention must be paid to the situation where the CB produces many unstable peaks in association with the carrier and sidebands when the carrier has a very high magnitude for the case of motor current signals. This may lead to mistakes in characterising the true meaning of the processes involved.
5. Experimental Evaluations
In order to evaluate the model for motor current signals and the two analysis methods, three different datasets are processed to obtain the MSB, CB and power spectrum simultaneously for comparison. In calculating the DFT, a Hanning window is applied to the data segments to minimise the side lobes of the DFT and spectrum leakage. In addition, a 40% overlap between segments is used and the number of averages is set to more than 100, allowing effective suppression of noise and interference. Moreover, a specific Matlab function is developed to calculate the power spectrum, CB and MSB simultaneously according to Equations (9), (7) and (13), respectively, which enables their performance to be compared under the same conditions. The results of the CB and MSB are examined within a frequency range from 0 Hz to 80 Hz, which is common for detecting rotor faults. The results are presented as grayscale surface graphs to give an effective representation of the key features.
5.1. Detection and Diagnosis of Broken Rotor Bars in Induction Machines
The motor used for BRB testing is a three-phase induction motor with a rated output power of 4 kW, operating at a speed of 1420 rpm (two-pole pairs). It has 28 rotor bars and 36 stator slots. Three BRB cases with different BRB severities and one baseline case were tested. The first one is a motor with half a BRB, the second with one complete bar broken and the third has two continuous broken bars, which were implemented in three different motors with the same specifications. The broken rotor bar cases were simulated by drilling into a half rotor bar, one rotor bar and two rotor bars, respectively. Further details of the test facilities and procedures can be found in [
27,
29].
5.1.1. MSB-Based Detection and Diagnosis
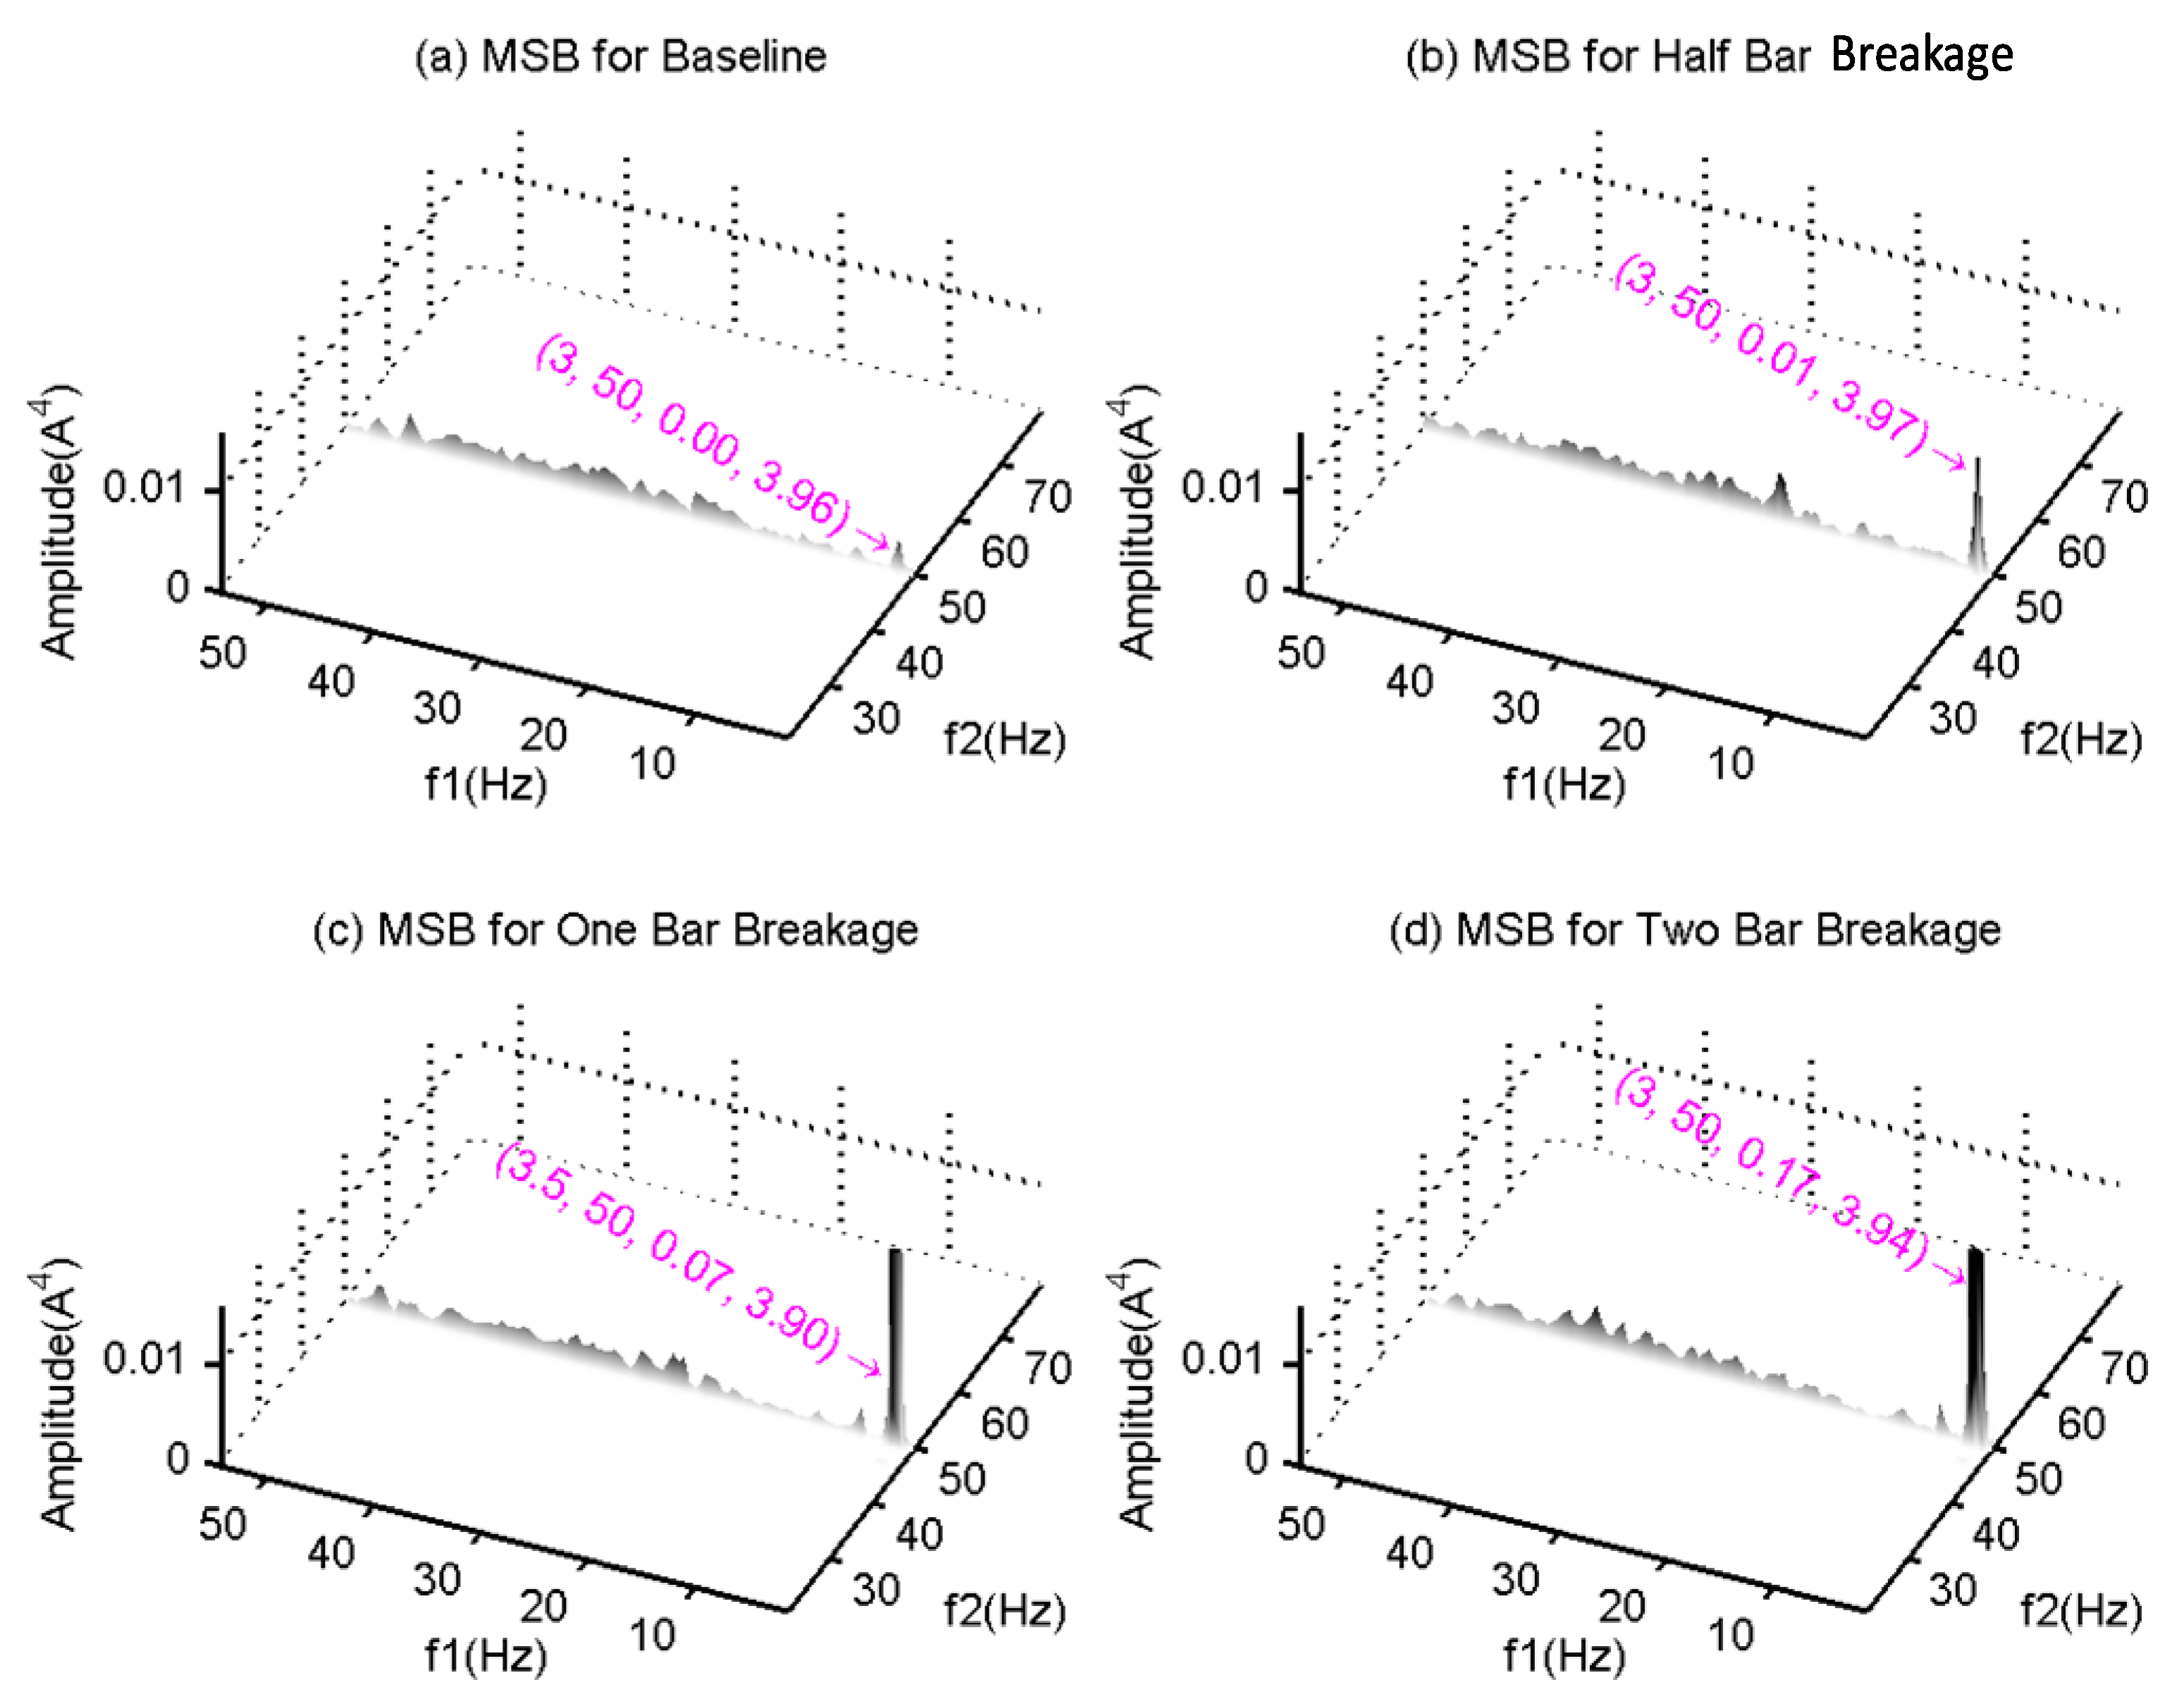
Figure 4 shows the MSB results for the four cases, presented with the
z-axis magnified to show the peaks of the small faults. The four coordinate values in the figure denote
, MSB and MSB phase values, respectively. It can be seen that the characteristic MSB peak at the bifrequency of
Hz for the baseline is relatively small. Its existence is because of the inherent rotor asymmetry arising from the manufacturing process. In comparison, the half BRB shows a significant peak at the bifrequency of (4.5, 50) Hz, allowing it to be easily differentiated from the baseline. Moreover, the magnitude for all the four cases increases monotonically with the fault severity. Thus, based on MSB magnitude, it is straightforward to assess the fault severity.
In addition, the phases for the four different cases are all around 3.90 rad and are very close to each other. This shows that the fault does not cause any changes to the stator characteristics, which is predicted by the model in
Section 2. However, the phase values can be useful in differentiating BRB faults from those due to speed oscillations, which will be shown later.
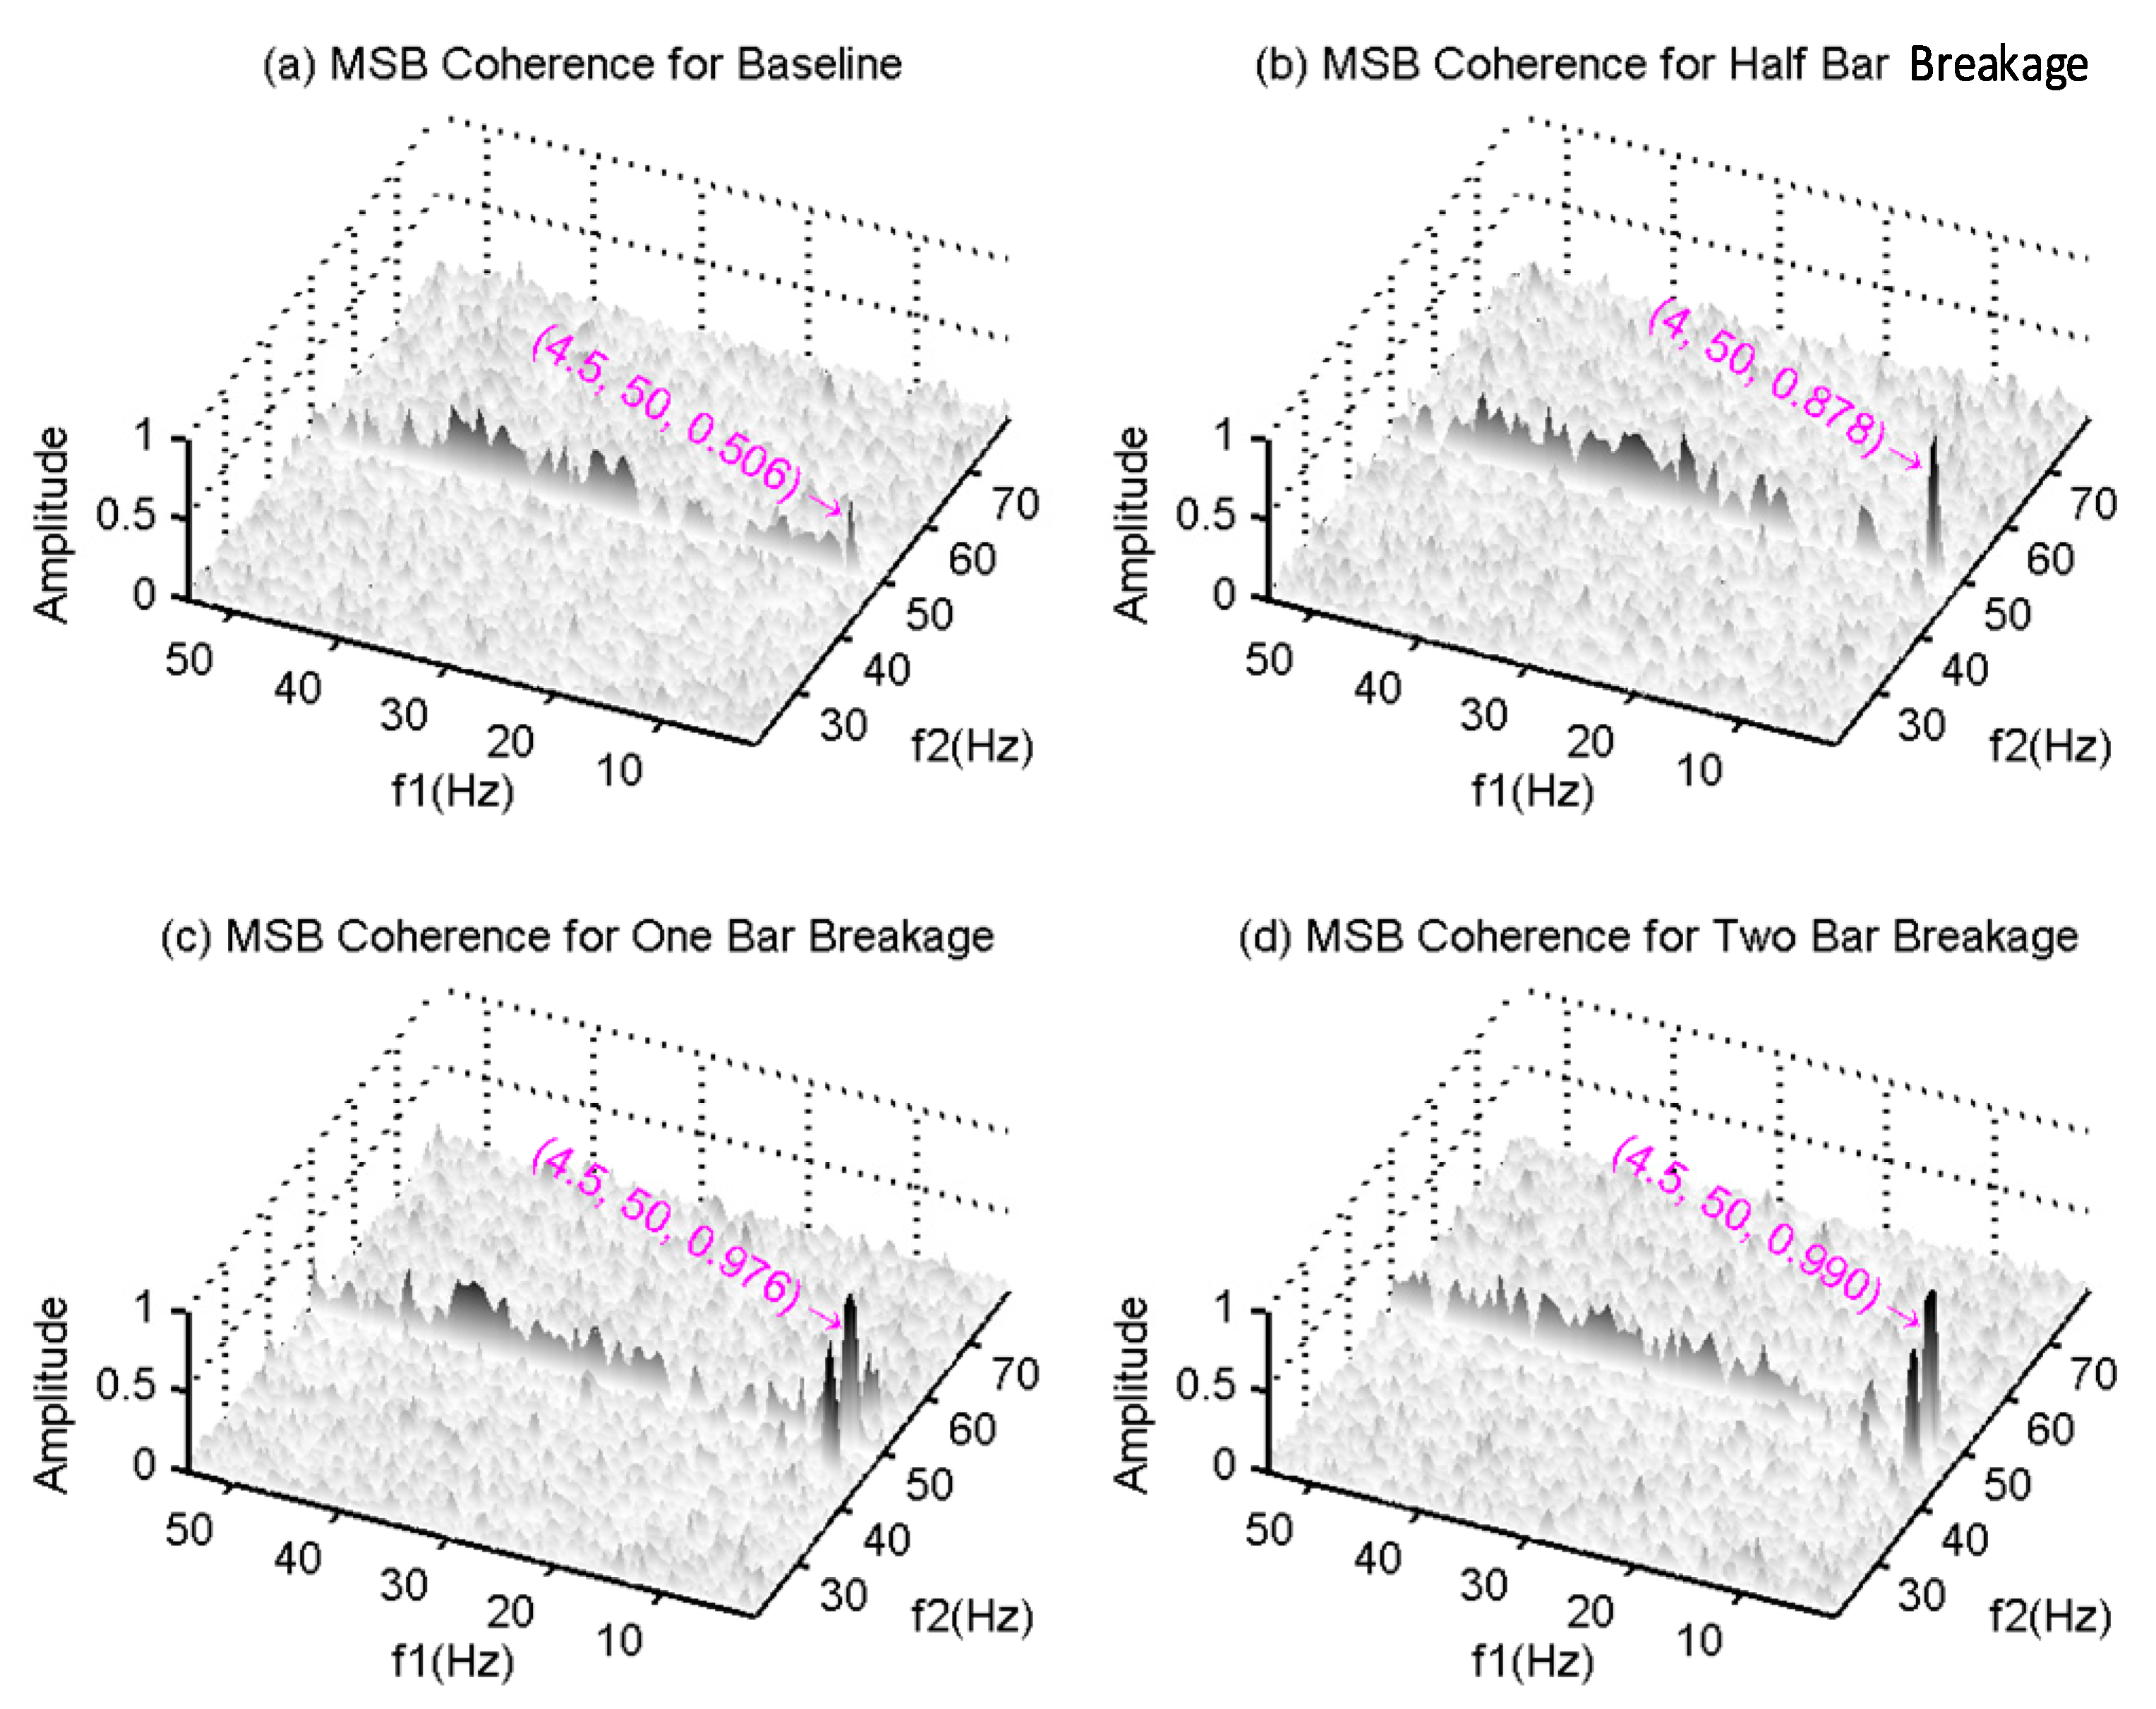
The quality of the MSB peaks can be further assessed by their corresponding coherences. As shown in
Figure 5, the baseline coherence value at the characteristic bifrequency is only 0.506. As discussed in
Section 3, this small amplitude indicates that the accuracy for MSB magnitude estimation is low. On the other hand, the values are 0.878, 0.976 and 0.9903 for the half-, one- and two-BRB cases, respectively, showing that the MSB amplitude estimators have a very high degree of accuracy and thus confirm the reliability of BRB detection and diagnosis.
In addition, the coherences for the one- and two-BRB cases also show a peak at the bifrequency (4.5, 45.5). This relates to the fault and may be used to support the existence of the main peaks or as a complementary feature for the situation where other components are interfering with the main peak.
5.1.2. CB-Based Detection and Diagnosis
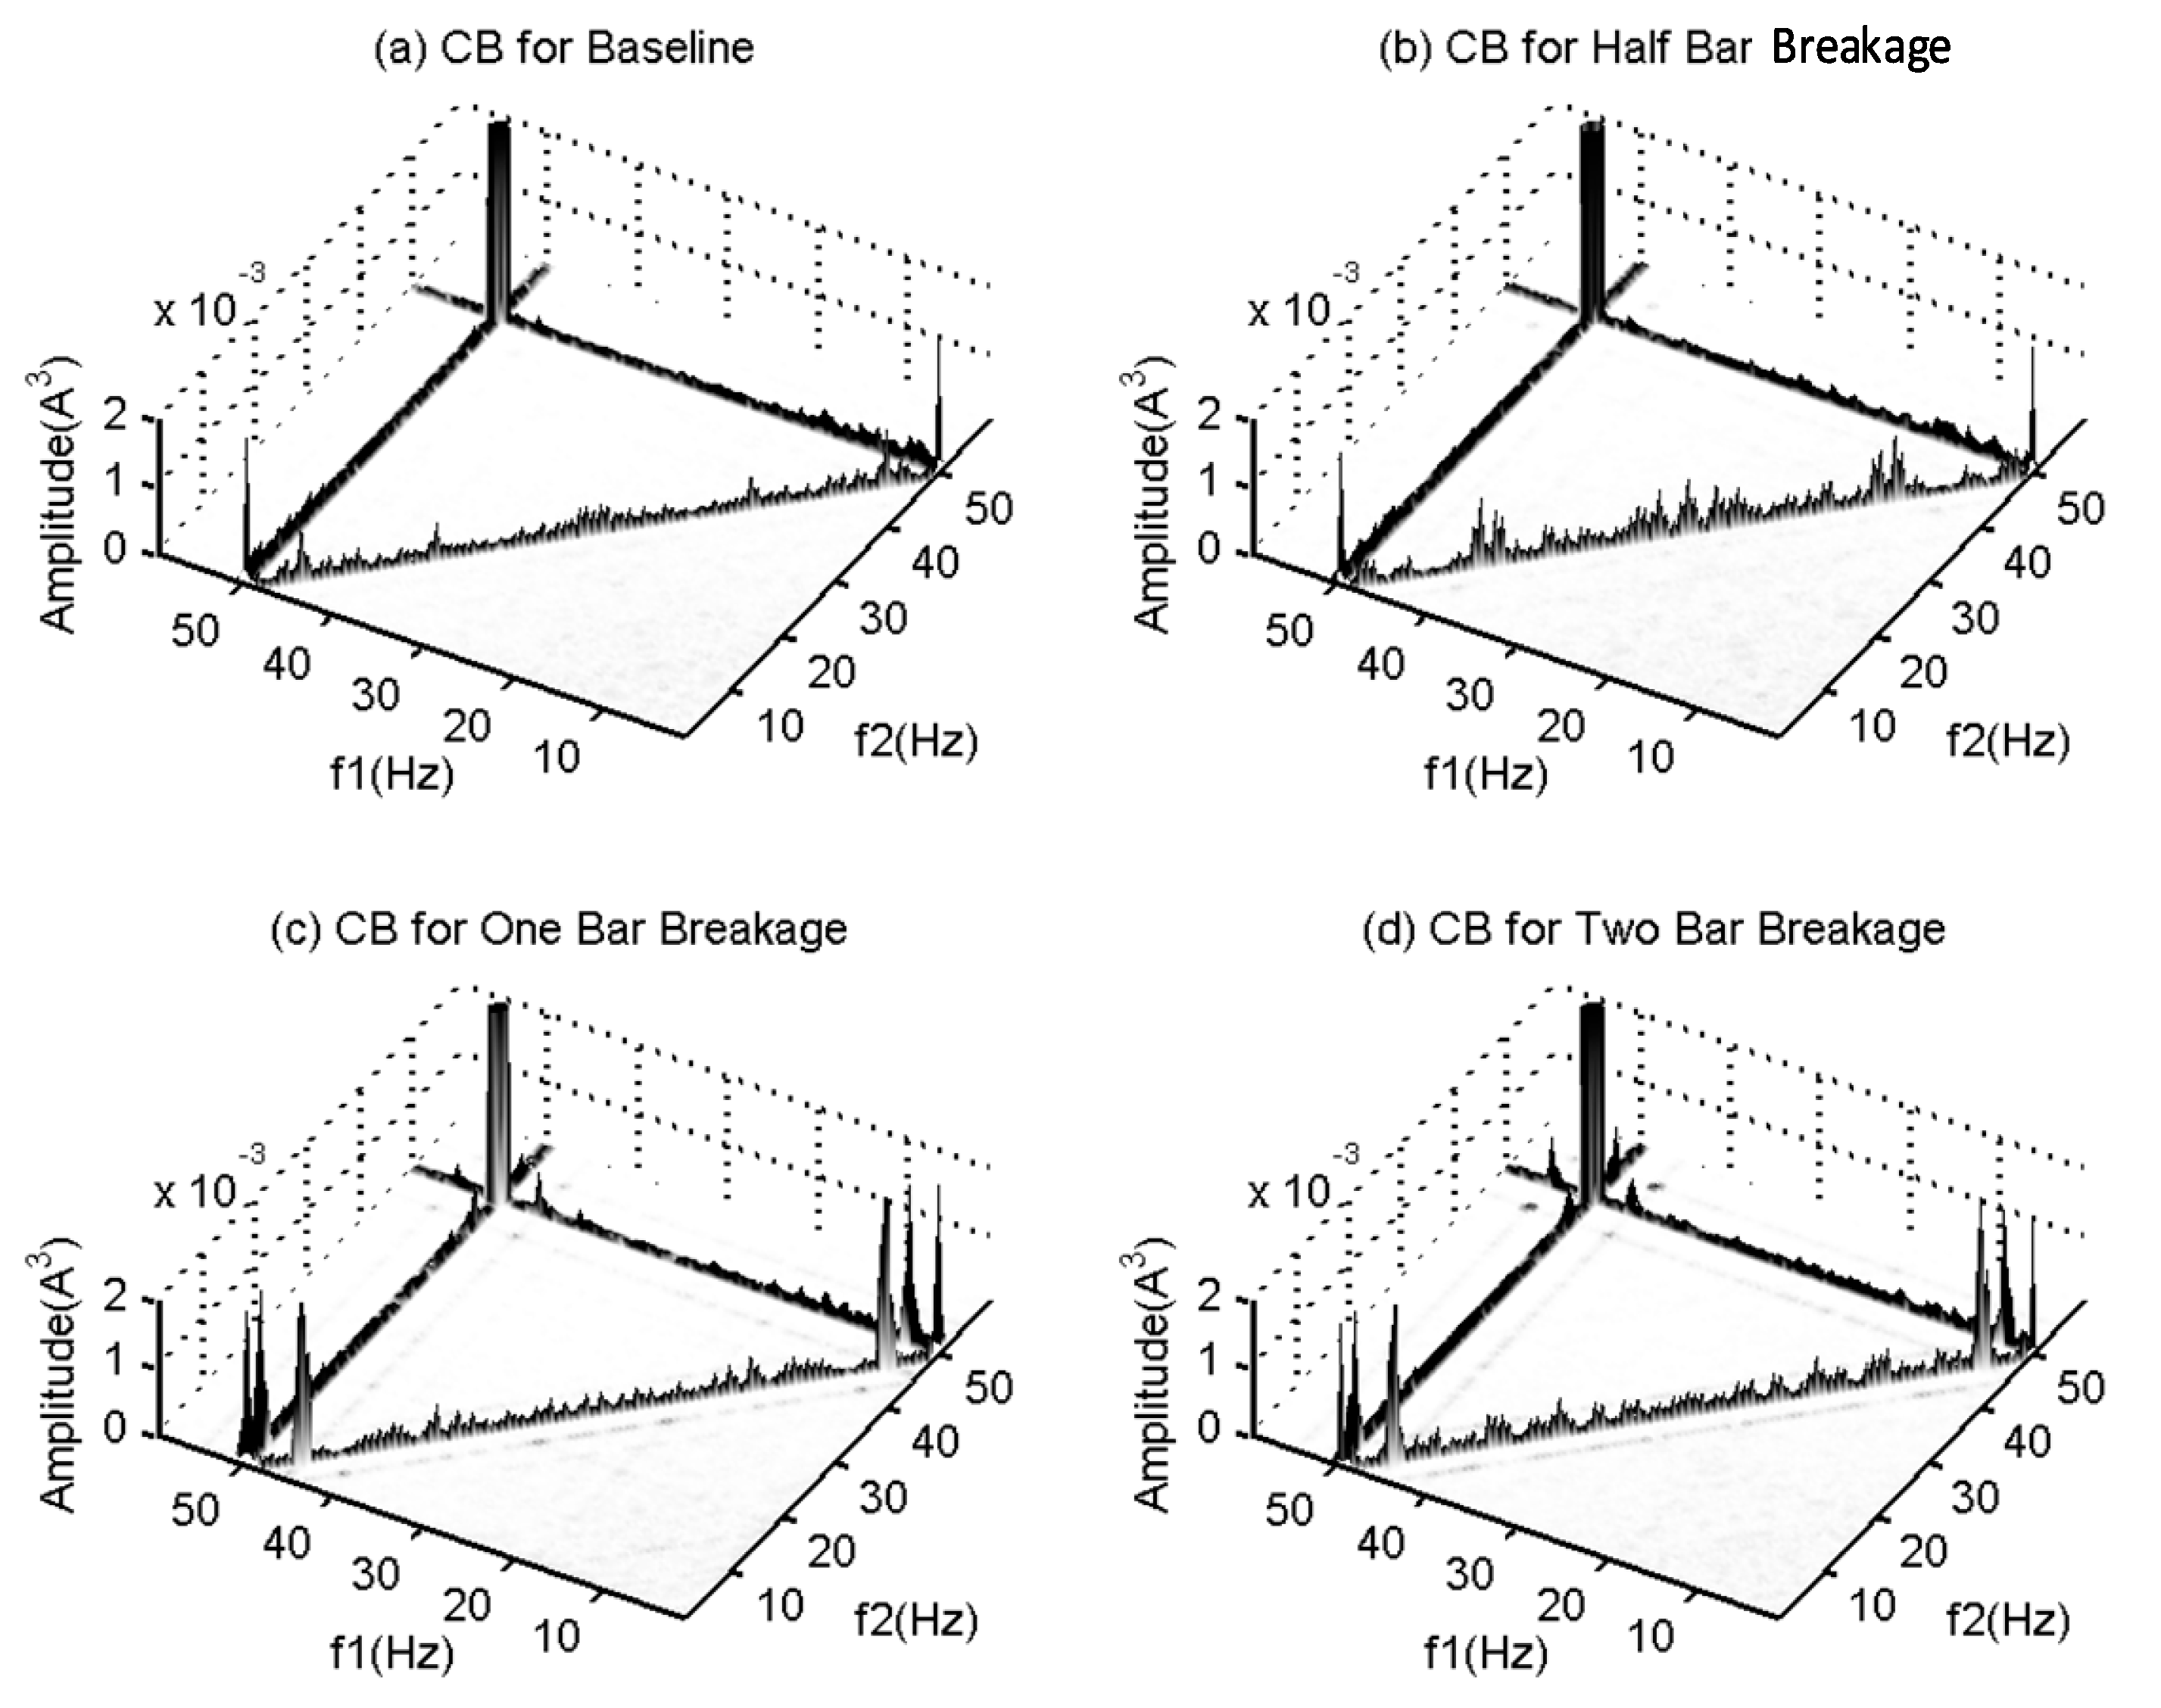
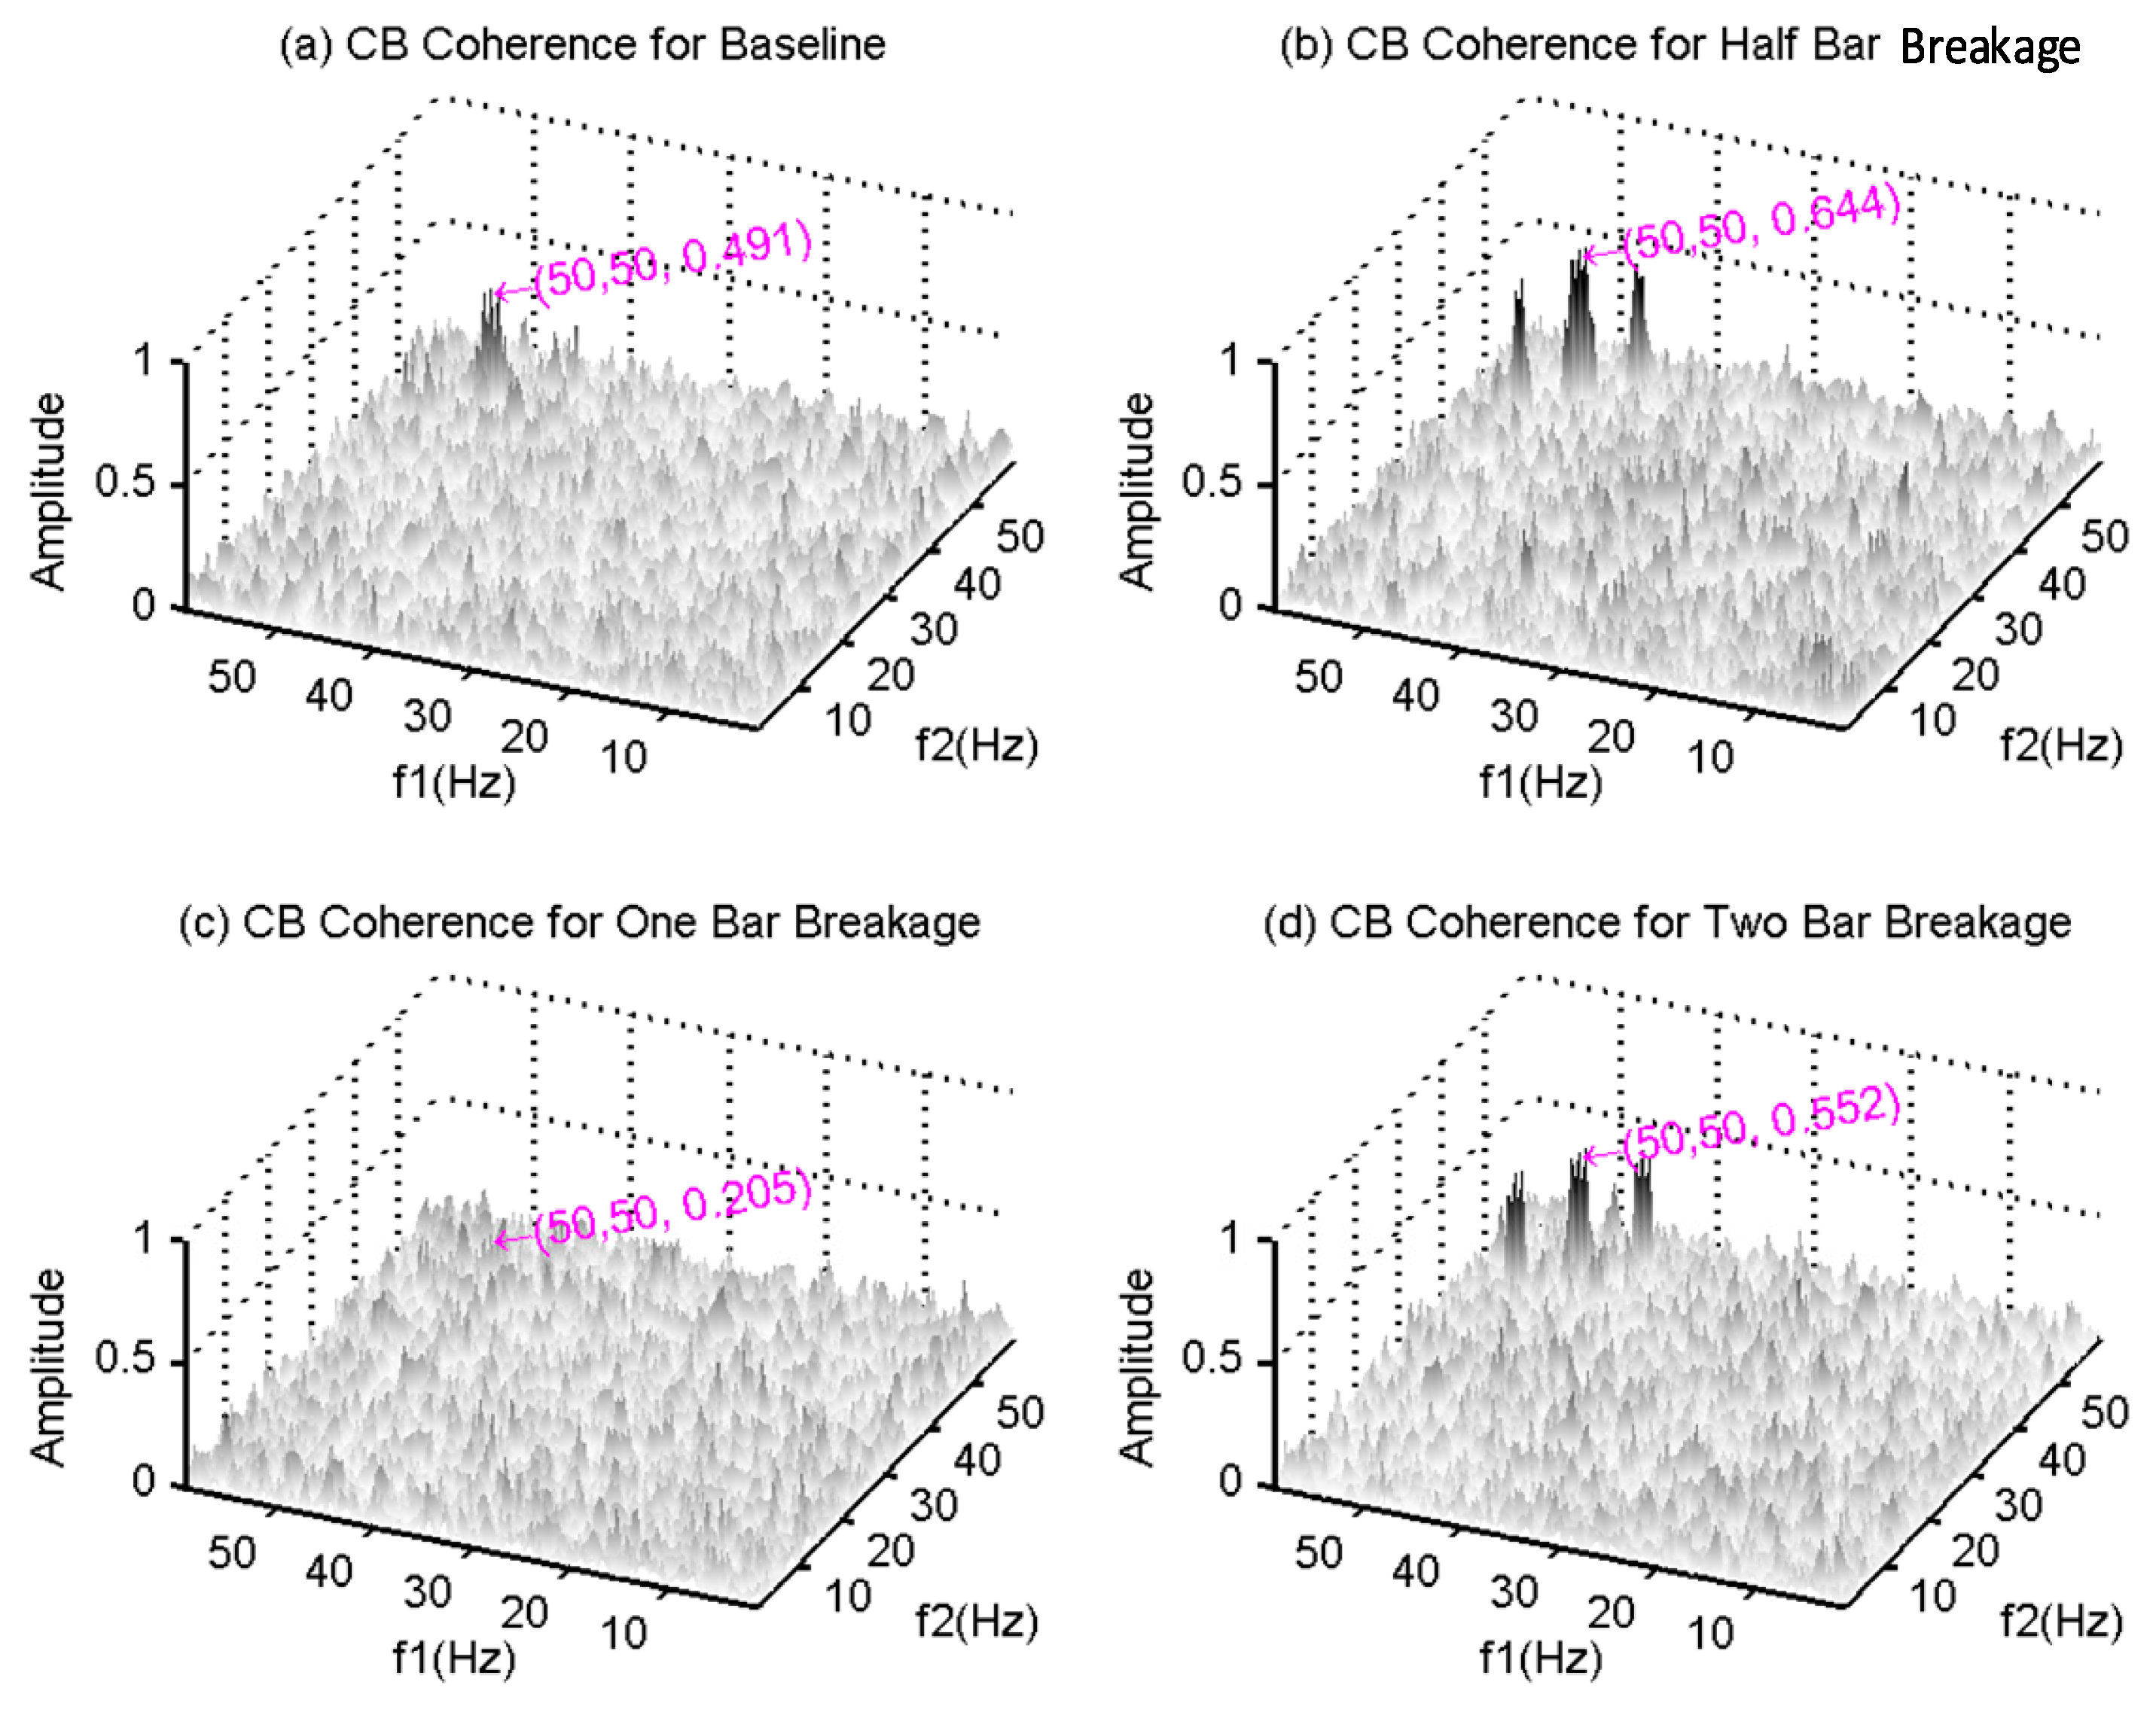
Figure 6 and
Figure 7 present the results of the CB method for the same data sets. It seems that the peaks at the bifrequency (4.5, 45.5) Hz shown in both
Figure 6c,d are related to BRB faults. However, their corresponding CB coherence values are very close to the background values. This shows that these peaks in the CB are not distinct from the nonlinear phase coupling, but may be a result of the extremely high amplitudes of the signal component at 50 Hz and inadequate averaging.
Interestingly,
Figure 7a,b,d shows a peak at (50, 50) Hz. This indicates that certain coupling exists between the 50 Hz and 100 Hz components in these three cases, which may be due to random asymmetric supplies when the tests were performed. However, because the values are around 0.5, they probably cannot be reliable for detecting the supply asymmetry with high confidence. A further study needs to be performed to confirm this finding, which is beyond the focus of this paper. Nevertheless,
Figure 7c does not show these peaks at all, further confirming that this peak is not a reliable feature for BRB detection. Instead, it also shows that the CB analysis is not reliable for motor current analysis because several sets of data signals are needed for re-examining any possible peaks to avoid any erroneous results.
5.2. Gearbox Fault Diagnosis in a Motor Drive
To show the performance of the CB and MSB methods in detecting and diagnosing faults occurring in rotors downstream based on motor current signals, a gearbox test was conducted based on a motor drive with a 10-kW two-stage helical gearbox driven by an 11-kW three-phase induction motor supplied by a variable frequency drive to operate at 1465 rpm [
26,
28]. The gear ratio is Z1/Z2 = 58/47 at the first stage and Z3/Z4 = 13/59 at the second stage. Therefore, the speeds of the gearbox are
Hz,
Hz and
Hz at the input shaft, middle shaft and output shaft, respectively. To accelerate gear deterioration, a 50% tooth width is removed on the pinion Z1 at the first stage and lubricating oil level is reduced by 20%. In these degraded conditions, it is expected that the gearbox will undergo faster wear due to poorer lubrication and higher stress on the tooth surfaces. After running for up to 573 h, the test rig was stopped because the MSB magnitude at
was over three times higher than the baseline. An inspection was performed and found that the tooth surface was over-worn on both Z1 and Z2. During the tests, both motor current signals and vibrations were measured to monitor in real time whether any severe faults had occurred during the tests, which avoided potential catastrophic damage to the test system.
5.2.1. MSB-Based Detection and Diagnosis
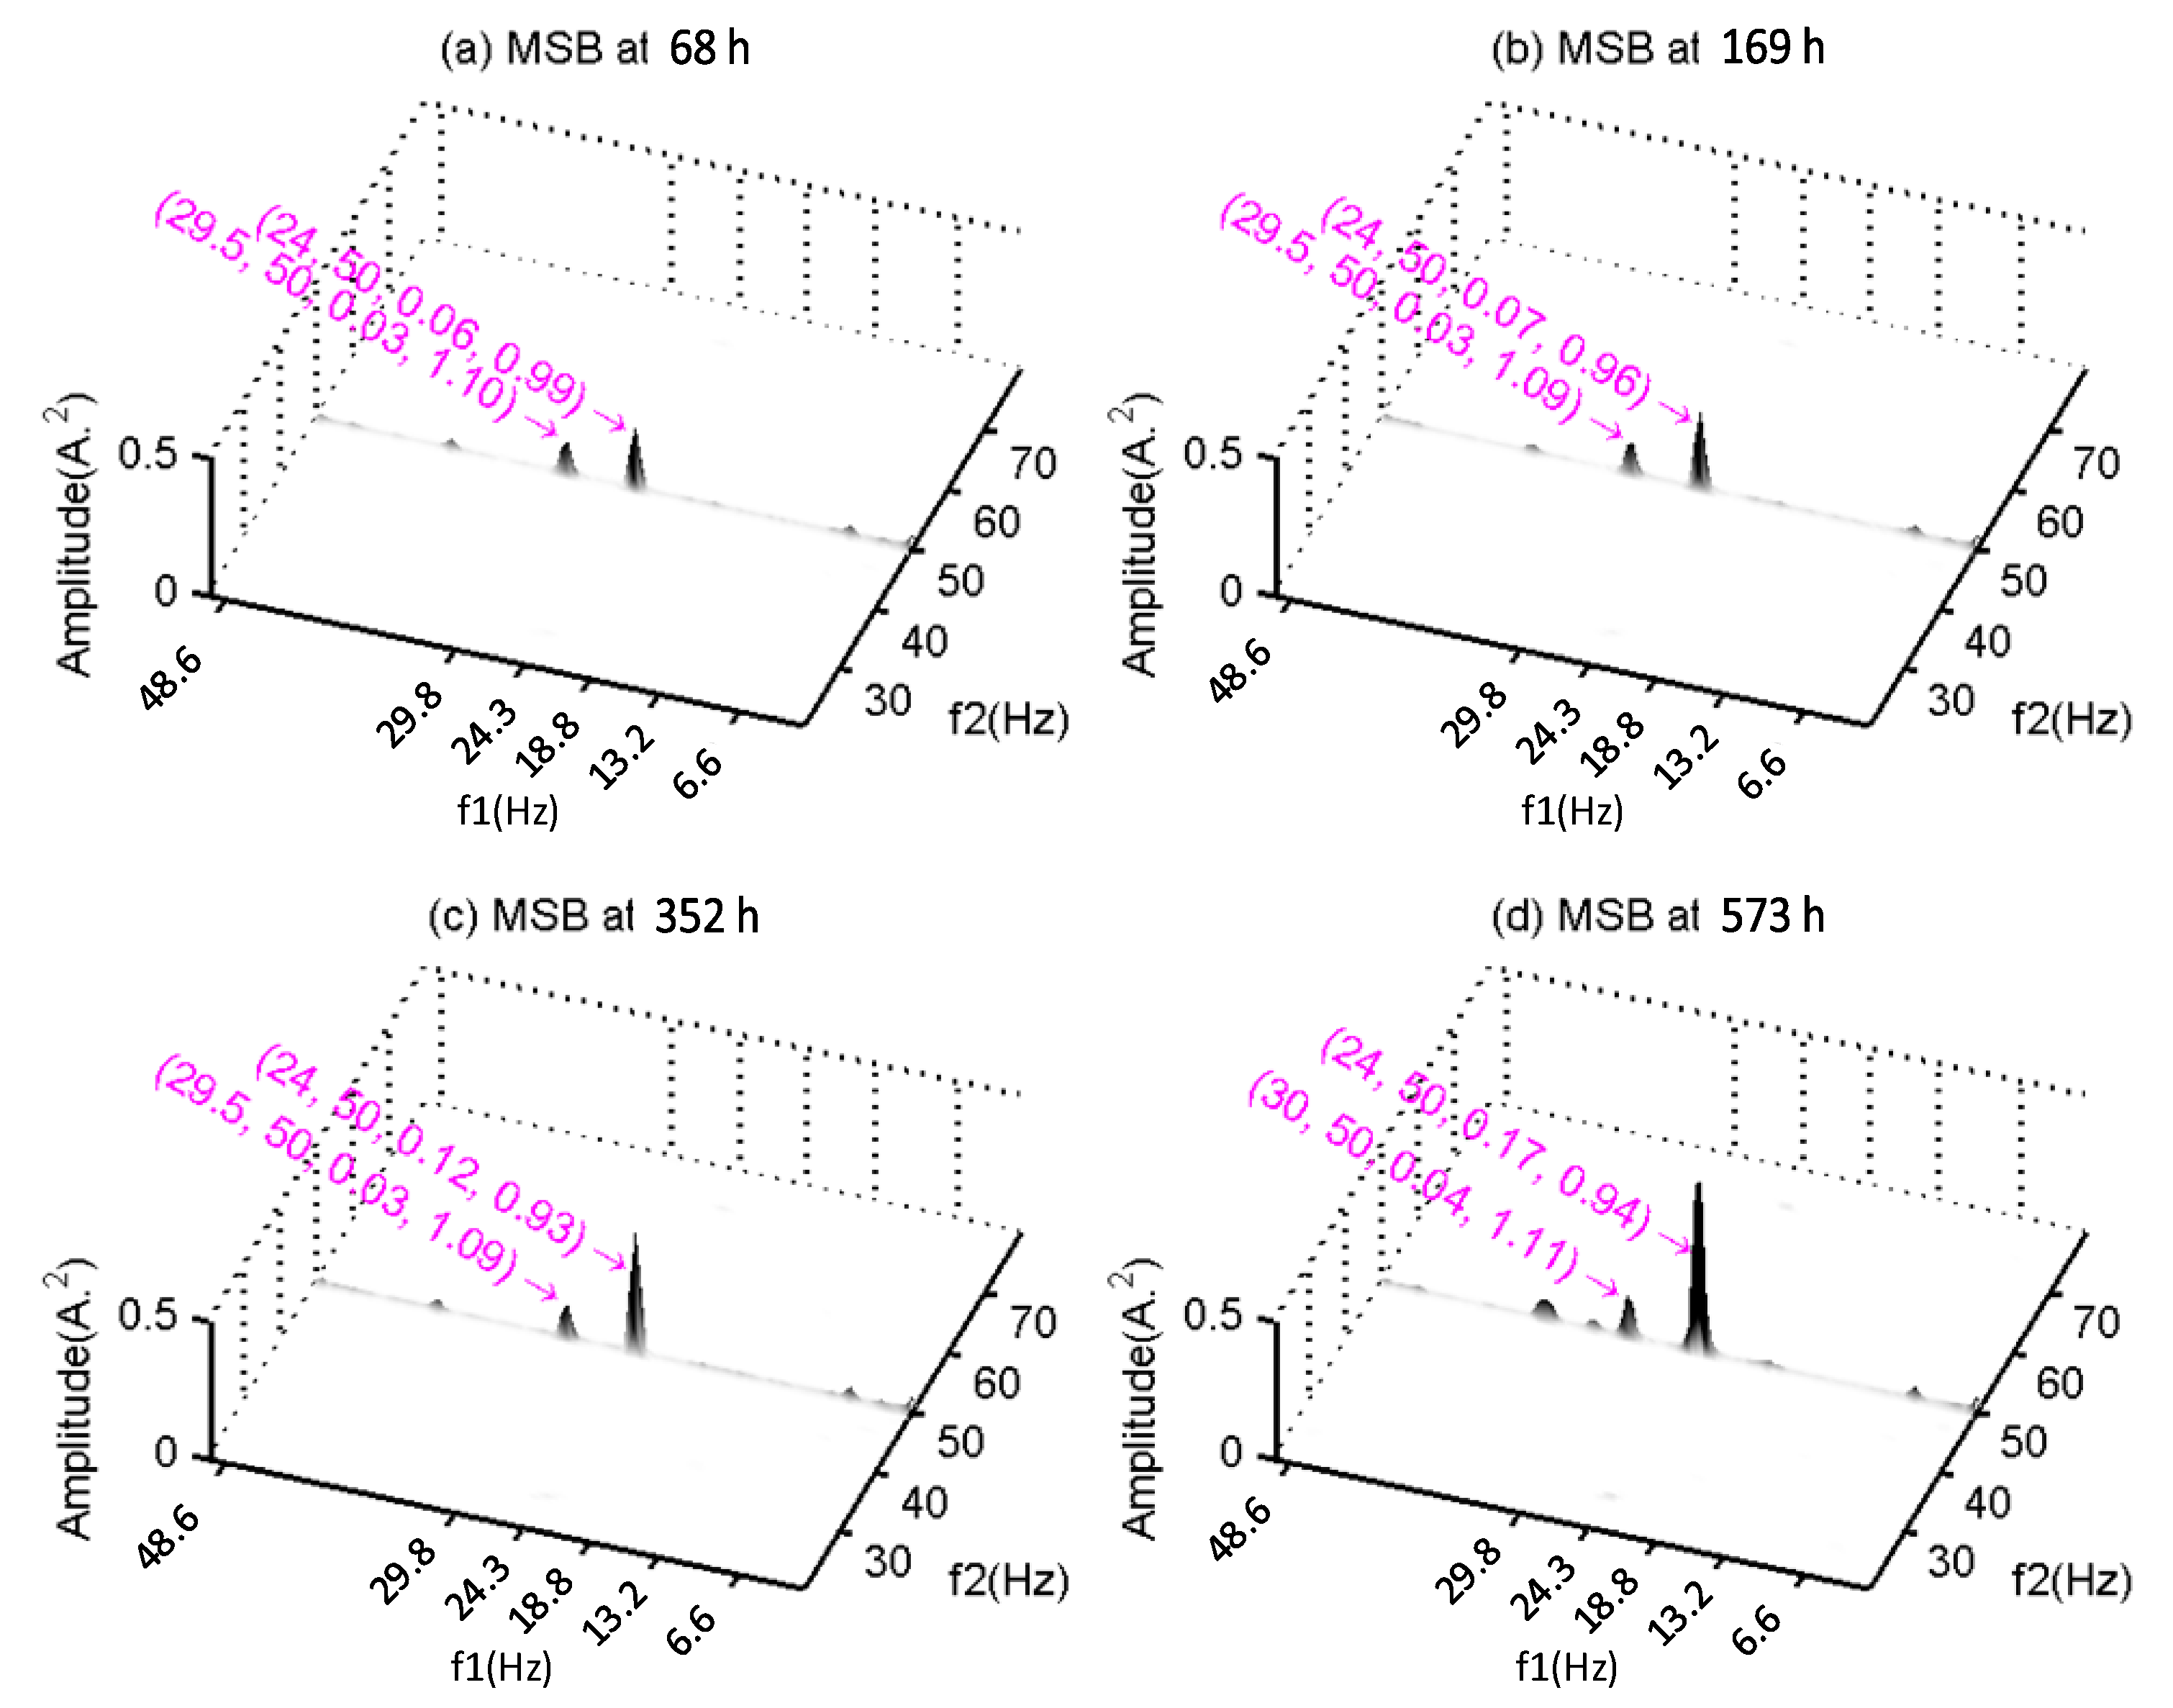
Figure 8 shows the MSB results at successive operating times. To show the trend of the MSB peaks, the MSB magnitude is root mean squared to reduce the data’s dynamic range. It can be seen that there are two distinctive peaks at (24.5, 50) Hz and (29.5, 50) Hz, which relate to the speed fluctuations at the input shaft and the middle shaft, respectively. Moreover, the peak at (24.5, 50) Hz shows a gradual increasing trend with the operating time. This shows that the weakened gear Z1 may undergo a faster wear rate process after enlarging the profile of its inherent asymmetric shape error. On the other hand, the peak at (29.5, 50) Hz relating to Z2 is observed not to have such a variation in trend. This is difficult to understand because the tooth profile should deteriorate in a similar way for both tooth surfaces in the matching gear pair. Nevertheless, the increasing trend can be an excellent indicator and measure for the deterioration occurring in the gear on the input shaft.
Unfortunately, features such as RMS, kurtosis and sideband amplitudes, which are commonly used in vibration-based condition monitoring, did not exhibit a similar gradual increasing trend until the final instant at 573 h, which is detailed in [
33,
34].
Additionally, the phase values for both MSB peaks and for all the time instances are around 1 rad, indicating that the impedance characteristics of the stator remained unchanged throughout the experiment. Moreover, this phase is smaller than for the BRB shown in
Figure 4, indicating that the fault is from motor speed oscillation rather than the BRB effect. This is in accordance with the prediction in the current signal model in
Section 2.
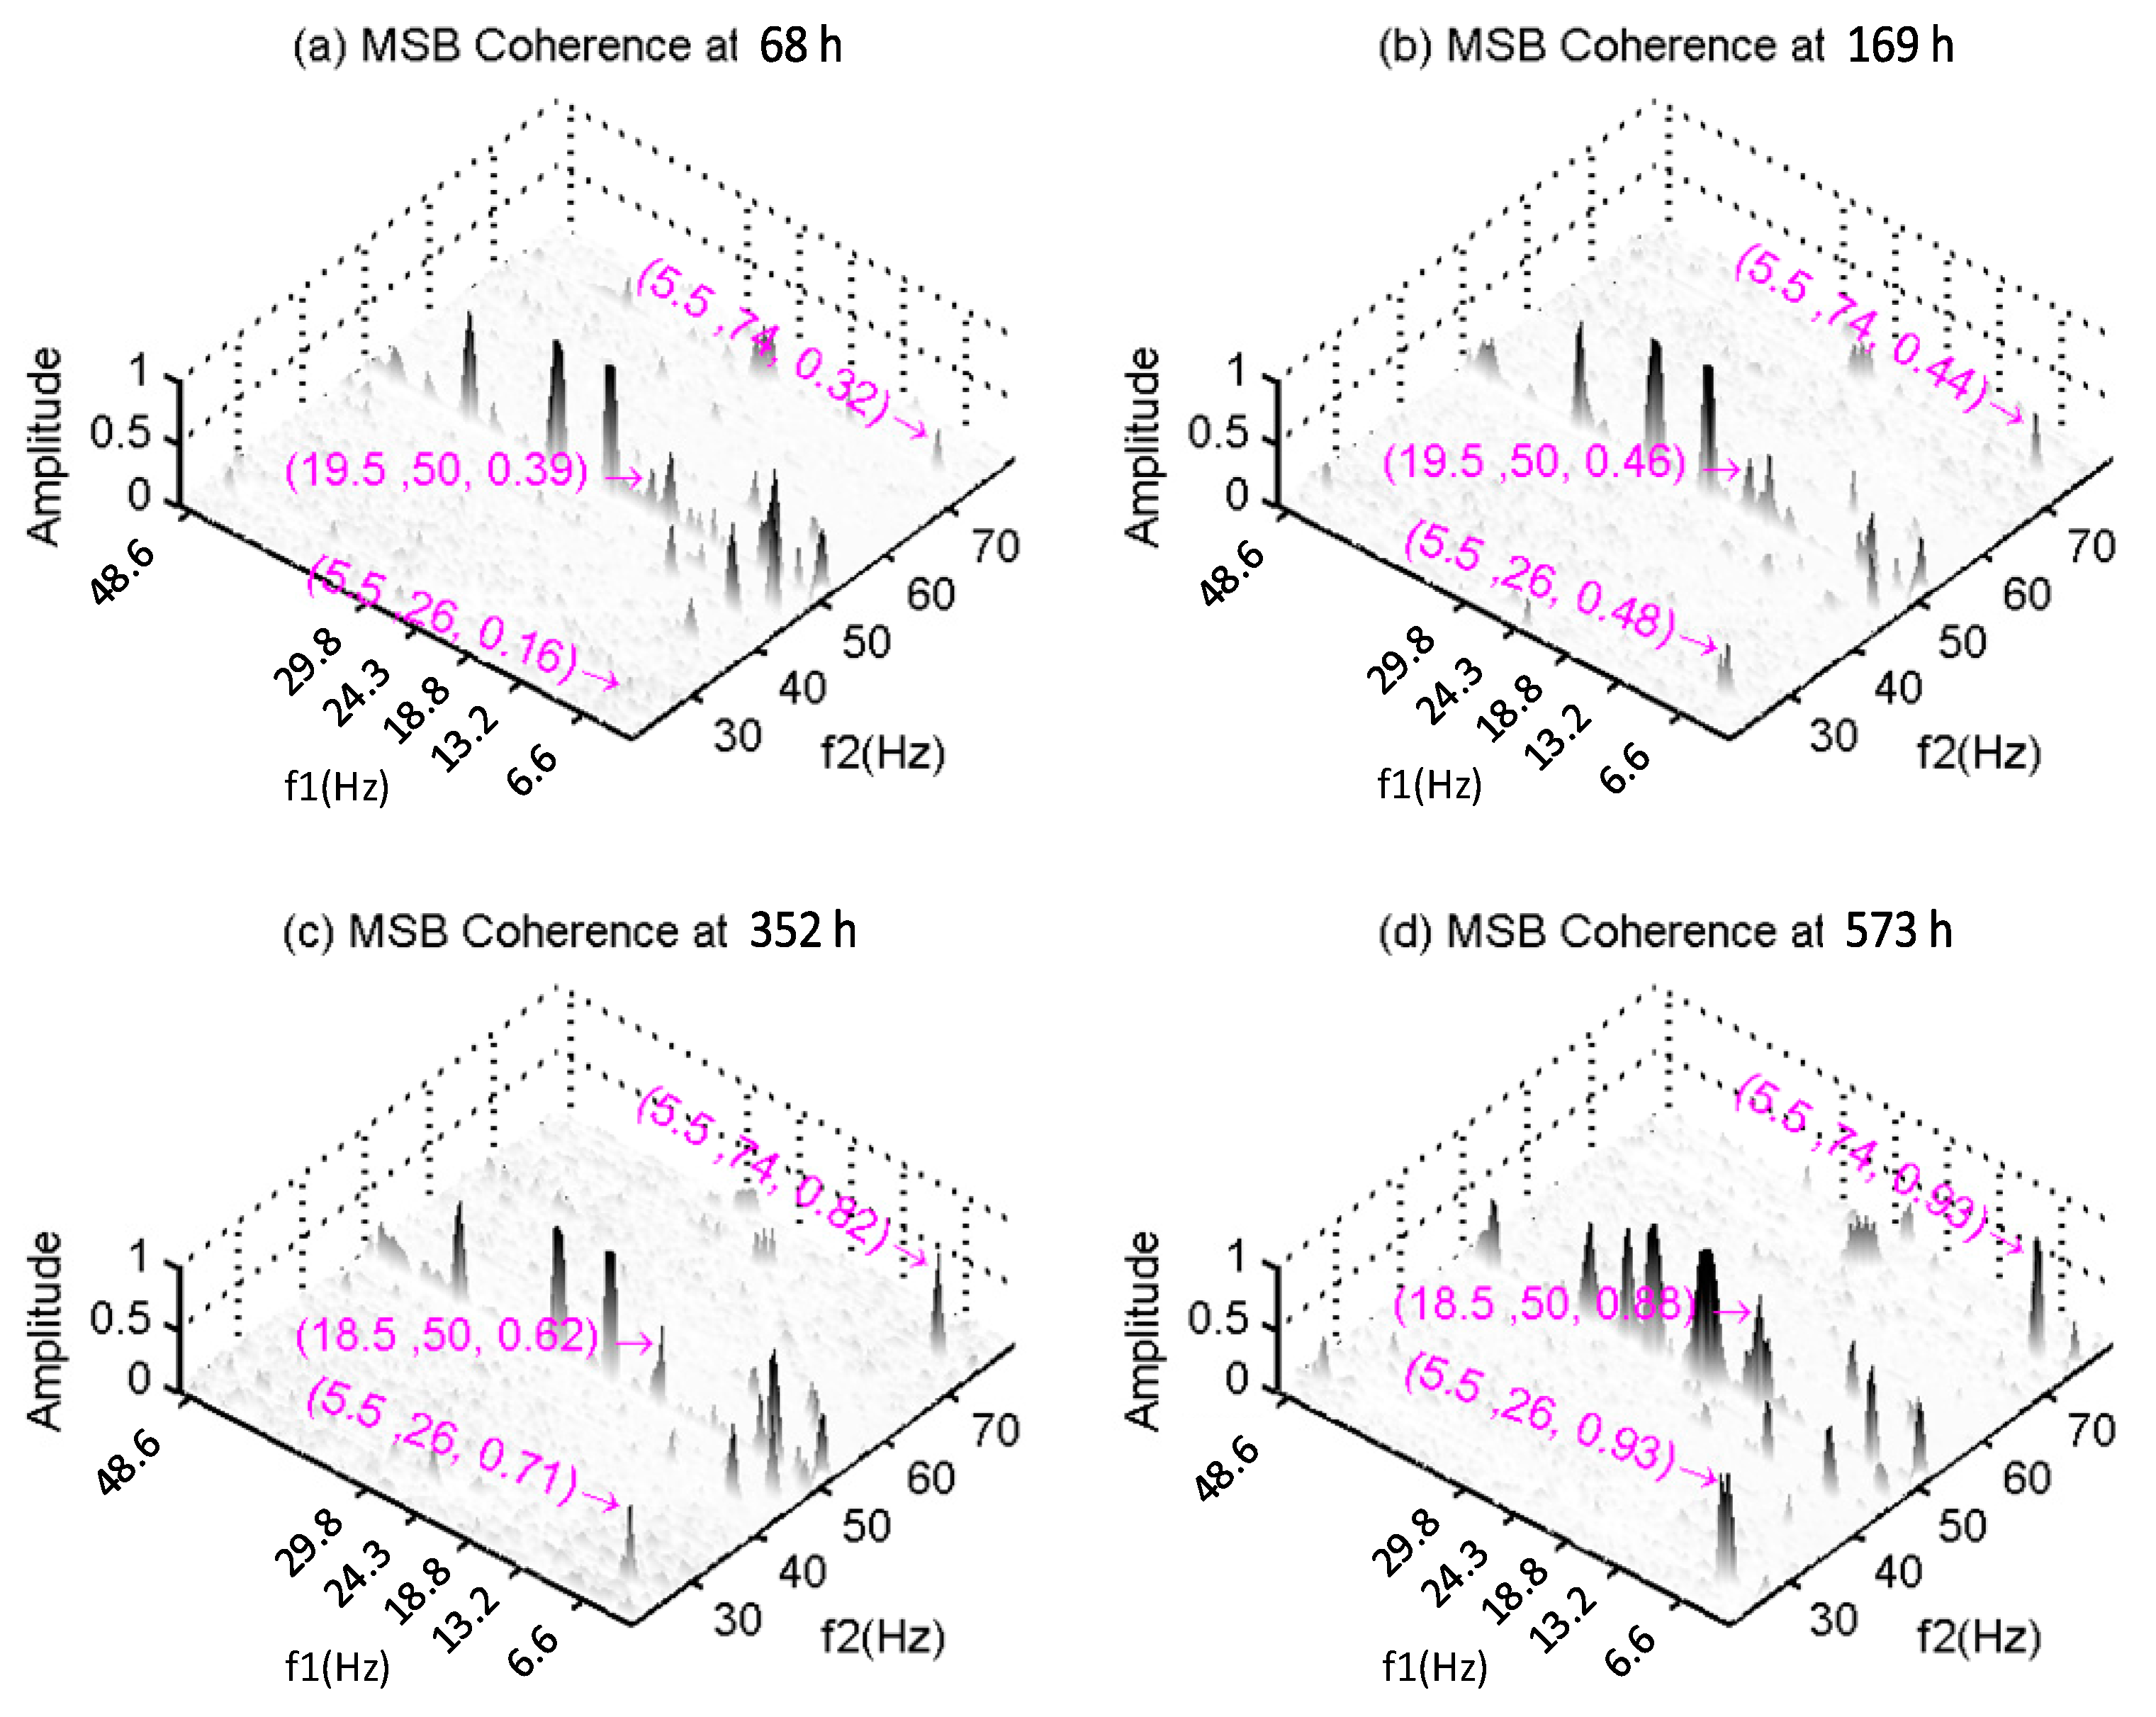
To confirm the peaks found in the MSB, its corresponding coherence is presented in
Figure 9. It can be seen that there are many more peaks for the multistage gear transmission because the system has at least three shafts, compared with those from the motor test only in
Figure 5. By examining the coherence, it is found that these characteristic peaks have values as high as 1, which hence ensures the accuracy of the peaks of the MSB.
In addition, many other peaks can be observed in the coherence, showing the complicated nonlinear process of gearbox transmission. Moreover, the peaks at the bifrequency (6.6, 50) Hz and other relative bifrequencies, such as (6.6 × 1, 50 − 6.6) Hz and (6.6 × 2, 50 − 6.6) Hz, which relate to of the output shaft, can also be observed more clearly in the coherence. However, these peaks show little change during the testing period, indicating that the deterioration of the gears in the second stage is negligible. This agrees with the fact that these gears have no faults seeded and the lubrication condition will be maintained with the large diameter of Z4 when the oil level is lower.
Another set of peaks found in the coherence of
Figure 9 are those at bifrequencies (5.5, 26.0), (5.5, 74.5) Hz and (18.5, 50) Hz. They start with a very small value of 0.244 at the beginning and increase to 0.919 in the end, showing a close correlation with the deterioration process presented by the MSB peak at (24.5, 50) Hz. Based on the vibration characteristics, it can be seen that the peaks at 5.5 Hz (
) and 74.5 Hz (
) are from the shaft mutual modulation due to the change of rotating speeds. Therefore, these peaks can also be evidence of the deterioration of the gearbox at the first stage. More importantly, it explains that Z2 also undergoes a fast wear rate process similar to Z1. However, this peak results from a modulation with a much smaller carrier and hence cannot be observed in the MSB peaks.
Overall, the MSB and its coherence give a full indication of the gearbox deterioration process. The coherence must be explored to include all possible coupling components that result from the carriers other than from the fundamental component. In addition, it also proves that the MSB-based current analysis is sufficiently sensitive to small changes in large motors even if they have large inertia.
5.2.2. CB-Based Detection and Diagnosis
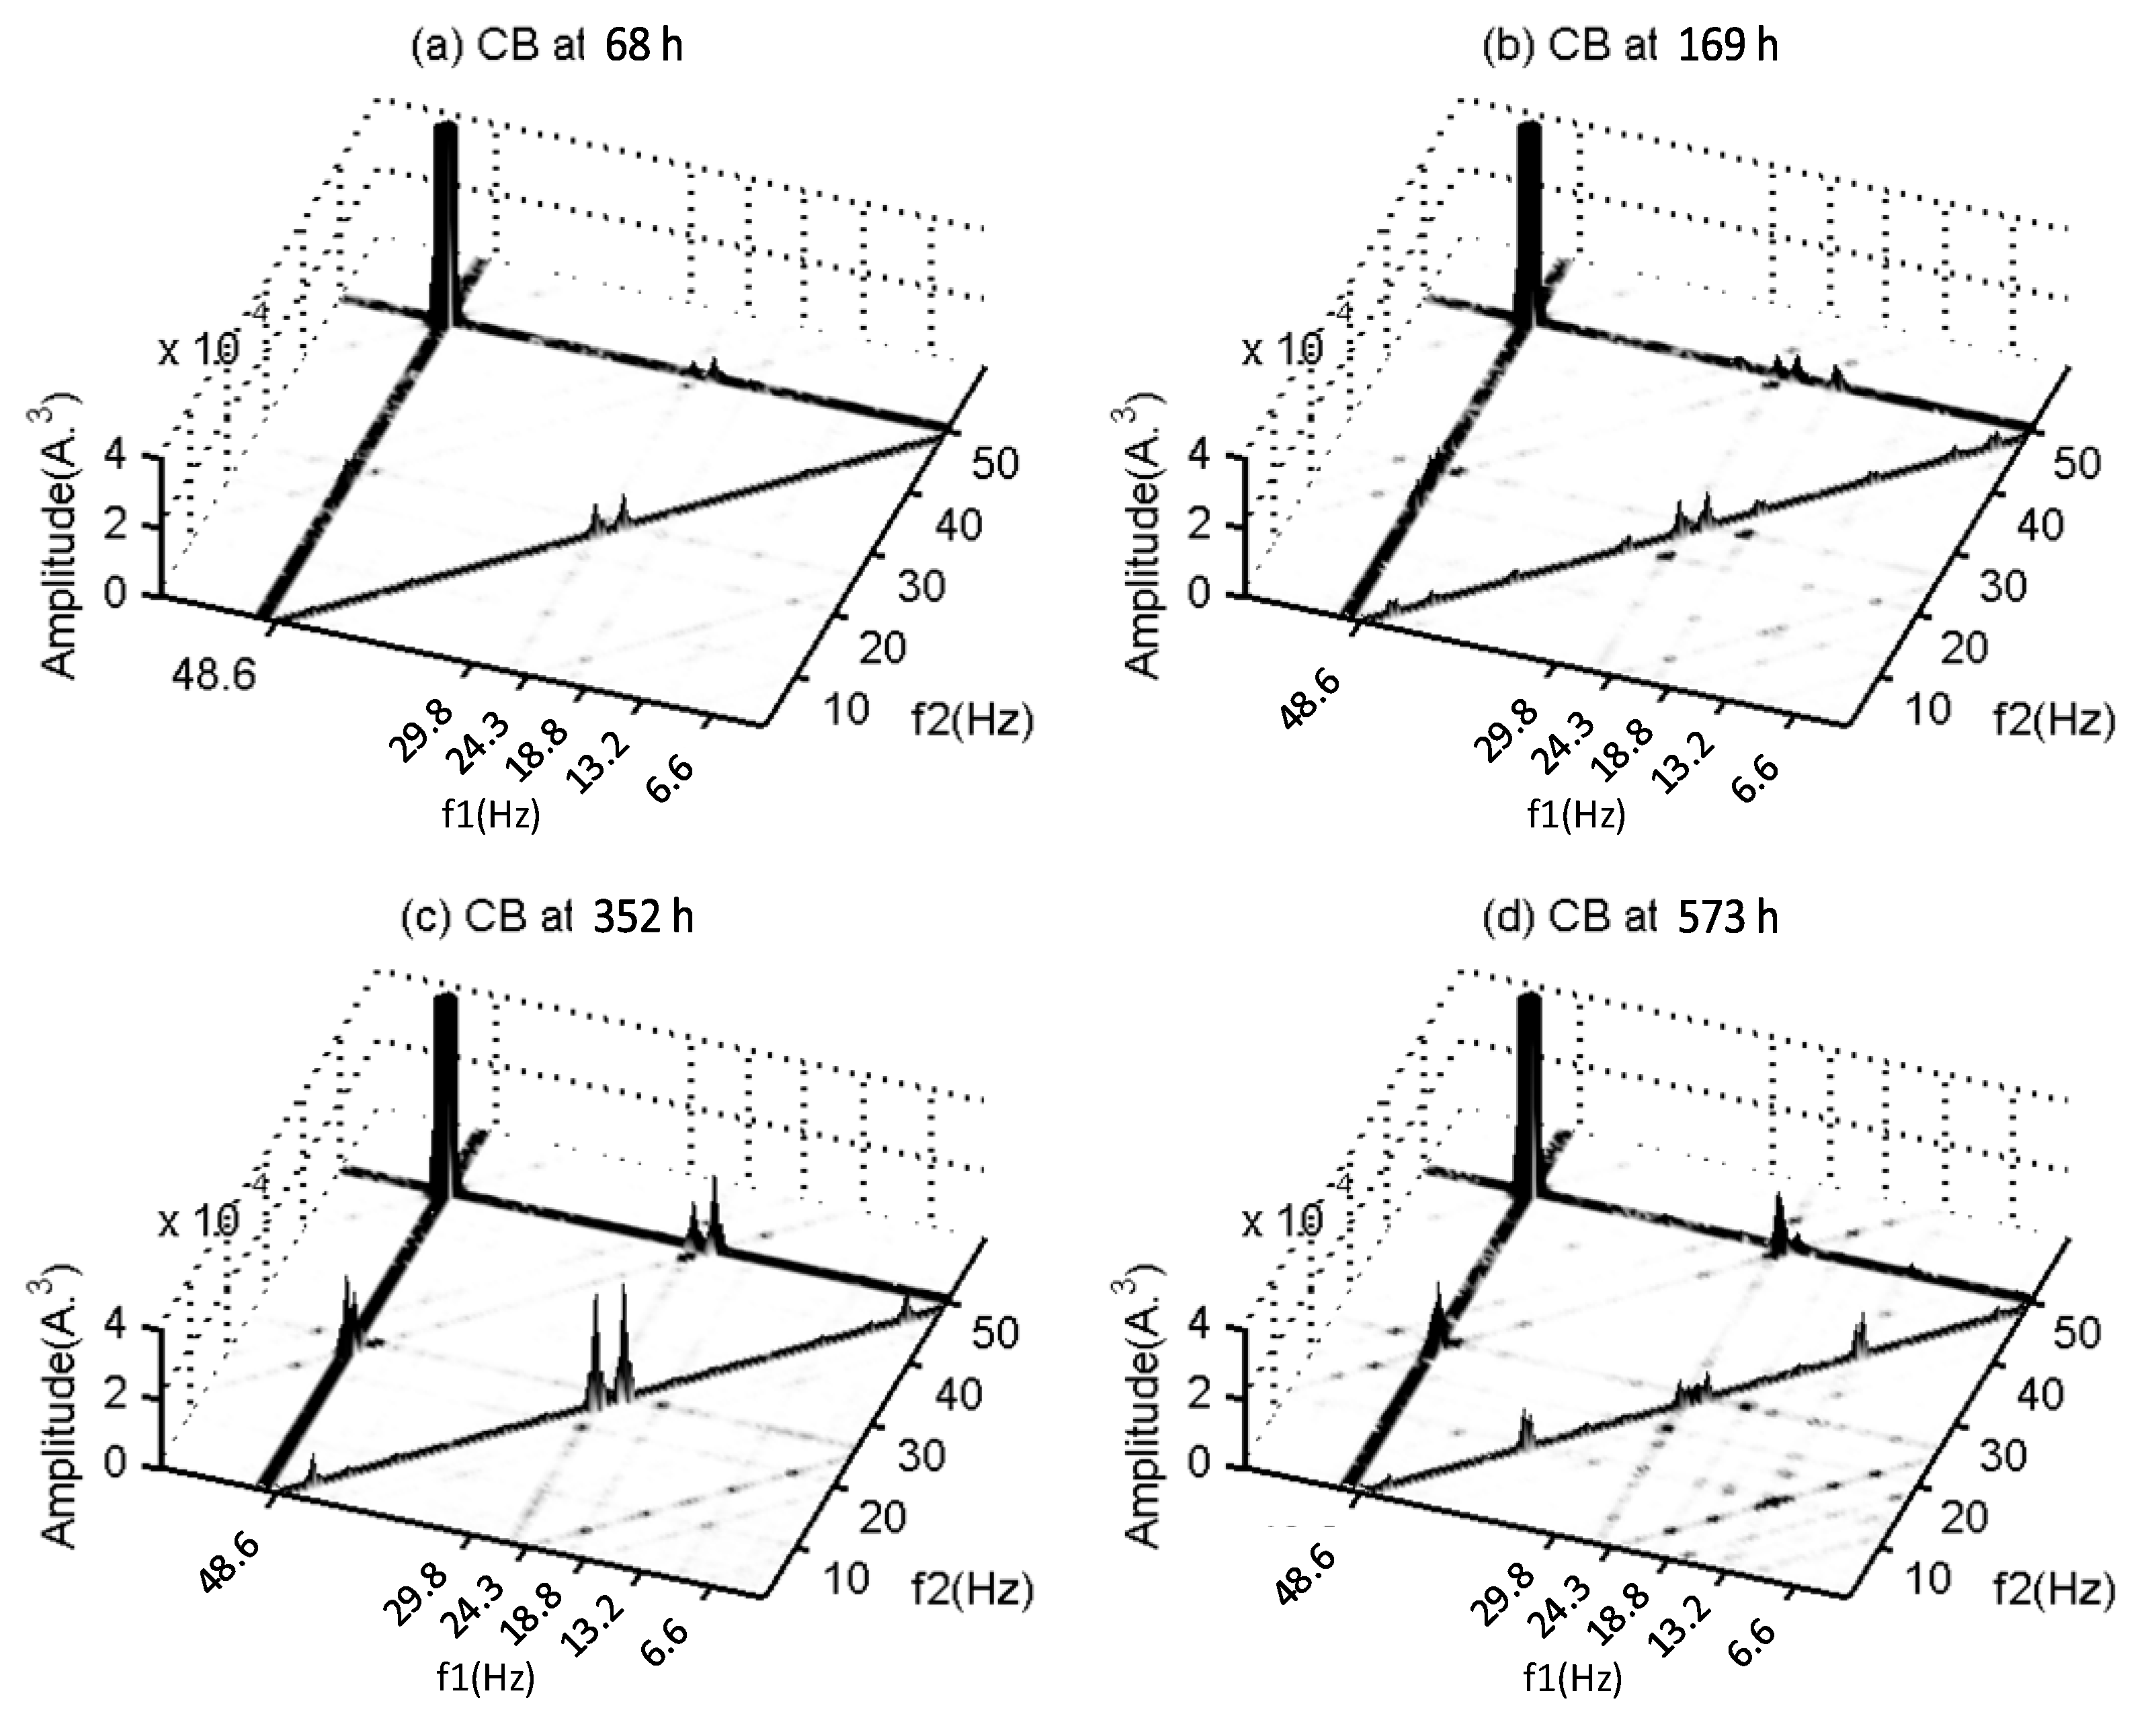
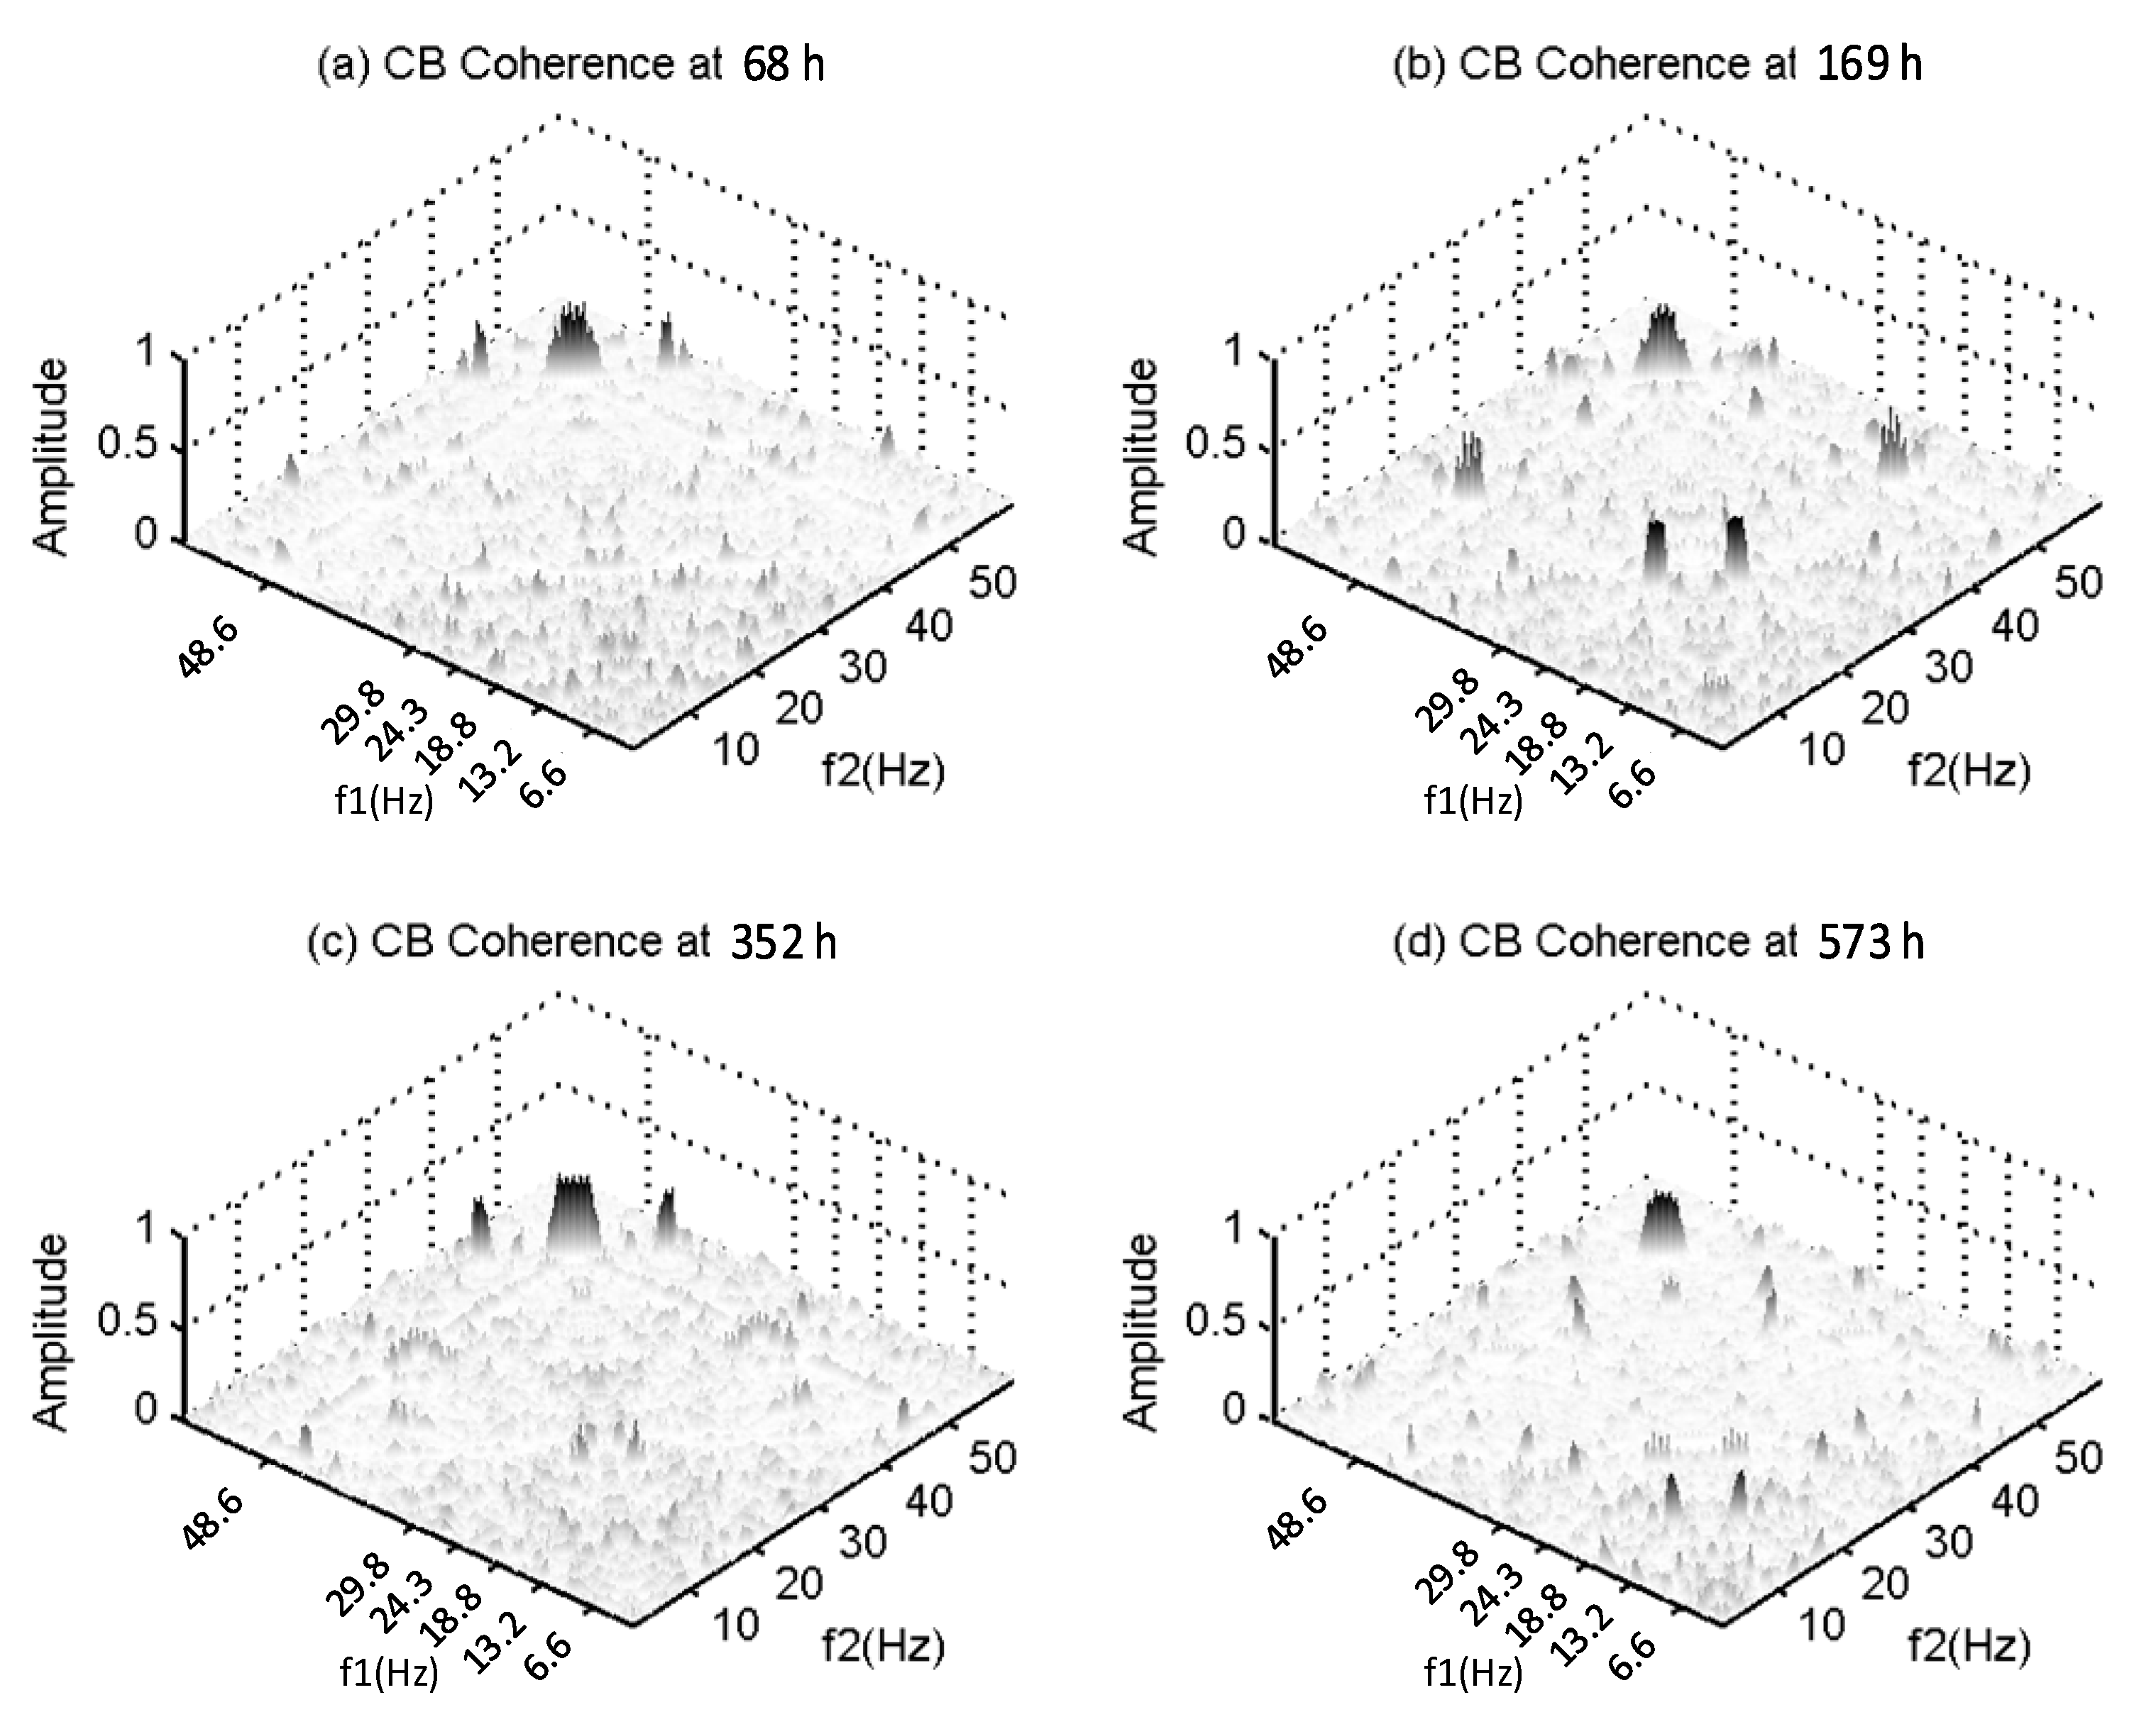
Figure 10 and
Figure 11 show the results of CB for the gearbox data sets. Although there are multiple frequency components which potentially have PCs, the results still show similar characteristics to that of the CB from motor BRB. There are no clear peaks found in the CB that relate to the shaft frequencies of interest or give any indication of a consistent change with operating time. Some of the peaks, such as that at (13.2, 13.2) Hz, may show a marginal relation, but the CB coherences show corresponding peaks.
In addition, the peak at (50, 50) Hz in the CB coherence shows a certain coupling between 50 Hz and 100 Hz components for all four cases due to random asymmetric supplies when the tests were performed. However, because the values are so small, they are not reliable for detecting supply asymmetry.
Once more, the gearbox test shows that the CB analysis is neither effective nor reliable for analysing motor current signals, even if it contains rich components from different sources.
5.3. Fault Diagnosis in a Reciprocating Compressor
Reciprocating compressors are widely used in industry for various purposes, and faults occurring in them can degrade their performance, consume additional energy, and even cause severe permanent damage to the machine. The current signals were acquired from a motor that drove a two-stage reciprocating compressor. The motor was a 2.5-kW three-phase four-pole induction motor which drove a compressor through a V-belt with a transmission ratio of 3.2. As the compressor works in an intermittent nature, the motor is subjected to a high dynamic load, fluctuating at about 7.15 Hz according to the working cycle of the compressor. This means that the motor current signals contain information in a much higher degree of modulation and are likely to produce a more complicated nonlinear process.
To evaluate the effectiveness of CB and MSB in diagnosing these faults, the data sets are collected from three types of fault conditions, i.e., discharge valve leakage, transmission belt looseness and intercooler leakage, which are detailed in [
25].
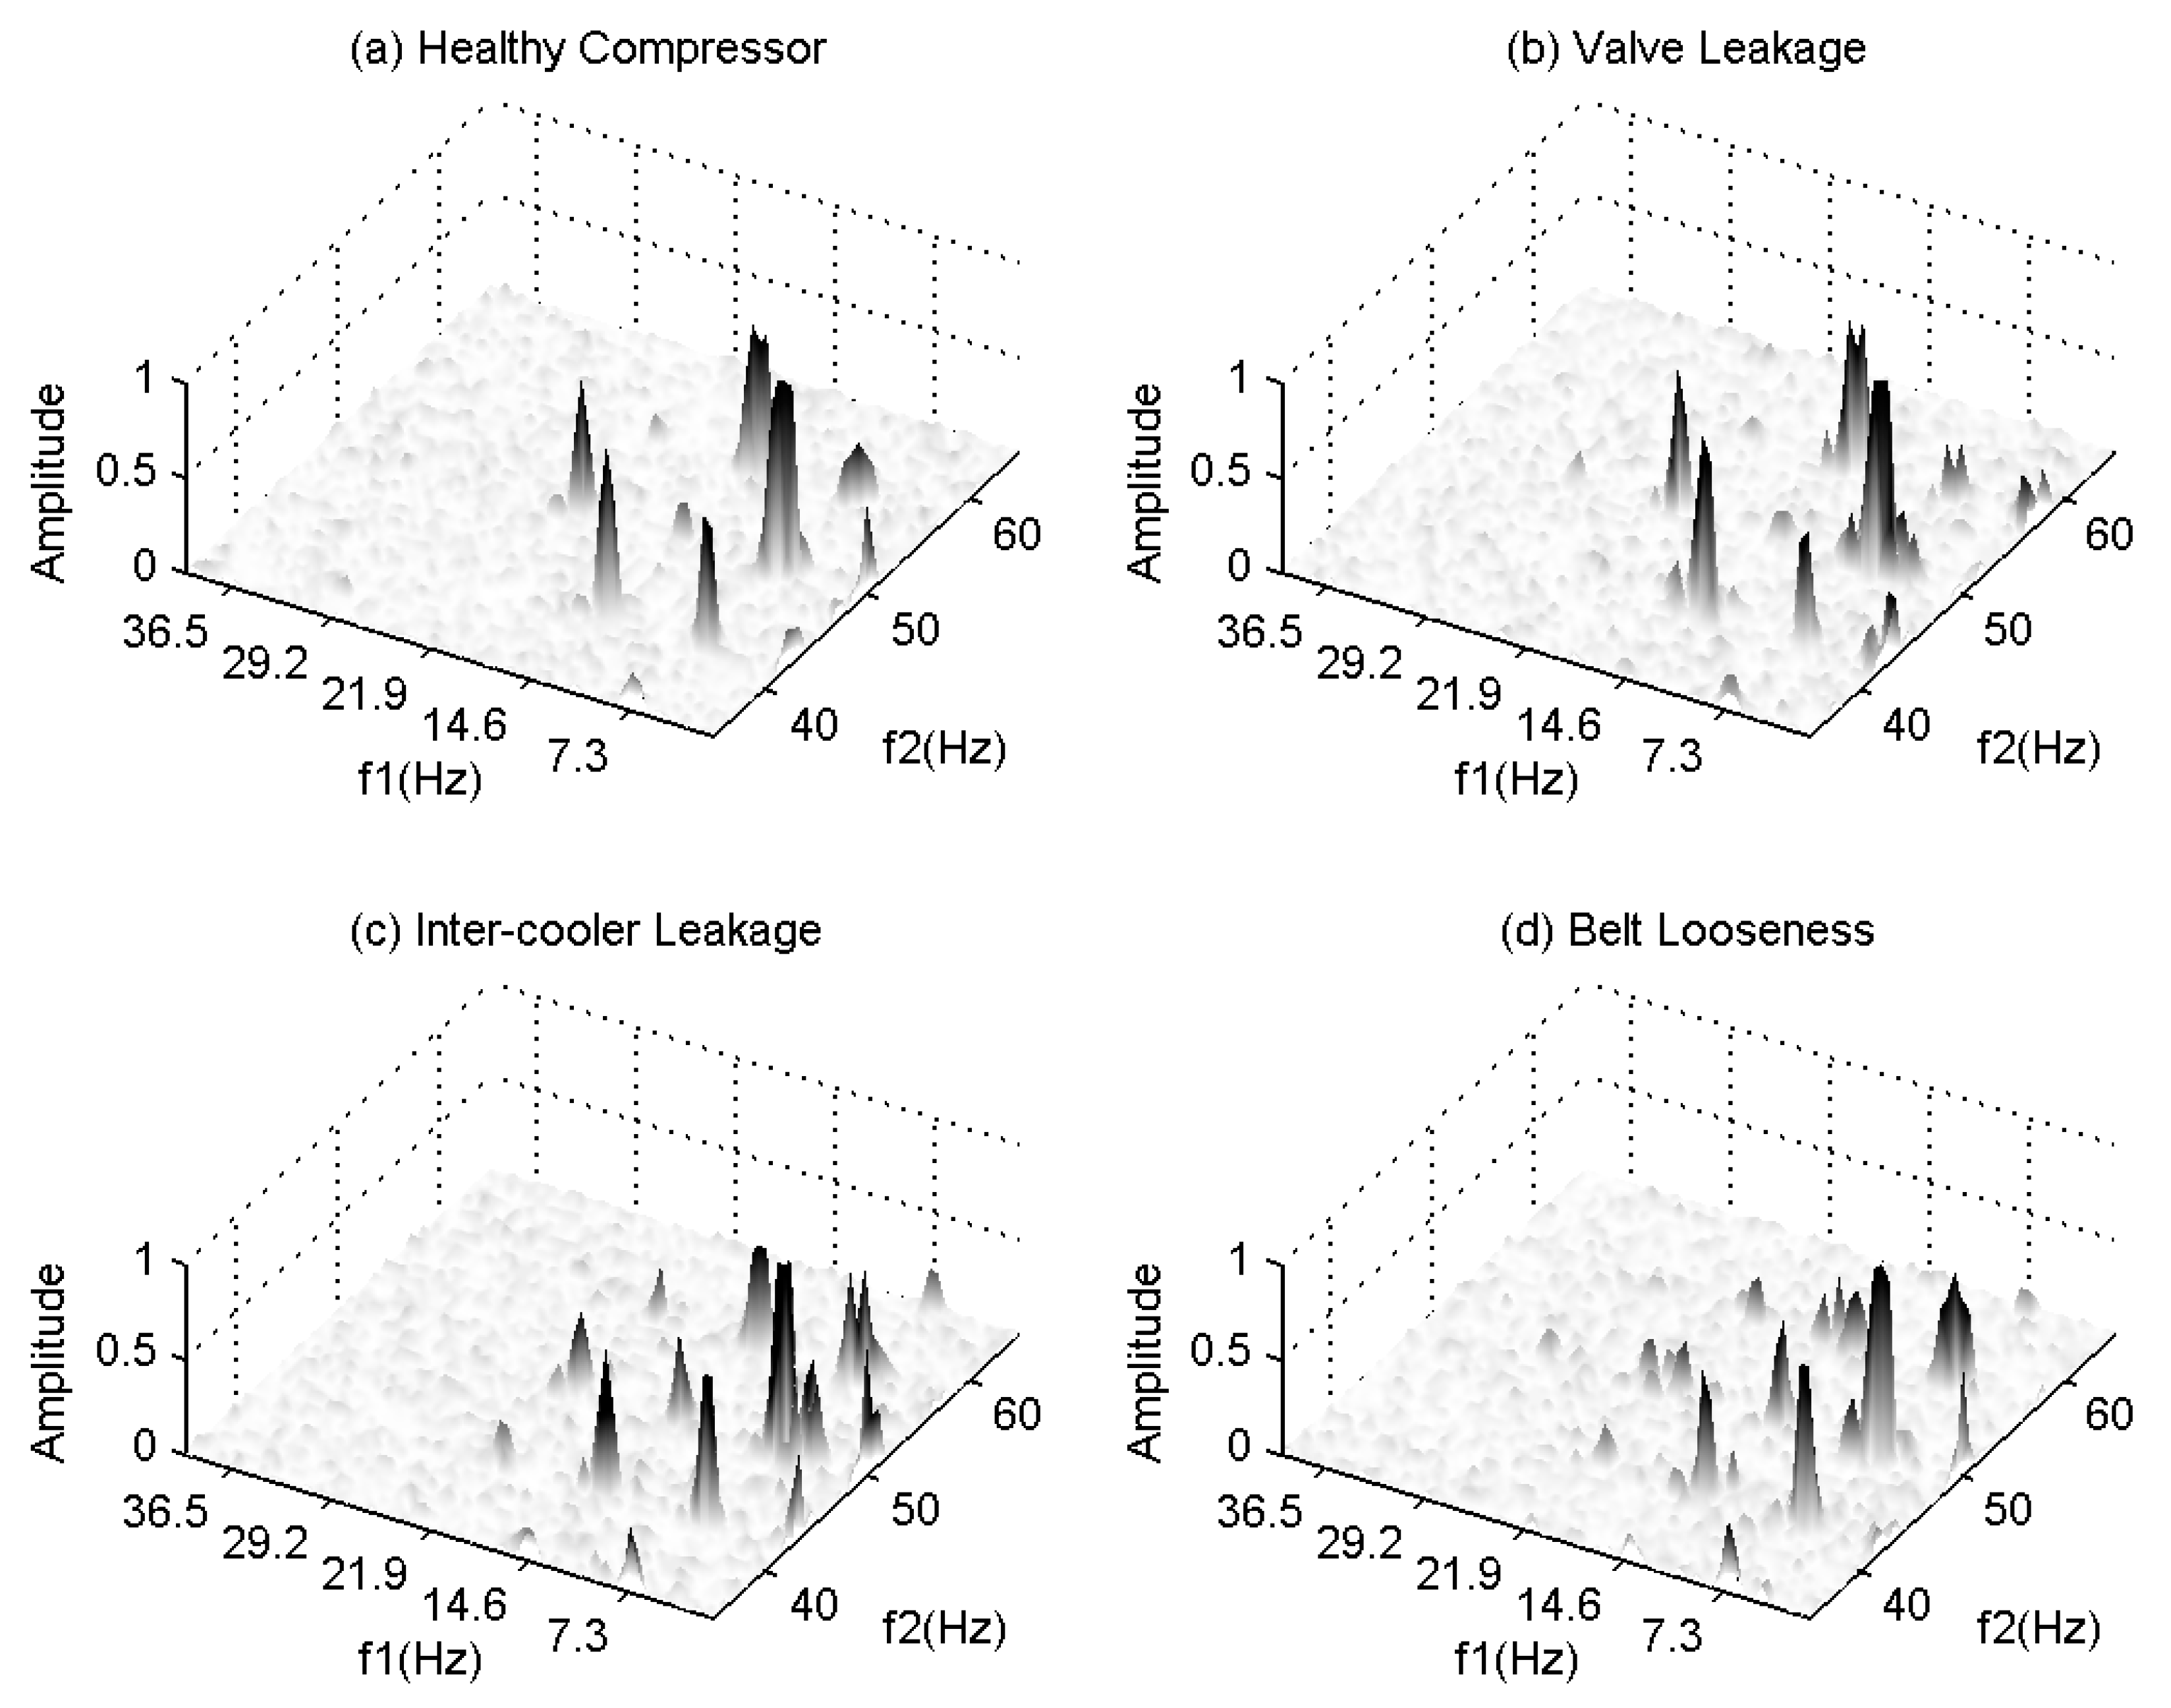
5.3.1. MSB-Based Detection and Diagnosis
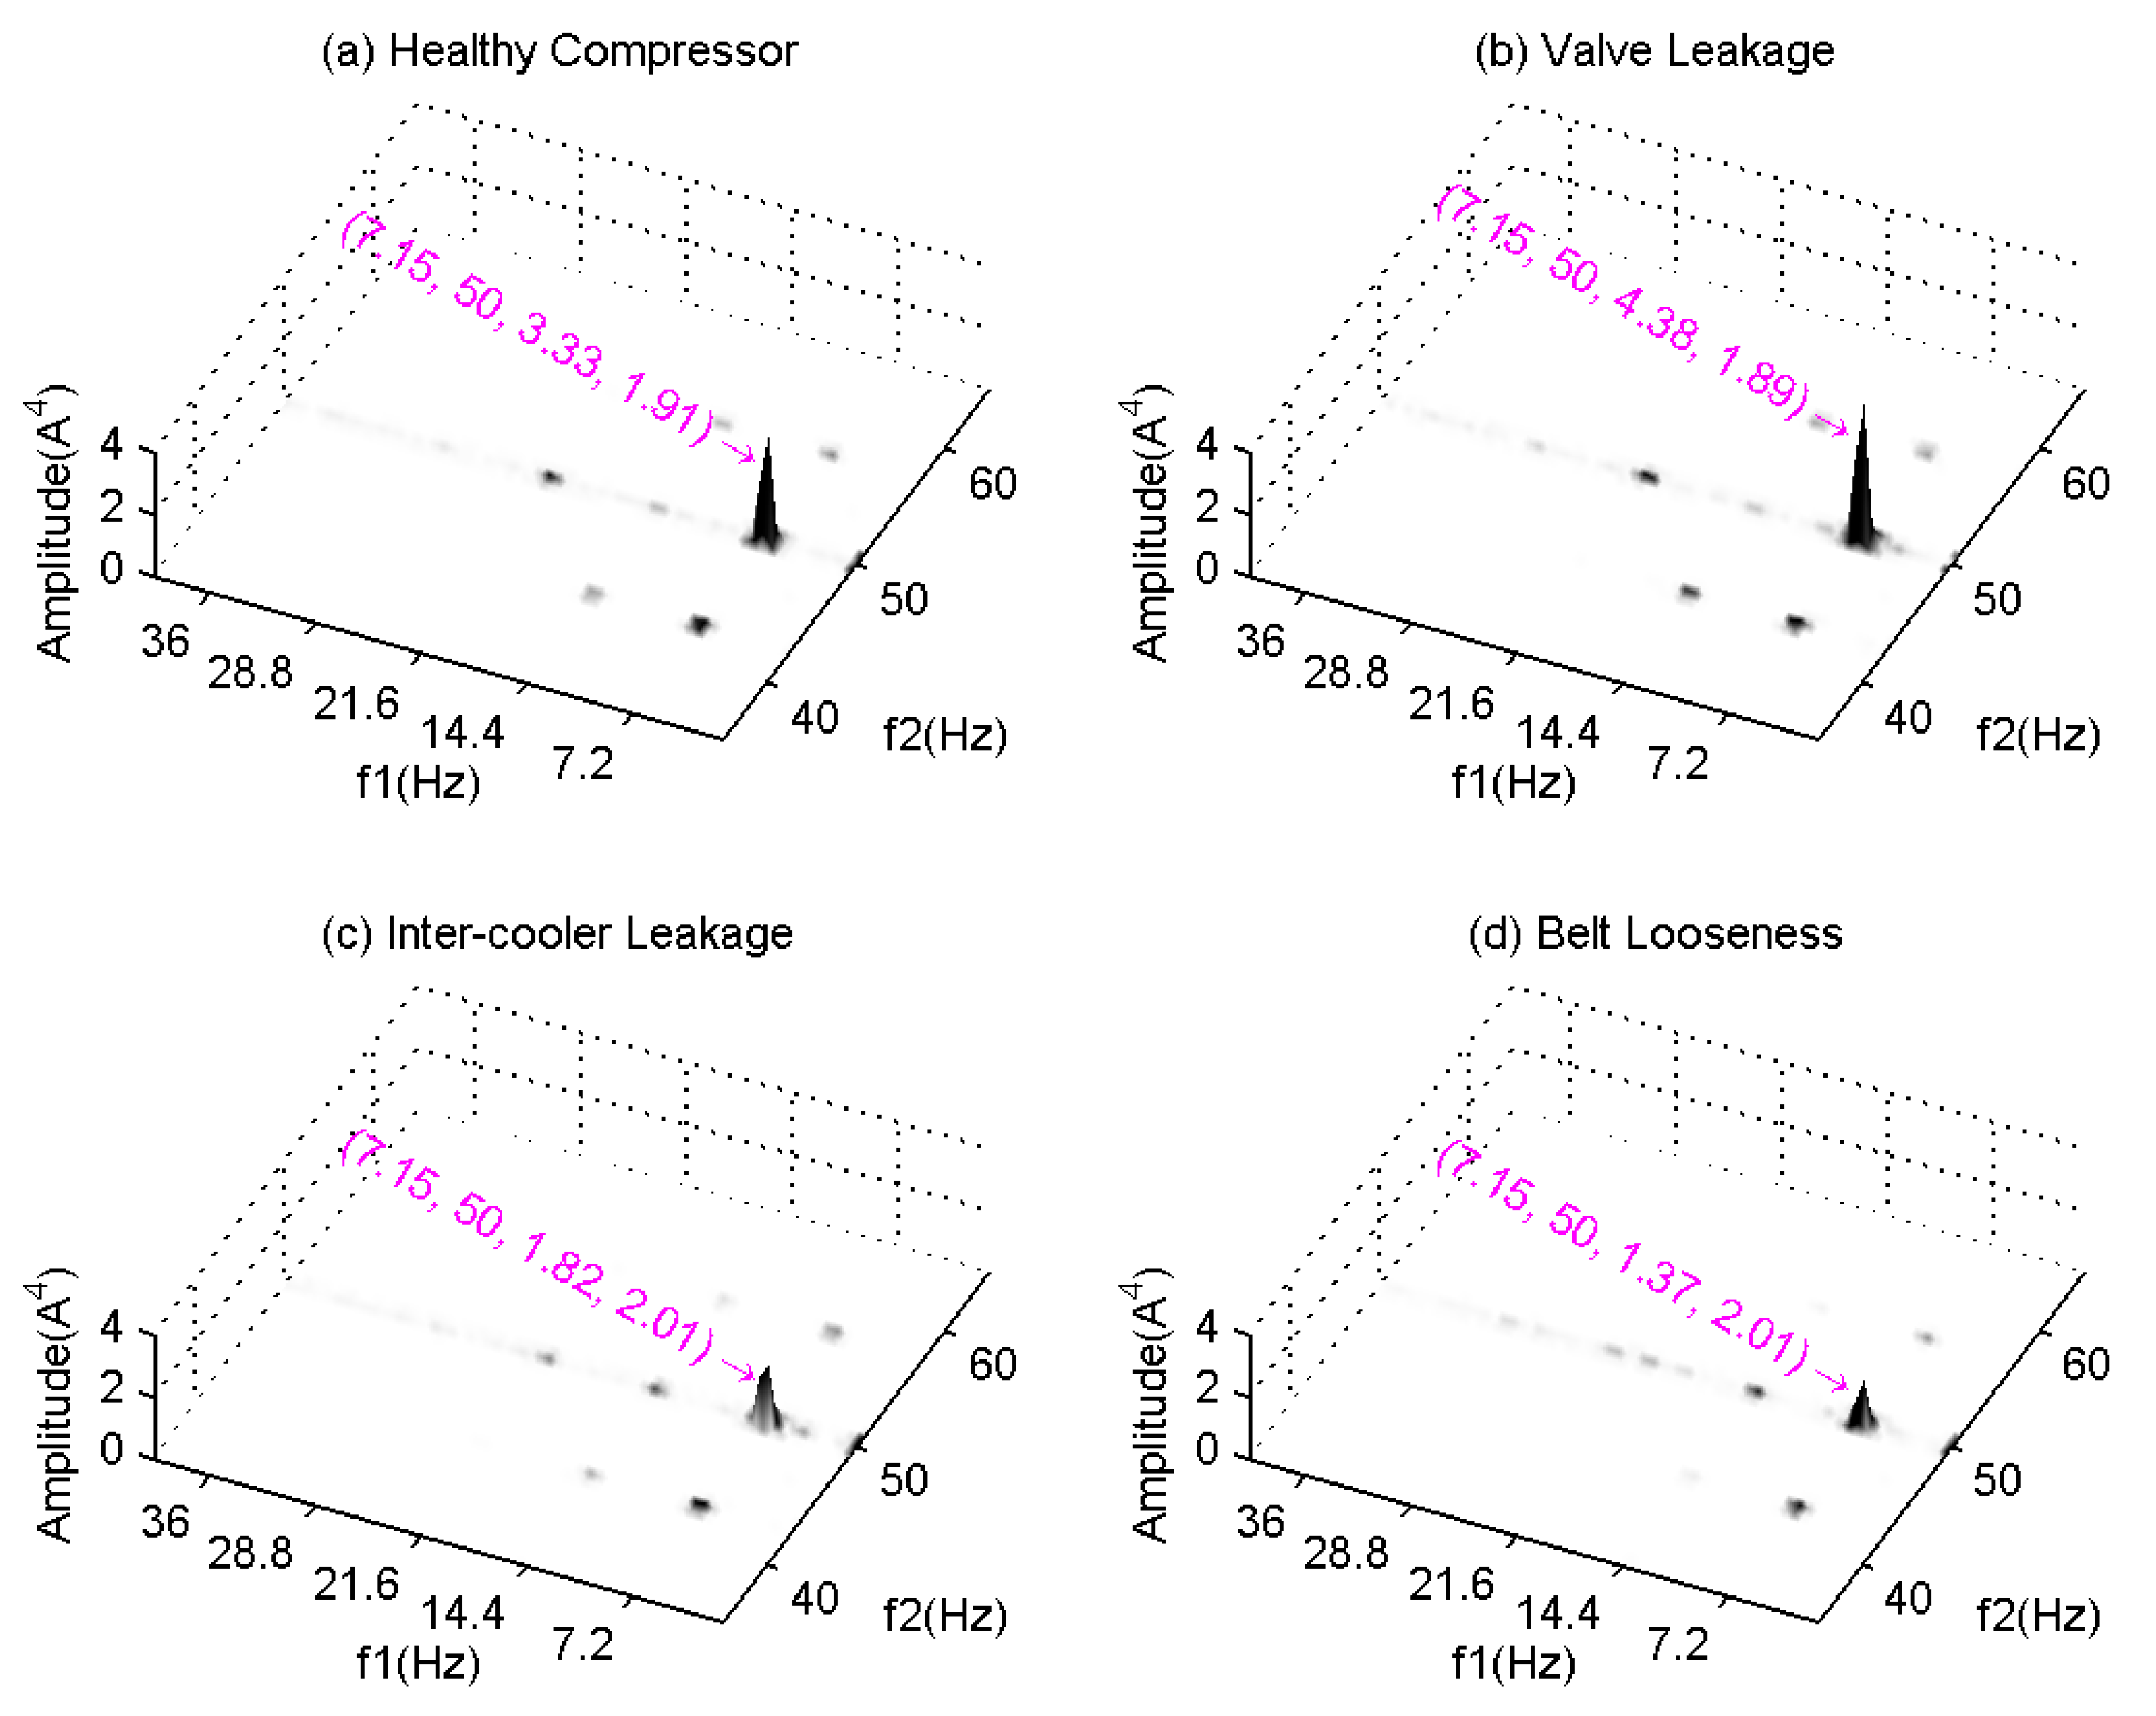
Figure 12 shows the MSB results for the healthy compressor and the three faulty cases. The healthy case exhibits a major peak at the bifrequency (7.15, 50), which relates to the compressor working frequency. In addition, the MSB peaks at bifrequencies (7.15 × 1, 50 − 7.15) Hz, (7.15 × 3, 50) Hz and (7.15 × 2, 50 − 7.15) Hz also clearly show up in the figure. These peaks indicate that higher order harmonics of the compressor working frequency also produce nonlinear interactions and may be relied on for differentiating between the faulty cases.
The main peaks at the bifrequency (7.15, 50) can be found to be different from the healthy case, and there is also a difference between the three faulty cases. The magnitude of the main peak for a faulty valve is about 30% higher than that of the healthy case, showing that valve leakage leads to higher cylinder pressure, which in turn produces a higher nonlinear interaction between the compressor operating frequency and the fundamental component, indicating more fluctuations in the operation of the compressor. A similar reason explains why the intercooler leakage leads to a lower cylinder pressure but alters the torque pattern to the motor. Therefore, the main peak in the MSB must be reduced, and this changes the height of the secondary peaks. In particular, the peak at (3 × 7.15, 50) Hz has been reduced significantly. In the same way, the looseness of transmission belt leads to further reduction in both the main peaks and secondary peaks. Obviously, based on these differences, it is straightforward to implement fault detection and diagnosis.
In addition, MSB phases for the main peaks are around 2.0 rad, which is a similar range to that of the gearbox case, showing that the coupling is due to speed oscillation rather than BRB.
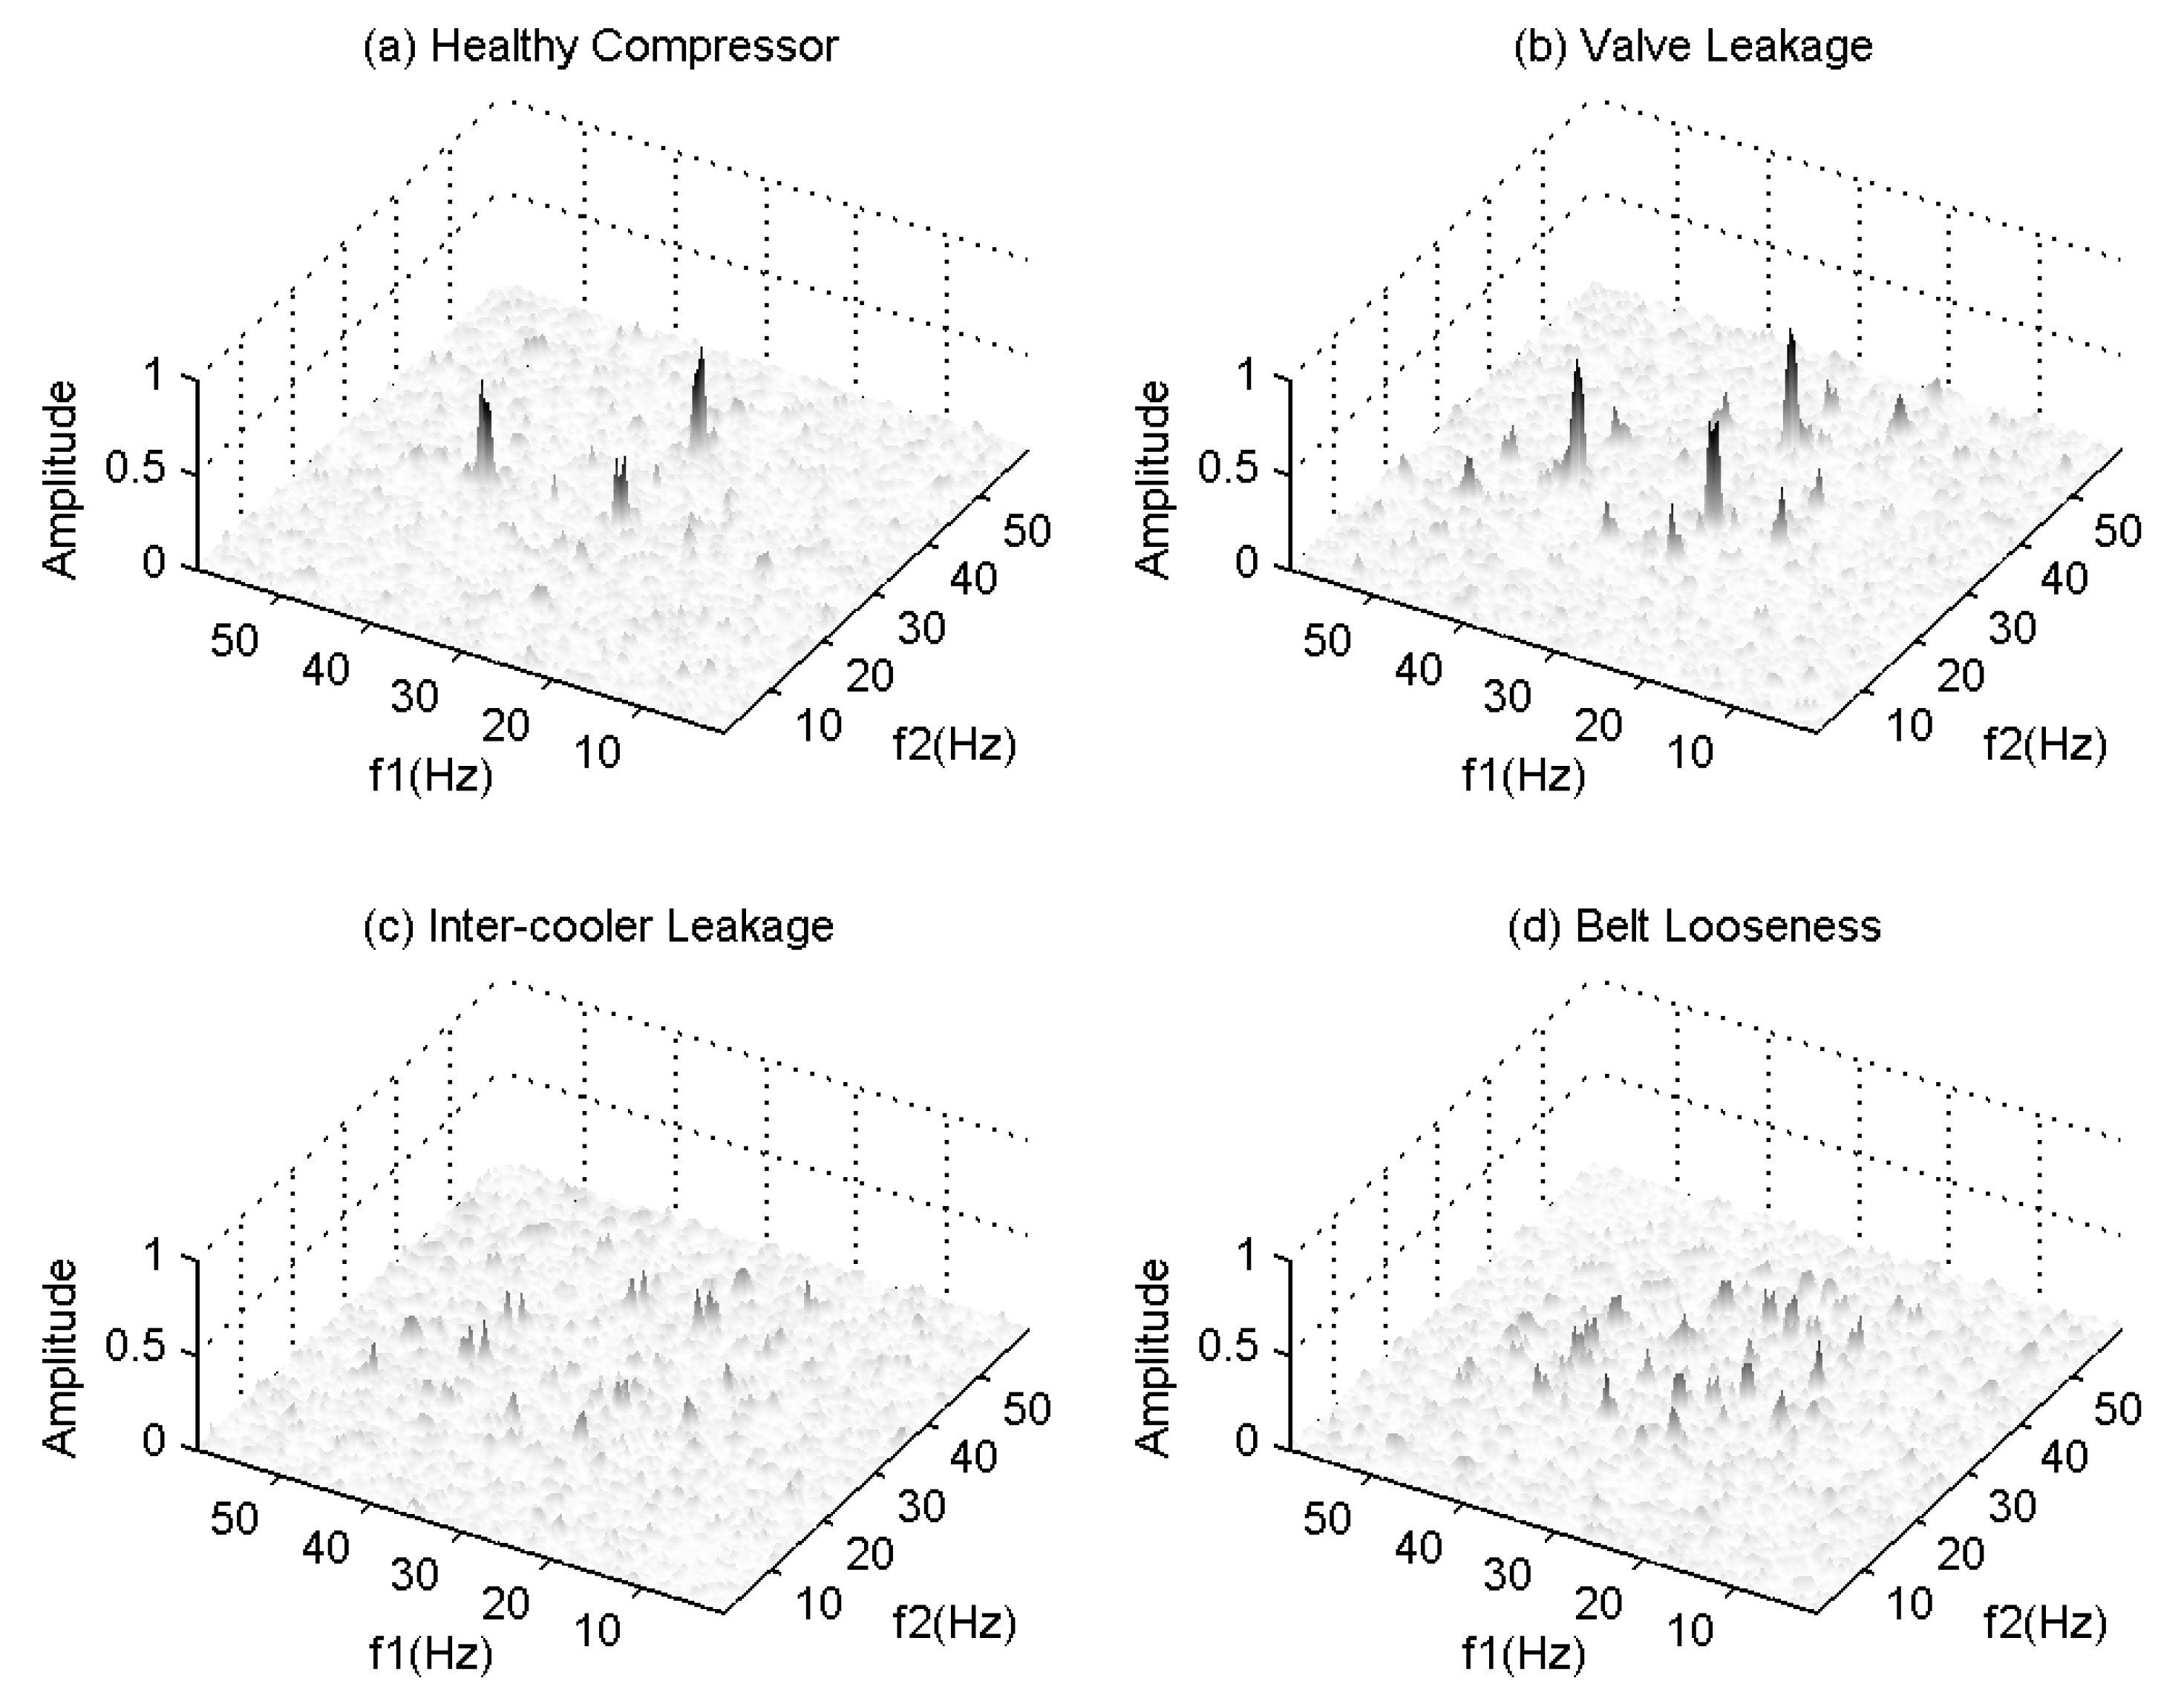
Likewise, the MSB coherences in
Figure 13 exhibit very similar characteristics in their corresponding MSBs. Moreover, because many of the peaks have amplitudes as high as 1, this indicates that the peak values in MSB are accurate and hence are reliable for diagnosis, giving clearer results than just processing the signal by power spectrum.
5.3.2. CB-Based Detection and Diagnosis
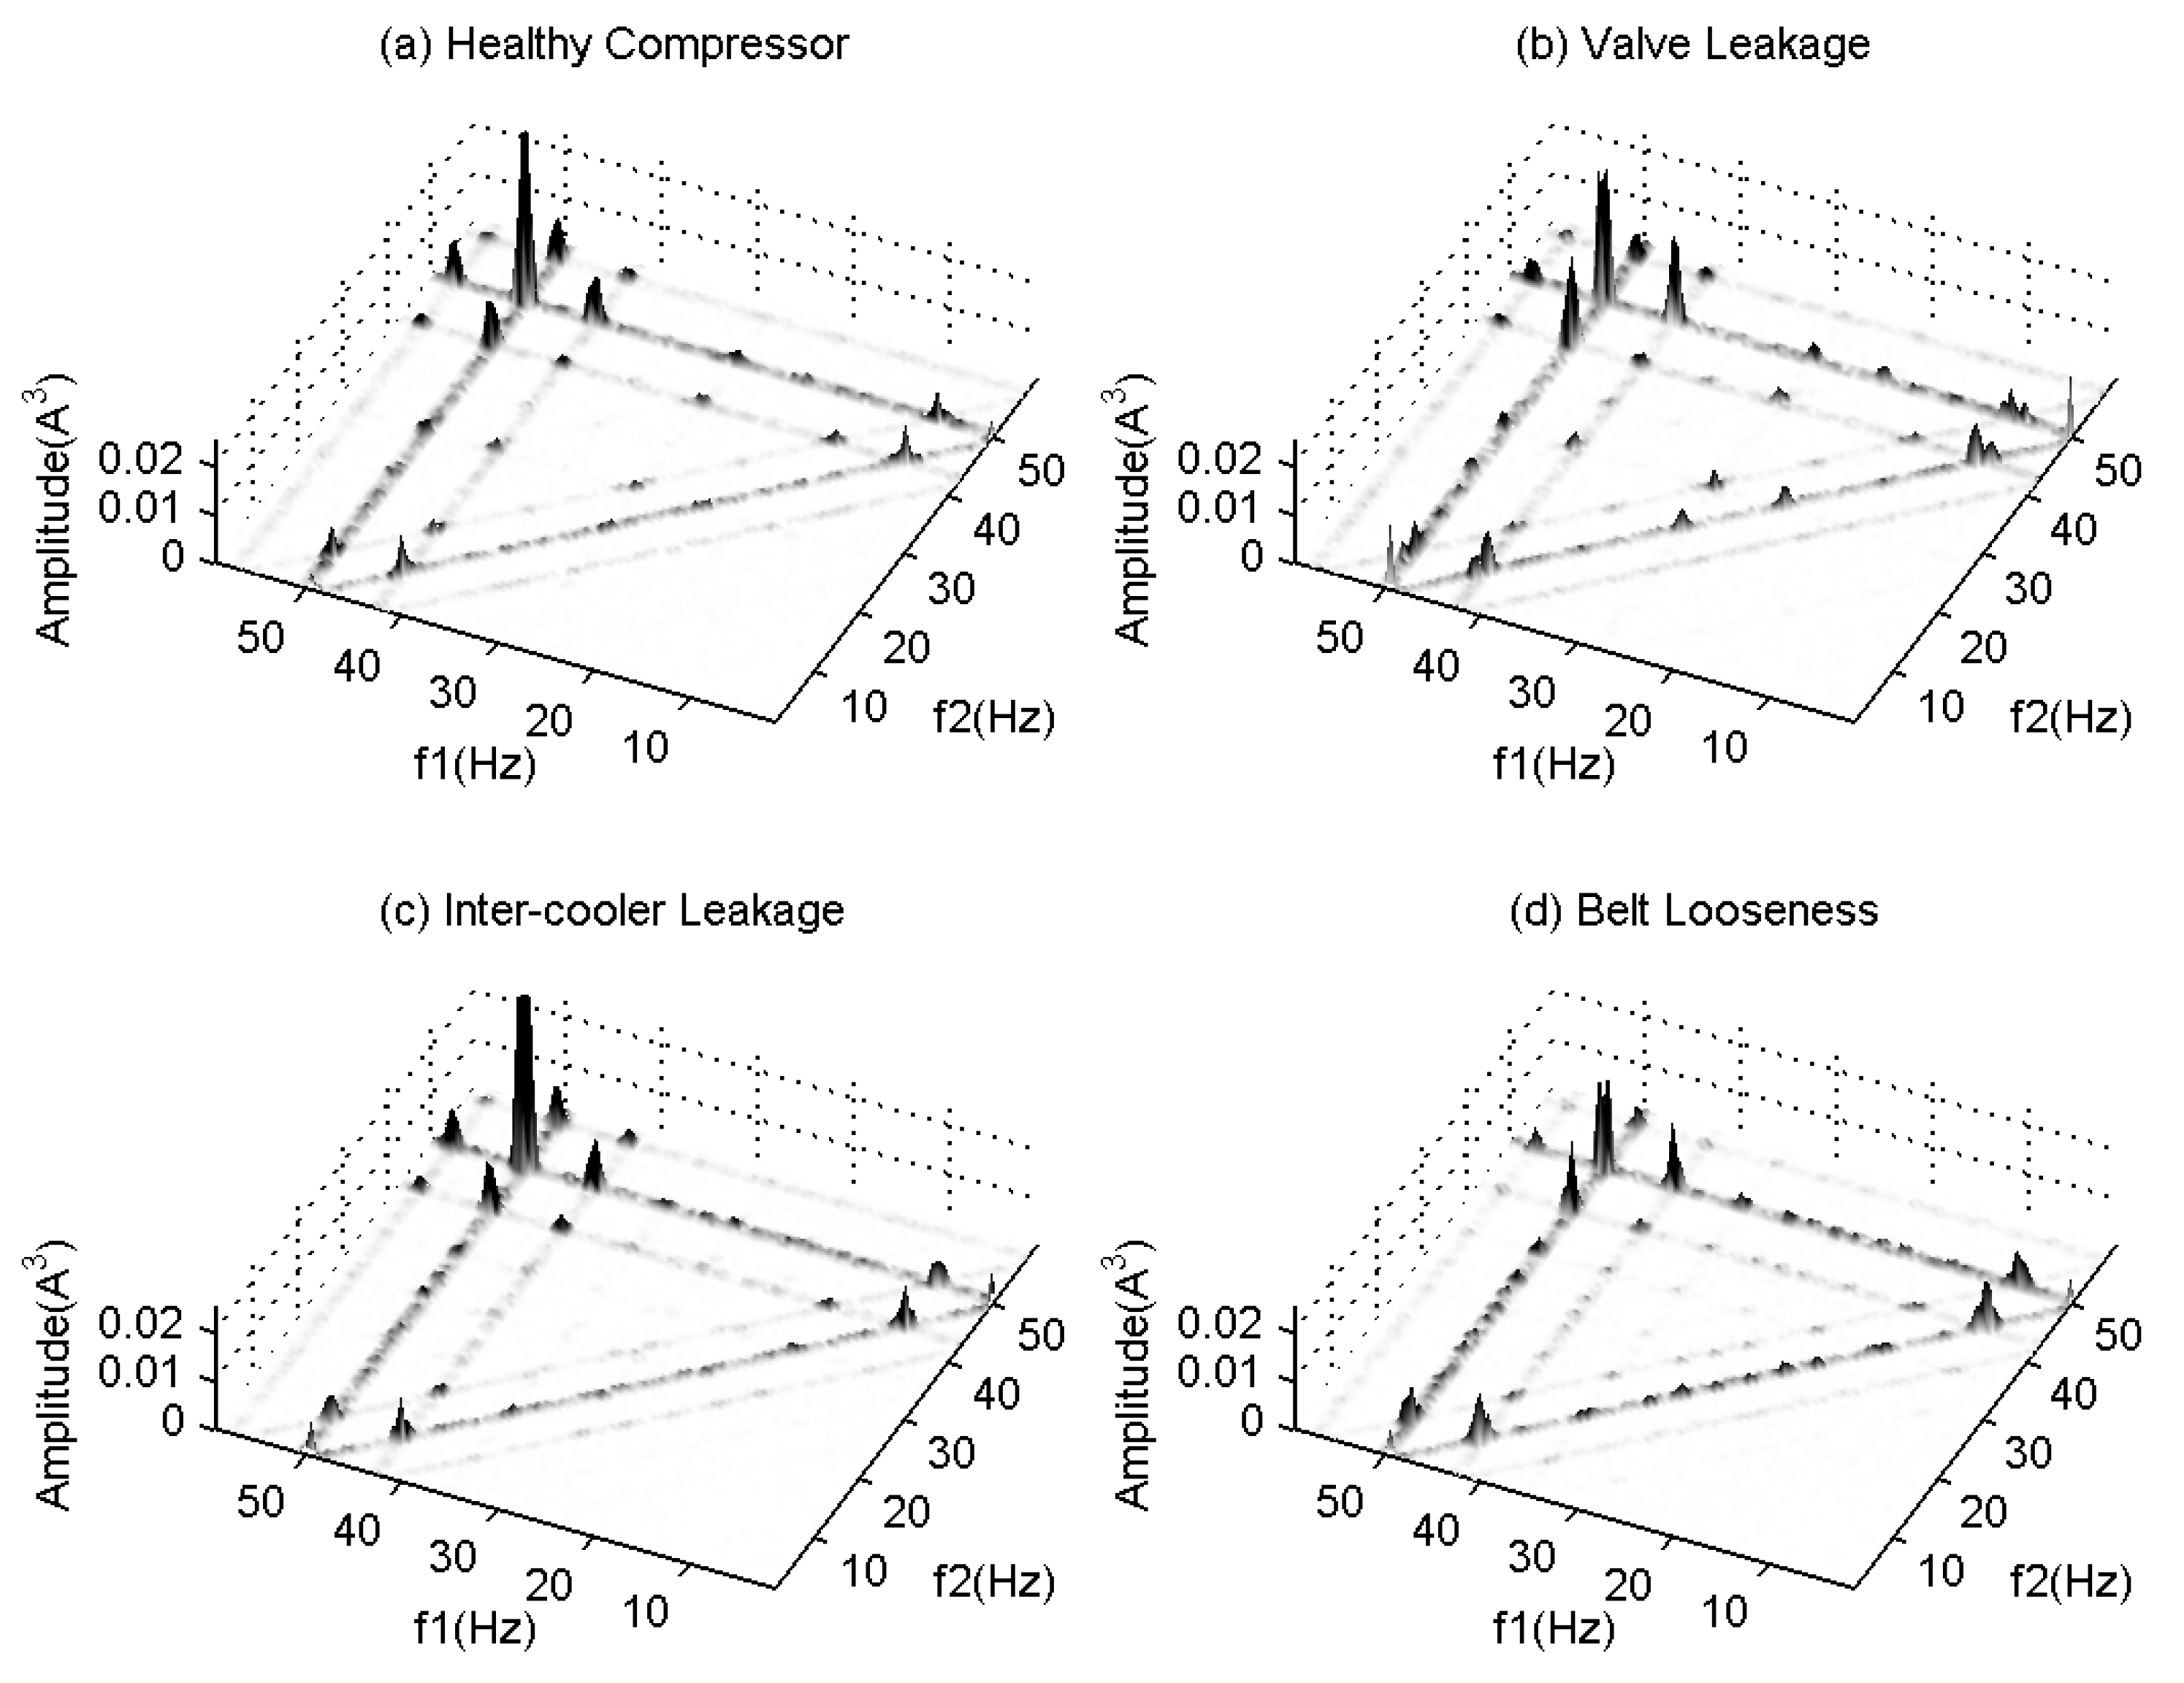
The CB results in
Figure 14 show peaks at bifrequencies (50 ± 7.15, 50 ± 7.15) Hz and (50, 50) Hz. The former relates to the component of the working frequency. However, their corresponding coherences shown in
Figure 15 do not support the existence of significant peaks because the values are at the same level as the background noise. Similarly, the peak at (50, 50) Hz is also not supported by its corresponding coherence results.
The CB coherences show different peaks. For the healthy case and valve leakage case, the peaks are at (50, 50 – 1 × 7.15) Hz, (50 – 1 × 7.15, 50) Hz and (50 − 2 × 7.15, 50 − 2 × 7.15) Hz, with values of around 0.5 rad. These may indicate the existence of PC effects and can be used for detection and diagnosis, even though the coupling degree is slightly lower. In particular, the peak values for the valve leakage are slightly higher, showing more of a phase coupling effect, which is consistent with that obtained by MSB. However, these PC effects become much weaker for the other two cases due to changes of their torque profiles, which are also in line with the MSB results. Therefore, based on the differences in the coherence peaks and distribution patterns, it is possible for CB coherence to both detect and diagnose the compressor faults. This means that, for a strong modulation process, there may exist potential PCs because of its rich high-order harmonics.
6. Conclusions
Faults in rotor systems driven by induction motors can cause additional motor current components which modulate the fundamental component. In the power spectrum, they may be seen as asymmetric sidebands around the supply fundamental with very low amplitudes. The magnitudes of the sidebands are related to the severity of the fault and the phase summation, or the difference will remain constant under steady operation.
To extract these small components, an MSB analysis is particularly effective as it takes into account the sideband phase information and results in a more accurate estimation of the sideband magnitudes. This is achieved by suppressing the influence of random noise on the motor operation and the measurement process. From the simulation studies, it is confirmed that MSB allows all different nonlinearities, including PM, AM and harmonic PC, to be characterised, whereas CB is only useful for detecting the PC. Moreover, the accuracy of sideband estimation by MSB is much higher than that of CB and power spectrum.
By applying both MSB and CB methods to the current signals from different types of motor-driven systems, it has demonstrated their capabilities as well as a comparison of their efficiency, in particular, with the following findings:
The MSB allows the three different degrees of BRB to be detected and diagnosed by using the change of MSB magnitudes. However, the CB is unable to capture any of these faulty components by either its magnitude or coherence results.
The MSB in association with its coherence allows the degree of tooth wear in both the pinion and the gear to be represented accurately even if the fault occurs at a distance away from the motor in which the signal is measured. However, the CB has not shown any useful information of the fault even if the signal has multiple modulations which result in significant nonlinear coupling components in the measured signal.
The high performance of the MSB coherence and the high accuracy of the MSB magnitude allows the faults from a two-stage reciprocating compressor to be detected and diagnosed appropriately, even if the faults cause both higher and lower MSB magnitudes in comparison with that of the baseline. Meanwhile, the CB analysis also shows differences between the four tested cases, showing that CB is able to monitor the large harmonic components existing in the signals which result from the high level of modulation.
Note that even though the performance of MSB is outstanding, it must be used in conjunction with its coherence for identifying small nonlinear coupling components before estimating the MSB magnitude.
