1. Introduction
Renewable energy sources are recently becoming one of the most promising topics of energy systems and policies in most countries. Among the different renewable sources, photovoltaic generation plants have reached a fast growth in the last decades with capacities ranged from small residential application to large-scale grid-connected commercial projects [
1]. At present, among all countries, in USA, China, and Germany medium and large-scale photovoltaic power plants (PVPs) have drawn more attention. With the rapid increase in the penetration level of such renewable sources and dispense with the conventional power plants, power systems are anticipated to face changes in their steady-state and dynamic performance. Consequently, integrating high generation from irregular PVPPs creates supplementary challenges to support the transmission networks stability, not only during normal operation but also in the occurrence of abnormal disturbances [
2,
3]. These abnormal conditions include different types of faults, to which a bus bar or a transmission line might be subjected (three phase to ground fault, single phase to ground fault, phase to phase fault, and etc.), tripping of a mean transmission line, outage of large conventional generating stations and heavy change in load. Accordingly, the expected operating scenarios should be directed and studied in anticipation in order to maintain the transmission network’s stability and the power supply reliability throughout the days and nights.
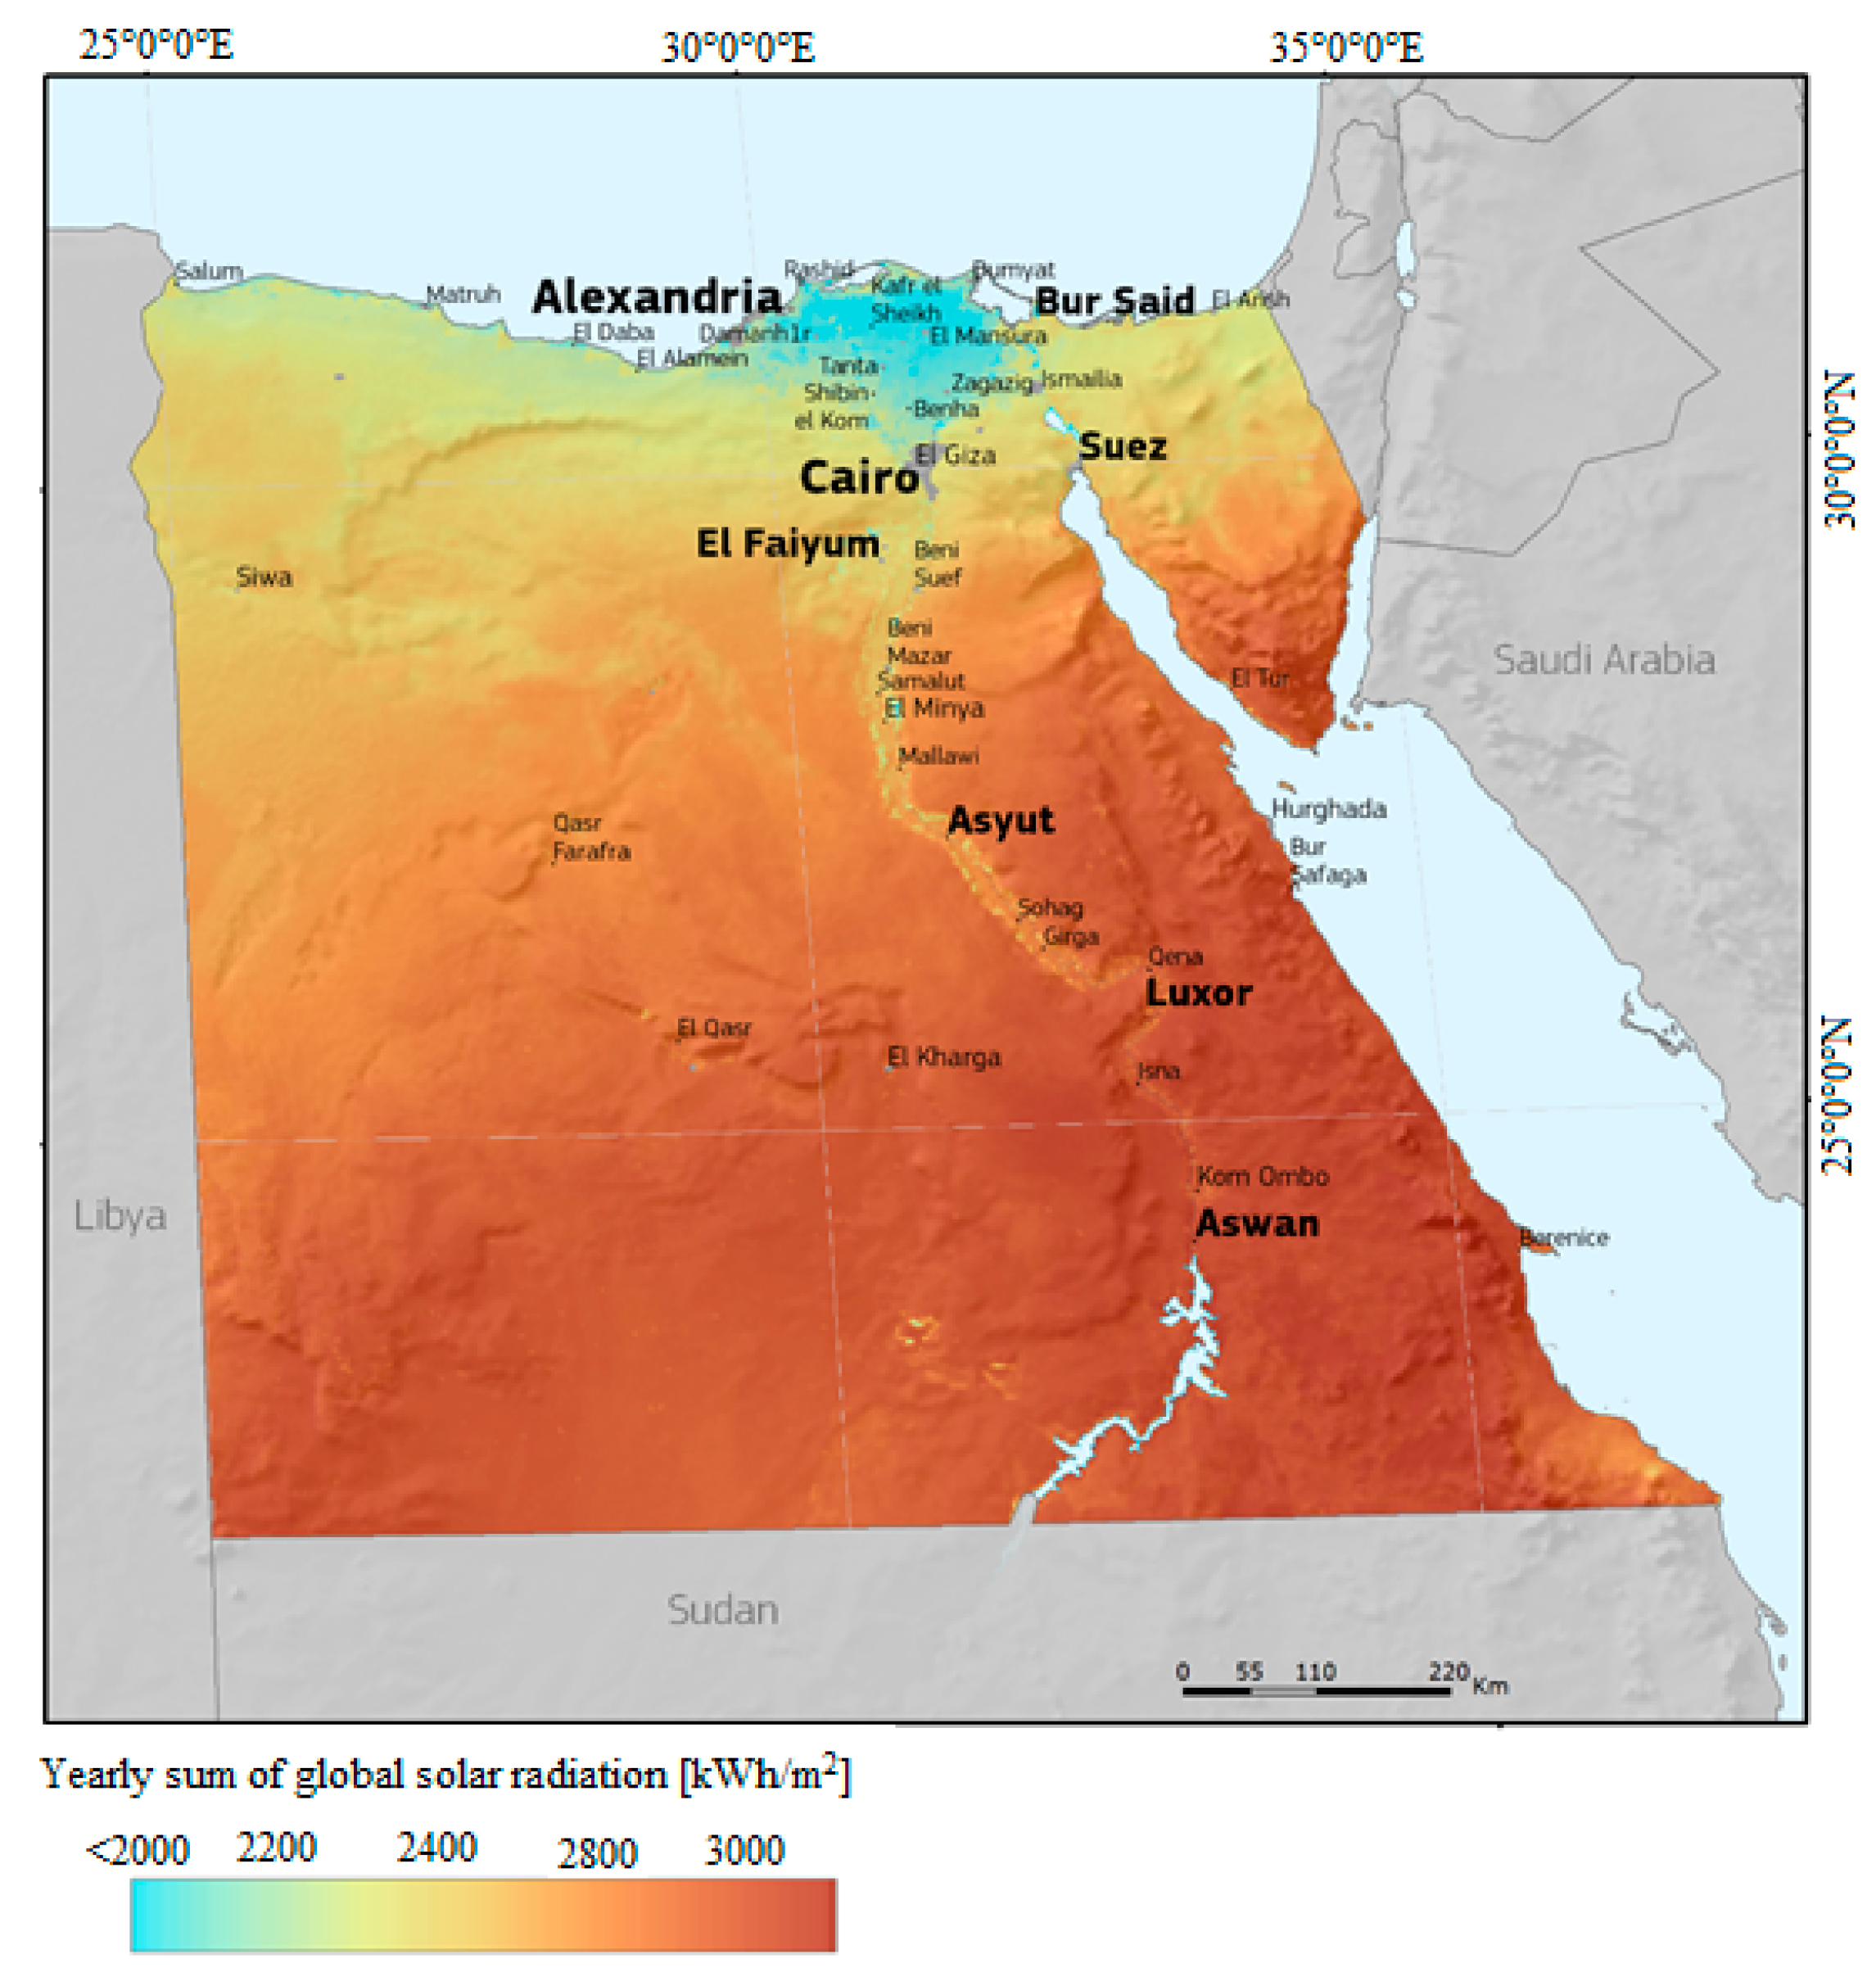
Egypt is rich in renewable energy resources as it is one of the countries located in the solar belt region, which is most suitable for implementation of solar energy projects. The results of Atlas Egypt, depending on the average values of the last 20 years, show that the solar radiation in average ranges between 2000–3200 kWh/(m
2 year) and the duration daily sunshine hours fluctuates between 9–11 hours/day, which creates good opportunities for investment in different fields of solar energy [
4,
5]. Global horizontal irradiation (GHI) over the territory of Egypt is presented in
Figure 1. According to the annual report of the Egyptian electricity holding company (EEHC) published in June 2016, there is a national plan to provide 20% of the demand for energy from renewable sources by 2027, while in this plan wind energy provide 12%, hydroelectric 5.8% and solar energy 2.2%. The plan anticipates significant participation from the private sector, which planned to reach 67% of the desired generation in the plan of the New and Renewable Energy Authority [
6,
7]. Renewable Energy sector plans to implement 51.3 GW from nonconventional energy sources to the present installed capacity of the national power system. The first integration of renewable sources of energy was in 2011 from the solar thermal part of the power station built in Kuraymat in the south of Egypt with a share of 20 MW from a total capacity of 140 MW. A 10 MW solar photovoltaic plant has entered service in 2015 in the Siwa Oasis in Western Sahara [
4]. At the present time, Egyptian electricity holding company is coordinating to take the administrative steps to complete the agreements, which control the process of purchase of the generated energy from the private sector’s projects. The project has a total of capacity of 1000 MW distributed as follow: a wind farm in Suez Golf with an installed capacity of 250 MW, a 200 MW photovoltaic power plant in Aswan (Komombo), and a project in the west of Nile River with a total installed capacity of 550 MW from different renewable sources [
5].
The connection of renewable power plants with high degrees of generation is not a new matter in the most of the developed countries. Taking into account the reports of the International Energy Agency published in 2014 there are about 20 renewable energy power plant in the world, mainly in China and the USA, with a high level of generation of more than 100 MW. An appreciable number of vendors are taking part in the development of the technology that adapts the unusable energy from the sunlight or the wind into usable electrical energy [
8]. In view of the above, both the supplier and the operator of the grid have to ensure the connection appropriateness of renewable energy sources to the electrical utility. The National Energy Control Center (NECC) and the Ministry of Electricity and Energy in Egypt issue the technical requirements, defined in the Grid Code that has to be accomplished by any renewable energy projects willing to be integrated into the grid [
4,
8]. To bypass costly design changes after installation, the performance of these plants is stimulated and examined to meet the applicable technical requirements at the design and pre-design stage. The special simulators are able to model both renewable sources and the electric utility grid, thus inspecting in advance the plant’s performance, before the process of on-site testing during commissioning.
The impact of PVPPs with high penetrations was demonstrated and different types of power system stability have been studied [
9,
10]. In [
9] using an equivalent model of Ontario utility grid, Eigen-values and voltage stability have been used in a comprehensive study describing the effect of low and high degrees of photovoltaic generation on the power system stability. While in [
10] the impact of PV systems on the short-term stability of voltage has been performed, and the results obtained from this study showed that in the case of voltage sage and the disconnection of PV system, the short-term voltage stability has been strongly impaired. Other authors give attention on the low-voltage ride-through capability of PV power plants with high generation levels [
11,
12]. In brief, the large PV power plants should remain integrated and into the grid utility in instances of heavy disturbance in grid voltage, as the outage of this large power may further deteriorate voltage recovering throughout and after fault time [
13]. The capability to voltage support, because of the integration of PV power plants, has been studied for a wide range of generation [
14,
15]. Voltage stability denotes to the power system’s ability to maintain stable voltages on all buses in the system after deviation from a particular initial operating point. The state of the power system enters the region voltage instability when a disturbance or a sharp increase in the current drawn by the loads results in an unmanageable and continuous drop in the voltage at the buses of the system. Instability of voltage appears in the form of a continuous increase or decrease in the voltages at some buses in the power system [
16]. The breakdown of the voltage is usually related to the demand for the reactive power of the load that has not been met due to the lack of reactive power production and transmission. The system is called unstable, if the magnitude of the voltage at one bus in the system, at least, is decreased when increasing reactive power injected into the same point.
Many authors have investigated the study of the impact of high penetration of PV generation on voltage, frequency and power [
17,
18,
19]. The impact of ambient conditions (Solar radiation and temperature) on the frequency and power of large-scale PV power plant at the point of connection with the grid is conducted in [
20]. Studying the techniques of integrating PVPs and WPPs with high power production into the transmission and distribution networks and their impact on the frequency of the power system has been examined [
21,
22,
23].
The stability analysis of Egypt grid has been discussed in [
24,
25,
26]. The analysis did not take into account the PV systems and its effect on the grid. In [
24], the analysis of the Egypt grid with wind energy plant of Gabl El-Zite wind farm has been discussed. In this reference, the frequency stability did not take in the consideration. In [
26], the impact of small PV plants on the stability and performance of the Egypt grid has been introduced. As a result of the complexity and change of the power system structure of Egypt, more analysis are asked to determine the voltage stability, frequency stability and the requirements to interconnect new large-scale PVPs.
Egypt’s national grid is hugely extended with new cities, which are established related to the population density and with the new growing industrial areas, which demand more energy. This extension will be more and more in the future because of the government plan for industrial development. In this paper, study and analysis of the national grid of Egypt connected with planned PVPs will be presented. The Impact of Large PV Plants with respect to the capacity, frequency and voltage stability of Egypt’s national utility grid is discussed in details. Egypt’s national electric network has been simulated and tested using DIgSILENT software (DIgSILENT, 2017) with the connection of the suggested PVPs.
DIgSILENT has set standards and trends in power system modelling, analysis and simulation for more than 25 years. The proven advantages of the PowerFactory software are its overall functional integration, its applicability to the modelling of generation, transmission, distribution and industrial grids, and the analysis of these grids’ interactions. It’s considered a software and consulting company providing engineering services in the field of electrical power systems and has a particular interest in the fields of simulation and grid integration of renewable energies. Also, it will allow to for example automatically identify the over/under and loading elements in the power grid, also it can help to identifies exactly the suitable bus that can carry the new load. [
27,
28,
29,
30,
31,
32,
33,
34,
35,
36,
37,
38]. Moreover, DIgSILENT PowerFactory offers a range of load flow calculation methods, including a full AC Newton-Raphson technique (balanced and unbalanced) and a linear DC method. The enhanced non-decoupled Newton-Raphson solution technique with current or power mismatch iterations, typically yields round-off errors below 1kVA for all buses. The implemented algorithms exhibit excellent stability and convergence. Several iteration levels guarantee convergence under all conditions, with optional automatic relaxation and modification of constraints. Many authors use the DIgSILENT as a benchmark to simulate and to analyze the power system load flow problem [
27,
28,
29,
30,
31], Newton-Raphson Load flow method modeling by using DIgSILENT is explained in [
27,
28]. For load flow study and grid simulation, the DIgSILENT is preferred and is recommended in a comparison between many software packages that is because it behaved as it is expected [
27,
28,
29,
30,
31,
32,
33,
34,
35,
36,
37].
This paper is considered as a part of a project studying the influence of the increasing the level of renewable generation from PV and wind turbines. The first step in achieving this work was collecting the real data of the component of high voltage (220 kV) and extra high voltage (500 kV) transmission networks, the data of transformer substation and loads. These data have been obtained from the national energy control center and the annual reports of the electricity holding company. Then, the data were organized and analyzed. Depending on the parameters of system components, a complete model of the national utility grid of Egypt have been developed using DigSILENT PowerFactory platform. After that, the according to the plan of the Ministry of Electricity and Energy and our previous study for selecting the suitable locations of large-scale PV power plants over the territory of the country, four sites of installing PV systems are proposed. The capacities of the proposed PV power plants have been determined by examining the grid capacity at the points of connection with the national grid. The main part of this paper is to study the impact of the PV plants on the performance of the national utility grid. The validated model has been used to study and analyze the impact of the planned PV power plants on the voltage and frequency stability of the national power system. The future work is to consider the impact of the wind energy power plants. Moreover, the combination with facts devices to improve the overall stability of the system will be considered in the research plane.
2. National Electric Grid of Egypt
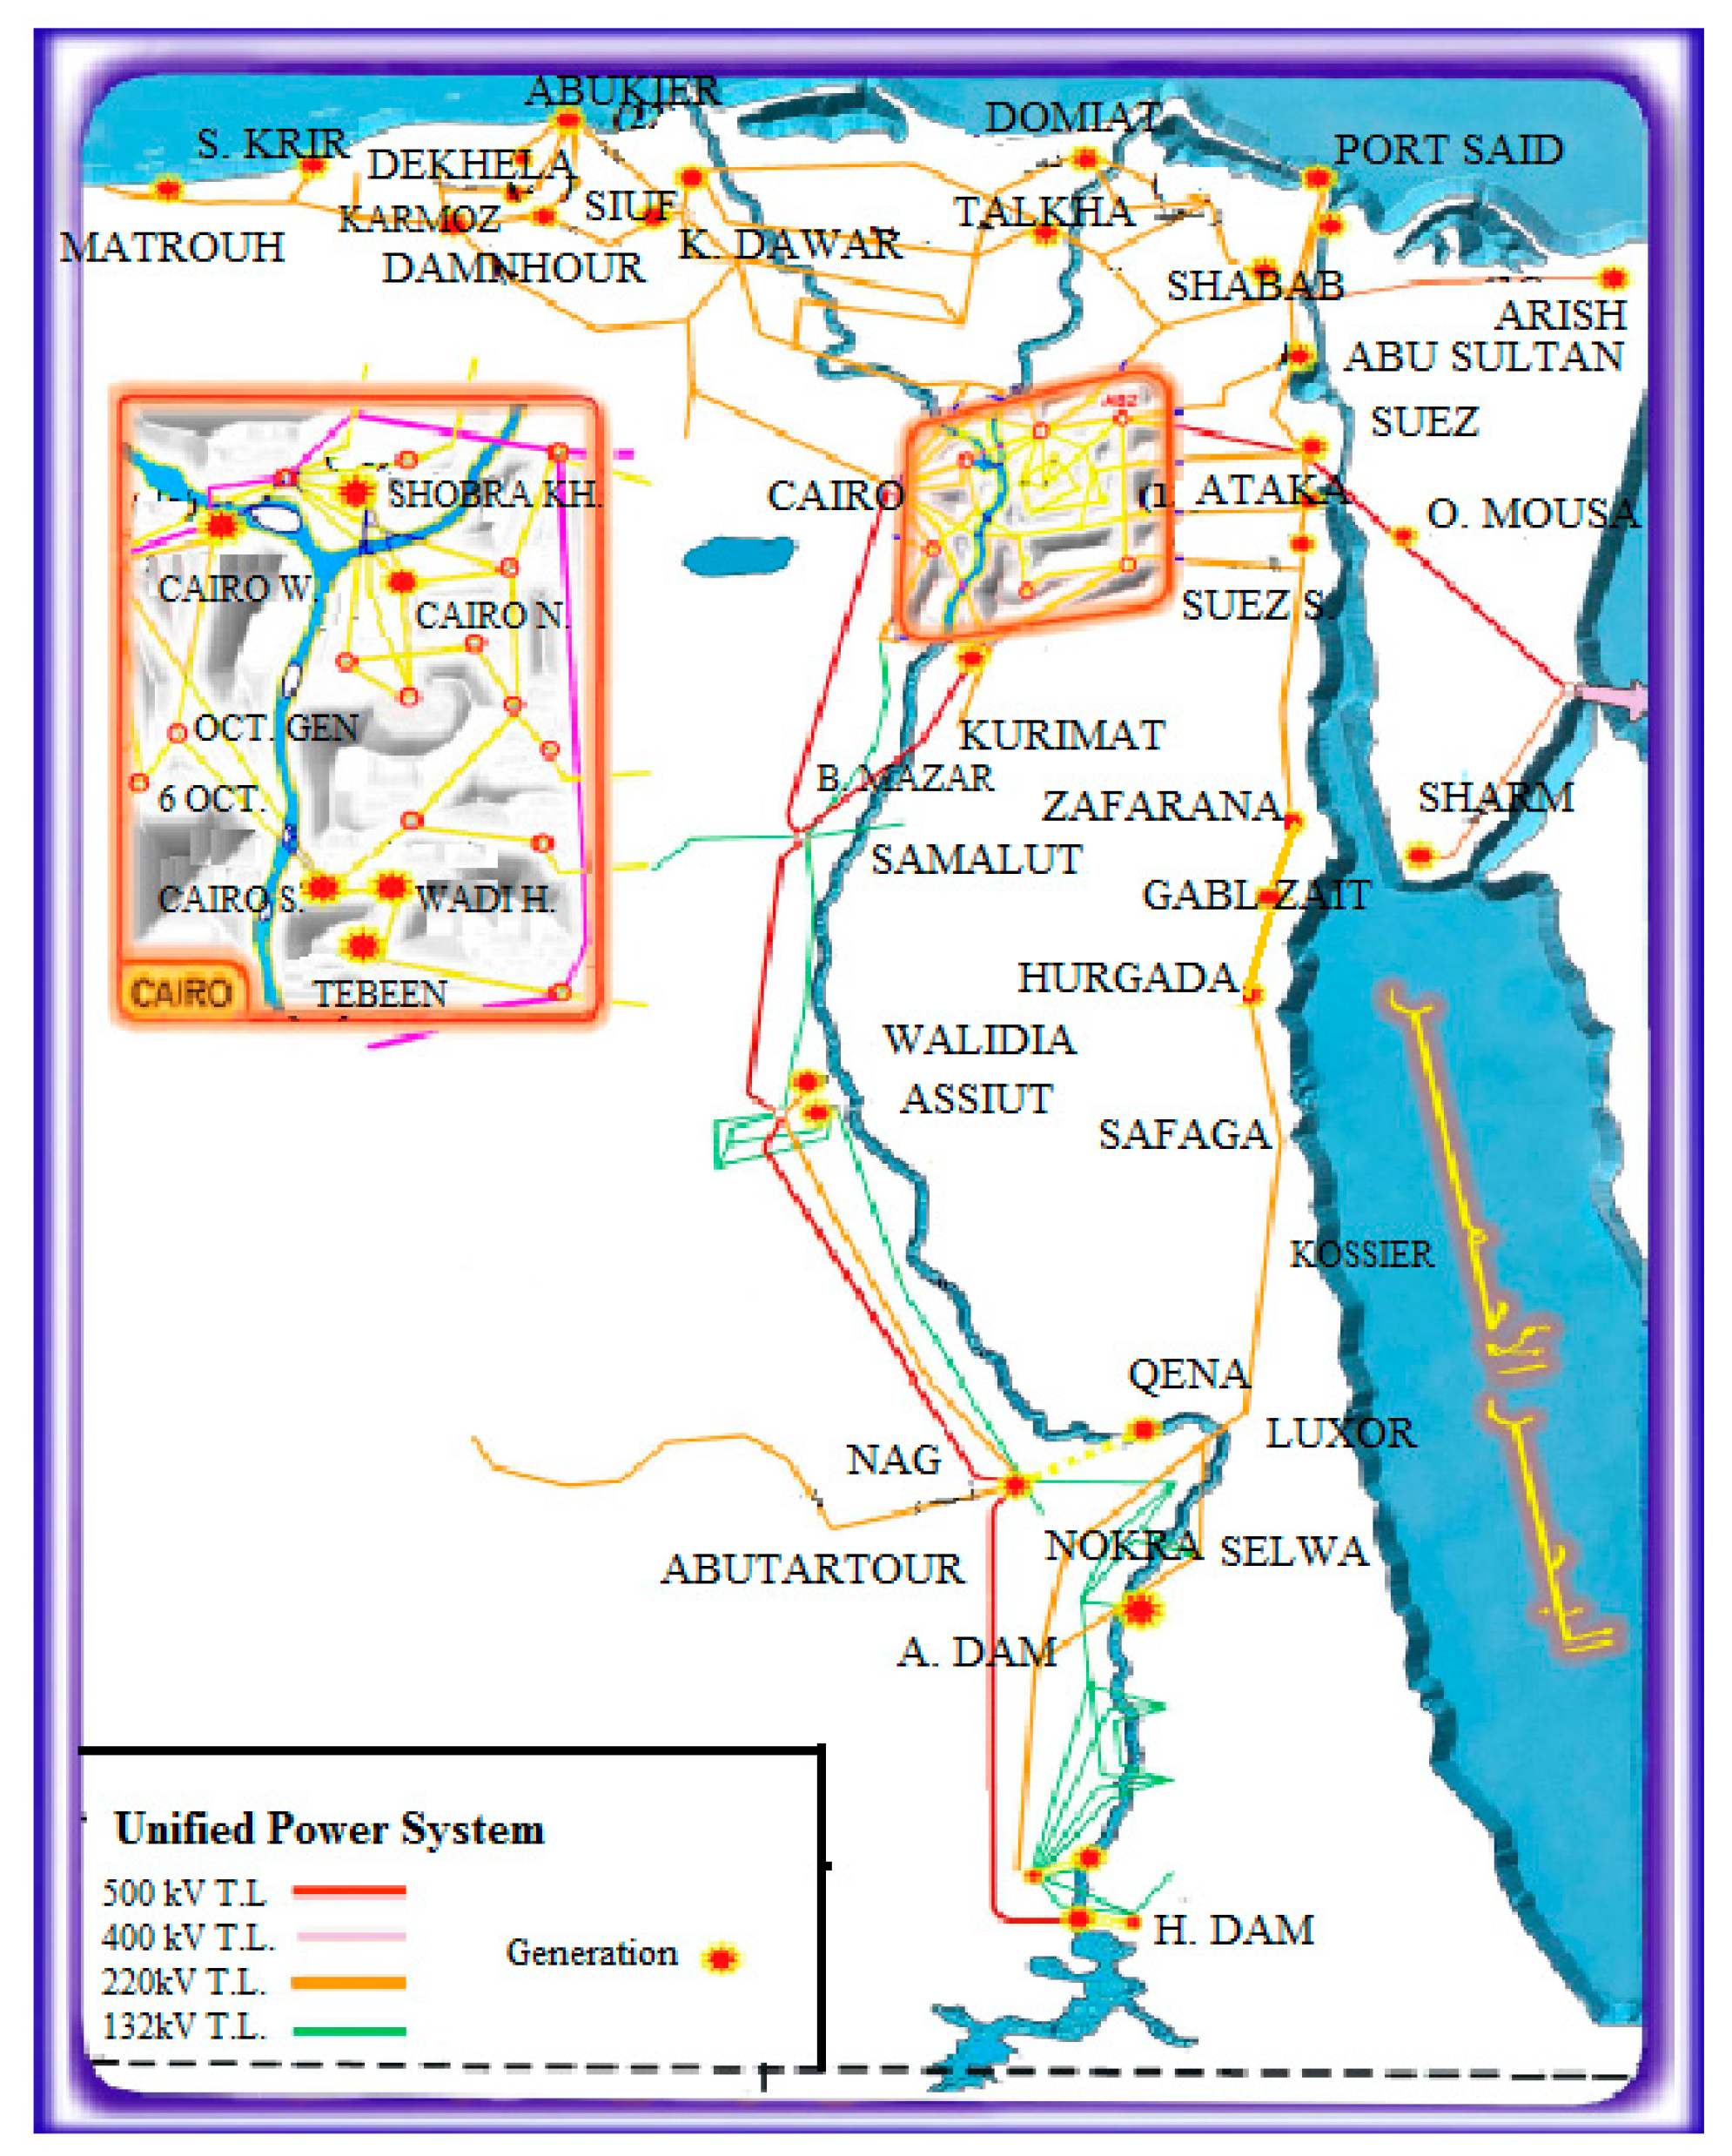
In the last ten years, the Egyptian energy system has witnessed rapid developments. New power stations have been built and extensions in the transmission network were implemented to provide electric energy to the existing loading centers as well as access to most isolated systems. A model for the electric utility grid in Egypt, which may be suitable for academic as well as research purposes, has been explored in our previous work [
39]. The starting point towards achieving this objective was the electric map of the unified energy system in Egypt, published on the official website of the Ministry of Electricity and Energy (see
Figure 2) [
7]. Egypt is electrically connected through 500 kV and 220 kV transmission networks, which extended along the Nile River from Aswan in the south to Alexandria in the far north.
The national utility grid under study is modeled, simulated and assessed using DIgSILENT PowerFactory simulation software package [
38]. The following elements were included in the model:
Transmission lines (500 kV and 220 kV),
500/220 kV substations,
500/132 kV substations,
220/66 kV substations,
Proposed renewable energy sources and existing conventional plants,
Electrical connection between Egypt and Jordan on the east side,
Electrical connection between Egypt and Libya on the west side.
The demands for electric energy are covered, nowadays, from 38 main conventional steam power plants and at least ten of these stations were built more than 35 years ago, two hydroelectric power plants in the south (High-dam and Aswan-dam), in addition to two wind farms on the shores of Red Sea in Zaafrana and Gabl El-Zait. During modeling, the values of the resistances, inductances, capacitances, thermal limits for 500 kV and 220 kV transmission lines and data of the generating stations were obtained from NECC. The parameters of the transformers are taken in accordance with the power limits of the transmission lines. The 220 kV network is divided into six electric zones, similar to the current reality of power transmission companies in Egypt. Single line diagrams for all these regions in addition to the 500 kV grid and technical information about generating stations, substations, transmission lines and nature of loads have been discussed in details in our previous study [
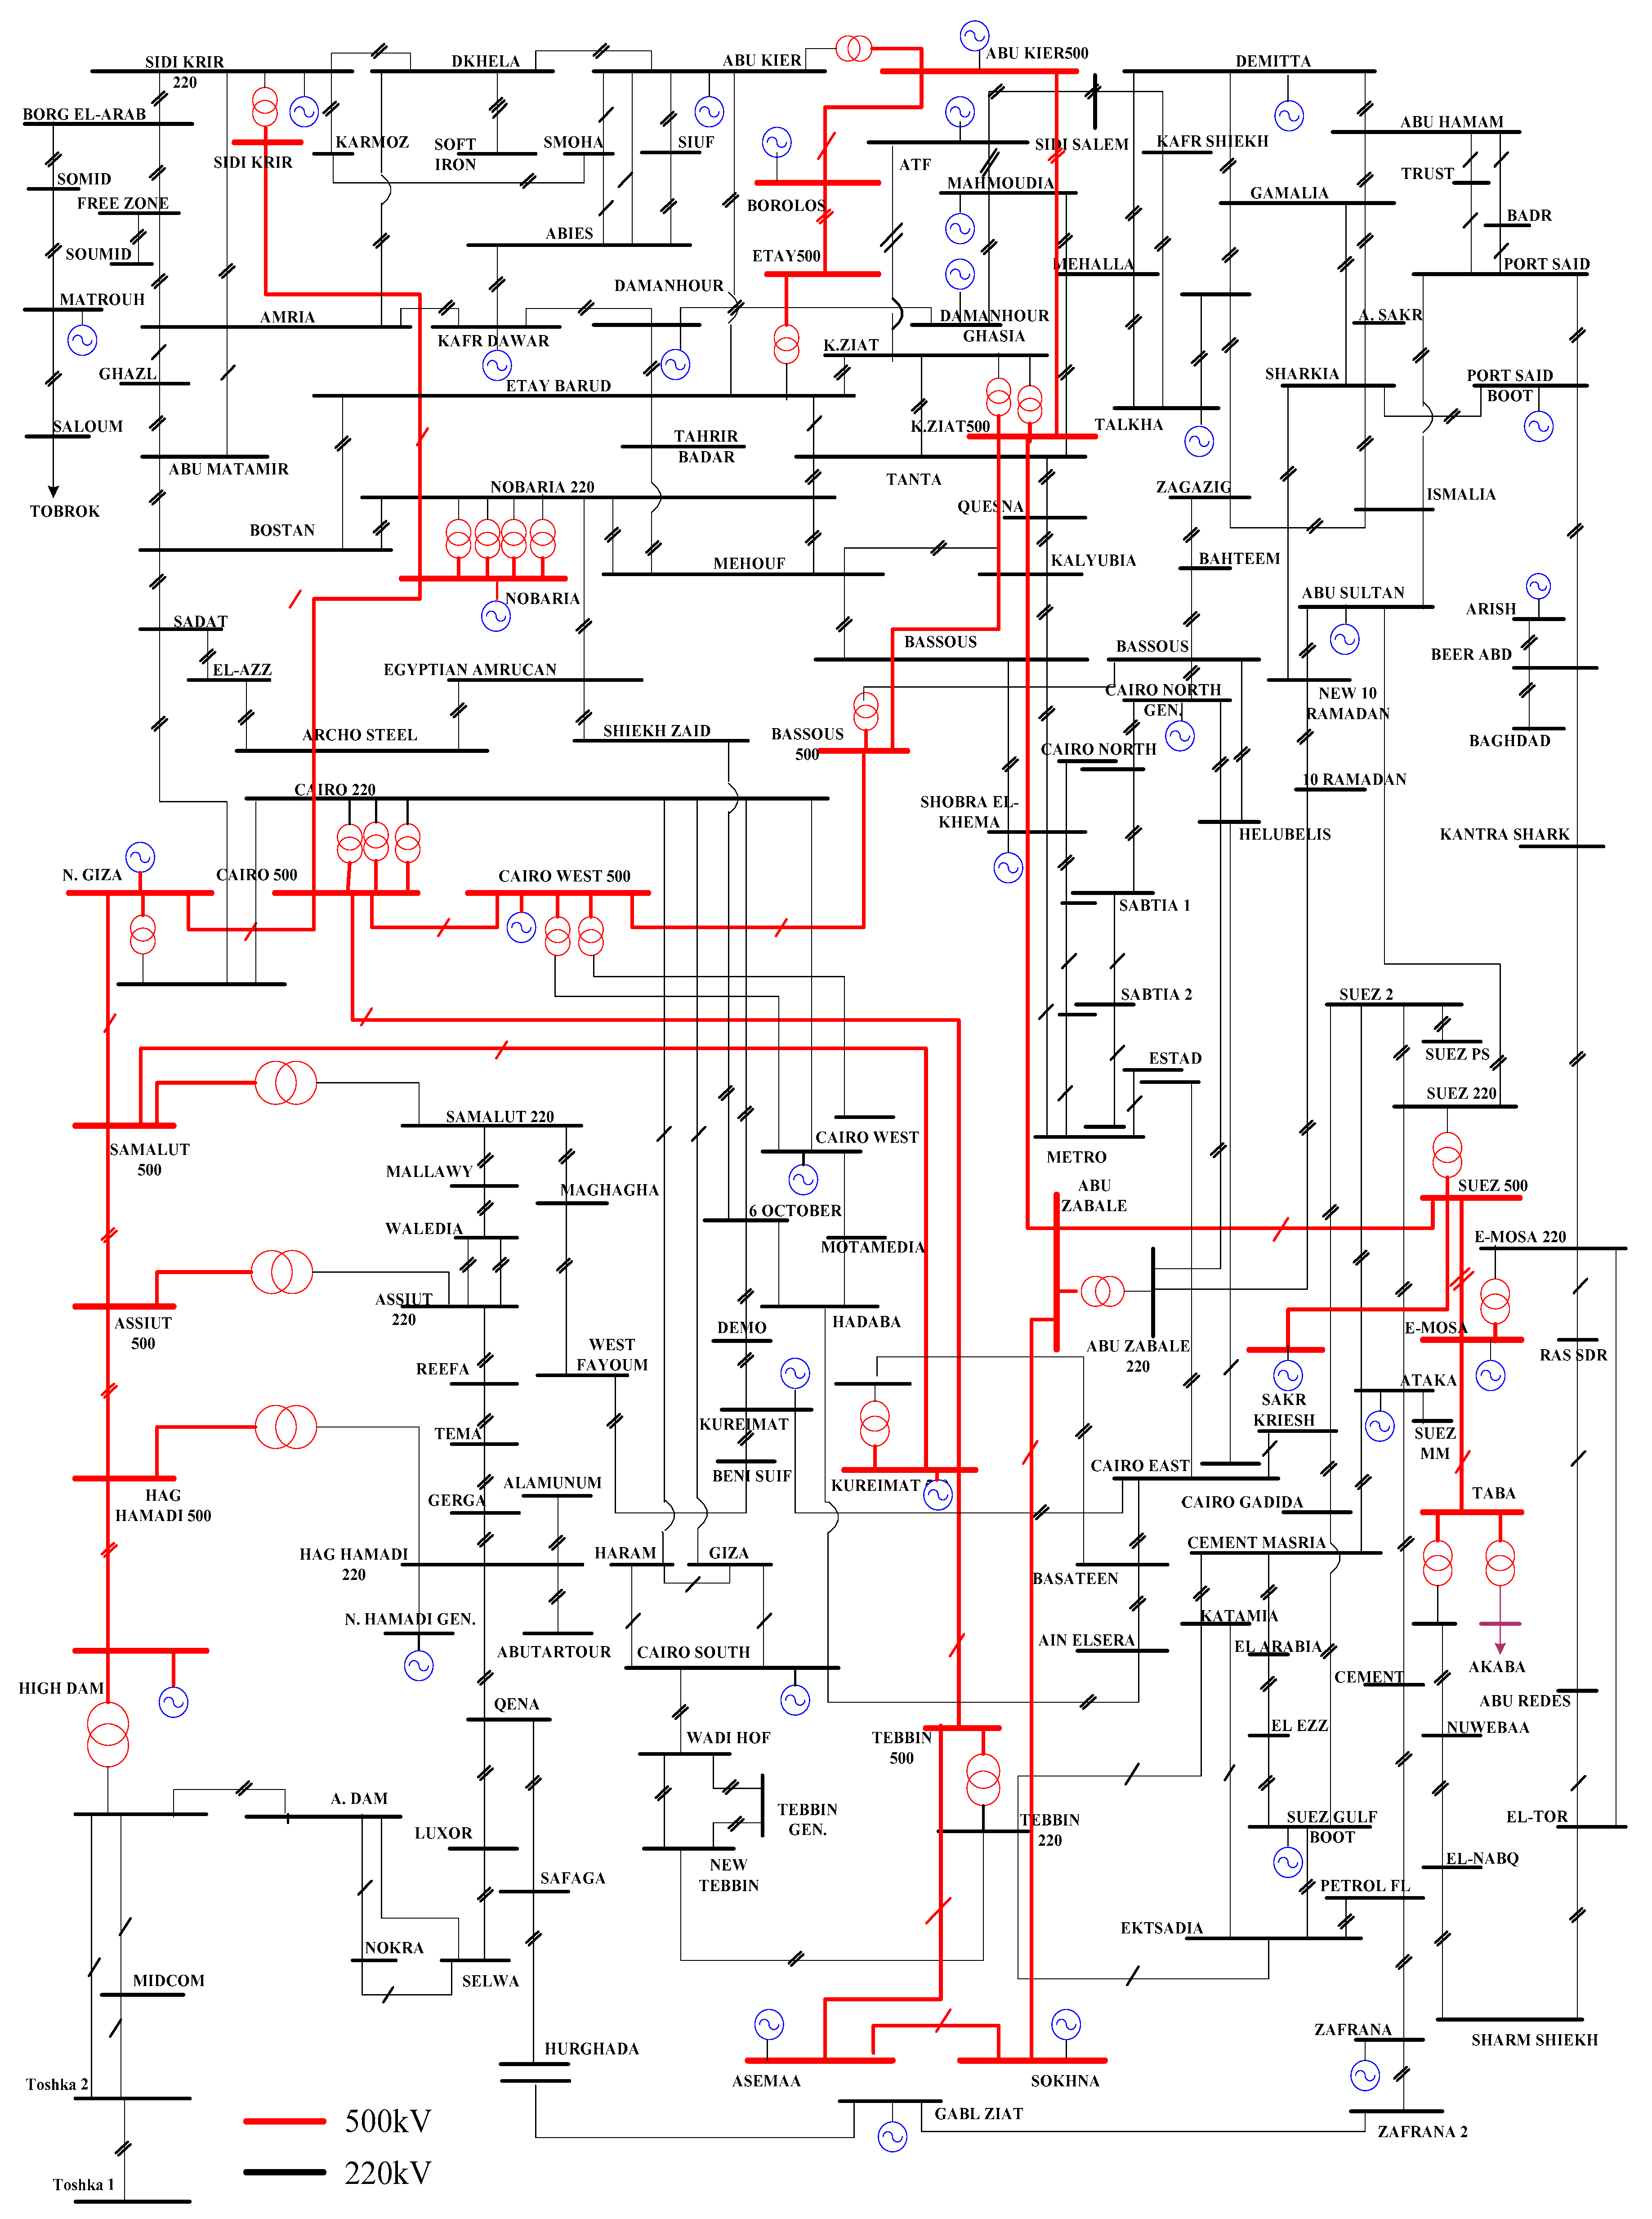
39]. The full model includes 218 synchronous machines, 443 transmission lines, 205 substations, 426 bus-bars, 248 transformers and 369 loads. The capacity of the generating stations which are considered in this study is presented in
Table 1. Moreover, the data specification of the substations has been listed in
Table 2. As stated in the standard of electric energy transmission in Egypt the values of acceptable voltages for different voltage levels under different operating conditions are shown in
Table 3 [
40,
41]. The single line diagram of the power system under study is shown in
Figure 3. For conventional power plants, automatic voltage regulators, turbine governors, and power system stabilizers are also included in the model. The existing library of the simulation software has been used for the representation of wind turbine machines and PVPs.
3. Simulation Results
The technical potential of 27 sites covering all the territory of the country for installation of large-scale grid-connected PV power plants is assessed using software package RETScreen Expert in our previous work [
42]. According to this study, the best sites for installation are located in the south of the country along the Red Sea and in the west to the Nile River. Four sites have been suggested for implementation of the new PVPs in KOMOMBO, KOSSIER, MINIA (B. Mazar) and 6.OCT_PV. For integrating the proposed plants with the existing transmission system, four 220 kV double circuit transmission lines are added as follow: 90 km transmission line from KOMOBO to substation A.DAM with a thermal capacity of 850 MW, 70 km from KOSSIER to substation SAFAGA with a thermal capacity of 500 MW, 15 km from MINIA to substation SAMLUT with a thermal capacity of 1200 MW and 10 km from 6.OCT_PV to substation 6.OCT with a thermal capacity of 1500 MW.
3.1. Grid Capacity Assesment
The Newton Raphson load flow method (PowerFactory software) was used to assess the electric network capacity to integrate PVPs in the case of the steady-state operation of the power system and determine the voltage profile and transmission line’s power limits.
The capacity of the south Egypt region represented by the 850 MW PV power plant in KOMOMBO is restricted by the thermal limits of the 220 kV lines linking A.DAM to NOKRA and SELWA substations. Moreover, the capacity of the Canal region represented by the 400 MW PV power plant suggested in KOSSIER is restricted by the thermal limits of the 220 kV line between SAFAGA and HURGADA Substations. The capacity of the third site in B. Mazar (MINIA) of 1200 MW to a certain degree bounded by the overloading of the 500 kV line connecting SAMLUT500 and NORTH.GIZA substations. The capacity of the fourth location of 6.OCTOBER City is comparatively high due to the increase in demand for electric energy in that area, so 1500 MW PV power plant suggested in that location. The capacity of the new PV power plants can be increased to twice its suggested values with installing a third 220 kV line between SAFAGA and HURGHADA, 220 kV line between A.DAM and SELWA substations and another 500 kV line between SAMALUT500 and GIZA N. substations.
3.2. Static Voltage Stability Analysis
Voltage and frequency stability has recently become the two important parameters of electric power quality describing the power system performance. Equally important is to know how the elements of the energy system that can stimulate instability work. The voltage is one of the parameters, which has different values at each node in the power system. The voltage at the nodes of the system relies on the values of the impedance of the different elements, which are in the grid or out of the system such as control and protection devices. For maintaining the imposed voltage level at the node, which has a clear impact on the voltage at other nodes in the same zone, different types of voltage adjusting devices can be used. Electric power specialists concern the techniques used for adjusting the voltage level in the power system. The stability of the voltage within the system nodes is very important in the coordination and operation of the system. Problems of voltage instability led to the blackout of energy systems in countries such as Japan in July 1987, in August 2003 in the United States and Canada, in September 23rd, 2003 in southern Sweden and eastern Denmark, and a few days later in Italy and Central Europe as a result of the cascaded outage [
43].
In the present study, the stability of voltage of the electric utility grid in Egypt is examined by elaborating the behavior of the power system as seen from four proposed locations; namely A.DAM, SAFAGA, SAMALUT, and 6.OCT. As they are considered the most prospected locations for integration of large photovoltaic generations.
The equivalent short circuit capacity (SCC) has been analyzed. Moreover, the basic definitions of short-circuit conditions are given in the IEC Standard 909 [
44]. This standard is based on the calculation of symmetrical initial short circuit current (I"sc), for unloaded networks, i.e., in the absence of passive loads and any shunt capacitance. In order to calculate I″sc, the Thévenin’s Theorem is applied to the unloaded network with a source voltage equal to Vn (Vn being the nominal voltage). IEC specifies two standard values for the factor c. The «maximum value» is to be used for apparatus rating purposes and it is fixed at 1.1 for HV systems. The «minimum value» is to be used for other purposes such as the control of motor starting conditions [
44], which is typical of fast voltage fluctuations problems such as flicker, and it is fixed at 1 for HV systems. The (IEC standard) short-circuit power is then defined as:
The IEC approach perfectly suits either for equipment rating purposes or for non-critical voltage fluctuations problems.
Table 4 presents the equivalent short circuit capacity (SCC), short circuit current and X/R ratio at the four studied locations depending on the short circuit analysis performed used the built-in tools in DigSILENT. The voltage is expected to be more responsive to changes in generated power at sites with less SCC or with higher network resistance.
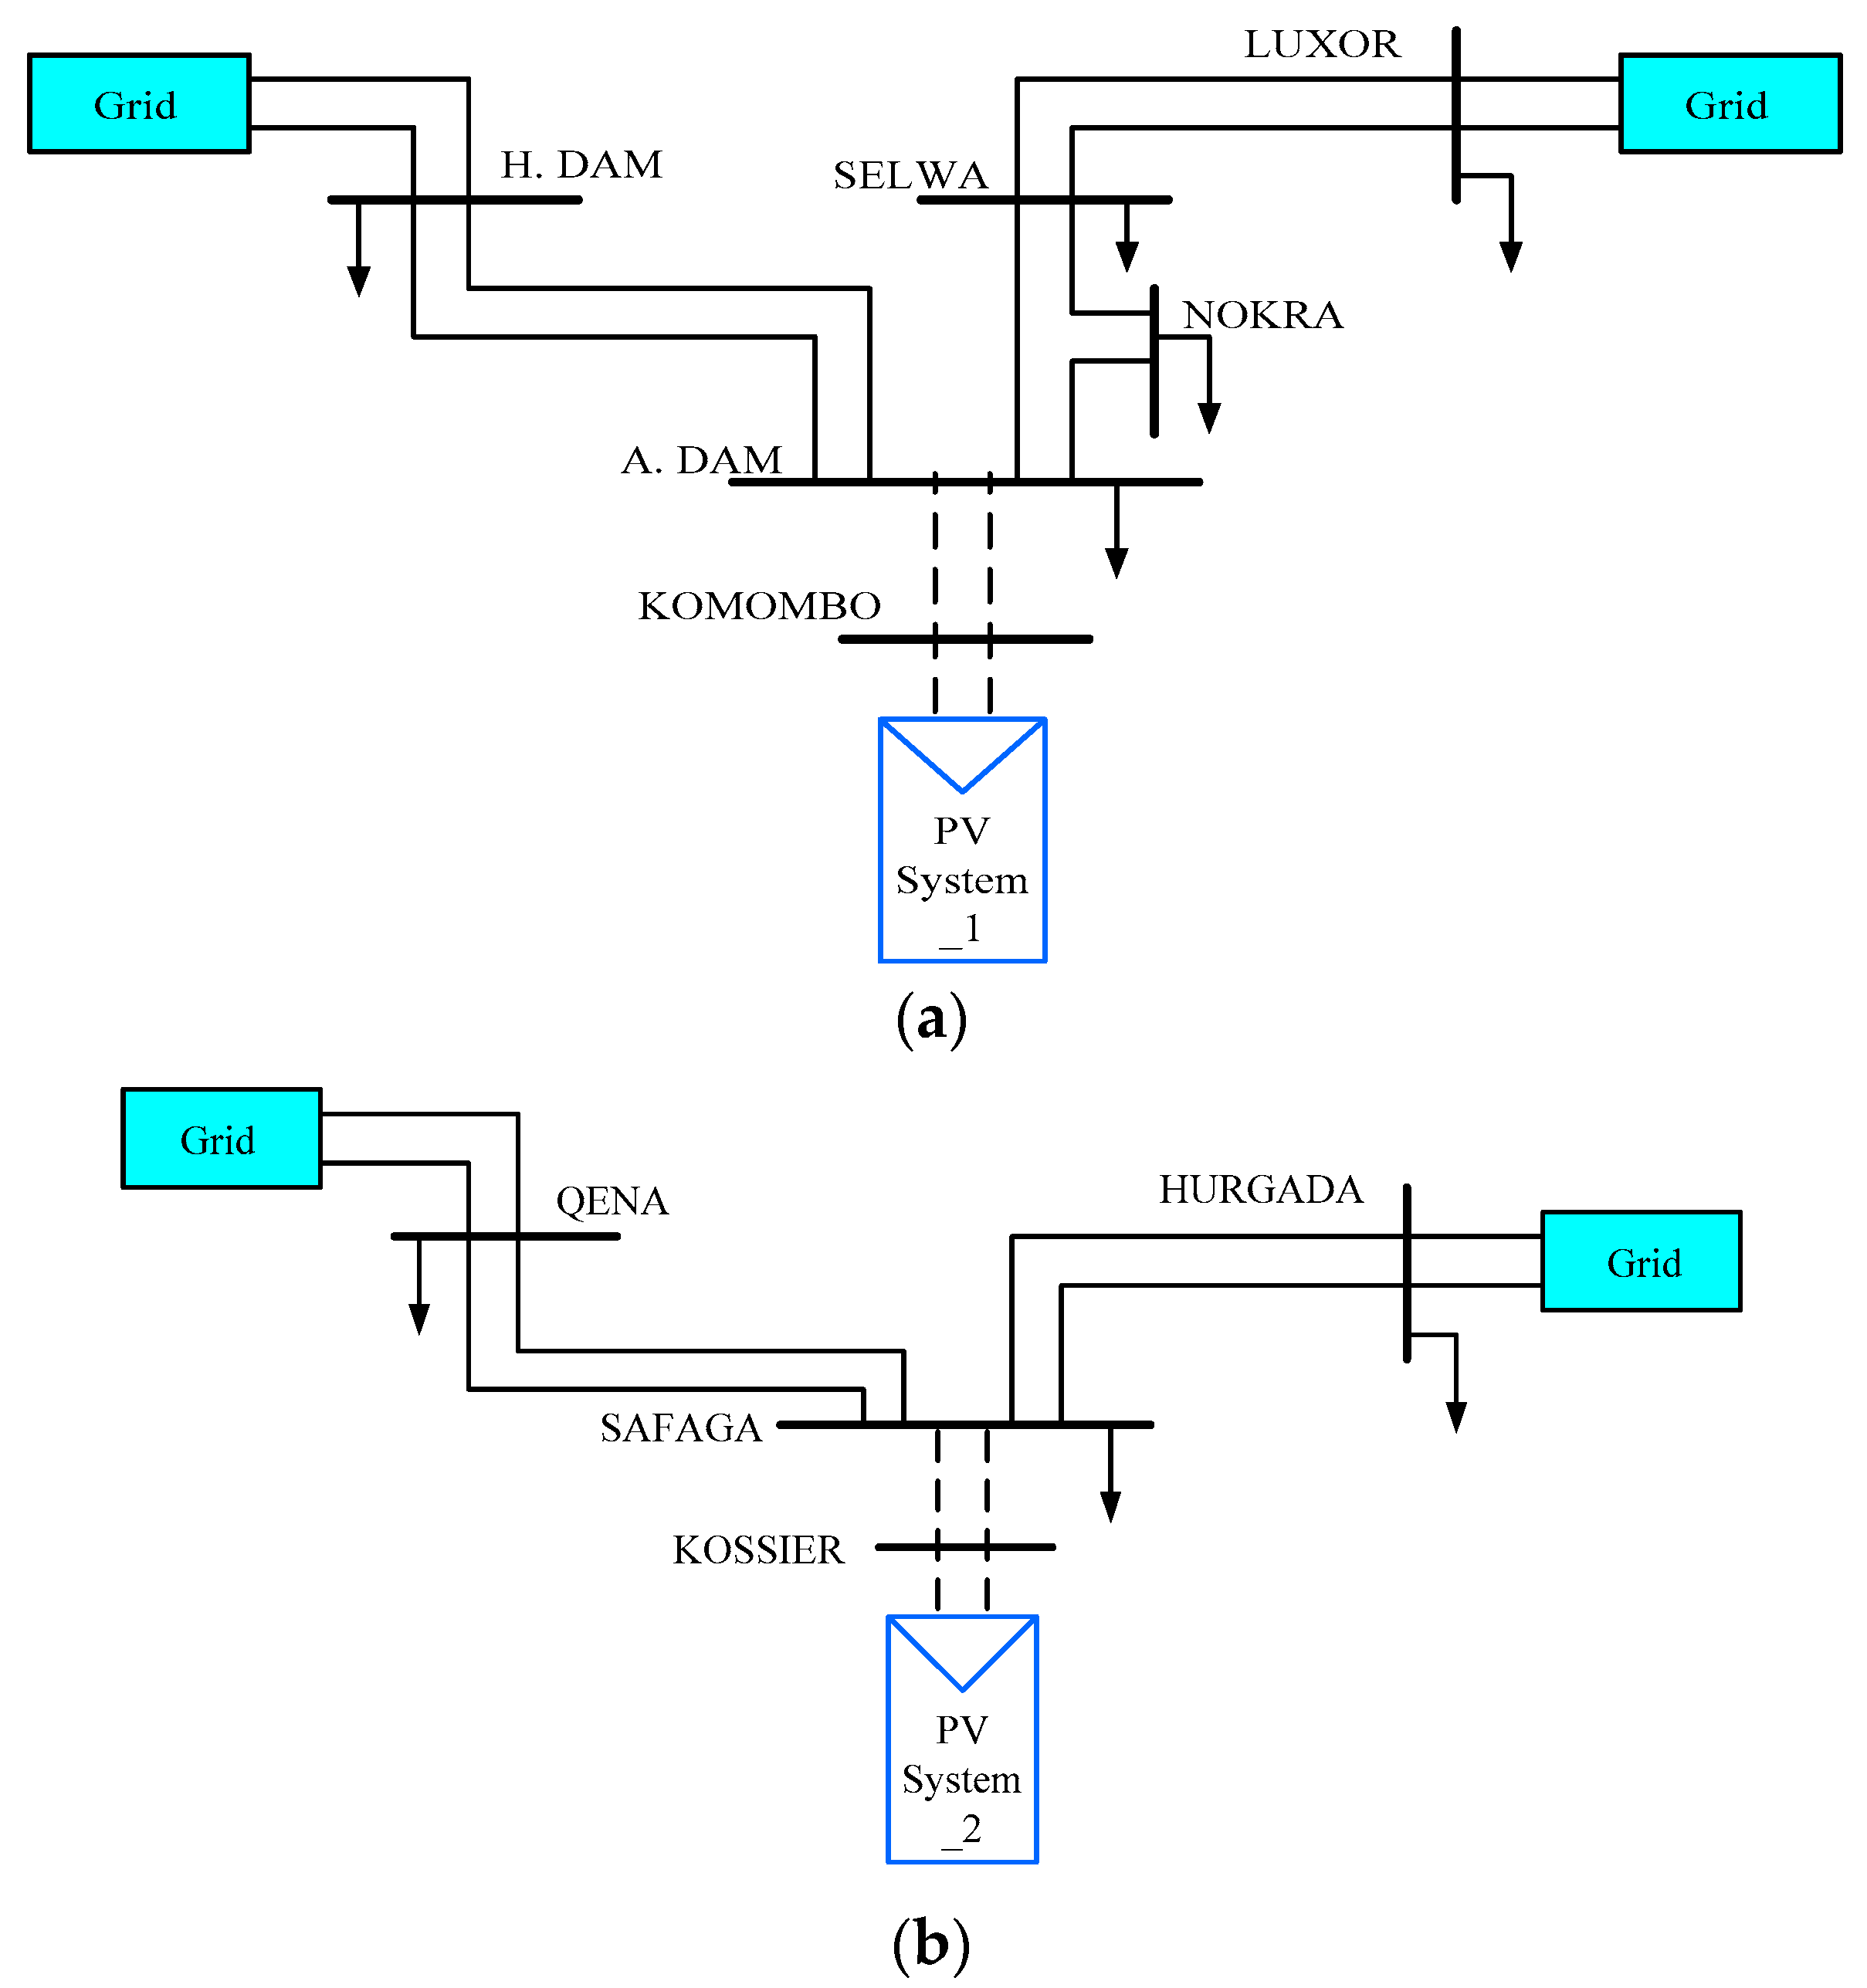
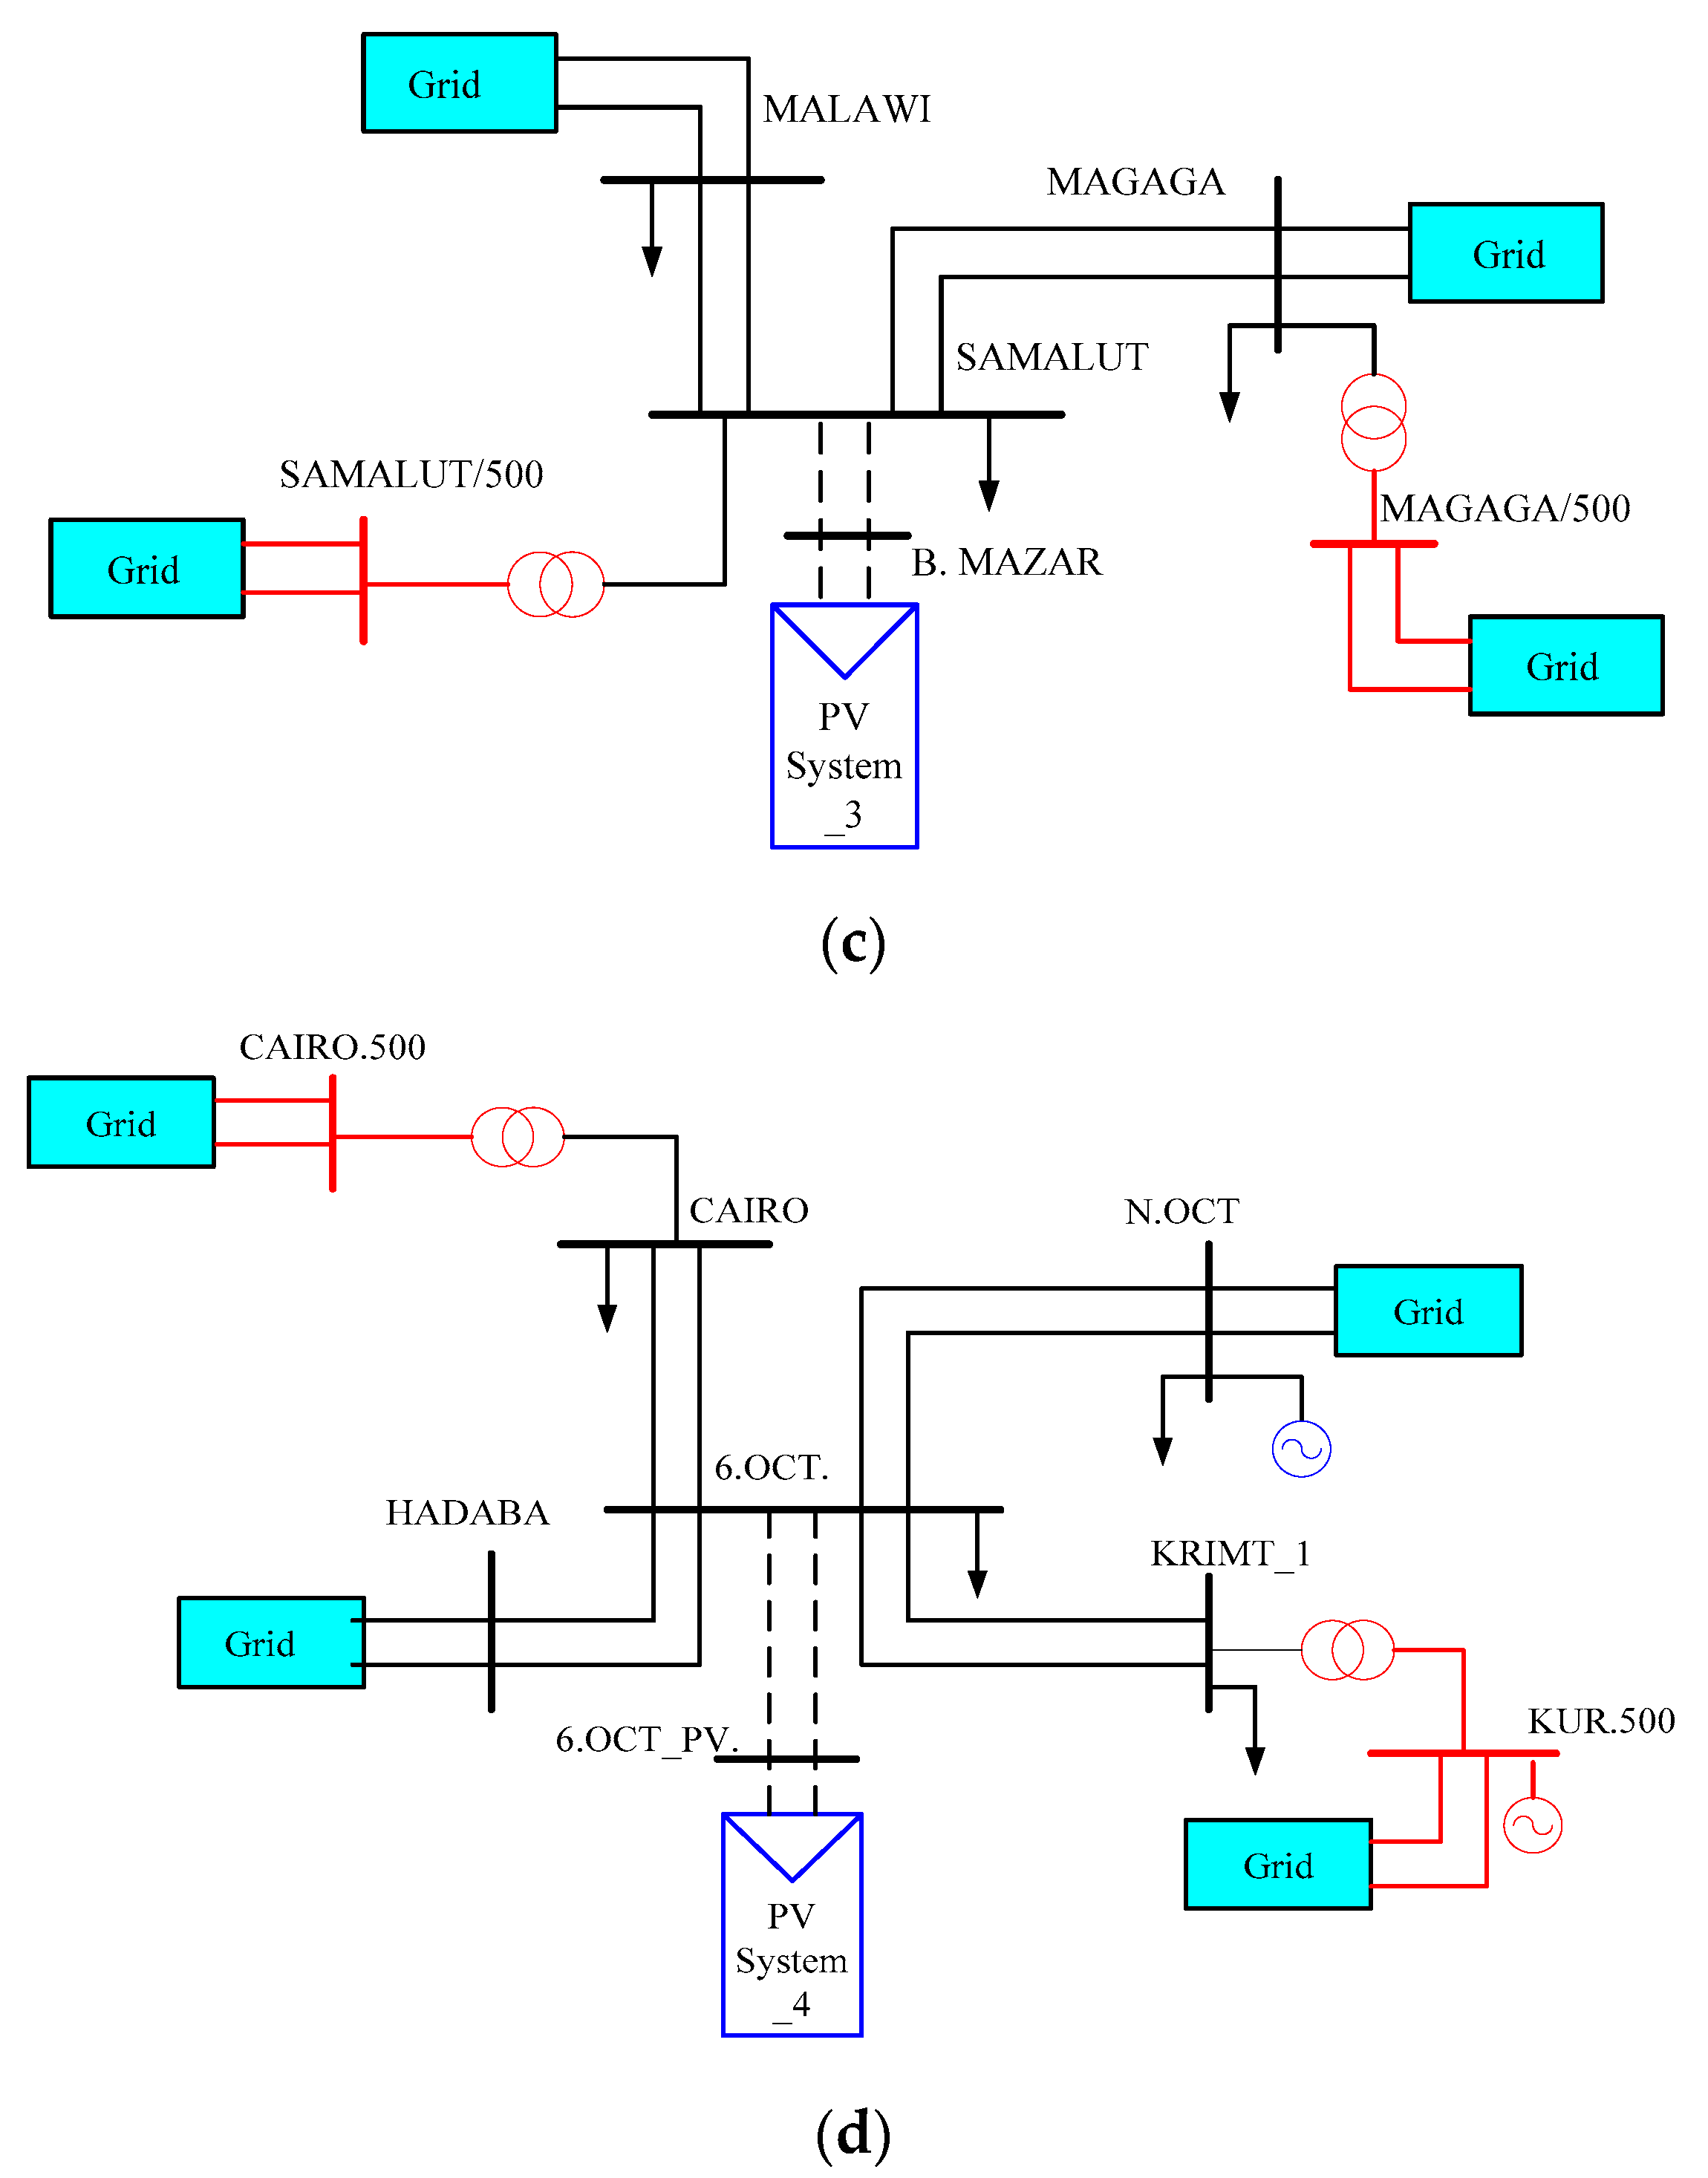
Figure 4 presents the grid equivalent circuit as seen from the node of the proposed sites; A.DAM (Site-1), SAFAGA (Site-2), SAMALUT (Site-3) and 6.OCT (Site-4), where PV power plants are proposed to be installed.
Large-scale photovoltaic power plants would have a particular impact on the voltage stability of the power system integrated into it [
15,
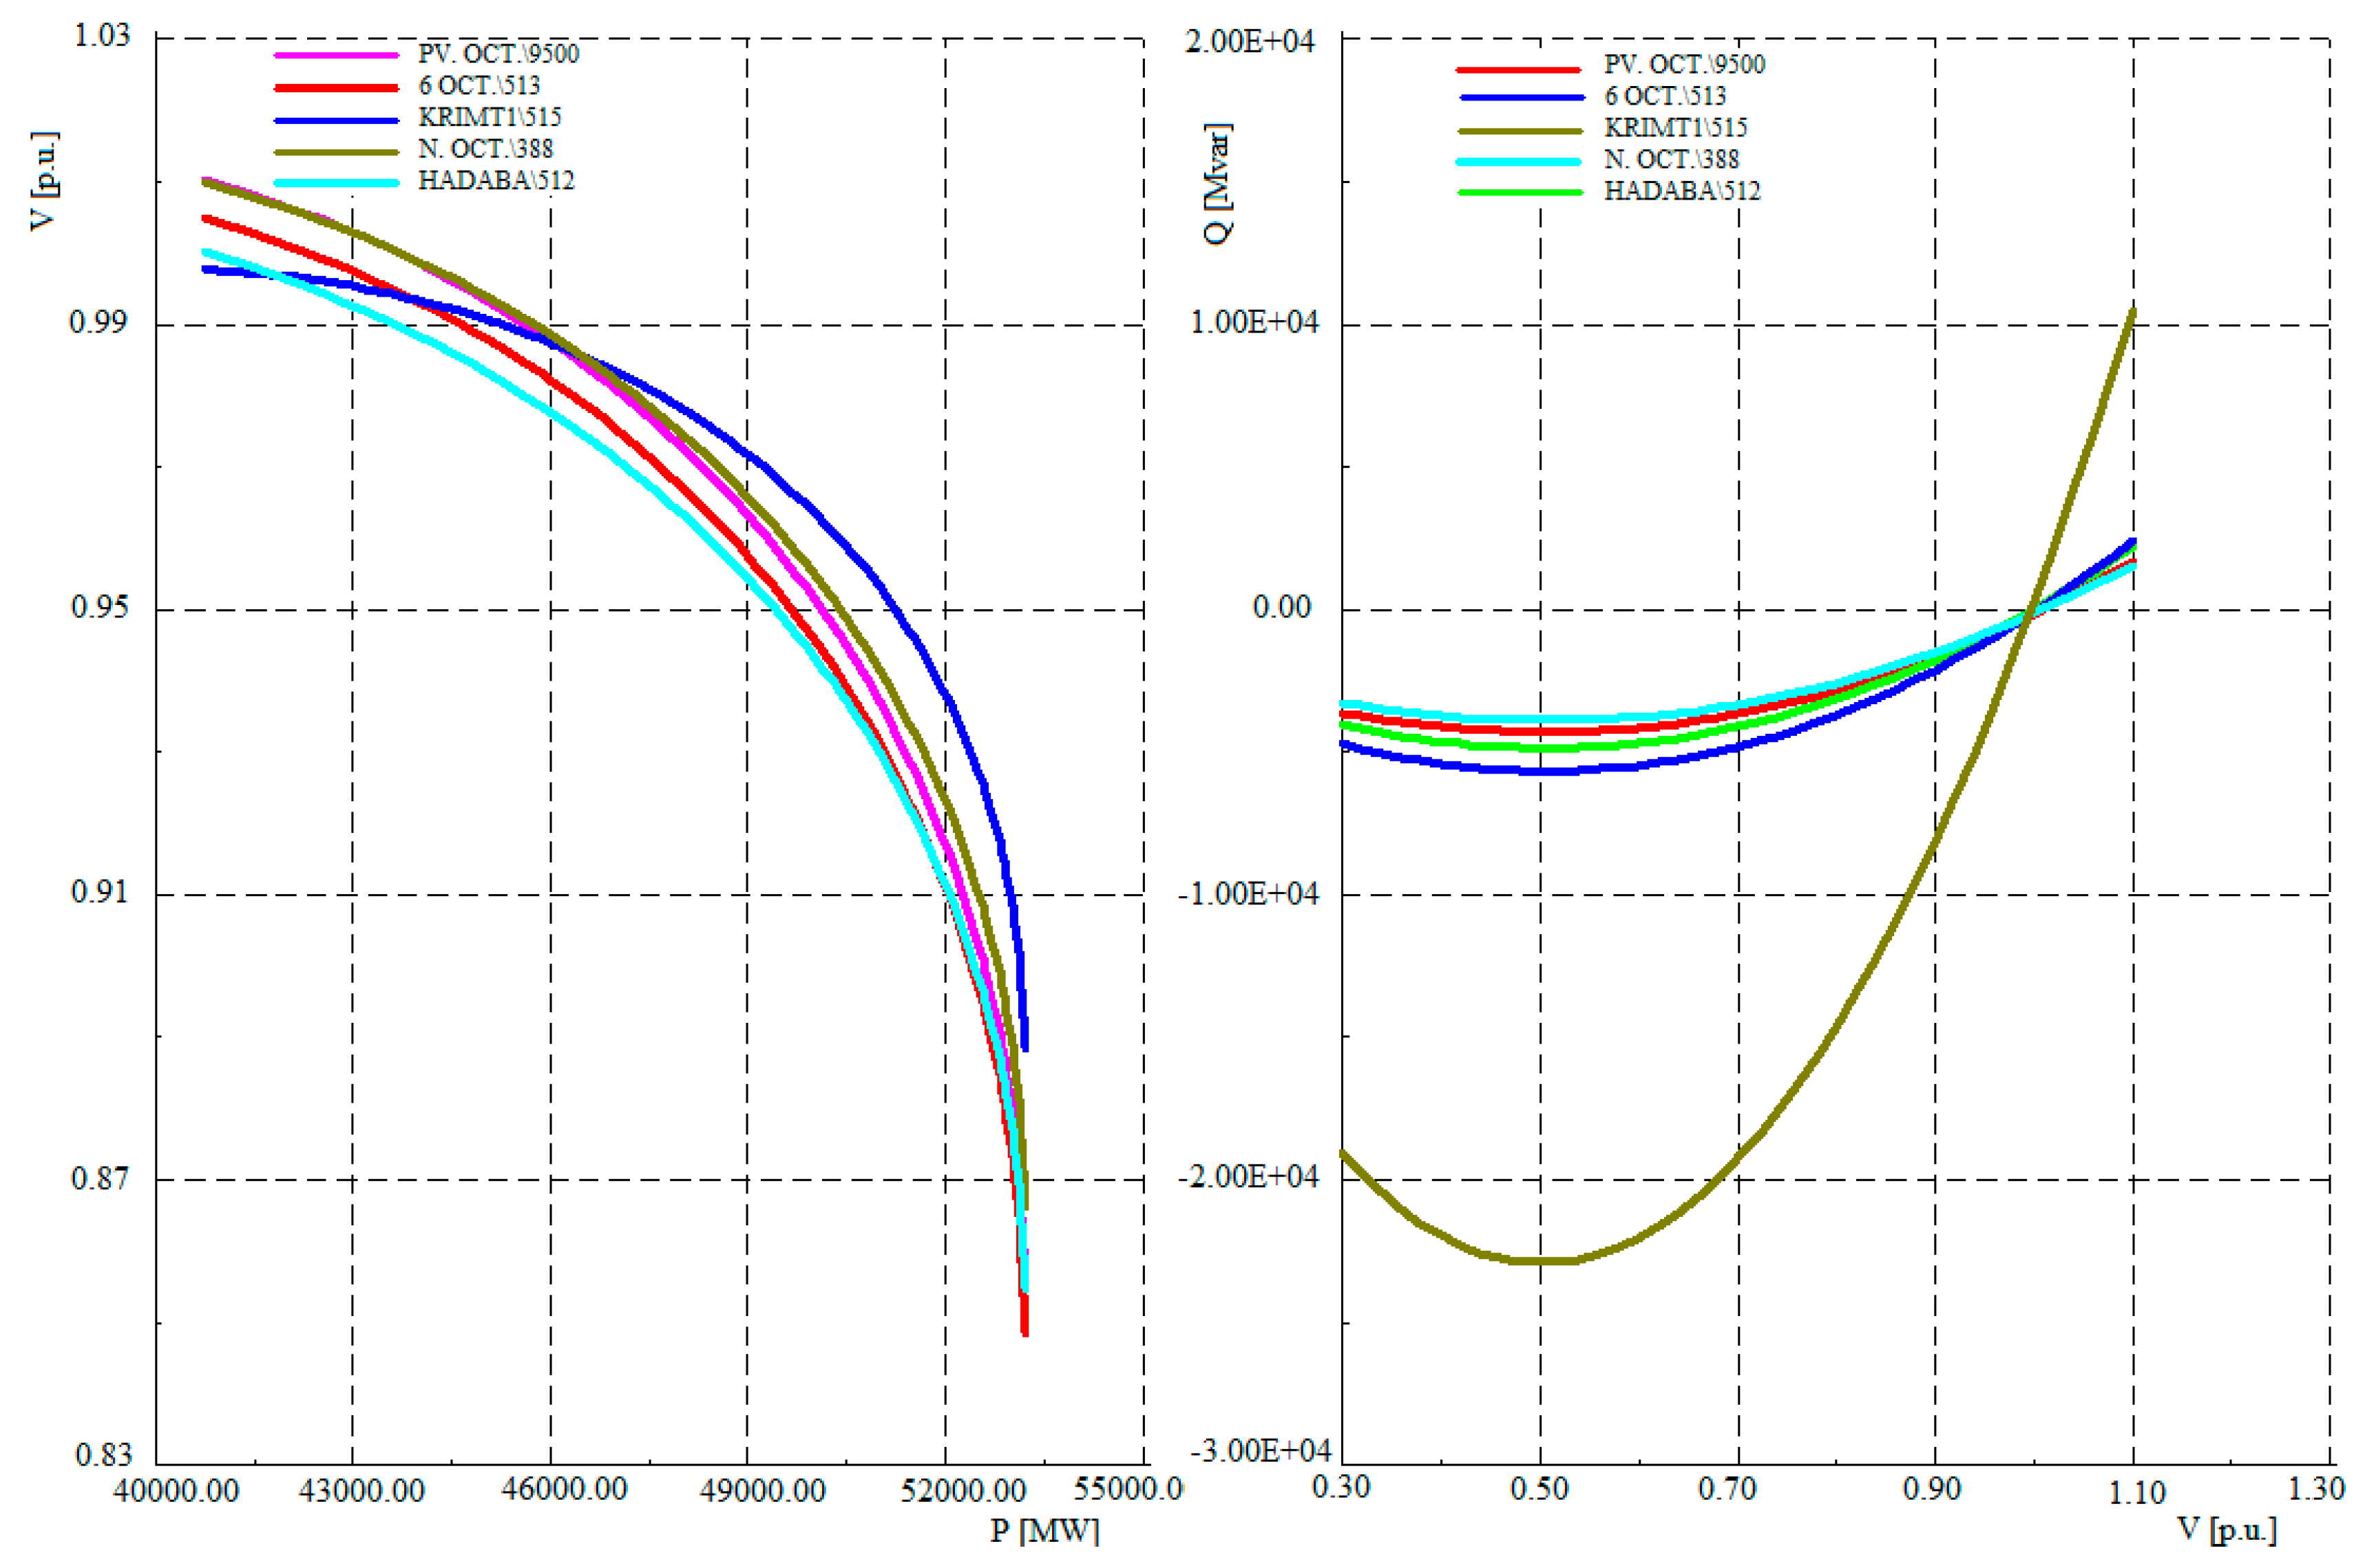
21]. In this section, the voltage stability limit of PV power plants at different sites is assessed during steady-state normal operation. All the previously mentioned cases that have been simulated are examined to obtain the impact of integration of PVPs with high penetration levels on voltage stability of the Egyptian unified power system. During simulation and studying the behavior of the P-V curves the real power generated at the buses, to which the proposed plants are connected, was gradually increased until voltage collapse is reached.
The Q-V curve is a powerful tool for analyzing the limits of steady-state voltage stability and the network’s reactive power margin by illustrating the relationship between the voltage at a certain bus and the reactive power injected to the same bus [
45,
46]. It demonstrates the distance in reactive power scale from the point of normal operation to the point, at which voltage collapse occurs. The system is called unstable, if the magnitude of the voltage at one bus in the system, at least, is decreased when increasing reactive power injected into the same point. This means that if the sensitivity of V-Q is positive for all buses the system is stable and when the sensitivity of V-Q is negative for one bus, at least, the system is unstable. The driving force for voltage instability is usually the loss loads in a certain section or tripping of transmission lines and other elements by their protective systems leading to cascading outages. Because of these outages, if the generator field current reaches its limit, some generators may lose synchronism [
45].
Fundamental to any analysis of the electric power system is the know-how of per unit systems (p.u.). This system is widely used to represent voltages, currents, and impedances in a power system. The per unit systems allows the electrical engineers to solve a single-phase network where: all active power (P) and reactive power (Q) are three phase, voltage magnitudes are represented as a fraction of their original values “base value”, all phase angles are presented with their original units.
Per unit (p.u.) system has many advantages over using the standard SI units such as:
When the electric quantities are expressed in p.u., the comparison with their normal values is straightforward.
Whatever the power and voltage rating, the values of the impedances in p.u. stay constant.
Using the p.u. system simplifies the calculation, especially in multi-voltage power systems.
For a given quantity (voltage, current, power, impedance, etc.) the per-unit value is the value related to a base quantity:
Generally the base power “
SBase” and the base voltage according to the line-to-line voltage “VBase” are chosen, then the value of the base current “
IBase” and the base impedance “
ZBase” are calculated:
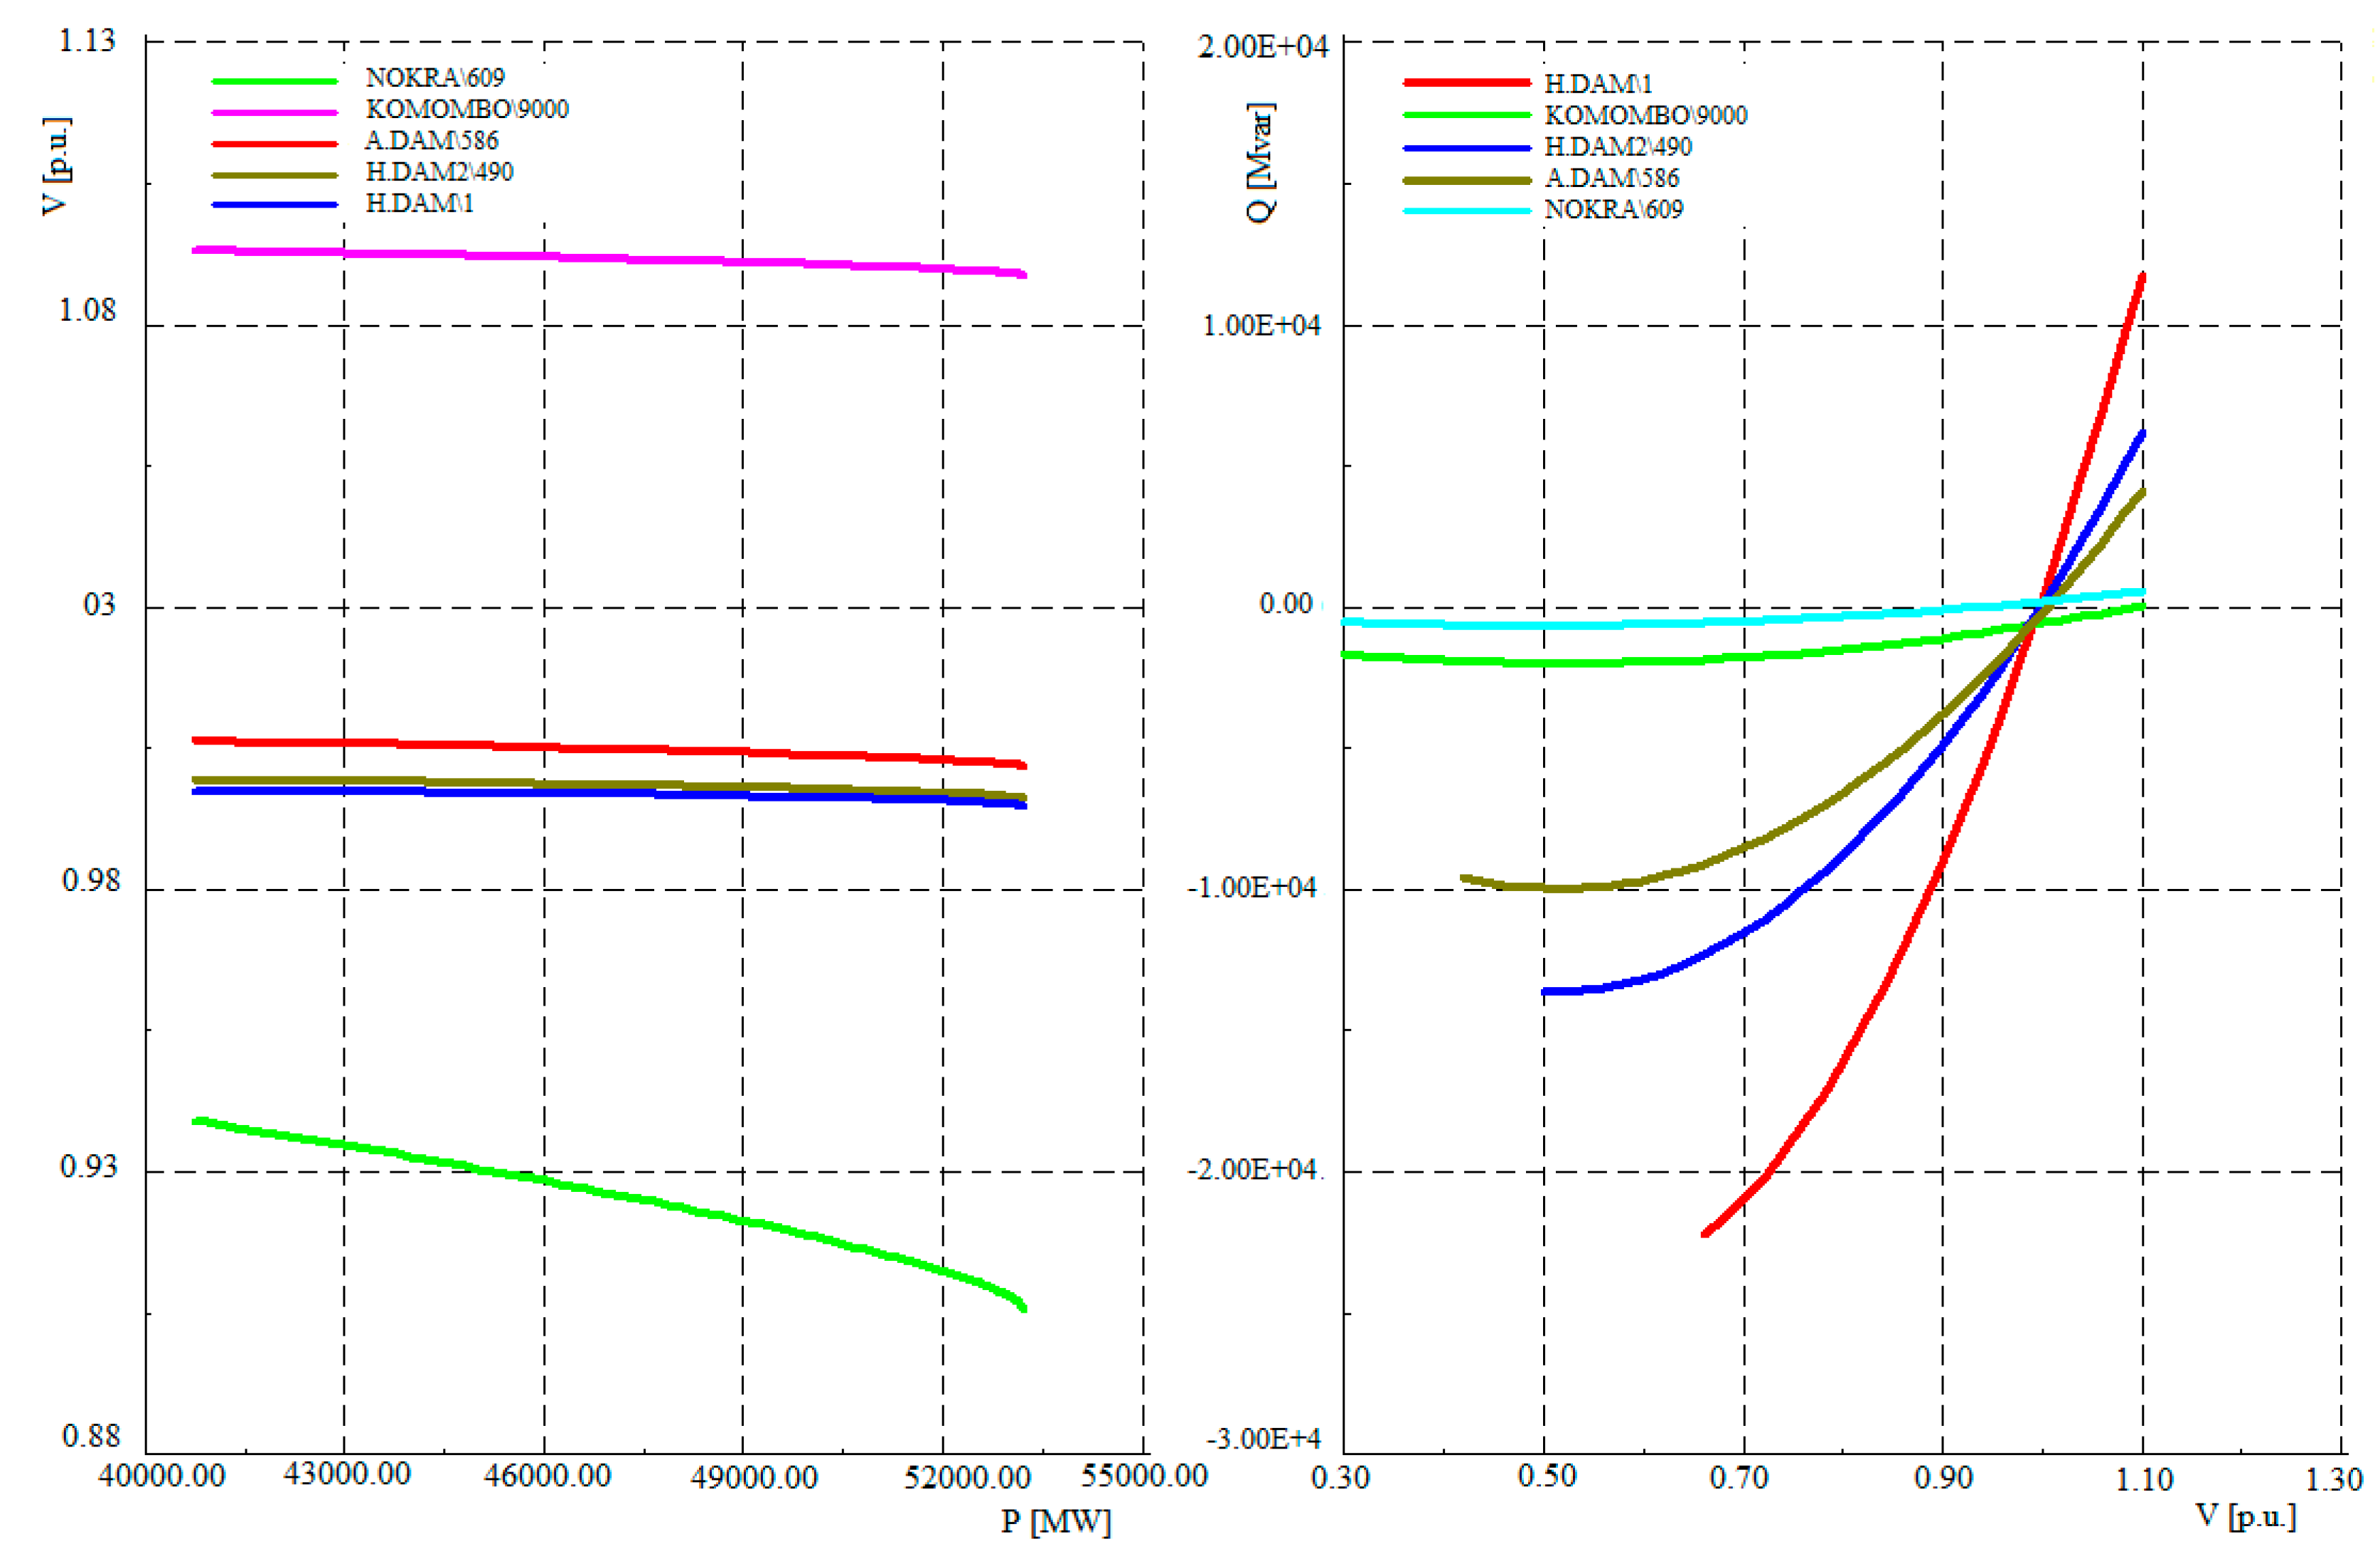
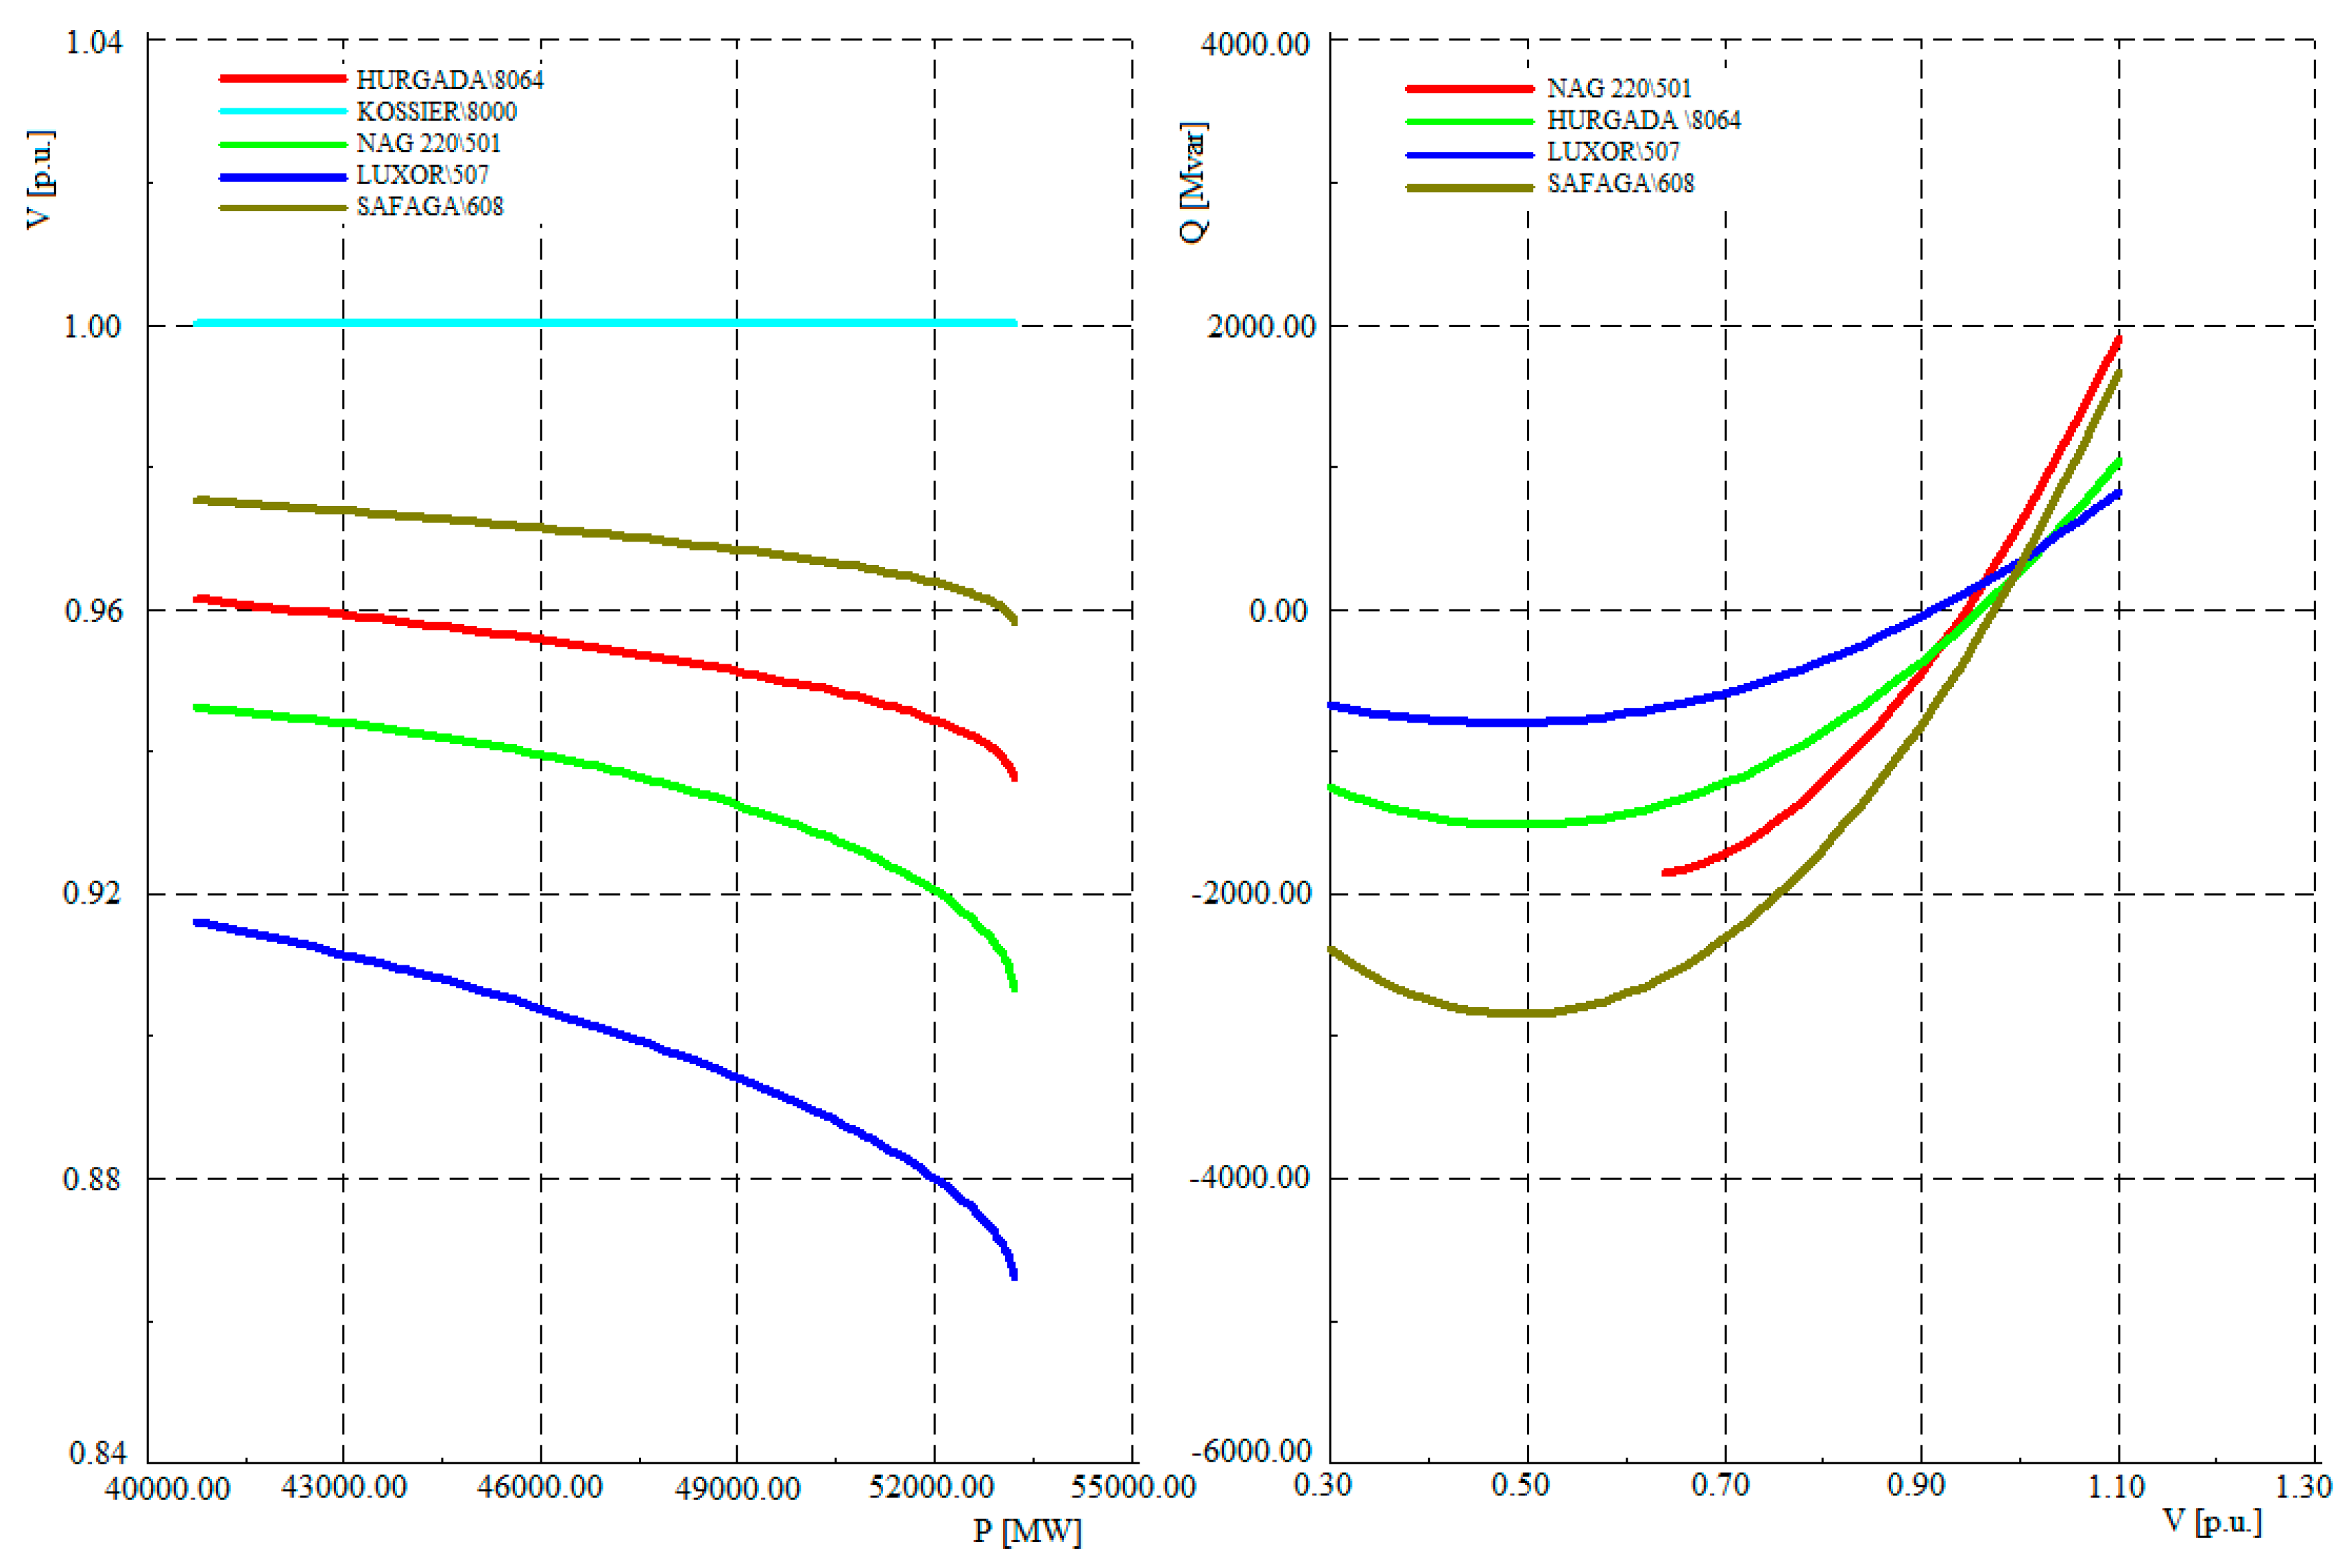
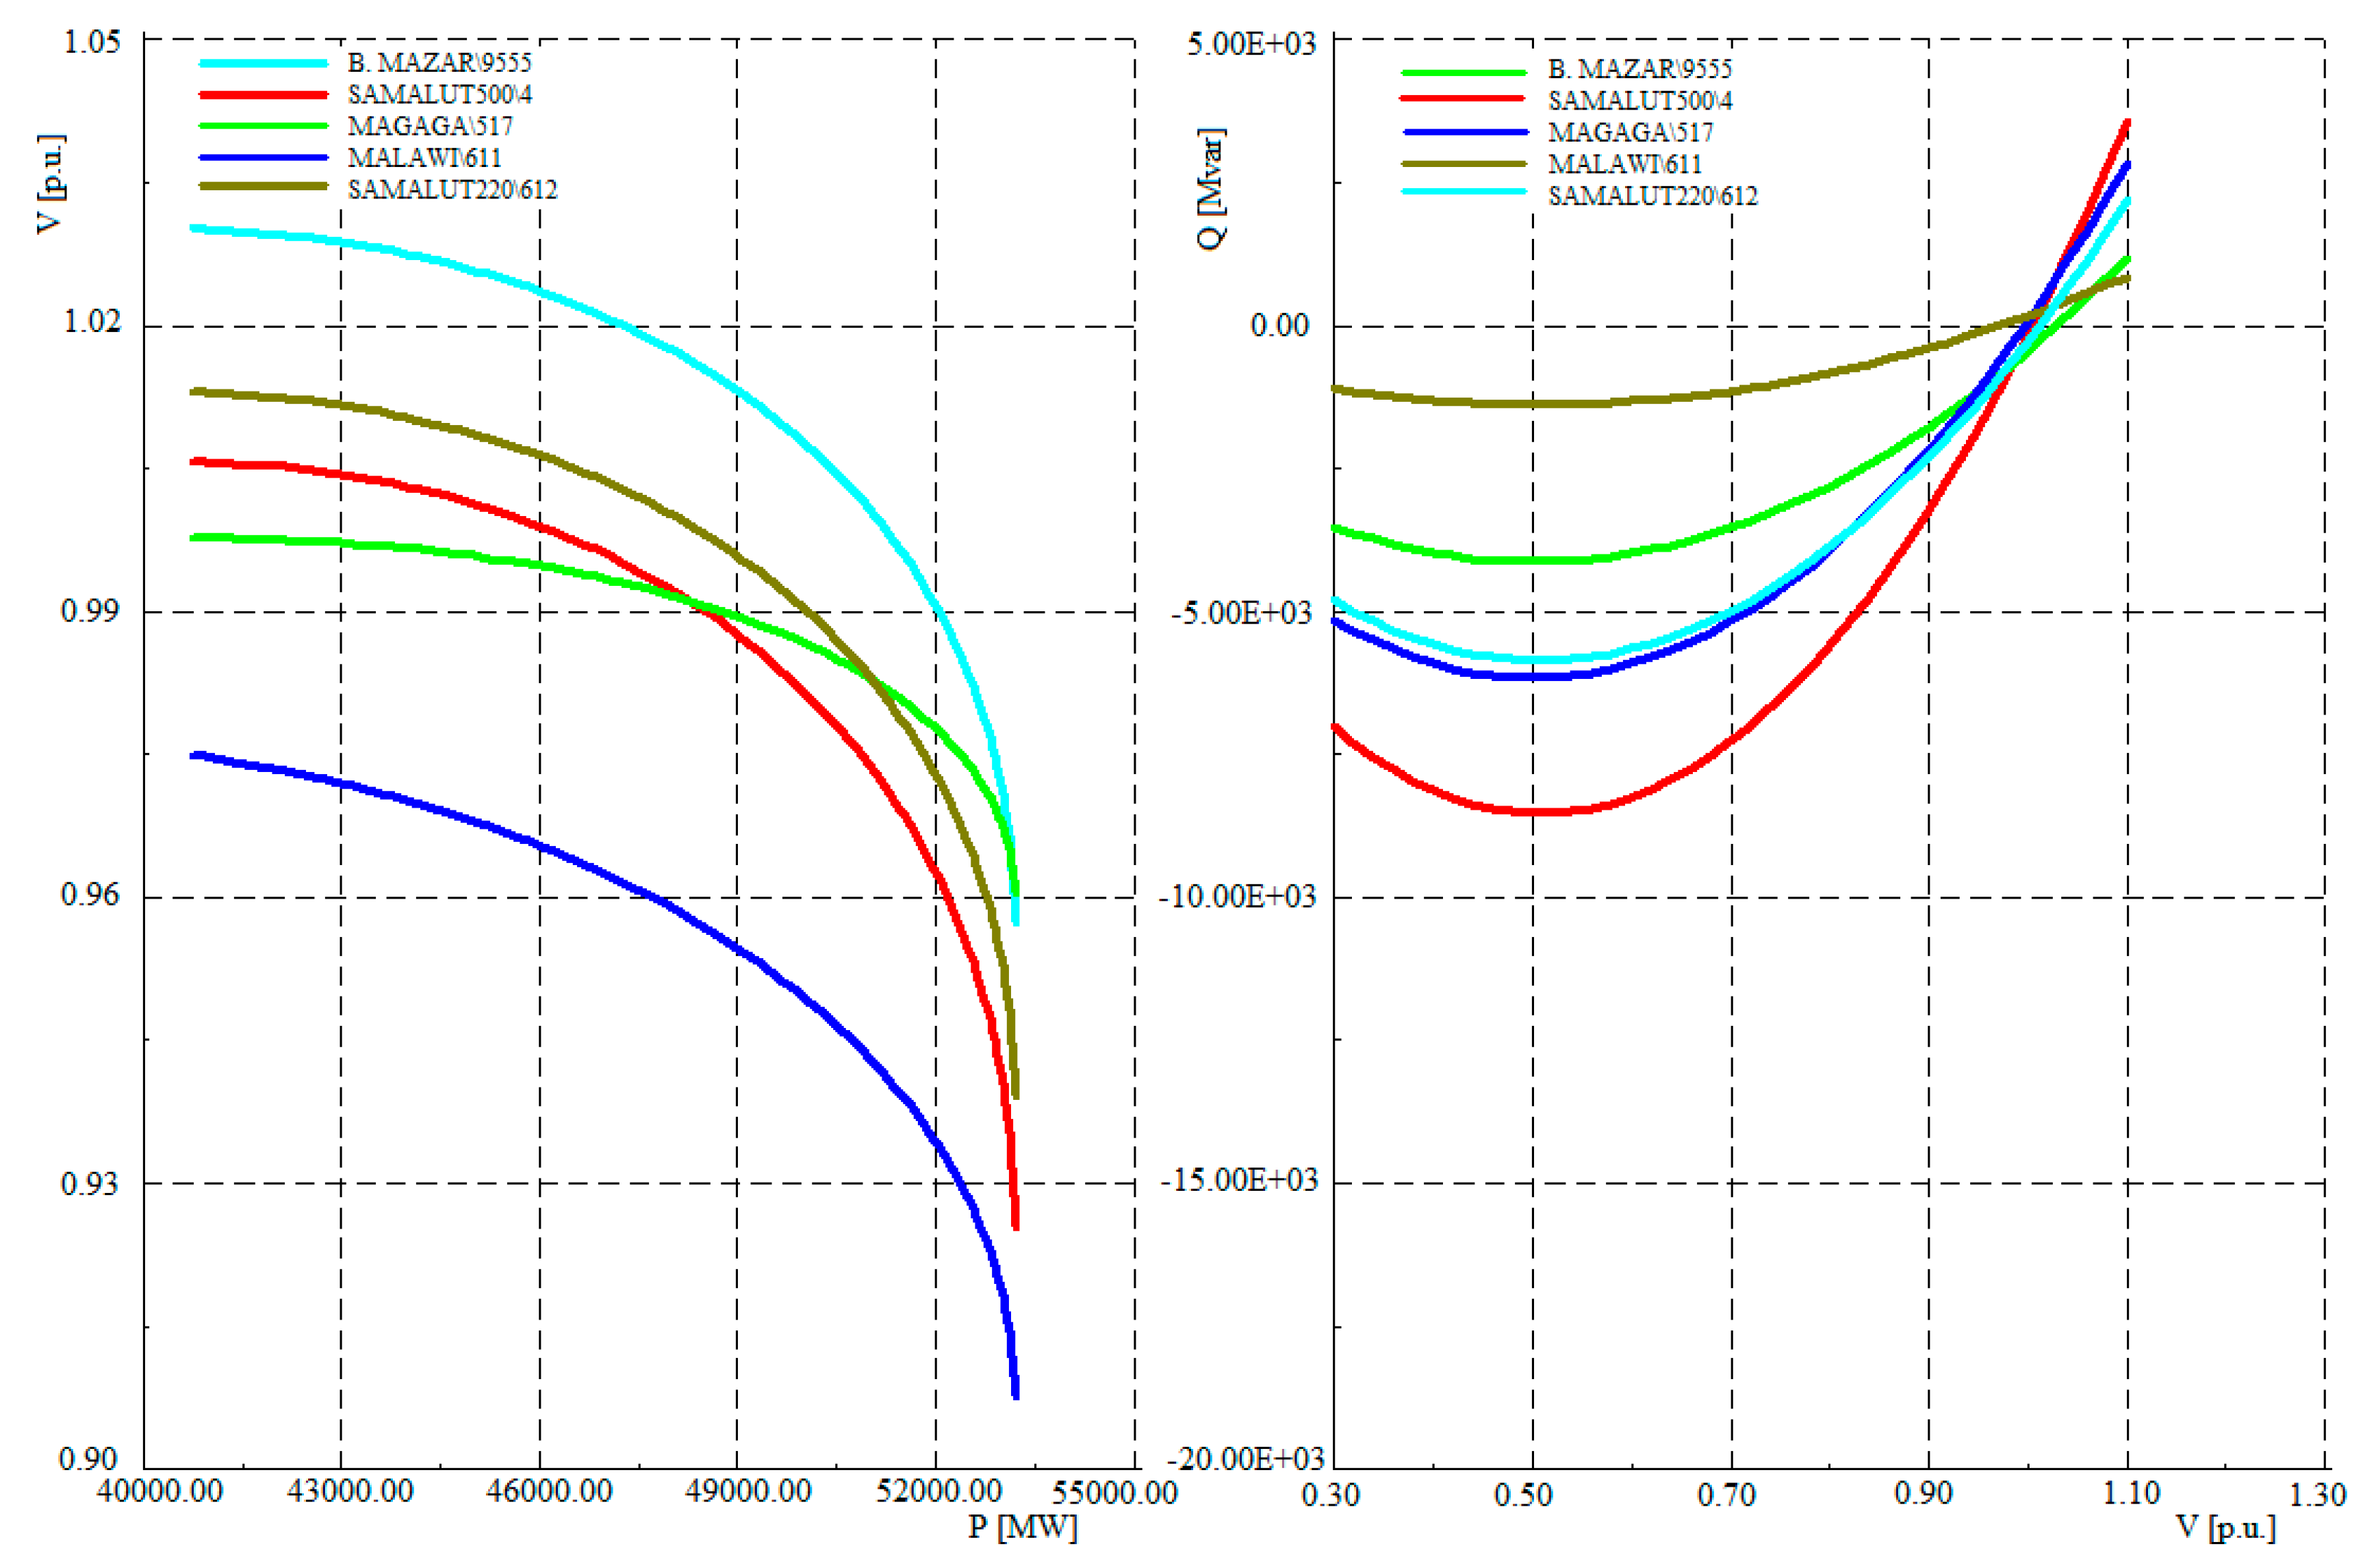
Figure 5,
Figure 6,
Figure 7 and
Figure 8 show the P-V and Q-V curves at the buses of the four proposed locations. The voltage profiles of the buses, to which PVPs are integrated and the buses of the nearby substations are also reproduced.
From
Figure 5,
Figure 6,
Figure 7 and
Figure 8, it can be noticed that the voltage control has contributed in increasing the penetration level of the PVP at the points of integration by controlling the reactive power injected at these buses. The voltage control method supported the voltage profile at the terminals of the PVPs power stations and the surrounding substations as illustrated in the figures. Moreover, the voltage stability of a certain substation in the grid is directly affected by the equivalent impedance of the electric network as seen from that point. The higher is the equivalent impedance, the higher is the sensitivity of voltage and the lower is the level of real power that can be injected at that point.
3.3. Dynamic Voltage Stability Analysis
The dynamic voltage stability of the studied power system was examined by assessing the behavior of the voltage at the buses and the response of the proposed PVPs during the abnormal conditions of three phase to ground fault at the terminals of the proposed PVPs and loss of a generation of a large-scale conventional power plant. The behavior of the system under a three-phase short circuit has been studied and simulated at each of the four proposed sites. The variations in the voltage profile at the buses under fault and the surrounding substations, as well as the active and reactive components of current injected from the suggested PV systems, are established.
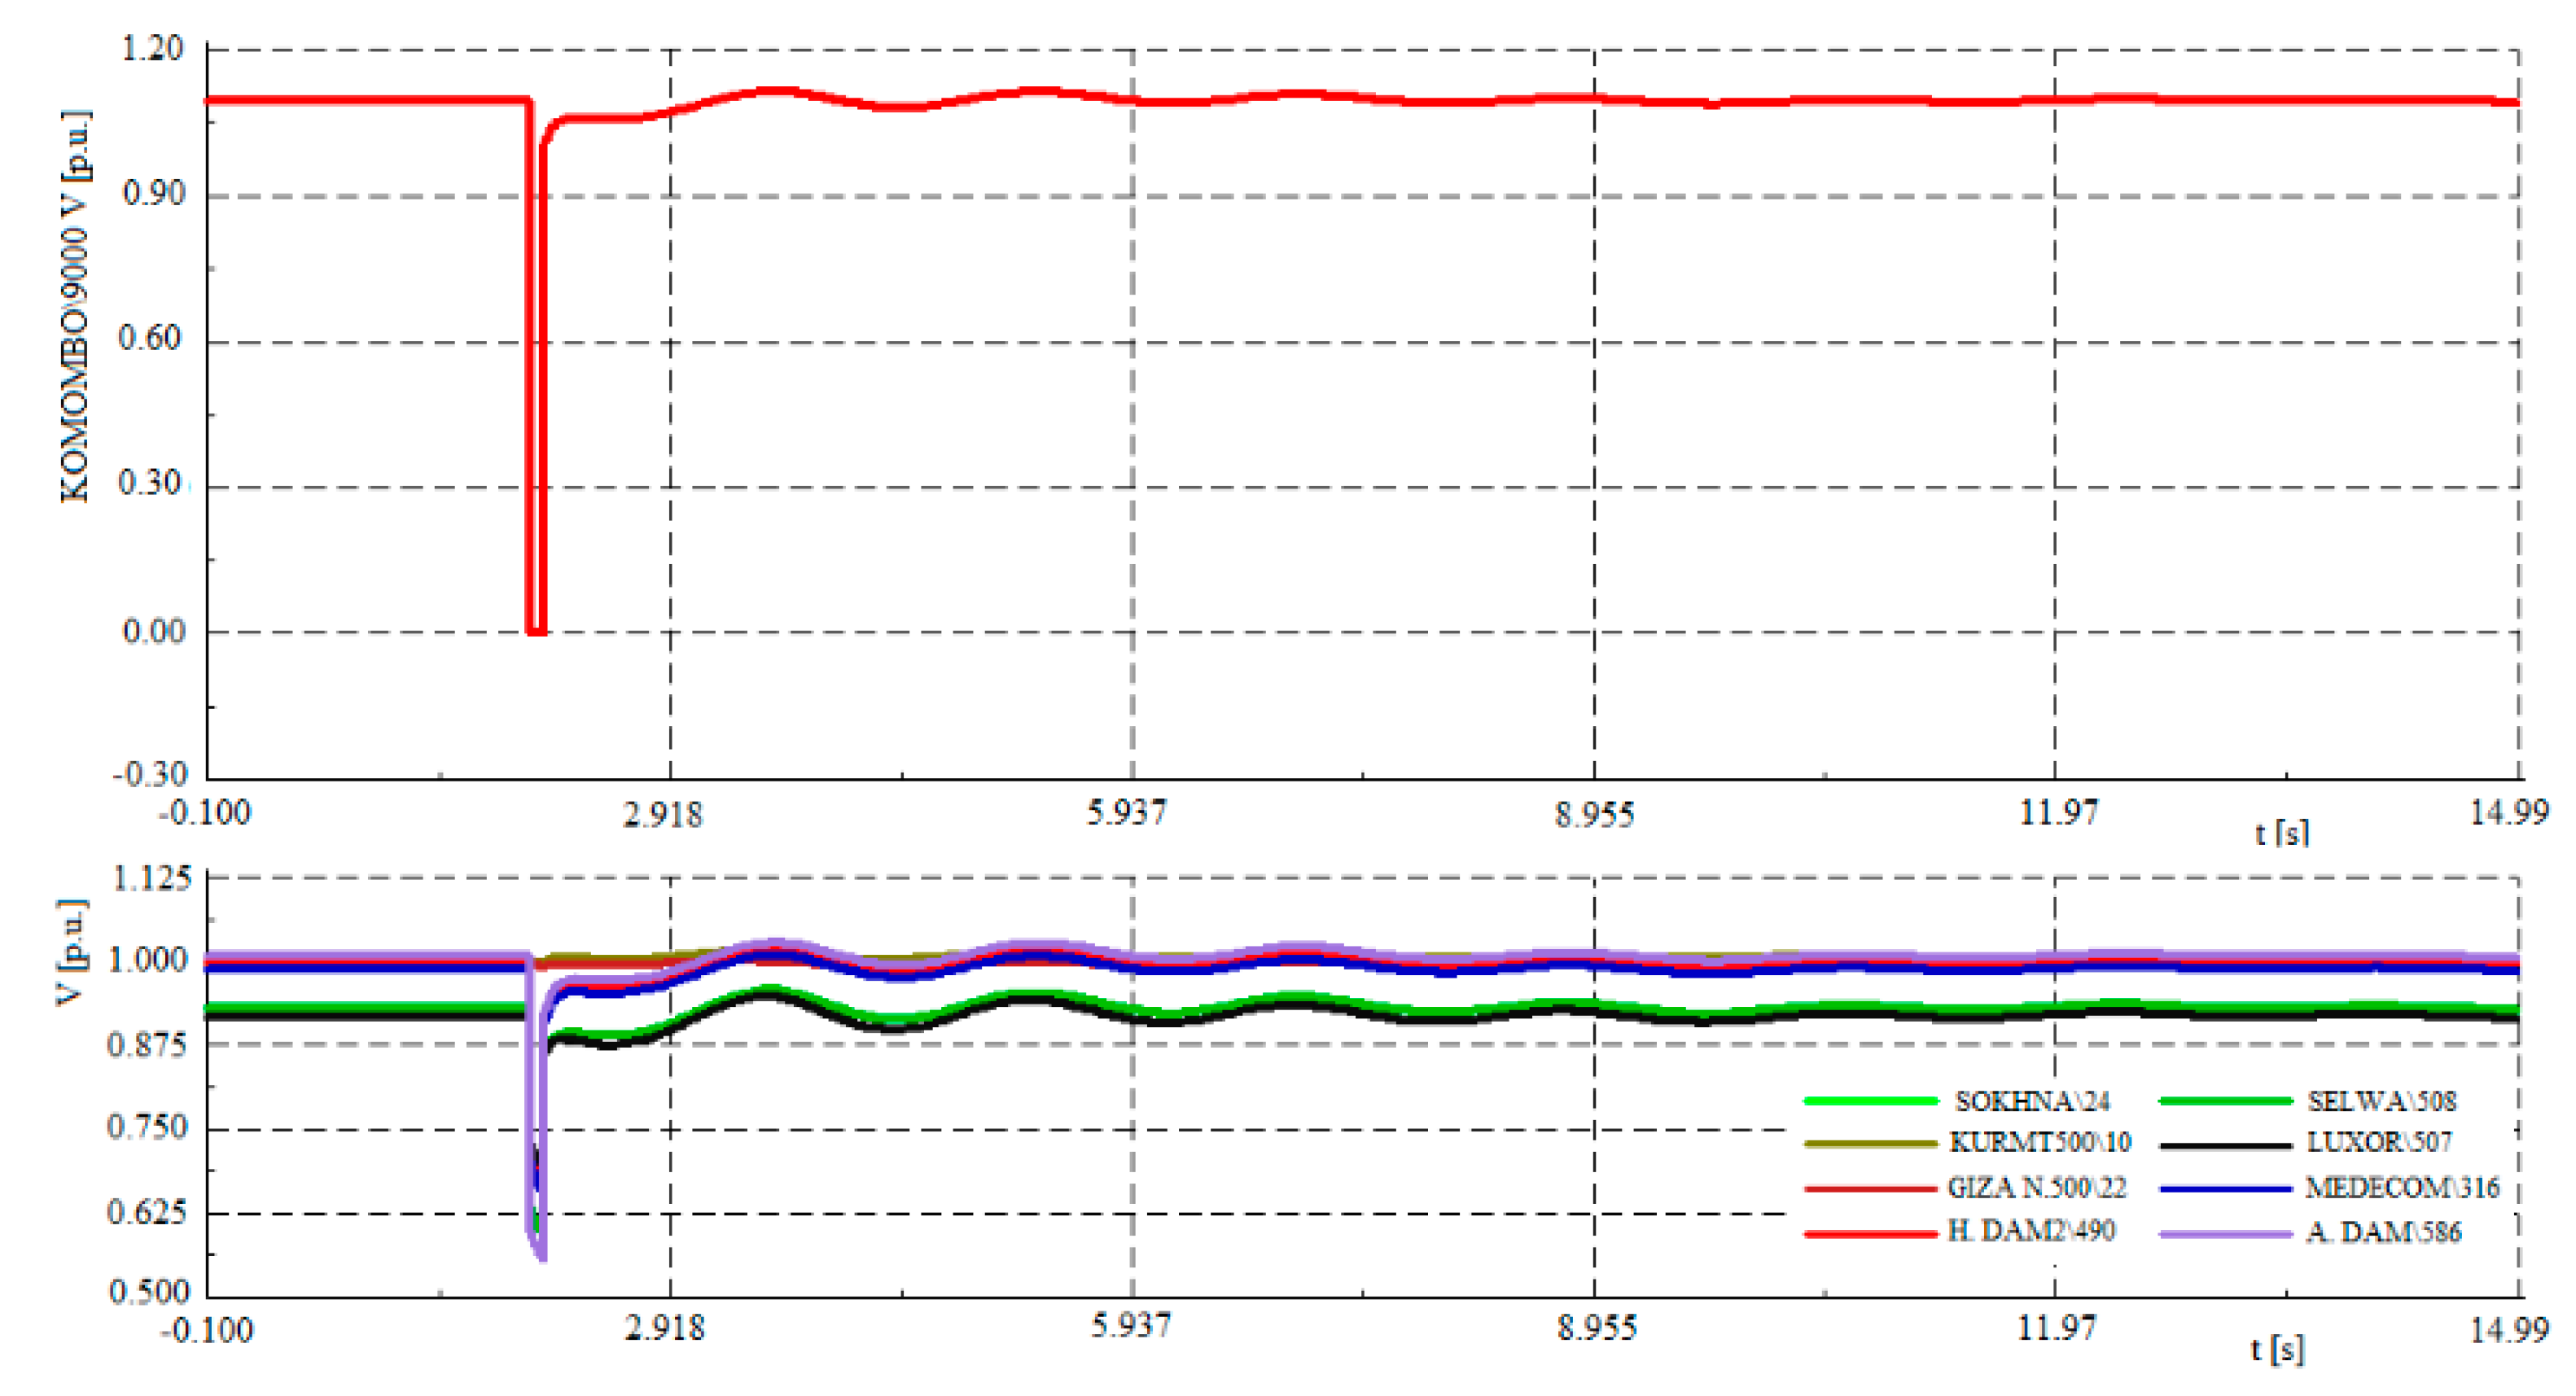
3.3.1. Three Phase Short Circuit on the Terminals of PV System_1 (KOMOMBO)
Figure 9 shows the variation in the voltage profile during the application of a 3-phase to ground fault for 0.1 s at the terminals of the high voltage side of transformer substation of PV System_1 (KOMOMBO). The upper graph displays terminal voltage variation at the terminals of the KOMOMBO site. The lower graph represents the variations in the terminal voltage at nearby substations A.DAM, SELWA, NOKRA, LUXOR, which are presented in the single line diagram of
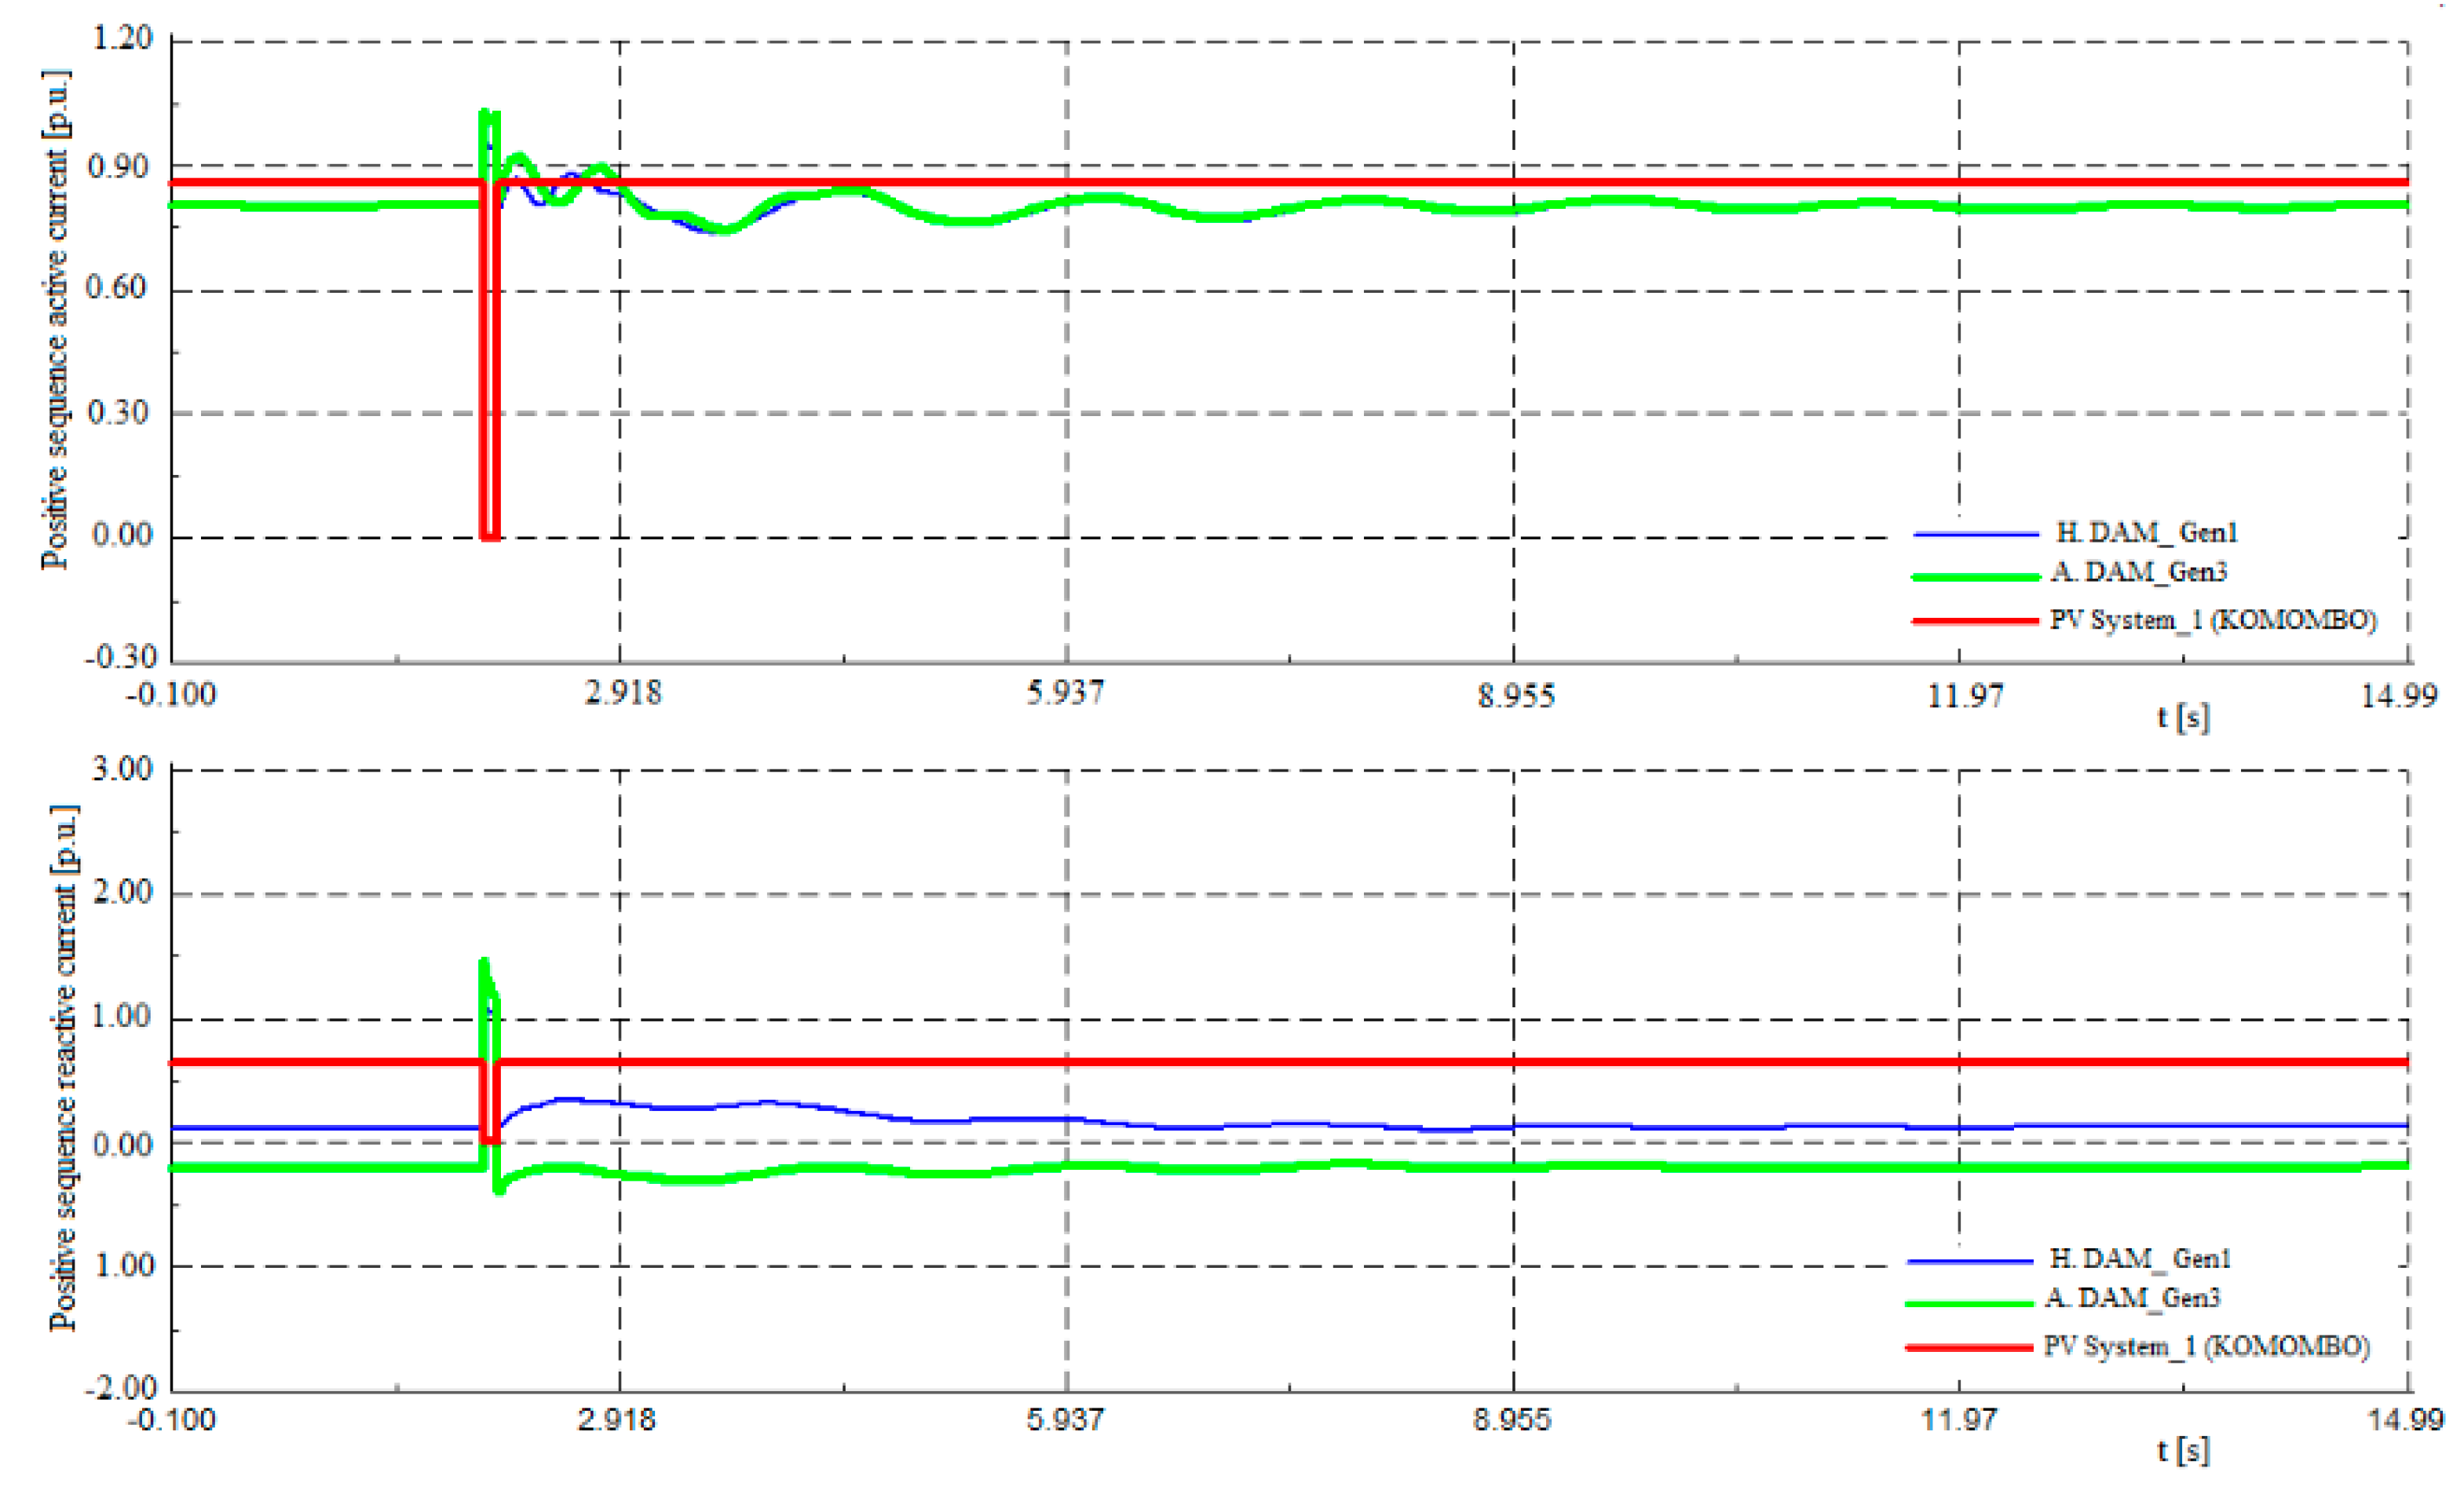
Figure 4a and the main power plants. Likewise,
Figure 10 presents the variations of the active and reactive components of currents injected from KOMOMBO site and the H.DAM hydroelectric power plant and A.DAM. The results indicate that the system is stable with respect to the same voltage, reactive and active power after fault clearance.
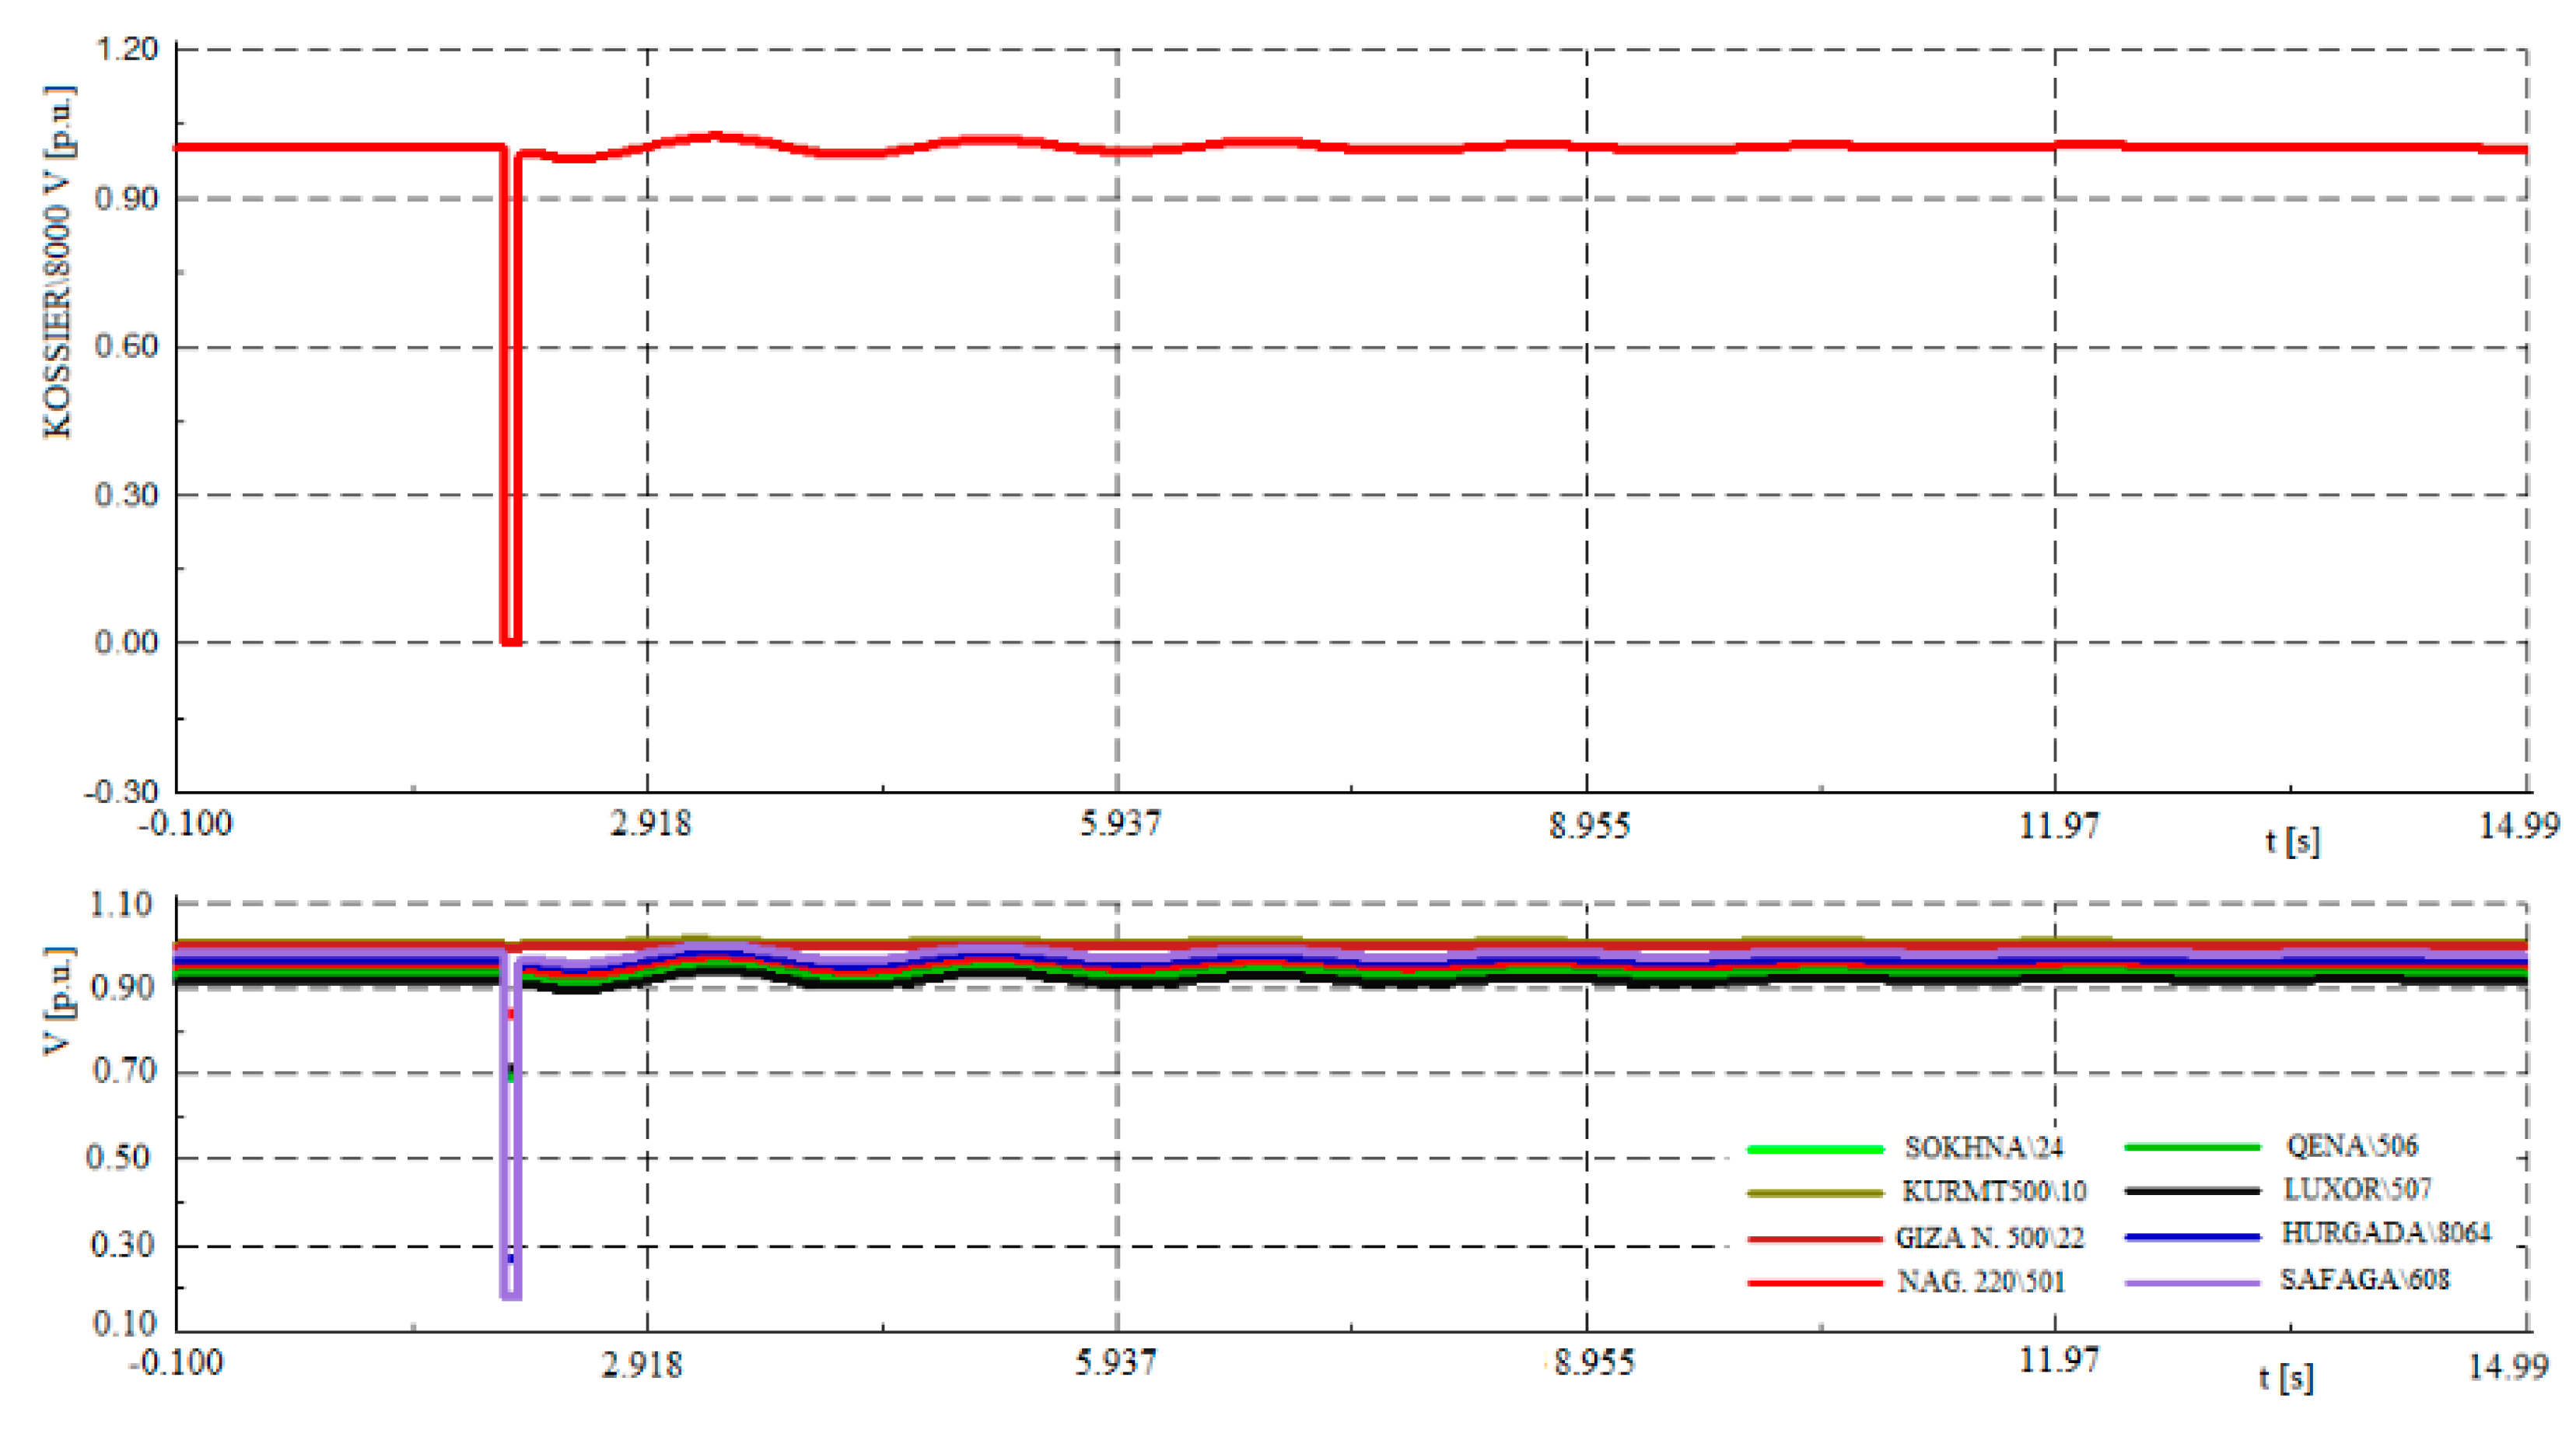
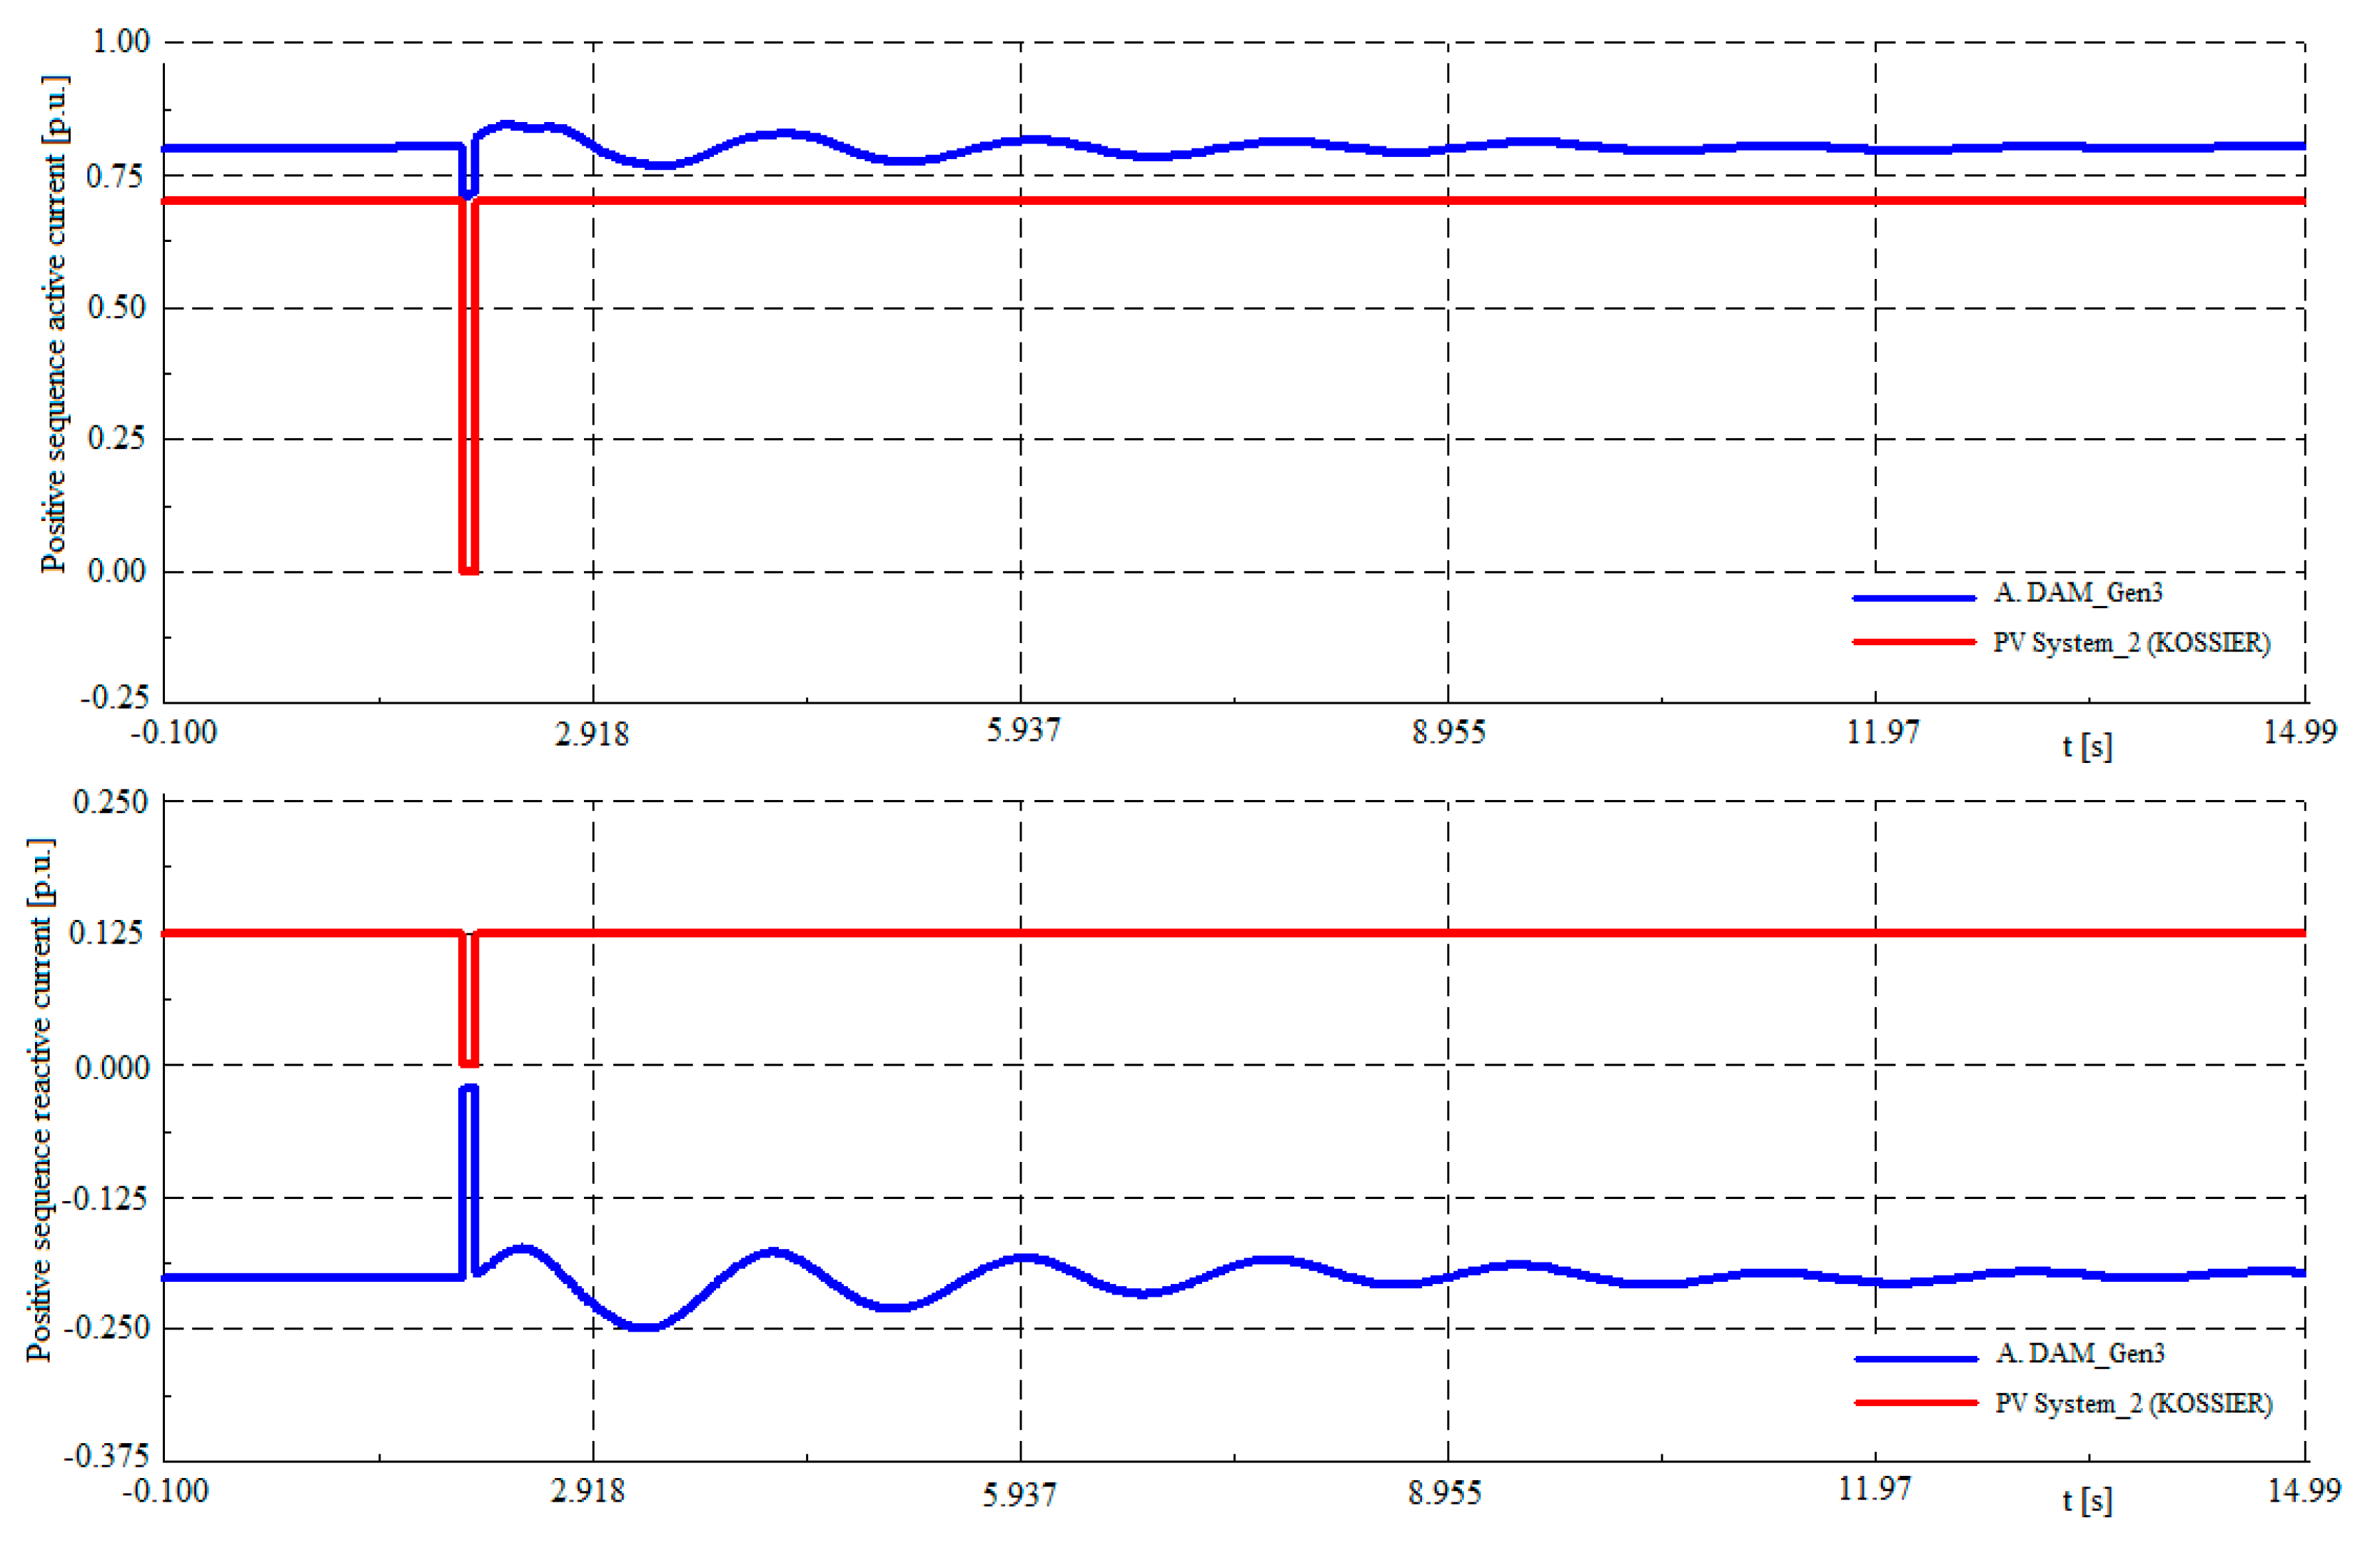
3.3.2. Three Phase Short Circuit on the Terminals of PV System_2 (KOSSIER)
Figure 11 shows the variation in the voltage profile in case of the application of a 3-phase fault for 0.1 s at KOSSIER site. The upper graph presents the variation in terminal voltage at the terminals of the KOSSIER power plant. The lower graph shows the terminal voltage variations at surrounding substations mentioned in the single line diagram presented in
Figure 4b. Likewise,
Figure 12 represents the variations of the active and reactive components of currents injected at KOSSIER site and A.DAM hydroelectric substation. From the results, the system takes more time to reach the stability after fault clearing at the A.DAM hydroelectric substation, because this substation is near the fault location. However, the system each to the stability and has a good dynamic performance.
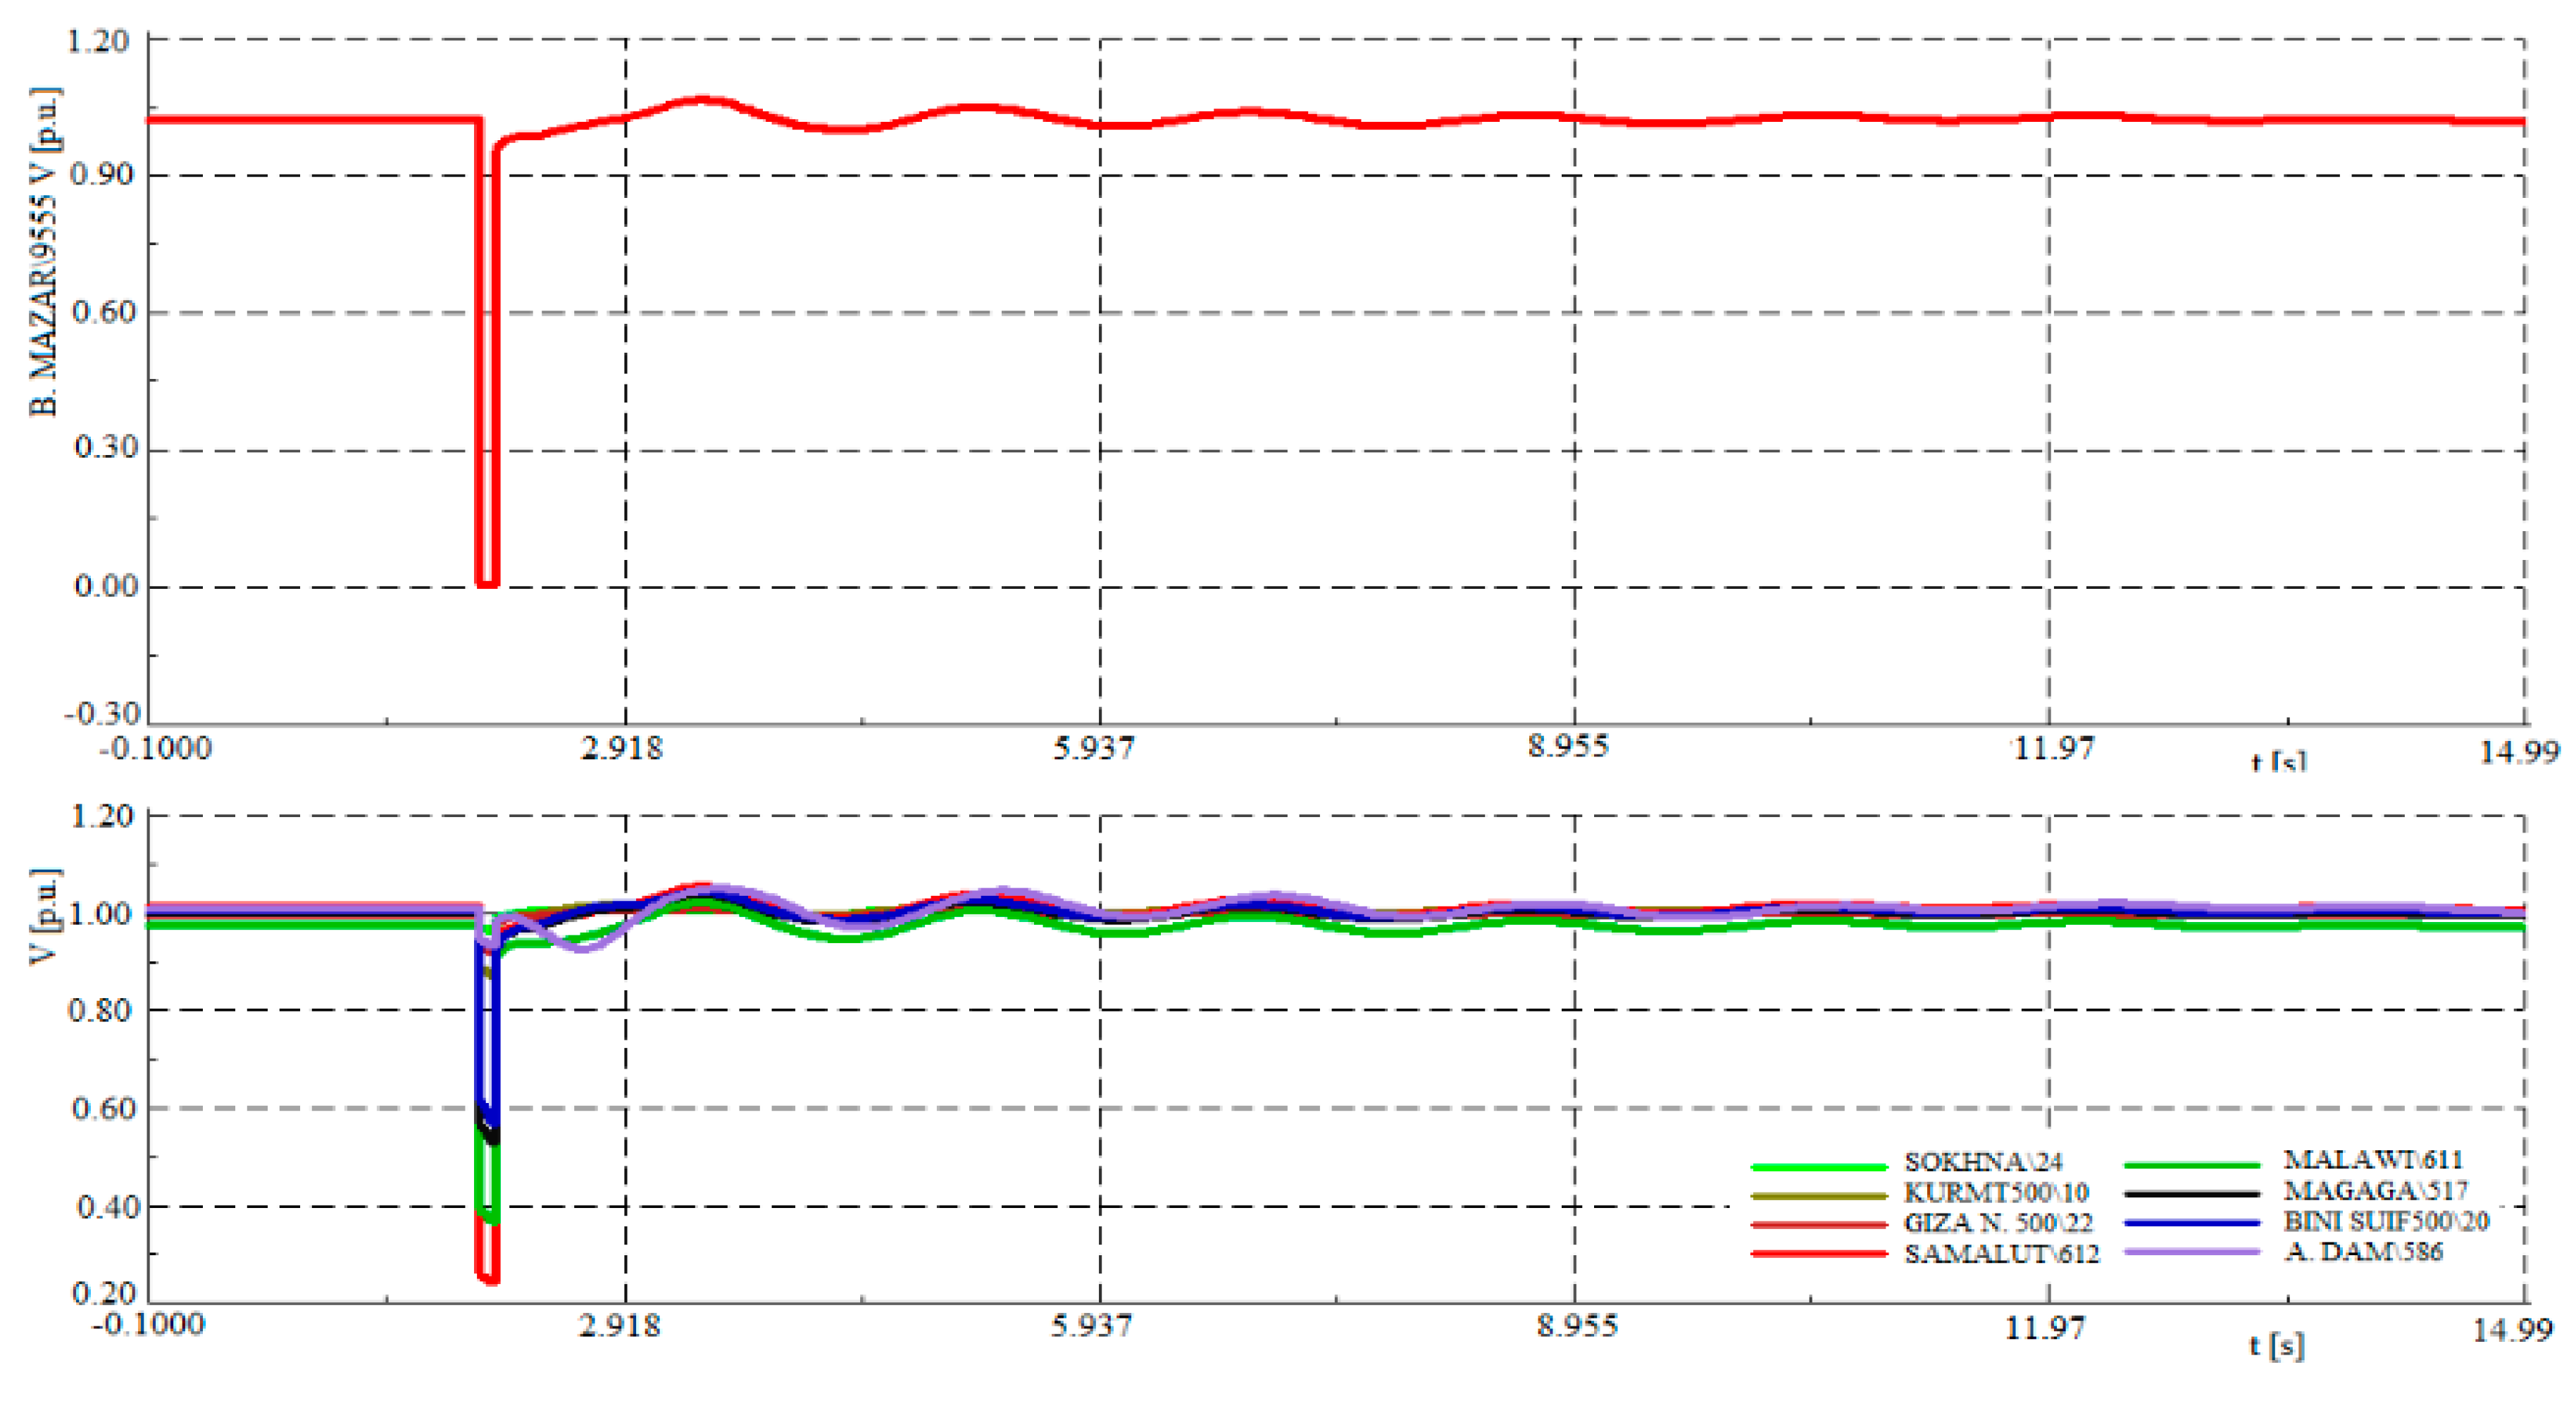
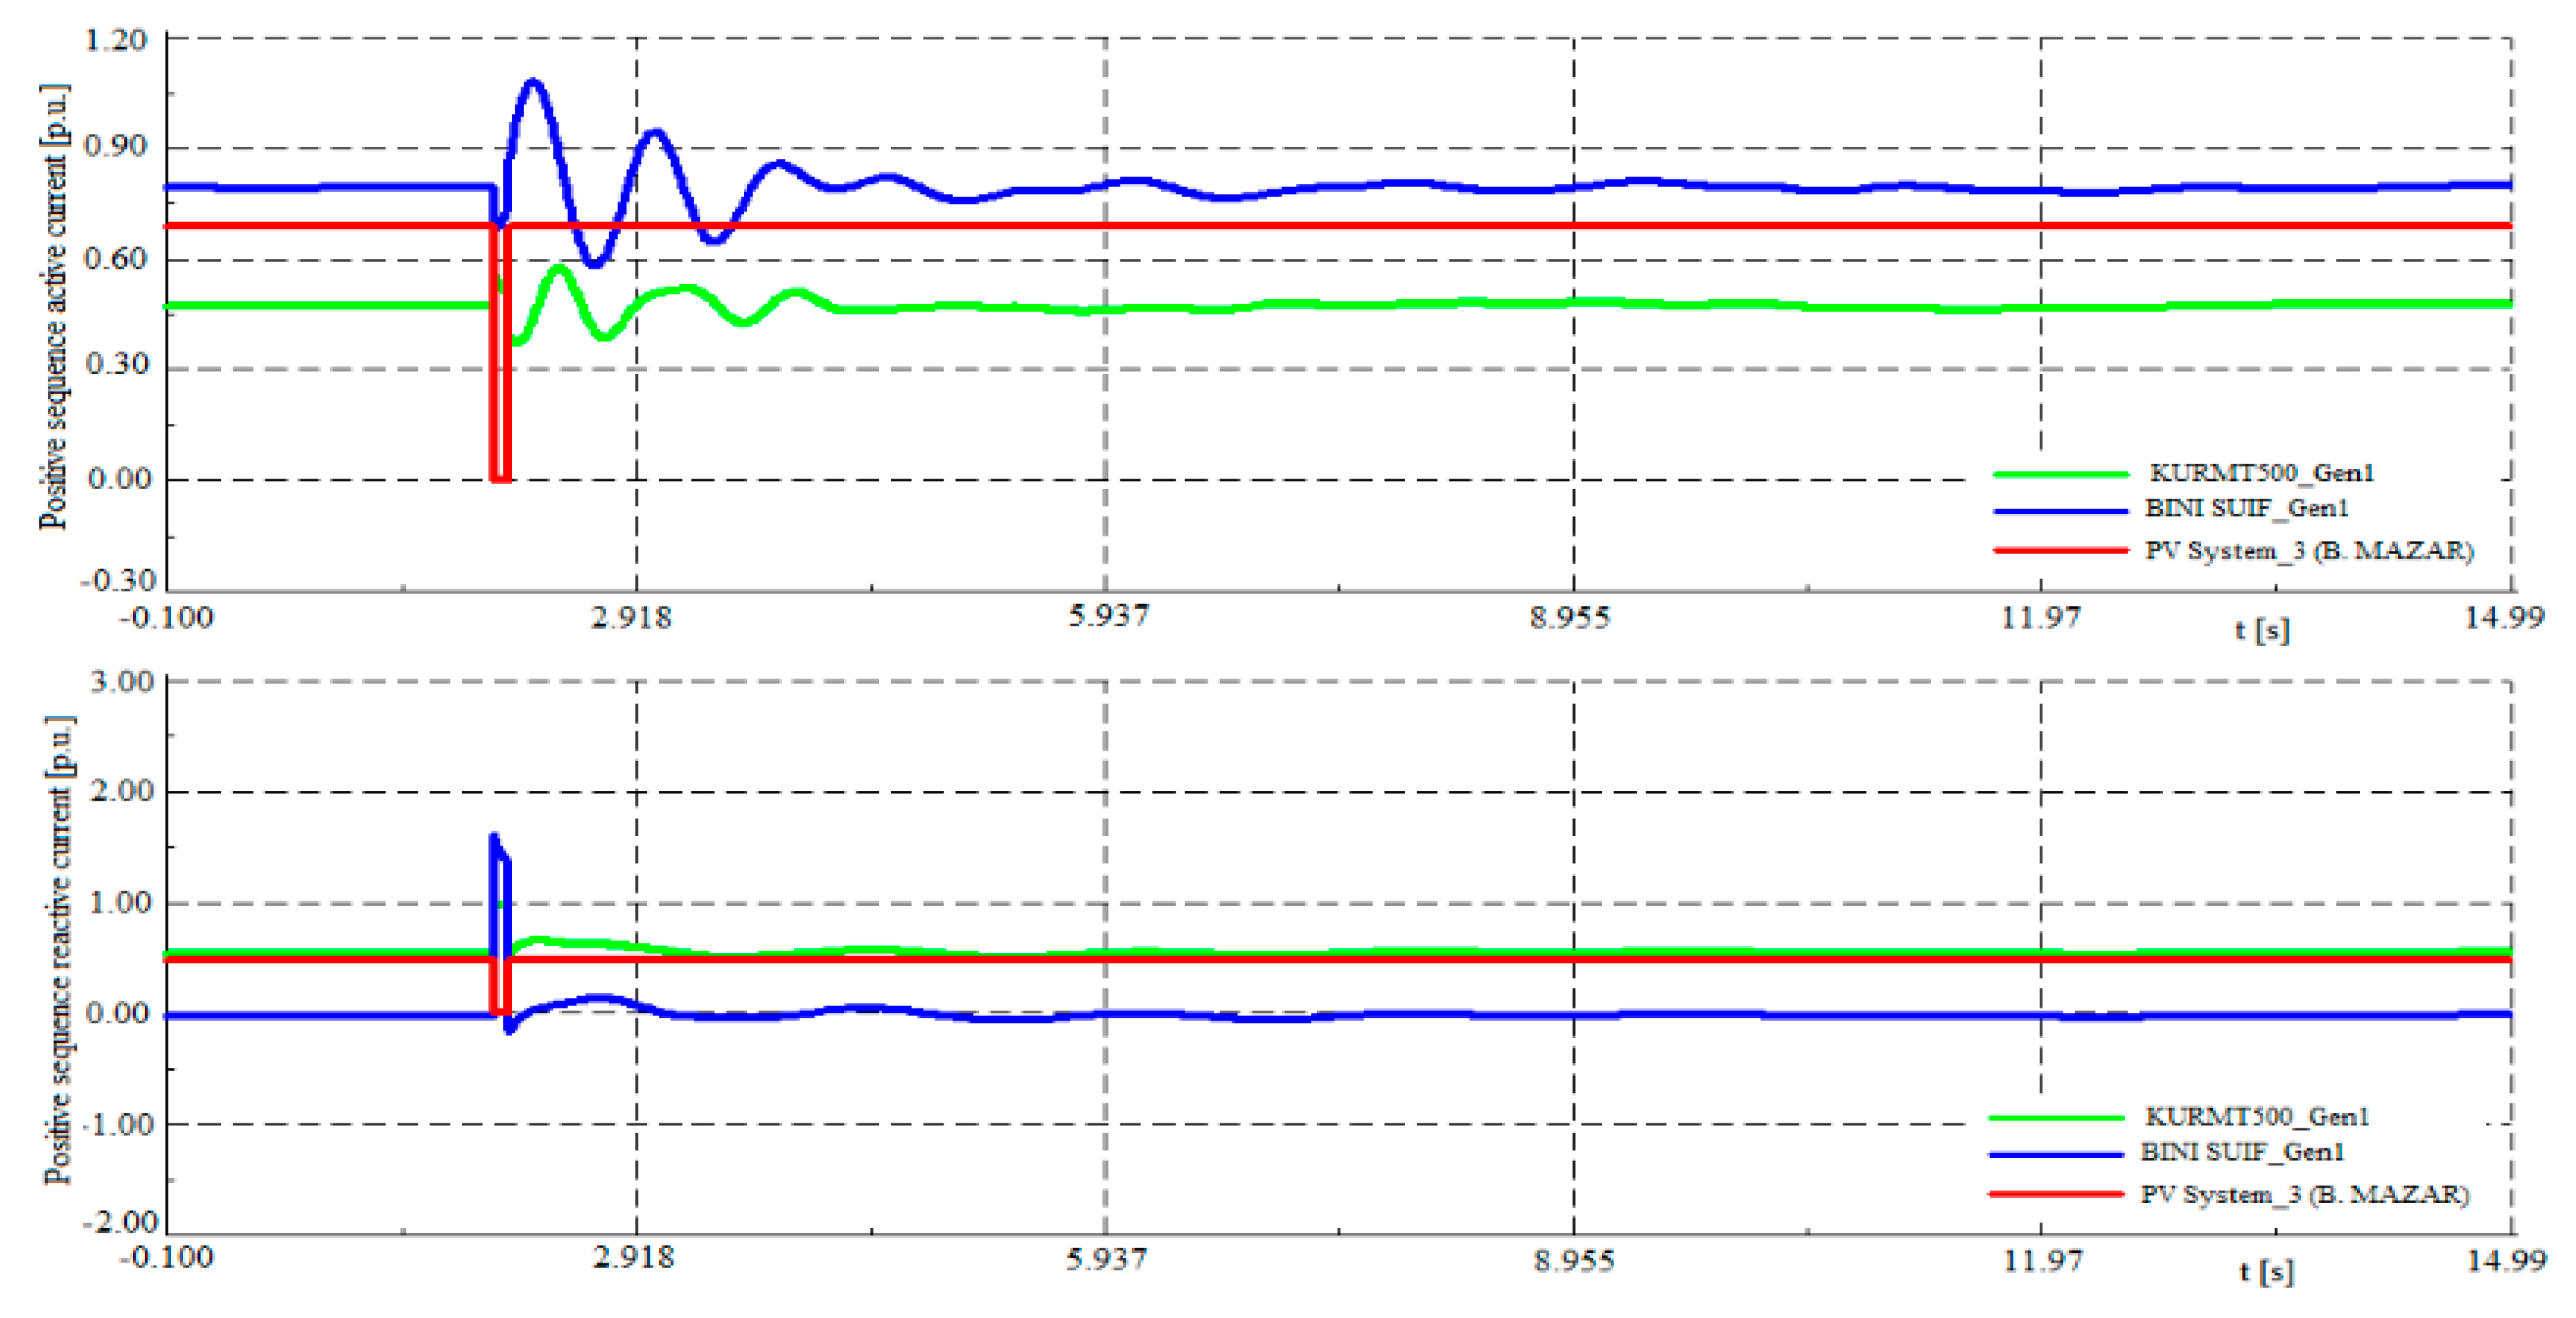
3.3.3. Three Phase Short Circuit on the Terminals of PV System_3 (Minia, B. Mazar)
Figure 13 shows the variation in the voltage profile in case of the application of a 3-phase fault for 0.1 s at B. Mazar site in the city of Minia. The upper graph presents the variation in terminal voltage at the terminals of the MINIA power plant. The lower graph shows the terminal voltage variations at surrounding substations shown in the schematic diagram of
Figure 4c. Likewise,
Figure 14 represents the variations of the active and reactive components of currents injected at B. Mazar site and the thermal power plants of KURM
1 and BINI SUIF. The results also indicate that the system is stable. Moreover, it has a good transient performance to rapid recovery of the terminal voltage and reactive and active power after fault clearance.
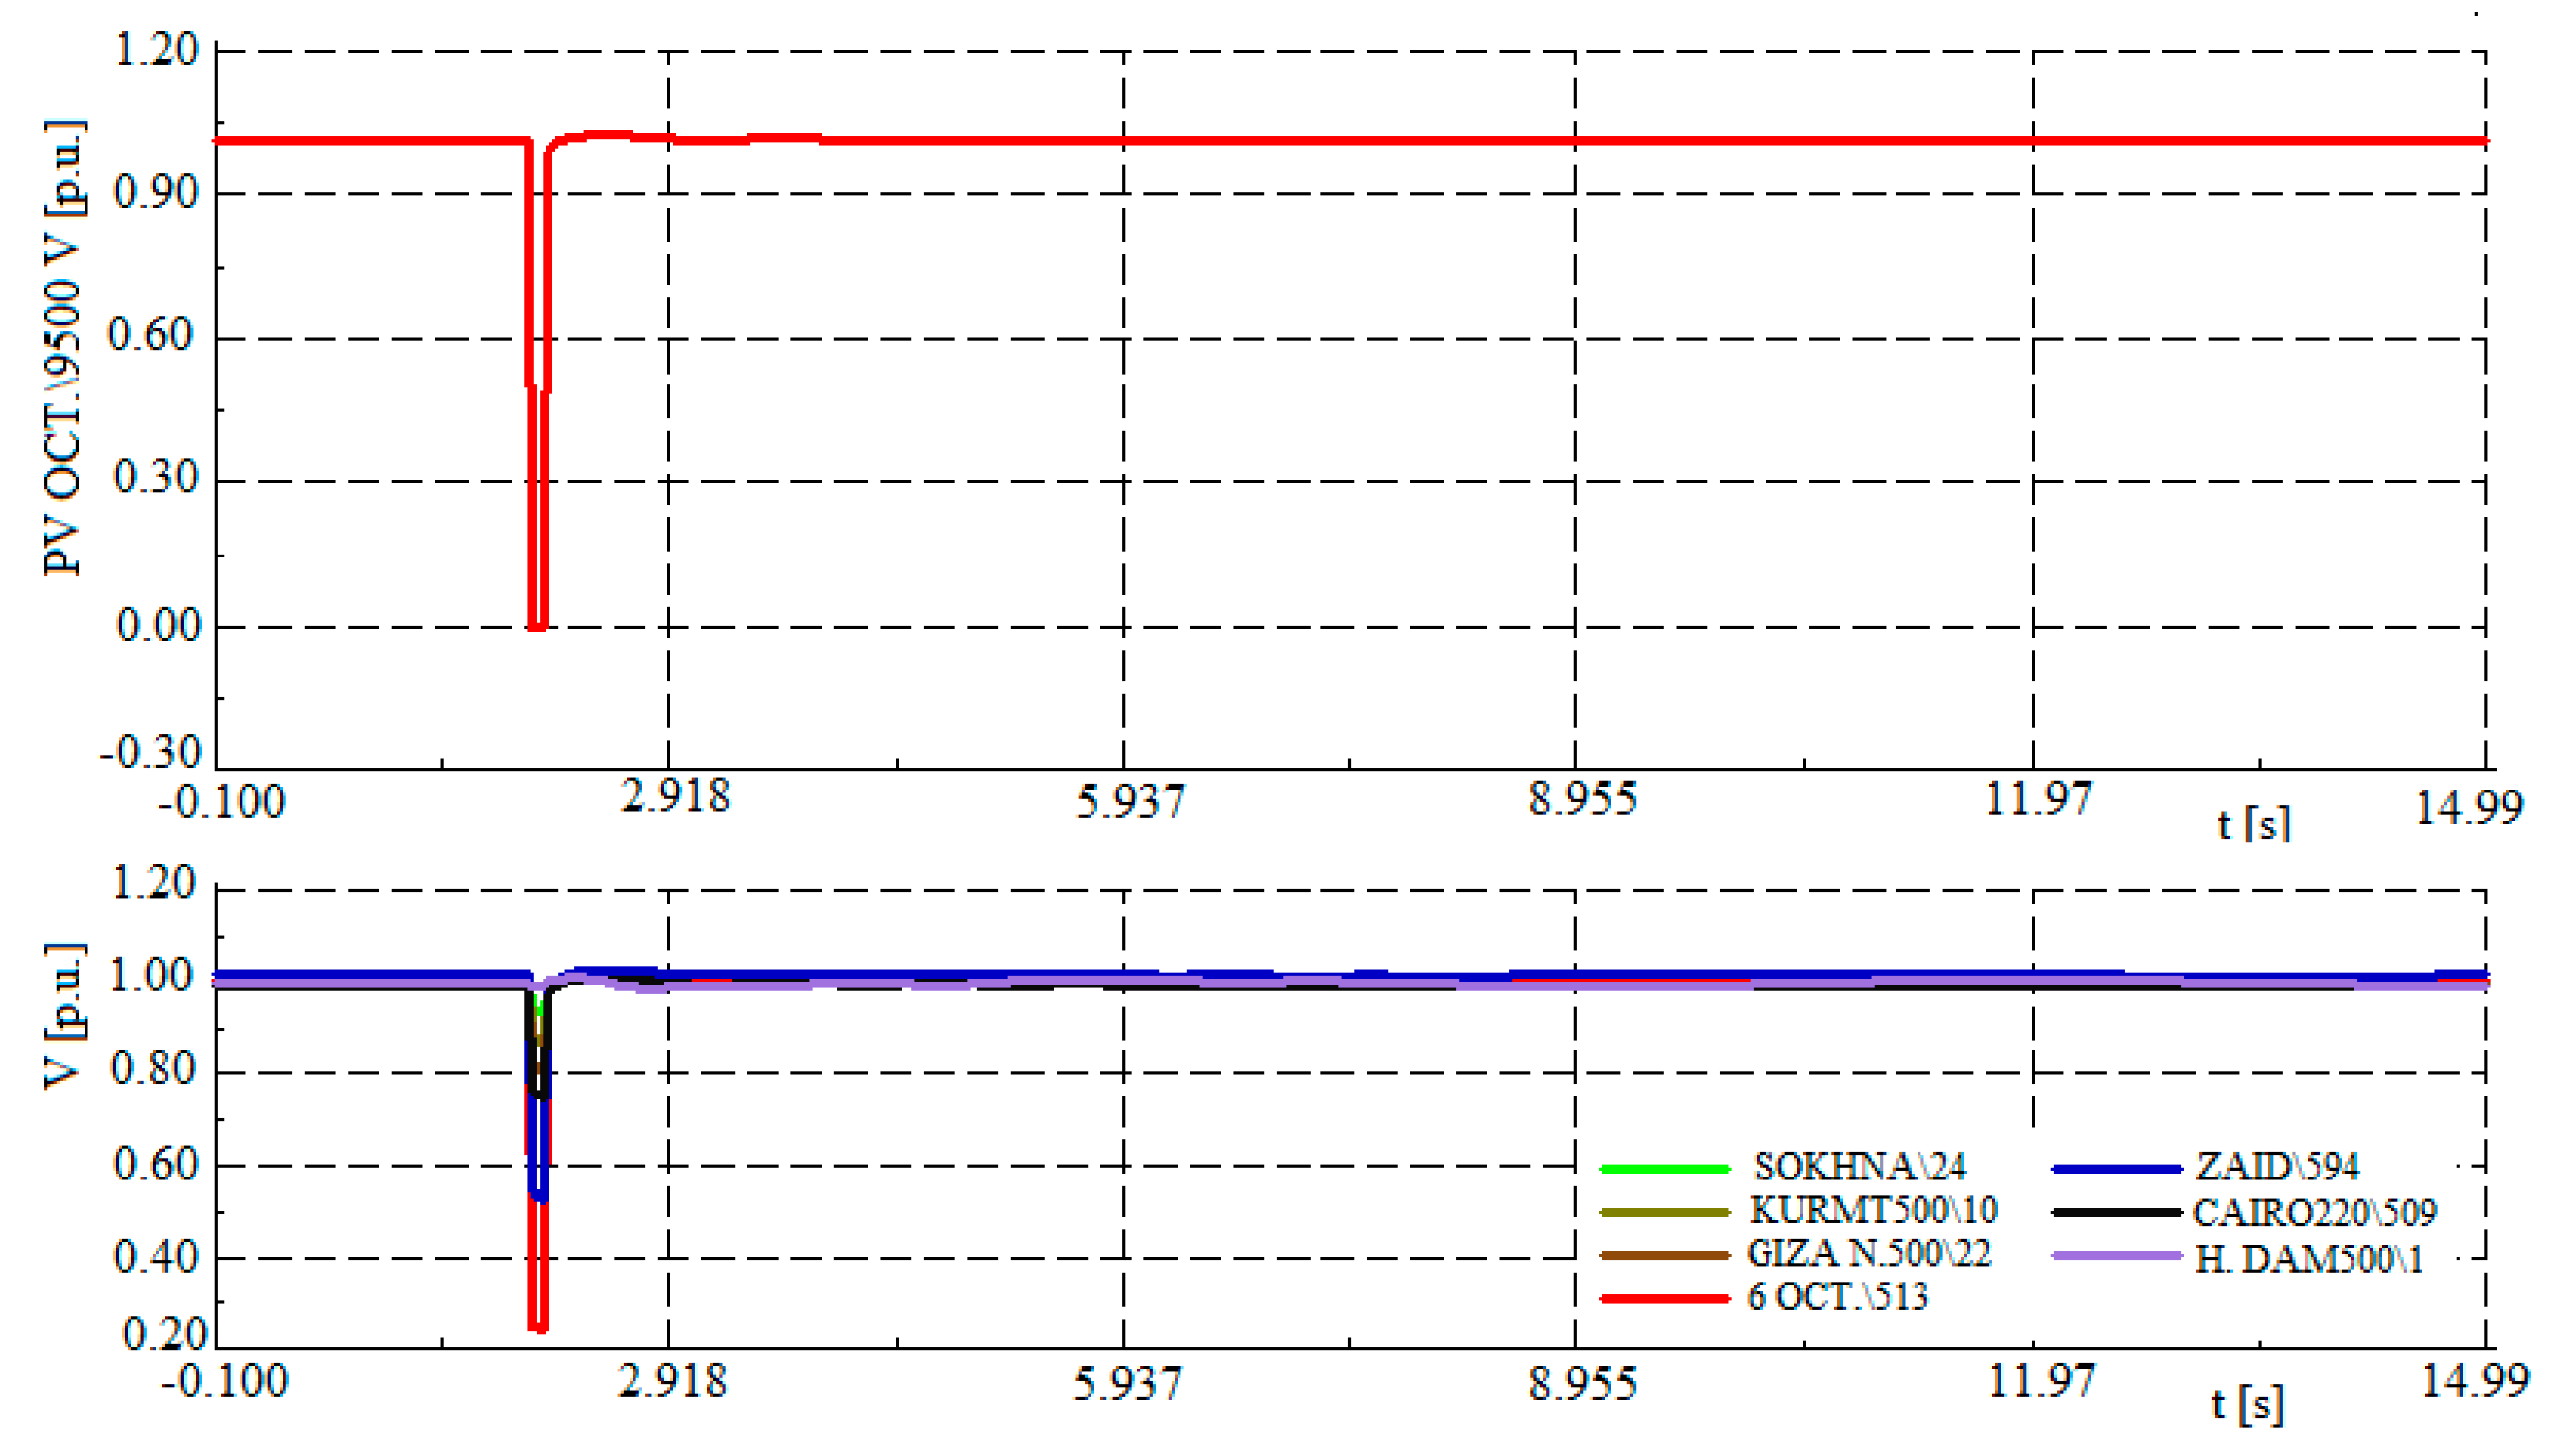
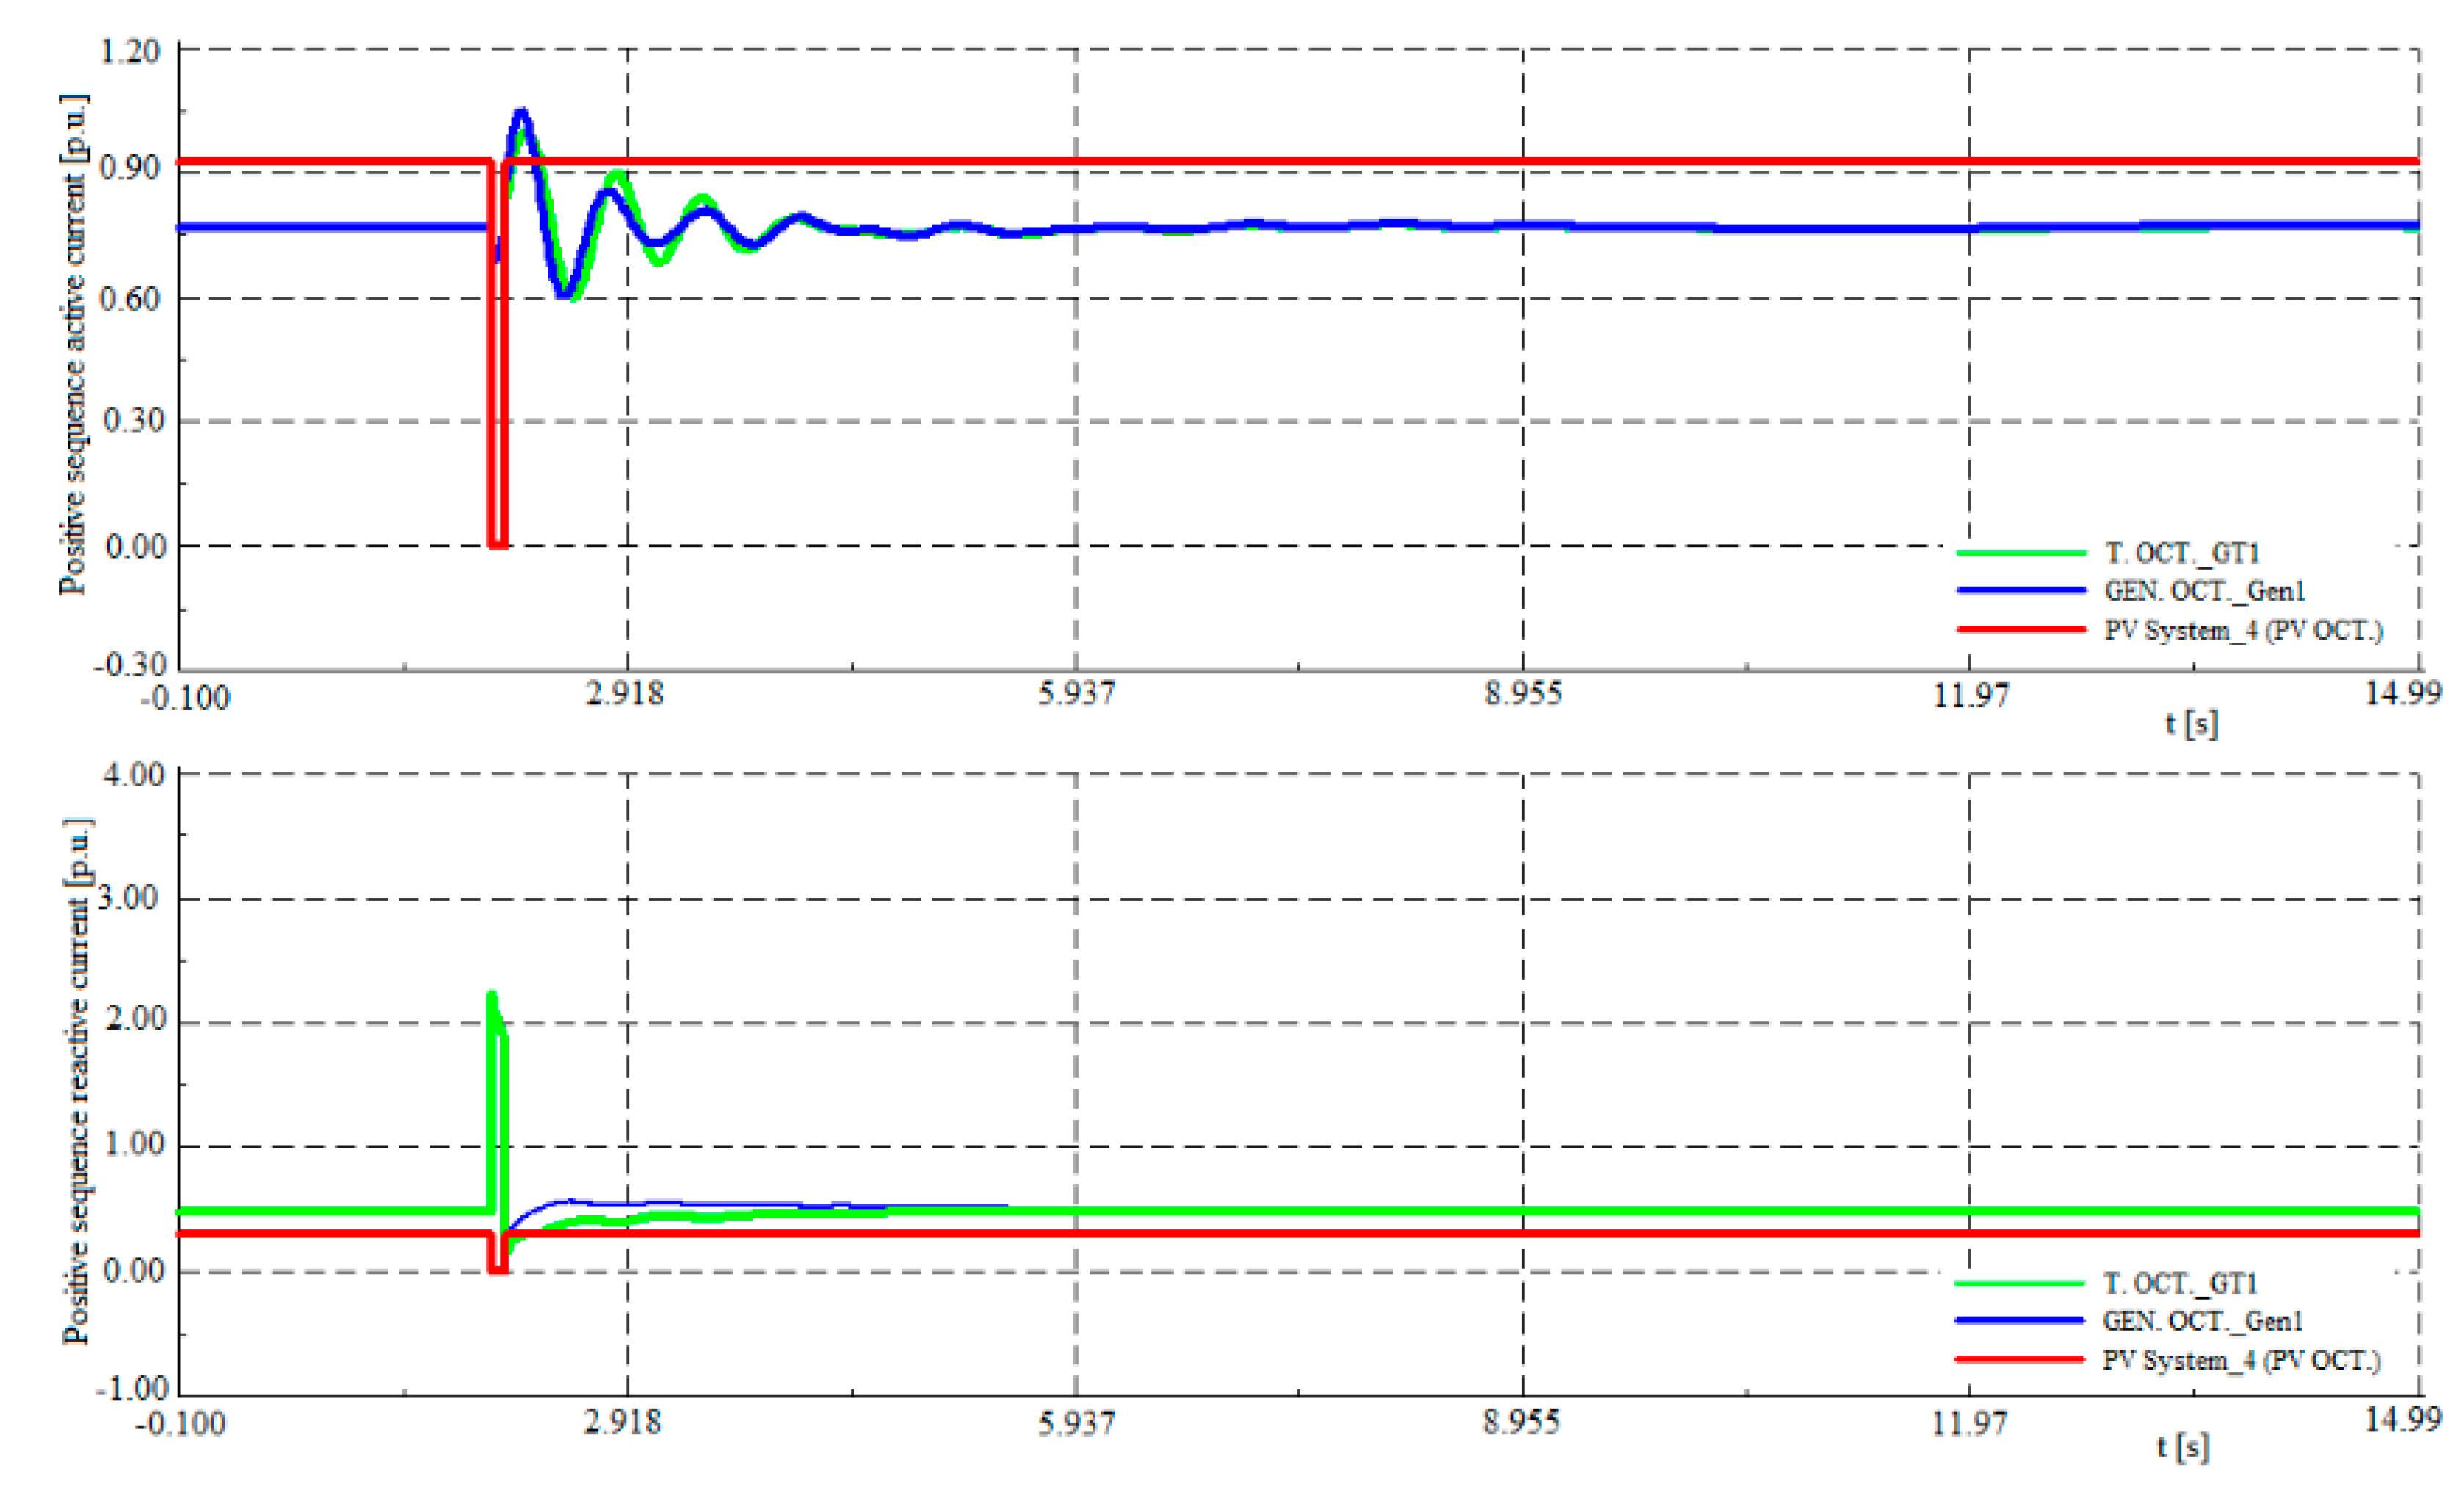
3.3.4. Three Phase Short Circuit on the Terminals of PV System_4 (6.OCT)
Figure 15 shows the variation in the voltage profile in case of the application of a 3-phase fault for 0.1 s at the fourth proposed site for installation of PVPs (6.OCT site). The upper graph presents the variation in terminal voltage at the terminals of the 6.OCT power plant. The lower graph shows the terminal voltage variations at surrounding substations presented in the single line diagram describing this part of the power system given in
Figure 4d. Likewise,
Figure 16 represents the variations of the active and reactive components of currents injected at 6.OCT site, OCT.GEN. and T.OCT.
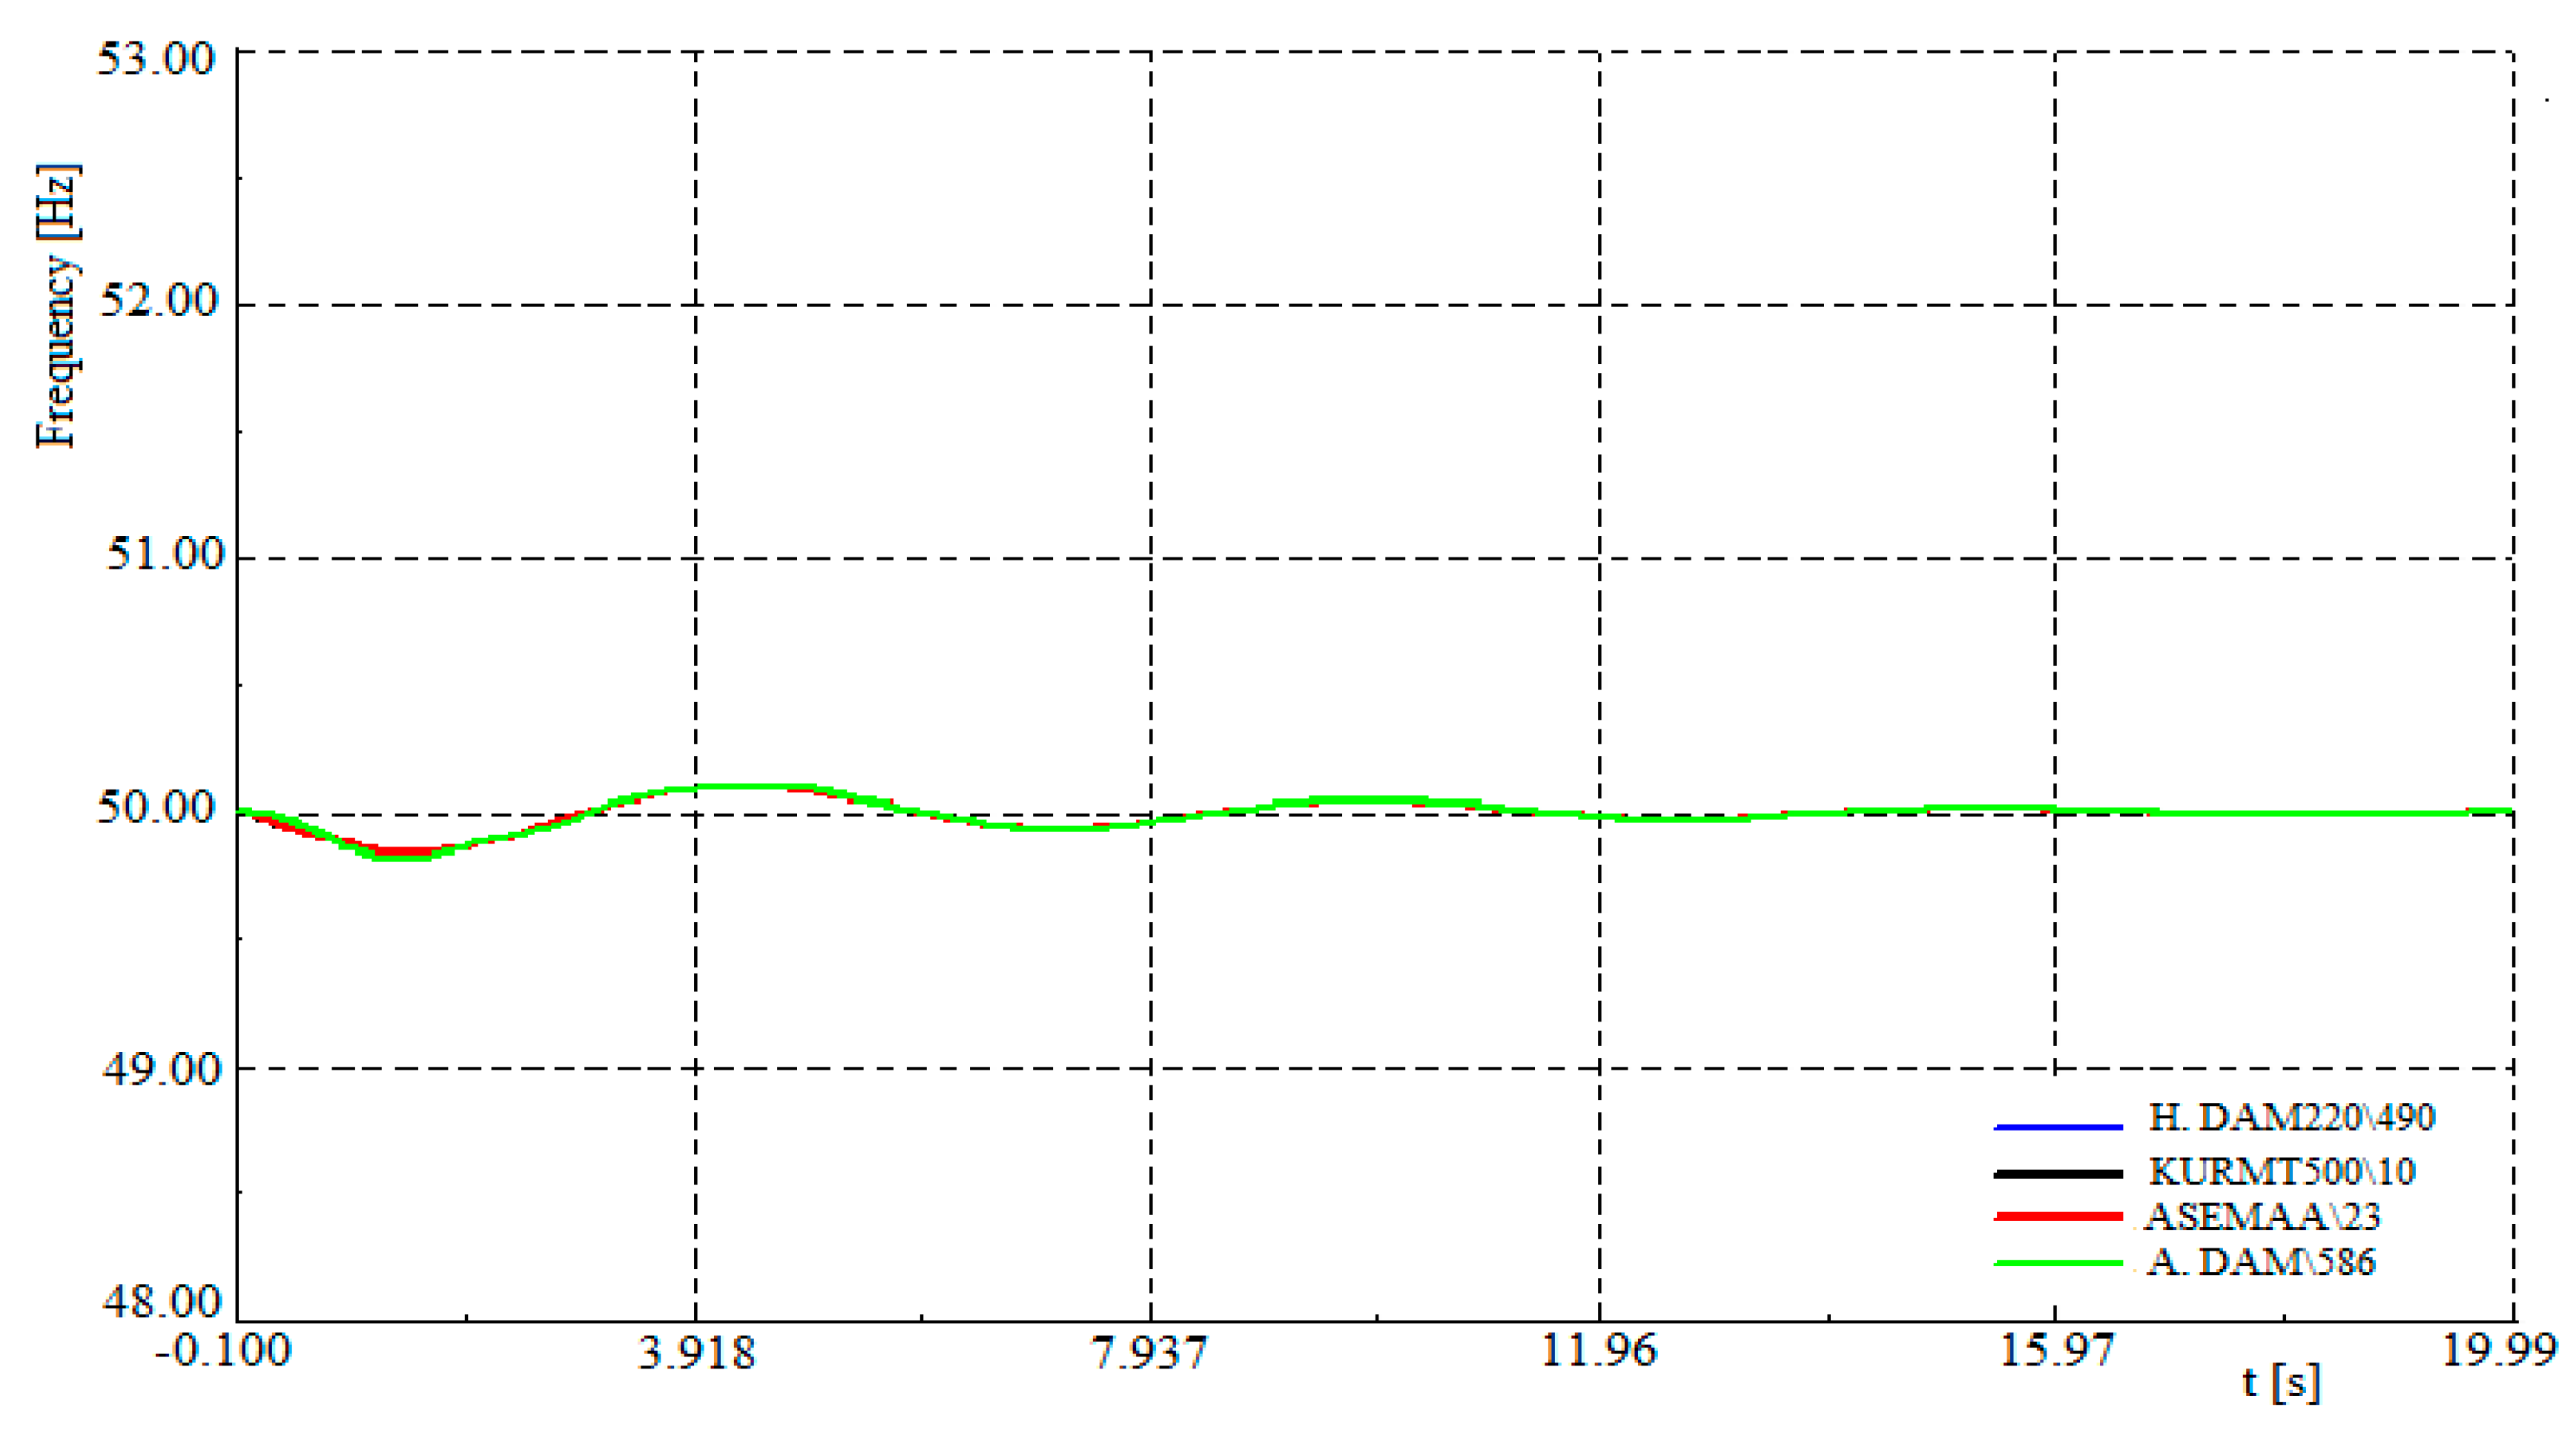
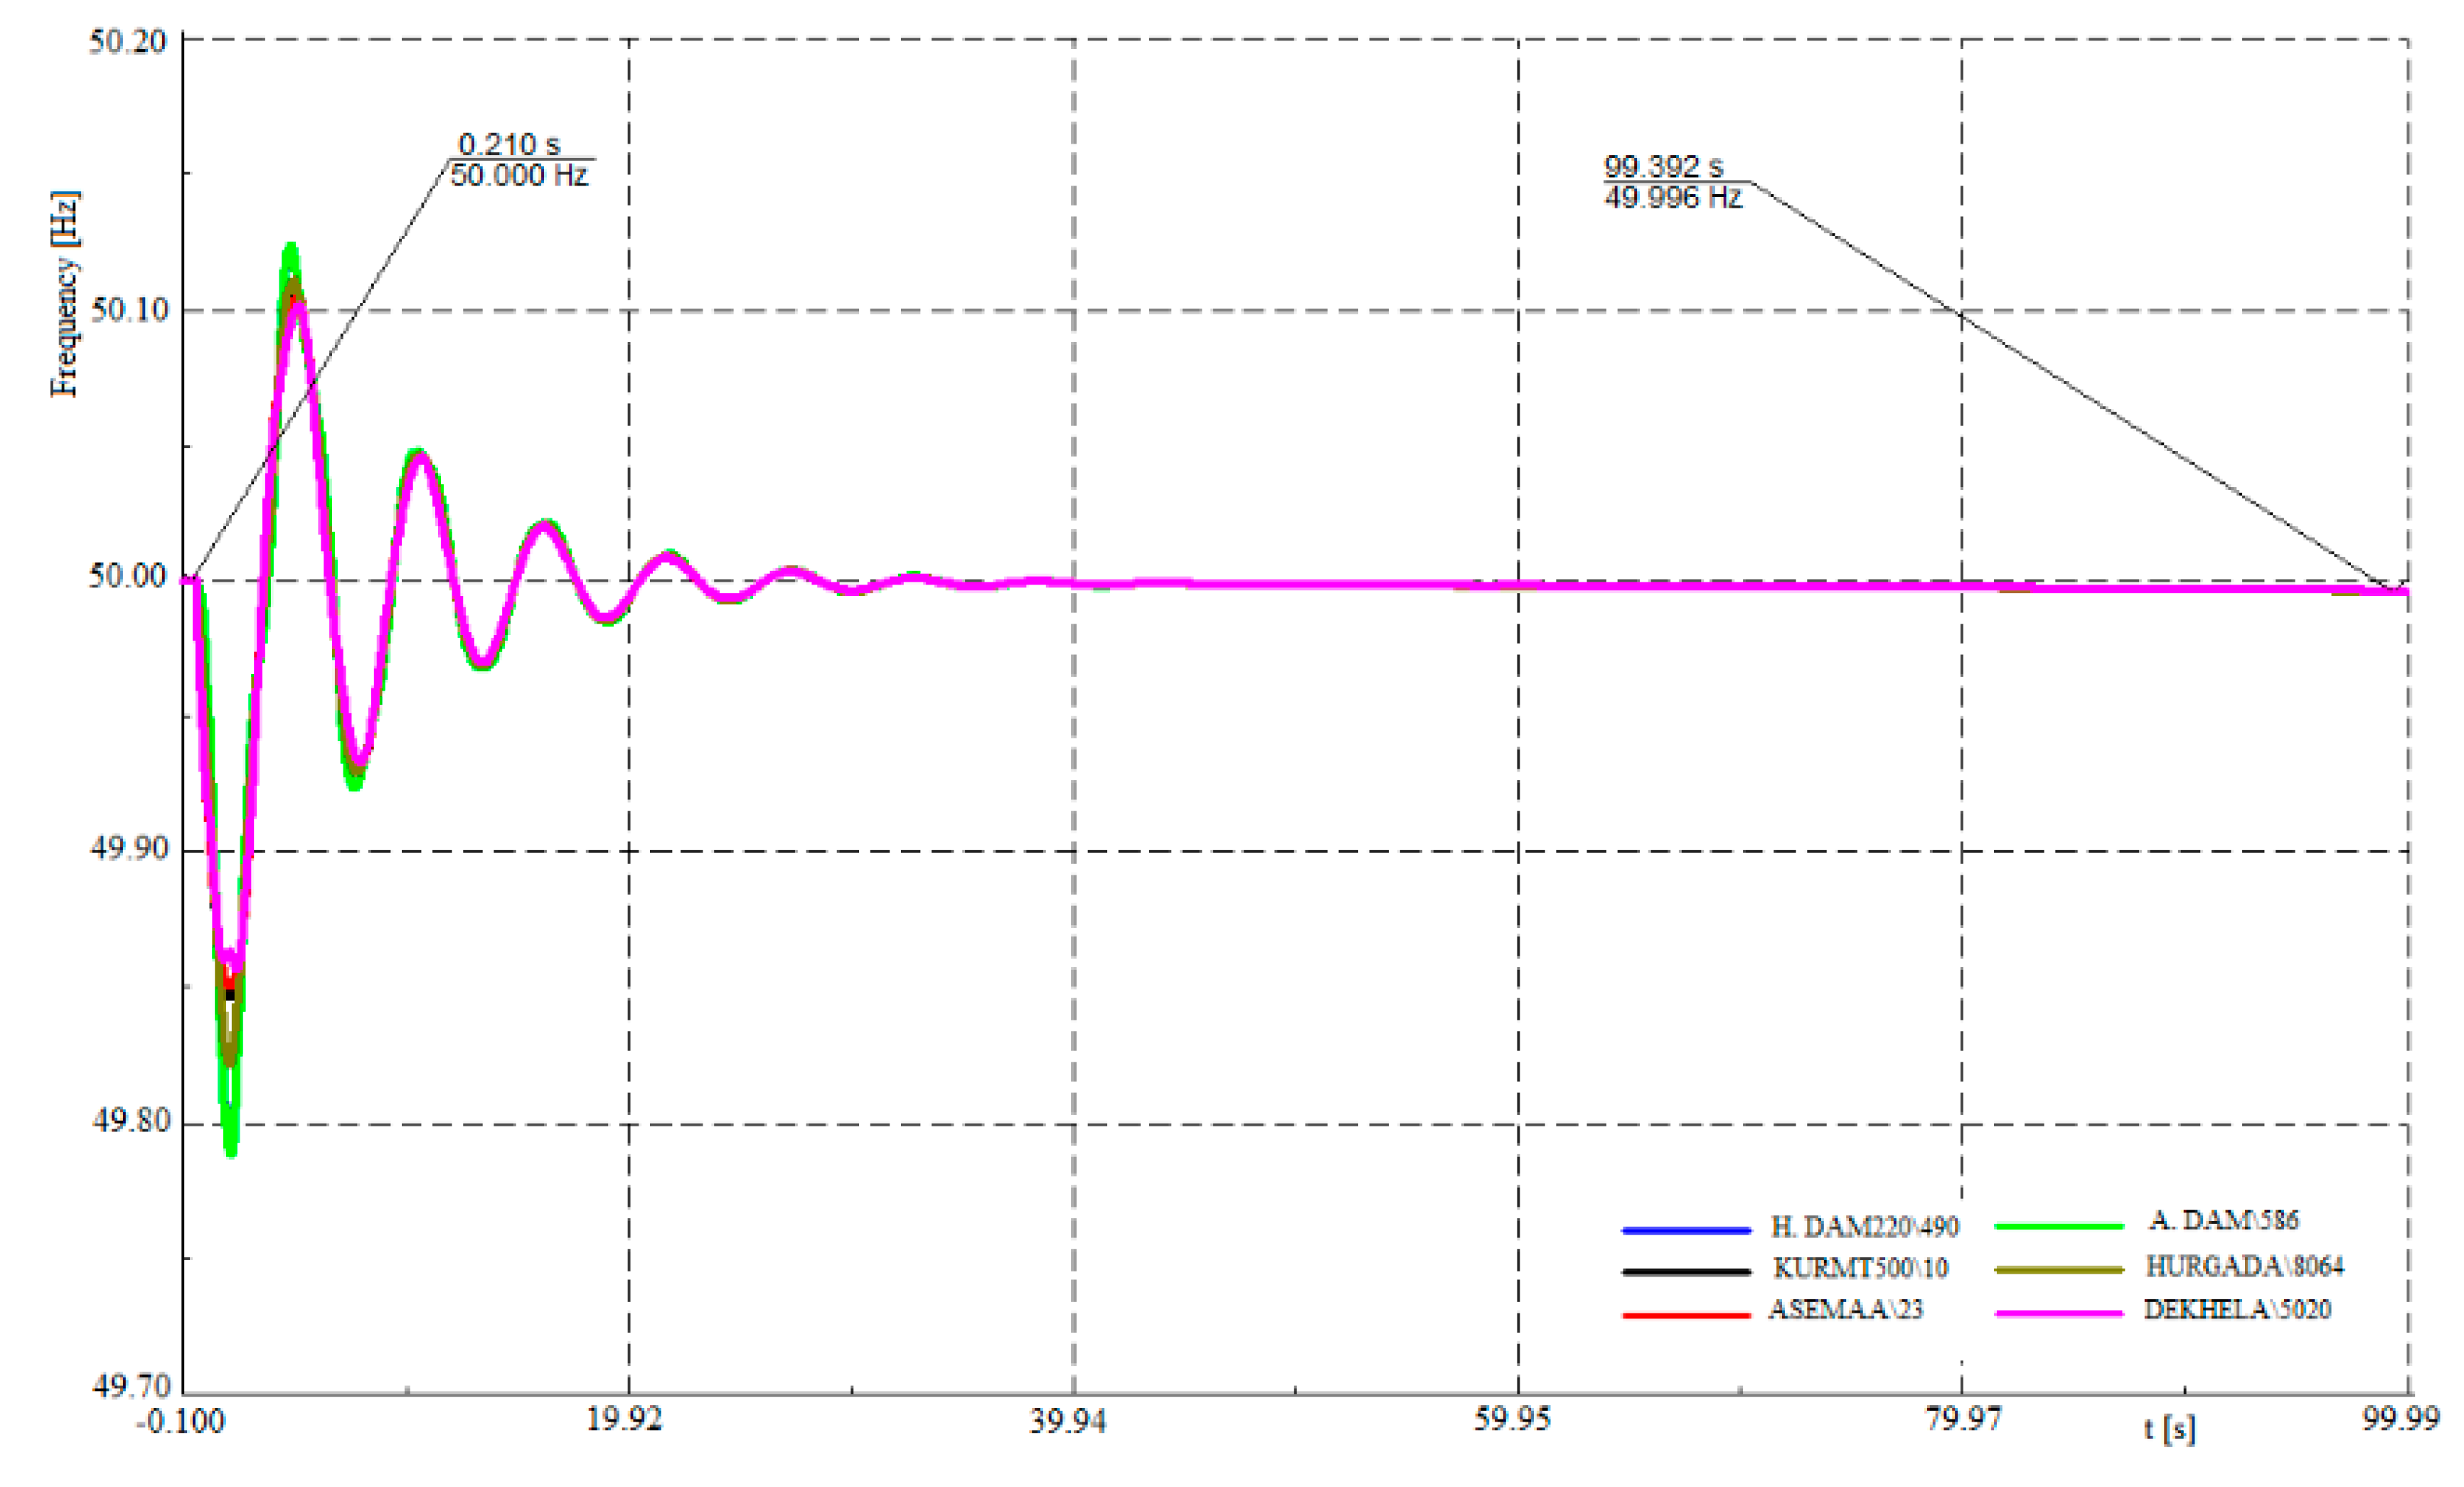
3.4. Frequency Stability Response with the Interconnection of PV Power Plants
In this section, the case of an outage of a certain generating station was simulated to examine frequency stability in the Egyptian power system. The following events have been considered:
- (1)
The total demand for energy is covered from conventional power plants with 0% PV penetration,
- (2)
3000MW of the load demand is obtained from the proposed PV power plants.
Figure 17 and
Figure 18 show the variation of the electrical frequency after an incident tripping of a large generating power plant (NORTH GIZA), with a generating capacity of 2250 MW for the two predefined scenarios.
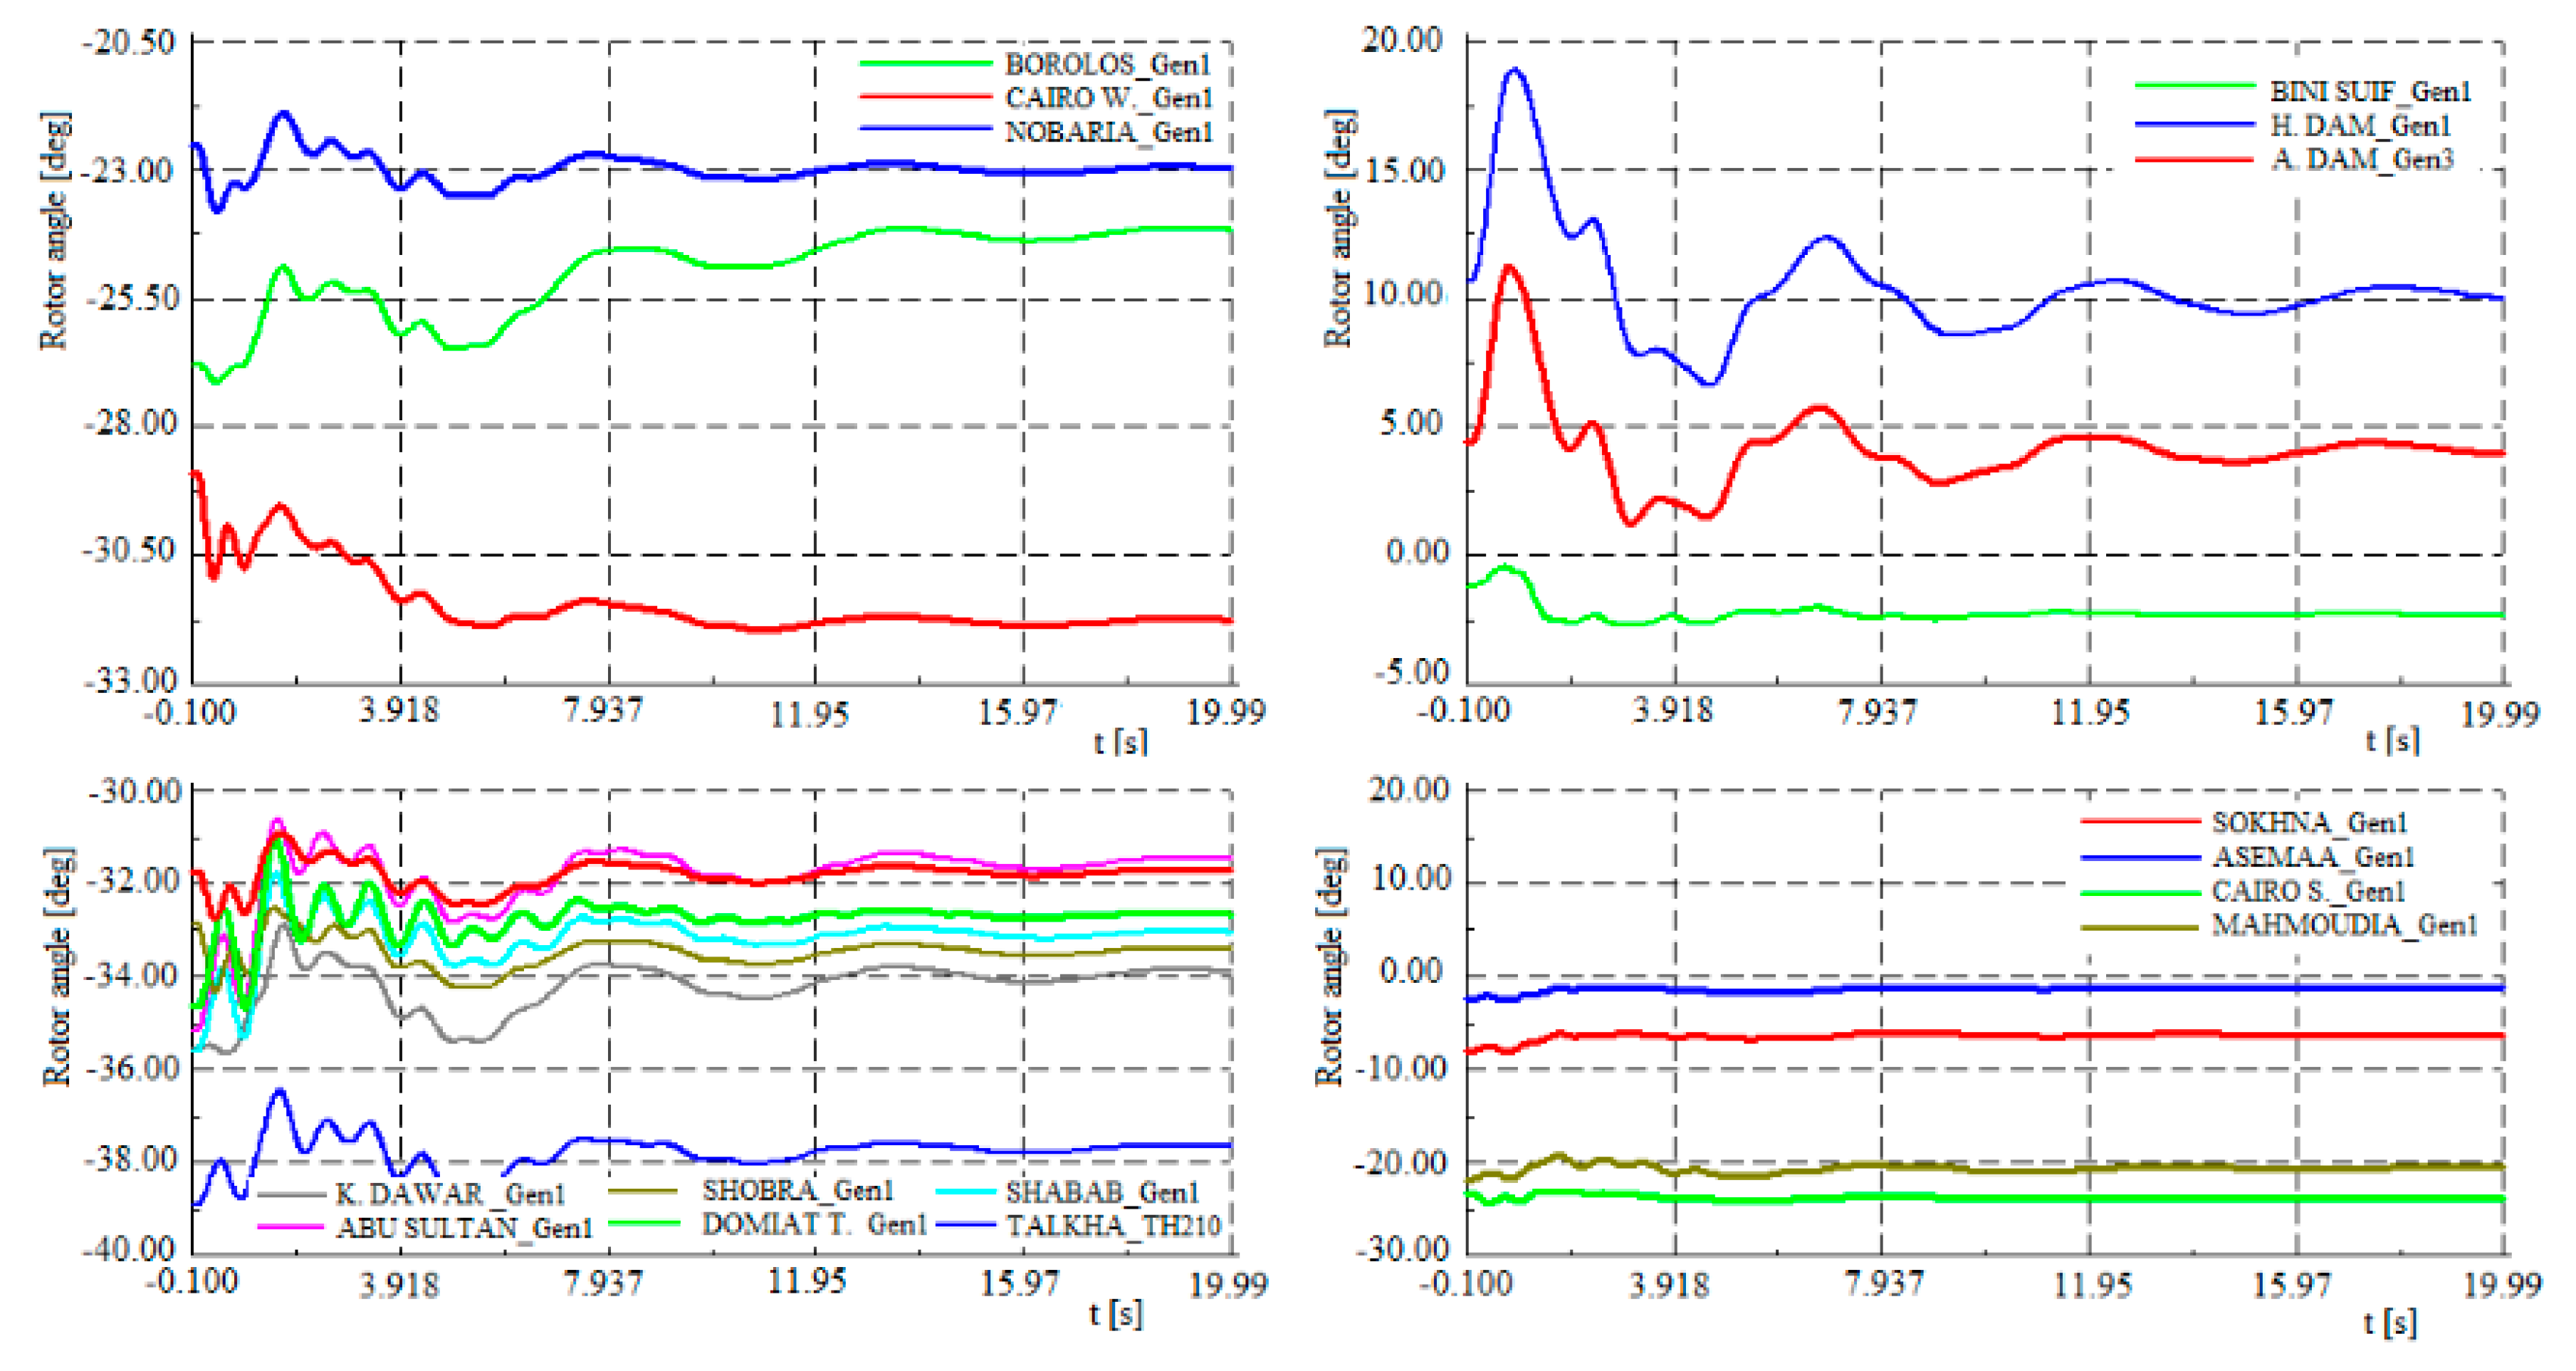
Figure 19 and
Figure 20 show the response of rotor angle of a number of the generators of the conventional generating stations operating on the system with No PV generation and with 3000MW renewable energy from the proposed sites of the PV power plants. From these figures, it can be noticed that all generators have reached steady-state condition after the outage of NORTH GIZA power plant.


 ,
, 


