Power Loss Minimization and Voltage Stability Improvement in Electrical Distribution System via Network Reconfiguration and Distributed Generation Placement Using Novel Adaptive Shuffled Frogs Leaping Algorithm

 ,
, 
Abstract
:1. Introduction
2. Problem Formulation and Implementation of ASFLA in Electrical Distribution System
2.1. Objective Functions
- -
- Size of DG:
- -
- Position of DG:
- -
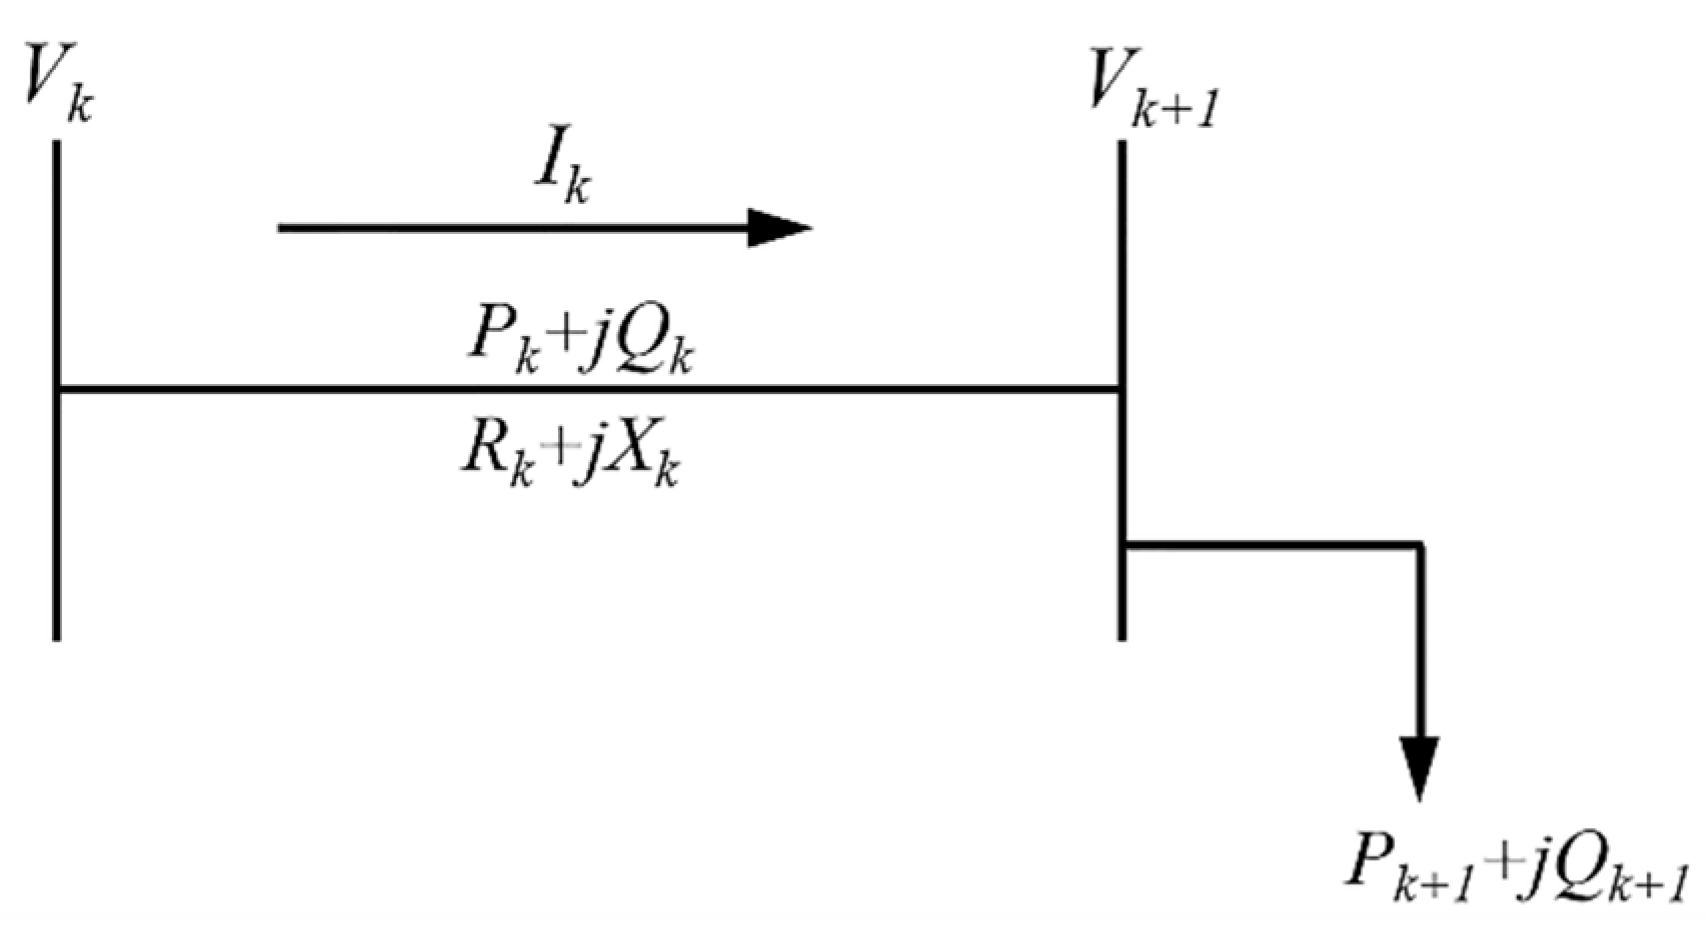
- Bus voltage: , where k = 1 to Nbus
- -
- Branch current: , where i = 1 to Nbr
- -
- Power factor: PF ≥ 0.85
2.2. Implementation of ASFLA in Network Reconfiguration and DG Placement Problems
- Step 1: Define the input data of the electrical distribution system.
- Step 2: Randomly generate the initial frog populations, as written in Equation (6).where N is the population of frogs defined as 90 in this work [19], and .swn is the number of opened sectionalizing or tie-line switches in loop n, LoDGn is the number of bus for DG installation and SizeDGn is the size of DG installed at bus n.In the population generating process, the constraints including radial topology and every node connected after network reconfiguration were taken into account. So, we adapted the graph theory to the generating process in order to prevent an occurrence of an infeasible population, as the following details:
- (1)
- Generate swn as the first opened switch where swn can be sectionalizing or tie-line switch in the loop n.
- (2)
- Generate another opened switch swn+1 by using graph theory under the following conditions:
- -
- If swn is not a member of the common switch between any loop n and loop n + 1, swn+1 will be a member of loop n + 1.
- -
- If swn is a member of the common switch between any loop n and loop n + 1, swn+1 will be member of loop n + 1 excluded a member of the common switch.
- -
- When a common switch in any loop connected to loop n + 1 is opened, swn+1 will be a member of loop n + 1 excluded a member of the common switch of that loop.
- Step 3: Rank the best to worst results obtained from Step 2 with regard to the objective function. The best result is defined as the 1st frog and the rest will follow.
- Step 4: Rearrange the ranked frog results obtained from Step 3 into groups of frog called memplex. There are nine memplexes considered in the implementation, and accordingly the frog member in each memplex will be nine. The 1st to 9th frogs are respectively put into 1st to 9th memplex, afterwards the 10th to 18th frogs will be repeatedly put into 1st to 9th memplex and the rest will follow.
- Step 5: The evolution of the frogs will be accomplished by replacing the worst frog of each memplex, Xw, by the new generated frog, Xnew. We propose an adaptive technique for generating the Xnew by improving the local and global searching of ASFA based on the previous obtained frogs. The Xnew is generated by considering the behaviour of the best answer of all frogs, Xg, the best frog of each memplex, Xb, and the new randomly generated frog, Xrand, as given in Equation (7). The new population of frogs is generated using the information from both local and global searching which are the term and the term, respectively. The radial system constraint is taken into account while solving ASFLA.
- Step 6: Update the locations and positions of frogs, and then repeat Steps 3–5 to obtain a specific number of iteration until the solution is satisfied.
- Step 7: Finish.
3. Results and Discussion
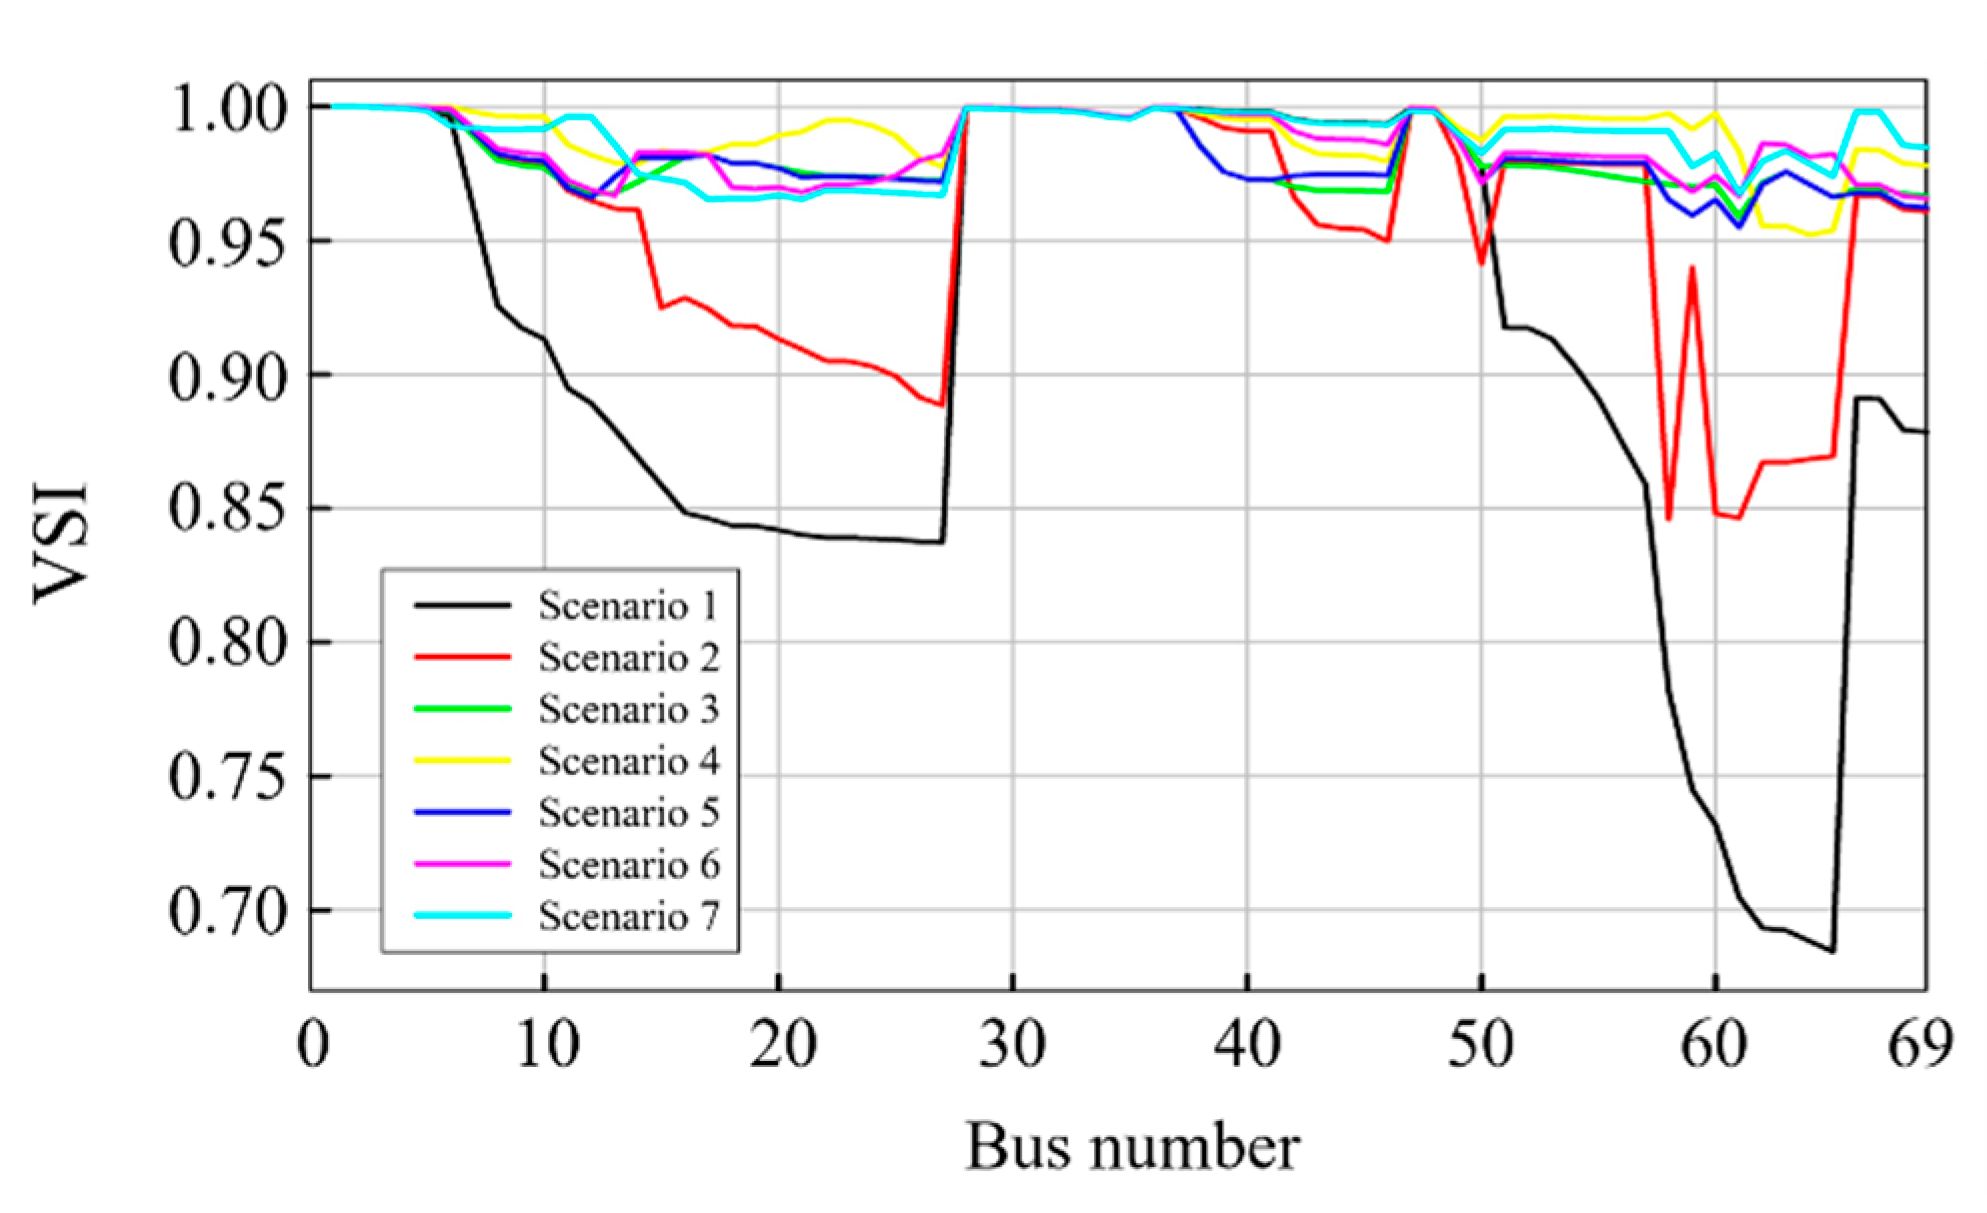
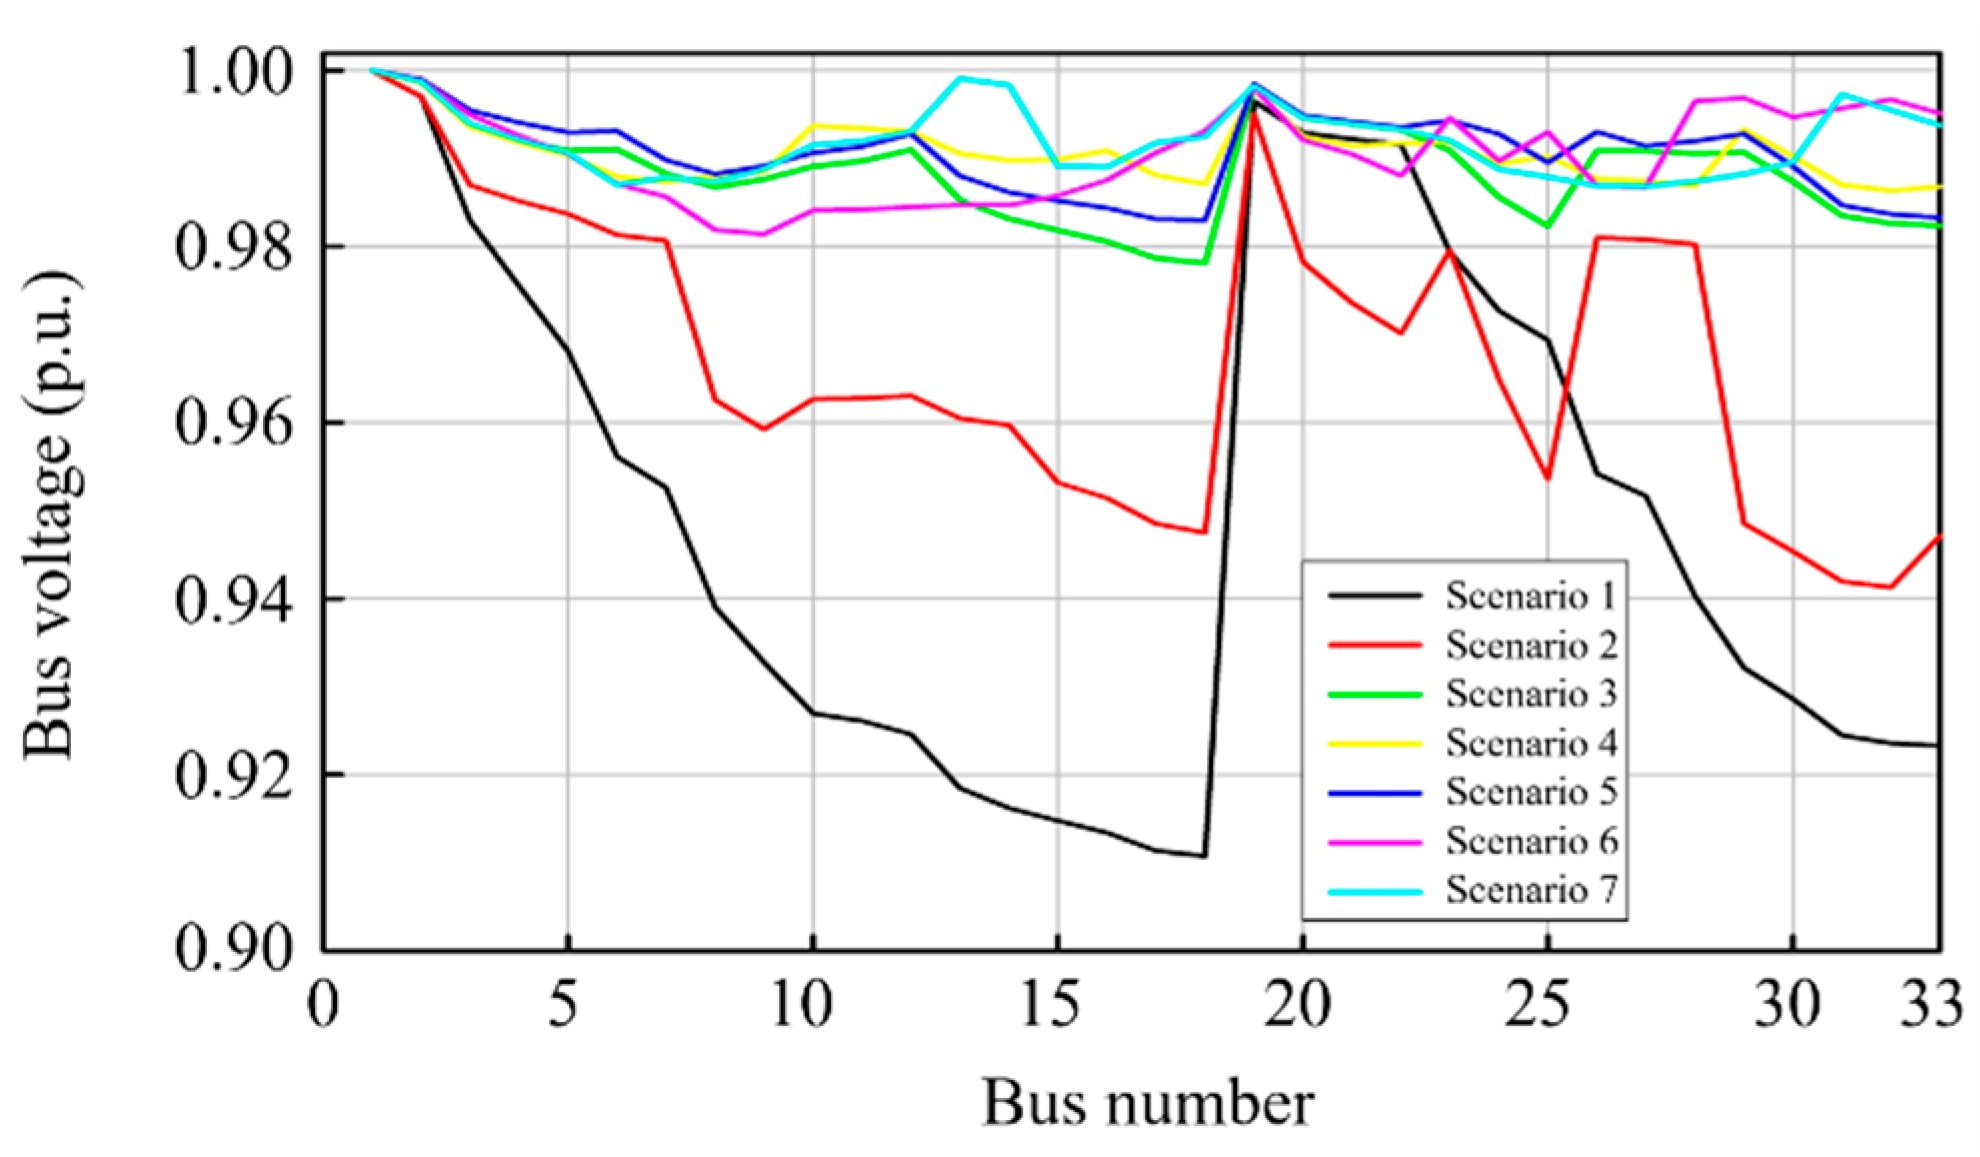
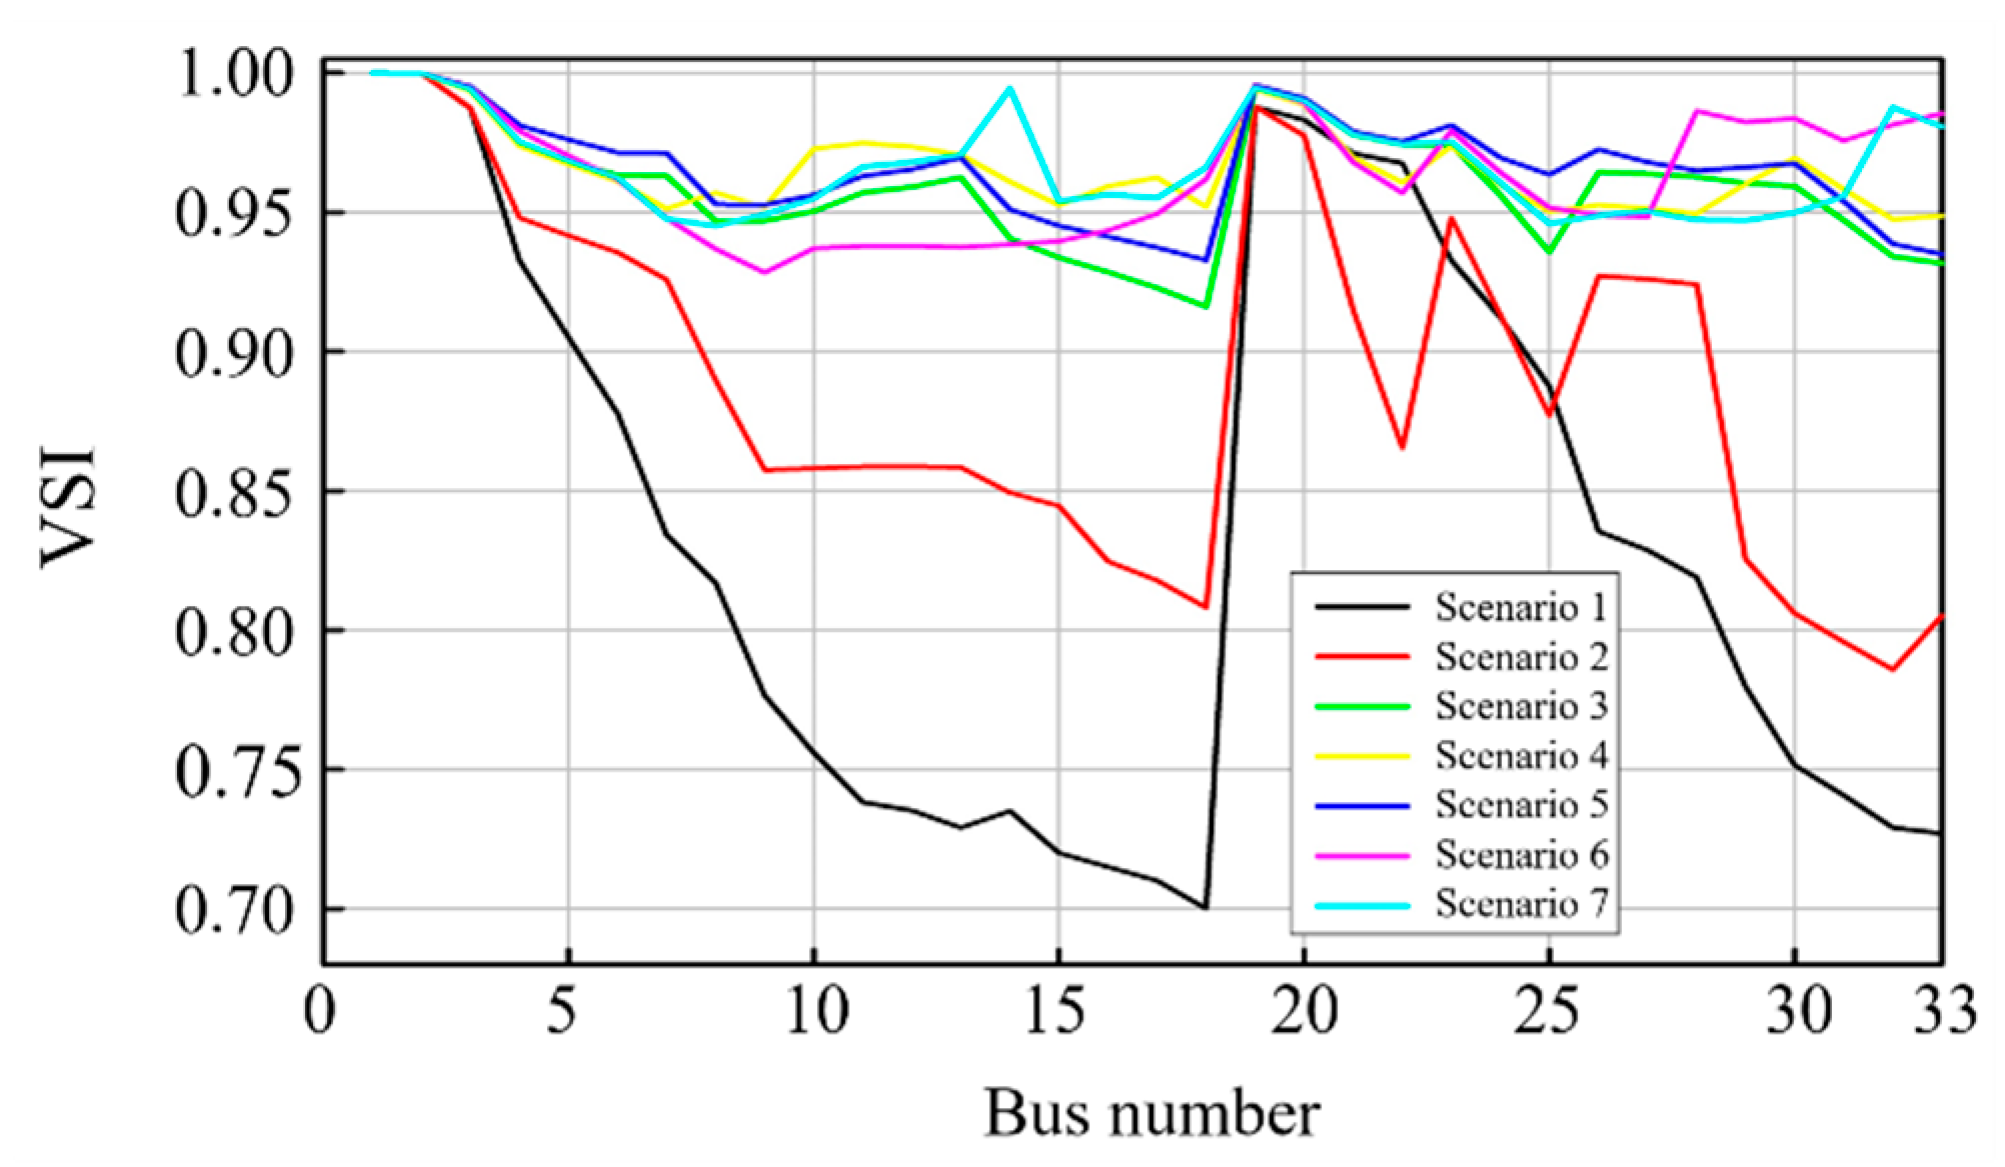
- Scenario 1: Base case system without network reconfiguration and DG installation.
- Scenario 2: The test system with only network reconfiguration.
- Scenario 3: The test system with only DG installation.
- Scenario 4: The test system with DG installation after network reconfiguration
- Scenario 5: The test system with network reconfiguration after DG installation.
- Scenario 6: The test system reconfigured simultaneously with DG installation.
- Scenario 7: The test system reconfigured simultaneously with DG installation and optimal DG location.
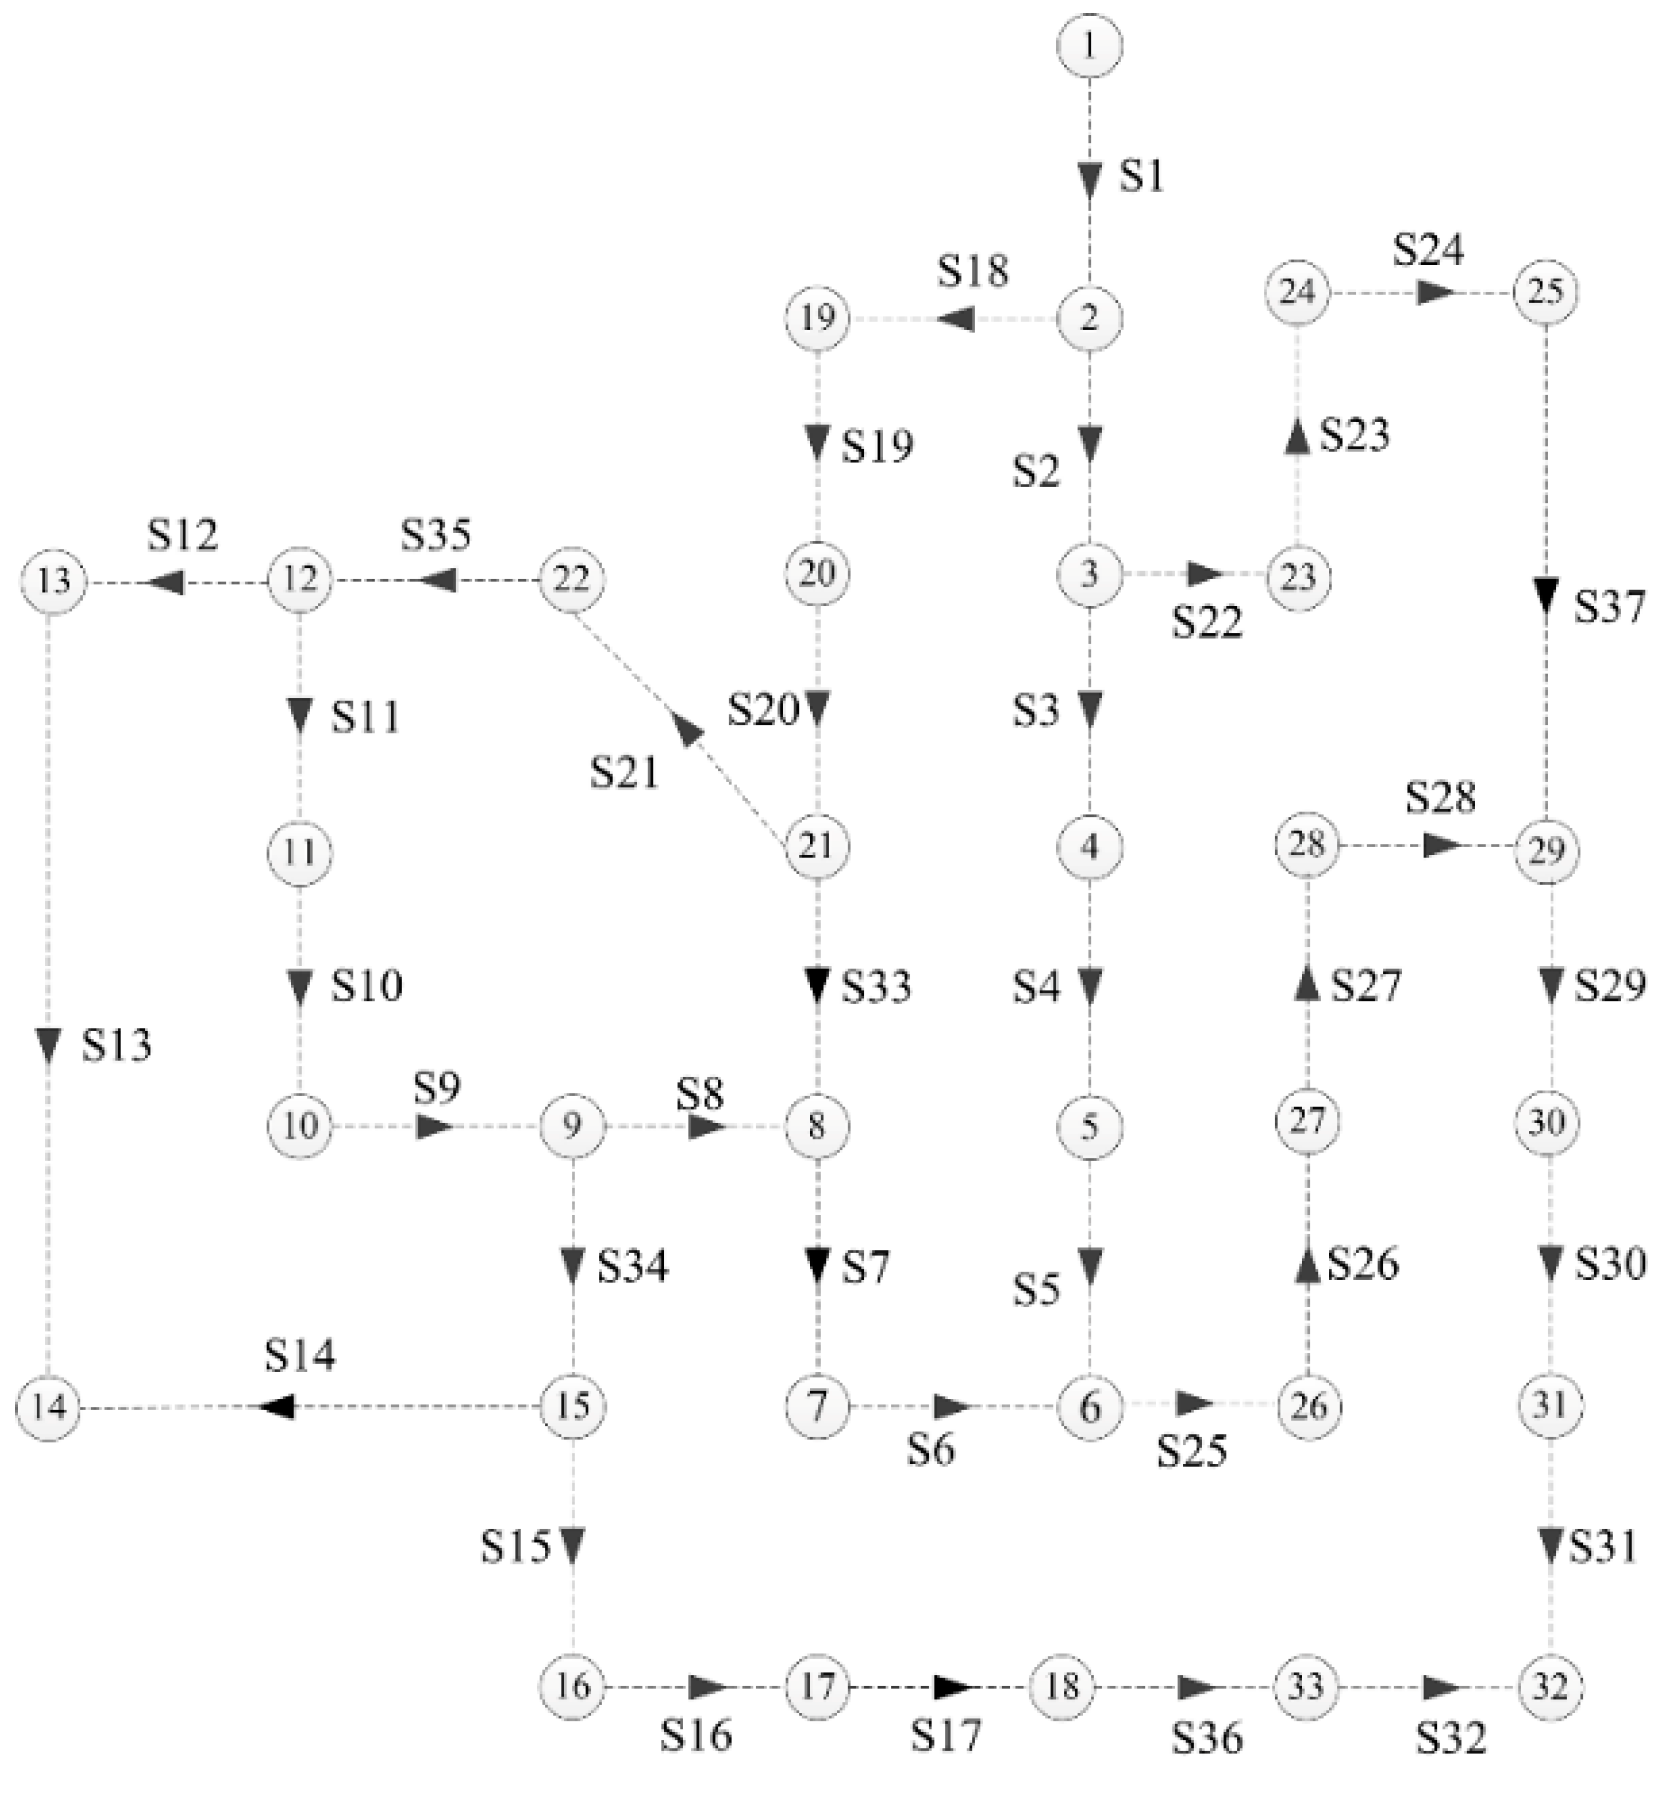
3.1. 33-Bus Distribution System
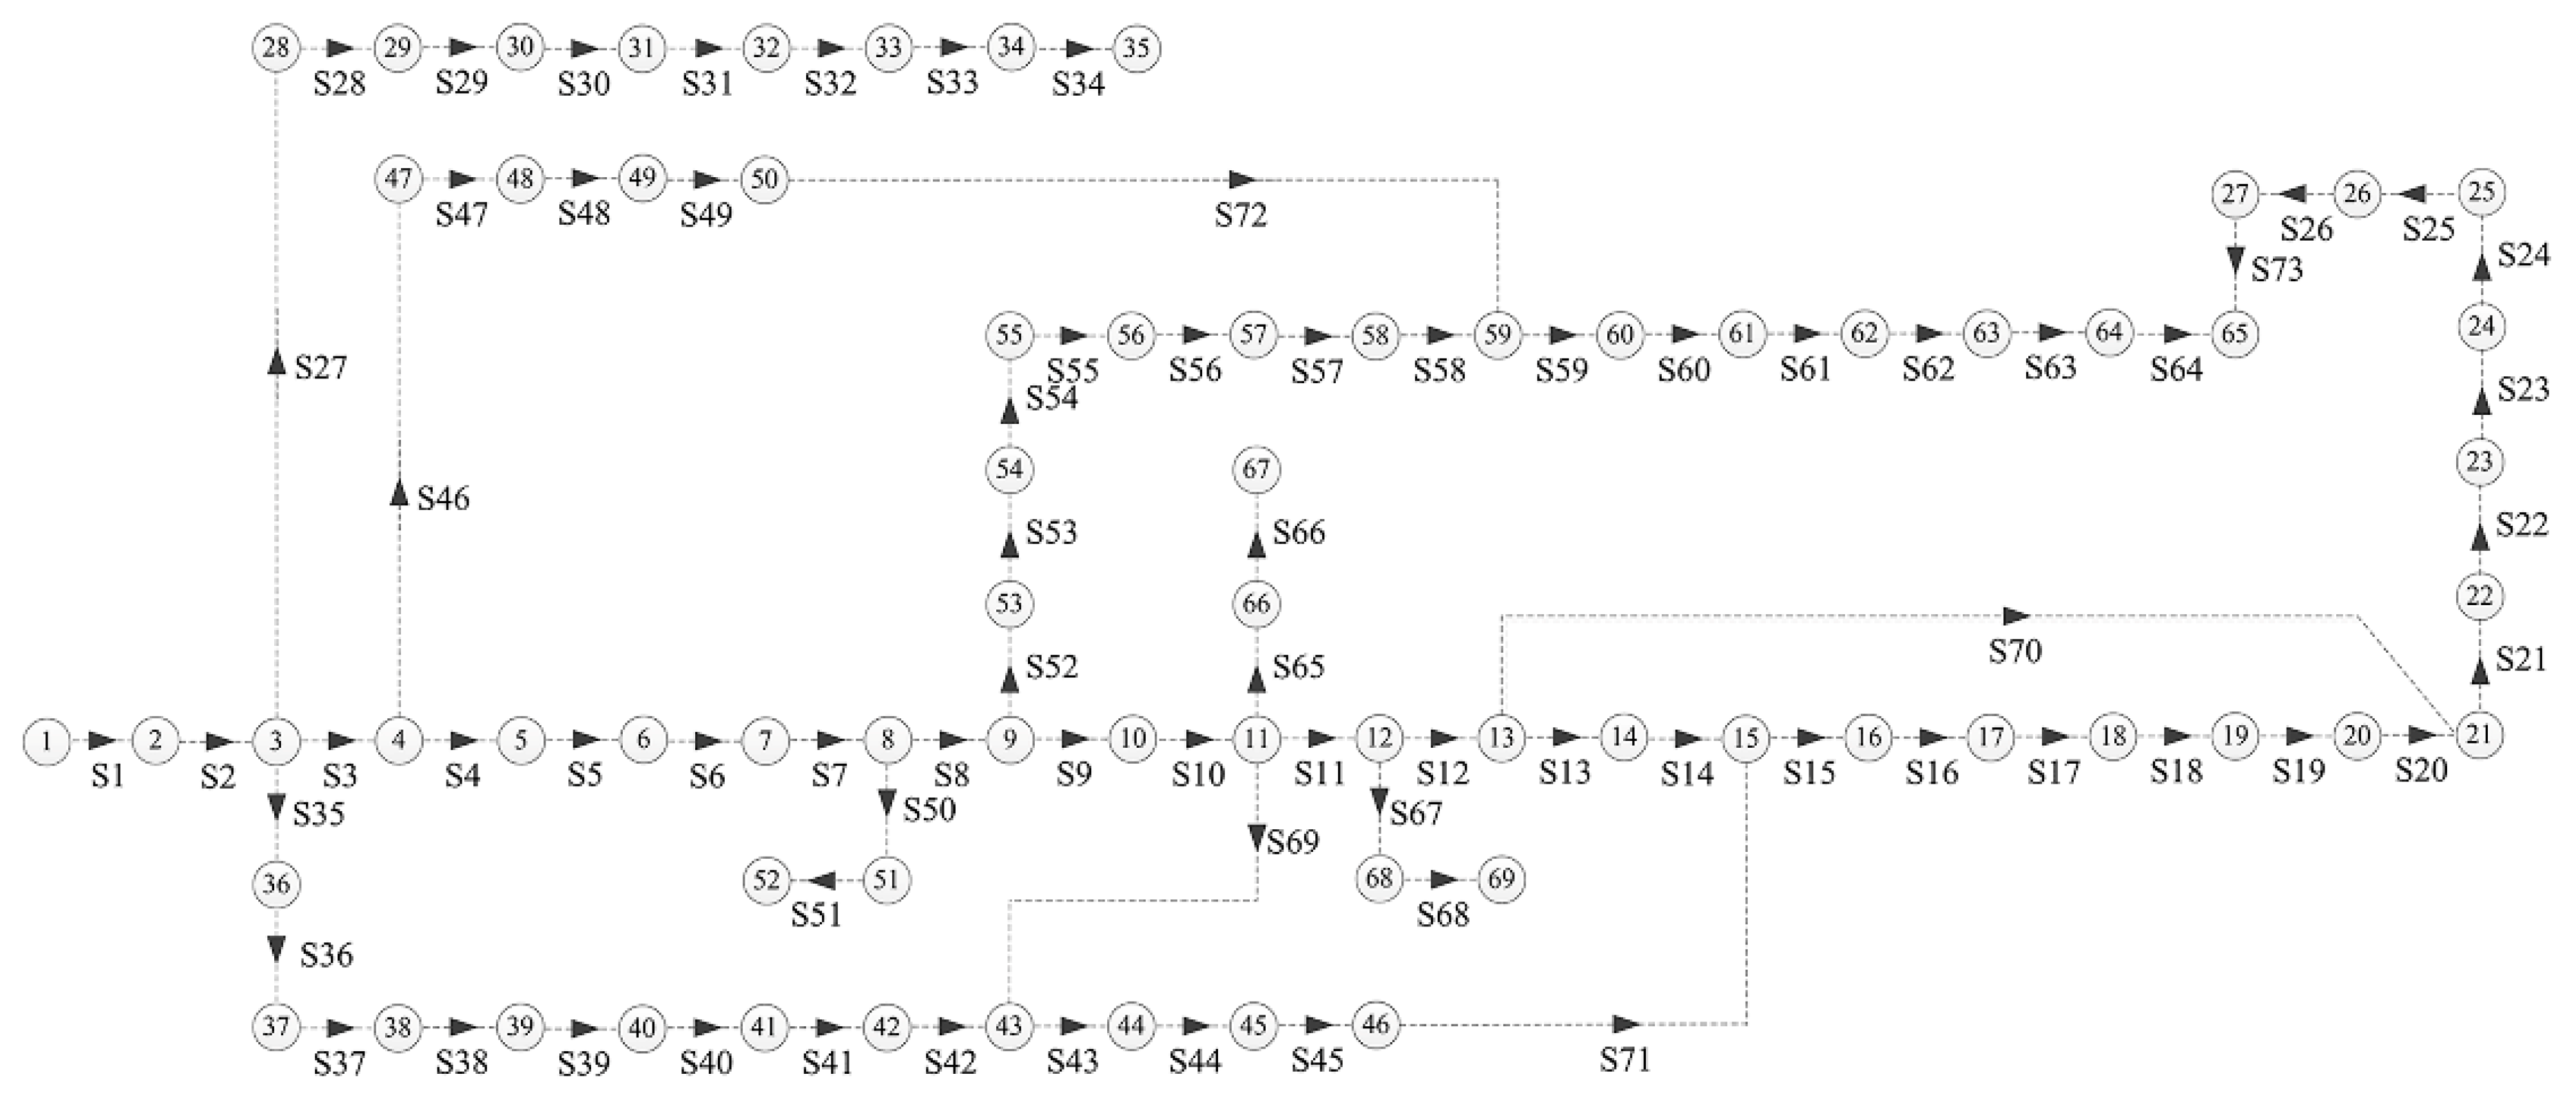
3.2. 69-Bus Distribution System
4. Conclusions
Author Contributions
Funding
Acknowledgments
Conflicts of Interest
References
- Shin, J.R.; Kim, B.S.; Park, J.B.; Lee, K.Y. A new optimal routing algorithm for loss minimization and voltage stability improvement in radial power systems. IEEE Trans. Power Syst. 2007, 22, 648–657. [Google Scholar] [CrossRef]
- Zhang, W.; Li, F.; Tolbert, L.M. Review of reactive power planning: Objectives, constraints, and algorithms. IEEE Trans. Power Syst. 2007, 22, 2177–2186. [Google Scholar] [CrossRef]
- Kayal, P.; Chanda, C.K. Placement of wind and solar based DGs in distribution system for power loss minimization and voltage stability improvement. Int. J. Electr. Power Energy Syst. 2013, 53, 795–809. [Google Scholar] [CrossRef]
- Imran, A.M.; Kowsalya, M. A new power system reconfiguration scheme for power loss minimization and voltage profile enhancement using fireworks algorithm. Int. J. Electr. Power Energy Syst. 2014, 62, 312–322. [Google Scholar] [CrossRef]
- Hung, D.Q.; Mithulananthan, N.; Bansal, R.C. Integration of PV and BES units in commercial distribution systems considering energy loss and voltage stability. Appl. Energy 2014, 113, 1162–1170. [Google Scholar] [CrossRef]
- Nguyen, T.T.; Truong, A.V. Distribution network reconfiguration for power loss minimization and voltage profile improvement using cuckoo search algorithm. Int. J. Electr. Power Energy Syst. 2015, 68, 233–242. [Google Scholar] [CrossRef]
- Baran, M.E.; Wu, F.F. Network reconfiguration in distribution systems for loss reduction and load balancing. IEEE Trans. Power Deliv. 1989, 4, 1401–1407. [Google Scholar] [CrossRef]
- Sultana, B.; Mustafa, M.W.; Sultana, U.; Bhatti, A.R. Review on reliability improvement and power loss reduction in distribution system via network reconfiguration. Renew. Sustain. Energy Rev. 2016, 66, 297–310. [Google Scholar] [CrossRef]
- Hivziefendić, J.; Hadžimehmedović, A.; Tešanović, M. Optimal network reconfiguration with distributed generation using NSGA II algorithm. Int. J. Adv. Res. Artif. Intell. 2016, 5, 6–11. [Google Scholar]
- Amanulla, B.; Chakrabarti, S.; Singh, S.N. Reconfiguration of power distribution systems considering reliability and power loss. IEEE Trans. Power Deliv. 2012, 27, 918–926. [Google Scholar] [CrossRef]
- Swarnkar, A.; Gupta, N.; Niazi, K.R. Adapted ant colony optimization for efficient reconfiguration of balanced and unbalanced distribution systems for loss minimization. Swarm Evolut. Comput. 2011, 1, 129–137. [Google Scholar] [CrossRef]
- Eusuff, M.M.; Lansey, K.E. Optimization of water distribution network design using the shuffled frog leaping algorithm. J. Water Resour. Plan. Manag. 2003, 129, 210–225. [Google Scholar] [CrossRef]
- Niknam, T.; Farsani, E.A. A hybrid self-adaptive particle swarm optimization and modified shuffled frog leaping algorithm for distribution feeder reconfiguration. Eng. Appl. Artif. Intell. 2010, 23, 1340–1349. [Google Scholar] [CrossRef]
- Arandian, B.; Hooshmand, R.A.; Gholipour, E. Decreasing activity cost of a distribution system company by reconfiguration and power generation control of DGs based on shuffled frog leaping algorithm. Int. J. Electr. Power Energy Syst. 2014, 61, 48–55. [Google Scholar] [CrossRef]
- Prakash, P.; Khatod, D.K. Optimal sizing and siting techniques for distributed generation in distribution systems: A review. Renew. Sustain. Energy Rev. 2016, 57, 111–130. [Google Scholar] [CrossRef]
- Rao, R.S.; Ravindra, K.; Satish, K.; Narasimham, S.V.L. Power loss minimization in distribution system using network reconfiguration in the presence of distributed generation. IEEE Trans. Power Syst. 2013, 28, 317–325. [Google Scholar] [CrossRef]
- Nguyen, T.T.; Truong, A.V.; Phung, T.A. A novel method based on adaptive cuckoo search for optimal network reconfiguration and distributed generation allocation in distribution network. Int. J. Electr. Power Energy Syst. 2016, 76, 801–815. [Google Scholar] [CrossRef]
- Franco, J.F.; Rider, M.J.; Lavorato, M.; Romero, R. A mixed-integer LP model for the reconfiguration of radial electric distribution systems considering distributed generation. Electr. Power Syst. Res. 2013, 97, 51–61. [Google Scholar] [CrossRef]
- Kavousi-Fard, A.; Akbari-Zadeh, M.R. Reliability enhancement using optimal distribution feeder reconfiguration. Neurocomputing 2013, 106, 1–11. [Google Scholar] [CrossRef]


| Scenario | Item | FWA | ACSA | SFLA | Proposed ASFLA |
|---|---|---|---|---|---|
| Base case (Scenario 1) | Opened switches | 33, 34, 35, 36, 37 | 33, 34, 35, 36, 37 | 33, 34, 35, 36, 37 | 33, 34, 35, 36, 37 |
| Power loss (kW) | 202.68 | 202.68 | 202.68 | 202.68 | |
| Minimum voltage (p.u.) | 0.9108 | 0.9108 | 0.9108 | 0.9108 | |
| Minimum VSI | 0.6978 | 0.6978 | 0.6978 | 0.6978 | |
| Only reconfiguration (Scenario 2) | Opened switches | 7, 9, 14, 28, 32 | 7, 9, 14, 28, 32 | 7, 9, 14, 28, 32 | 7, 9, 14, 28, 32 |
| Size of DG in MW (Bus number) | - | - | - | - | |
| Power loss (kW) | 139.98 | 139.98 | 139.98 | 139.98 | |
| Loss reduction (%) | 30.93 | 30.93 | 30.93 | 30.93 | |
| Minimum voltage (p.u.) | 0.9413 | 0.9413 | 0.9413 | 0.9413 | |
| Minimum VSI | 0.7878 | 0.7878 | 0.7878 | 0.7878 | |
| Only DG Installation (Scenario 3) | Opened switches | 33, 34, 35, 36, 37 | 33, 34, 35, 36, 37 | 33, 34, 35, 36, 37 | 33, 34, 35, 36, 37 |
| Size of DG in MW (Bus number) | 0.5897(14) | 0.7798(14) | 0.5639(28) | 0.5457(24) | |
| 0.1895(18) | 1.251(24) | 0.3182(30) | 0.9936(29) | ||
| 1.0146(32) | 1.3496(30) | 0.5144(14) | 1.2094(12) | ||
| Power loss (kW) | 88.68 | 74.26 | 83.37 | 66.87 | |
| Loss reduction (%) | 56.24 | 63.36 | 58.86 | 67.00 | |
| Minimum voltage (p.u.) | 0.9680 | 0.9778 | 0.9770 | 0.9781 | |
| Minimum VSI | - | 0.9118 | 0.9088 | 0.9161 | |
| DG installation after reconfiguration (Scenario 4) | Opened switches | 7, 9, 14, 28, 32 | 7, 9, 14, 28, 32 | 7, 9, 14, 28, 32 | 7, 9, 14, 28, 32 |
| Size of DG in MW (Bus number) | 0.5996(32) | 1.7536(29) | 0.7461(24) | 0.0918(10) | |
| 0.3141(33) | 0.5397(12) | 0.3682(17) | 0.6190(29) | ||
| 0.1591(18) | 0.5045(16) | 0.0148(29) | 0.5624(16) | ||
| Power loss (kW) | 83.81 | 58.79 | 80.42 | 51.68 | |
| Loss reduction (%) | 58.59 | 70.99 | 60.32 | 74.50 | |
| Minimum voltage (p.u.) | 0.9612 | 0.9802 | 0.9688 | 0.9864 | |
| Minimum VSI | - | 0.9264 | 0.9041 | 0.9474 | |
| Reconfiguration after DG installation (Scenario 5) | Opened switches | 7, 34, 9, 32, 28 | 33, 9, 8, 36, 27 | 8, 11, 27, 33, 37 | 35, 34, 26, 37, 33 |
| Size of DG in MW (Bus number) | 0.5897(14) | 0.7798(14) | 0.5639(28) | 0.5457(24) | |
| 0.1895(18) | 1.251(24) | 0.3182(30) | 0.9936(29) | ||
| 1.0146(32) | 1.3496(30) | 0.5144(14) | 1.2094(12) | ||
| Power loss (kW) | 68.28 | 62.98 | 71.86 | 55.1907 | |
| Loss reduction (%) | 66.31 | 68.92 | 64.54 | 72.76 | |
| Minimum voltage (p.u.) | 0.9712 | 0.9826 | 0.9763 | 0.9830 | |
| Minimum VSI | - | 0.9354 | 0.9123 | 0.9359 | |
| Simultaneous reconfiguration and DG Installation (Scenario 6) | Opened switches | 7, 14, 11, 32, 28 | 7, 10, 13, 32, 28 | 9, 13, 27, 24, 33 | 9, 34, 27, 23, 33 |
| Size of DG in MW (Bus number) | 0.5367(32) | 0.4263(32) | 0.4330(32) | 0.7641(32) | |
| 0.6158(29) | 1.2024(29) | 1.0832(29) | 0.0599(29) | ||
| 0.5315(30) | 0.7127(30) | 0.0441(30) | 0.9987(30) | ||
| Power loss (kW) | 67.11 | 63.69 | 68.64 | 53.10 | |
| Loss reduction (%) | 66.89 | 68.57 | 66.13 | 73.80 | |
| Minimum voltage (p.u.) | 0.9713 | 0.9786 | 0.9753 | 0.9814 | |
| Minimum VSI | - | 0.9202 | 0.9116 | 0.9284 | |
| Simultaneous reconfiguration, DG installation and location (Scenario 7) | Opened switches | - | 33, 34, 11, 31, 28 | 5, 7, 33, 34, 35 | 35, 14, 26, 24, 33 |
| Size of DG in MW (Bus number) | - | 0.8968(18) | 0.9490(31) | 0.2712(25) | |
| - | 1.4381(25) | 0.1216(6) | 0.6093(13) | ||
| - | 0.9646(7) | 1.2045(12) | 0.8935(31) | ||
| Power loss (kW) | - | 53.21 | 64.77 | 49.51 | |
| Loss reduction (%) | - | 73.74 | 68.04 | 75.57 | |
| Minimum voltage (p.u.) | - | 0.9826 | 0.9765 | 0.9869 | |
| Minimum VSI | - | 0.9354 | 0.9147 | 0.9452 |
| Scenario | Item | FWA | ACSA | SFLA | Proposed ASFLA |
|---|---|---|---|---|---|
| Base case (Scenario 1) | Opened switches | 69, 70, 71, 72, 73 | 69, 70, 71, 72, 73 | 69, 70, 71, 72, 73 | 69, 70, 71, 72, 73 |
| Power loss (kW) | 224.89 | 224.89 | 224.89 | 224.89 | |
| Minimum voltage (p.u.) | 0.9092 | 0.9092 | 0.9092 | 0.9092 | |
| Minimum VSI | 0.6859 | 0.6859 | 0.6859 | 0.6859 | |
| Only Reconfiguration (Scenario 2) | Opened switches | 60, 70, 14, 57, 61 | 60, 70, 14, 57, 61 | 60, 70, 14, 57, 61 | 60, 70, 14, 57, 61 |
| Size of DG in MW (Bus number) | - | - | - | - | |
| Power loss (kW) | 98.59 | 98.59 | 98.59 | 98.59 | |
| Loss reduction (%) | 56.16 | 56.16 | 56.16 | 56.16 | |
| Minimum voltage (p.u.) | 0.9459 | 0.9459 | 0.9459 | 0.9459 | |
| Minimum VSI | 0.8414 | 0.8414 | 0.8414 | 0.8414 | |
| Only DG installation (Scenario 3) | Opened switches | 69, 70, 71, 72, 73 | 69, 70, 71, 72, 73 | 69, 70, 71, 72, 73 | 69, 70, 71, 72, 73 |
| Size of DG in MW (Bus number) | 0.4085(65) | 0.6022(11) | 1.0887(57) | 1.9626(62) | |
| 1.1986(61) | 0.3804(18) | 0.1673(63) | 0.6274(16) | ||
| 0.2258(27) | 2.000(61) | 0.9809(26) | 0.9939(40) | ||
| Power loss (kW) | 77.85 | 72.44 | 77.75 | 69.41 | |
| Loss reduction (%) | 65.39 | 67.79 | 65.43 | 69.13 | |
| Minimum voltage (p.u.) | 0.9740 | 0.9890 | 0.9752 | 0.9913 | |
| Minimum VSI | - | 0.9546 | 0.9472 | 0.9589 | |
| DG install after reconfiguration (Scenario 4) | Opened switches | 69, 70, 14, 57, 61 | 69, 70, 14, 57, 61 | 69, 70, 14, 57, 61 | 69, 70, 14, 57, 61 |
| Size of DG in MW (Bus number) | 1.7254(61) | 1.7254(61) | 0.4035(60) | 0.2434(9) | |
| 0.4666(64) | 0.4666(64) | 0.7988(61) | 1.0770(22) | ||
| 0.3686(12) | 0.3686(12) | 0.9754(25) | 0.9544(61) | ||
| Power loss (kW) | 37.23 | 37.23 | 45.52 | 34.74 | |
| Loss reduction (%) | 83.45 | 83.45 | 79.75 | 84.55 | |
| Minimum voltage (p.u.) | 0.9870 | 0.9870 | 0.9686 | 0.9886 | |
| Minimum VSI | 0.9390 | 0.9390 | 0.9454 | 0.9522 | |
| Reconfiguration after DG installation (Scenario 5) | Opened switches | 69, 70, 14, 58, 64 | 69, 70, 14, 58, 64 | 54, 73, 15, 69, 12 | 57, 73, 13, 69, 12 |
| Size of DG in MW (Bus number) | 0.6022(11) | 0.6022(11) | 0.659(57) | 1.9626(62) | |
| 0.3804(18) | 0.3804(18) | 1.0887(63) | 0.6274(16) | ||
| 2.000(61) | 2.000(61) | 0.1673(26) | 0.9939(40) | ||
| Power loss (kW) | 41.13 | 41.13 | 40.40 | 35.73 | |
| Loss reduction (%) | 81.1 | 81.1 | 82.04 | 84.10 | |
| Minimum voltage (p.u.) | 0.9828 | 0.9828 | 0.9752 | 0.9904 | |
| Minimum VSI | 0.9390 | 0.9390 | 0.9499 | 0.9549 | |
| Simultaneous Reconfiguration and DG installation (Scenario 6) | Opened switches | 69, 70, 12, 58, 61 | 69, 70, 12, 58, 61 | 54, 61, 16, 69, 12 | 57, 64, 17, 69, 13 |
| Size of DG in MW (Bus number) | 1.749(61) | 1.749(61) | 1.2532(61) | 0.5453(61) | |
| 0.1566(62) | 0.1566(62) | 0.3260(62) | 1.7169(62) | ||
| 0.4090(65) | 0.4090(65) | 0.2147(65) | 0.2243(65) | ||
| Power loss (kW) | 40.49 | 40.49 | 41.84 | 36.70 | |
| Loss reduction (%) | 82.00 | 82.00 | 81.40 | 83.68 | |
| Minimum voltage (p.u.) | 0.9873 | 0.9873 | 0.9781 | 0.9913 | |
| Minimum VSI | 0.9403 | 0.9403 | 0.9466 | 0.9657 | |
| Simultaneous Reconfiguration and DG installation and location (Scenario 7) | Opened switches | - | 69, 70, 14, 58, 61 | 72, 56, 70, 69, 14 | 58, 73, 16, 69, 71 |
| Size of DG in MW (Bus number) | - | 0.5413(11) | 0.0193(59) | 1.8384(5) | |
| - | 0.5536(65) | 0.7004(60) | 1.2154(62) | ||
| - | 1.7240(61) | 0.6668(61) | 0.9603(11) | ||
| Power loss (kW) | - | 37.02 | 38.67 | 33.95 | |
| Loss reduction (%) | - | 83.54 | 82.80 | 84.90 | |
| Minimum voltage (p.u.) | - | 0.9869 | 0.9778 | 0.9915 | |
| Minimum VSI | - | 0.9433 | 0.9534 | 0.9659 |
© 2019 by the authors. Licensee MDPI, Basel, Switzerland. This article is an open access article distributed under the terms and conditions of the Creative Commons Attribution (CC BY) license (http://creativecommons.org/licenses/by/4.0/).
Share and Cite
Onlam, A.; Yodphet, D.; Chatthaworn, R.; Surawanitkun, C.; Siritaratiwat, A.; Khunkitti, P. Power Loss Minimization and Voltage Stability Improvement in Electrical Distribution System via Network Reconfiguration and Distributed Generation Placement Using Novel Adaptive Shuffled Frogs Leaping Algorithm. Energies 2019, 12, 553. https://doi.org/10.3390/en12030553
Onlam A, Yodphet D, Chatthaworn R, Surawanitkun C, Siritaratiwat A, Khunkitti P. Power Loss Minimization and Voltage Stability Improvement in Electrical Distribution System via Network Reconfiguration and Distributed Generation Placement Using Novel Adaptive Shuffled Frogs Leaping Algorithm. Energies. 2019; 12(3):553. https://doi.org/10.3390/en12030553
Chicago/Turabian StyleOnlam, Arun, Daranpob Yodphet, Rongrit Chatthaworn, Chayada Surawanitkun, Apirat Siritaratiwat, and Pirat Khunkitti. 2019. "Power Loss Minimization and Voltage Stability Improvement in Electrical Distribution System via Network Reconfiguration and Distributed Generation Placement Using Novel Adaptive Shuffled Frogs Leaping Algorithm" Energies 12, no. 3: 553. https://doi.org/10.3390/en12030553
APA StyleOnlam, A., Yodphet, D., Chatthaworn, R., Surawanitkun, C., Siritaratiwat, A., & Khunkitti, P. (2019). Power Loss Minimization and Voltage Stability Improvement in Electrical Distribution System via Network Reconfiguration and Distributed Generation Placement Using Novel Adaptive Shuffled Frogs Leaping Algorithm. Energies, 12(3), 553. https://doi.org/10.3390/en12030553