Article

Effects of Pyrolysis Temperature and Retention Time on Fuel Characteristics of Food Waste Feedstuff and Compost for Co-Firing in Coal Power Plants

1
Division of Environment and Plant Engineering, Korea Institute of Civil Engineering and Building Technology 283, Goyang-daero, Ilsanseo-gu Goyang-si, Gyeonggi-do 10223, Korea
2
Department of Construction Environmental Engineering, University of Science and Technology, 217, Gajeong-ro, Yuseong-gu, Daejeon 34113, Korea
*
Author to whom correspondence should be addressed.
Energies 2019, 12(23), 4538; https://doi.org/10.3390/en12234538
Submission received: 2 November 2019 / Revised: 25 November 2019 / Accepted: 27 November 2019 / Published: 28 November 2019

Abstract

:
Food waste is an underutilized organic resource given its abundance and high potential energy. The purpose of this study was to confirm the suitability of pyrolyzed food waste as a co-firing fuel by adjusting the pyrolysis temperature (300–500 °C) and retention time (15–60 min). Both high moisture (compost) and low moisture (feedstuff) food waste were examined. Increasing the temperature and retention time yielded more volatile H and O as well as C sequestration, resulting in reduced H/C and O/C ratios. Notably, the van Krevelen diagram increased in similarity to that of coal. Upon pyrolyzing food waste compost, more than half of the chloride was volatilized, the highest carbon content of the compost and feedstuff were 61.35% and 54.12%, respectively, after pyrolysis at 400 °C for 60 min; however, the calorific value of the pyrolyzed feedstuff was reduced owing to the high salt concentration. The pyrolyzed compost and feedstuff had high Ca contents, which contributed to an increased ash fusion temperature. Therefore, food waste byproducts are advantageous as co-firing fuels in terms of energy regeneration. Nevertheless, further research is required regarding the removal of salt and alkali earth metal ion materials.

1. Introduction

Food waste has high potential energy and is generated in large quantities, making it an abundant but underutilized organic resource. It is normally disposed of through methane gas production by anaerobic digestion, or used to produce compost and feedstuff. However, there are limitations to producing methane gas via biological methods, such as difficulty in maintaining a certain level of yield and the production of a thickened sludge. Compost and feedstuff produced from food waste are often of low quality, resulting from high salt concentrations, and end up being stored in piles or buried instead of being used.
The limitations of current disposal methods show the need for new alternatives. Among the possible alternatives, one of the increasingly popular suggestions is to produce energy from food waste. Current technologies for energy conversion of food waste involve biological methods (e.g., anaerobic digestion and fermentation) and thermochemical methods (e.g., incineration, pyrolysis, and hydrothermal carbonization) [1]. Pyrolysis is advantageous as it can convert all the exhausted gases, oil, and char into energy. However, Pham et al. [1] noted that pyrolysis is suitable for use with treated waste, but as the process is affected by the elemental composition and moisture content of the raw material, very few pyrolysis processes have been developed solely for use with raw food waste. Unused feedstuff and compost are suitable for use as pyrolysis fuels due to their low moisture content and high potential energy.
The energy density of biomass increases through pyrolysis, making it a high-value fuel. Recently, biomass co-firing with coal has received attention as it decreases the CO2, NOx, and SOx production from plants [2,3,4,5]. However, some biomass fuels contain copious amounts of chlorine and alkalis, which may increase corrosion [6,7]. Although salt from food waste is undesirable as a solid fuel, there has been little research on this issue. Poudel et al. [8] identified the value of food waste as an energy source by dehydration and torrefaction at a low temperature; however, the problems associated with a high salt content were not adequately discussed. Opatokun et al. [9] identified the energy potential through pyrolysis and anaerobic digestion of food waste; however, they also did not consider the problem of salt. Lee et al. [10] showed the possibility of eliminating salt by water flushing the food waste after pyrolysis; however, this study was limited in that artificial samples were used instead of actual food waste. Although there are not many papers on the pyrolysis of food waste to use as fuel, a few papers have confirmed the value of food waste as a co-firing fuel by specifically monitoring the heat value and structure of inorganic matter under various pyrolysis conditions.
Recently, some studies on the use of wood-based biomass as a co-firing fuel have revealed a problem with chlorine. Keipi et al. [11] analyzed the chlorine content of eight woody biomasses and the change of chlorine content by torrefaction at low temperature. They found that the difference in the amount of residual or volatilized chlorine was 70% depending on the type of biomass. Chen et al. [12] studied the behavior of chlorine in rice straw and showed that chlorine in the form of potassium chloride could be volatilized to hydrogen chloride after reacting with carboxyl groups. In addition, some researchers have investigated the volatilization of potassium chloride in woody biomass under pyrolysis or torrefaction conditions [13,14,15]. Nevertheless, there are no similar studies on sodium chloride in food waste. Keipi et al. [11] and Poudel et al. [8] noted the lack of focus on chlorine in biomass research. It is essential to confirm the chlorine behavior of the actual food waste complex under various pyrolysis conditions.
The first purpose of this study was to identify the value of food waste compost and feedstuff as a co-firing pyrolysis fuel source; the second was to determine the change in chlorine content and inorganic composition with different pyrolysis conditions, with the aim of comprehensively identifying the changes in slagging and fouling characteristics of feedstuff and compost from food waste, to provide fundamental data for studies on creating fuel from food waste byproducts and to determine the optimal pyrolysis conditions.

2. Experimental

2.1. Raw Material

This study used compost and feedstuff produced as recycled materials through food waste processing, which had accumulated without being used. The food waste compost was collected from an Environment Management Center in P-city, Korea. The compost samples were used after sieving with a 1.18-mm sieve for uniformity. Food waste feedstuff was collected from a Food Waste Disposal Facility in Incheon, Korea. The facility distributes the food waste feedstuff in a powdered form following homogenization through grinding and dehydration, and it was therefore used directly (without sifting).

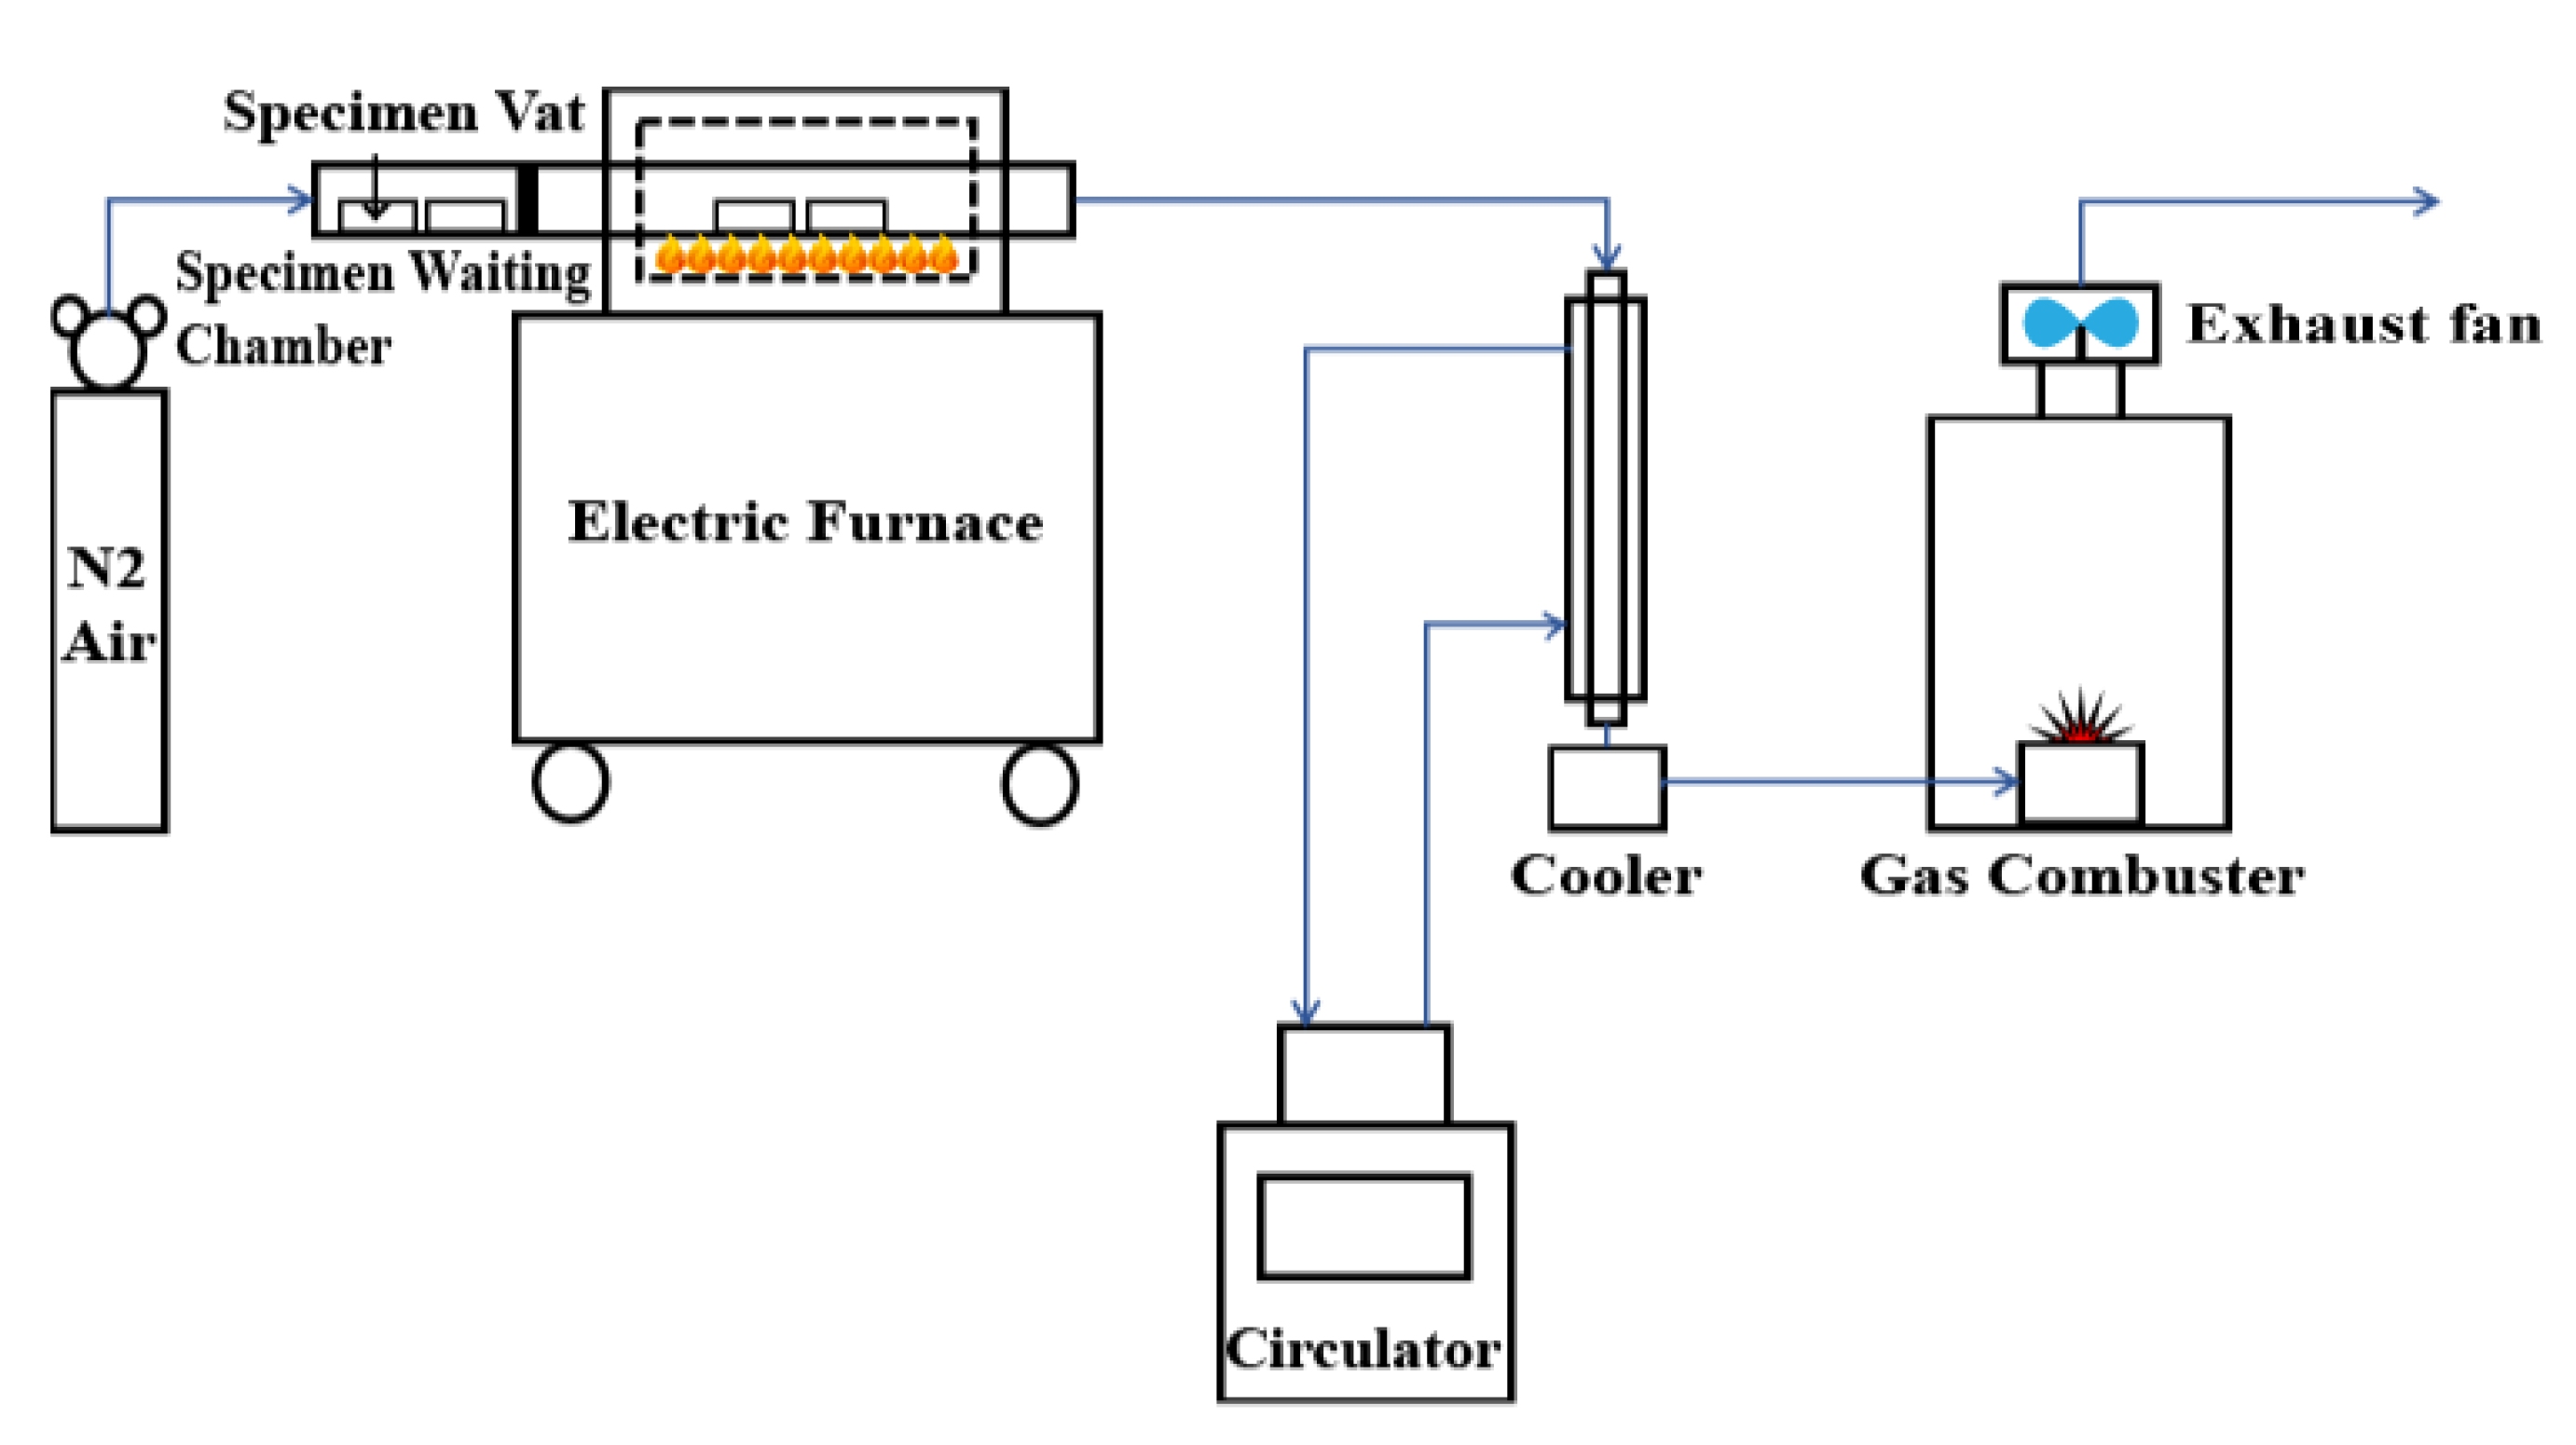
2.2. Experimental Apparatus and Procedures

2.2.1. Pyrolysis

The food waste feedstuff and compost were placed into the pyrolysis equipment, shown in Figure 1, and subjected to pyrolysis for 15, 30, 45, or 60 min at target temperatures of 300, 400, or 500 °C. Nitrogen gas was added at 5 L/min. Samples were placed in 5 (W) × 20 (L) × 4.5 (H) cm stainless-steel containers before being put into the pyrolysis equipment. The custom pyrolysis equipment (Handuk R-FECO Co., Ltd., Gyonggi-do, Korea) is designed so that the biogas produced in the electric furnace unit is combusted after passing through a heat exchanger.

2.2.2. Analytical Methods

To identify the fuel characteristics of each sample according to the pyrolysis temperature, retention time, and leaching method, technical analyses (Moisture, Volatile, Ash, Fixed carbon) and elementary analyses (Flash EA 1112-C,H,N,S and EA 2000-O, Thermo-Finnigan, Bremen, Germany) were conducted according to the experimental method of ASTM D 7582. A 0.7–1.0 g sample of the biochar produced by each pyrolysis condition was weighed and combusted in a bomb calorimeter (6400 Automatic Isoperibol Calorimeter, Parr, Moline, IL, USA) with oxygen gas. The calorimeter calculates the calorific value according to the input weight after measuring how much the temperature of water rises due to heat generated by combustion. The mass and energy yields were defined and calculated by Equations (1) and (2), respectively.
Mass   yield   ( % ) =   Mass   after   pyrolysis Mass   of   raw   sample   × 100 ,
Energy   yield   ( % ) =   Mass   yield   ( % ) ×   HHV   ( pyrolyzed   sample ) HHV   ( raw   sample ) ,
where HHV is the higher heating value.
Fourier transform infrared (FTIR) spectroscopy (Nicolet 6700, Thermo Scientific, USA) was conducted to identify the structural changes of the biochar according to the pyrolysis temperature and retention time. Changes in the chlorine contents were analyzed using combustion ion chromatography (AQF-2100H, Mitsubishi Chemical Analytech Co., Ltd., Japan) with a GA210 sparging unit and anion separator column (Thermo Scientific, Dionex IonPac AS15). The operating flow was 1.00 mL/min, and the pressure was 6.00 MPa. The data were recorded for 19 min.
To identify the adherence of the pyrolyzed food waste compost and feedstuff, the ash was subjected to X-ray fluorescence (XRF) analysis (Axios system, Panalytical Co., Ltd., Holland) and ash fusion temperature (AFT) analysis after complete combustion in an electric furnace at 815 °C; subsequently, the slagging and fouling potentials were calculated using the equations presented in Table 1.

3. Results and Discussion

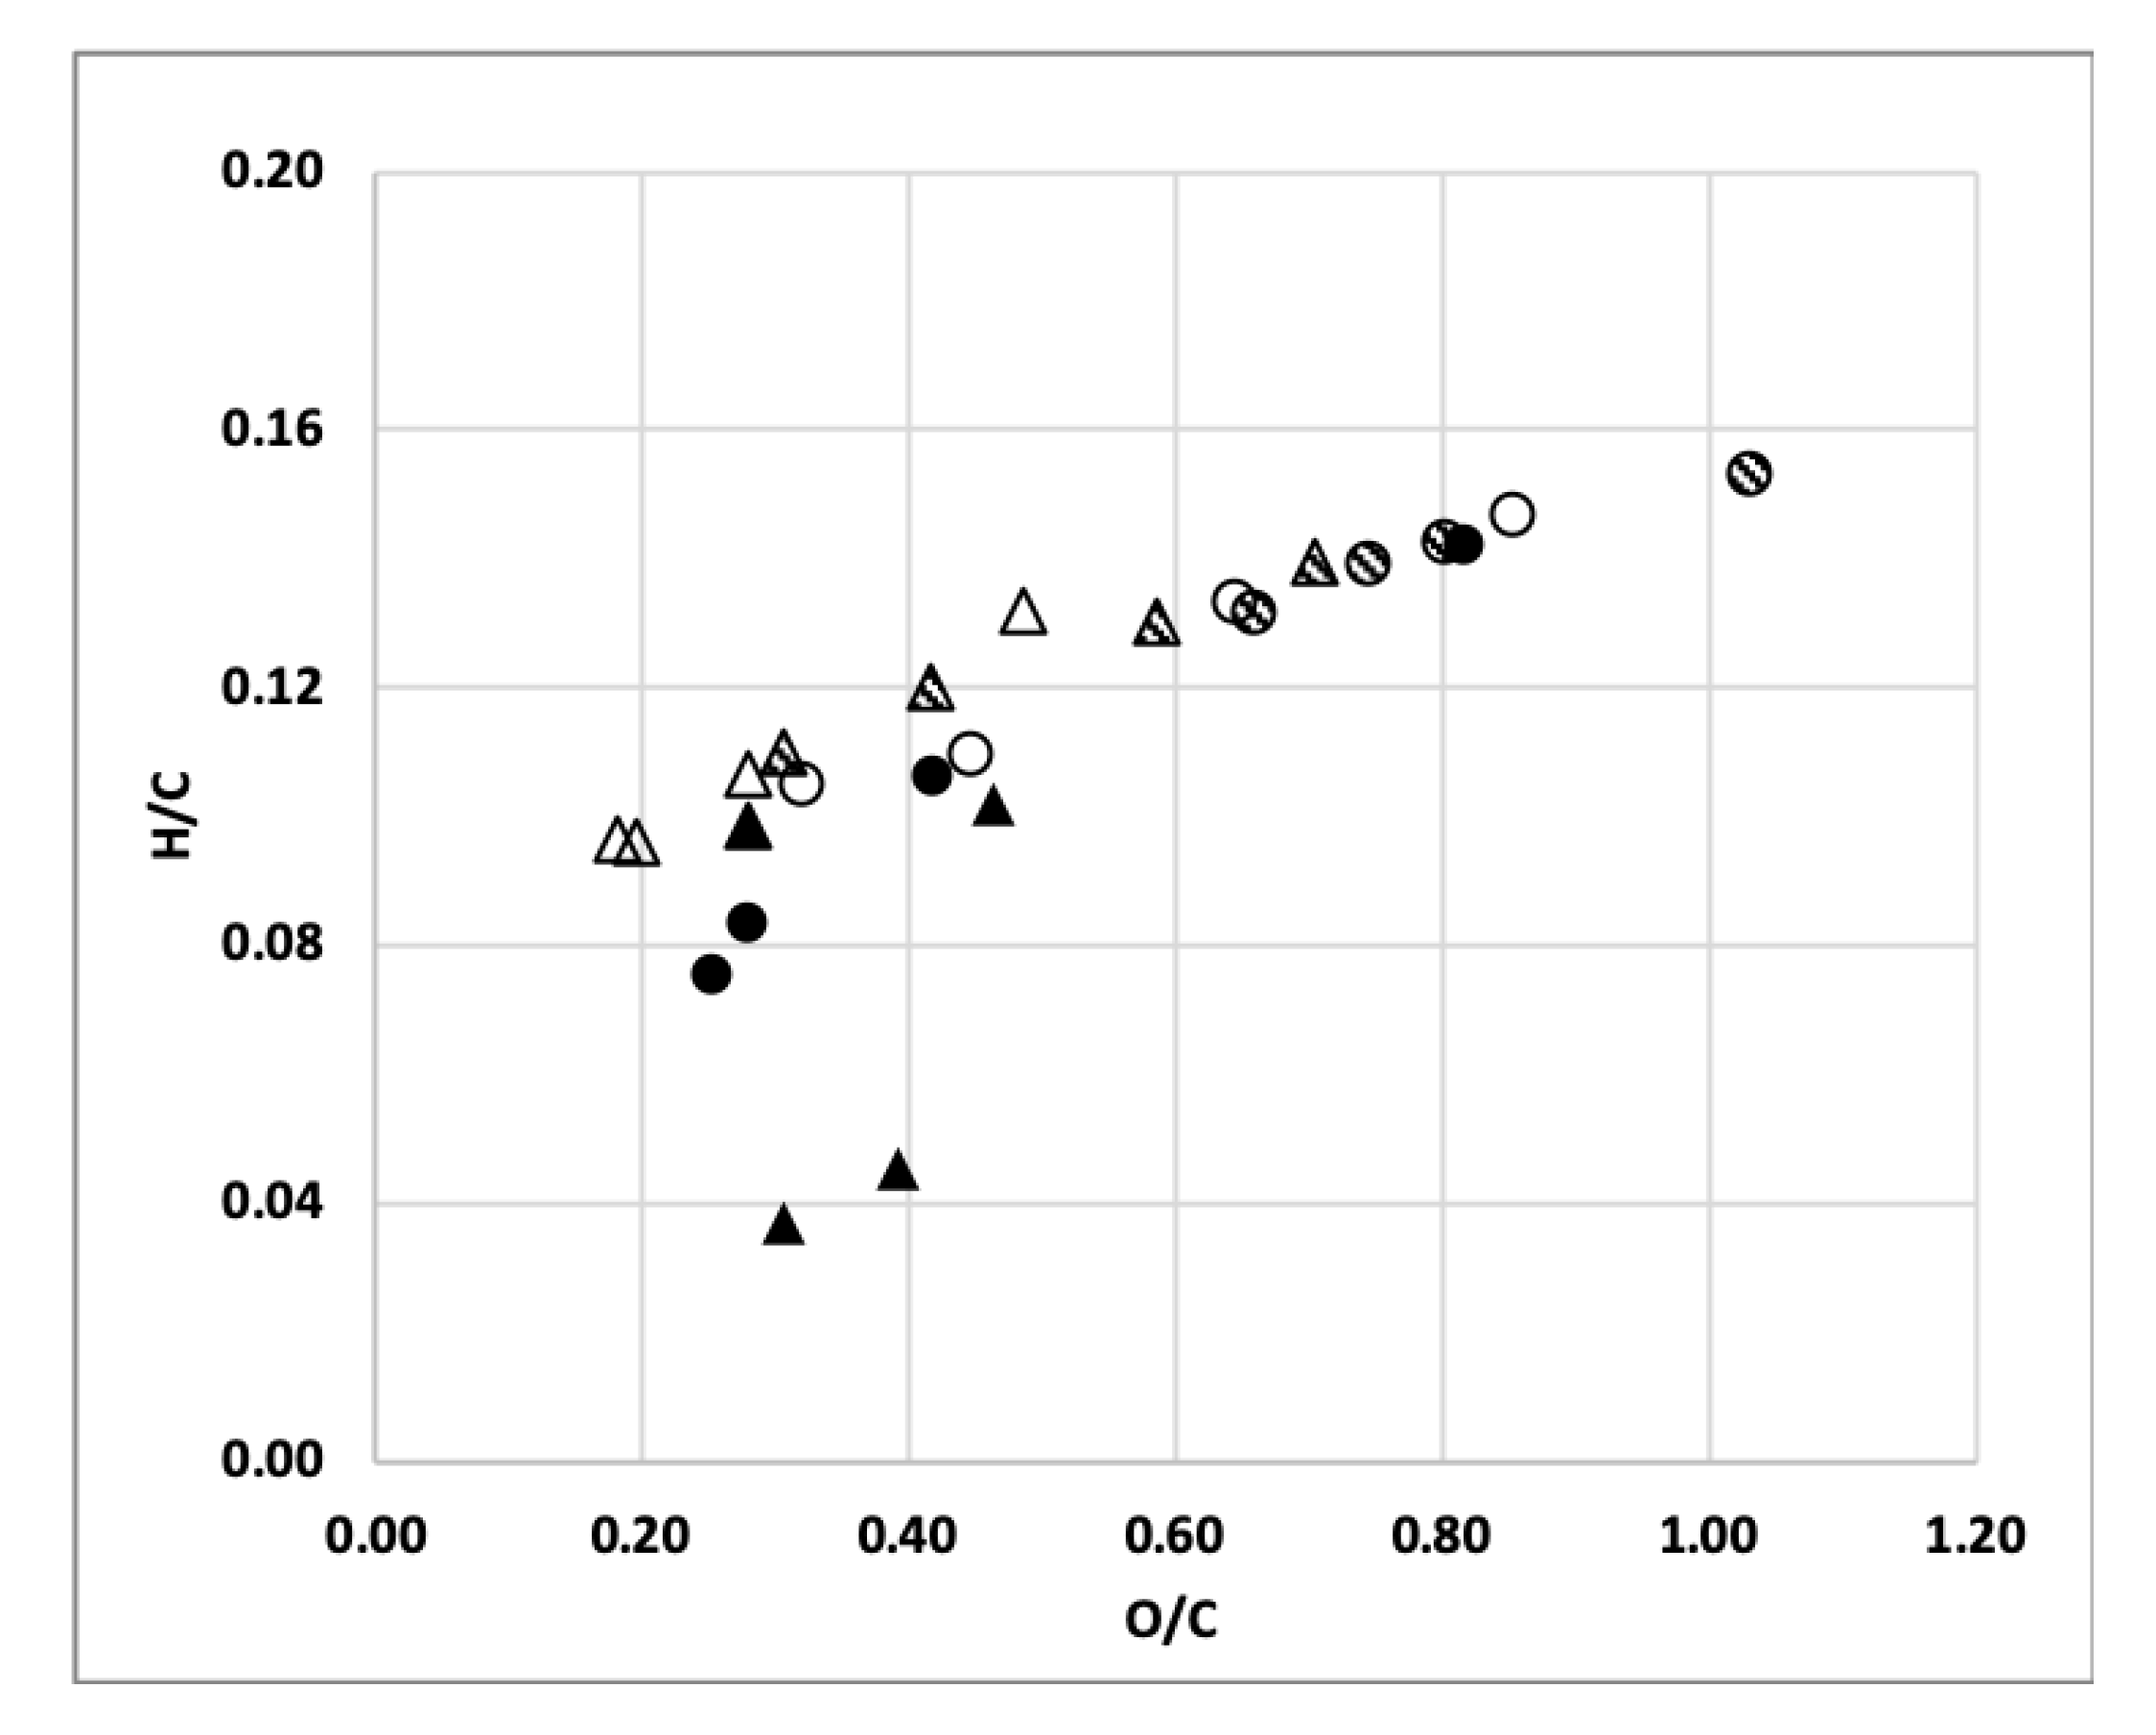
3.1. Elemental Fuel Characteristics

3.1.1. Basic Properties

Food waste compost and feedstuff displayed different characteristics. Table 2 shows the fundamental properties of the two raw samples. Compost has a relatively high moisture content compared to feedstuff, because while feedstuff is produced by drying and pulverized food waste, compost is produced by biological processes, and the carbon, nitrogen, and volatile components are reduced as the organic matter decomposes. There was just a small difference in the carbon contents of the feedstuff and compost, even though carbon is decomposed by microorganisms during composting. This is because the sawdust that was added during composting and microorganisms grown during the decomposition of carbon are included in the compost and collectively released upon pyrolysis [20].
Table 3 shows the primary properties of the food waste compost and feedstuff samples after pyrolysis at different temperatures and retention times. For feedstuff, as the pyrolysis temperature and time increased, the amount of fixed carbon increased from 11.84 to 41.14 wt.%; the ash content increased from 10.51 to 33.57 wt.%; and the volatile matter content decreased from 75.6 to 24.6 wt.%. There was more volatile matter in the compost than in the feedstuff. For the compost, as the pyrolysis temperature and time increased, the amount of fixed carbon increased from 6.68 to 30.44 wt.%, and the ash content increased from 7.68 to 28.22 wt.%. The results are similar to those of Park et al. [21] in a study on biomass pyrolysis, wherein the ash content of wood-based raw materials was low, while that of rice husk increased from 13 wt.% to wt.36% after pyrolysis at 500 °C. In other words, high ash content is characteristic of food waste, especially agricultural waste. Because the compost had a higher moisture content than the feedstuff, moisture elimination was prioritized during pyrolysis; hence, there were conditions where the volatile matter content increased according to the pyrolysis temperature and time. For compost, the volatilization of water was superior during pyrolysis for all times at 300 °C, between 15–30 min at 400 °C, and between 15–30 min at 500 °C, resulting in maximum volatile contents of 74.41, 71, and 64.56 wt.%, respectively. The fact that the maximum volatile contents decreased as the pyrolysis temperature increased shows that simultaneous volatilization of water and decomposition of organic matter occurred as the temperature increased.
The oxygen and hydrogen concentrations of the feedstuff and compost both decreased while the carbon concentration increased as the pyrolysis temperature and time increased. The carbon contents of feedstuff and compost were both highest after pyrolysis at 400 °C for 60 min, reaching 61.35 and 54.12 wt.%, respectively. The higher the carbon content, the higher the expected calorific value; therefore, the food waste feedstuff is more suitable as a fuel in terms of its calorific value than the compost.
The van Krevelen diagram (Figure 2) shows that the H/C and O/C ratios decreased as the pyrolysis temperature and retention time increased. Park et al. [21] showed a similar result, in that the similarity of pyrolyzed woody biomass to coal increases as the pyrolysis temperature increases. Here, the O/C values of both the compost and feedstuff were close to those of coal (<0.25) after pyrolysis at 500 °C for 45–60 min. The H/C values were all <0.4 and in the anthracite range [21,22]. The feedstuff and compost were coalified with increasing pyrolysis temperature and retention time, while the feedstuff produces coal with less energy than that from compost.

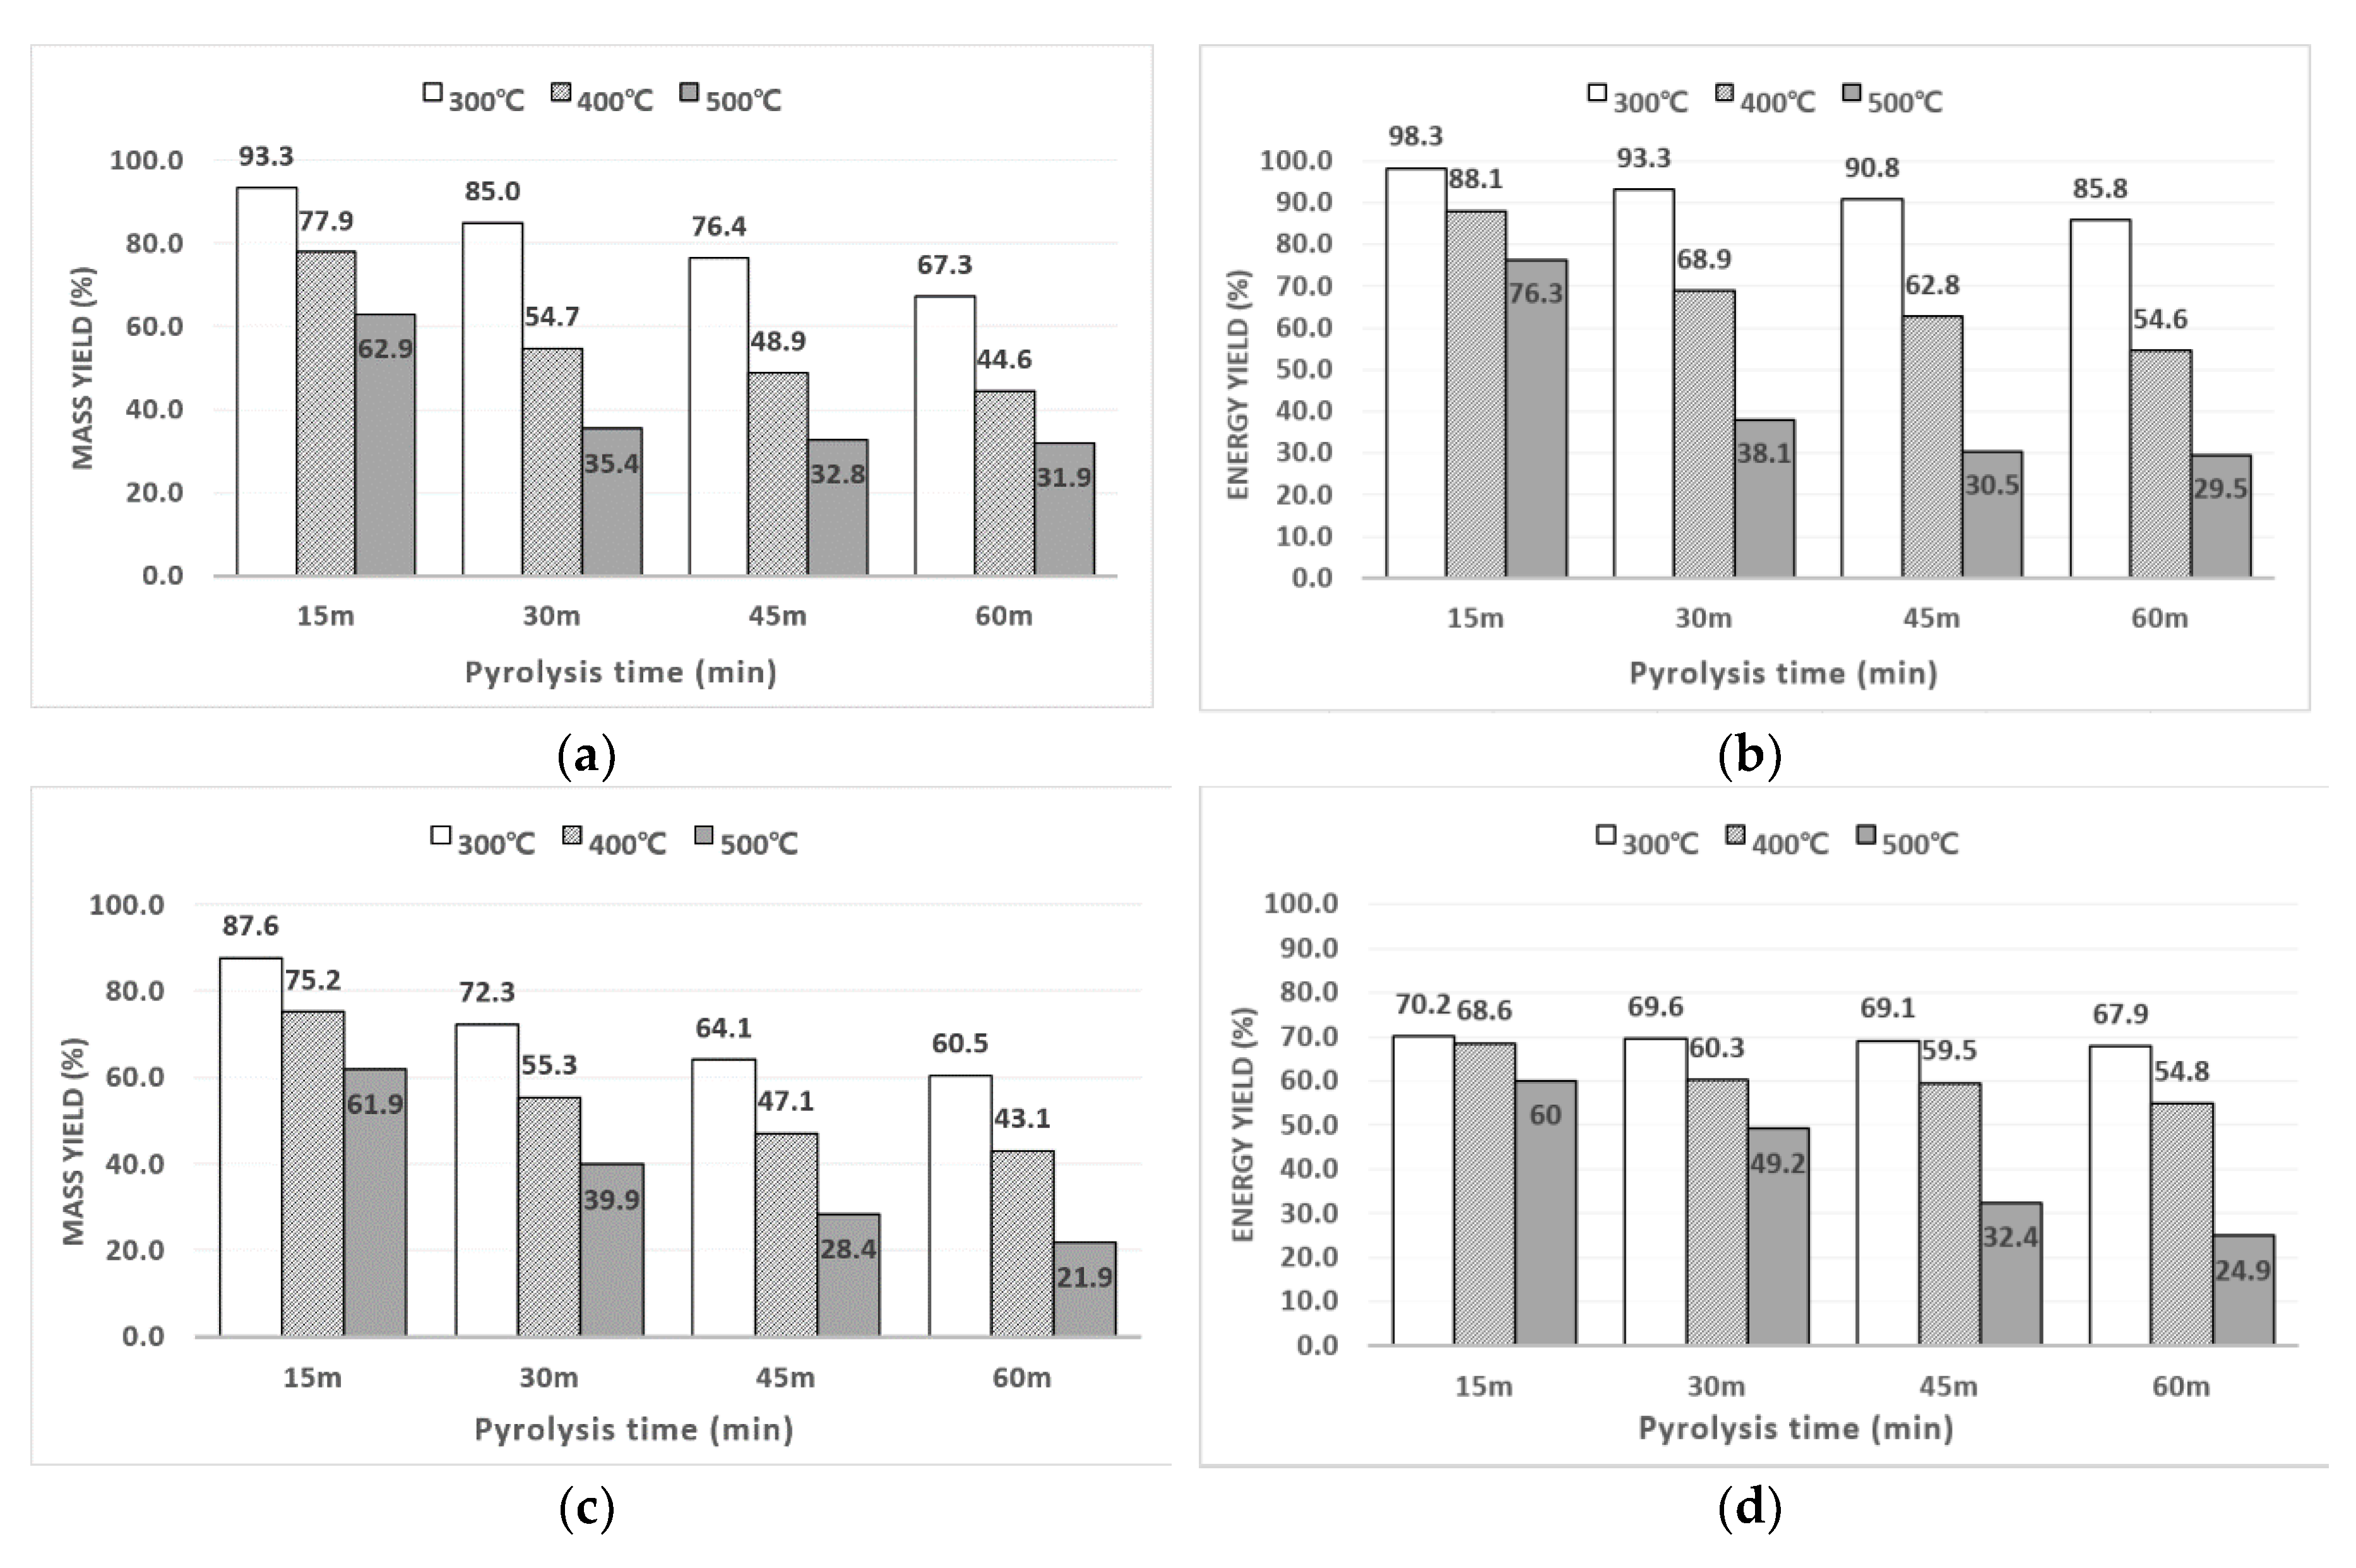
3.1.2. Energy and Mass Yield

The energy yield of the feedstuff and compost was generally greater than the mass yield (From Figure 3), because the energy yield increases along with the caloric value upon pyrolysis. The mass yield of the feedstuff after pyrolysis for 45–60 min at 500 °C was higher than the energy yield, because the caloric value decreases as the salt concentration increases. However, the mass yield of the compost was higher after pyrolysis for 15 min at each temperature (300–500 °C), as it had a low caloric value because of its high moisture content. The energy yields of the feedstuff and compost were 30.4–29.5% and 32.4–24.9%, respectively, after pyrolysis with the conditions to produce char with characteristics as close to those of coal as possible in the van Krevelen diagram.

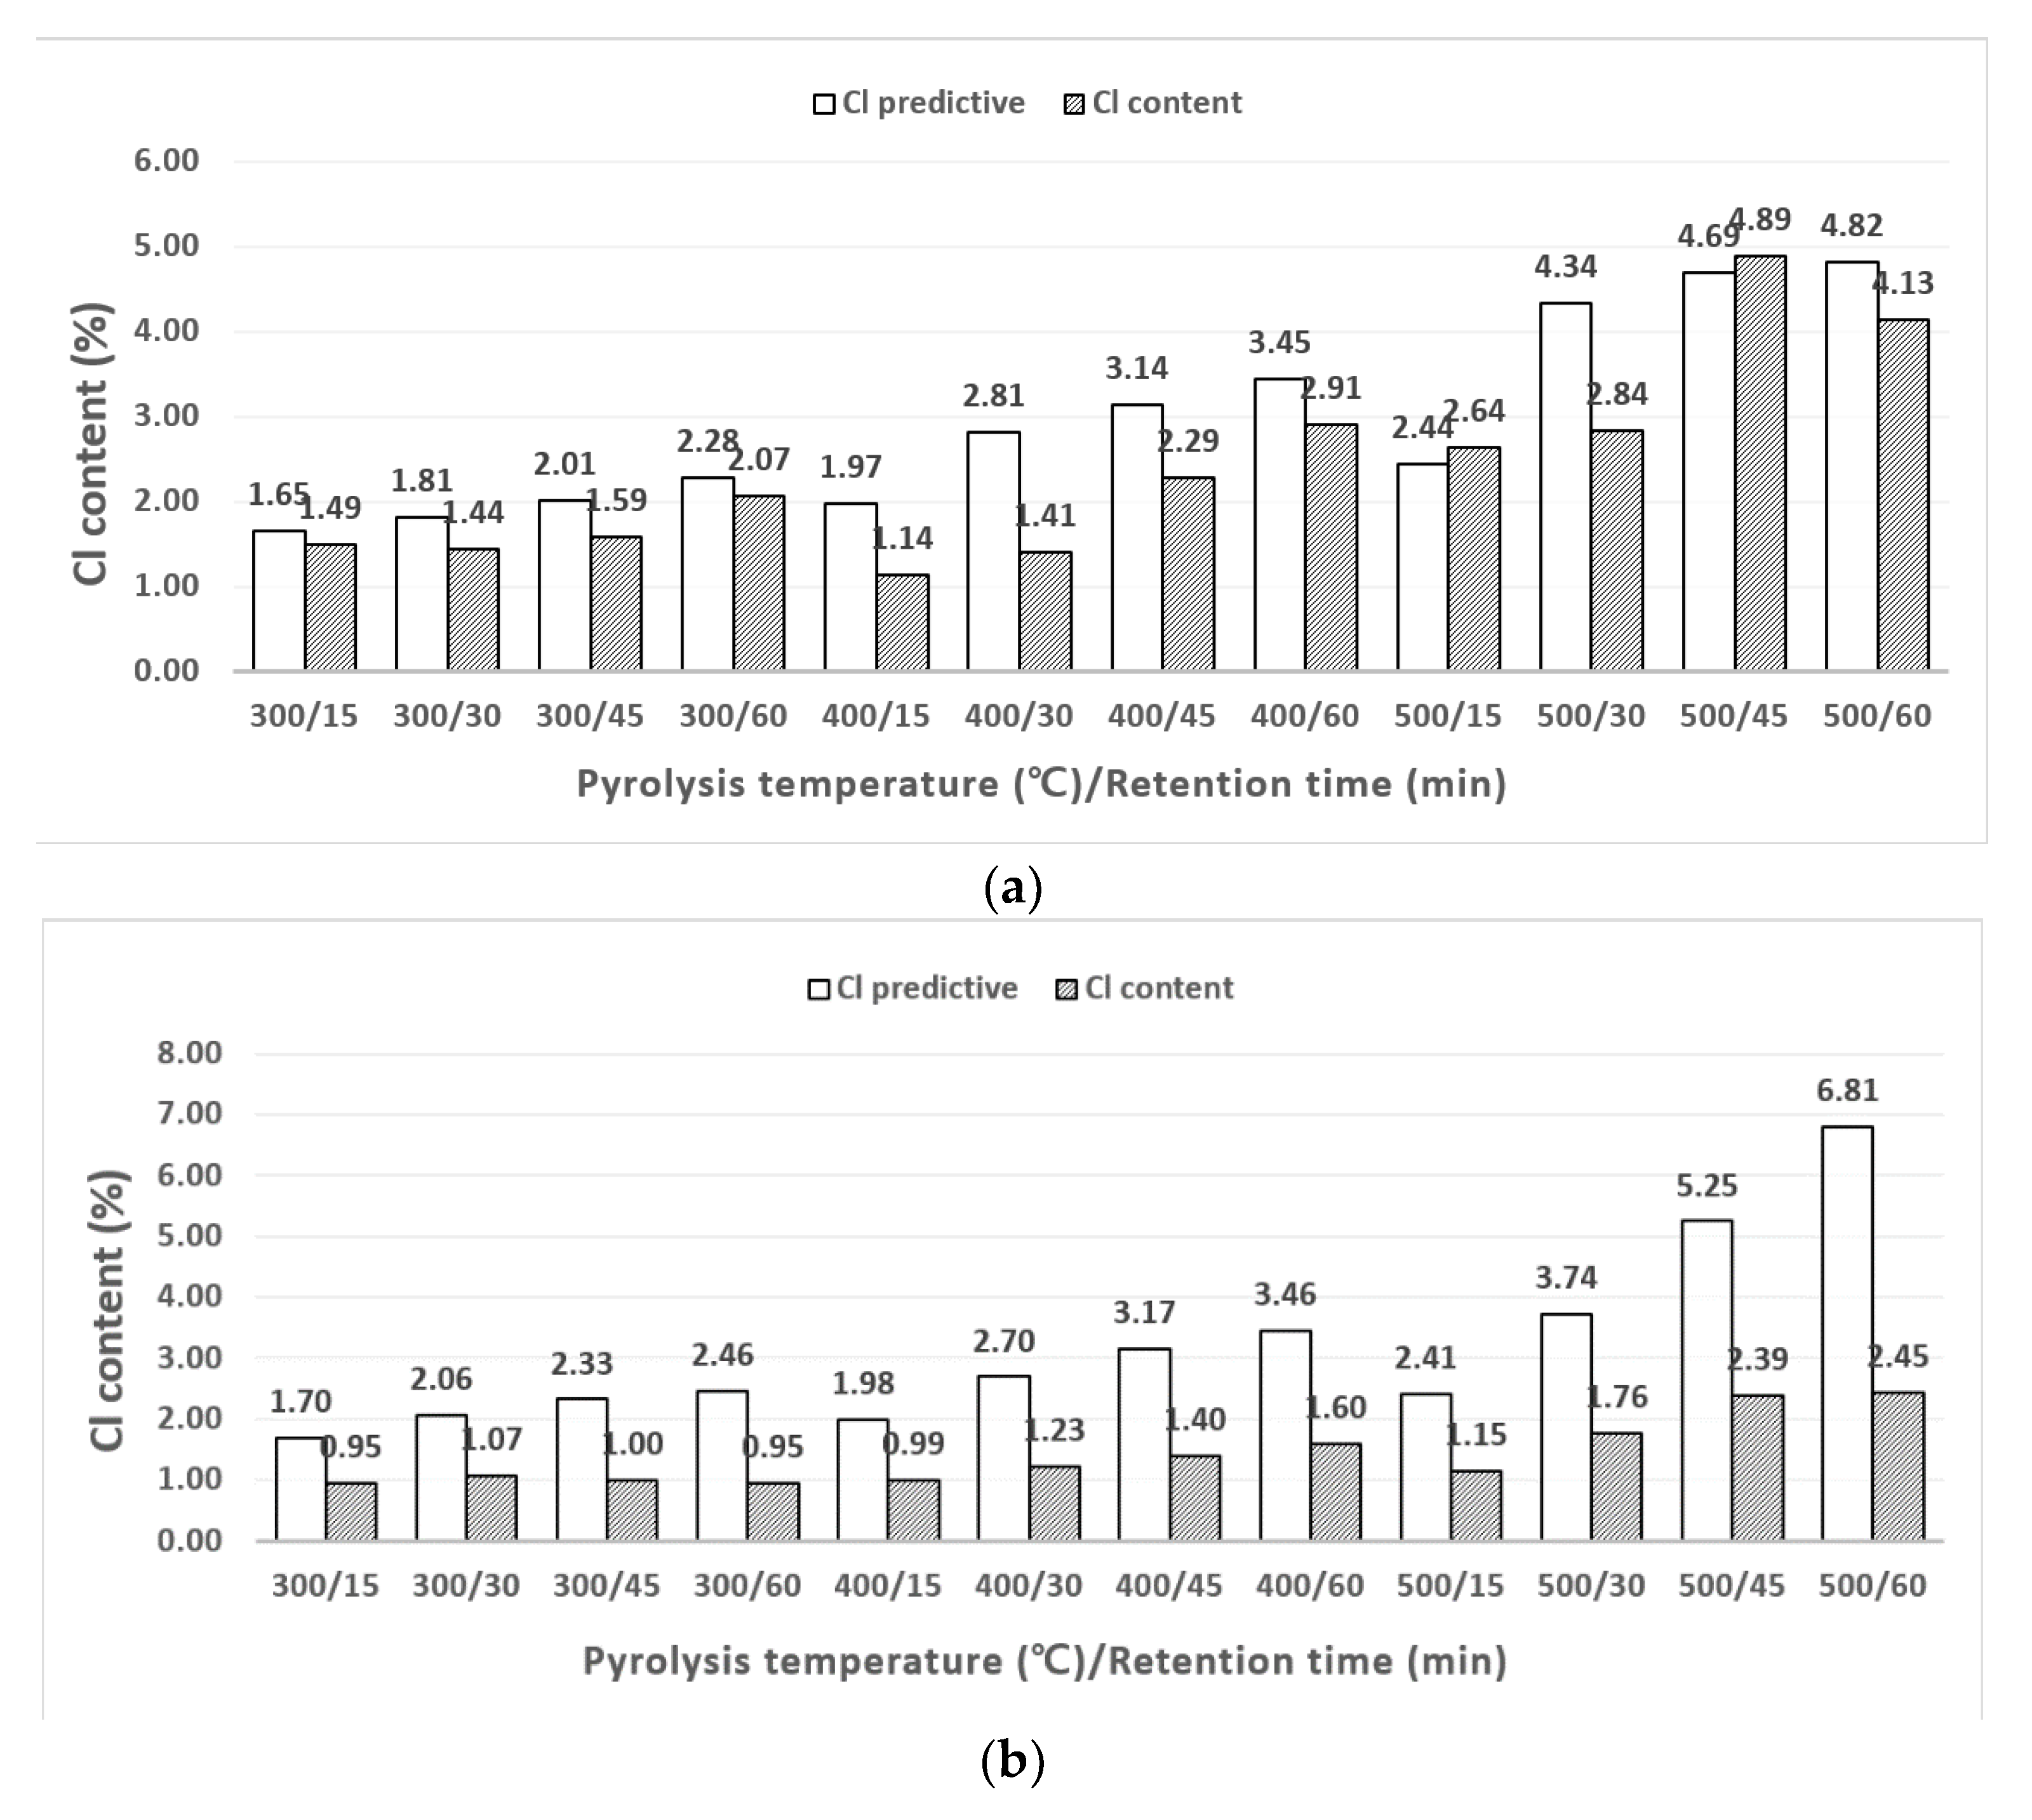
3.2. Chlorine Content Change with Different Pyrolysis Conditions

Before using food waste as a combustion fuel, the change in the chlorine content—the most harmful substance in the fuel—was measured by combustion ion chromatography. The results are shown in Figure 4. The predicted chlorine value was calculated using Equation (3) based on the yield of char, assuming that the 1.54 and 1.49 wt.% chlorine contained in the raw feedstuff and raw compost, respectively, remained after pyrolysis. When chlorine is present in the crystal form of sodium chloride, it does not volatilize and remains in the char. Moreover, the chlorine gets more concentrated with increasing pyrolysis temperature and time.
  Predicted   chlorine   content   ( % ) =   raw   chlorine   content   ( % ) Mass   yield ( % )   ×   100 ,
The actual concentration of chlorine generally increased in both the food waste compost and feedstuff as the pyrolysis time increased. The chlorine contents of the compost showed a similar trend to that of torrefied rice straw by Chen et al. [14]. Compost has a lower chlorine content than feedstuff, as the compost is diluted during the washing process (water is added to the food waste to remove salt), and sawdust is added as a moisture-controlling agent. Since the main component of the discharged compost is sawdust [20], it exhibits similar chlorine behavior to other wood-based biomass studies. However, the feedstuff showed a different trend, with chlorine contents closer to the predicted values.
Figure 4 demonstrates that the actual chlorine content of the feedstuff and compost was generally lower than the predicted chlorine contents. This indicates that some chlorine volatilization occurs. The chlorine volatiles are more active in the compost than the feedstuff. Sodium chloride dissolves readily in water and exists in the form of ions. Compost contained relatively abundant water and is, therefore, more likely to contain ionized chlorine in the water as well as salt in the form of crystals. Hence, it can be interpreted that when heat is applied rapidly to the ionized water, the chlorine is highly volatile. Since the feedstock is produced through a drying process, most of the moisture is removed, increasing the proportion of salt in the form of crystals, which are not easily volatile; the chlorine therefore tends to remain after pyrolysis. Given the amount of chlorine in the biochars, it can be expected that the compost biochar will cause less combustion corrosion or dioxin. However, the high chlorine content of biochar is a major disadvantage compared to fossil fuels and needs to be eliminated.

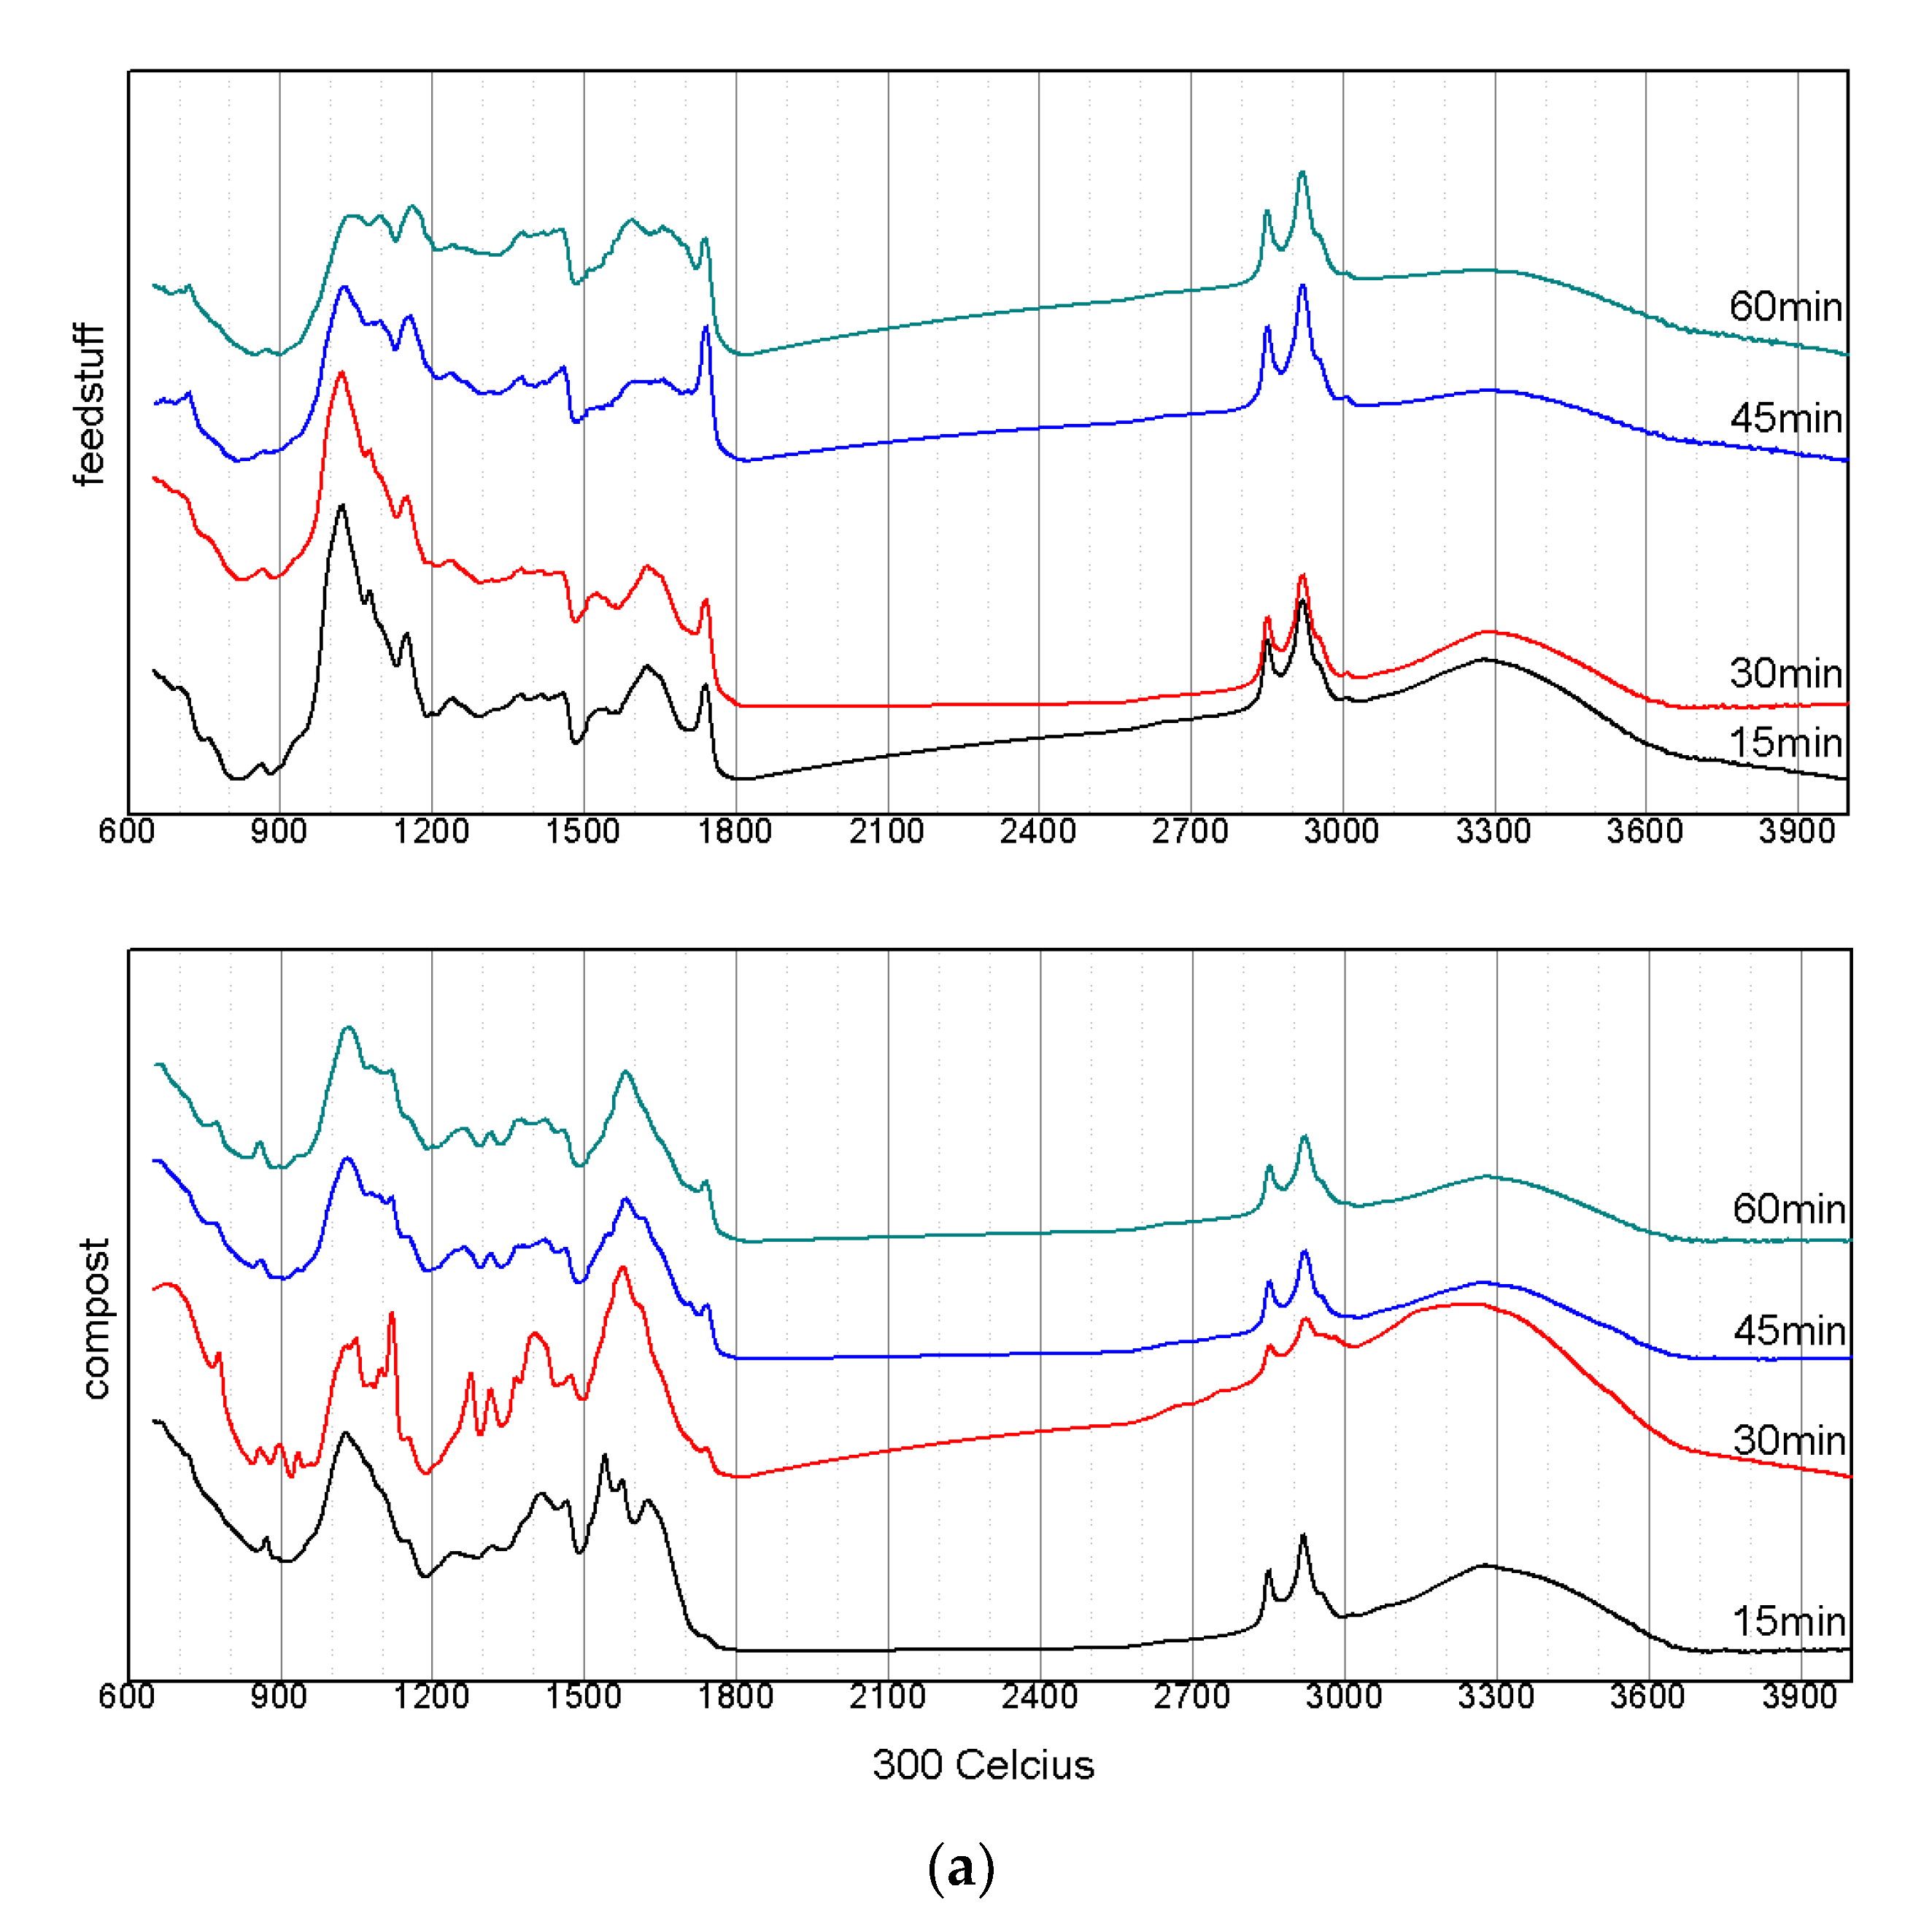
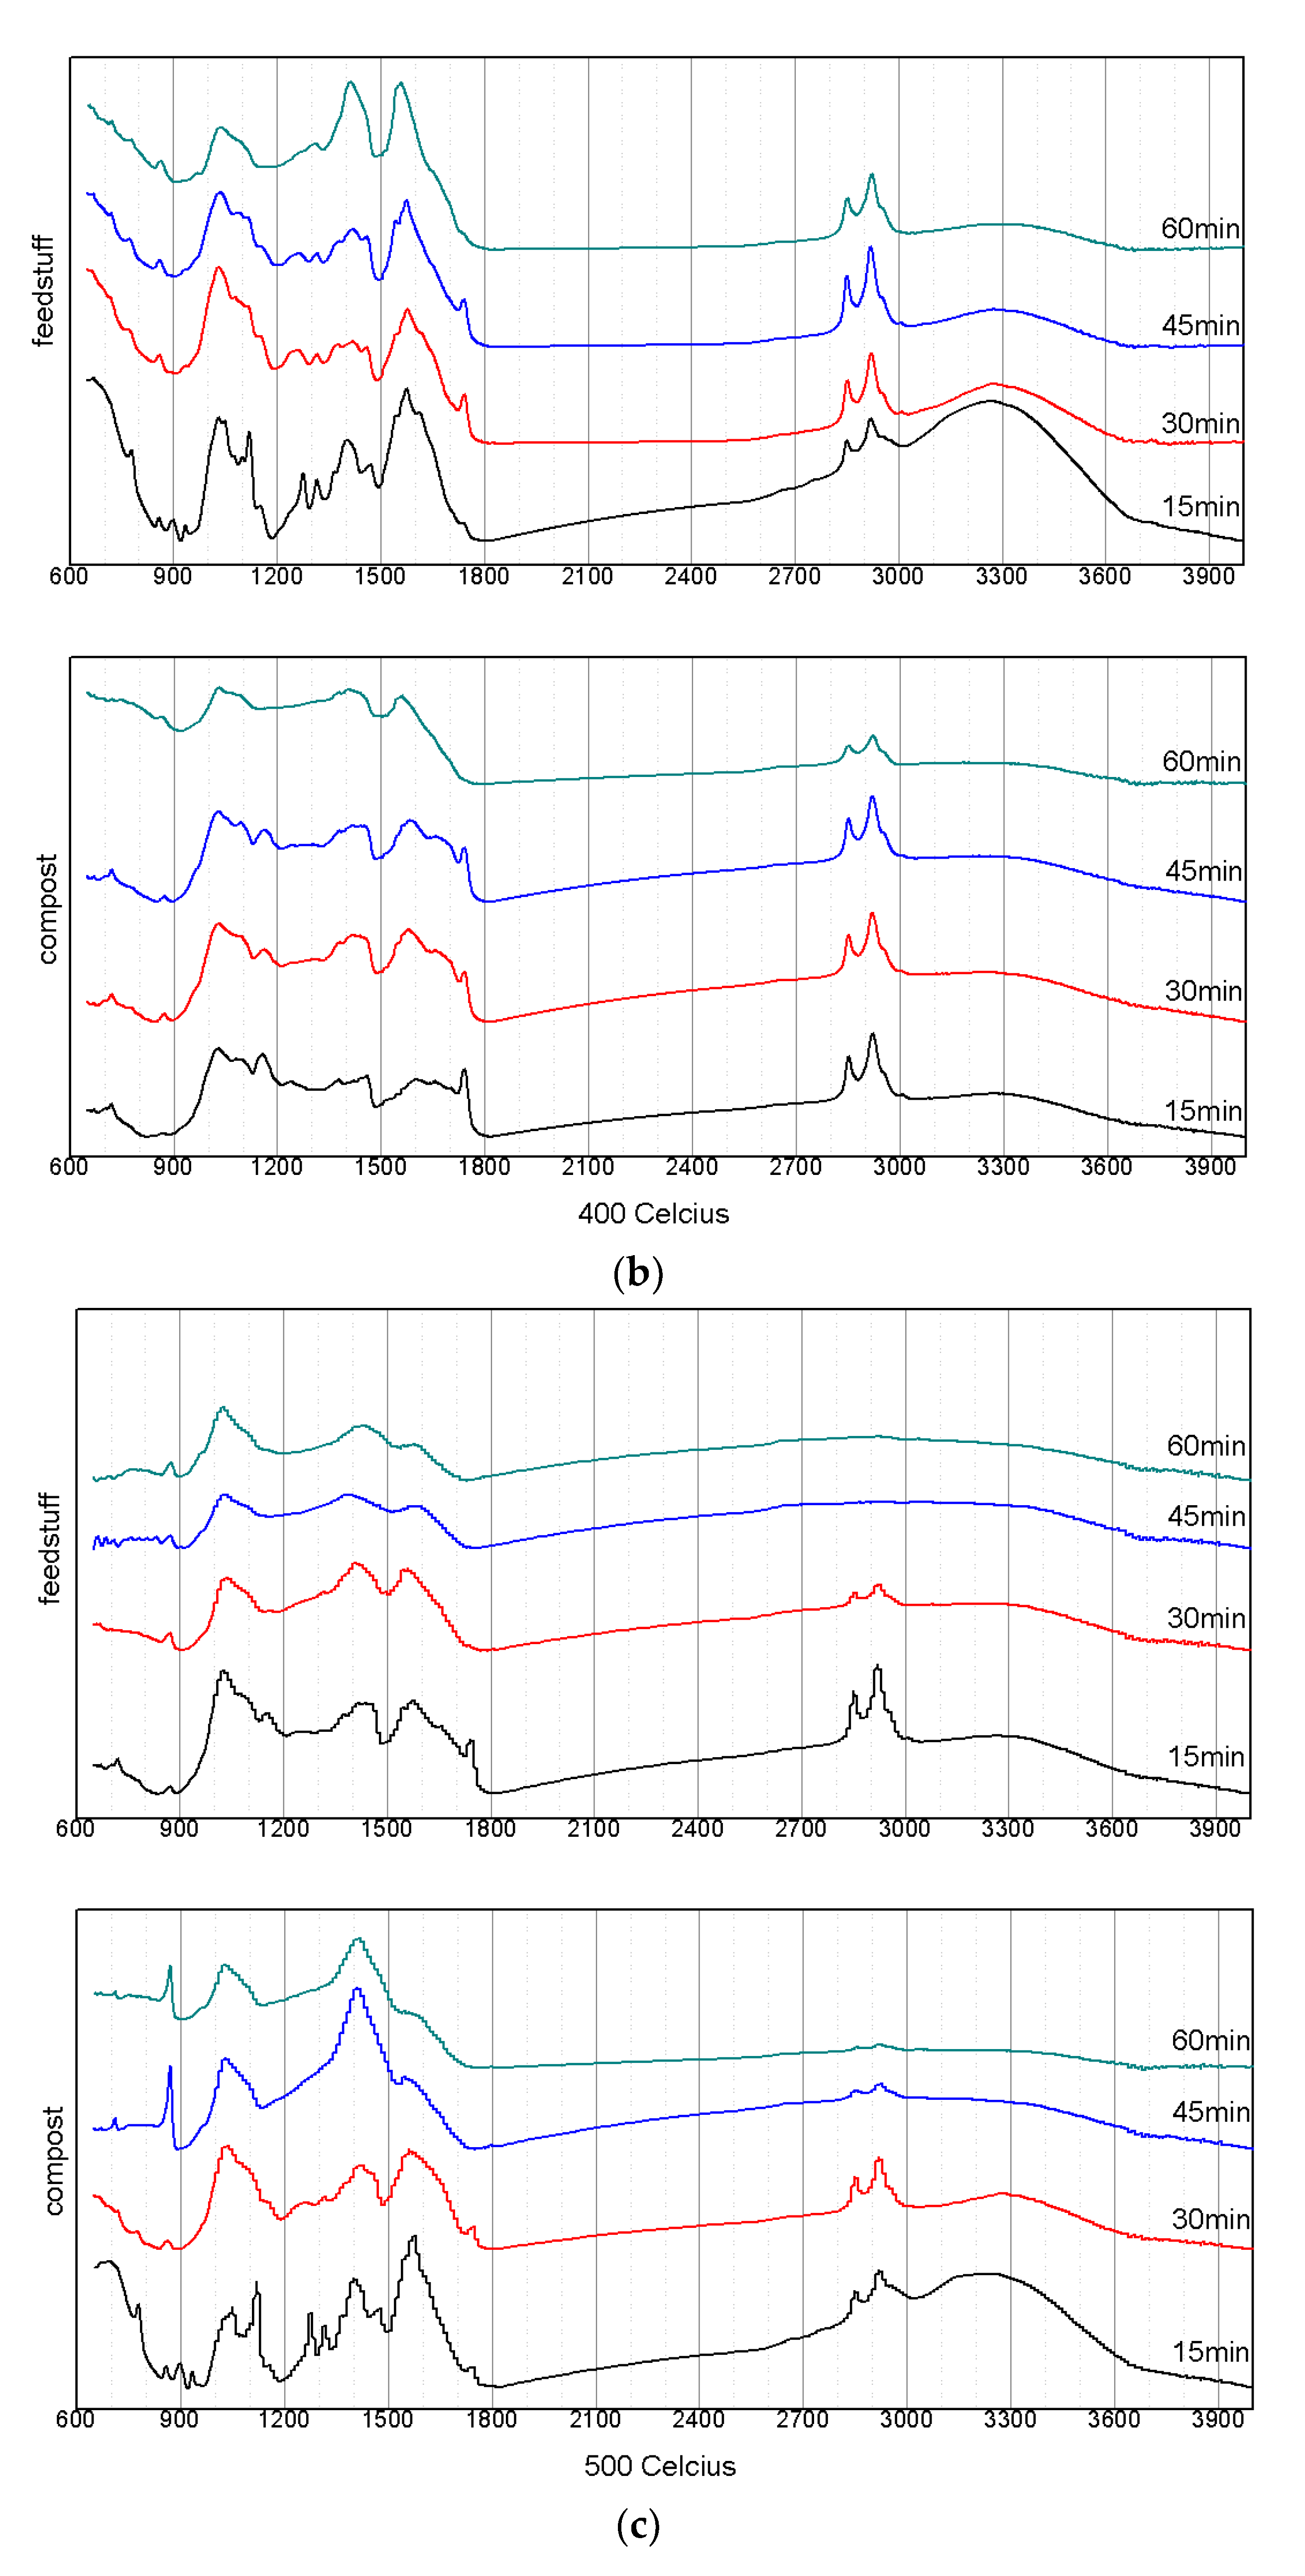
3.3. Changes in the Structuralized Characteristics According to the Pyrolysis Conditions

Figure 5 compares the FT-IR spectra of the food waste compost and feedstuff. The 900–1200 cm−1 region indicates the C–O–C stretching vibration of polysaccharides [23], which is dominant in carbohydrates; both the feedstuff and compost exhibited strong peaks in this section. At 1200–1350 cm−1, compost exhibited peaks at 1248 and 1317 cm−1, which indicates the occurrence of C–N stretching of amide III [24]. Although the feedstuff also exhibited peaks at similar locations, the peaks were lower than for the compost. This can also be seen from the two peaks at 1500–1600 cm−1. Although the compost showed a clear C–N stretching peak of the amide II band at 1541 and 1575 cm−1, it was difficult to identify peaks at that level for the feedstuff. The amide I peak in the 1600–1700 cm−1 region indicates that the C=O stretching was weakly coupled with C–N stretching and N–H bending. Although both the compost and feedstuff showed a peak near 1620 cm−1, the peak was more distinct for compost. The amide vibration infers a combination of peptides [25,26,27]—a type of protein—as protein is a major constituent of the cell walls of microorganisms. Compost contains not just food waste but also the aerobic microorganisms involved in the digestion of the food waste. The peak near 1740 cm−1 indicated C=O ester stretching vibrations [23,26,28], which come from the ester linkages of either fatty acids or various polysaccharides. The structure of the C=O carbonyl is easily degradable [29]. Therefore, compost, which undergoes a decomposition process of polymer organic materials due to microorganisms, showed a smaller peak. The aliphatic compound C–H stretching peak near 2850 and 2920 cm−1 and the O–H stretching peak which appeared broadly between 3100–3600 cm−1 can be clearly identified for both materials.
When the pyrolysis temperature was 300 °C, the amide peak and O–H peak at 1541 and 1620 cm−1, respectively; the polysaccharides peak near 1030 cm−1; and the peak near 1025 cm−1 that appeared in the hemicellulose were greatly decreased or absent in the food waste feedstuff. Although the peaks at 1541 and 1620 cm−1 disappeared from the compost spectra, there were no large changes in the C–O peak, and the C–H deformation peak near 1400 cm−1 decreased. The reason that the feedstuff exhibited more changes than the compost during pyrolysis at 300 °C is that relatively few changes occur in the structure of the organic matter in compost, as more energy is used for moisture volatilization.
With a pyrolysis temperature of 400 °C, the carbonyl peak at 1720 cm−1 disappeared after 60 min for both the feedstuff and compost. The amide peak also rapidly decreased as the pyrolysis time increased, eventually disappearing from the spectra altogether. While there were continuous decreases in the O–H and C–H stretching peaks for the feedstuff, there was only a decrease in the O–H stretching peak for compost. Therefore, while the energy produced homogeneous decomposition among the organic matter in the feedstuff, similarly to at 300 °C, in the compost, moisture volatilization and microorganism decomposition occurred. After carbonization at 400 °C for 60 min, the spectra of the feedstuff and compost were similar, aside from the intensities of the peaks. This means that despite the different preprocessing techniques, it is possible to produce biochar of similar quality from both feedstuff and compost by subjecting them to certain pyrolysis conditions. This can be further verified from Table 3, which shows that the feedstuff and compost had similar caloric values (5486 and 5324 kcal/kg, respectively) under the same pyrolysis conditions.
After just 30 min of pyrolysis at 500 °C, the peaks of the spectra resemble those after 60 min of pyrolysis at 400 °C. For feedstuff, as the pyrolysis time increases, most of the peaks decrease, with only the aromatic C=C stretching at 1600 and 1450 cm−1 and the C−H in a plane-bending vibration near 1010 cm−1 remaining. However, when the compost was pyrolyzed at 500 °C for up to 60 min, the peaks of the aliphatic compounds at 2850 and 2920 cm−1 did not disappear, and the broad peaks at 1030 and 1400–1440 cm−1 became more distinct compared to those of the feedstuff. The peaks near 1030 and 1400 cm−1 indicate C–O–C stretching and C–H deformation [23,29], respectively, and the relatively weak aromatic carbon peak at 1600 cm−1 indicates that the compost underwent insufficient aromatization. This can be interpreted by considering the role of the sawdust included in the compost as recalcitrant matter composed of cellulose and lignin, which requires sufficient energy for decomposition and aromatization. In addition, the compost contained moisture from microorganisms due to the composting process.

3.4. Slagging and Fouling Indices Analysis

Inorganic materials, including salts in food waste, may cause slagging and fouling depending on their composition and content. It is therefore essential to assess their value as fossil fuels. Table 4 shows the results of calculations according to the slagging and fouling indices formulas shown in Table 2, based on the XRF analysis of the ash left after incinerating each sample (shown in Table 5) and analysis of the ash fusion temperature. The results of the ash fusion analysis showed that under all tested pyrolysis conditions, deformation temperature (DT), softening temperature (ST), hemispherical temperature (HT), and fluid temperature (FT) were always more than 1500 °C.
The XRF analysis showed that the food waste feedstuff and compost were both high in calcium. Food waste contains a lot of fruit seeds, which typically remain undisturbed by microbes during composting. In particular, the aragonite crystals that compose the seeds are CaCO3 crystals containing calcium, which can be inferred as having a high content in feed and compost. This high calcium content can increase the ash melting point, but it can also increase the slagging and fouling effects.
Although there were differences in the specific numbers of the index, it was difficult to find strong differences in the slagging and fouling potential within each index. In particular, there was a large difference in the slagging and fouling potential among each index. This is because of the differences in the characteristics of the raw material. Food waste has a low sulfur content; therefore, there was little fouling from sulfur. The ash fusibility index was also low owing to the stable ash fusion temperature behavior, with the DT and HT of all samples at 1500 °C and above. The behavior of the ash fusion temperature is related to the characteristics of the raw material with high calcium contents. When the B/A values were similar, the ash fusion temperature increased when the Ca/Fe ratio was >1, which contributed to decreased slagging [30,31,32]. Conversely, owing to the high calcium contents, the mineral contents (such as silicon, aluminum, and iron) were relatively low and, therefore, the silica ratio, B/A ratio, and Fu index were shown to have high potentials. Therefore, further research is needed to remove salt compounds, and overall compost is more appropriate for use as a co-firing fuel with a lower slagging and flushing index compared to feedstuff.

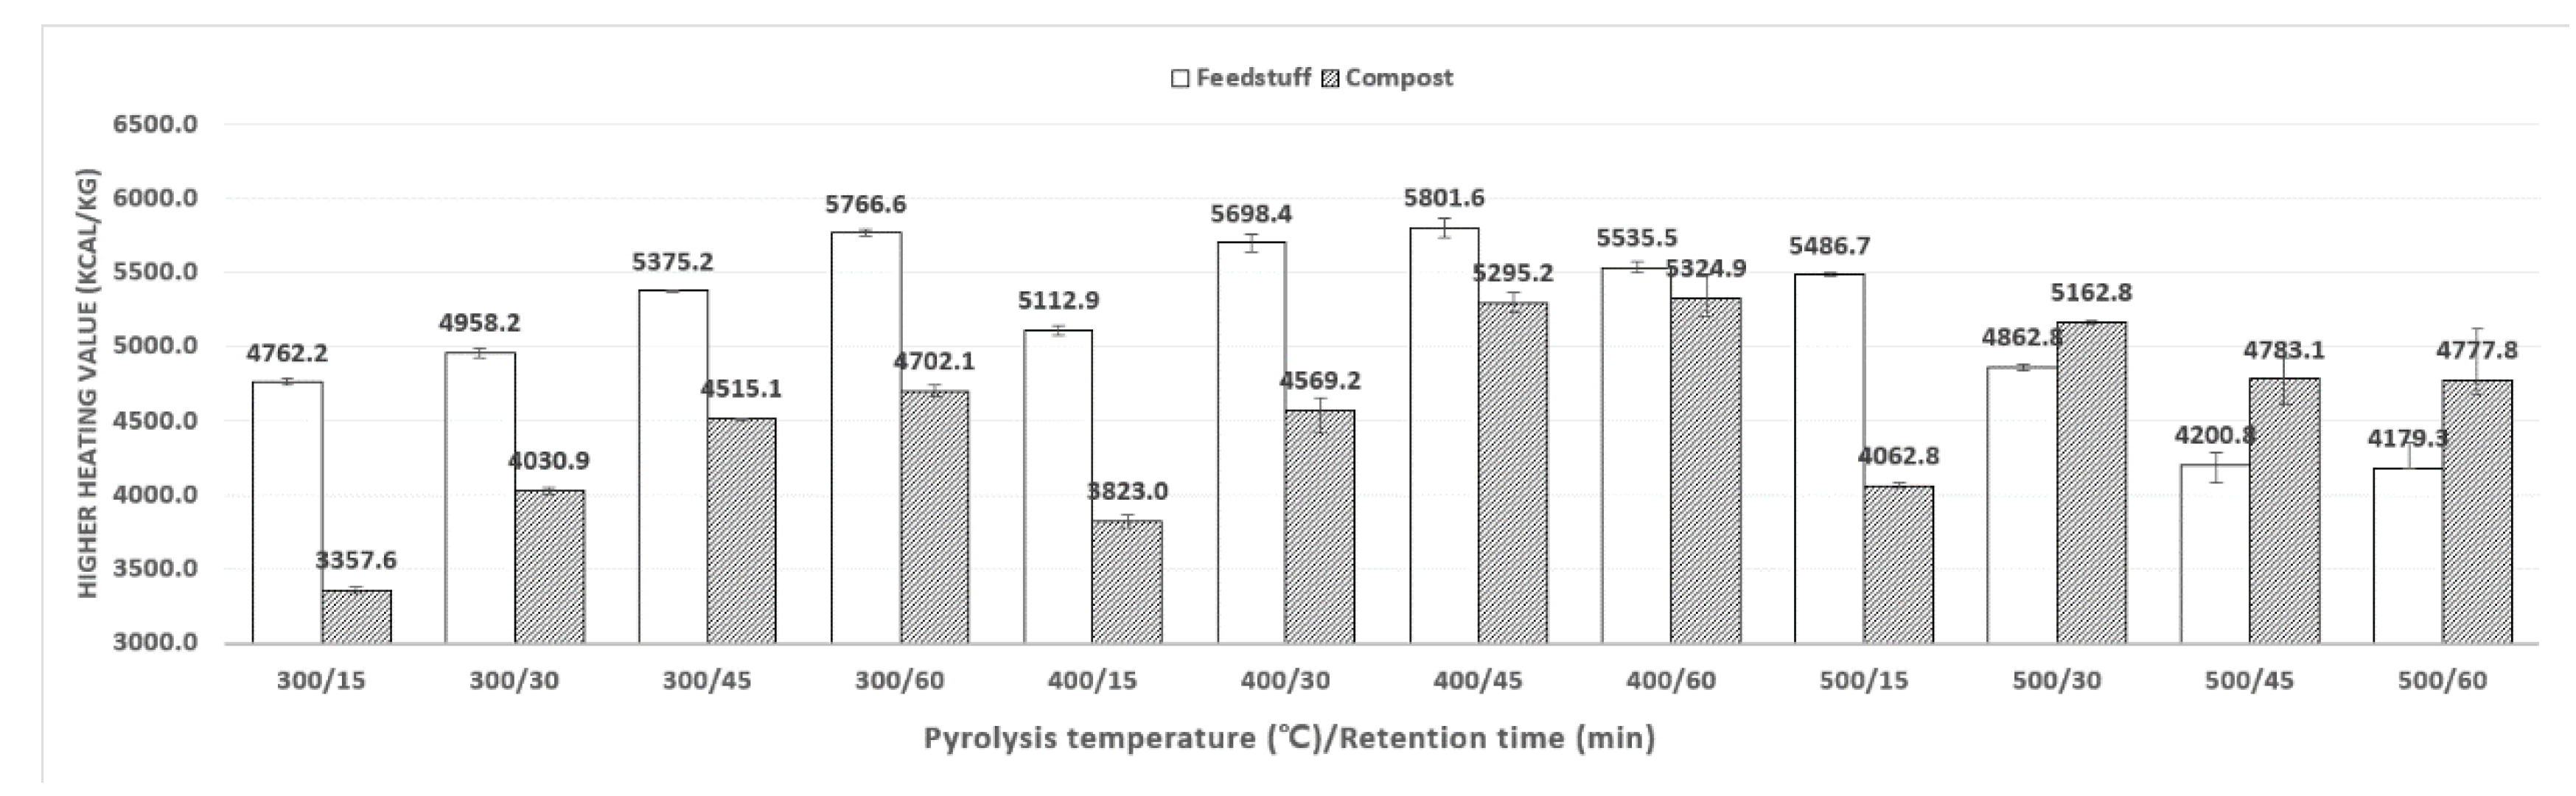
3.5. Higher Heating Value (HHV) Analysis

Figure 6 shows the caloric values (higher heating values, HHVs) of each sample according to the pyrolysis conditions. The caloric values of the raw compost samples increased as the pyrolysis time increased, from 3357 to 4702 kcal/kg at 300 °C, and from 3823 to 5324 kcal/kg at 400 °C. The caloric value decreased after pyrolysis for 45–60 min at 500 °C, which may be the result of the increased salt concentration and increased organic matter volatilization. The calorific values of the feedstuff decreased after reaching a maximum at 45 min of pyrolysis at 400 °C. This is due to active volatilization of the organic matter and an increase in the salt concentration compared to the compost which had high moisture content. After pyrolysis for 60 min at 400 °C, the compost had the highest caloric value of 5324.9 kcal/kg. After pyrolysis for 45 min at 400 °C, the feedstuff had the highest caloric value of 5801.6 kcal/kg. Hence, the feedstuff exhibited a higher maximum caloric value than compost. Pyrolysis at 400 °C was the most appropriate condition to increase the caloric values for both feedstuff and compost, and feedstuff is a more valuable co-firing fuel than compost in terms of its calorific value.

4. Conclusions

The purpose of this study was to identify the fuel characteristics of food waste compost and food waste feedstuff to apply as a co-firing fuel. As the temperature and retention of pyrolysis increased, the higher heating value of food waste compost continued to increase at 300–400 ° C, but the calorific value decreased after pyrolysis at 500 ° C for more than 30 min. In case of food waste feedstuff, the calorific value decreased when the food waste was pyrolyzed for more than 45 min at 400 degrees. If the chloride-to-carbon ratio is above about 4.5%, the calorific value decreases, so that the salinity should be removed to secure sufficient calorific value as fuel. Further research is necessary to achieve this. Both the food waste feedstuff and compost have a high calcium content, which negatively affects the slagging and fouling indices; however, it is difficult to determine the effects of slagging and fouling due to their stable ash fusion behavior. In order to use the pyrolyzed food waste as a co-firing fuel, sodium, potassium, etc. due to salts other than calcium need to be removed, and further studies will be conducted to eliminate the salt problem.

Author Contributions

Conceptualization, Y.-E.L. and Y.-S.Y.; Validation, Y.-E.L., Y.-S.Y.; Formal Analysis, Y.-E.L.; Data curation, Y.J., D.-C.S.; Investigation, Y.-E.L.; Methodology, Y.J.; Resources, D.-C.S.; Writing-Original Draft Preparation, Y.-E.L.; Writing-Review & Editing, Y.-E.L., Y.J., and I.-T.K.; Supervision, Y.-S.Y.; Project Administration, I.-T.K.

Funding

This work was supported by the Major Project of the Korea Institute of Civil Engineering and Building Technology (KICT) [grant number 2019-0152].

Conflicts of Interest

The authors declare no conflict of interest.

References

  1. Pham, T.P.T.; Kaushik, R.; Parshetti, G.K.; Mahmood, R.; Balasubramanian, R. Food waste-to-energy conversion technologies: current status and future directions. Waste Manag. 2015, 38, 399–408. [Google Scholar] [CrossRef] [PubMed]
  2. Wu, D.; Wang, Y.; Wang, Y.; Li, S.; Wei, X. Release of alkali metals during co-firing biomass and coal. Renew. Energy 2016, 96, 91–97. [Google Scholar] [CrossRef]
  3. Daood, S.S.; Javed, M.T.; Gibbs, B.M.; Nimmo, W. NOx control in coal combustion by combining biomass co-firing, oxygen enrichment and SNCR. Fuel 2013, 105, 283–292. [Google Scholar] [CrossRef]
  4. Munir, S.; Nimmo, W.; Gibbs, B.M. The effect of air staged, co-combustion of pulverised coal and biomass blends on NOx emissions and combustion efficiency. Fuel 2011, 90, 126–135. [Google Scholar] [CrossRef]
  5. Li, J.; Zhang, X.; Yang, W.; Blasiak, W. Effects of flue gas internal recirculation on NOx and SOx emissions in a co-firing boiler. Int. J. Clean Coal Energy 2013, 2, 13–21. [Google Scholar] [CrossRef]
  6. Demirbas, A. Combustion characteristics of different biomass fuels. Prog. Energy Combust. Sci. 2004, 30, 219–230. [Google Scholar] [CrossRef]
  7. Baxter, L.L.; Miles, T.R.; Miles, T.R., Jr.; Jenkins, B.M.; Milne, T.; Dayton, D.; Bryers, R.W.; Oden, L.L. The behavior of inorganic material in biomass-fired power boilers: Field and laboratory experiences. Fuel Process. Technol. 1998, 54, 47–78. [Google Scholar] [CrossRef]
  8. Poudel, J.; Ohm, T.I.; Oh, S.C. A study on torrefaction of food waste. Fuel 2015, 140, 275–281. [Google Scholar] [CrossRef]
  9. Opatokun, S.A.; Strezov, V.; Kan, T. Product based evaluation of pyrolysis of food waste and its digestate. Energy 2015, 92, 349–354. [Google Scholar] [CrossRef]
  10. Lee, Y.E.; Jo, J.H.; Kim, S.M.; Yoo, Y.S. Recycling possibility of the salty food waste by pyrolysis and water scrubbing. Energies 2017, 10, 210. [Google Scholar] [CrossRef]
  11. Keipi, T.; Tolvanen, H.; Kokko, L.; Raiko, R. The effect of torrefaction on the chlorine content and heating value of eight woody biomass samples. Biomass Bioenergy 2014, 66, 232–239. [Google Scholar] [CrossRef]
  12. Chen, H.; Chen, X.; Qiao, Z.; Liu, H. Release and transformation characteristics of K and Cl during straw torrefaction and mild pyrolysis. Fuel 2016, 167, 31–39. [Google Scholar] [CrossRef]
  13. Wang, Y.; Wu, H.; Sárossy, Z.; Dong, C.; Glarborg, P. Release and transformation of chlorine and potassium during pyrolysis of KCl doped biomass. Fuel 2017, 197, 422–432. [Google Scholar] [CrossRef]
  14. Chen, H.; Chen, X.; Qiao, Z.; Liu, H. Release and transformation behavior of Cl during pyrolysis of torrefied rice straw. Fuel 2016, 183, 145–154. [Google Scholar] [CrossRef]
  15. Saleh, S.B.; Flensborg, J.P.; Shoulaifar, T.K.; Sárossy, Z.; Hansen, B.B.; Egsgaard, H.; DeMartini, N.; Jensen, P.A.; Glarborg, P.; Dam-Johansen, K. Release of chlorine and sulfur during biomass torrefaction and pyrolysis. Energy Fuels 2014, 28, 3738–3746. [Google Scholar] [CrossRef]
  16. Lawrence, A.; Kumar, R.; Nandakumar, K.; Narayanan, K. A novel tool for assessing slagging propensity of coals in PF boilers. Fuel 2008, 87, 946–950. [Google Scholar] [CrossRef]
  17. Pronobis, M. Evaluation of the influence of biomass co-combustion on boiler furnace slagging by means of fusibility correlations. Biomass Bioenergy 2005, 28, 375–383. [Google Scholar] [CrossRef]
  18. Teixeira, P.; Lopes, H.; Gulyurtlu, I.; Lapa, N.; Abelha, P. Evaluation of slagging and fouling tendency during biomass co-firing with coal in a fluidized bed. Biomass Bioenergy 2012, 39, 192–203. [Google Scholar] [CrossRef]
  19. López, C.; Unterberger, S.; Maier, J.; Hein, K.R.G. Overview of actual methods for characterization of ash deposition. In Proceedings of the Heat Exchanger Fouling and Cleaning: Fundamentals and Applications, ECI Symposium Series, Santa Fe, NM, USA, 18–22 May 2003. [Google Scholar]
  20. Lee, Y.E.; Jo, J.H.; Kim, I.T.; Yoo, Y.S. Value-added performance and thermal decomposition characteristics of dumped food waste compost by pyrolysis. Energies 2018, 11, 1061. [Google Scholar] [CrossRef]
  21. Park, S.-W.; Jang, C.-H. Effects of pyrolysis temperature on changes in fuel characteristics of biomass char. Energy 2012, 39, 187–195. [Google Scholar] [CrossRef]
  22. Prins, M.J.; Ptasinski, K.J.; Janssen, F.J.J.G. More efficient biomass gasification via torrefaction. Energy 2006, 31, 3458–3470. [Google Scholar] [CrossRef]
  23. Bekiaris, G.; Bruun, S.; Peltre, C.; Houot, S.; Jensen, L.S. FTIR-PAS: A powerful tool for characterising the chemical composition and predicting the labile C fraction of various organic waste products. Waste Manag. 2015, 39, 45–56. [Google Scholar] [CrossRef] [PubMed]
  24. Chang, M.C.; Tanaka, J. FT-IR study for hydroxyapatite/collagen nanocomposite cross-linked by glutaraldehyde. Biomaterials 2002, 23, 4811–4818. [Google Scholar] [CrossRef]
  25. Singh, B.R.; DeOliveira, D.B.; Fu, F.N.; Fuller, M.P. Fourier transform infrared analysis of amide III bands of proteins for the secondary structure estimation. In Biomolecular Spectroscopy III, Proceedings of SPIE 1890, Los Angeles, CA, USA, 17–22 January 1993; Nafie, L.A., Mantsch, H.H., Eds.; International Society for Optics and Photonics: Bellingham, WA, USA, 1993; pp. 47–55. [Google Scholar] [CrossRef]
  26. Hadjoudja, S.; Deluchat, V.; Baudu, M. Cell surface characterisation of Microcystis aeruginosa and Chlorella vulgaris. J. Colloid Interface Sci. 2010, 342, 293–299. [Google Scholar] [CrossRef] [PubMed]
  27. Jebsen, C.; Norici, A.; Wagner, H.; Palmucci, M.; Giordano, M.; Wilhelm, C. FTIR spectra of algal species can be used as physiological fingerprints to assess their actual growth potential. Physiol. Plant. 2012, 146, 427–438. [Google Scholar] [CrossRef] [PubMed]
  28. Bekiaris, G.; Peltre, C.; Jensen, L.S.; Bruun, S. Using FTIR-photoacoustic spectroscopy for phosphorus speciation analysis of biochars. Spectrochim. Acta Part A 2016, 168, 29–36. [Google Scholar] [CrossRef]
  29. Yuan, J.H.; Xu, R.K.; Zhang, H. The forms of alkalis in the biochar produced from crop residues at different temperatures. Bioresour. Technol. 2011, 102, 3488–3497. [Google Scholar] [CrossRef]
  30. Shi, W.J.; Kong, L.X.; Bai, J.; Xu, J.; Li, W.C.; Bai, Z.Q.; Li, W. Effect of CaO/Fe2O3 on fusion behaviors of coal ash at high temperatures. Fuel Process. Technol. 2018, 181, 18–24. [Google Scholar] [CrossRef]
  31. Holubcik, M.; Jandacka, J.; Malcho, M. Ash melting temperature prediction from chemical composition of biomass ash. Holist. Approach Environ. 2015, 5, 119–125. [Google Scholar]
  32. Gao, Y.; Ding, L.; Li, X.; Wang, W.; Xue, Y.; Zhu, X.; Hu, H.; Luo, G.; Naruse, I.; Bai, Z.; et al. Na&Ca removal from Zhundong coal by a novel CO2-water leaching method and the ashing behavior of the leached coal. Fuel 2017, 210, 8–14. [Google Scholar] [CrossRef]
Figure 1. Configuration of the pyrolysis experiment setup [10].
Energies 12 04538 g001
Figure 2. Van Krevelen diagrams for compost and feedstuff prepared at different pyrolysis temperatures and retention time (○: Food waste compost, △: Food waste feedstuff, △: 300 °C, △: 400 °C, ▲: 500 °C).
Energies 12 04538 g002
Figure 3. Mass and energy yield of: (a,b) food waste feedstuff, and (c,d) food waste compost with different pyrolysis temperatures and durations.
Energies 12 04538 g003
Figure 4. Chlorine contents of (a) feedstuff and (b) compost with different pyrolysis conditions.
Energies 12 04538 g004
Figure 5. FT-IR results of food waste feedstuff and compost char with different pyrolysis retention times and temperatures: (a) 300 °C; (b) 400 °C; and (c) 500 °C.
Energies 12 04538 g005aEnergies 12 04538 g005b
Figure 6. Caloric value according to the pyrolysis conditions.
Energies 12 04538 g006
Table 1. Slagging and fouling indices.
IndexFormulaSlagging and Fouling PotentialRef.
LowMedHighSevere
Silica ratio SR = 100 ( SiO 2 SiO 2 + Fe 2 O 3 + CaO + MgO ) 72–8065–7250–65-[16]
B/A ratio 1 B A = K 2 O + Na 2 O + Fe 2 O 3 + CaO + MgO   SiO 2 + TiO 2 + Al 2 O 3 <0.110.11–0.14 0.14-
Sulfur content Index = ( B A ) ×   S <0.60.6–2.02.0–2.6>2.6
Fu 2 F u = ( B A ) × ( K 2 O + Na 2 O ) ≤0.60.6–1.61.6–40>40[17]
AFI 3 (°C) AFI =   4 I D T + H T 5 >13431232–13431149–1232<1149[18,19]
1 B/A ratio—Base/Acid oxides ratio; 2 Fu—Fouling index relevance with alkaline content; 3 AFI—ash fusibility index.
Table 2. Elemental composition of food waste compost and feedstuff.
ParameterFeedstuff
(wt.%)
Compost
(wt%)
Carbon45.2641.57
Hydrogen6.395.94
Nitrogen3.53.03
Sulfur 1--
Oxygen32.3535.54
Moisture6.1710.77
Volatile72.3268.96
Ash10.4510.4
Fixed carbon11.079.88
HHV 2 (kcal/kg)4520.194187.37
1 Missing values indicate “not detected” (<0.05 wt.%). 2 HHV—higher heating value.
Table 3. Proximate and ultimate analysis results for different pyrolysis conditions.
SampleProximate Analysis (wt. %)Ultimate Analysis (wt. %)
MoistureVolatileAshFixed CarbonCHSNO
Food waste fodder
300 °C15 m2.0575.610.5111.8445.056.28-4.1631.73
30 m2.272.6711.5513.5849.536.43-4.5429.09
45 m0.4170.4113.2215.9655.56.65-4.8823.13
60 m0.664.5815.6119.2157.866.35-5.3317.77
400 °C15 m0.6172.712.5914.151.426.78-4.225
30 m0.3762.8616.7320.0454.085.75-4.9815.15
45 m0.7953.6320.1825.461.165.88-5.1111.14
60 m2.7650.7920.8325.6261.355.87-5.4912.05
500 °C15 m0.6957.9218.0523.3458.195.73-5.316.33
30 m1.7852.1121.7824.3252.565.34-3.9824.45
45 m0.6424.9833.3141.0652.672.37-4.8320.73
60 m0.6924.633.5741.1437.211.37-2.8911.45
Food waste compost
300 °C15 m28.5857.067.686.6835.795.48-2.5136.87
30 m16.6965.6298.6940.835.82-2.8232.74
45 m7.3872.0510.3610.2146.066.42-3.2234.26
60 m3.2674.4111.331148.266.35-3.7331.8
400 °C15 m19.8163.388.768.0440.635.97-3.1134.6
30 m6.597111.9610.4646.396.19-3.4629.87
45 m1.2666.6616.215.8853.635.89-4.0923.87
60 m3.2758.8918.9518.8954.125.69-3.8217.25
500 °C15 m17.463.1610.259.1940.925.82-3.3133.4
30 m1.1764.5617.4716.7950.665.4-3.5221.14
45 m0.6445.5527.3426.4752.144.36-3.3914.55
60 m0.940.4428.2230.4451.743.91-3.3212.99
Undetected (<0.05 wt %)
1 Missing values indicate “not detected” (<0.05 wt.%).
Table 4. Slagging and Fouling index of food waste compost and feedstuff biochar with different pyrolysis conditions.
SampleSilica RatioB/A RatioSulphur ContentFuAsh Fusibility Index (AFI)
Food waste compost300 °C6.90
(High)
11.61
(High)
0.58
(Low)
92.76
(Severe)
>1500 °C
(Low)
400 °C6.82
(High)
11.54
(High)
0.58
(Low)
46.39
(Severe)
>1500 °C
(Low)
500 °C7.13
(High)
11.87
(High)
0.59
(Low)
106.00
(Severe)
>1500 °C
(Low)
Food waste feedstuff300 °C5.38
(High)
16.85
(High)
0.84
(Medium)
185.35
(Severe)
>1500 °C
(Low)
400 °C6.33
(High)
14.89
(High)
0.74
(Medium)
170.49
(Severe)
>1500 °C
(Low)
500 °C6.96
(High)
13.02
(High)
0.65
(Medium)
140.10
(Severe)
>1500 °C
(Low)
Table 5. XRF analysis result of char with different pyrolysis temperatures.
Food Waste CompostFood Waste Feedstuff
300 °C400 °C500 °C300 °C400 °C500 °C
CaO59.6761.7259.160.2156.9255.32
P2O513.0714.1511.4112.6214.416.69
Na2O5.421.914.636.596.916.08
Cl4.035.15.736.227.066.79
SiO24.915.015.013.594.064.37
Fe2O34.564.634.830.790.740.74
K2O2.572.114.34.414.544.68
MgO1.982.091.352.162.372.34
SO31.891.752.082.231.891.65
Al2O31.391.221.160.730.670.85
SrO0.110.10.110.110.10.1
BaO---0.130.140.17
ZnO0.1-----
MnO-0.090.11---
TiO20.090.060.080.080.070.09

