Article

Stationary Energy Storage System for Fast EV Charging Stations: Simultaneous Sizing of Battery and Converter

1
Department of Electrical Engineering, Incheon National University, 12-1 Songdo-dong, Yeonsu-gu, Incheon 406840, Korea
2
Research Institute for Northeast Asian Super Grid, Incheon National University, 119 Academy-ro, Yeonsu-gu, Incheon 22012, Korea
3
Division of Smart Grid, Korea Electrotechnology Research Institute, Changwon 51543, Korea
*
Author to whom correspondence should be addressed.
Energies 2019, 12(23), 4516; https://doi.org/10.3390/en12234516
Submission received: 22 October 2019 / Revised: 18 November 2019 / Accepted: 25 November 2019 / Published: 27 November 2019
(This article belongs to the Special Issue Impact of Electric Vehicles on the Power System)

Abstract

:
Optimal sizing of stationary energy storage systems (ESS) is required to reduce the peak load and increase the profit of fast charging stations. Sequential sizing of battery and converter or fixed-size converters are considered in most of the existing studies. However, sequential sizing or fixed-converter sizes may result in under or oversizing of ESS and thus fail to achieve the set targets, such as peak shaving and cost reduction. In order to address these issues, simultaneous sizing of battery and converter is proposed in this study. The proposed method has the ability to avoid the under or oversizing of ESS by considering the converter capacity and battery size as two independence decision variables. A mathematical problem is formulated by considering the stochastic return time of electrical vehicles (EVs), worst-case state of charge at return time, number of registered EVs, charging level of EVs, and other related parameters. The annualized cost of ESS is computed by considering the lifetime of ESS equipment and annual interest rates. The performance of the proposed method is compared with the existing sizing methods for ESS in fast-charging stations. In addition, sensitivity analysis is carried out to analyze the impact of different parameters on the size of the battery and the converter. Simulation results have proved that the proposed method is outperforming the existing sizing methods in terms of the total annual cost of the charging station and the amount of power buying during peak load intervals.

1. Introduction

Transportation electrification has the potential to reduce air pollution and the emission of greenhouse gasses by reducing the usage of oil from the transportation sector. Recently, due to the continuous reduction in the cost of electric vehicles (EVs), the adaptation of EVs has increased across the globe [1]. The reduction in the cost of EVs is mainly due to the reduction in prices of battery packs. A technological roadmap has been issued by the U.S. Department of Energy (DOE) for 2025, where EVs will be competing with fossil-fuel-based vehicles [2]. However, several technical challenges need to be addressed to enhance the penetration of EVs and assure their competitiveness with conventional vehicles. Among these issues, range anxiety has been a major challenge for EV manufacturers and researchers. Broadly, there are two possible solutions for the range anxiety issue, which includes increasing the size of the EV battery and enhancing the charging infrastructure to easily recharge the EVs. Here, enhancing charging infrastructure implies enhancing the EV charging rates, i.e., fast charging. The former solution is not preferred mainly due to the increase in cost, size, and weight of the EV with increased battery capacity [3]. The latter is considered more economical and beneficial due to the ability of EV owners to recharge their vehicles in short times similar to the refueling of conventional vehicles [4].
Fast and ultra-fast charging infrastructures can solve the range anxiety issue by charging the EVs at higher currents and voltages. However, it may cause power demand peaks if several EVs start charging simultaneously with higher powers. Especially if the EV demand and system peak demand coincide, which may result in system instability or even power outages [5]. It has been demonstrated in [6] that uncontrolled EV charging may result in up to 1.5 times the peak load in residential areas. This may result in the overloading of distribution feeders and transformers and ultimately outage of the power system. In order to solve this issue, stationary energy storage systems (ESS) coupled with fast charging stations have emerged as a solution in the literature. ESS can reduce the operation cost of the charging infrastructure by feeding EVs during system peak load intervals. In addition, the ESS can also save the system (transformer and feeder) up-gradation cost by buying power from the grid during off-peak intervals [7,8]. Finally, ESS can also enhance the resilience of the EVs by providing them with the required energy for traveling to healthy charging stations during system contingencies. Several studies have been conducted on analyzing the benefits of coupling stationary ESS with fast charging EV stations [7,9,10]. In order to achieve the aforementioned benefits from the ESS, optimal sizing of ESS is required, considering the local load profiles, energy tariffs, and expected penetration level of EVs.
Several studies are available in the literature on optimal sizing of ESS for fast charging stations with different objectives. Rule-based methods for optimal sizing of ESS in fast charging stations have been proposed in [11,12]. In [11], the objective of the optimization is to minimize the waiting time of the users and determine the size of the ESS to assure an acceptable waiting time. Charging time is modeled as a stochastic event in [12], and the number of charging slots is determined in the first stage. In the second stage, the information of the number of charging stations determined in the first stage is utilized to determine the optimal size of ESS for fast charging stations. Rule-based approaches are vulnerable to the experience of the field experts and may not necessarily result in an optimal solution. In addition, with an increase in system complexity, it is difficult to realize all possible scenarios and design rules against all these different cases. In order to address these limitations, recently, model-based approaches for determining the optimal size of ESS for fast charging stations have been proposed by several researchers.
Mathematical models have been developed for optimal sizing of ESSs in fast-charging stations considering the stochastic nature of EV loads in [13,14,15]. A mathematical model for determining the charging topology and integration point of ESS has been developed in [13]. In addition, a model for determining the optimal size of ESS has also been developed for fast charging stations. The size of an ESS unit for a fast charging station in Stockholm has been determined in [14] using mixed-integer linear programming. The objective of [14] is to minimize the annualized cost for deploying ESS. The minimization of ESS investment cost and operation cost of buying power from the grid have been considered in [15] for determining the optimal size of ESS for a fast-charging EV station. In addition, the power flow between different components of the charging station has also been analyzed for a selected day in [15]. However, these studies still have shortcomings in terms of the sizing of different components of the charging station, which are analyzed in the following paragraph.
In these studies, either fixed converter ratings (pre-determined values) are utilized [14] or only the size of the battery is optimized, and it is assumed that the same rating converter will be deployed [13,15]. However, determining the capacity of the converter separately may result in sub-optimal results due to the sequential optimization of the converter and battery. Similarly, it is not necessarily optimal to deploy the same size converter with that of battery ratings. Determining converter size separately either results in increased investment cost due to oversizing or increased operation (buying power from the grid) cost due to under-sizing. Similarly, deployment of the same rating converter may result in increased investment cost and ultimately decrease the profit to the charging station owners. Especially for fast charging stations, where batteries are usually charged and discharged once a day (charging during off-peak price intervals and discharging during peak price intervals). Therefore, an attempt has been made in this study to size the battery and converter simultaneously to minimize the cost of the fast charging station while shaving peak loads. The major contributions of this study in comparison to existing studies are as follows.
  • In contrast to the existing studies, where sequential sizing of the battery and converter is considered, simultaneous sizing of the battery and converter is proposed in this study for deploying ESS in fast charging stations. The proposed method has the potential to avoid the under and oversizing of converters by sizing them together with batteries.
  • The performance of the proposed method has been compared with the commonly utilized sizing methods, which are available in the literature. The total yearly cost of the charging station, the investment cost of ESS, the amount of power bought during system peak intervals, and the cost of buying power from the grid have been compared. The proposed method has outperformed the existing methods in terms of reducing the total yearly cost of the charging station.
  • In order to evaluate the impact of several system parameters on the size of battery and converter, sensitivity analysis is carried out. The impact of the number of EVs registered with the charging station, uncertainty in return time of EVs to the charging station, percentage of useable energy range of ESS, and ratio of commercial to private vehicles in the fleet are analyzed.
The remainder of the paper is organized as follows. In Section 2, the configuration of the network and the proposed sizing method are explained. In Section 3, the mathematical model for the simultaneous sizing of the battery and converter is presented. In Section 4, the performance of the proposed method is compared with existing sizing methods via simulations. In Section 5, sensitivity analysis of different parameters that could impact the size of the battery and the converter is carried out. Finally, the conclusions and future research directions are presented in Section 6.

2. Network Configuration and Proposed Sizing Method

2.1. Network Configuration

The configuration of the fast EV charging station coupled with stationary ESS proposed in this study is shown in Figure 1. The network configuration assures the power balance in the network by using power flow among different components of the network, as shown in Figure 1. The objective of the power flow is to fulfill the load of the EVs in each interval while fulfilling the constrained related to the individual components and the entire network. The component-wise flow of power and its utilization is as follows.

2.1.1. EV Load

Fulfillment of EV load ( p E V ) at each interval by using the available components is the major objective of the network configuration. It can be observed from Figure 1 that the EV load can be fulfilled by buying power ( p B u y ) from the utility grid or by discharging the ESS ( p B D ) or using both. The decision of choosing any one of the sources or both depends on the network constraints, i.e., system peak load intervals and price signals of the network. Similarly, it also depends on the constraints of the individual components, i.e., charging/discharging rate of ESS, the capacity of distribution lines, and state-of-charge (SOC) of ESS.

2.1.2. Energy Storage System (ESS)

The power flow of ESS is two ways, i.e., charging and discharging. ESS can be discharged to fulfill the power demand of EVs or it can be utilized to sell power ( p S e l l ) back to the utility grid during system peak load intervals. However, ESS can be charged ( p B C ) only by buying power from the utility grid, as shown in Figure 1.

2.1.3. Utility Grid

Similar to ESS, the power flow of the utility grid is also bi-directional. Power can be bought from the utility grid to fulfill the power demand of EVs or can be utilized to charge the ESS or both. Similarly, ESS can be discharged to sell power back to the utility grid. The decision between buying power and selling power depends on several constraints related to the whole network and the individual components of the network.

2.1.4. Power Conversion System (PCS)

Power bought from the utility grid or power sold to the utility grid via ESS is converted using the PCS, as shown in Figure 1. Similarly, power bought from the utility grid by EVs is converted by using the AC/DC converter, as shown in Figure 1.

2.2. Proposed Sizing Method

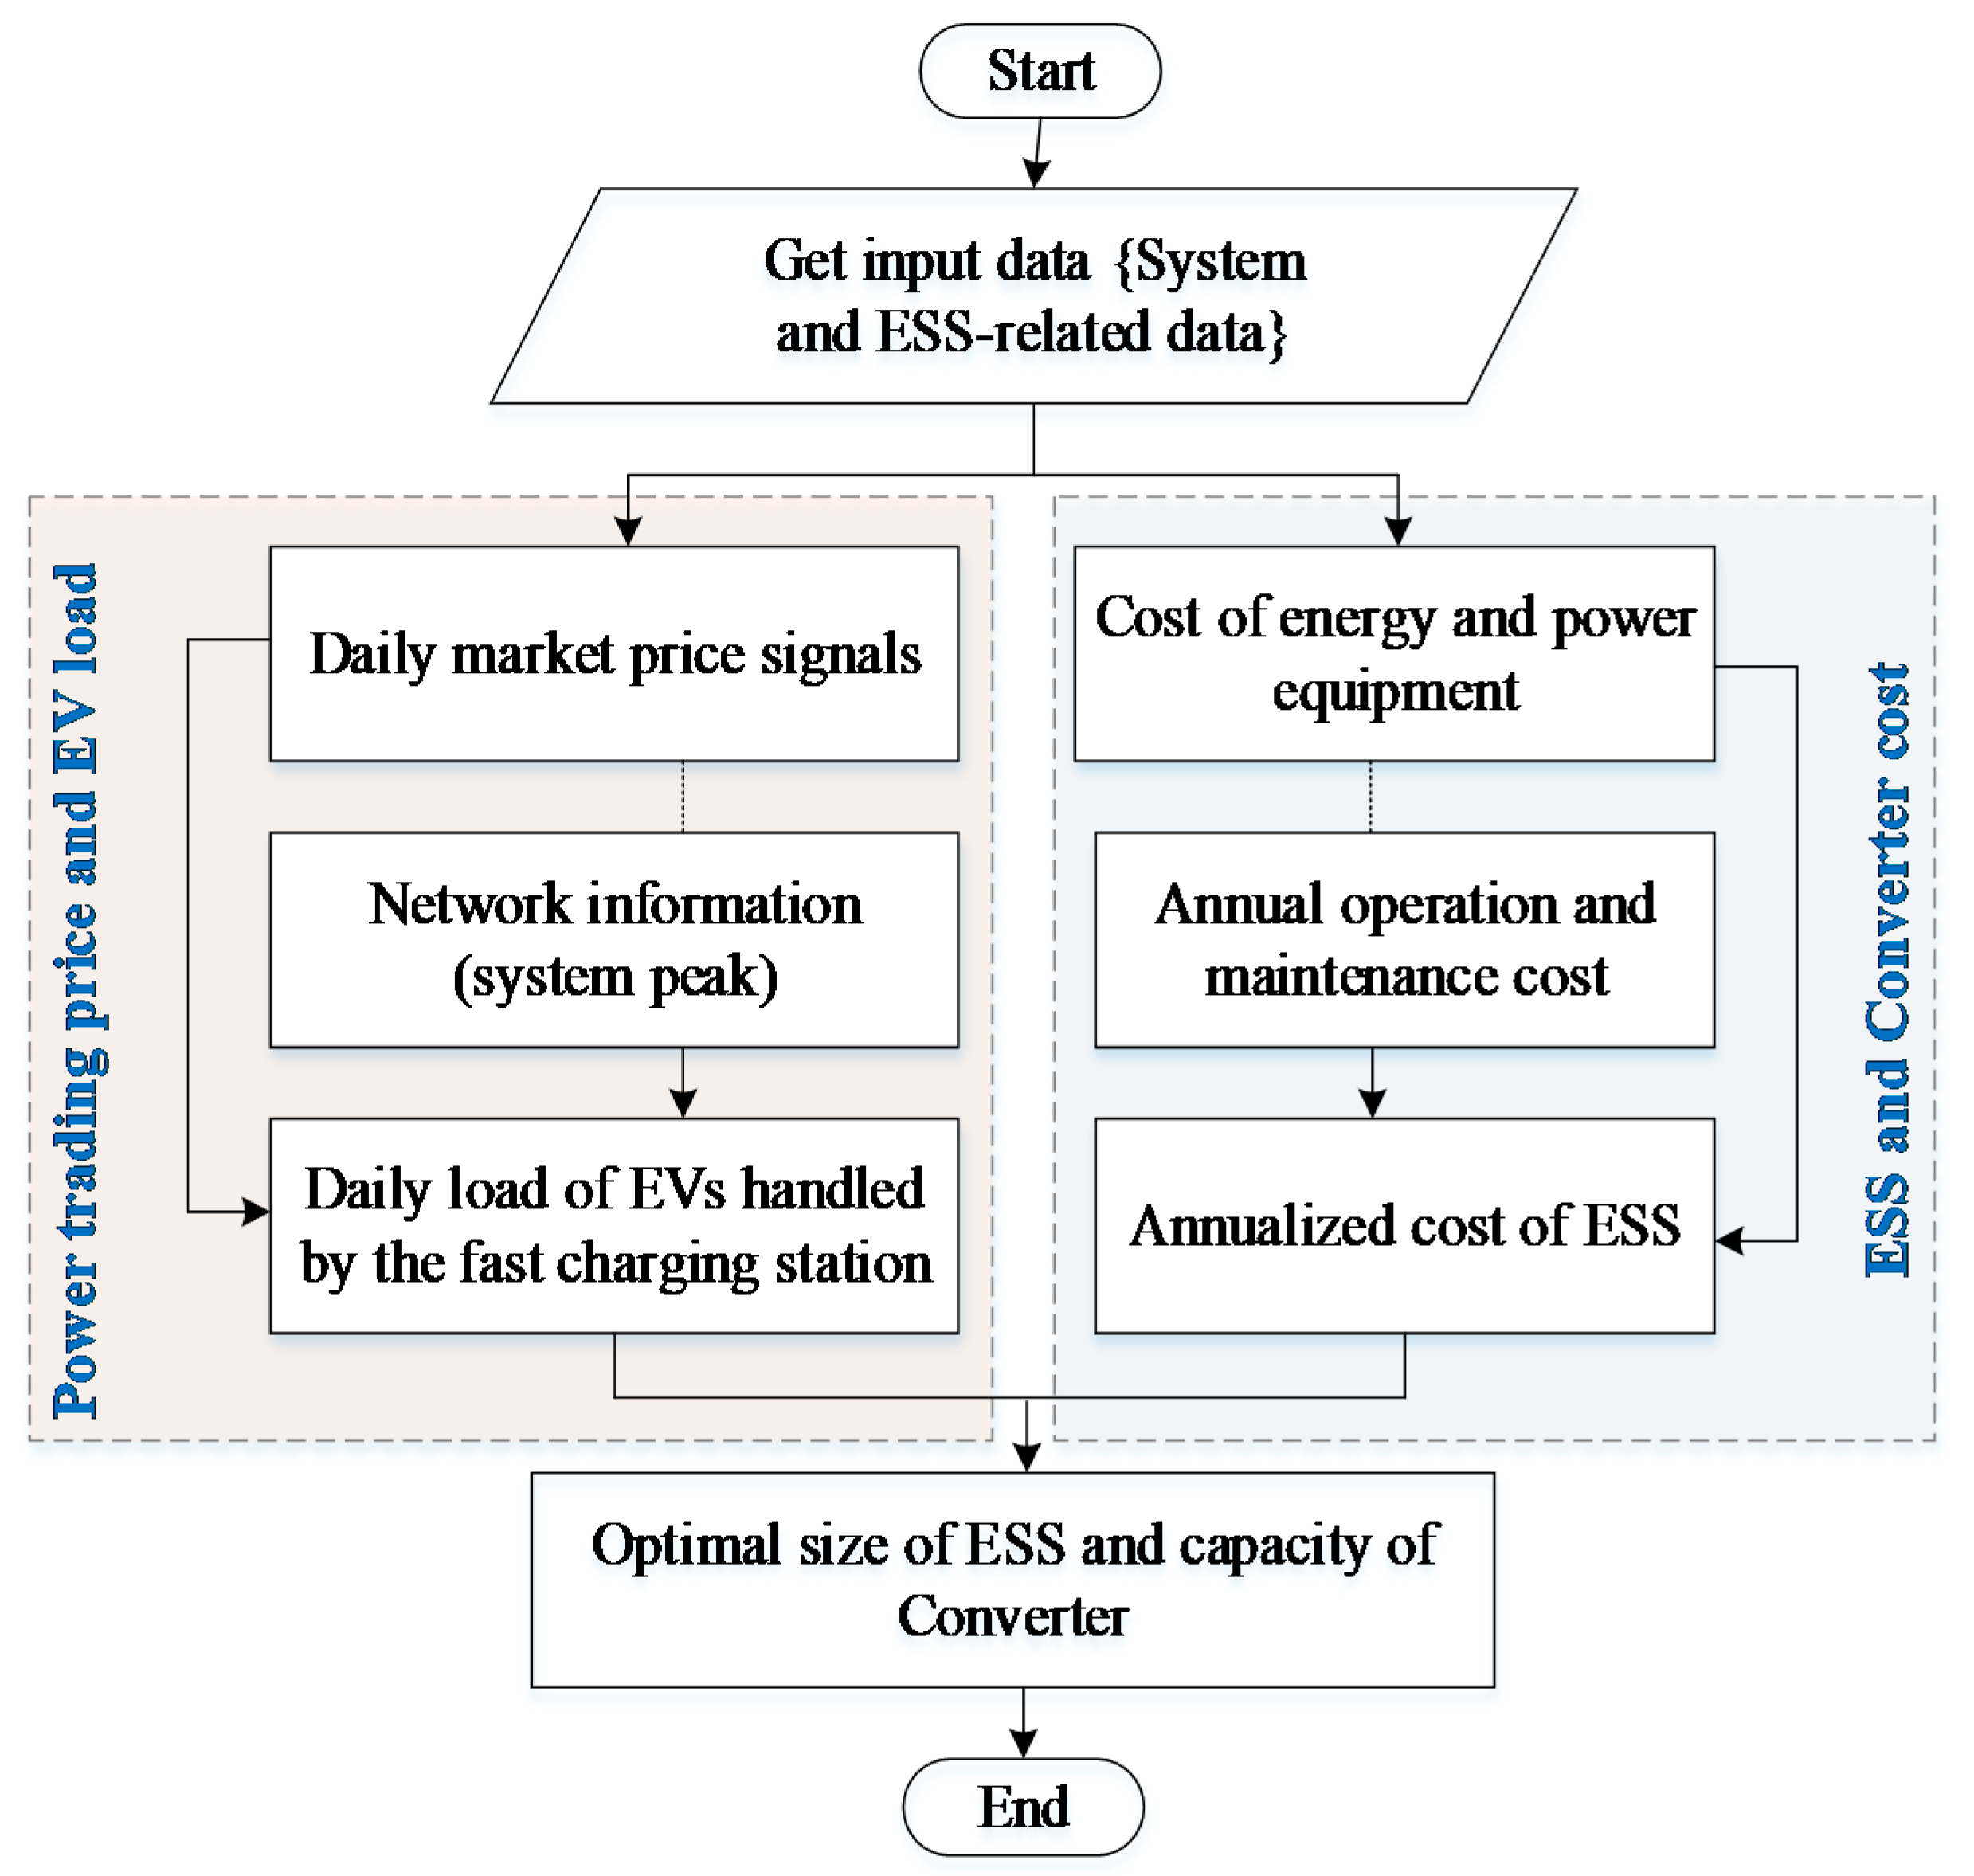
The flowchart of the proposed method for simultaneous sizing of the battery and converter is shown in Figure 2. Initially, data related to the system such as market price signals, system peak load intervals, the number of EVs registered in the charging station, etc. are gathered. Similarly, data related to the ESS such as per-unit cost of the battery, per unit cost of PCS, per unit cost of balance of the plant, annual operation and maintenance cost, etc. are gathered. After receiving the input information, the stochastic load of individual EVs is estimated, which is then utilized to estimate the load of all EVs for each interval of the day.
In order to determine the interval-wise load of EVs, the return time of the EVs to the charging station is estimated by using the history data and usage purpose of the vehicle, i.e., commuting or business purpose. Similarly, the residual SOC of each EV at the return time can be estimated using the mileage profile of each EV. This study is focused on planning optimization; therefore, it is assumed that EVs return with minimum SOC at the return time. This assumption will help to cope with the worst-case scenario in the operation phase.
The cost of the network for optimal sizing of battery and converter is decomposed into three types, i.e., cost of trading power with the grid, penalty cost for buying power during peak intervals, and cost of ESS (battery, converter, and other devices). The annual power trading cost is determined by considering the hourly market price signals and the amount of power traded by the charging station with the grid. Similarly, the penalty cost is determined by considering daily peak load intervals for an entire year. Finally, the cost of ESS is determined by annualizing the total investment and operation cost of the ESS. The annual interest rates and lifetime of different components are utilized to determine the annualized cost of the ESS.
The optimization algorithm determines the optimal size of the battery and the converter considering the three types of costs mentioned above. The objective of the optimization is to minimize the total cost of the charging station by suggesting an optimally sized battery along with an optimally sized converter. Simultaneous optimization of battery and converter ratings can reduce the cost of the network, which will be analyzed in the simulations section. The detailed mathematical formulation of all the three costs is presented in the following section.

3. Mathematical Modeling

3.1. Modeling of Charging Station Load

In order to determine the interval-wise load of the fast-charging station, the load of individual EVs is determined first. Then, the load of individual EVs is accumulated to estimate the load of the entire charging station. The probability of returning an EV to the charging station at time t is taken as a random variable ( f ( t ) ). Similar to [16,17], it is assumed that this random variable follows a normal distribution function as given by Equation (1). The power demand of an EV at time t can be computed by using Equation (2), where Δ t represents time interval in hours. In Equation (2), P V represents the charging level of EV in kW. Similarly, f ( t ) represents the probability of the return of an EV at time   t   to the charging station. Finally, S ( t ) represents the probability of requiring a recharge by an EV on a particular day at its arrival interval t. As noted in [18], private vehicles only need to be recharged once in 2 days while commercial EVs need to be recharged on all working days. The same results have been obtained in this study by analyzing the daily commuting miles of vehicles [18] according to their usage purpose in Korea. Therefore, Equation (3) implies that commercial EVs need to be charged on all the working days. Equation (4) represents that private EVs need to be charged on alternated days. Equation (5) can be utilized to compute the load of the charging station at each time interval by summing loads of individual EVs registered with that particular charging station.
It can be observed from Figure 3 that the system peak load and the second peak of vehicles commuting are during the same intervals. The second commuting peak implies the returning of vehicles from work to their homes. EVs will start charging after returning to their respective homes, which may result in an increase in the peak load of the system, if not managed. Therefore, the utilization of ESS is inevitable to shave the additional load introduced due to the charging of EVs in their residential areas. The detailed mathematical model for optimal sizing of ESS and converter is discussed in the following paragraph.
f ( t ) = 1 σ 2 π e z ,   z = ( t μ ) 2 2 σ 2
p t , v E V = Δ t . P V . f ( t ) . S ( t )
S ( t ) = {   1           i f   d W o r k i n g   d a y 0                                                                       e l s e   For   commercial   EVs
S ( t ) = 0.5             F o r   P r i v a t e   v e h i c l e s
p t E V = v V p t , v E V

3.2. Modeling for Simultaneous Sizing of ESS and Converter

In order to determine the optimal size of the battery and the attached converter, the annualized cost of ESS, the cost for trading power with the grid, and the penalty cost for buying power during peak intervals are considered. The optimization problem along with the corresponding objective function and constraints is described below.

3.2.1. Objective Function

The objective of this problem formulation is to minimize the annualized cost of the operator by making a tradeoff between the cost of deploying ESS and the cost of buying power during peak hours. The objective function is composed of three parts, i.e., yearly cost for trading power with the grid ( C G r i d ), yearly penalty cost for buying power during peak intervals ( C P e a k ), and annualized ESS cost ( C E S S ), as shown in Equation (6). The annual trading price is obtained by summing the amount of power bought from the grid ( p d , t B u y ) and amount of power sold to the grid ( p d , t S e l l ) for 1 year. Daily time-of-use (TOU) price signals ( P R d , t B u y   and   P R d , t S e l l ) are used for T intervals and D days, as given by Equation (7). Similarly, the yearly penalty cost is computed by summing the daily penalty cost for buying power during peak price intervals, as given by (8). In Equation (8), t p b   and   t p e , respectively represent the beginning and end of system peak intervals for day d. In Equation (8), C d , t P e n represents the penalty cost for buying 1 kW of power from the grid during system peak hours. Due to this additional penalty cost, the optimization algorithm will size the battery and converter to minimize the buying power from the grid during peak hours.
The cost of ESS can be divided into the cost of PCS ( C P C S ), cost of battery ( P c a p B a t ), the cost for balance of plant ( C B O P ), and operation and maintenance cost ( C O & M ). The lifetime of different components in the ESS (battery and PCS) are different; therefore, it is necessary to convert them into a similar scale [19]. Annualized cost is generally used in such cases, where the total cost is converted to annual cost by considering the interest rates and lifetime of equipment [20,21]. Therefore, in this study, the annualized cost of different components of the ESS is also considered. In order to compare the performance of the proposed simultaneous sizing of the battery and converter with existing sizing methods, the objective function ( C E S S part) is divided into three lines. The first line of (9) shows the ESS cost computation method for the proposed method. It can be observed that the capacity of the converter ( P c a p C o n v ) and size of battery ( P c a p B a t ) are considered as two independent decision variables in this case. The second line shows the ESS cost computation method used by [15] and is named the battery following method. It can be observed that in this case, only the battery size is considered as a decision variable and the size of the converter follows the size of the battery. The third line shows the ESS cost computation method used by [14] and is named as the fixed capacity method. In this case, the size of the converter is already known and the cost associated with the converter is a fixed value. This fixed cost will be included in the total cost irrespective of the size of the battery (non-zero size). If the optimization algorithm opts to not deploy any battery, then the converter is not required. In order to realize this consideration, Equation (10) is formulated. In (10),   u t B a t indicates the presence or absence of a battery in the charging station. It implies that if a non-zero-sized battery is suggested by the optimization algorithm, converter cost will be included in the total cost, otherwise it will be set to zero. In the simulations section, the performance of all these methods is analyzed in terms of the total yearly cost and investment cost of ESS.
M i n   ( C   G r i d + C   P e a k + C   E S S )
C G r i d = d = 1 D t = 1 T ( P R d , t B u y . p d , t B u y P R d , t S e l l . p d , t S e l l )
C P e a k = d = 1 D t = t p b t = t p e C d , t P e n . p d , t B u y
C E S S = { γ C o n v . C P C S . P c a p C o n v + γ B a t . P c a p B a t . ( C B a t + C B O P ) + C O & M ;     P r o p o s e d γ B a t . P c a p B a t . ( C P C S + C B a t + C B O P ) + C O & M   ; B a t t e r y   f o l l o w i n g u t B a t . γ C o n v . C f i x P C S + γ B a t . P c a p B a t . ( C B a t + C B O P ) + C O & M ; F i x e d   c a p a c i t y
u t B a t = { 1                     i f   P c a p B a t > 0 0                                               e l s e

3.2.2. Power Balancing Constraints

Equation (11) shows the constraint for balancing the power in the charging station. It implies that the total energy inflow and outflow to/from the charging station should be balanced at each time interval t. It can be observed from (11) that the EV load can be fulfilled by either buying power from the grid or by discharging the battery or even both. This decision is based on the value of the objective function corresponding to that action. Similarly, the battery can be charged by buying power from the grid and can be discharged to sell power back to the grid. The decision between buying and selling is based on the TOU price signals, i.e., buying at low price intervals and selling at high price intervals.
p t B u y + p t B D = p t E V + p t S e l l + p t B C

3.2.3. ESS and Converter Constraints

The final output of the optimization problem is the optimal size of the battery ( P c a p B a t ) and the optimal rating of the converter ( P c a p C o n v ). The constraints related to the battery and the converter are discussed in this section. The SOC of the battery is limited to a certain range to enhance the lifetime of the battery, as given by (12). The maximum and minimum SOC bounds can be determined in terms of the battery capacity by using (13). The SOC at any time interval t can be updated by using the SOC of the previous interval and the amount of power charged/discharged at the current interval t, as given by (14). The maximum amount of power, which can be charged or discharged at any time t is given by Equations (15) and (16), respectively. Equations (17) and (18) imply the requirements for SOC at the beginning of the scheduling horizon and end of each day, respectively. Equation (20) shows the C-rates for charging and discharging of the battery, i.e., converter ratings. Equation (20) shows the range for charging/discharging efficiencies of battery and SOC operation ranges.
P m i n B a t p t S O C P m a x B a t ;   t
P m i n B a t = α . P c a p B a t ,   P m a x B a t = β . P c a p B a t
p S O C ( t ) = p t 1 S O C + p t B C . η C p t B D η D C R ;   t
0 p t B C ( P m a x B a t   p t 1 S O C η C ) ;   t
0 p t B D ( ( p t 1 S O C   P m i n B a t ) ) . η d ;   t
p t 1 S O C = P I N I T   i f   t = 1
p T S O C = P I N I T   i f   t = T
p t B C P c a p C o n v ; p t B D P c a p C o n v
0 η C , η D   1 ; 0 α , β 1 ;   t

4. Simulation Results

In order to analyze the performance of the proposed method for optimal sizing of the battery and converter in the fast EV charging station, numerical simulations are carried out in this section. The scheduling horizon of the test system is 1 year and each day is divided into 48 time intervals, i.e., 30-minute intervals. Simulations have been carried out in Java, NetBeans environment with integration of IBM ILOG CPLEX 12.3 (Gentilly, France) [22].

4.1. Input Data

This study is focused on determining the optimal size of ESS (battery and converter) for a residential apartment complex. Therefore, the daily mileage profile data of vehicles in Korea for the year 2018 [18] are utilized to estimate the arrival time of EVs in a residential apartment complex. The input data related to the total number of vehicles in the test system, ratio of private and commercial vehicles, maximum and minimum ranges for ESS SOC, initial SOC and efficiency of the battery, and other related parameters are shown in Table 1. In this section, these values are considered for comparing the performance of the proposed method with other existing methods. Sensitivity analysis of different parameters that could impact the size of the battery or converter is discussed in the next section.
Due to the widespread adaptation and benefits of lithium-ion (Li-ion) batteries [19,23], the sizing of Li-ion batteries-based ESS is considered in this study. However, the proposed method can be utilized for the sizing of other types of batteries, if the annualized cost data is available. The parameters related to the cost of ESS are also shown in Table 1. Per unit cost of battery and converter and annual operation and maintenance cost for the year 2018 are taken from [19]. Similarly, per unit cost for the balance of the plant for the year 2018 is taken from [24]. The annual interest rate of Korea is taken from [25], and the lifetime of ESS components is taken from [26]. These parameters are utilized to compute the annualized cost of the ESS. The market price signals are also taken as input data [27] and market price signals for a typical working day and a holiday are shown in Figure 4.

4.2. Performance Comparison

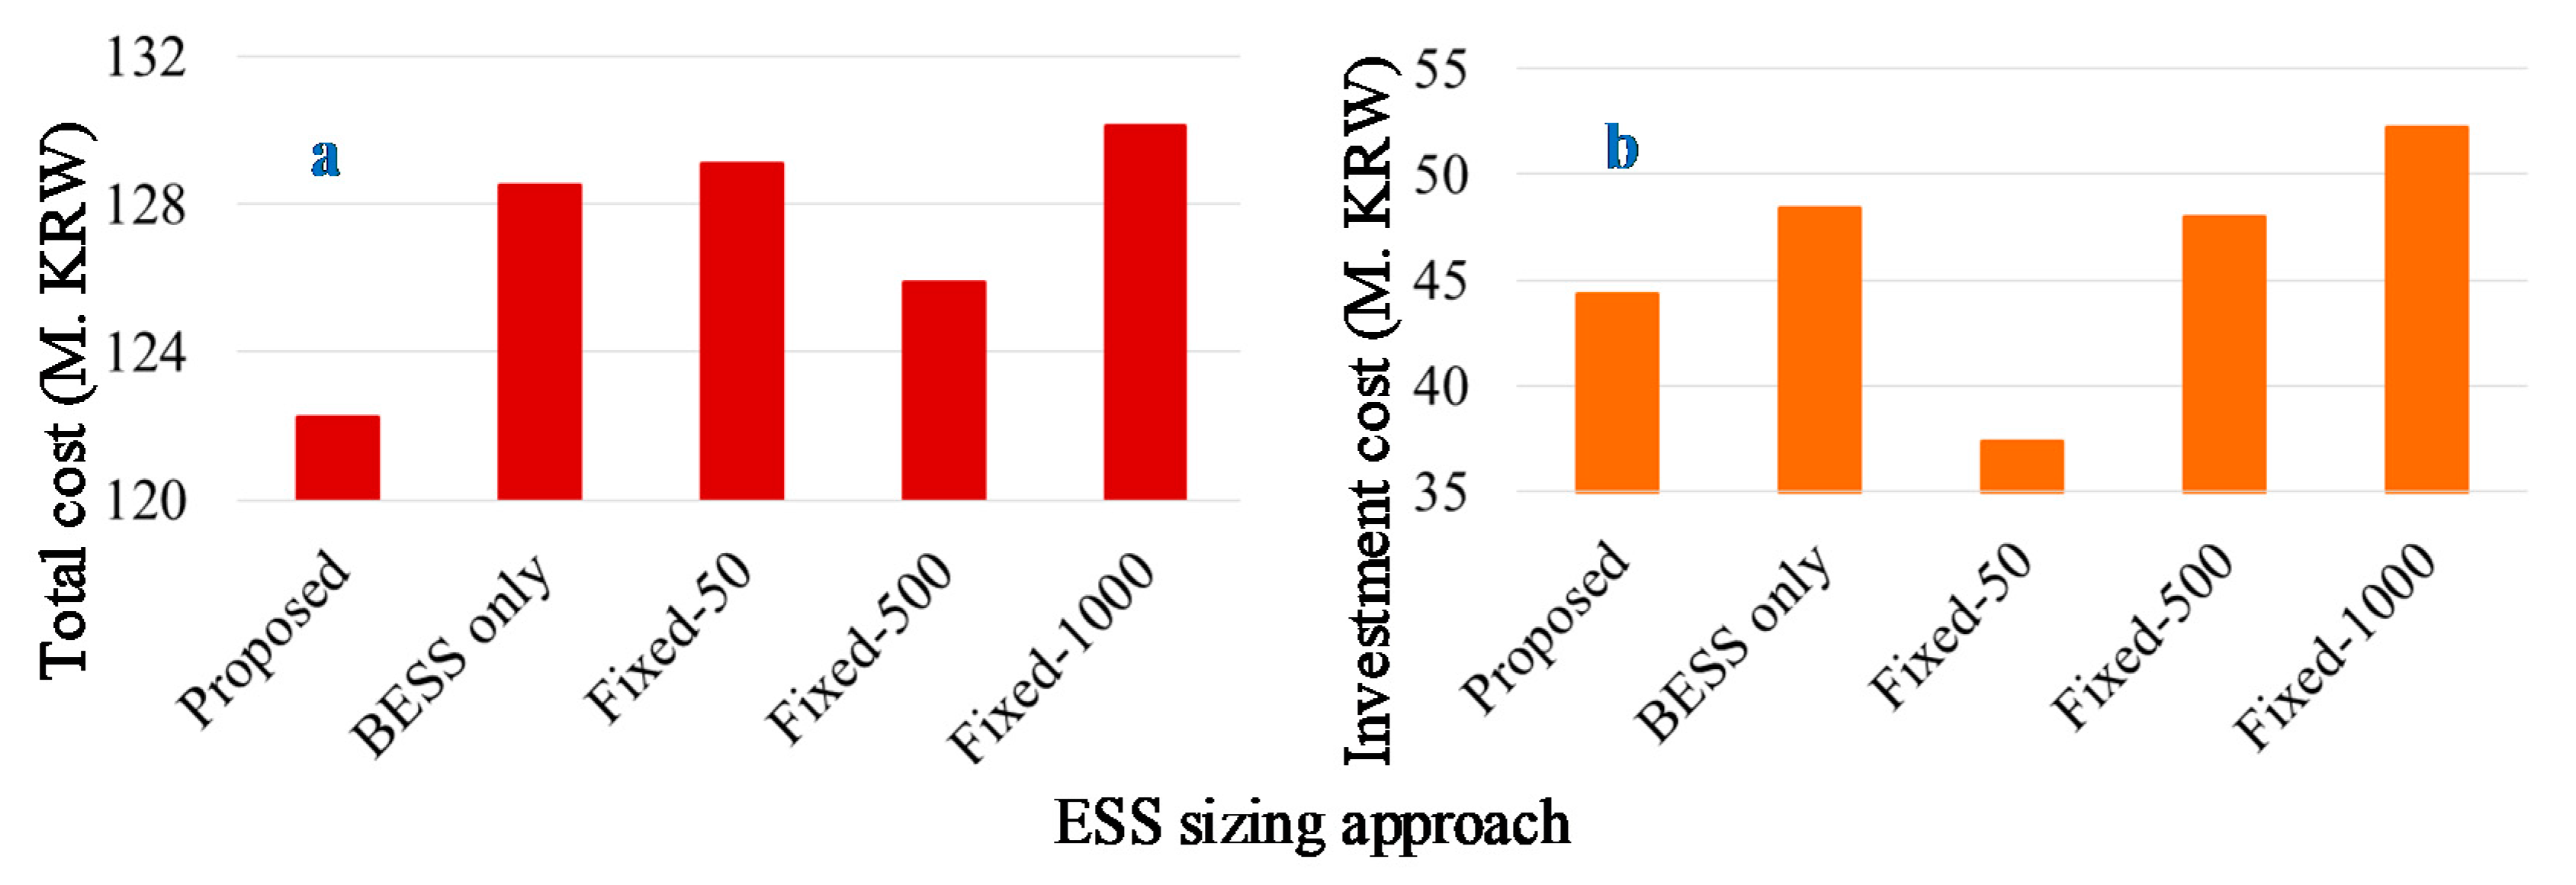
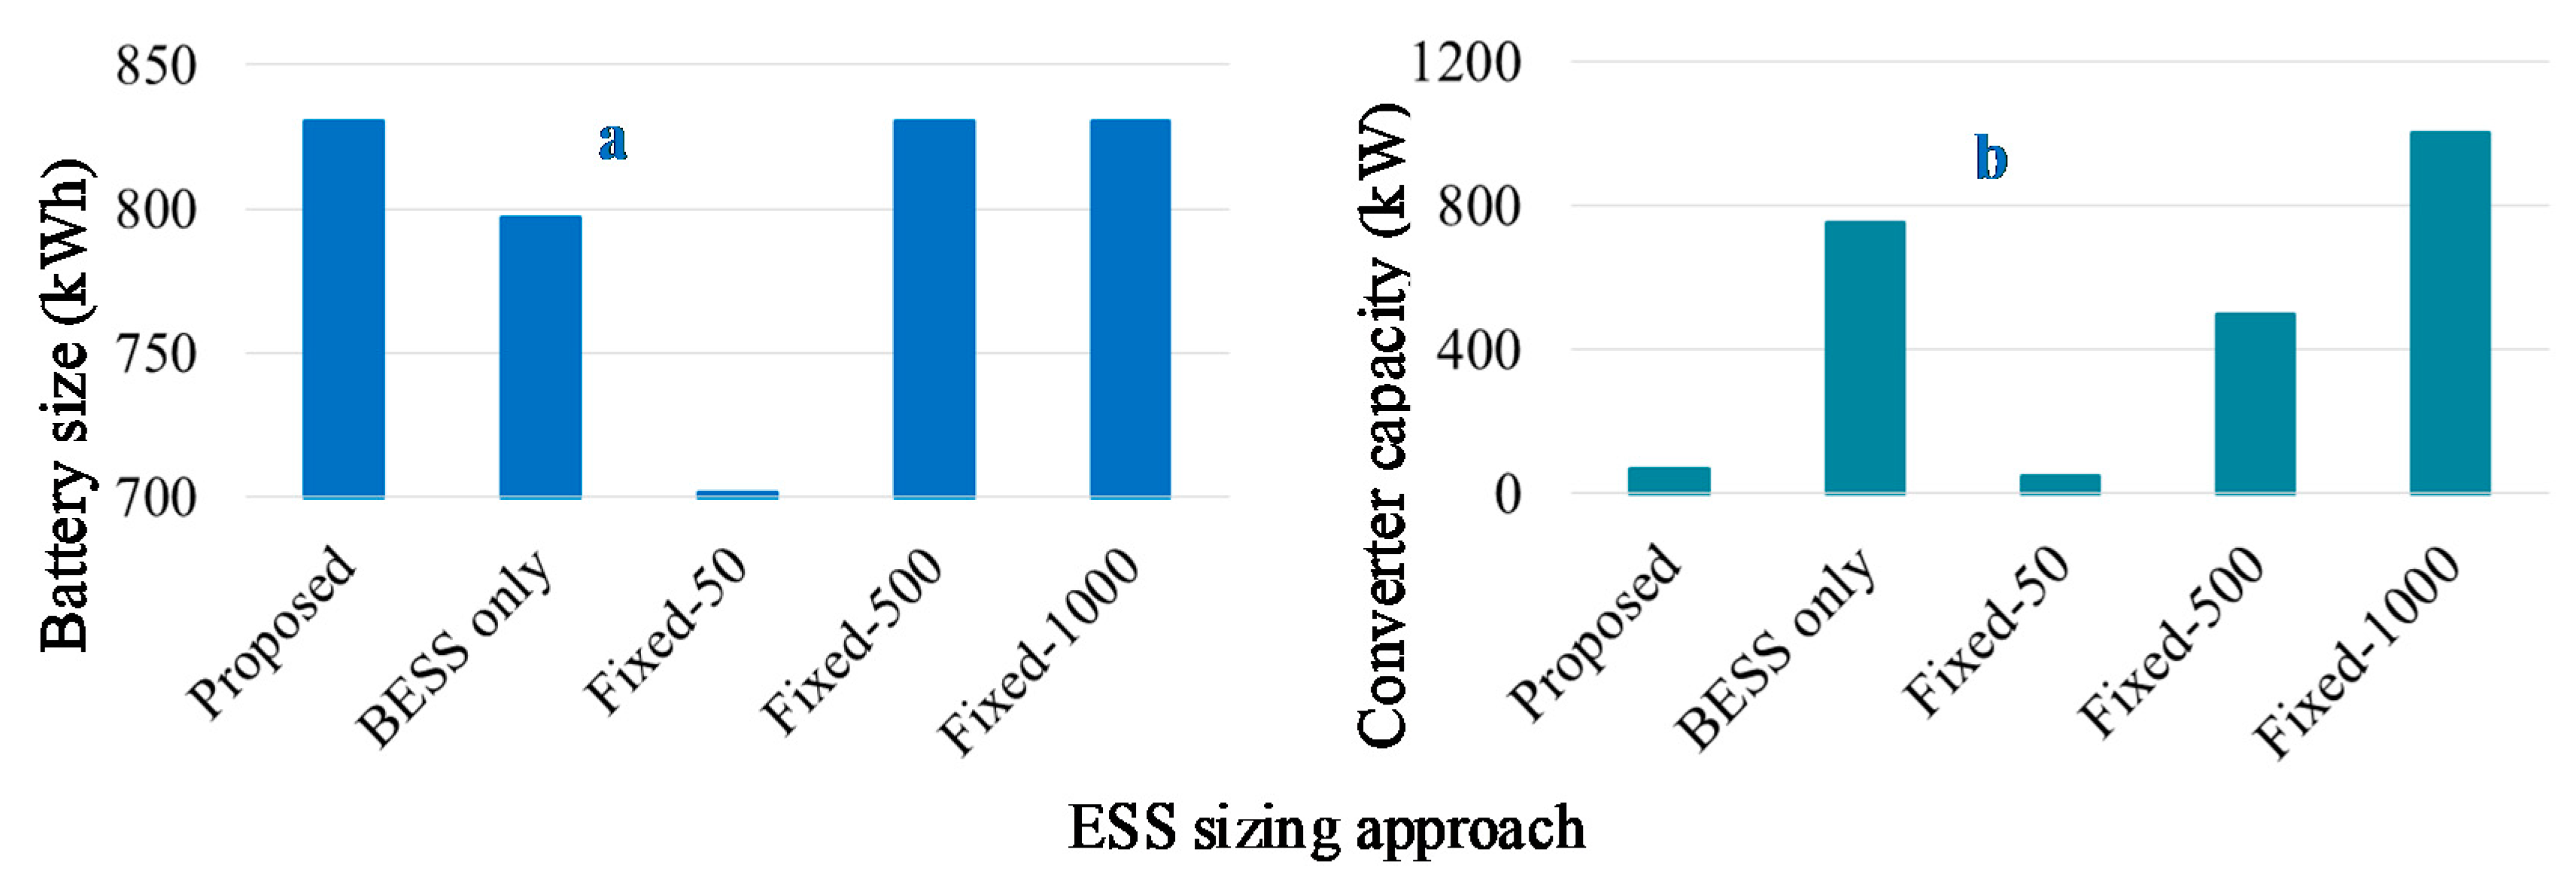
In this section, the performance of the proposed simultaneous sizing method is compared with two existing sizing approaches. The sizing approach utilized in [15] is named as a battery energy storage system (BESS) only approach, where the capacity of the converter is assumed to be the same as that of battery size. The approach utilized in [14] is named as the fixed converter capacity approach, where a predetermined converter capacity is considered. Considering the optimal value of converter capacity determined by the proposed approach, three cases are considered for the fixed converter capacity approach to cover all possible cases. In these cases, the converter size is defined as 50, 500, and 1000 kW, respectively. The optimal ratings of the battery and the converter determined by the proposed approach for the given system parameters (Figure 4 and Table 1) are 831 kWh and 68 kw, respectively. The total yearly cost of the fast EV charging station and the investment cost for deploying ESS for all the six cases are shown in Figure 5. In all the figures, M. KRW corresponds to Million Korean Won. Similarly, the optimal sizes of the battery and converter determined by each case are shown in Figure 6.
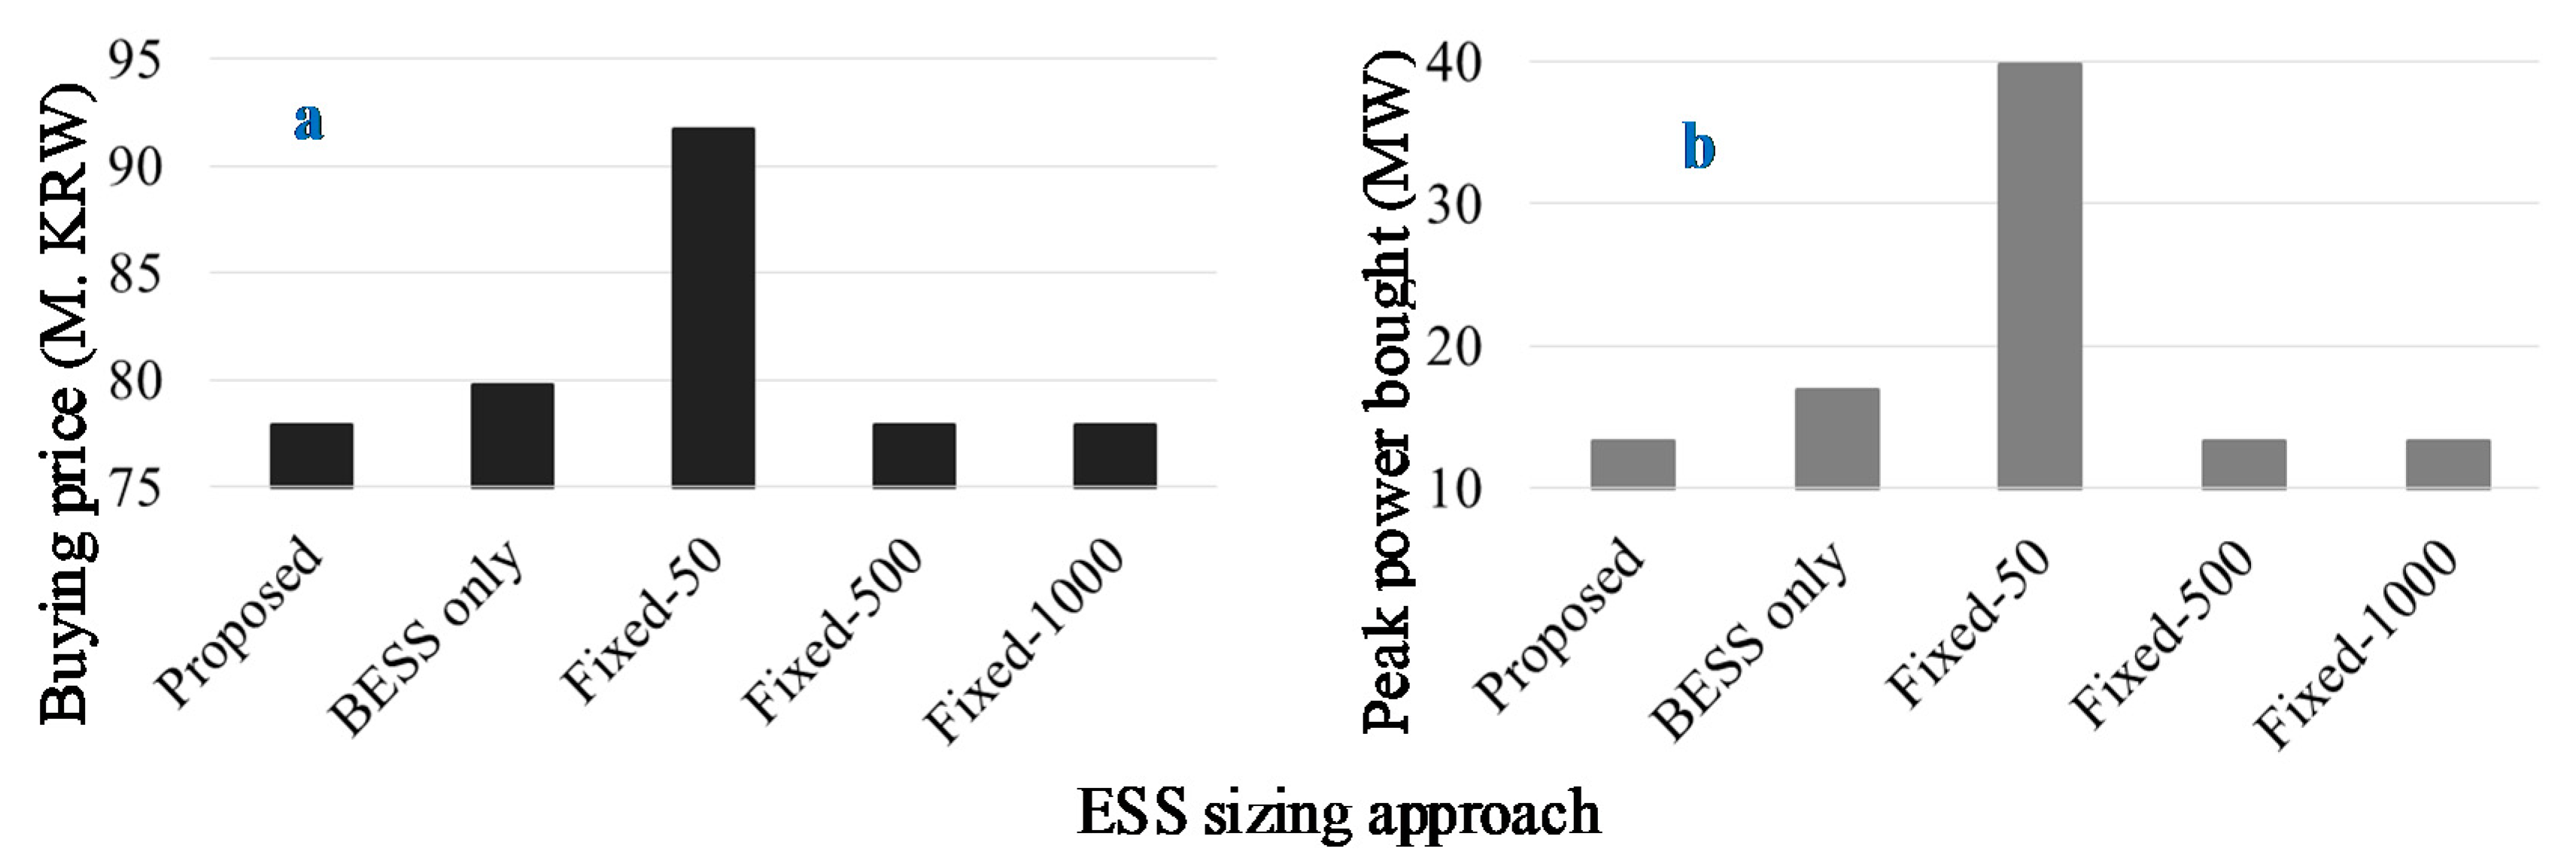
It can be observed from Figure 5a that in the BESS only case, small size battery is chosen due to an increase in the investment cost with an increase in battery size. It is also evident from Figure 5b that the investment cost of the BESS only case is higher than that of the proposed case, even though a smaller size battery is deployed. Due to the small size of the battery, more power is bought during peak intervals and correspondingly the buying cost is increased for the BESS only case, as shown in Figure 7. Due to the increase in the investment cost and buying price, the total yearly cost of the BESS only case is higher than that of the proposed method, as shown in Figure 5a. It implies that with the same system parameters, the proposed method performs better than that of the BESS only case.
In the case of fixed-50, the investment cost of the ESS is reduced as compared to the proposed method due to the smaller size converter. However, due to the small size converter, battery size is also reduced. It results in an increase in power buying during peak intervals, which contracts the goal for adding a battery in the fast charging station, i.e., peak shaving. Due to the higher buying price, the total yearly cost of the Fixed-50 case is much higher than that of the proposed method, Figure 5a. It implies that in the case of Fixed-50, the converter is under-sized. In all the remaining cases (Fixed 100, Fixed-500, Fixed 1000), the investment cost increases due to the increase in converter size. In all these three cases, the investment cost is higher than that of the proposed method even though the battery size is the same as the proposed method. Due to the same battery size, the amount of power bought during peak intervals and the buying price for all these three cases is the same as that of the proposed method. However, the total yearly cost in all these cases is higher than that of the proposed method. It implies that in all these three cases, the converter is over-sized.
Results comparison of the proposed and existing sizing approaches is presented in Table 2, where the results of the proposed methods are taken as reference. It can be concluded from this comparison that in the case of the BESS only method, the size of the battery is reduced due to the higher investment cost of the converter which increases buying power and the yearly cost of the charging station by about 5%. In the case of a fixed-size converter method, either the converter is oversized or undersized. In both of these cases, the total yearly cost of the charging station is increased by a maximum of about 6%. In the case of the undersized converter (Fixed 500 case), more power is bought during peak intervals to fulfill the demand of EVs. This results in failure to shave the peak load. Similarly, in the case of the over-sized converter (Fixed 500 and Fixed 1000 cases), the investment cost of the ESS increases while the power bought during peak intervals is the same as the proposed method. It can be concluded that the proposed method optimizes the total cost of the charging station by simultaneously optimizing the size of the battery and converter.

5. Discussion

The optimal size of the battery and converter determined in the previous section is subjected to various uncertainties and parameters of the system. In this section, the impact of these parameters on the size of the battery and converter is analyzed. The impact of these parameters on the investment cost of ESS, cost for buying power from the grid, and the total yearly cost of the charging station are analyzed. Especially, the impact of the number of EVs registered with the charging station, uncertainty in return time of EVs to the charging station, the useable energy range of ESS, and the ratio between commercial and private EVs in the fleet are analyzed.

5.1. Number of EVs

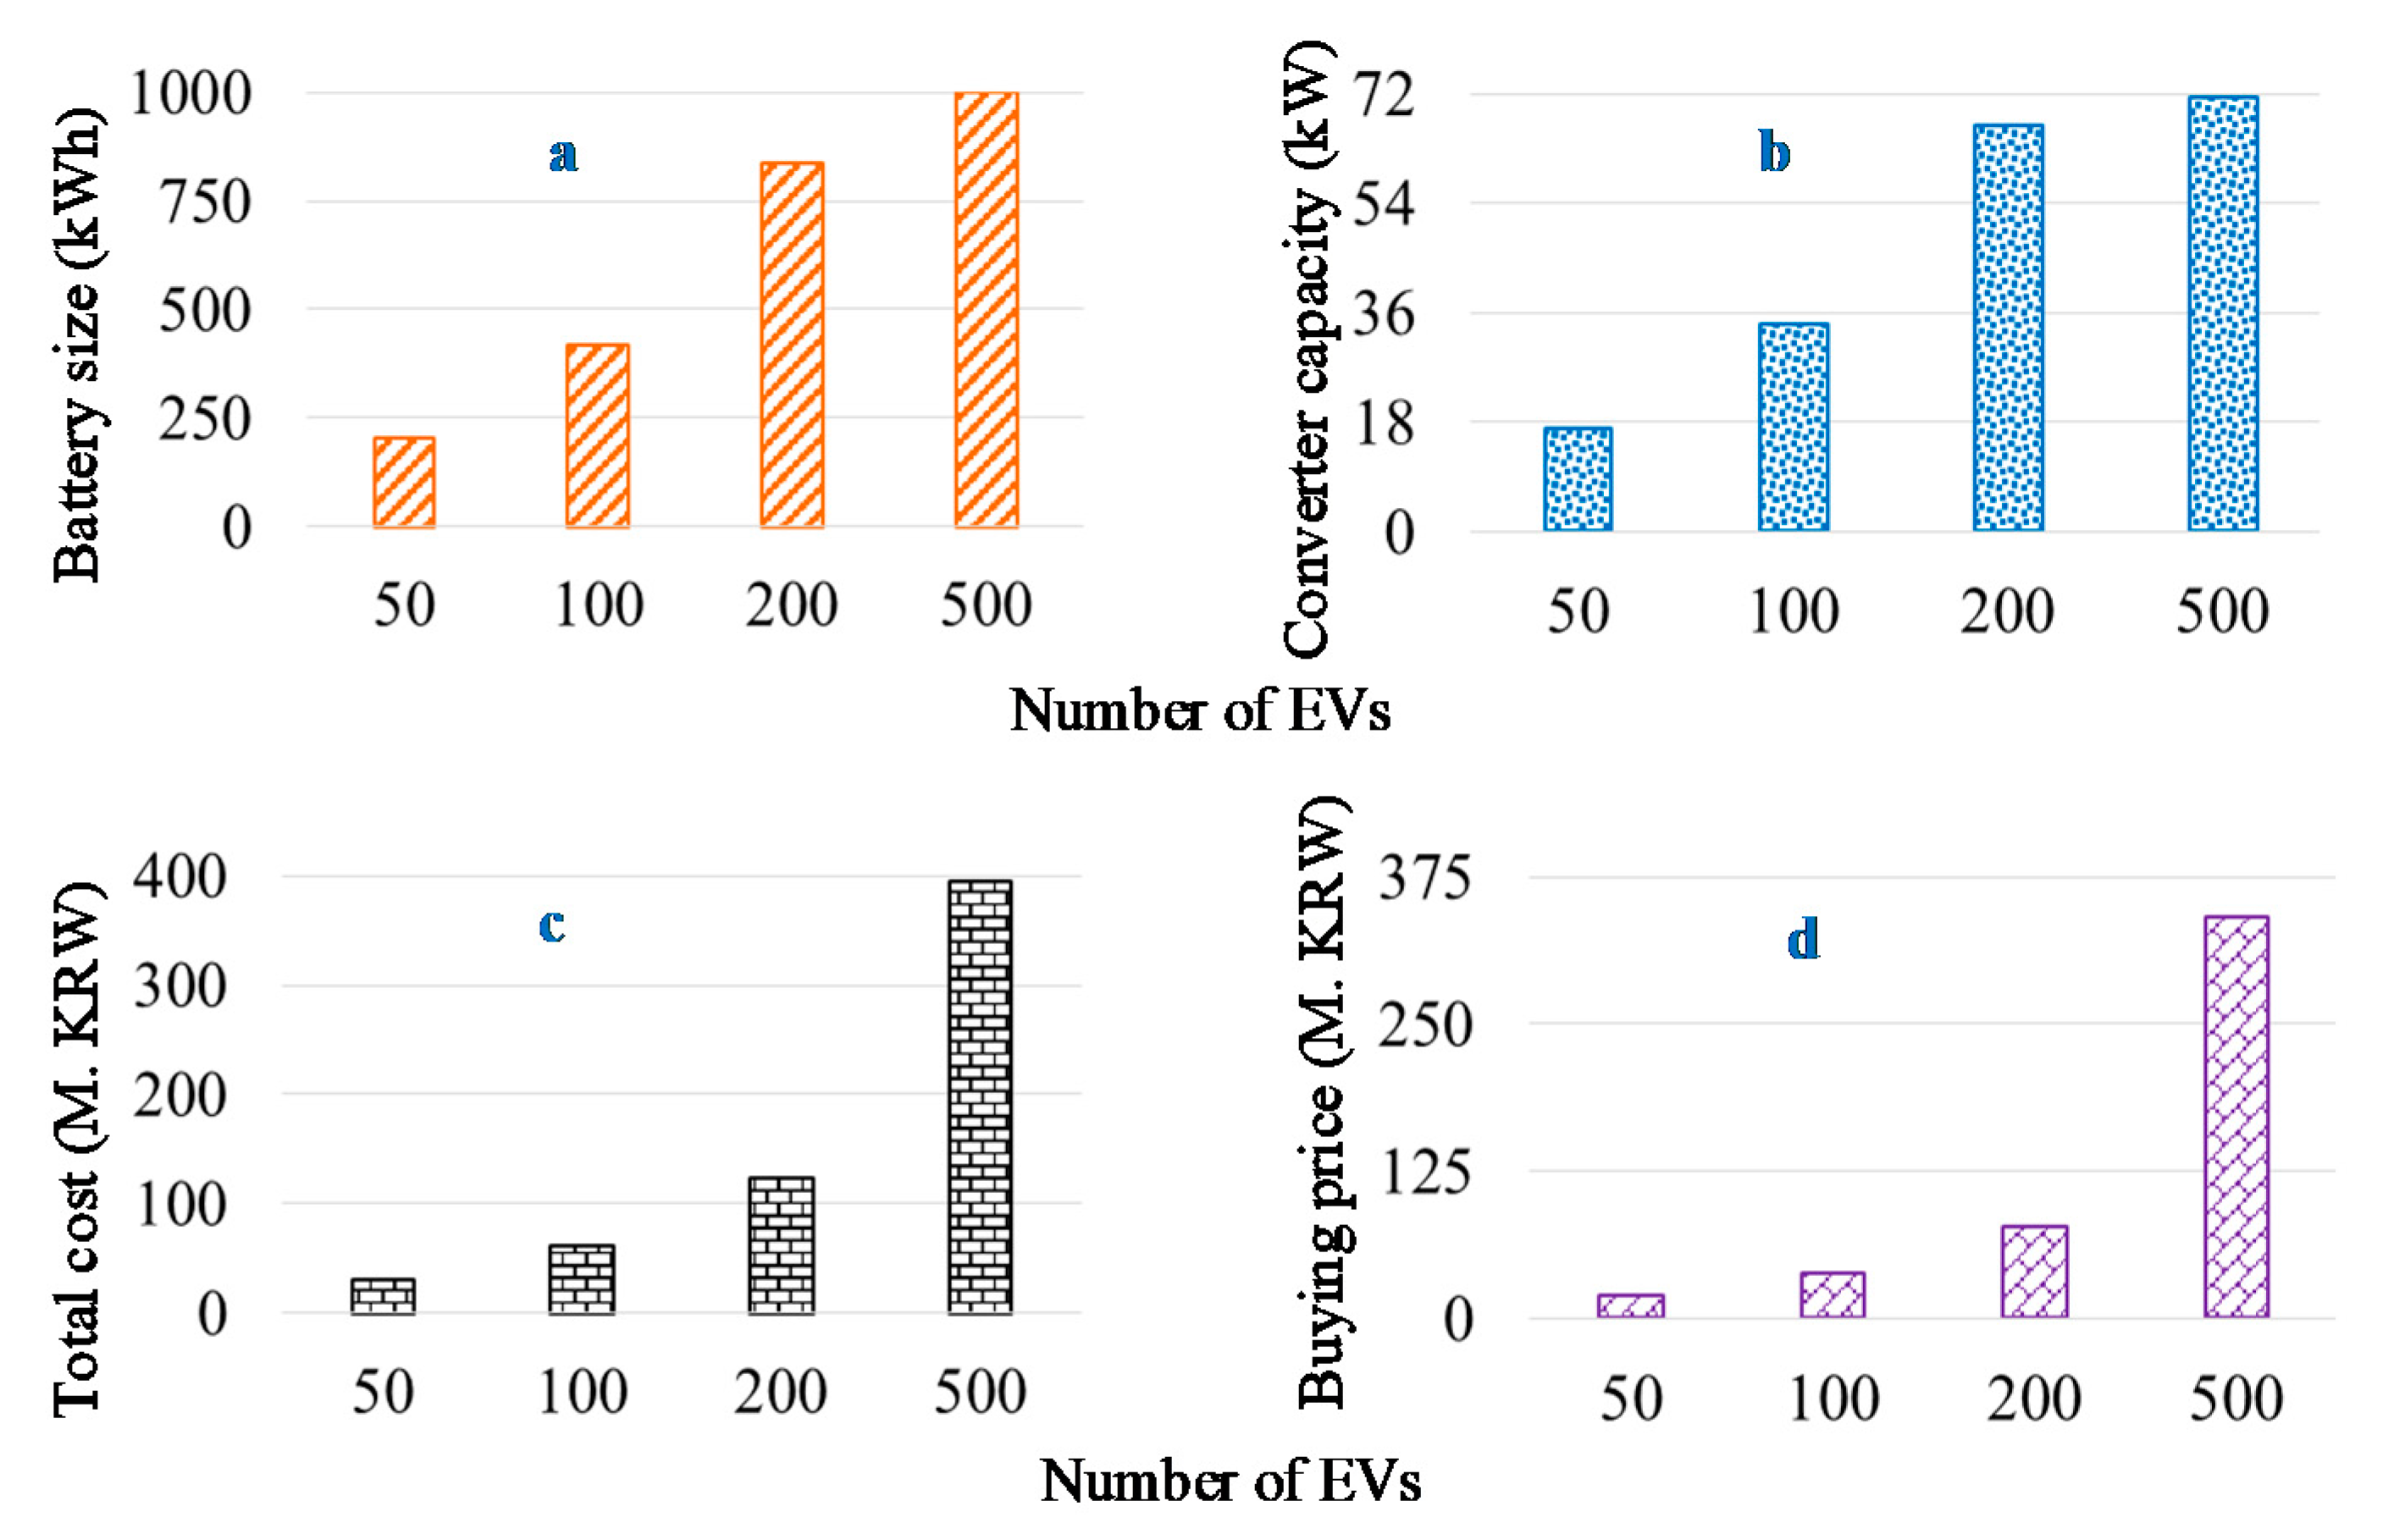
In this section, the number of EVs registered with the charging station is varied and four cases are considered, i.e., the number of EVs is 50, 100, 200, and 500, respectively. However, the ratio between commercial and private EVs is the same (5%) for all the cases. It can be observed from Figure 8a that with an increase in the number of EVs, the battery size increases, as expected. However, it is interesting to notice that converter size is not increasing in the same fashion, as shown in Figure 8b. This is due to the higher number of charging (off-peak hours during night and dawn) and discharging (peak hours during afternoon and evening) intervals. This observation supports our idea that battery size and converter capacity are two independent variables and need to be sized simultaneously. Buying power from the grid increases in an exponential way with an increase in the number of EVs, as shown in Figure 8d, since it is uneconomical to increase the battery and converter size linearly with an increase in the number of EVs, which is also evident from Figure 8a,b. Therefore, more power is bought from the grid to balance the power of the charging station during all the intervals. Due to the exponential increase in the buying price, the total cost of the charging station also increases in an exponential way. It implies that with an increase in the number of EVs, the cost of buying power from the grid is more dominant as compared to the investment cost of the ESS. This is due to the difference in the load profile of the charging station during different days. If the number of EVs is increased by a certain amount, the optimization algorithm will opt to increase the size of the ESS, since the optimization algorithms aim to find a tradeoff between buying power during peak intervals and increasing the size of the ESS.

5.2. Uncertainty in Return Time of EVs

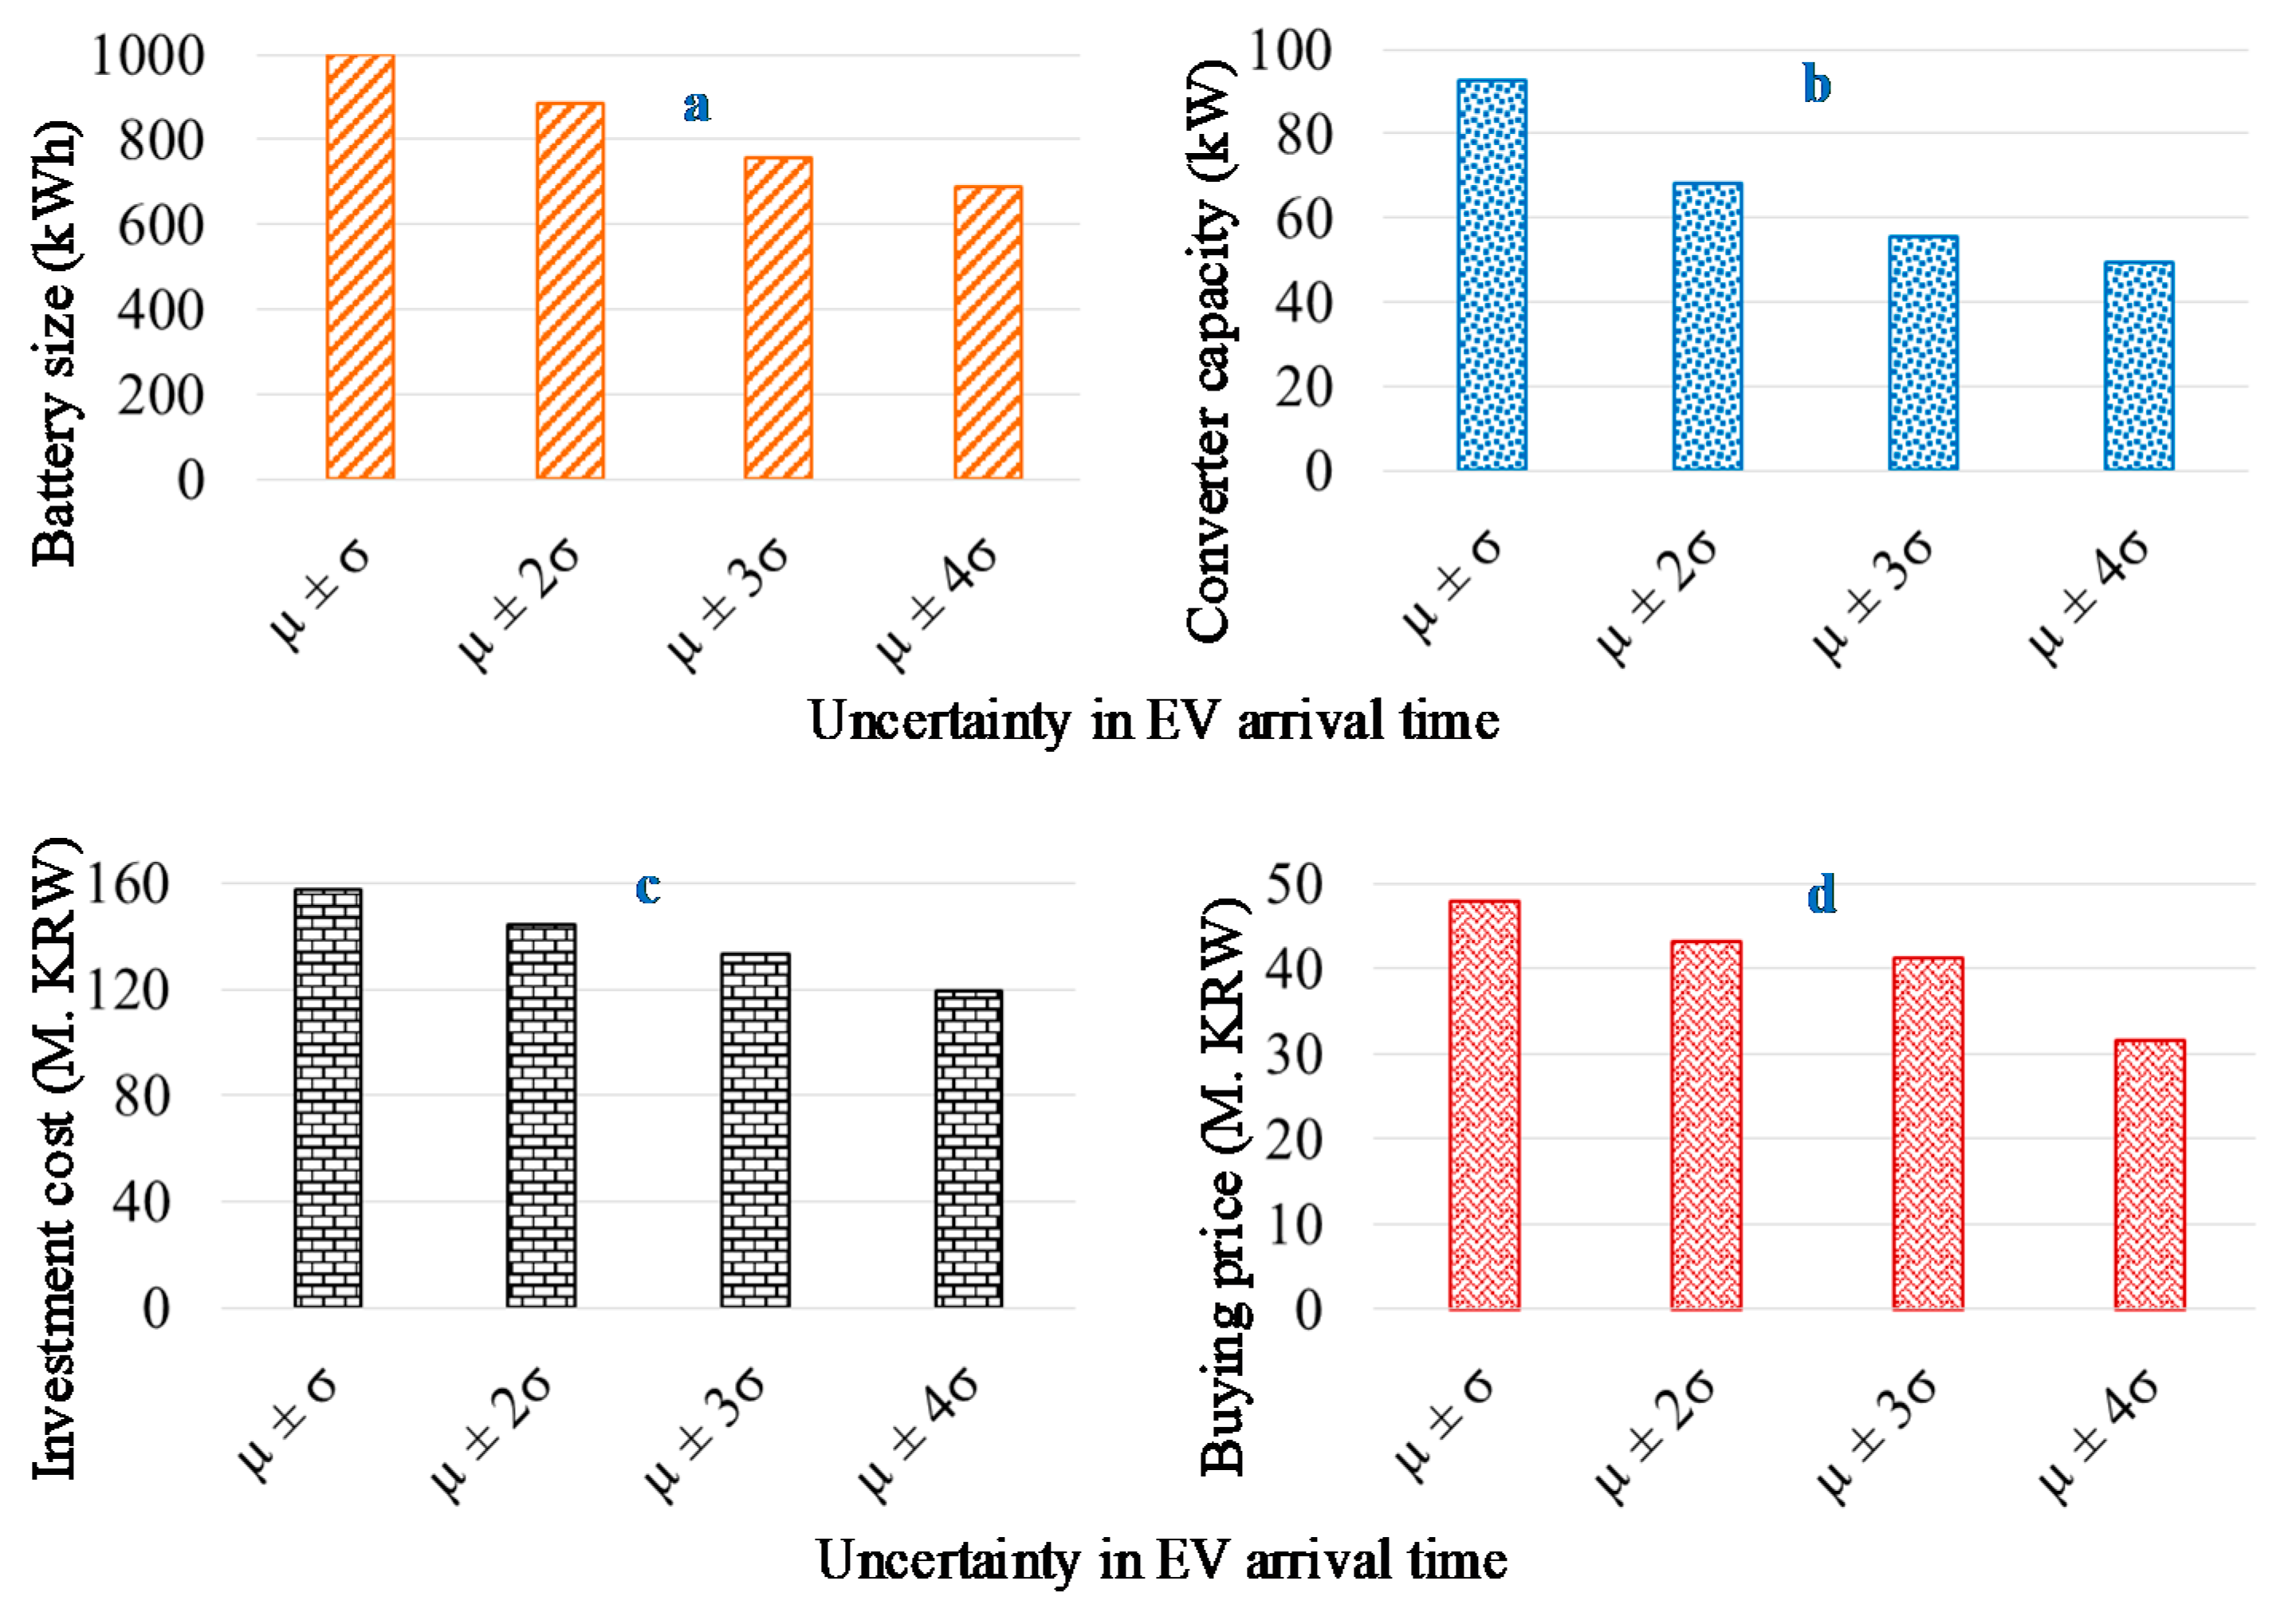
In this section, the uncertainty in return time of EVs to the charging station is analyzed by formulating four cases, where µ and σ represent the mean and standard deviation of return time. It can be observed from Figure 9a,b that when all the vehicles return within the µ ± σ bound, bigger size battery and correspondingly larger capacity converter is selected. This is due to the return of all the vehicles during system peak intervals. With an increase in the arrival bound, the battery and converter sizes decrease due to returning more EVs outside the peak intervals, i.e., power can be directly bought from the grid. Similarly, the buying price also decreases due to buying more power during off-peak intervals with wider returning bounds, as shown in Figure 9d. Due to smaller sizes of the battery and converter, the investment cost of ESS also decreases with an increase in return bounds, as shown in Figure 9c.

5.3. ESS Useable Energy Range

Overcharging and deep discharging have a direct impact on the life of the ESS, but the operators can increase their benefit for a short time. Therefore, in this section, the impact of ESS useable energy range on the size of the battery and converter is analyzed by considering four cases. It is interesting to notice that with a decrease in the useable energy range (from 0 to 100–30 to 70), the battery and converter sizes decrease. This is due to the inability to use a higher percentage of battery (100%, 80%, 60%, and 40%, respectively) while paying higher investment costs. Instead, the optimization algorithm chooses to buy power from the grid to fulfill the load demand of EVs, even during system peak intervals. It is also evident from Figure 10d that the amount of power bought during peak intervals increases with a decrease in useable energy range. Similarly, the total cost of the charging station also increases with a decrease in the usage energy level due to the increase in buying power, especially during peak intervals.

5.4. Ratio Between Commercial and Private EVs

The load profile of the charging station is influenced by the number of commercial and private EVs in the EV fleet. Commercial EVs need to be charged each day but they are not required to be charged on holidays. However, private EVs need to charge on alternate days irrespective of working or holidays. Therefore, in this section, the impact of the percentage of commercial and private EVs on battery size and converter capacity is analyzed. In this section, five cases are considered where the value in each case implies the percentage of commercial vehicles. The percentage of private vehicles can be obtained by subtracting the value from 100.
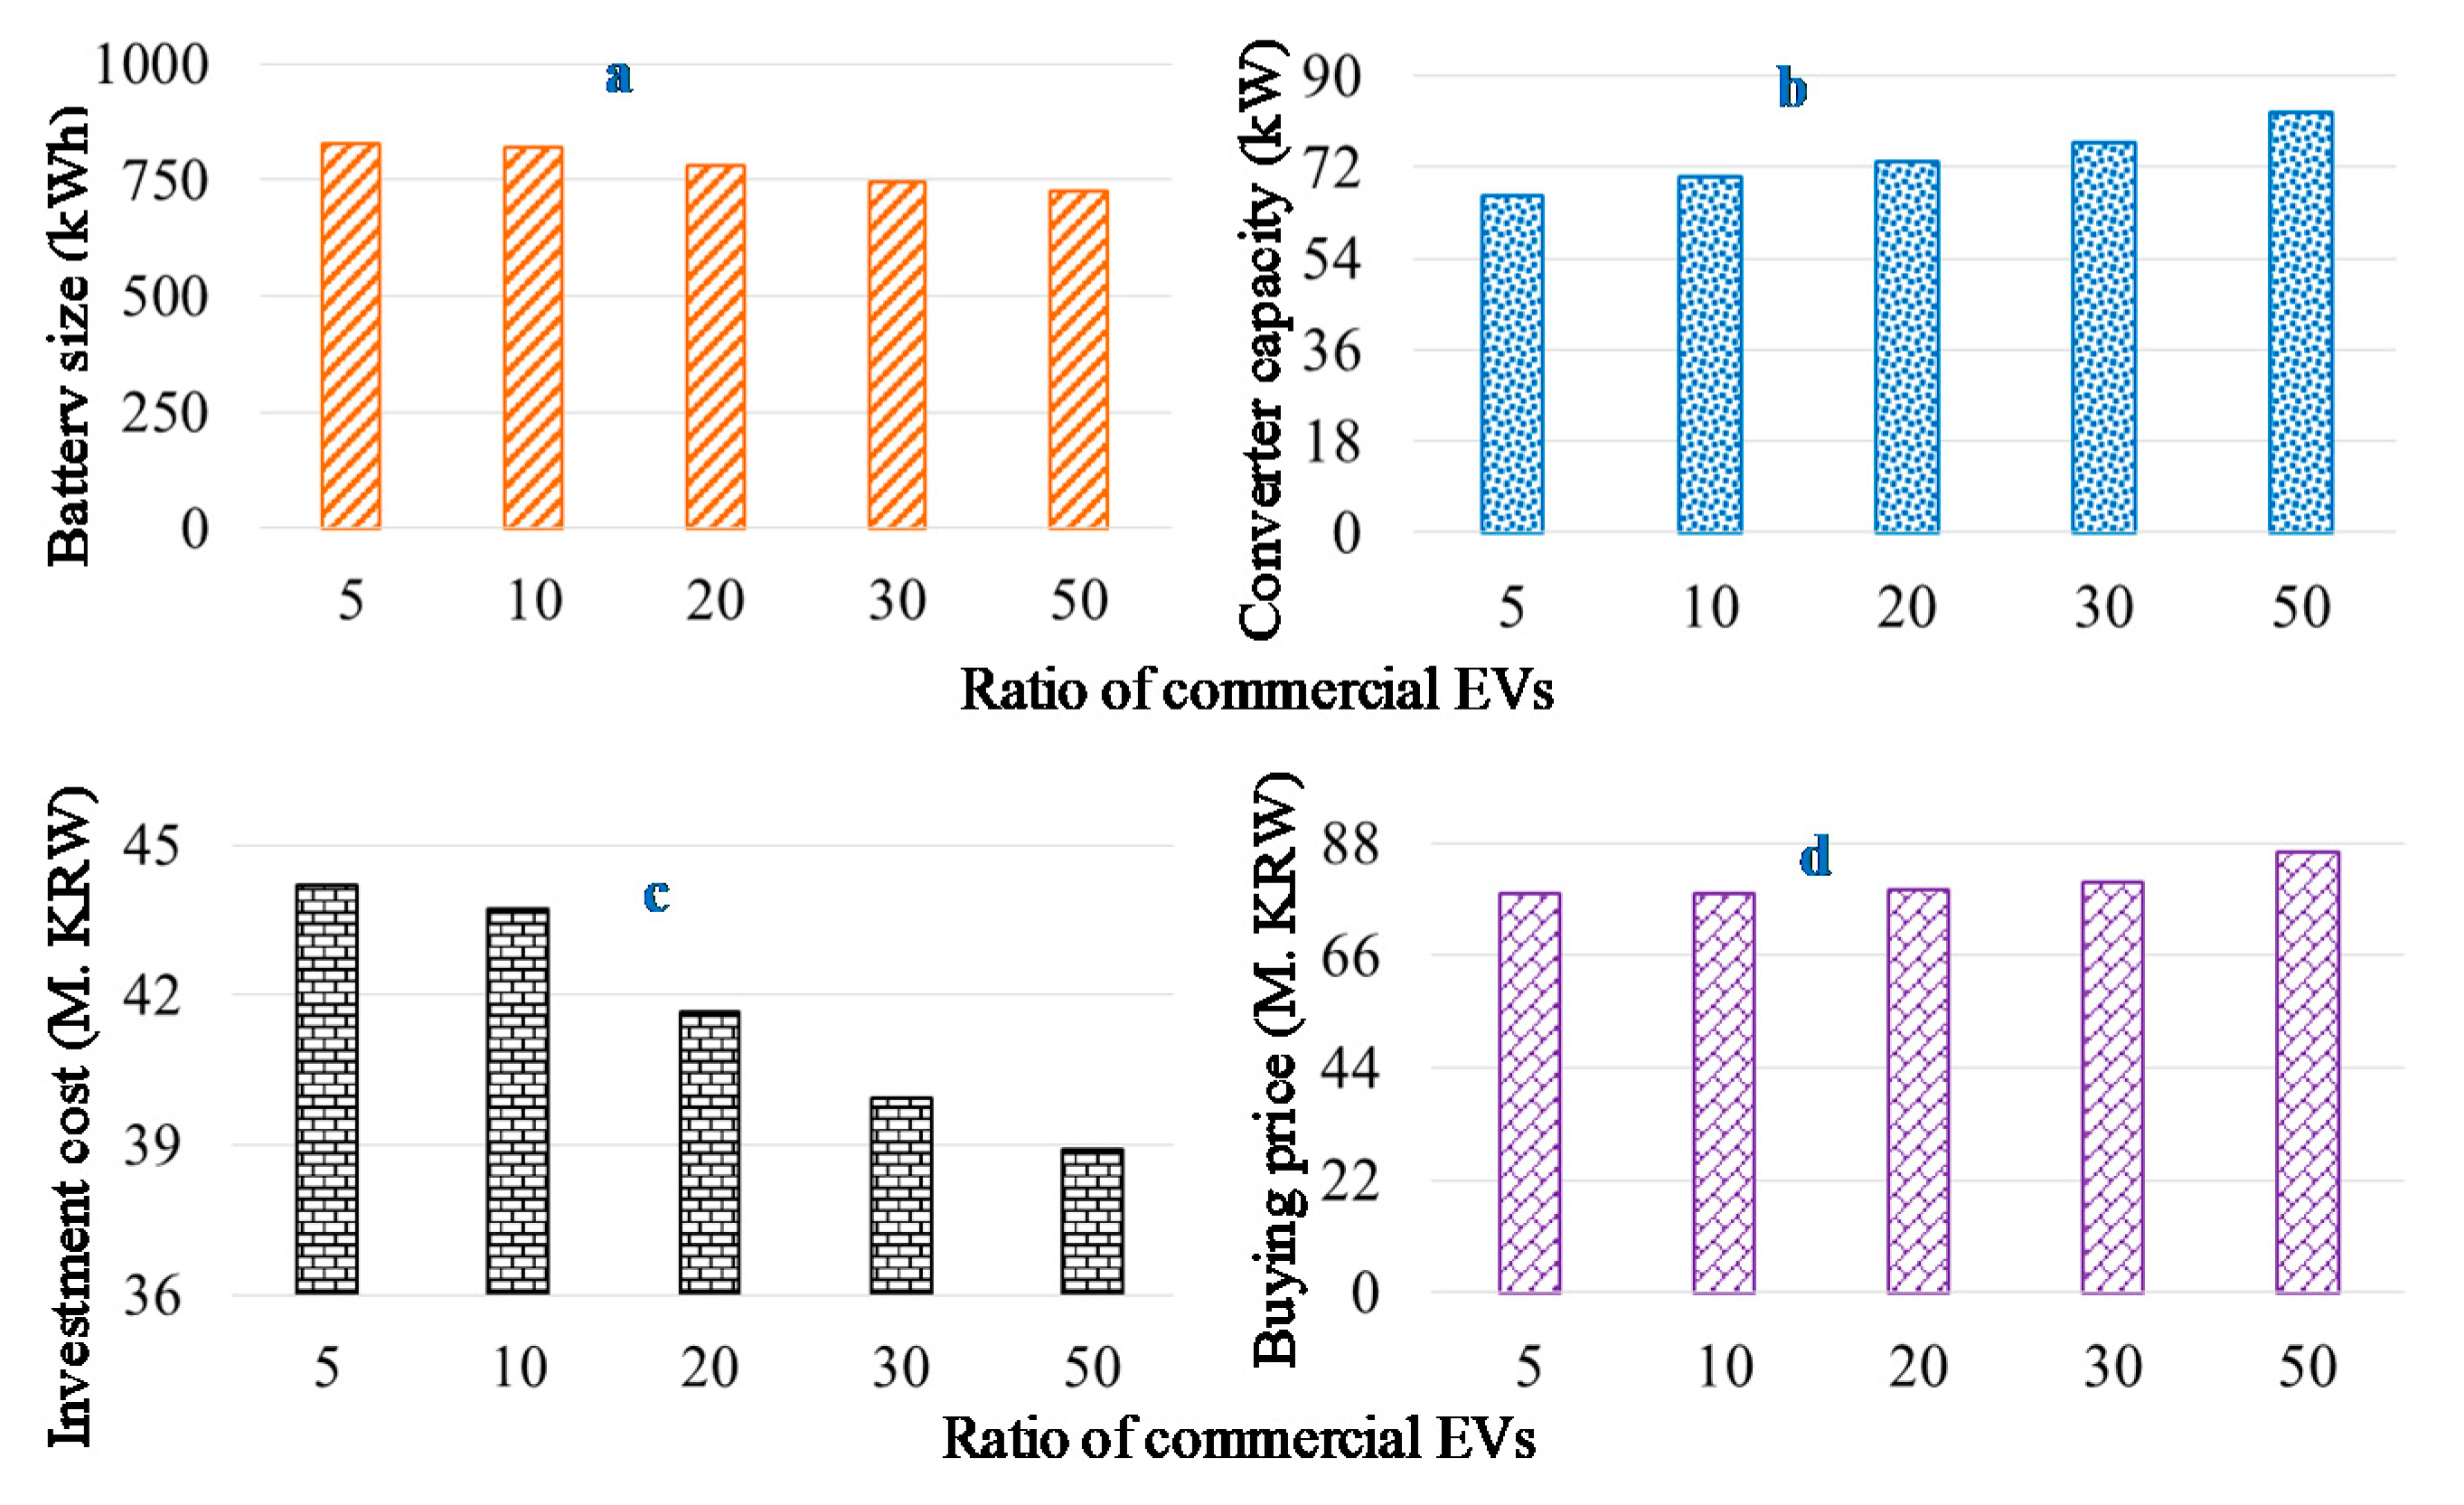
It can be observed that battery size decreases with an increase in the percentage of commercial vehicles in the fleet while the size or converter increases, as shown in Figure 11a,b. It implies that more frequent charging and discharging will be required due to the charging of commercial vehicles each day. The buying prices also increase with an increase in the percentage of commercials vehicles due to buying more power during all working days, as shown in Figure 11d. However, the investment cost of ESS decreases with an increase in the percentage of commercial vehicles, as shown in Figure 11c. This is due to the sharp reduction in battery size as compared to the increase in converter size and buying power cost from the grid with an increase in the percentage of the commercial EVs.

6. Conclusions

An optimization method for simultaneous sizing of the battery and converter for fast charging stations is proposed in this paper. The performance of the proposed method is compared with two commonly used sizing approaches, i.e., battery following and fixed-converter size approaches. The major findings of this article are as follows.
  • The proposed method has reduced the yearly cost (investment and operation) of the fast charging station by 5% in comparison with the battery following case. Similarly, cost reductions of up to 6% have been observed when compared with the fixed capacity converter case. In the case of the fixed-converter method, the investment cost is lower in one case (Fixed 50) than the proposed method. However, in that case, the amount of power bought during peak intervals has increased by about 200%, which is against the objective of deploying ESS in fast charging stations.
  • It has been observed from simulation results that the proposed method avoids under or oversizing of the converter by sizing it simultaneously with the battery, which was the major drawback of the existing methods.
  • It has been observed that the size of the converter does not increase significantly with an increase in the number of vehicles due to enough time for charging and discharging of the battery in the case of charging stations. In addition, a direct relationship between the uncertainties in return time of vehicles and the size of the battery and converter has been observed.
  • It also has been observed that when the useable energy range of the battery is reduced, the optimization algorithm chooses to buy directly from the grid while battery and converter sizes are reduced. This will result in the inability to reduce the peak load and is thus not suitable for charging stations.
  • Finally, with an increase in the percentage of commercial vehicles in the fleet, the battery size decreases while converter size increases. However, the reduction in battery size is more significant and thus the investment cost reduces.
Various methods are available in the literature on optimal sizing of ESS for fast EV charging stations. Methods for evaluating the optimality of determined sizes are required, especially for rule-based methods, and it could be a valuable extension to this paper. Similarly, the evaluation of the obtained results for different cases such as seasons of the year and public holidays is also required. This would also be a valuable extension for this paper to analyze the determined sizes of the battery and converter for various conditions of the year.

Author Contributions

A.H.—conceptualization and writing: original draft preparation; V.-H.B.—writing: review and editing; H.-M.K.—validation and supervision; J.-W.B.—project administration and resources.

Funding

This work was supported by the energy efficiency and resources of the Korea Institute of Energy Technology Evaluation and Planning (KETEP) grant funded by the Korea government Ministry of Knowledge Economy (No. 20192010106750).

Acknowledgments

This work was supported by the energy efficiency & resources of the Korea Institute of Energy Technology Evaluation and Planning (KETEP) grant funded by the Korea government Ministry of Knowledge Economy (No. 20192010106750).

Conflicts of Interest

The authors declare no conflict of interest.

Nomenclature

Identifiers and Binary Variable
d The identifier for a day, running from 1 to D.
t The identifier for a time interval, running from 1 to T.
v The identifier for electric vehicles, running from 1 to V.
t p b ,   t p e Identifiers for daily peak beginning and peak ending time intervals.
u t B a t A binary variable for identifying the presence or absence of battery in the parking station.
μ ,   σ Mean and standard deviation of daily commuting profiles.
α ,   β Factors for determining the minimum and maximum operation range of ESS.
Parameters and Variable
p t , v E V , p t E V Power required by vth vehicle and whole EV fleet at time t, respectively.
Δ t ,   P V The time interval in hours and charging level of EV in kW, respectively.
f ( t ) ,   S ( t ) Probability of return time of EV and probability of recharge required, respectively.
C G r i d , C P e a k Cost for trading power and cost for buying power during peak period, respectively.
C E S S ,   C d , t P e n Cost of ESS and penalty price buying power during peak intervals, respectively.
P R d , t B u y , P R d , t S e l l Price for buying and selling power during day d and time t, respectively.
p d , t B u y , p d , t S e l l Amount of power bought and sold during day d and time t, respectively.
γ C o n v ,   γ B a t Cost recovery factor for converter and battery, respectively.
P c a p C o n v ,   P c a p B a t The capacity of the converter and size of the battery, respectively.
C P C S ,   C O & M Per unit cost of PCS and yearly operation & maintenance cost of the battery, respectively.
C B a t , C B O P Per unit cost of battery and balance of plant, respectively.
p t B D ,   p t B C Amount of power charger and discharged to/from the battery at t, respectively.
P m i n B a t ,   P m a x B a t Lower and upper operation bound of battery SOC, respectively.
p t S O C SOC of battery at time t.
η C ,   η d Charging efficiency and discharging efficiency of the battery, respectively.
P I N I T , p T S O C Initial SOC and SOC at the end of each operation day, respectively.

References

  1. Dale, H.; Nic, L. Emerging Best Practices for Electric Vehicle Charging Infrastructure; The International Council on Clean Transportation (ICCT): Washington, DC, USA, 2017. [Google Scholar]
  2. Matthew, M.; Clément, R.; Eric, W. Meeting 2025 Zero Emission Vehicle Goals: An Assessment of Electric Vehicle Charging Infrastructure in Maryland. Available online: https://www.nrel.gov/docs/fy19osti/71198.pdf (accessed on 15 October 2019).
  3. Hannan, M.A.; Hoque, M.M.; Hussain, A.; Yusof, Y.; Ker, P.J. State-of-the-Art and Energy Management System of Lithium-Ion Batteries in Electric Vehicle Applications: Issues and Recommendations. IEEE Access 2018, 6, 19362–19378. [Google Scholar] [CrossRef]
  4. Deepak, R.; Apoorva, K.; Sheldon, S.W. Extreme Fast Charging Technology—Prospects to Enhance Sustainable Electric Transportation. Energies 2019, 12, 3721. [Google Scholar]
  5. Song, J.; Toliyat, A.; Turtle, D.; Kwasinski, A. A Rapid Charging Station with an Ultracapacitor Energy Storage System for Plug-In Electrical Vehicles. In Proceedings of the International Conference on Electrical Machines and Systems, Jeju, Korea, 1–5 October 2010. [Google Scholar]
  6. Liu, G.; Kang, L.; Luan, Z.; Qiu, J.; Zheng, F. Charging Station and Power Network Planning for Integrated Electric Vehicles (EVs). Energies 2019, 12, 2595. [Google Scholar] [CrossRef]
  7. Ding, H.; Hu, Z.; Song, Y. Value of the Energy Storage System in an Electric Bus Fast Charging Station. Appl. Energy 2015, 157, 630–639. [Google Scholar] [CrossRef]
  8. Ehsan, A.; Yang, Q. Active Distribution System Reinforcement Planning with EV Charging Stations-Part I: Uncertainty Modelling and Problem Formulation. IEEE Trans. Sustain. Energy 2019. [Google Scholar] [CrossRef]
  9. Bao, Y.; Luo, Y.; Zhang, W.; Huang, M.; Wang, L.; Jiang, J. A Bi-Level Optimization Approach to Charging Load Regulation of Electric Vehicle Fast Charging Stations Based on a Battery Energy Storage System. Energies 2018, 11, 229. [Google Scholar] [CrossRef]
  10. Sbordone, D.; Bertini, I.; Di, P.B.; Falvo, M.C.; Genovese, A.; Martirano, L. EV Fast Charging Stations and Energy Storage Technologies: A Real Implementation in the Smart Micro Grid Paradigm. Electr. Power Syst. Res. 2015, 120, 96–108. [Google Scholar] [CrossRef]
  11. Bryden, T.S.; Hilton, G.; Dimitrov, B.; de León, C.P.; Cruden, A. Rating a Stationary Energy Storage System within a Fast Electric Vehicle Charging Station Considering User Waiting Times. IEEE Trans. Transp. Electr. 2019. [Google Scholar] [CrossRef]
  12. Ligen, Y.; Vrubel, H.; Girault, H. Local Energy Storage and Stochastic Modeling for Ultrafast Charging Stations. Energies 2019, 12, 1986. [Google Scholar] [CrossRef]
  13. Yan, Y.; Wang, H.; Jiang, J.; Zhang, W.; Bao, Y.; Huang, M. Research on Configuration Methods of Battery Energy Storage System for Pure Electric Bus Fast Charging Station. Energies 2019, 12, 558. [Google Scholar] [CrossRef]
  14. Longo, L. Optimal Design of an EV Fast Charging Station Coupled with Storage in Stockholm. Master’s Thesis, KTH School of Industrial Engineering and Management, Brinellvägen, Stockholm, 2017. [Google Scholar]
  15. Negarestani, S.; Fotuhi-Firuzabad, M.; Rastegar, M.; Rajabi-Ghahnavieh, A. Optimal Sizing of Storage System in a Fast Charging Station for Plug-In Hybrid Electric Vehicles. IEEE Trans. Transp. Electif. 2016, 2, 443–453. [Google Scholar] [CrossRef]
  16. Qian, K.; Zhou, C.; Allan, M.; Yuan, Y. Modeling of Load Demand due to EV Battery Charging in Distribution Systems. IEEE Trans. Power Syst. 2010, 26, 802–810. [Google Scholar] [CrossRef]
  17. Zhang, P.; Qian, K.; Zhou, C.; Stewart, B.G.; Hepburn, D.M. A Methodology for Optimization of Power Systems Demand due to Electric Vehicle Charging Load. IEEE Trans. Power Syst. 2012, 27, 1628–1636. [Google Scholar] [CrossRef]
  18. Choi, J.; Lee, W.D.; Park, W.H.; Kim, C.; Choi, K.; Joh, C.H. Analyzing Changes in Travel Behavior in Time and Space Using Household Travel Surveys in Seoul Metropolitan Area over Eight Years. Travel Behav. Soc. 2014, 1, 3–14. [Google Scholar] [CrossRef]
  19. Börjesson, P.; Larsson, P. Cost Models for Battery Energy Storage Systems. Bachelor’s Thesis, KTH School of Industrial Engineering and Management, Brinellvägen, Stockholm, 2018. [Google Scholar]
  20. Poonpun, P.; Jewell, W.T. Analysis of the Cost Per Kilowatt Hour to Store Electricity. IEEE Trans. Energy Convers. 2008, 23, 529–534. [Google Scholar] [CrossRef]
  21. Tsiropoulos, I.; Tarvydas, D.; Lebedeva, N. Li-ion Batteries for Mobility and Stationary Storage Applications Scenarios for Costs and Market Growth; JCR Science for Policy Report; Publications Office of the European Union: Luxembourg, 2018. [Google Scholar]
  22. Asif, A.; Singh, R. Further cost reduction of battery manufacturing. Batteries 2017, 3, 17. [Google Scholar] [CrossRef]
  23. IBM ILOG CPLEX V12.6 User’s Manual for CPLEX 2015, CPLEX Division; ILOG: Incline Village, NV, USA, 2015.
  24. Fu, R.; Remo, T.W.; Margolis, R.M. 2018 US Utility-Scale Photovoltaics-Plus-Energy Storage System Costs Benchmark (No. NREL/TP-6A20-71714); National Renewable Energy Lab. (NREL): Golden, CO, USA, 2018. [Google Scholar]
  25. Trading Economics: South Korea Interest Rate. Available online: https://tradingeconomics.com/south-korea/interest-rate (accessed on 25 November 2019).
  26. Vector Limited. Battery Energy Storage Systems: Independent Review of Lithium Ion Battery Lives; Vector Limited: Denver, CO, USA, 2017. [Google Scholar] [CrossRef]
  27. Hussain, A.; Bui, V.H.; Kim, H.M. Fuzzy Logic-Based Operation of Battery Energy Storage Systems (BESSs) for Enhancing the Resiliency of Hybrid Microgrids. Energies 2017, 10, 271. [Google Scholar] [CrossRef] [Green Version]
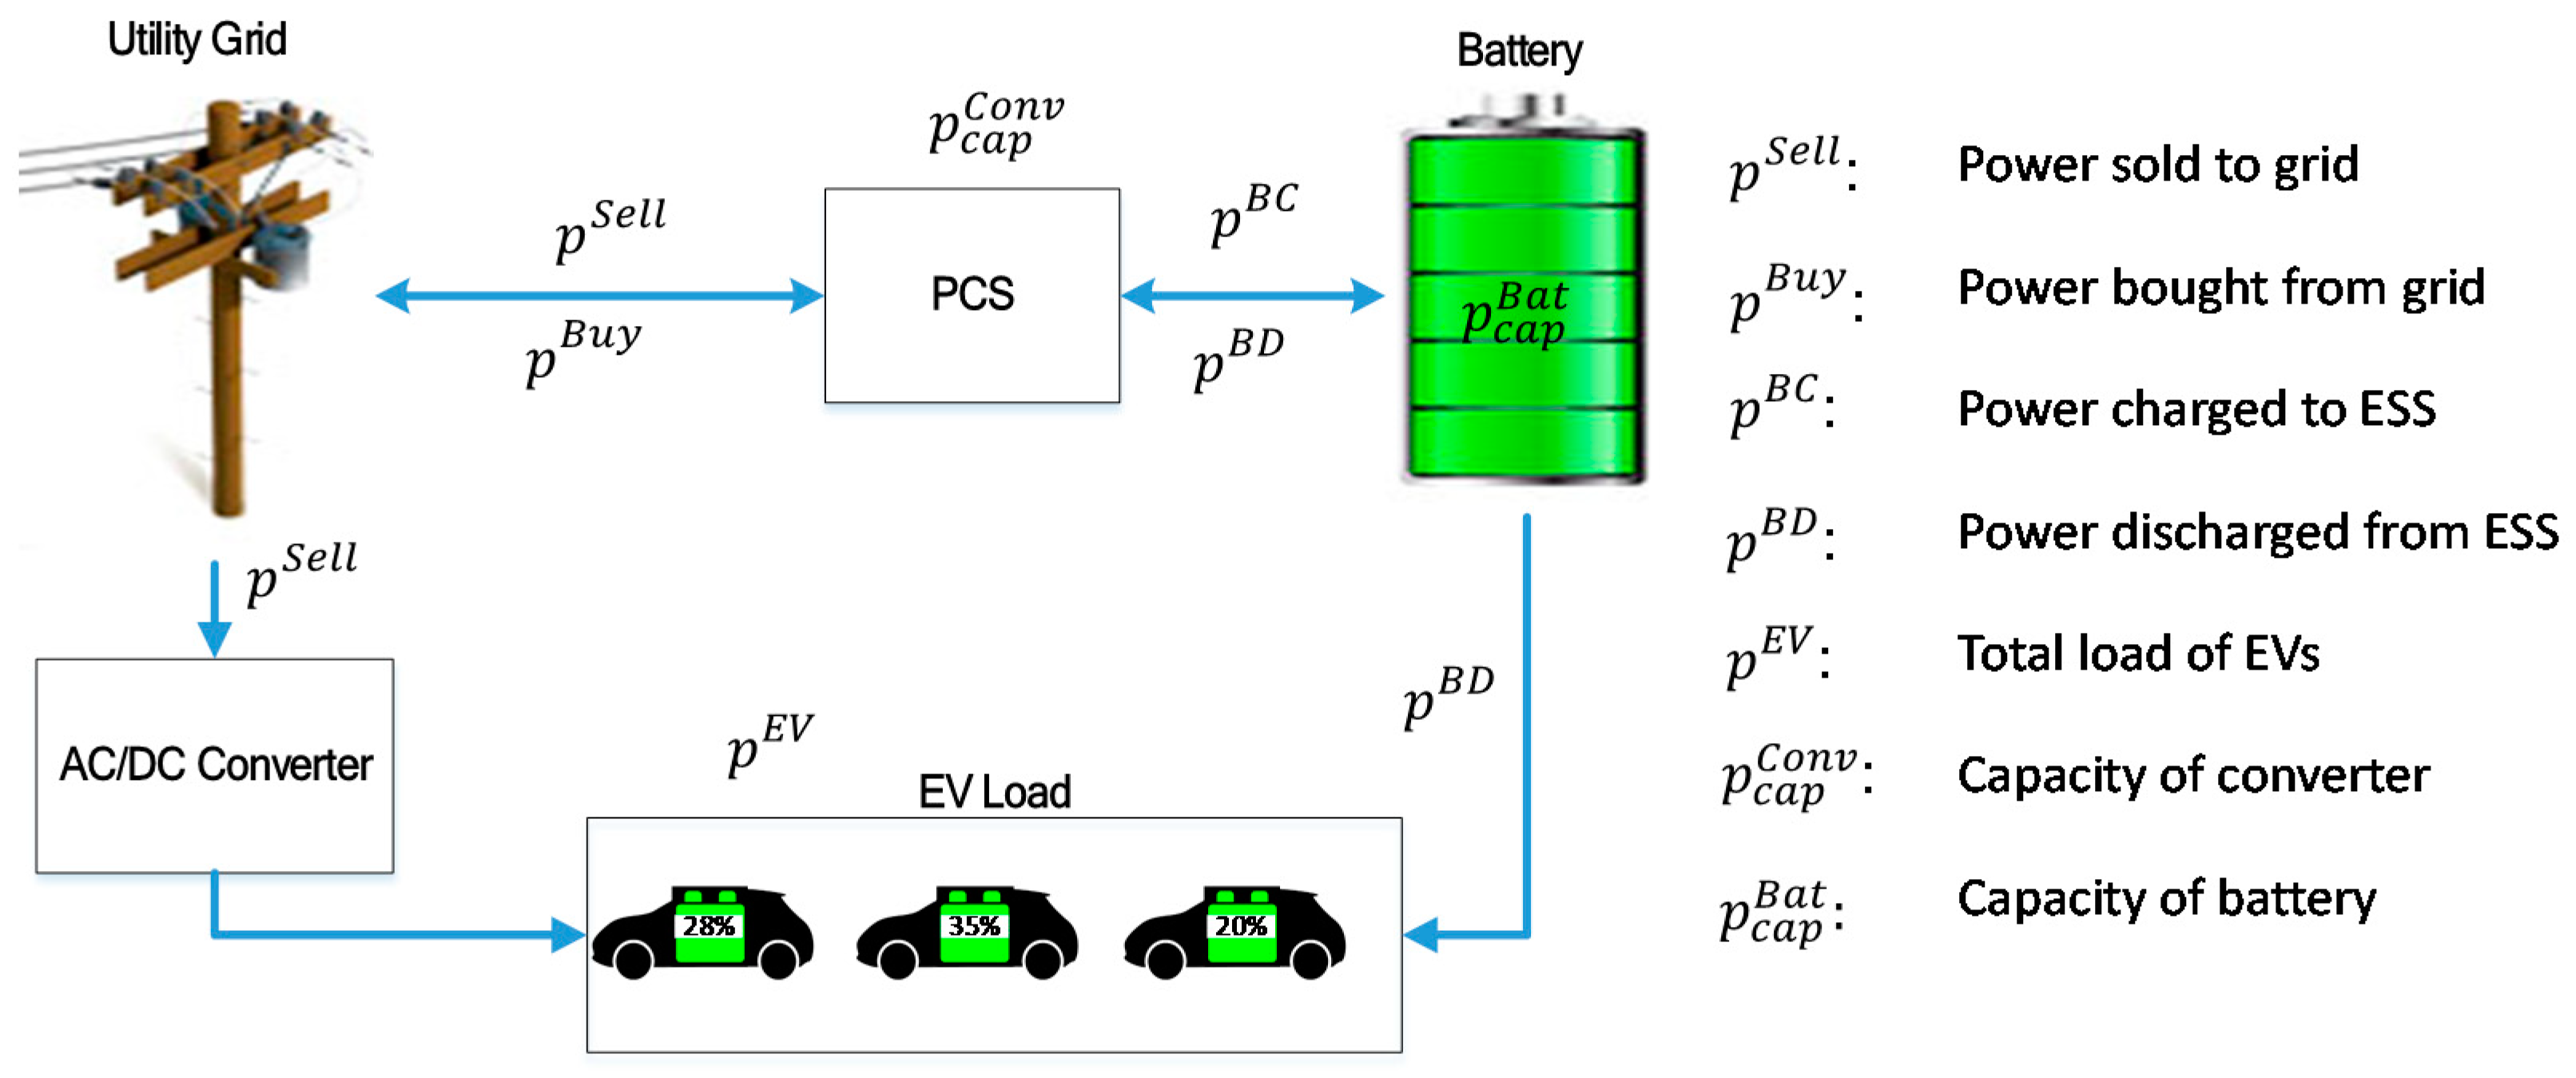
Figure 1. Configuration of the fast electric vehicle (EV) charging station including stationary energy storage system (ESS).
Energies 12 04516 g001
Figure 2. Proposed method for simultaneous sizing of ESS and converter.
Energies 12 04516 g002
Figure 3. (a) Korean power system load profiles on a typical summer weekday and a holiday; (b) daily commuting profile of vehicles in Korea in 2018.
Energies 12 04516 g003
Figure 4. Daily market price signal of typical days: (a) working day; (b) holiday.
Energies 12 04516 g004
Figure 5. Cost comparison among different sizing approaches: (a) total cost; (b) investment cost.
Energies 12 04516 g005
Figure 6. Sizes of battery and converters in different sizing approaches: (a) battery; (b) converter.
Energies 12 04516 g006
Figure 7. Power buying amount and price for different sizing approaches: (a) price for buying power; (b) amount of power bought during peak price intervals.
Energies 12 04516 g007
Figure 8. Impact of number of EVs on the results of the proposed method: (a) size of battery; (b) capacity of converter; (c) total cost of charging station; (d) price for buying power.
Energies 12 04516 g008
Figure 9. Impact of arrival time uncertainty of EVs on the results of the proposed method: (a) size of battery; (b) capacity of converter; (c) investment cost of ESS; (d) price for buying power.
Energies 12 04516 g009
Figure 10. Impact of battery useable energy range on the results of the proposed method: (a) size of battery; (b) capacity of converter; (c) total cost; (d) power bought during peak intervals.
Energies 12 04516 g010
Figure 11. Impact of commercial to private EVs ratio on the results of the proposed method: (a) size of battery; (b) capacity of converter; (c) investment cost; (d) price for buying power.
Energies 12 04516 g011
Table 1. Input parameters related to charging station and energy storage system (ESS) cost.
ParameterValueUnitParameterValueUnitReference
Total EVs200-PCS cost77,0001/kW[24]
Commercial EVs5%Battery cost229,9001/kWh[24]
Private EVs95%O&M cost18,7001/kW/yr[24]
Maximum SOC90%BOP cost53,9001/kWh[19]
Minimum SOC10%Interest rate1.75%[25]
Initial SOC20%Lifetime (battery, converter)10, 15years[26]
EV charger rating40kWEfficiency90%[26]
1 Korean Won.
Table 2. Comparison of proposed and existing sizing approaches.
Sizing ApproachTotal Cost
(Million KRW)
Difference
(%)
Peak Buy
(MW)
Difference
(%)
Proposed122.260.0013.340.00
BESS only128.515.1116.9126.75
Fixed 50129.125.6139.83198.55
Fixed 500125.902.9813.340.00
Fixed 1000130.136.4413.340.00