Abstract
The objective of this article is to propose a framework for defining a day-ahead prediction-of-use tariff (POU) that promotes aggregators of the plug-in electric vehicles (PEVs) to operate as closely as possible to an optimal charging curve previously calculated by the distribution system operator (DSO). The DSO calculates this optimal charging curve to flatten the load curve of the distribution transformers as much as possible by coordinating the daily recharging of PEVs. The objective is to establish the optimal power profile of the PEV aggregators needed to flatten the power curve supplied by the transformer, so that PEV customers’ needs can be met throughout the day. The proposed framework is applied in a case study accounting for uncertainties associated with charging through Monte Carlo simulation, in order to find the POU tariff. The results demonstrate that applying the POU tariff determines the transformer’s minimum power limit necessary to meet all PEV users’ needs. Additionally, the day-ahead POU tariff does not generate new demand peaks, since it does not concentrate the energy supply of flexible loads in pre-established time bands. Finally, simulation reflects the significant effect of the PEV charging on the distribution system in terms of enhancing the voltage profile, maximizing the transformer life, and reducing the power/energy losses.
1. Introduction
Nowadays, the global transport system relies heavily on internal-combustion engines, which use fuels that contribute to environmental pollution. To mitigate this pollution, an exponential growth of the number of plug-in electric vehicles (PEVs) is awaited in the transport market worldwide [1]. PEVs will have the potential to rapidly replace internal-combustion vehicles if some incentives are introduced for their adoption by the end consumers, for instance, the decrease in the PEV battery costs [2] and the increase in gasolines prices. However, some barriers to PEV adoption must be also eliminated. One significant barrier is the lack of suitable charging infrastructures, which must be considered in a holistic way, interacting with the distribution network for its reliable operation [3].
However, it is necessary to consider the fact that the massive connection of PEVs to distribution networks could have negative impacts. Some of these impacts include an acceleration of the distribution transformer aging, an increase of energy losses, an increase in the peak demand and a deterioration of power quality [4]. These drawbacks can be controlled by properly coordinating the charging of the PEV batteries (PEV management).
Flexibility is a noticeable feature of PEVs when operating as electric loads. In this sense, it is possible to control the charging process of a PEV, e.g., the PEV can be switched on/off while parked and connected to the grid [5]. That characteristic can be appropriately used by a distribution system operator (DSO) to calculate the optimal moment at which a vehicle, in a PEV fleet (controlled by an aggregator), must be charged. This scheduling problem is always seeking the best techno-economic operation of the grid, in brief, performing load management.
At this point, it is necessary to state that an aggregator is a new agent of a smart distribution grid, which manages the charging of PEVs plugged into a low-voltage network (in fact, it can also manage distributed generators in the grid).
In this context, this article proposes a framework for coordinating multiple PEV aggregators through a prediction-of-use tariff. The framework is composed of two main stages. The first stage involves an optimization problem aimed at determining the minimum probable levels of power to be supplied by primary and secondary distribution transformers (PDTs and SDTs, respectively) in the network operated by the DSO. The optimization problem is subject to the energy requirements of PEVs (affected by uncertainty) and the rest of the electric loads (inflexible loads) connected to the network. At the end of this first stage, probable optimal charging profiles of PEVs controlled by each aggregator in the grid are obtained, i.e., at the SDT level. The probable power profiles obtained for all the aggregators are then added to obtain the total power to be supplied by the PDT. At this stage, a Monte Carlo simulation is performed to consider the uncertainty related to charging scenarios.
The second stage of the framework focuses on the DSO and involves determining a prediction-of-use tariff (POU) for the day-ahead operation of the network. This prediction aims at incentivizing the aggregator to follow the probable optimal load curves obtained in the first stage and to penalize any deviation from them.
The framework proposed in this article aims to enhance the operation of the grid by flattening its supply power profile. The results of the proposed methodology, based on POU tariff, are compared with those obtained through the approach reported in [6], which is based on a time-of-use tariff (TOU), that uses the same case study. This case considers a power distribution system with 32 aggregators whose coordination is managed by the DSO.
Finally, the voltage profile, the aging of the PDT and the power/energy losses during a day of operation under both TOU and POU are compared, in order to analyze the impact of the strategy proposed in this work on the studied distribution system.
This article is structured in six sections. Section 2 provides a summary of the literature focusing on PEV charging coordination schemes and electricity tariffs in smart distribution grids. Section 3 presents a description of the methodology proposed. Section 4 explains the case study for which the proposal is tested. A summary and analysis of results are provided in Section 5. Finally, Section 6 presents the conclusions of this work.
2. Related Work
This section presents the state-of-the-art strategies for charging coordination among multiple aggregators and the electricity tariffs in smart distribution grids. In addition, the main contributions of this work are detailed.
2.1. Coordination among Multiple Aggregators
The problem of managing PEV charging is approached in the literature, with the scope of reducing the peak demand and mitigating the impacts mentioned in the previous section. In this sense, two types of studies can be distinguished. The first type deals with charging management at the aggregator level, while the second type approaches the coordination among several aggregators. Based on that, it is important to stress that the charging management at the aggregator level can overload and stress the network components. Therefore, only some of the works included in the second group are presented below.
In [7], the participation of PEV charging in the daily electricity markets is analyzed, considering a coordination mechanism between aggregators with the aim of minimizing the total cost of the purchased energy by each aggregator. That work does not consider restrictions imposed by the distribution network for coordination among aggregators. In [8], a hierarchical dispatch model, considering a vehicle-to-grid (V2G), is proposed for the coordination of PEV charging/discharging in a bi-level optimization problem. The upper level of that problem represents the traditional optimal power flow model whose objective function is to minimize the total cost and the active power loss. On the other hand, the objective of the lower level is to program PEV charging/discharging. This coordination of program is the role of the aggregator. Likewise, a coordination approach that is run online in order to charge/discharge PEVs is shown in [9]. The targets of the work are to achieve the maximum satisfaction of PEV owners while also ensuring the minimum operational costs of the system. This problem also considers the restrictions of the electrical system and states that the function of the aggregators is to inform the charger controllers with the operator´s charging/discharging decisions. In particular, extra cycles of battery discharge in V2G mode can be detrimental to its performance and affect its useful life.
Taking into account this disadvantage, V2G mode is not considered, as in references [6,10,11,12,13] which only address PEV recharging. In [6], an approach to coordinate the charging of PEV is proposed. The objective is to minimize the charging cost under a TOU tariff, considering a power constraint imposed by the distribution transformers. Moreover, the impact of PEV charging on the distribution grid is analyzed in terms of the profile of the voltage, the life loss of the transformer, and the power/energy losses of the grid. The objective of [10] is to coordinate PEV’s charging so it matches the wind supply. The solution of the problem is addressed through a two-stage simulation-based approach. In the upper stage, the DSO dispatches the power between the aggregators to make maximum use of wind energy, while the aggregator schedules the charging process of the EVs to have the minimum charging cost in the lower stage. The prices used in this work belong to fixed bands according to the time of day. In [11], a scheduling approach is proposed to coordinate the charging of PEV load according to the base load of the network and the price of electricity schedule but fixed for all days. The problem is formulated as a bi-level optimization problem, minimizing the total network costs in the upper level and minimizing the dispatching deviation of the sum of PEV charging power in the lower level. In [12], an approach for coordinating PEV charging that considers multiple aggregators under a TOU tariff and minimizes costs for each aggregator is proposed. Using a linear optimization model, the problem is solved iteratively by providing the aggregators with the scheduled power of the first interval and considering the solution of the next interval optimization problem. Finally, this approach has been enhanced in [13], which considers a three-level framework. Additionally, these coordination schemes based on TOU tariff, in general, cause rebound peaks and try to reduce the aggregator costs.
2.2. Electricity Tariffs in Smart Distribution Grids
In [14], the participation of different electric loads in the optimal functioning of an intelligent home district is studied. One of these loads is the PEVs, both in load mode and in V2G mode. The aim of this work is obtaining the minimum total cost of energy under TOU tariff. As a test case, a system of three dwellings that are supplied by a single-phase transformer is considered. The results show that the proposed approach would encourage users to change their consumption based on the TOU tariff to pay lower electricity bills. The optimum regional time of use (RTOU) load price model for PEVs is proposed in [15]; it reduces both the difference between peak and valley demand and the load cost. In [15], each zone has its optimal price, which takes into account the temporal and spatial characteristics. According to the results obtained, the optimum RTOU price will serve in guiding the PEV charging in order to achieve the stated objectives. In addition, the authors determine the efficiency of the optimum RTOU price to be better than the TOU price.
On the other hand, the response potential of a consumer’s demand is analyzed in [16]; it considers flat electricity tariffs, TOU, and critical peak pricing (CPP). For the different analyses, various scenarios were considered depending on the controllable devices and PEVs studied in each case. The results obtained show that a flat residential demand is partly achieved in the case of TOU or CPP tariffs. The disadvantage is that those tariffs, in a system where every customer is optimizing the demand, can cause rebound peaks. To address these peaks, multi-TOU and multi-CPP tariffs are offered in [16]. Customers are aggregated into groups, and price varies between different levels from one customer group to another.
In [17], the impacts of a flat tariff and the TOU are analyzed to identify the most suitable for each customer. Based on this information, an approach is proposed for an optimal PEV programming that achieves valley-filling of the load curve while minimizing electricity costs for each user. The results demonstrate that the determination of a global price system will not be optimal for all customers. An appropriate combination of tariffs is therefore necessary to ensure benefits for all customers.
In [18], an energy estimation method of a PEV aggregator is proposed through historical observations of price and consumed power data. According to the results of estimation, a scheme for pricing is designed to coordinate the energy consumed by the aggregators and to reduce the aggregated peak demand. This study compares the efficiency of the proposed pricing scheme with a flat tariff and TOU scheme. These comparisons show that the pricing scheme proposed encourages aggregators to reduce their maximum demand. According to the results obtained, the power profile presents oscillations, which can lead to frequent interruptions of the charging equipment and cause additional mechanical wear to the equipment and degradation of the battery.
In addition to the studies mentioned above, several articles propose local marginal prices in distribution with the aim of alleviating the network congestion with high PEV penetration [19,20,21]. Based on such works, a prediction-of-use (POU) tariff is proposed in [22], which better reflects a customer’s cost of predictability. The fundamental idea of the POU tariff is that every customer provides advanced prediction of his/her demand during a particular period. The POU tariff is composed of a rate based on actual consumption and a rate for the deviation of its previously announced base demand. This type of tariff has not been tested for the coordination of PEV aggregators. Moreover, the influence of uncertainties on demand forecasting has not been considered for the POU tariff determination.
2.3. Contributions
Based on the earlier literature analyzed, the main contributions of this paper are the following:
- A day-ahead POU tariff is proposed based on the optimal load curves of each aggregator previously obtained by the DSO considering the uncertainty related to charging scenarios. The latter is modelled through a Monte Carlo simulation process. This simulation considers the uncertainty of the required energy, the time of arrival, and the time of departure of the PEVs. The POU tariff proposed, unlike the TOU tariffs used in other works, avoids the formation of new demand peaks caused by inadequate economic signals as it is updated daily based on the charging scenarios for the next day.
- The method proposed in this work allows the DSO to optimally coordinate multiple aggregators in order to flatten the load curve of the transformers and to improve the operation of the network. In order to evaluate the grid improvement, the voltage profile, power/energy loses, and the loss of life of the transformer are analyzed. In this sense, a flat demand curve will make it possible to use the existing installation and to improve the reliability of the entire system.
3. The Framework Proposed
The framework proposed determines the optimal load power profiles of the PEV aggregators through the coordination performed by the DSO with the aim of flattening the load curve of the transformers and decreasing the aging rate of these transformers. In addition, the DSO calculates a POU tariff for each aggregator so as to encourage them to follow the optimum load profiles previously determined. These load profiles are generated through a Monte Carlo simulation process to account for uncertainties related to charging scenarios. Figure 1 shows the components involved in the charging coordination.
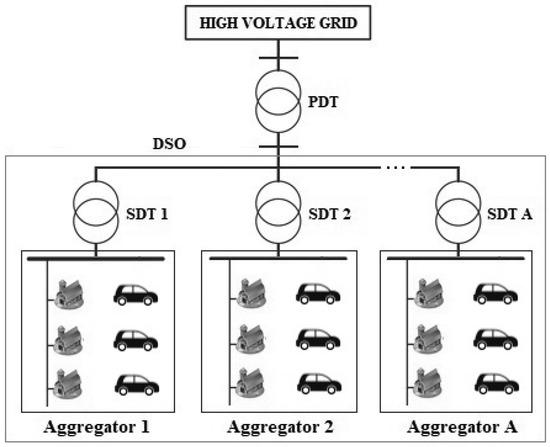
Figure 1.
Components involved in the load strategy.
The flowchart in Figure 2 explains the proposed framework. In the first block, the input data establish the PEV load scenario to undergo an optimization through the proposed framework, considering data about the PEVs, the aggregator, and the distribution network. Subsequently, the limits of power and energy required by the PEVs are calculated by the aggregator for each instance of time (tk) by using these data. Then, these limits are used as constraints in the optimization problem. Based on the PEV energy requirements reported by aggregators to the DSO, the DSO solves the optimization problem for each aggregator. Finally, the optimum total charging power of the PEVs is then obtained in order to flatten the demand curve of each SDT and PDT, as is detailed below.
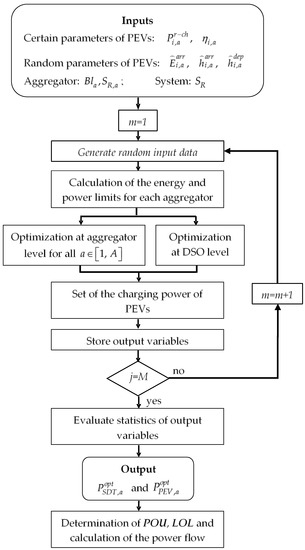
Figure 2.
Block diagram of the framework proposed.
The iterative procedure, shown in the flowchart, represents a first Monte Carlo simulation and must be repeated M times. In each new iteration it randomly generates the input variables , , and in order to obtain M profiles of the optimum PEV charging for each aggregator. Each optimum recharge profile is defined by a power vector of N values, i.e., a charging power value of PEVs for each instance of time tk. In this way, M × N values of PEV charging power are obtained for each SDT, from which an average power profile and two power bands are calculated. The DSO determines a POU tariff with the aim of encouraging aggregators to respond to this charging profile based on these bands, considering the uncertainty in the input data.
Finally, the distribution system characteristics represented by the profile of the voltage, the loss of life of the transformer, and the power/energy losses are calculated to analyze the impact of the approach proposed in the distribution system.
The formulation involved in the main steps of the general framework is presented in greater detail below.
3.1. Estimation of the Aggregator’s Energy and Power Limits for PEV Charging
This step focuses on determining the limits of the required energy and the power of an aggregator—for a set of random variables—based on the charging scenario of the PEVs associated with it. In this work, the energy limits and total power of the aggregator are determined by adding the limits of each PEV for each time interval. Firstly, the upper and lower limits of energy necessary to optimize the PEV charging are calculated through (1)–(5). In order to calculate these limits, it is also necessary to previously have calculated the maximum possible energy to be stored in each PEV at the moment of departure through (1). This maximum energy is determined to be the minimum value between the energy desired (fully charged battery) and the sum of the incoming energy and the energy charged during each time interval. Equations (2) and (5) state that the upper (early charge) and lower (late charge) energy limits are the same when the PEV is not connected for charging. Equations (3) and (4) calculate the lower and upper limits, respectively, when the PEV is connected. In the case of the lower limit, it is determined to be the maximum value between the lower energy limit of the next period minus the energy that was charged during that period, and the incoming energy. Finally, the upper limit is calculated to be the minimum value between the upper energy limit of the previous period plus the energy that was charged in that period, and the maximum possible starting energy.
Secondly, it is necessary to determine the maximum possible PEV charging power for each aggregator at each time interval. That power is determined as the minimum between the sum of the nominal power of the PEV chargers connected simultaneously during time interval tk and the power available to the aggregator in that same time interval. The available power of the aggregator is determined to be the difference between the nominal SDT power and its respective base load. The maximum power for the PEV charging of each aggregator is calculated through (6).
3.2. Optimization at the Aggregator Level
In this stage, the optimization problem is formulated in (7). This problem is responsible for minimizing the SDT load profile and ensures the charging of all the PEVs during the whole operation period. With the solution of this optimization problem, the minimum flat power profile is obtained in each aggregator that meets all the requirements of the PEV users. The PDT load curve resulting from the sum of the load curves of all aggregators coordinated by the DSO will subsequently be flattened.
The first constraint defines the upper limit of the energy required to charge the PEVs of the aggregator, while the second constraint targets the lower limit of such energy. The third constraint defines the power upper and lower limits. Finally, the fourth constraint states that the total demand (base demand and PEV demand) of each aggregator must be equal to the optimum power of the SDT so as to flatten its load curve. Both the needs of the PEV users and the base demand will therefore be met.
Once the optimization problem in (7) has been solved, it is necessary to calculate the power profile of the PDT. This problem determines the optimum power profile for each SDT. This power profile is calculated based on the sum of the SDT profiles associated with each aggregator, as shown in (8). This equation is based on the concept that the sum of each SDT flat power profile produces an aggregate flat power profile at the PDT level.
3.3. Optimization at the DSO Level
The optimization problem presented in this section minimizes the total PDT load profile, as well as ensuring the charging of all PEVs managed by all aggregators. The purpose of this optimization problem is to verify that the sum of all SDT flat power profiles produces a total load curve that must be similar to the one obtained from the solution of the centralized optimization problem at the PDT level, in fact by solving (9).
The first constraint sets the upper limit on the required energy; while the second constraint targets the lower limit of such energy. The total power upper and lower limits are defined by the third and fourth restrictions constraints, respectively. The fourth constraint states that the sum of PEV optimum power and base demand must be equal to the PDT optimum total power in order to meet the needs of each PEV user and the base demand at the minimum possible load of the transformer during daily operation.
3.4. Prediction-Of-Use Tariff by Aggregator
The methodology described in Section 3.1 to Section 3.3 makes it possible to obtain M × N values of PEV charging power for each SDT by means of Monte Carlo simulation. From these M × N values, the mean value µ(tk) and the standard deviation σ(tk) of the PEV power at each interval tk are calculated through statistical analysis. These values of µ(tk) and σ(tk) define an average PEV charging profile and two power bands (upper and lower), determined from µ(tk) ± 2σ(tk). Based on these bands, the DSO determines a POU tariff with the aim of encouraging aggregators to respond to the optimum charging curve, previously calculated by the DSO, by considering the uncertainty in the input data. This procedure determines the POU tariff, which is calculated through (10).
According to (10), the POU tariff is composed of two terms, explained below. The first term represents a base charge that the aggregator must pay to the DSO for all the energy consumed. The second term is a penalty charge applied when the aggregator’s power profile is outside the previously established power band.
To better understand the POU tariff, the aggregator payment in each case of (10) is discussed here. For the case where , the aggregator will pay for all the energy consumed at the value of and will not have to pay any penalty since its consumption is within the power bands defined by the DSO. For the case where , the aggregator will pay for all the energy consumed at the value of and a penalty for the excess energy consumed outside the upper power limit at the value of . Finally when , the aggregator will pay for all the energy consumed at the value of and a penalty for the excess energy consumed outside the lower power limit at the value of .
Based on this, and considering that the power bands take into account the uncertainty in the input data, the aggregator is penalized, since the sum of the PEV charging power profile and the base demand in the transformers will not be flat when exceeding the power band.
Unlike other dynamic tariffs (TOU, CPP, among others), the POU tariff proposed in this work does not generate new demand peaks, since it does not displace the load to other hours. Instead, it is defined according to an optimum PEV charging curve previously calculated, with the aim of flattening the total demand curve.
The practical implementation of a POU tariff involves changes in the regulatory framework, mainly associated with the introduction of aggregators as new agents of the electricity sector, and the availability of advanced measuring infrastructure, information and communication technologies between PEV owners, aggregators, and DSO. Both regulatory changes and new technologies are mainly associated with the development of smart grids, a subject that is widely studied and implemented around the world nowadays. For instance, the Act on the Digitization of the Energy Transition encourages the introduction of smart meters and provides a secure communication platform for the transition from current distribution networks to smart grids in Germany [23]. Regarding the changes in the regulatory framework, several EU member states have implemented aggregators with different degrees of technical capabilities [24,25].
Likewise, the International Energy Agency (IEA) developed a roadmap for the implementation of smart grids, which stresses that smart grids are necessary to ensure the security of energy, the development of economy and environmental mitigation. In addition, they promote demand-side management and integrate renewable energy sources, storage systems, electric vehicles as well as increasing efficiencies [26].
Finally, in [27] a business model called Energy Supplier 2.0 is proposed. The POU tariff proposed in this article could fit under this business model, which has proven to lead to profit generation for DSO, aggregators, and end customers. Moreover, profits for end customers can be obtained from a reduction in energy costs. To promote the aggregation, Energy Supplier 2.0 can offer a better tariff in comparison to the one offered directly by the DSO. As a counterpart, the customer can use the aggregator to manage its PEV charging. The capacity of the aggregator necessary to offer a reduced tariff is based on its better position to have access to energy markets in comparison with an end customer.
4. Case Study
This work uses the same case study described in [6], where the Institute of Electrical and Electronics Engineers (IEEE) 33-bus test distribution grid [28] is considered for that case study. A total of 32 SDTs have been added, each with 12.66/0.38 kV. A 5 MVA PDT supplies the main distribution grid. The 32 aggregators manage the charging of 450 PEVs in 32 low-voltage distribution zones fed by a medium-voltage network. The schematic diagram of the system corresponds to Figure 1 but with 32 aggregators. In addition, it is assumed that the nominal power of charger is 7 kW and it is the same for all PEVs.
On the other hand, the PEV’s battery capacity varies between 40 and 60 kWh, as per real market models, (e.g., Tesla Model S, Nissan Leaf, and BMW i3). In addition, the behavior of the PEVs is stochastic, and the following Gaussian distributions were used: The arrival time is N (20:00, (1 h)2), the departure time is N (7:00, (1 h)2), and the initial state of charge is N (0.6, (0.1)2).
The TOU tariff paid by the aggregators for the energy consumed is 0.138 USD/kWhduring the peak period (8:00–12:00 and 17:00–21:00), 0.109 USD/kWh during the shoulder period (12:00–17:00 and 21:00–24:00), and 0.058 USD/kWh during the off-peak period (0:00–8:00).
To compare the results obtained with the TOU tariff, this work assumes for the POU tariff that the base price and the penalty price in (10) correspond to energy pricing (USD/kWh) in the off-peak period and to the variation in the energy price among the peak and off-peak periods of the TOU tariff, respectively. In fact,= 0.058 USD/kWh and = 0.08 USD/kWh.
Finally, the IEEE aging model [29] and Susa thermal model [30] are used in this work to determine the aging of transformers. The following parameters were adopted as inputs to the 5 MVA Oil Natural Air Natural (ONAN) transformer thermal model (R = 10, τW = 7 min, τTO = 125 min, ΔθTO,R = 55 K, ΔθH,R = 20 K, θA,R = 35 °C). A weather temperature measurement [31] was taken in San Juan, Argentina, on a high temperature summer day. The temperature was between 20 °C at 6:00 to 41 °C at 18:00.
5. Results and Discussion
In this section, the results of the application of the proposed framework in the case study mentioned above are presented. Additionally, a discussion is presented based on the results obtained.
5.1. Results of the Case Study
For the purpose of this study, 1000 Monte Carlo simulations were carried out in order to consider different randomly generated load scenarios. Figure 3, Figure 4 and Figure 5 show the 1000 PEV optimal load power profiles using the framework presented in this article for the PDT and for simplicity for 2 SDTs only. These figures show the 1000 power profiles, rectangular boxes divided by vertical segments indicating the mean value of the distribution and two lines protruding from each box representing the upper and lower bands (maximum and minimum values, respectively), in relation to two standard deviations. Based on this information, the POU tariff is determined for each aggregator, as explained in Section 3.4. It is important to mention that these figures show values outside the established band based on two standard deviations, which are considered atypical values at the mean.
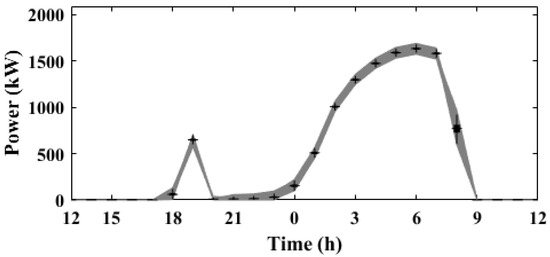
Figure 3.
Plug-in electric vehicle (PEV) power profiles of the primary distribution transformer (PDT).
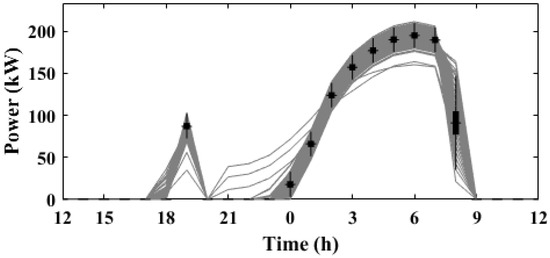
Figure 4.
PEV power profiles of the first aggregator.
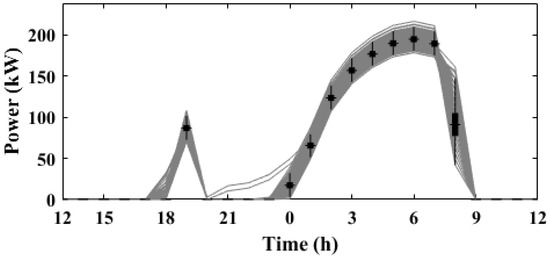
Figure 5.
PEV power profiles of the second aggregator.
Figure 6 shows the base load (BL) of the 33-bus test system together with three power profiles of the primary distribution transformer. On the one hand, two of these profiles are determined to be the sum of the base demand and the PEV charging demand of each SDT, and correspond to both the charging strategy with the coordination proposed in the reference case based on the TOU tariff (STOU) and the strategy proposed in this work based on the POU tariff (SPOU). On the other hand, the third power profile corresponds to the PDT level optimization (SPDT) problem presented in (9). This case shows how to flatten the PDT load curve through the SPOU strategy. This is achieved because the POU tariff previously determined by the DSO encourages aggregators to follow the DSO curve in order to flatten the total demand curve. This will result in the entire distribution system operating optimally. It can also be observed that the SPOU and SPDT profiles are very similar, so it is possible to verify that the sum of the SDT flat power profiles produces an aggregated flat power profile at the PDT level.
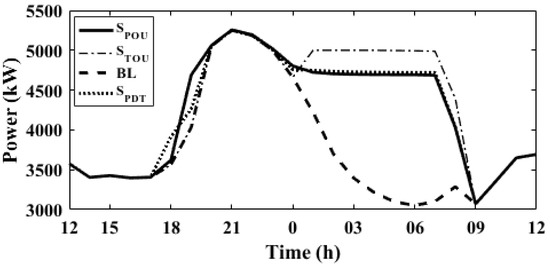
Figure 6.
Primary distribution transformer power profile.
Moreover, Figure 7 shows the upper (EMAX) and lower (EMIN) limits of the energy required, along with the evolution of the energy stored in the PEV batteries (EPOU) resulting from the optimization problem for the 450 PEVs considered in the case study during the 24-hour period. In this figure, the upper energy limit represents early charging and the lower limit represents late charging. As can be seen, all graphs start and end at the same points, which represent the sum of the incoming energy of all PEVs and the sum of the maximum energy that the battery of the PEV can store, respectively. In this sense, the batteries of all PEVs are completely charged by the end of the period. It is important to note that this figure verifies that EPOU is within the energy limits established by the constraints of the problem, at any time interval.
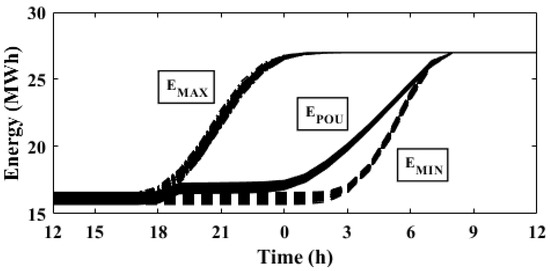
Figure 7.
Energy limits and energy evolution of the entire fleet of PEVs.
With the aim of verifying the effects of uncertainty on the prediction of the optimum curves, and therefore on the definition of the POU tariff for the following day, 1000 simulations were performed again on the payment of the aggregator to the DSO assuming that each of these corresponds to a load curve resulting from the actual operation during PEV charging. For each actual operation curve, the actual payment to be made by the aggregator was determined to be the product of the PEV charging profile and the POU tariff or the TOU tariff, depending on the charging scenario considered. In order to compare the payments of aggregators in the SPOU and STOU strategies, the mean value and standard deviation of the sum of the payments of each the 32 aggregators for the 1000 simulations performed were calculated. Table 1 presents these values. According to this, the payments in each strategy are very similar. This is logical, since the income of the DSO and the aggregator should not be affected by the POU tariff proposed in this paper. Additionally, this table also shows the mean value and standard deviation of the payment for the SPDT strategy, described in problem (9). Table 1 shows that the payments of the SPOU and SPDT strategies are very similar. Therefore, the sum of the SDTs’ flat power profiles, found for each aggregator separately, produces a flat power profile at the PDT level.

Table 1.
Payment for Different Strategies.
In addition, the aging of PDT was determined with the methods presented in [29,30], so as to compare it to the aging caused using the methodology proposed in [6]. To this end, the Hottest Spot Temperature (HST) of the PDT was calculated for both methodologies, shown in Figure 8. This figure shows the HST for strategies based on the POU tariff (HSTPOU) and the TOU tariff (HSTTOU), along with the room temperature (θamb) obtained from measurements taken previously. As this figure shows, HSTPOU is smaller than HSTTOU because there are no peaks in the load curve in this strategy. On the other hand, HSTPOU is not as flat as the load curve, since it does not only depend on the demand but also depends on the room temperature.
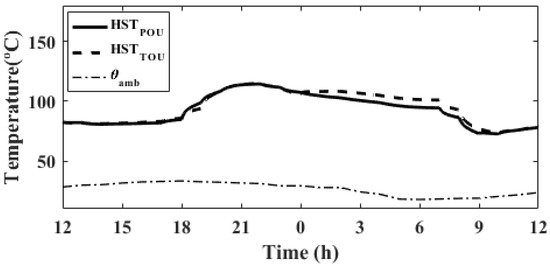
Figure 8.
PDT hot point temperature.
Table 2 presents the loss-of-life values of the primary distribution transformers for both the SPOU and STOU strategies. As can be seen, the charging strategy proposed in this article has lower loss of life (LOL) than the centralized strategy proposed in [6]. This is because the methodology proposed manages to flatten the demand curve of the transformer, so the peak resulting in the STOU methodology is eliminated. To calculate the LOL, the value of the normal insulation life was based on [29], which is 180,000 h.
Table 2.
Loss of Life under Different Strategies.
For the 1000 simulations, Figure 9 shows a boxplot of the magnitude of the voltage under the SPOU strategy for each of the 33 buses of the test distribution system during a day. It has been approved that the voltage deviation is within the acceptable limits for all time intervals, that it is 5% for distribution systems in Argentina.
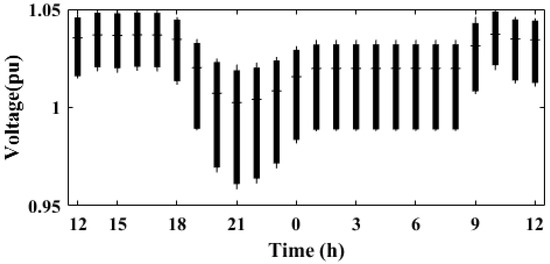
Figure 9.
Profile of the magnitude of the voltage when considering prediction-of-use (POU) strategy.
Finally, in the SPOU strategy, the power losses during the off-peak period are approximately 40 kW (18%) lower than those computed with the methodology proposed in [6], i.e., through the STOU strategy. This can be seen in Figure 10, which shows the comparison of the daily power loss profiles between SPOU and STOU strategies. In addition, the computed daily energy losses (i.e., the area below the power loss profiles), are 4.12 MWh and 4.33 MWh for SPOU and STOU strategies, respectively.
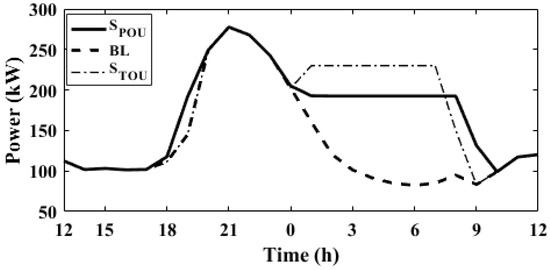
Figure 10.
IEEE 33-bus distribution grid power losses under SPOU, STOU and base load (BL).
5.2. Discussion
The main findings derived from the analysis of the previous section show that the POU tariff proposed reduces the impact of the PEVs charging in the distribution networks, since it flattens the load profile and improves the performance of the entire distribution system. This can be verified by the analysis of the magnitudes of the voltage deviation that are within the acceptable limits for all the time intervals. In addition, the energy losses results show a 5% reduction when deploying the POU strategy compared to the case when the strategy based on TOU tariff is deployed. Moreover, the methodology presented in this article also reduces the daily LOL percentage of the PDT.
Additionally, the POU tariff does not generate new demand peaks since it does not force the connection of the PEV load in fixed time intervals; this is the case for the TOU strategy. This advantage is achieved because POU tariff is defined for the day ahead based on a forecast of PEV charging with the aim of flattening the total load profile.
Despite the advantages of the POU tariff, mentioned above, it is necessary to make changes to the current distribution systems and their regulations for subsequent application. In this sense, smart meters and wall boxes should be installed for the end customers to inform the aggregators about PEV charging requirements, so these can control the PEV charging. Regarding regulatory modifications, a business model that considers the three agents involved in this methodology (aggregator, end customer, and DSO) should be designed. This type of business model is proposed in [27], where costs and profits of each agent are included. Actually, the proposed POU tariff could be applied in any distribution system with the implementation of these technologies currently developed in several countries in the world.
6. Conclusions
This article proposes a methodology for determining a day-ahead POU tariff for each aggregator according to its optimum load profiles. It considers the uncertainty in both the arrival and departure times and the energy needed by PEVs connected to each aggregator. This POU tariff encourages aggregators to follow the PEV optimum charging curve previously determined by the DSO, so the total demand curve of each transformer is flattened. In addition, the POU tariff proposed in this work does not generate new demand peaks since it does not concentrate the energy supply of flexible loads in pre-established time bands, as is the case with the TOU tariff. This is because the POU tariff is updated daily based on the charging scenarios for the next day.
Moreover, this methodology makes it possible to optimize the PEV daily charging in order to flatten the demand curve. It minimizes the power limit of the transformers that supply each aggregator, so that a flat load profile can be obtained from the sum of the optimum load power and the base demand. This will meet the needs of the PEV owners.
Additionally, to apply this tariff, it is necessary to install measuring equipment and smart communication and to update the regulations to consider the aggregator as a new agent of the electric power market.
Finally, the results of the case study revealed that the POU strategy application in distribution systems effectively mitigates the expected impacts of the massive charging of PEVs. In this regard, LOL percentage of the transformers was computed to demonstrate that flattening the supplied load profile is useful to reduce this value. Furthermore, it was verified that the magnitudes of voltage remained within the allowable limits. Finally, the computed energy losses were reduced by using the POU strategy proposed in this article compared with the strategy based on TOU tariff.
Future research should analyze other techniques for managing uncertainty that can accelerate calculation times in order to consider other sources of uncertainty in the problem, such as the base demand and the incorporation of distributed generation based on renewable resources.
Author Contributions
The present work brings together projects of the Universidad Nacional de San Juan-CONICET with G.E.C, A.M.S., G.A.R. and A.A.R.; Khalifa University with A.S.A; and Universidad Nacional de Colombia with S.R.R. The project is carried out under the supervision of A.S.A, S.R.R. and A.A.R., PEV charging case analysis is done by G.E.C., A.M.S., A.A.R. and S.R.R.; the solutions are proposed by G.E.C. and A.M.S.; analysis of results is carried out by G.E.C, G.A.R, S.R.R. and A.S.A.; the preparation of the original draft is done by G.E.C., A.M.S. and S.R.R.; the review and editing is done by, A.A.R., A.S.A. and S.R.R.; finally, analysis of the implementation of POU tariff by G.A.R, A.A.R and G.E.C.
Funding
This work was supported by the National Scientific and Technical Research Council (CONICET), and the National Agency of Scientific and Technological Promotion under grant PICT 2015 – 1202. Also, it is supported by Khalifa University under Awards No. kkjrc-2019-trans 2 and FSU-2018-25.
Conflicts of Interest
The authors declare no conflict of interest.
Nomenclature
| i | PEV index |
| a | Aggregator index |
| M | Number of Monte Carlo simulations |
| m | Index of the Monte Carlo iteration, |
| Δt | Time interval, in hours |
| N | Number of time intervals |
| A | Number of aggregators |
| Va | Number of PEVs of aggregator a |
| k | Auxiliary index representing each hour of the time interval, |
| Rated power of the PDT | |
| Rated power of the SDT of aggregator a | |
| Stored energy in PEV i of aggregator a | |
| at the arrival time | |
| Probability density function of | |
| Desired at the departure time | |
| Maximum possible at | |
| Minimum for time interval k | |
| Maximum for time interval k | |
| Arrival time of PEV i of aggregator a | |
| Probability density function of | |
| Departure time of PEV i of aggregator a | |
| Probability density function of | |
| Charging Efficiency of PEV i of the aggregator a | |
| Overall base load for time interval k | |
| Base load of aggregator a for time interval k | |
| Optimum total power of the PDT at time interval k | |
| Optimum power of each of the SDT at time interval k | |
| Optimum total power of PEVs for time interval k | |
| Optimum power of the PEVs of aggregator a for time interval k | |
| Rated power of the charger of PEV i | |
| Charging power of PEV i supplied by aggregator a at time interval k | |
| Maximum power of total charging of aggregator a | |
| Real power of the PEVs of aggregator a at time interval k | |
| Power of the upper band of aggregator a during time interval k | |
| Power of the lower band of aggregator a during time interval k | |
| Power of aggregator a outside the band during time interval k | |
| Base electricity price for the POU tariff | |
| Penalization electricity price for the POU tariff | |
| Payment of aggregator a | |
| BL | Base load |
| CPP | Critical peak pricing |
| DSO | Distribution system operator |
| HST | Hottest Spot Temperature |
| IEEE | Institute of Electrical and Electronics Engineers |
| LOL | Loss of life of transformer |
| ONAN | Oil Natural Air Natural |
| PDT | Primary distribution transformer |
| PEV | Plug-in electric vehicle |
| POU | Prediction-of-use tariff |
| RTOU | Regional time of use |
| SDT | Secondary distribution transformer |
| TOU | Time-of-use tariff |
| V2G | Vehicle-to-grid |
References
- International Energy Agency (IEA). Global Electric Vehicle Outlook 2018; IEA: Paris, France, 30 May 2018. [Google Scholar]
- Cicconi, P.; Germani, M.; Landi, D.; Mengarelli, M. Life cycle cost from consumer side: A comparison between traditional and ecological vehicles. In Proceedings of the Energycon 2014—IEEE International Energy Conference, Dubrovnik, Croatia, 13–16 May 2014. [Google Scholar]
- Feng, B.; Ye, Q.; Collins, B. A dynamic model of electric vehicle adoption: The role of social commerce in new transportation. Inf. Manag. 2019, 56, 196–212. [Google Scholar] [CrossRef]
- Yong, J.Y.; Ramachandaramurthy, V.K.; Tan, K.M.; Mithulananthan, N. A review on the state-of-the-art technologies of electric vehicle, its impacts and prospects. Renew. Sustain. Energy Rev. 2015, 49, 365–385. [Google Scholar] [CrossRef]
- Sanchez, A.; Romero, A.; Rattá, G.; Rivera, S. Smart charging of PEVs to reduce the power transformer loss of life. In Proceedings of the 2017 IEEE PES Innovative Smart Grid Technologies Conference—Latin America (ISGT Latin America), Quito, Ecuador, 20–22 September 2017. [Google Scholar]
- Sanchez, A.M.; Coria, G.E.; Romero, A.A.; Rivera, S.R. An improved methodology for the hierarchical coordination of PEV charging. IEEE Access 2019, 7, 141754–141765. [Google Scholar] [CrossRef]
- Perez-Diaz, A.; Gerding, E.; McGroart, F. Coordination and payment mechanisms for electric vehicle aggregators. Appl. Energy 2018, 212, 185–195. [Google Scholar] [CrossRef]
- Zhang, Q.; Liu, H.; Li, C. A hierarchical dispatch model for optimizing real-time charging and discharging strategy of electric vehicles. IEEJ Trans. Electr. Electron. Eng. 2018, 13, 537–548. [Google Scholar] [CrossRef]
- Shaaban, M.F.; Ismail, M.; El-Saadany, E.F.; Zhuang, W. Real-time PEV charging/discharging coordination in smart distribution systems. IEEE Trans. Smart Grid 2014, 5, 1797–1807. [Google Scholar] [CrossRef]
- Huang, Q.; Jia, Q.S.; Guan, X. A Multi-Timescale and Bilevel Coordination Approach for Matching Uncertain Wind Supply with EV Charging Demand. IEEE Trans. Autom. Sci. Eng. 2017, 14, 694–704. [Google Scholar] [CrossRef]
- Deng, C.; Liang, N.; Tan, J.; Wang, G. Multi-Objective Scheduling of Electric Vehicles in Smart Distribution Network. Sustainability 2016, 8, 1234. [Google Scholar] [CrossRef]
- Xu, Z.; Hu, Z.; Song, Y.; Zhao, W.; Zhang, Y. Coordination of PEVs charging across multiple aggregators. Appl. Energy 2014, 136, 582–589. [Google Scholar] [CrossRef]
- Xu, Z.; Su, W.; Hu, Z.; Song, Y.; Zhang, H. A hierarchical framework for coordinated charging of plug-in electric vehicles in China. IEEE Trans. Smart Grid 2016, 7, 428–438. [Google Scholar] [CrossRef]
- Paterakis, N.G.; Erdinc, O.; Pappi, I.N.; Bakirtzis, G.A.; Catalao, J.P.S. Coordinated Operation of a Neighborhood of Smart Households Comprising Electric Vehicles, Energy Storage and Distributed Generation. IEEE Trans. Smart Grid 2016, 7, 2736–2747. [Google Scholar] [CrossRef]
- Chen, J.; Yang, J.; Zhu, J.; Li, X.; Zeng, S.; Li, Y.; Wang, X.; Tang, Y. An optimal regional time-of-use charging price model for electric vehicles. In Proceedings of the IEEE Power and Energy Society General Meeting, Portland, OR, USA, 5–9 August 2018. [Google Scholar]
- Muratori, M.; Rizzoni, G. Residential Demand Response: Dynamic Energy Management and Time-Varying Electricity Pricing. IEEE Trans. Power Syst. 2016, 31, 1108–1117. [Google Scholar] [CrossRef]
- Maigha; Crow, M.L. Cost-Constrained Dynamic Optimal Electric Vehicle Charging. IEEE Trans. Sustain. Energy 2017, 8, 716–724. [Google Scholar] [CrossRef]
- Xu, Z.; Deng, T.; Hu, Z.; Song, Y.; Wang, J. Data-driven pricing strategy for demand-side resource aggregators. IEEE Trans. Smart Grid 2018, 9, 57–66. [Google Scholar] [CrossRef]
- Huang, S.; Wu, Q.; Zhao, H.; Li, C. Distributed Optimization-Based Dynamic Tariff for Congestion Management in Distribution Networks. IEEE Trans. Smart Grid 2019, 10, 184–192. [Google Scholar] [CrossRef]
- Liu, Z.; Wu, Q.; Oren, S.S.; Huang, S.; Li, R.; Cheng, L. Distribution locational marginal pricing for optimal electric vehicle charging through chance constrained mixed-integer programming. IEEE Trans. Smart Grid 2018, 9, 644–654. [Google Scholar] [CrossRef]
- O’Connell, N.; Wu, Q.; Østergaard, J.; Nielsen, A.H.; Cha, S.T.; Ding, Y. Day-ahead tariffs for the alleviation of distribution grid congestion from electric vehicles. Electr. Power Syst. Res. 2012, 92, 106–114. [Google Scholar] [CrossRef]
- Robu, V.; Vinyals, M.; Rogers, A.; Jennings, N.R. Efficient buyer groups with prediction-of-use electricity tariffs. IEEE Trans. Smart Grid 2018, 9, 4468–4479. [Google Scholar] [CrossRef]
- Deutscher Bundestag. Gesetz zur Digitalisierung der Energiewende vom 29. August 2016; Teil 1 Nr. 43 Bundesgesetzblatt; Deutscher Bundestag: Bonn, Germany, 2016. [Google Scholar]
- Borne, O.; Perez, Y.; Petit, M. Market integration or bids granularity to enhance flexibility provision by batteries of electric vehicles. Energy Policy 2018, 119, 140–148. [Google Scholar] [CrossRef]
- Bertoldi, P.; Zancanella, P.; Boza-Kiss, B. Demand Response Status in EU Member States; Europa EU: Brussels, Belgium, 2016; pp. 1–153. [Google Scholar]
- International Energy Agency (IEA). Technology Roadmap—Smart Grids; IEA: Paris, France, 4 April 2011. [Google Scholar]
- Specht, J.M.; Madlener, R. Energy Supplier 2.0: A conceptual business model for energy suppliers aggregating flexible distributed assets and policy issues raised. Energy Policy 2019, 135, 1–14. [Google Scholar] [CrossRef]
- Baran, M.E.; Wu, F.F. Network reconfiguration in distribution systems for loss reduction and load balancing. IEEE Power Eng. Rev. 1989, 4, 1401–1407. [Google Scholar]
- IEEE Power & Energy Society. IEEE Std C57.91-2011; IEEE Power & Energy Society: Piscataway, NJ, USA, 7 March 2012. [Google Scholar]
- Susa, D.; Lehtonen, M.; Nordman, H. Dynamic thermal modelling of power transformers. IEEE Trans. Power Deliv. 2005, 20, 197–204. [Google Scholar] [CrossRef]
- Romero-Quete, A.A.; Mombello, E.E.; Rattá, G. Assessing the loss-of-insulation life of power transformers by estimating their historical loads and ambient temperature profiles using ANNs and Monte Carlo simulations. DYNA 2016, 83, 104–113. [Google Scholar]
© 2019 by the authors. Licensee MDPI, Basel, Switzerland. This article is an open access article distributed under the terms and conditions of the Creative Commons Attribution (CC BY) license (http://creativecommons.org/licenses/by/4.0/).