Article

Detection of Low Electrolyte Level for Vented Lead–Acid Batteries Based on Electrical Measurements

Faculty of Engineering, University of San Luis Potosí, San Luis Potosí 78290, Mexico
*
Author to whom correspondence should be addressed.
Energies 2019, 12(23), 4435; https://doi.org/10.3390/en12234435
Submission received: 25 September 2019 / Revised: 21 October 2019 / Accepted: 9 November 2019 / Published: 21 November 2019

Abstract

:
It is well known that a low level of electrolytes in batteries produces a malfunction or even failure and irreversible damage. There are several kinds of sensors to detect the electrolyte level. Some of them are non-invasive, such as optical sensors of level, while some others are invasive; but both require one sensor per battery. This paper proposes a different approach to detect the low electrolyte level, which neither requires invasive sensors nor one sensor for each battery. The approach is based on the estimation of the internal resistance of an equivalent electrical circuit (EEC) model of the battery. To establish the detection criterion of the low level of electrolytes, a statistical analysis is proposed. To demonstrate the feasibility of this approach to be considered a valid method, multiple experiments were performed. The experiments consisted of determining how the internal resistance is affected at eight different levels of electrolyte at different aging levels of vented lead–acid (VLA) batteries. The results have demonstrated the feasibility of this approach. Hence, this approach has the potential to be used for the reducing of sensors and avoiding invasive methods to determine the low level of electrolytes.

Graphical Abstract

1. Introduction

Despite the vast research on electrochemical energy storage systems, the lead–acid battery has remained one of the predominant secondary source of power for stationary applications [1]. There are many different types of lead–acid batteries and diverse applications for them [1,2,3]. Therefore, the chosen lead–acid battery for stationary application must meet the following basic requirements regarding the electrolyte level [1]: it should consume low or null water, low maintenance or be maintenance-free, and high-efficiency of charging and discharging, just to mention a few.
The valve-regulated lead–acid (VRLA) batteries are expected to be either maintenance-free and null water consumption; however, in these types of batteries, water loss may also occur [3,4]. Lead–acid batteries that have removable caps for adding water, like vented lead–acid (VLA) batteries, require low maintenance to keep the correct level of electrolytes and the optimum battery performance. VLA batteries are preferred over VRLA batteries since the former have a lifespan from 15 to 20 years, and are often substituted due to their age instead of failure reasons. In this regard, the loss of electrolytes below the minimum level leads to a gradual reduction of performance and, consequently, the battery’s end of life (EOL) [4,5,6,7,8,9]. Other aging mechanisms are: irreversible formation of lead sulfate, electrolyte stratification, positive plate corrosion, shedding, sludging, and internal short-circuits, among others [10,11,12,13]. These phenomena contribute to decrease the available capacity and to modify the battery’s internal resistance (also known as ohmic resistance). Also, the state of charge (SOC) produces ohmic resistance variation [2]. Therefore, the ohmic resistance is strongly related to the aging mechanisms, and those mechanisms can be identified through the ohmic resistance [5,6,7,11,12].
The electrolyte level supervision is an essential task that it is even included in standards for supervising battery banks for stationary applications. Some standards recommend periodic and continuous supervision [14,15,16,17,18], and for stationary applications, continuous supervision is preferred.
If the electrolyte level falls below the minimal level that the battery manufacturers specify, the battery performance will be deteriorated, and serious problems can occur to the battery, such as reducing the battery capacity, the drying out of electrodes, loss of active material, and damaging the battery irreversibly. For example, if the electrodes are exposed to air, they will oxidize, and the battery becomes irreversibly damaged. To fix this problem, diverse solutions have been proposed to monitor the electrolyte level and alarm when the minimum electrolyte level is detected. The solutions to monitor the electrolyte level can be placed into one of two groups: those based on invasive devices (known as invasive methods) and those based on non-invasive devices (known as non-invasive methods) [19].
The invasive methods to monitor the electrolyte level consist of submersible level sensors, which are commonly used in periodical supervision. The drawbacks of these kinds of methods are: (1) The submersible sensor must be installed into the jar and invade the battery, (2) the battery must be perforated and it can modify the battery performance, (3) the submersible sensor can contaminate the electrolytes, (4) the incorrect installation of the submersible sensor can provoke false detection, internal short circuits, and battery damage, (5) a polluted sensor can provoke false detection and, consequently, battery damage. Some methods use submersible sensors with a different design to avoid those common problems [19,20]. Also, these sensors can be configured to monitor the electrolyte level of a battery pack instead of using an extra sensor for each battery [21].
The non-invasive methods to monitor the electrolyte level consist of non-invasive level sensors, which avoid altering the battery. Two examples of these solutions are: (1) methods based on ultrasonic sensors [22], and (2) methods based on pressure sensors [23]. Some drawbacks of these methods are: (i) The battery container must have unique characteristics to allow the proper operation of sensors, (ii) the incorrect calibration of the sensors can provoke false alarms, and subsequently cause battery damage, (iii) a device must be used per battery which increases the final cost of the supervisory system [24].
On the other hand, it is well known that some variables can be identified indirectly. The aforementioned is common when the variable of interest either presents difficulties or is impossible to be measured. In those cases, indirect methods to identify the variable of interest are suitable to be applied. For example, temperature, magnetic flux, oxygen consumption, and so forth, can be estimated using equivalent models, linear observers, artificial intelligence, and experimental curves.
Considering the limitations of physical sensors to identify the electrolyte level and knowing that its identification can be solved by using other variables, this paper focuses on developing a statistical method to detect the low electrolyte level in VLA batteries for stationary applications by using only battery voltage and current measurements. The proposed method is based on an equivalent electrical circuit (EEC) battery model and the influence of the electrolyte level on the EEC parameters.
Table 1 shows a comparison of the attributes given by the proposed method and those commonly used in supervisory systems (for continuous supervision) that monitor the electrolyte level. From Table 1, we show that the proposed method does not need any level sensor, but it fulfills the standards related to monitoring and alarming the electrolyte level.
The rest of this paper is organized as follows. Section 2 describes the used EEC battery model and the relationship that the internal resistance keeps with the water loss. Section 3 deals with the test bench, experimental setup, and procedures needed to characterize the ohmic resistance versus the electrolyte level. Section 4 describes the proposed statistical criterion to detect the low electrolyte level. Section 5 presents the experimental validation results of the proposed and implemented scheme to detect the low electrolyte level. Finally, conclusions are given in Section 6.

2. Equivalent Electrical Circuit (EEC) Model of the Battery and its Correlation with Water Loss

The EEC battery model is shown in Figure 1, and according to references [1,25,26,27], this representation describes the internal electrochemical phenomena of the battery, which is based on its construction. In this equivalent model, v O C represents the battery open-circuit voltage, R 0 represents the bulk electrolyte resistance, also known as the internal resistance or ohmic resistance. The constant-phase element is given by the capacitor C 1 and resistor R 1 , which are used to model the distribution of reactivity representing the electrode properties. Charge transfer resistance R 2 and double-layer capacitor C 2 represent the interfacial impedance of the cell. i d and v B a t t are the battery current and voltage, respectively.
The internal resistance ( R 0 ) of the EEC battery model is the only parameter that can be estimated without disconnecting the battery; instead, only the float voltage mode is needed. In addition to this, this resistance is strongly related to the electrolyte level since the water loss increases the electrolyte concentration, which in turn increases the internal resistance value [4,5,6,9,10,11,12,13,28,29,30]. Consequently, R 0 is the selected indicator in this contribution to detect the low electrolyte level.

3. Experimental Setup for Battery Characterization

The aim of this section is to describe the procedure to estimate parameter R 0 at eight different electrolyte levels, for 44 VLA batteries. First, Section 3.1 describes in detail the test bench. Then, Section 3.2 provides the specifications for selecting electrolyte test levels. After that, Section 3.3 presents the estimation method used to obtain parameter R 0 for a given electrolyte level, and specifies the pulses of current applied to the battery bank to estimate R 0 . Finally, battery model parameter characterization results are presented in Section 3.4.

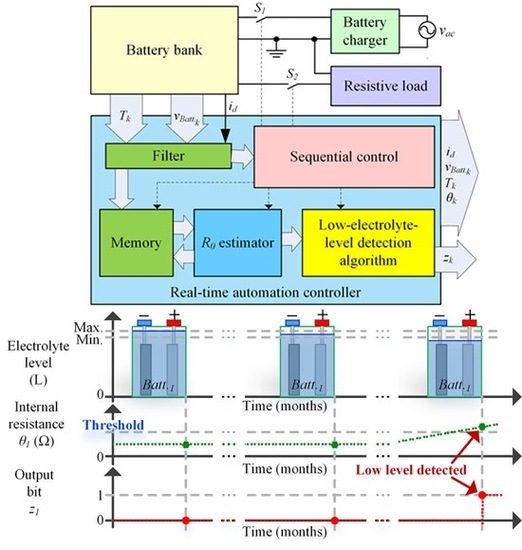
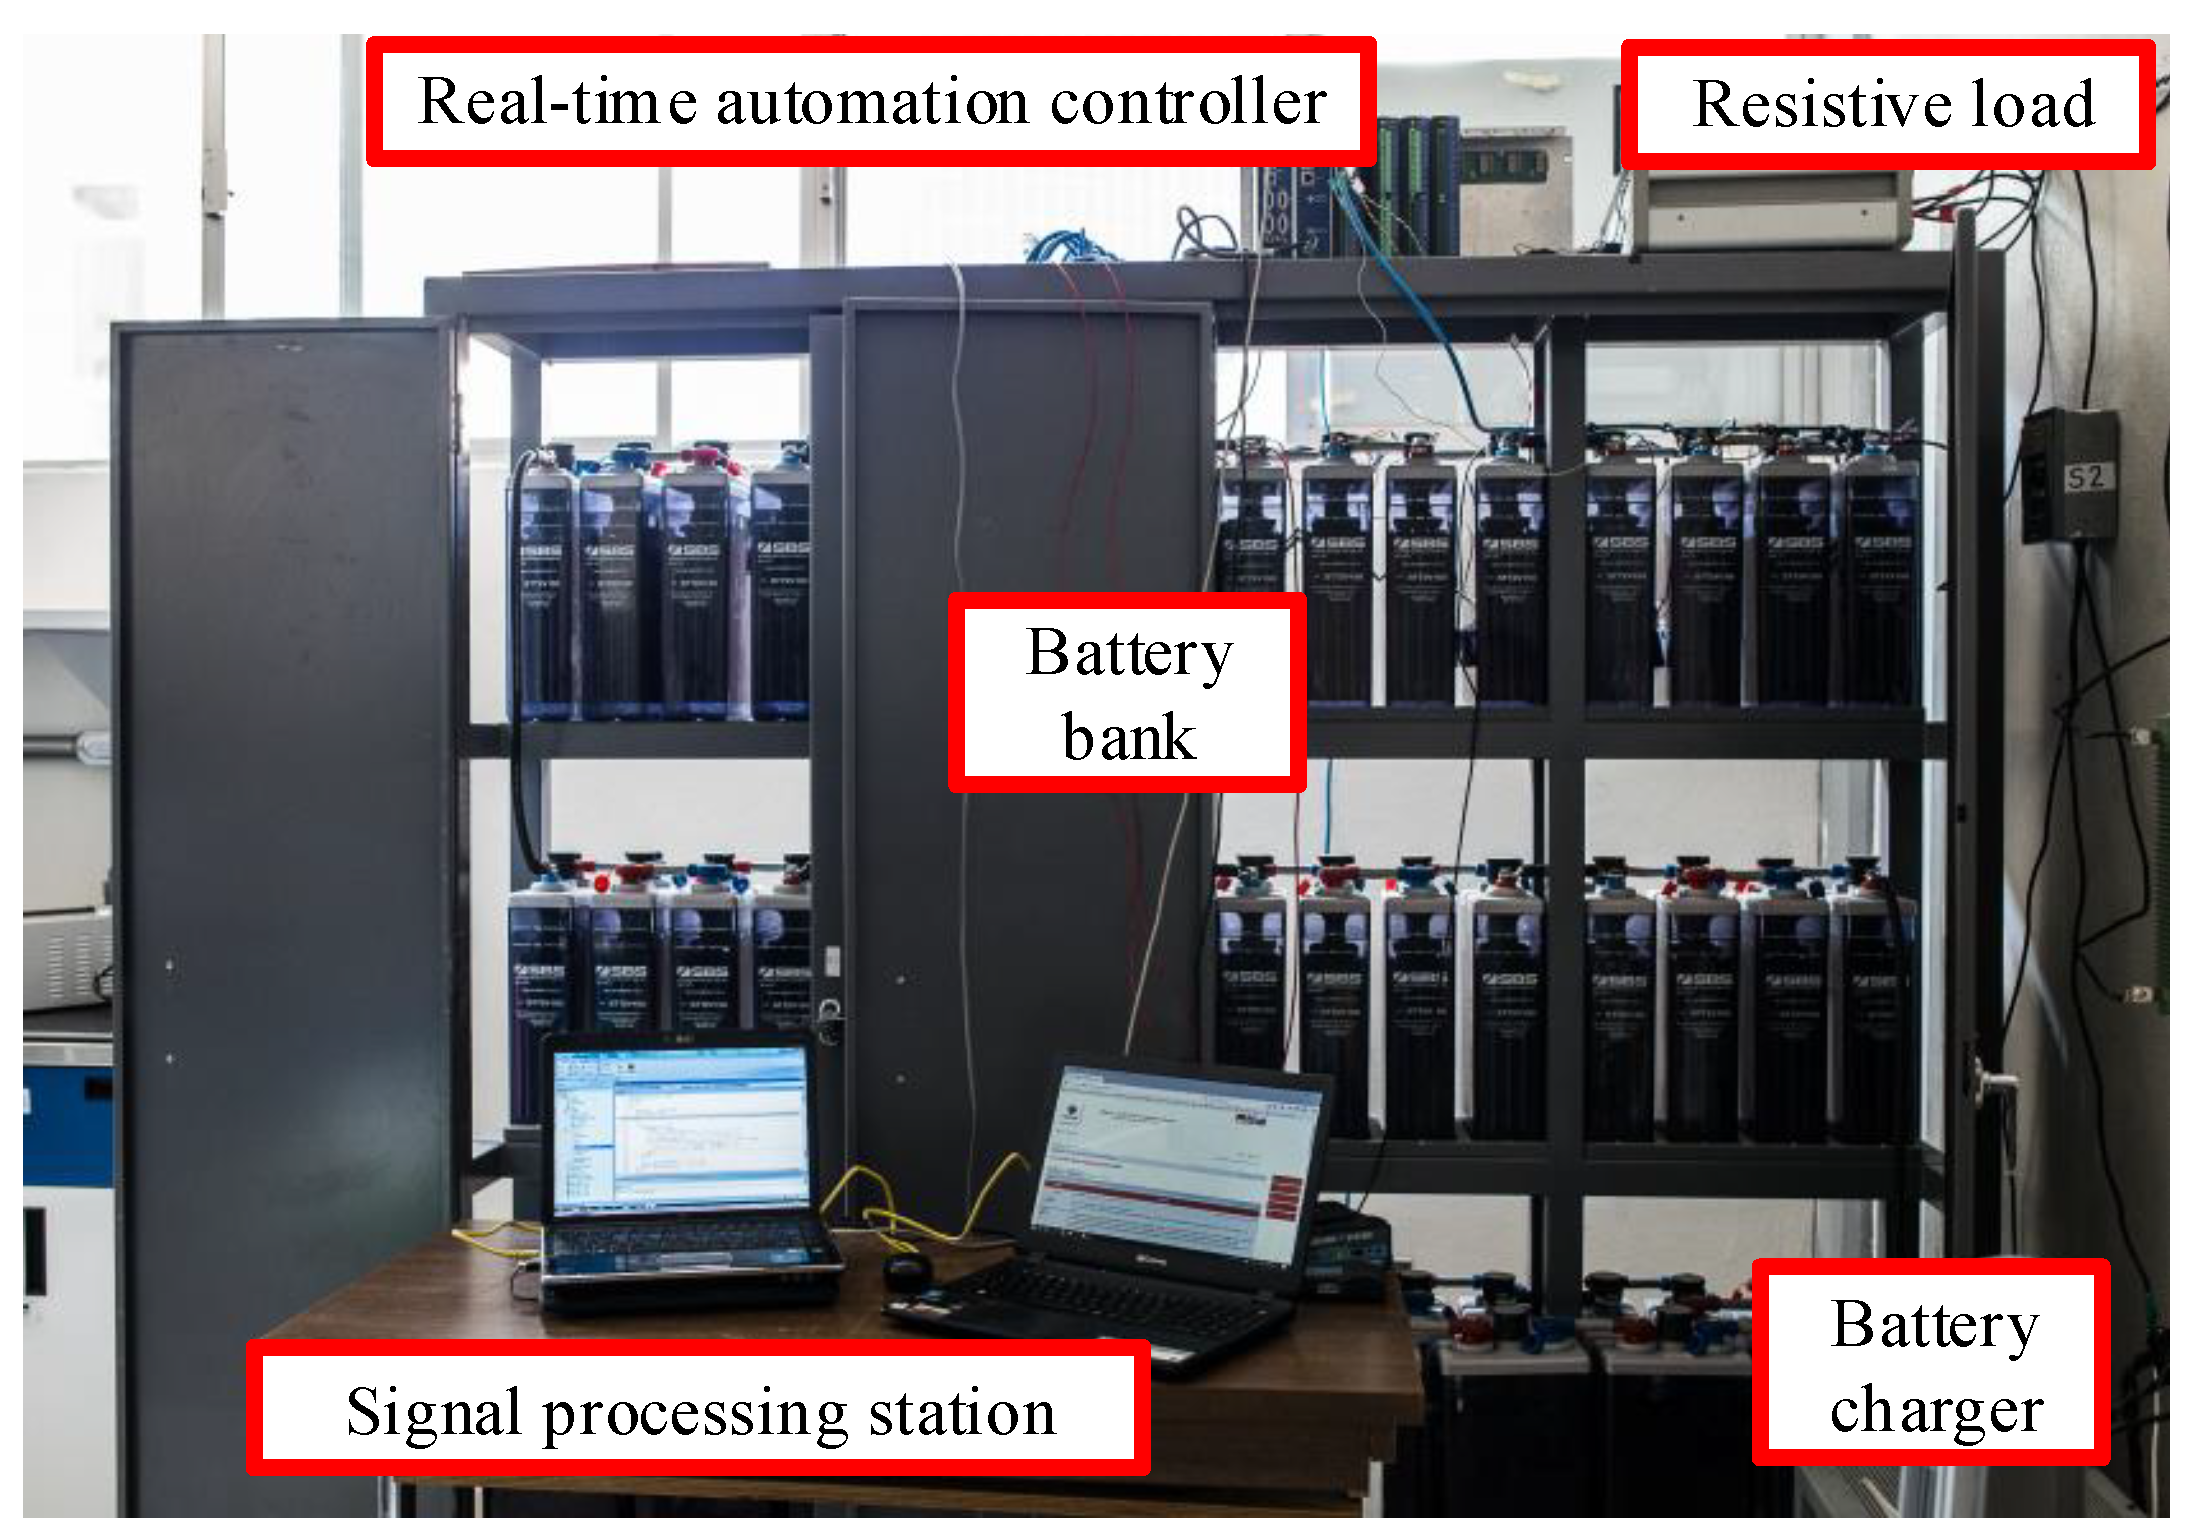
3.1. Stationary Battery Bank and Monitoring System

The experimental setup emulates the conditions of an electrical substation to characterize the R 0 parameter versus the electrolyte level and to validate the proposed low-level detection method. It used a series-connected battery bank with 44 VLA batteries, model STT2V150 (2 V, 165 Ah [31]).
Figure 2 shows the test bench, where a real-time automation controller (RTAC) is used [32]. The RTAC has voltage and temperature sensors to monitor battery voltages and temperatures. The battery temperature was measured on the negative terminal. The current transducer was adapted on the RTAC to monitor the string current. An 8514 programmable DC electronic load and an AT10.1 charger were used. Two relays to switch the charger and the testing load were adapted to the digital outputs of the RTAC. A laptop was used to configure the RTAC and processing data.

3.2. Electrolyte Level Calibration for Battery Characterization

The independent variable was the electrolyte level x given in liters. Figure 3 shows the selected eight setting levels of electrolyte for the battery model used in this research. The n-th electrolyte level will be represented by x n , where n = 1, 2, 3, ..., N. For this battery bank, N = 8 .
According to the battery manufacturer, the levels x 2 and x 8 correspond to the minimum and maximum allowed levels, respectively. The electrolyte level x 1 is a level below the minimum level and, in this level, the optimal performance of the battery is lost.
In this research, 44 VLA batteries were used and each with eight setting levels to characterize their internal resistance R 0 versus the electrolyte level. The level x 1 was set up in each battery by keeping the battery bank in flotation voltage mode until a loss of battery water led to an electrolyte level below x 2 . Level x 1 was different for each battery, since, in the conducted calibration test, they lost water at different rates. Levels x 1 for each battery varied between the 3.81 L to 3.73 L (see Appendix A). x 1 is the first setting level used to characterize the internal resistance. After that, the batteries are refilled to reach the upper levels and characterize their corresponding internal resistances. Once the batteries were refilled and before characterizing the new electrolyte level, the batteries were kept floating for twelve hours to properly integrate the refilled liquid into the acid and thus avoid the electrolyte stratification, which modifies the internal resistance. Additionally, the batteries must stand in open circuit for seven hours before applying the five characterization pulses described in the following subsection. It is worth mentioning that the electrodes never were exposed to air to avoid oxidation. All tests were conducted with the state of charge at 100% and the temperature at 23 ± 2 °C in each battery.

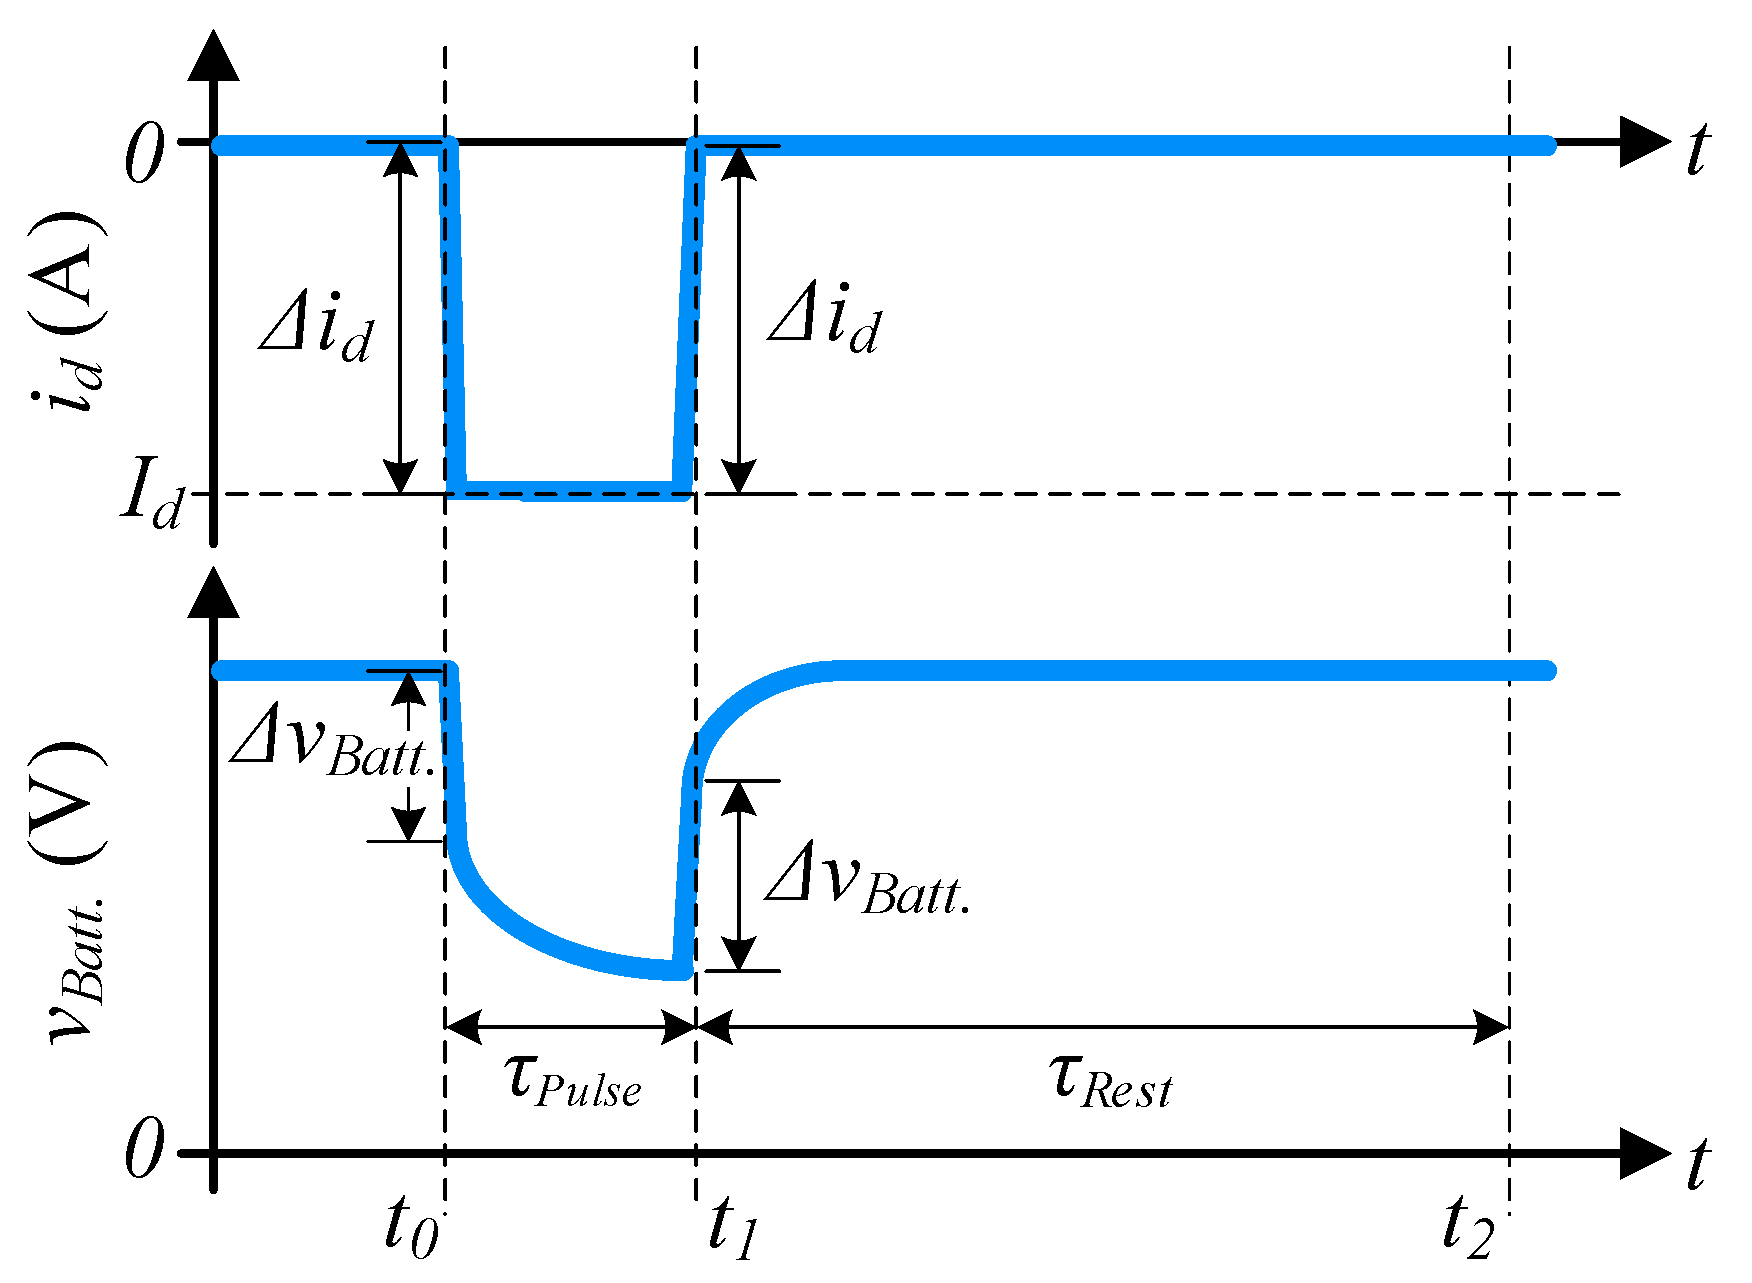
3.3. Method to Estimate R 0

Parameter R 0 is estimated as follows [8,25,26,27,33,34]: firstly, a discharge pulse of constant current amplitude ( I d ) is applied from t 0 to t 1 during 10 s ( τ P u l s e = 10 s), as shown in Figure 4. Battery voltages, and string current measurements from t 0 to t 1 are recorded and, R 0 of each battery is estimated by Equation (1). We should mention that Δ v B a t t . and Δ i d are obtained in the linear segment of the transients to avoid capturing the charge transfer phenomenon and inaccurate estimation.
R 0 = Δ v B a t t . Δ i d .
On the other hand, to estimate the parameters R 1 , C 1 , R 2 , and C 2 , the battery bank must be set in a zero current condition; however, this condition is achieved by disconnecting the battery bank, which is a condition highly forbidden for electrical substations. Even though these parameters are not eligible to detect the low electrolyte level, their estimation method is presented to justify the reason. The charge transfer phenomenon depicted by the recovery voltage curve from t 1 to t 2 (resting period τ R e s t = 1 h, in Figure 4) is used to estimate parameters R C , whereas R 0 is estimated using Δ i d and Δ v B a t t . Due to the order and characteristic response of the EEC, the transient response is fitted to an exponential function given in Equation (2). The coefficients a, b, c, and d are calculated using the curve fitting toolbox on MATLAB® (R2015b). Then, parameters R C are obtained with expressions in Equation (3).
v B a t t . ( t ) | t = t 1 t 2 = a e b t + c e d t
R 1 = - a I d , R 2 = - c I d , C 1 = - 1 b R 1 , and C 2 = - 1 d R 2 .
The R 0 estimation is conducted at different amplitudes of current i d , around the nominal load current, to estimate the internal resistance profile over the operating current range. However, if the load current were quasi-stationary, this estimation process is performed only once. The characteristic average internal resistance value, defined as θ k ( x n ) , is given by the following expression:
θ k ( x n ) = m = 1 M R 0 k , m ( x n ) M
where k indicates the k-th battery in the string (k = 1, 2, 3, ..., K), K is the total number of batteries in the battery bank, m indicates m-th discharge pulse (m = 1, 2, 3, ..., M), and M is the total number of discharge pulses for electrolyte level x n . For this particular battery bank K = 44 and M = 5. R 0 k , m ( x n ) represents the ohmic resistance of k-th battery and m-th pulse at electrolyte level x n . Figure 5 illustrates the profile of the string current i d with the five consecutive discharge pulses and their amplitudes. All the obtained values of R 0 k , m ( x n ) and θ k ( x n ) are listed in the following web page: https://aroholl15.wixsite.com/experimentaldata.

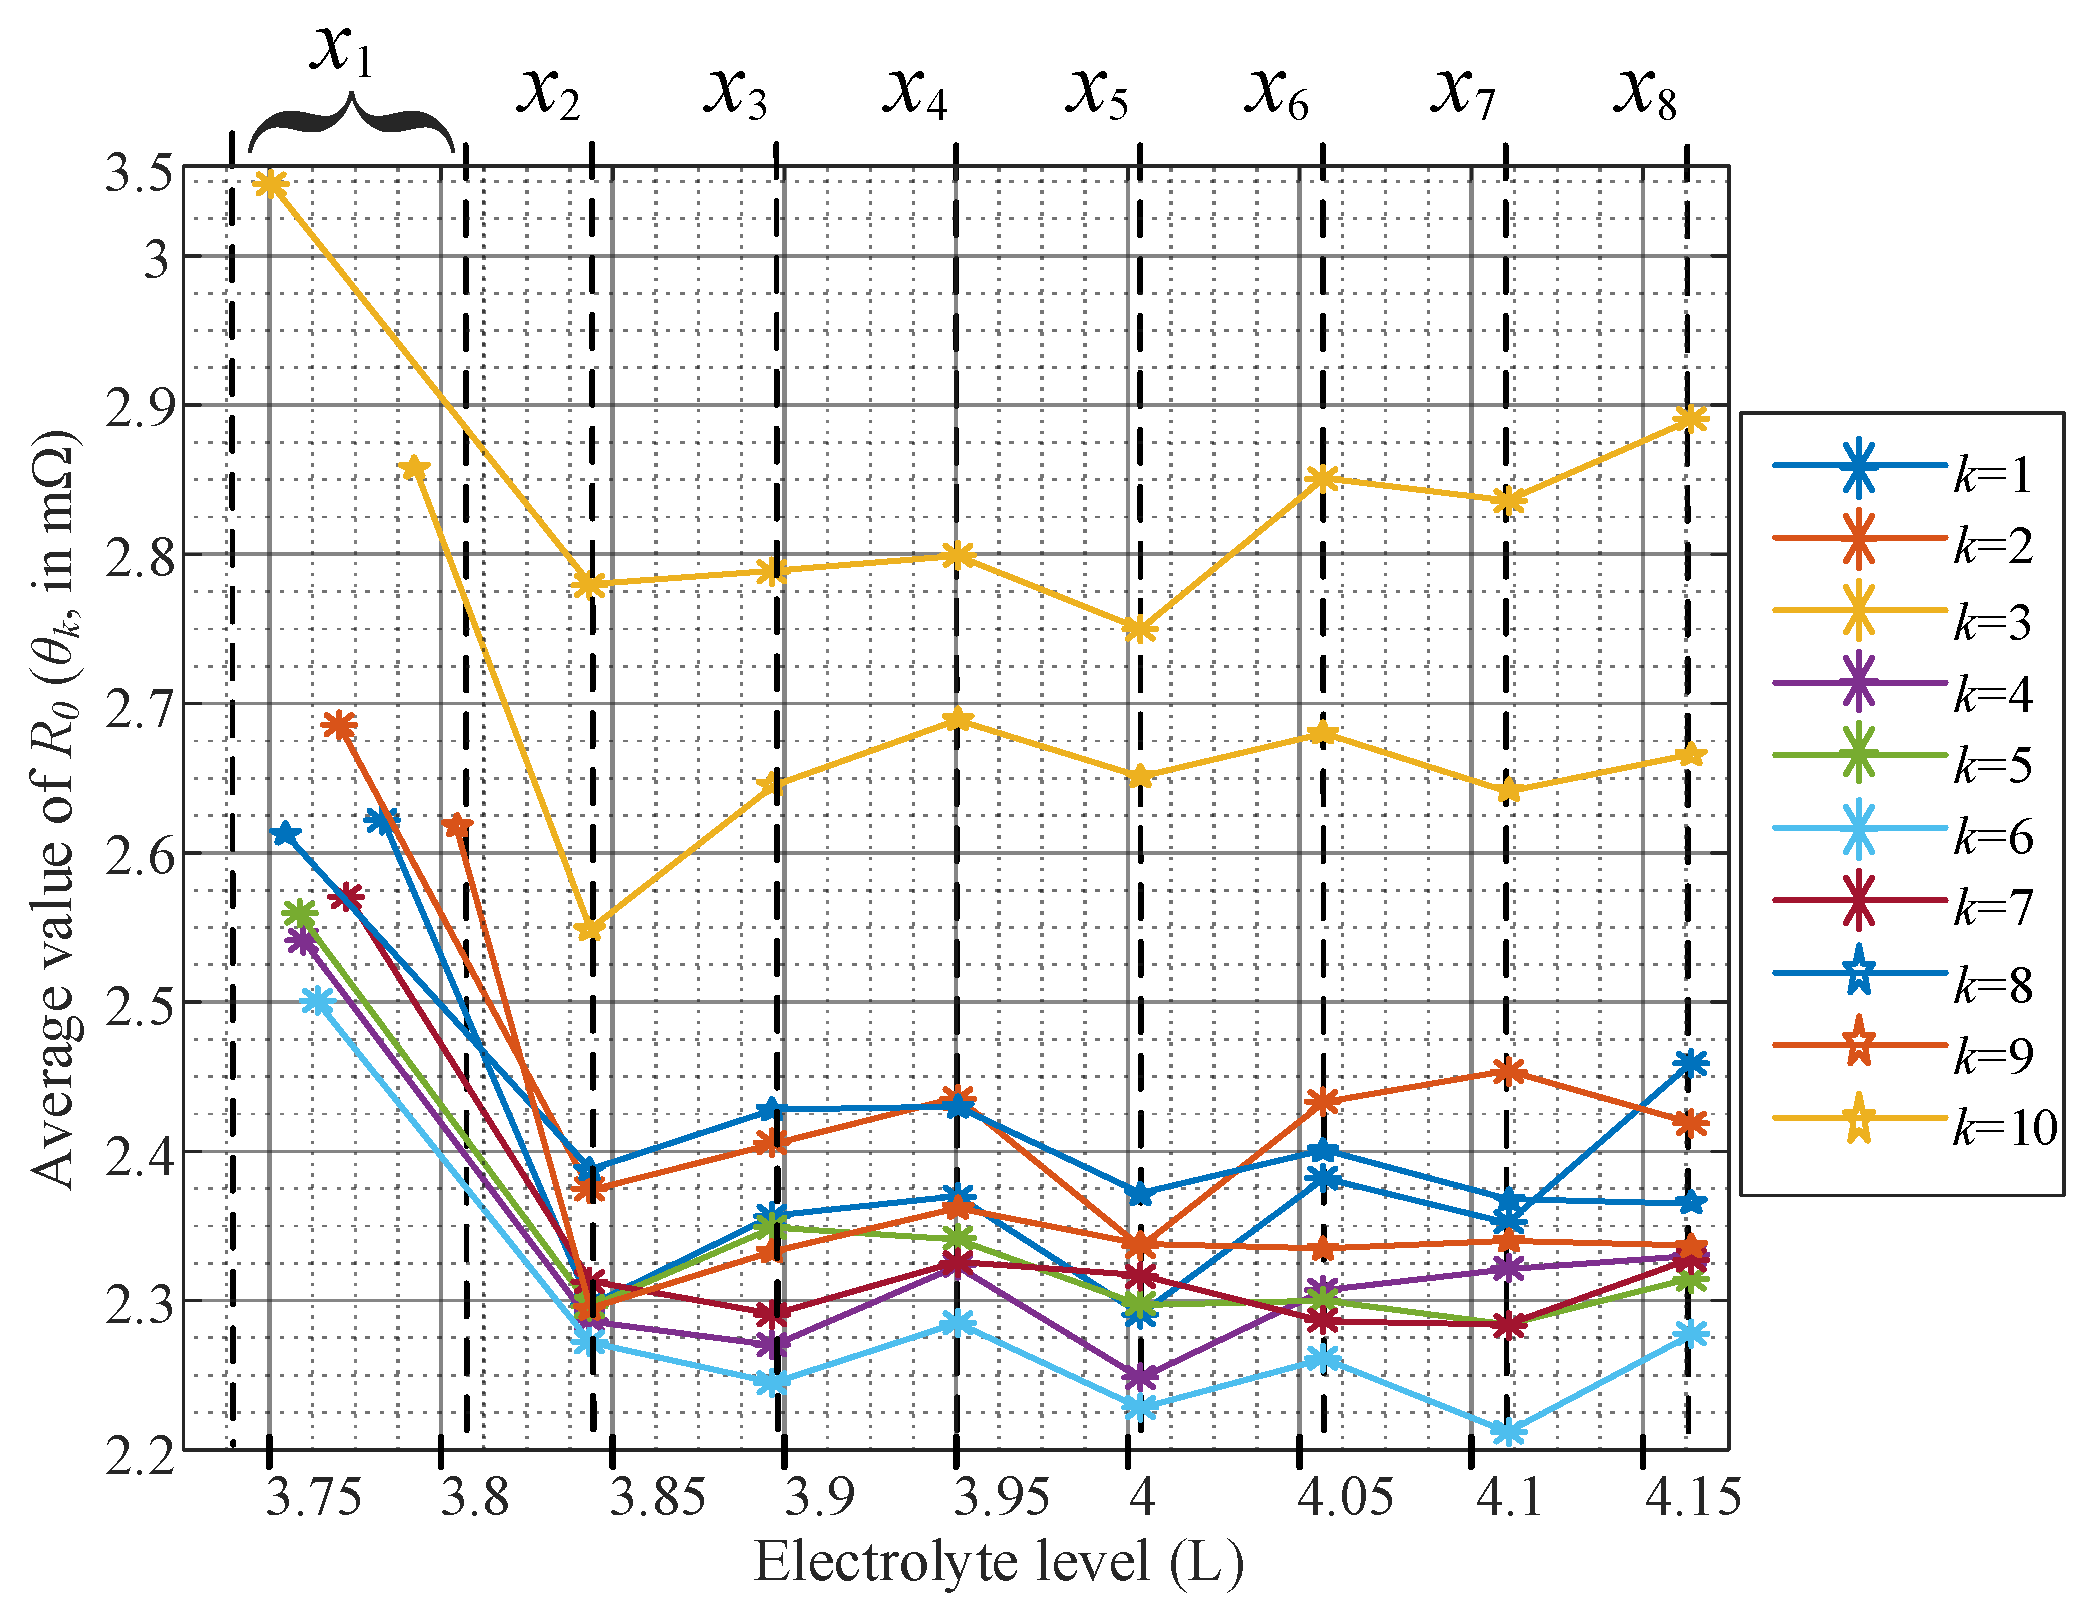
3.4. Battery Model Parameter Characterization Results

Only the values of θ k ( x n ) are needed to detect the low level of electrolytes. The obtained values θ k ( x n ) of the 44 VLA batteries are listed in Table A2 (see Appendix B). Please notice that θ k ( x 1 ) is always the biggest as compared with the subset { θ k ( x 2 ) , . . . , θ k ( x 8 ) } in all cases. Also, Figure 6 shows the variation of internal resistance according to eight electrolyte levels for the first ten batteries. Figure 6 shows the electrolyte levels x n and the scale in liters at the top and bottom axes, respectively.
These experimental results reveal that the capacity of conducting current diminishes when the electrolyte level is below the x 2 level since the average internal resistance θ k ( x n ) increases in all cases at x 1 . Notice in Figure 6 that for the k-th battery, θ k ( x n ) varies slightly for n = 2, 3, ..., 8; however, θ k ( x 1 ) is in all cases higher than θ k ( x n ) for n = 2, 3, ..., 8. Bare in mind that θ k ( x 1 ) corresponds to the low electrolyte level, below the reserve level. Therefore, the θ k ( x n ) estimation allows us to detect this undesirable condition using only current and voltage measurements, without employing extra sensors. The θ k ( x n ) profiles across the different electrolyte levels ( x n ) are different for each battery. These differences are attributable to the unequal degree of aging of each battery. Table A1, in Appendix A, shows the degree of aging represented by the available capacity Q A (in Ah).

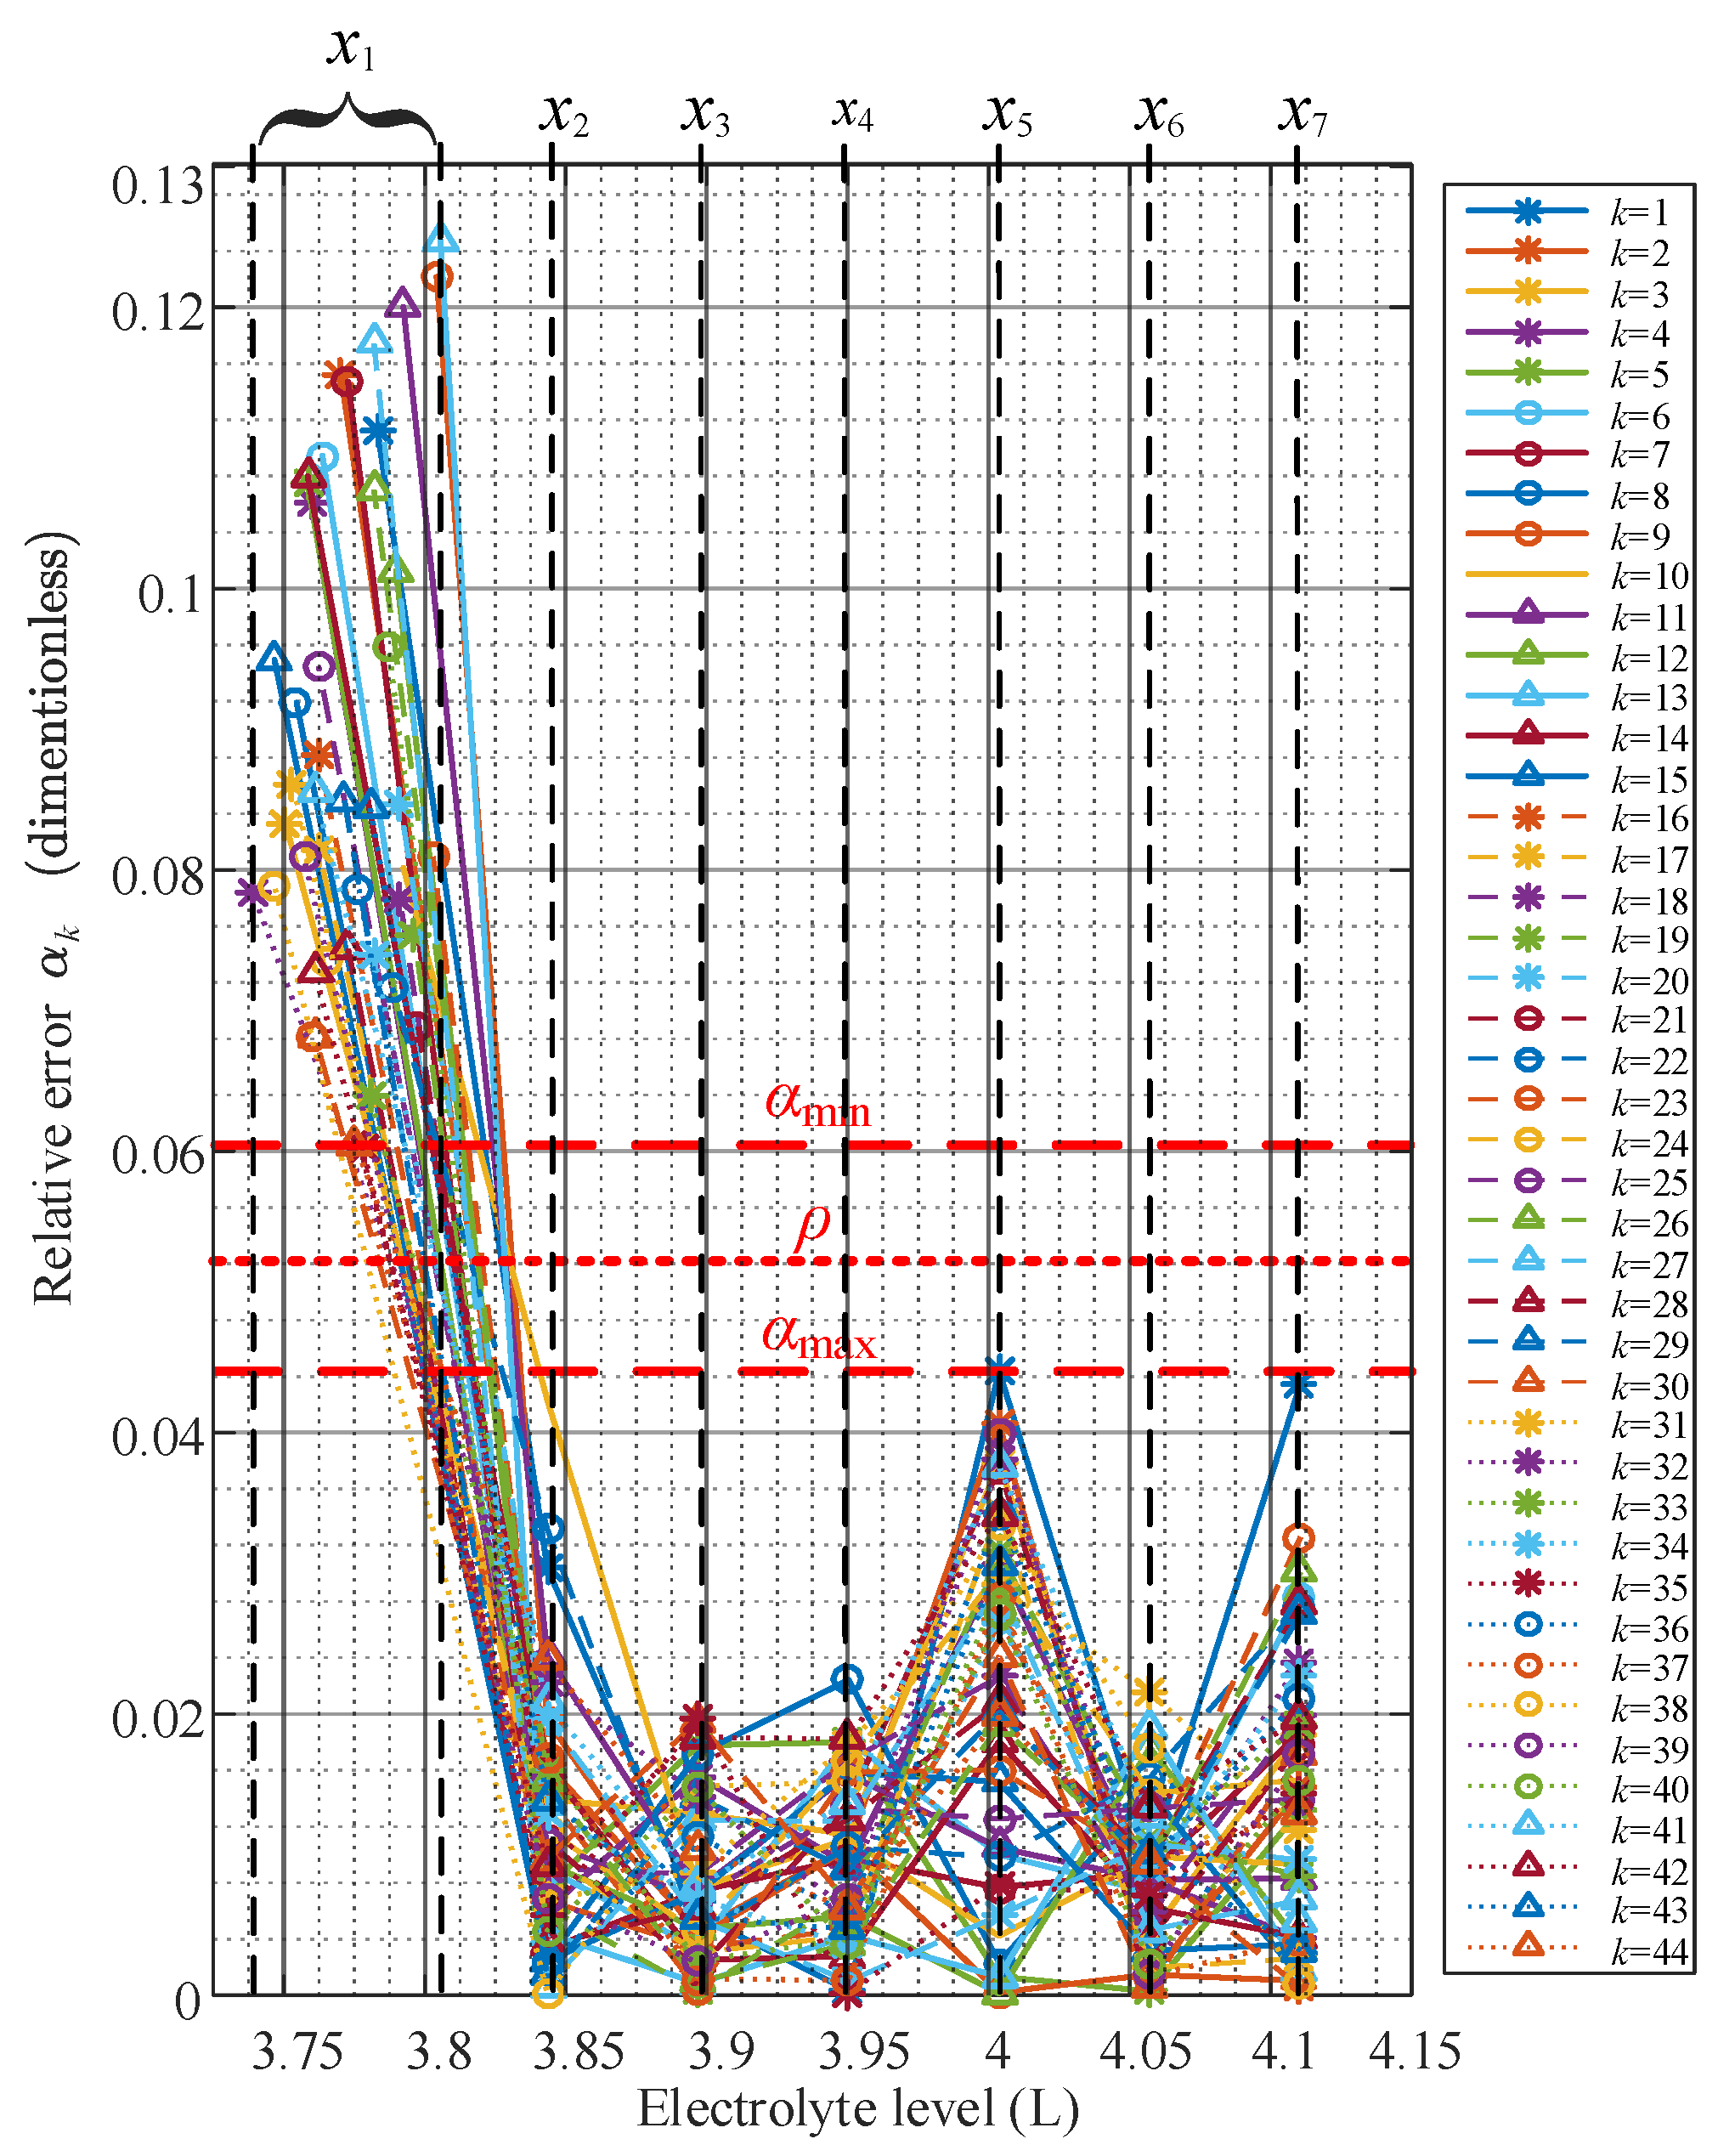
4. Statistical Criterion to Detect Low Electrolyte Level

This section describes the proposed statistical criterion to detect the low electrolyte level. Since the θ k ( x n ) profiles of each battery are different, the first two-step stage consists of preprocessing the data using a proposed statistical approach:
a.
Firstly, define μ k ( q ) as the cumulative moving average of θ k ( x n ) between the electrolyte levels x N and x q + 1 , as follows:
μ k ( q ) = 1 N - q n = q + 1 N θ k ( x n ) , for q = 1 , 2 , . . . , N - 1 .
b.
Then, calculate the relative error α k ( x q ) of θ k ( x q ) defined by the following expression:
α k ( x q ) = θ k ( x q ) - μ k ( q ) μ k ( q ) , for q = 1 , 2 , . . . , N - 1 .
According to Equation (6), the proposed relative error means the normalized error of θ k ( x q ) respect to the its cumulative moving average value ( μ k ( q ) ). This is to say, if the θ k ( x q ) is constant for all electrolyte level, α k ( x q ) is zero. In regards with the study case, Figure 7 shows α k ( x q ) of all batteries.
Notice from Figure 7 that for all batteries, despite their different characteristic average internal resistance profiles, α k ( x q ) remain bounded below a maximum boundary α max for all reserve electrolyte levels ( x n for n = 2, 3, ..., 8). In addition, α k ( x 1 ) remains above a minimum boundary α min . Thereby, α max and α min are used to establish a limit to discriminate between the reserve electrolyte levels and the undesirable low electrolyte level condition ( x 1 ).
The limits α min and α max are calculated as follows:
α min = min { α 1 ( x 1 ) , α 2 ( x 1 ) , . . . , α K ( x 1 ) }
α max = max { α 1 ( x q ) , α 2 ( x q ) , . . . , α K ( x q ) } , for q = 2 , 3 , . . . , N - 1 .
The proposed relative error makes easier to detect the low electrolyte level x 1 . The main advantage of using the proposed relative error is that only one criterion is needed to detect the low electrolyte level. The discrimination limit ρ (dimensionless) is obtained by the following expression:
ρ = α max + α min 2 .
For this particular case α min = 0.06022, α max = 0.04004, and ρ = 0.05013.
To explain how the criterion works, assume that the criterion is evaluated every period τ . Thus, we define the integer r to indicate the number of times in which the average value θ k ( x n ) and the criterion have been evaluated. Therefore, the criterion is described as follows:
Use current and voltage measurements to obtain the r-th average value of internal resistance, which for the experimental valiation is defined by the following expression:
θ k [ r τ ] = θ k ( x )
where x is an unknown electrolyte level at the r-th evaluation. When r = 0 (at the start-up), only the value of θ k [ 0 ] is obtained. For r > 0, obtain θ k [ r τ ] , its cumulative moving average η k [ r τ ] , and its threshold w k [ r τ ] , which are defined in the following expressions:
η k [ r τ ] = 1 r j = 0 r - 1 θ k [ j τ ]
w k [ r τ ] = 1 + ρ η k [ r τ ] .
Therefore, the criterion dictates that the low electrolyte level is detected in the k-th battery if θ k [ r τ ] > w k [ r τ ] .
We defined output bits z k [ r τ ] to indicate if the electrolyte levels are below the level x 2 (minimum level) in the VLA batteries or within the reserve of electrolytes. Then, the state of the output bits at every instant r τ is defined by the following expression:
z k [ r τ ] = 0 Electrolyte level within the reserve 1 Alarm for detecting the low electrolyte level .
We list the following considerations to start-up the proposed criterion:
i.
Verify that the electrolyte level in each battery is within the reserve level. If not, refill the battery up to the maximum level.
ii.
Fix the sampling period τ . For these VLA batteries (2 V, 165 Ah, model STT2V150 [31]), τ = 10 days considering that electrolyte level decreases from x N to x 2 in around 2.5 months.
iii.
Set z k [ 0 ] = 0 as the initial condition, to indicate that the electrolyte level is within the reserve level.

5. Experimental Validation of the Criterion to Detect the Low Electrolyte Level

Experimental validation of the criterion was conducted emulating the operation of an electrical substation. To obtain the ohmic resistance R 0 , the system automatically switches the testing load to generate the five consecutive discharge pulses when the batteries are fully charged and the steady-state is detected. Proper float voltage and constant temperature were set to avoid the presence of other aging mechanisms that causes a change in the ohmic resistance. We used a battery bank in series connection with six STT2V150 VLA batteries to conduct the experiment. These six VLA batteries are not the same used for the characterization process. We enumerate these six batteries with the consecutive numbers k = 45, 46, 47, 48, 49, and 50, respectively. During the characterization process and experimental validation of the criterion, the temperature was controlled close to 23 °C in each battery.
Figure 8 illustrates the block diagram of the implemented system, where T k is the measured temperature of the k-th battery, v B a t t . k is the measured voltage of the k-th battery, i d is the string current, and S 1 and S 2 are relays to control the battery charger and the load. The outputs are the voltage, the current and the temperature, the average value of the internal resistance θ k [ r τ ] of the k-th battery, and the bits z k [ r τ ] used to indicate the detection of the low electrolyte level for the k-th battery.
Figure 9 shows experimentally obtained results θ k [ r τ ] , w k [ r τ ] , and z k [ r τ ] . The continuous lines plot θ k [ r τ ] , the dashed lines represent w k [ r τ ] , and the dots depict the output bits z k [ r τ ] , for batteries from k = 45 to k = 50. The experimental results validate the low electrolyte level criterion successfully even though the full validation experiment took 70 days, and the characterization process only lasted eight days.
The average internal resistances from θ 45 [ r τ ] to θ 50 [ r τ ] for 0 r 6, in Figure 9, correspond with the reserve level seen between x 8 and x 2 in each battery. These experimental results confirm that the θ k [ r τ ] values vary slightly when the electrolyte level is within the reserve level, and abruptly changes when the electrolyte level is below the defined minimum level x 2 at 7 τ = 70 days. Notice that the values of the threshold from w 45 [ r τ ] to w 50 [ r τ ] also vary slightly while the electrolyte level is within the reserve level and, in the instance of 7 τ = 70 days, θ k [ 7 τ ] > w k [ 7 τ ] for the six batteries. Therefore, the bit values from z 45 [ r τ ] to z 50 [ r τ ] remain zero until the values of θ k [ 7 τ ] exceed w k [ 7 τ ] , and z k [ 7 τ ] becomes 1, and a low electrolyte level is detected in each battery. Finally, despite the fact that the batteries loss water at different rates, that electrolyte levels were different in each battery at each instance r τ , and batteries had different degrees of aging, the low electrolyte level is only detected when the level is below the reserve of electrolyte in each battery. This fact demonstrates that if batteries are operated appropriately, and the temperature is regulated in each battery, the low electrolyte level can be detected by estimating the ohmic resistance through electrical measurements due to the fact that the capacity of the conducting current diminishes if the electrolyte level is low. Therefore, in this research and for a specific application, we dismissed the usage of level sensors to detect the low electrolyte level in VLA batteries.

6. Conclusions

This paper presents a complete theoretical development based on the battery internal resistance estimation to detect low electrolyte levels, and its experimental validation, with the premise of avoiding level sensors for achieving the continuous supervision scheme required by standard PRC-005-2. The disadvantages related to the use of extra sensors are consequently ruled out with the proposed continuous battery supervision scheme. The experimental results support the hypothesis of using the battery’s internal resistance for detecting the undesirable low electrolyte level condition.
The proposed criterion was tested in a bank of 50 batteries with a capacity of 165 Ah, and 2000 experiments were conducted to validate the feasibility of the method, obtaining in all cases, results that confirm the reliability and robustness of the proposed and implemented criterion.

Author Contributions

Conceptualization, E.C. and C.N.; formal analysis, N.V.; investigation, E.C., J.S., J.C., and D.M.; methodology, E.C. and N.V.; project administration, C.N.; software, J.C.; supervision, C.N.; visualization, J.S. and D.M.; writing—original draft, E.C., C.N. and J.S.; writing—review and editing, J.S., J.C., and D.M.

Funding

The authors would like to thank funds from CONACyT, with project number A1-S-29705 and scholarship number 209440.

Acknowledgments

The authors would like to thank the technical and infrastructure support from Schweitzer Engineering Laboratories for the development of this work.

Conflicts of Interest

The authors declare no conflict of interest. The funders had no role in the design of the study; in the collection, analyses, or interpretation of data; in the writing of the manuscript, or in the decision to publish the results.

Appendix A. Water Loss, Volume at Level x1, and Available Capacity of the 44 VLA Characterized Batteries

The water loss, the volume of electrolyte at level x 1 , and the available capacity ( Q A ) of each battery are listed in Table A1. Water loss is measured from level x 8 to level x 1 . With the data in Table A1, we can show that the 44 VLA batteries (2V, 165 Ah, model STT2V150) that we used for the characterization process have different aging (different available capacity Q A ).
Table A1. Available capacity Q A , level x 1 , and water loss per battery.
Batt. Q A (Ah) x 1 (L)Water Loss (mL) Batt. Q A (Ah) x 1 (L)Water Loss (mL)
1101.93.783380.6 23142.03.802361.0
2112.13.770393.7 24158.93.765398.9
390.33.750413.3 25153.93.762401.6
497.33.759404.2 26132.43.782381.9
5154.83.758405.5 27164.53.782381.9
6136.53.763400.2 28154.53.772391.1
7132.73.772391.1 29164.43.771392.4
8142.13.754409.4 30161.43.761402.9
9107.53.804359.7 31150.63.753410.7
1097.63.792371.5 32152.43.738425.1
1195.13.792371.5 33148.03.780383.2
1296.53.789374.1 34144.03.782381.9
13131.63.805358.4 35171.33.778385.9
14153.63.758405.5 36152.13.776387.2
15145.93.746417.3 37141.83.759404.2
16153.03.762401.6 38148.43.746417.3
17144.23.762401.6 39144.93.757406.8
18150.73.791372.8 40147.43.787376.7
19135.63.796367.5 41147.93.761402.9
20110.33.791372.8 42164.83.761402.9
21155.83.797366.2 43149.43.780383.2
2298.03.788375.4 44155.63.775388.5

Appendix B. Values of the Average Internal Resistances Obtained in the Characterization Process

The values θ k ( x n ) in m Ω of the 44 VLA batteries are listed in Table A2. We can see that θ k ( x 1 ) is always bigger than θ k ( x 2 ) , . . . , θ k ( x 8 ) for any battery.
Table A2. Average values of the ohmic resistance (in m Ω ) of 44 vented lead–acid (VLA) batteries for the eight electrolyte levels.
k θ k ( x 1 ) θ k ( x 2 ) θ k ( x 3 ) θ k ( x 4 ) θ k ( x 5 ) θ k ( x 6 ) θ k ( x 7 ) θ k ( x 8 )
12.6212.2972.3572.3702.2912.3822.3522.459
22.6862.3742.4052.4362.3362.4332.4542.419
33.0482.7802.7892.7992.7502.8512.8362.890
42.5422.2862.2702.3232.2482.3072.3212.330
52.5602.2962.3492.3412.2972.3002.2842.315
62.5012.2722.2452.2852.2282.2612.2122.277
72.5712.3132.2912.3262.3172.2862.2842.328
82.6132.3882.4282.4302.3722.4012.3682.365
92.6192.2952.3332.3622.3382.3352.3402.337
102.8582.5492.6452.6892.6512.6802.6412.666
112.7712.4232.4672.5172.4592.4712.4812.502
122.8052.5272.5412.5412.5552.5862.5362.545
132.7532.4572.4442.4552.4472.4742.4262.430
142.4872.2762.2442.2342.2702.2392.2202.230
152.4952.2742.2932.3062.2442.2732.2772.285
162.4812.2662.2752.2922.3262.2802.2602.258
172.6562.4352.4662.4662.5192.4382.4302.437
182.5422.3392.3782.3892.3892.3272.3172.365
192.6362.4392.4532.4672.5082.4132.4302.451
202.6132.3682.4052.4162.4282.3972.4122.435
212.5992.4092.4392.4612.4962.3992.3872.430
222.7242.4702.5452.5782.5702.5182.5222.594
232.4342.2252.2562.2852.2772.2552.1972.271
242.5342.3372.3732.3942.4082.3602.3082.344
252.4732.2802.2692.2772.2692.2202.2352.266
262.6312.3462.3842.3892.4142.3832.3252.397
272.6232.3462.3722.3662.3882.3272.3082.324
282.5382.3702.3732.3822.3892.3552.3002.366
292.3292.1442.1722.1572.1702.1402.0922.150
302.4652.2892.3492.3162.3422.2862.2672.307
312.3942.2172.2182.2302.2382.2062.1472.172
322.7692.5182.6062.5572.6462.5612.5122.573
332.7242.5252.5722.5572.6232.5672.5162.565
342.7262.5102.5582.5472.5882.5372.4852.543
352.5052.3512.4042.3582.3712.3412.3412.375
362.5352.3462.3732.3582.4042.3092.3072.357
372.5682.3702.4082.4132.4612.3912.3992.389
382.4102.2342.2612.2552.2772.2282.1892.191
392.6612.4472.4692.4772.5332.4382.4132.455
402.4732.2482.2862.2462.3002.2432.2202.255
412.5522.3092.3732.3812.4142.3072.3312.343
422.4122.2312.2862.2772.2932.2372.1862.230
432.3622.1522.1922.1882.2282.1472.1652.172
442.8382.6212.7082.6672.7232.6532.6612.696

References

  1. Rand, D.A.; Moseley, P.T. Electrochemical Energy Storage for Renewable Sources and Grid Balancing. In Electrochemical Energy Storage for Renewable Sources and Grid Balancing; Elsevier: Amsterdam, The Netherlands, 2015. [Google Scholar] [CrossRef]
  2. Rand, D.A.J.; Moseley, P.T.; Garche, J.; Parker, C.D. Valve-Regulated Lead-Acid Batteries; Elsevier Inc.: San Diego, CA, USA, 2004. [Google Scholar]
  3. Handbook of Batteries; McGraw Hill: New York, NY, USA, 2002.
  4. Karimi, M.A.; Karami, H.; Mahdipour, M. ANN modeling of water consumption in the lead–acid batteries. J. Power Sources 2007, 172, 946–956. [Google Scholar] [CrossRef]
  5. Ruetschi, P. Aging mechanisms and service life of lead–acid batteries. J. Power Sources 2004, 127, 33–44. [Google Scholar] [CrossRef]
  6. Schulte, D.; Sauer, D.U.; Ebner, E.; Börger, A.; Gose, S.; Wenzl, H. “Stratifiability index”—A quantitative assessment of acid stratification in flooded lead acid batteries. J. Power Sources 2014, 269, 704–715. [Google Scholar] [CrossRef]
  7. Franke, M.; Kowal, J. Empirical sulfation model for valve-regulated lead–acid batteries under cycling operation. J. Power Sources 2018, 380, 76–82. [Google Scholar] [CrossRef]
  8. Ouyang, M.; Zhang, M.; Feng, X.; Lu, L.; Li, J.; He, X.; Zheng, Y. Internal short circuit detection for battery pack using equivalent parameter and consistency method. J. Power Sources 2015, 294, 272–283. [Google Scholar] [CrossRef]
  9. Pavlov, D.; Petkova, G.; Rogachev, T. Influence of acid concentration on the performance of Lead–acid battery negative plates. J. Power Sources 2008, 175, 586–594. [Google Scholar] [CrossRef]
  10. Deveau, J.; White, C.; Swan, L.G. Lead–acid battery response to various formation levels—Part B: Internal resistance. Sustain. Energy Technol. Assess. 2015, 11, 126–133. [Google Scholar] [CrossRef]
  11. Brik, K.; Ben Ammar, F. The fault three analysis of the lead acid battery’s degradation. J. Electr. Syst. 2008, 4, 504–511. [Google Scholar]
  12. Bro, P.; Levy, S.C. Battery Hazards and Accident Prevention; Plenum Press: New York, NY, USA, 1994. [Google Scholar]
  13. Yahamadi, R.; Brik, K.; ben Ammar, F. Failure mode effects and criticality analysis of the manufacturing process od Lead–acid battery. Int. J. Sci. Res. Eng. Technol. 2015, 3, 6–11. [Google Scholar]
  14. IEEE-450. IEEE Recommended Practice for Maintenance, Testing, and Replacement of Vented Lead-Acid Batteries for Stationary Applications; IEEE: New York, NY, USA, 2011. [Google Scholar]
  15. IEEE-1188. IEEE Recommended Practice for Maintenance, Testing, and Replacement of Valve-Regulated Lead-Acid (VRLA) Batteries for Stationary Applications; IEEE: New York, NY, USA, 2014. [Google Scholar]
  16. IEEE-1106. IEEE Recommended Practice for Installation, Maintenance, Testing, and Replacement of Vented Nickel-Cadmium Batteries for Stationary Applications; IEEE: New York, NY, USA, 2015. [Google Scholar]
  17. UL-4128. UL outline of Investigation for Intercell and Intertier Connectors for Use in Electrochemical Battery System Applications; UL: Chicago, IL, USA, 2019. [Google Scholar]
  18. Standard PRC-005-2. Protection System Maintenance; North American Electric Reliability Corporation (NERC): Atlanta, GA, USA, 2014. [Google Scholar]
  19. Jones, D.; Worthington, J. System and Method for Monitoring Electrolyte Levels in a Battery. U.S. Patent 8928326, 5 January 2015. Available online: http://scholar.google.com (accessed on 10 January 2019).
  20. Herrema, M.; Earl, R.D.; Kloote, S.; Fox, J.L.; Shinew, M.T.; Moelker, D.A. Liquid Level Sensor for Battery Monitoring Systems. U.S. Patent 20170279167, 28 September 2017. Available online: http://patents.com (accessed on 10 January 2019).
  21. Jones, W.E.M.; Weidner, E.C. Battery Electrolyte Level Monitor. U.S. Patent 005936382, 10 August 1999. Available online: http://scholar.google.com (accessed on 10 January 2019).
  22. Deveau, E.W.; Stewart, D.; Popken, D.; Martinez, J. Ultrasonic Electrolyte Sensor. U.S. Patent 9548520, 17 January 2017. Available online: http://scholar.google.com (accessed on 10 January 2019).
  23. Herrema, M.; Earl, R.D.; Kloote, D.; Fox, J.L. Intelligent Monitoring Systems for Liquid Electrolyte Batteries. U.S. Patent 2019260090, 22 August 2019. Available online: https://worldwide.espacenet.com (accessed on 1 September 2019).
  24. CELLGUARD System—Battery Monitoring Solution; Midtronics Inc: Willowbrook, IL USA, 2019; Available online: http://www.stationary-power.com/siteassets/products/cellguard (accessed on 10 January 2019).
  25. Zou, Y.; Hu, X.; Ma, H.; Li, S. Combined State of Charge and State of Health estimation over lithium-ion battery cell cycle lifespan for electric vehicles. J. Power Sources 2015, 273, 793–803. [Google Scholar] [CrossRef]
  26. Plett, G.L. Battery Management Systems, Volume II: Equivalent-Circuit Methods; Artech House: Norwood, MA, USA, 2016. [Google Scholar]
  27. Du, J.; Liu, Z.; Wang, Y.; Wen, C. An adaptive sliding mode observer for lithium-ion battery state of charge and state of health estimation in electric vehicles. Control Eng. Pract. 2016, 54, 81–90. [Google Scholar] [CrossRef]
  28. Lifetime Modelling of Lead Acid Batteries; Risø-R-1515(EN); Risø National Laboratory: Roskilde, Denmark, 2005; Available online: http://orbit.dtu.dk/ (accessed on 1 January 2019).
  29. Wenzl, H.; Baring-Gould, I.; Kaiser, R.; Liaw, B.Y.; Lundsager, P.; Manwell, J.; Ruddell, A.; Svoboda, V. Life prediction of batteries for selecting the technically most suitable and cost effective battery. J. Power Sources 2005, 144, 373–384. [Google Scholar] [CrossRef]
  30. Guo, Y.; Tang, S.; Meng, G.; Yang, S. Failure modes of valve-regulated lead–acid batteries for electric bicycle applications in deep discharge. J. Power Sources 2009, 191, 127–133. [Google Scholar] [CrossRef]
  31. STT Series-Tubular Flooded Batteries-Datasheet; 06-17-T2V150; Storage Battery Systems LLC: Menomonee Falls, WI, USA, 2019; Available online: http://www.sbsbattery.com (accessed on 1 September 2019).
  32. SEL-3530. AcSELerator RTAC Manual; Schweitzer Engineering Laboratories, Inc.: Pullman, WA, USA, 2016; Available online: https://cdn.selinc.com (accessed on 10 January 2019).
  33. White, C.; Deveau, J.; Swan, L.G. Evolution of internal resistance during formation of flooded lead–acid batteries. J. Power Sources 2016, 327, 160–170. [Google Scholar] [CrossRef]
  34. Tao, L.; Ma, J.; Cheng, Y.; Noktehdan, A.; Chong, J.; Lu, C. A review of stochastic battery models and health management. Renew. Sustain. Energy Rev. 2017, 80, 716–732. [Google Scholar] [CrossRef]
Figure 1. Equivalent electrical circuit (EEC) battery model.
Energies 12 04435 g001
Figure 2. Test bench implemented to emulate the conditions of an electrical substation.
Energies 12 04435 g002
Figure 3. The eight electrolyte setting levels used to characterize R 0 .
Energies 12 04435 g003
Figure 4. Schematic representation of the discharge pulse and the resulting battery voltage used to estimate R 0 . String current i d (top) and battery voltage v B a t t . (bottom) are illustrated.
Energies 12 04435 g004
Figure 5. Schematic representation of the string current i d with the five consecutive discharge pulses to estimate the average values of R 0 .
Energies 12 04435 g005
Figure 6. Evolution of the ohmic resistance with the eight electrolyte levels obtained for ten batteries.
Energies 12 04435 g006
Figure 7. Evolution of the relative error α k ( x q ) for the eight electrolyte levels set up.
Energies 12 04435 g007
Figure 8. Block diagram of the implemented system.
Energies 12 04435 g008
Figure 9. Experimental evaluation of the ohmic resistance where low electrolyte level is detected at day 70 when the eighth sample was obtained.
Energies 12 04435 g009
Table 1. Comparison between the proposed method and those commonly used in supervisory systems (for continuous supervision) that monitor the electrolyte level.
AttributeOther SystemsProposed System
Level sensorsInvasiveNot required
Non-invasiveNot required
Other sensorsVoltage
Current
Temperature
Periodic monitoring (human supervision)Not required
Continuous monitoring (online)
StandardsPRC-005-2 and IEEE-450PRC-005-2 and IEEE-450

