Assessment of Overvoltage and Insulation Coordination in Mixed HVDC Transmission Lines Exposed to Lightning Strikes


Abstract
:1. Introduction
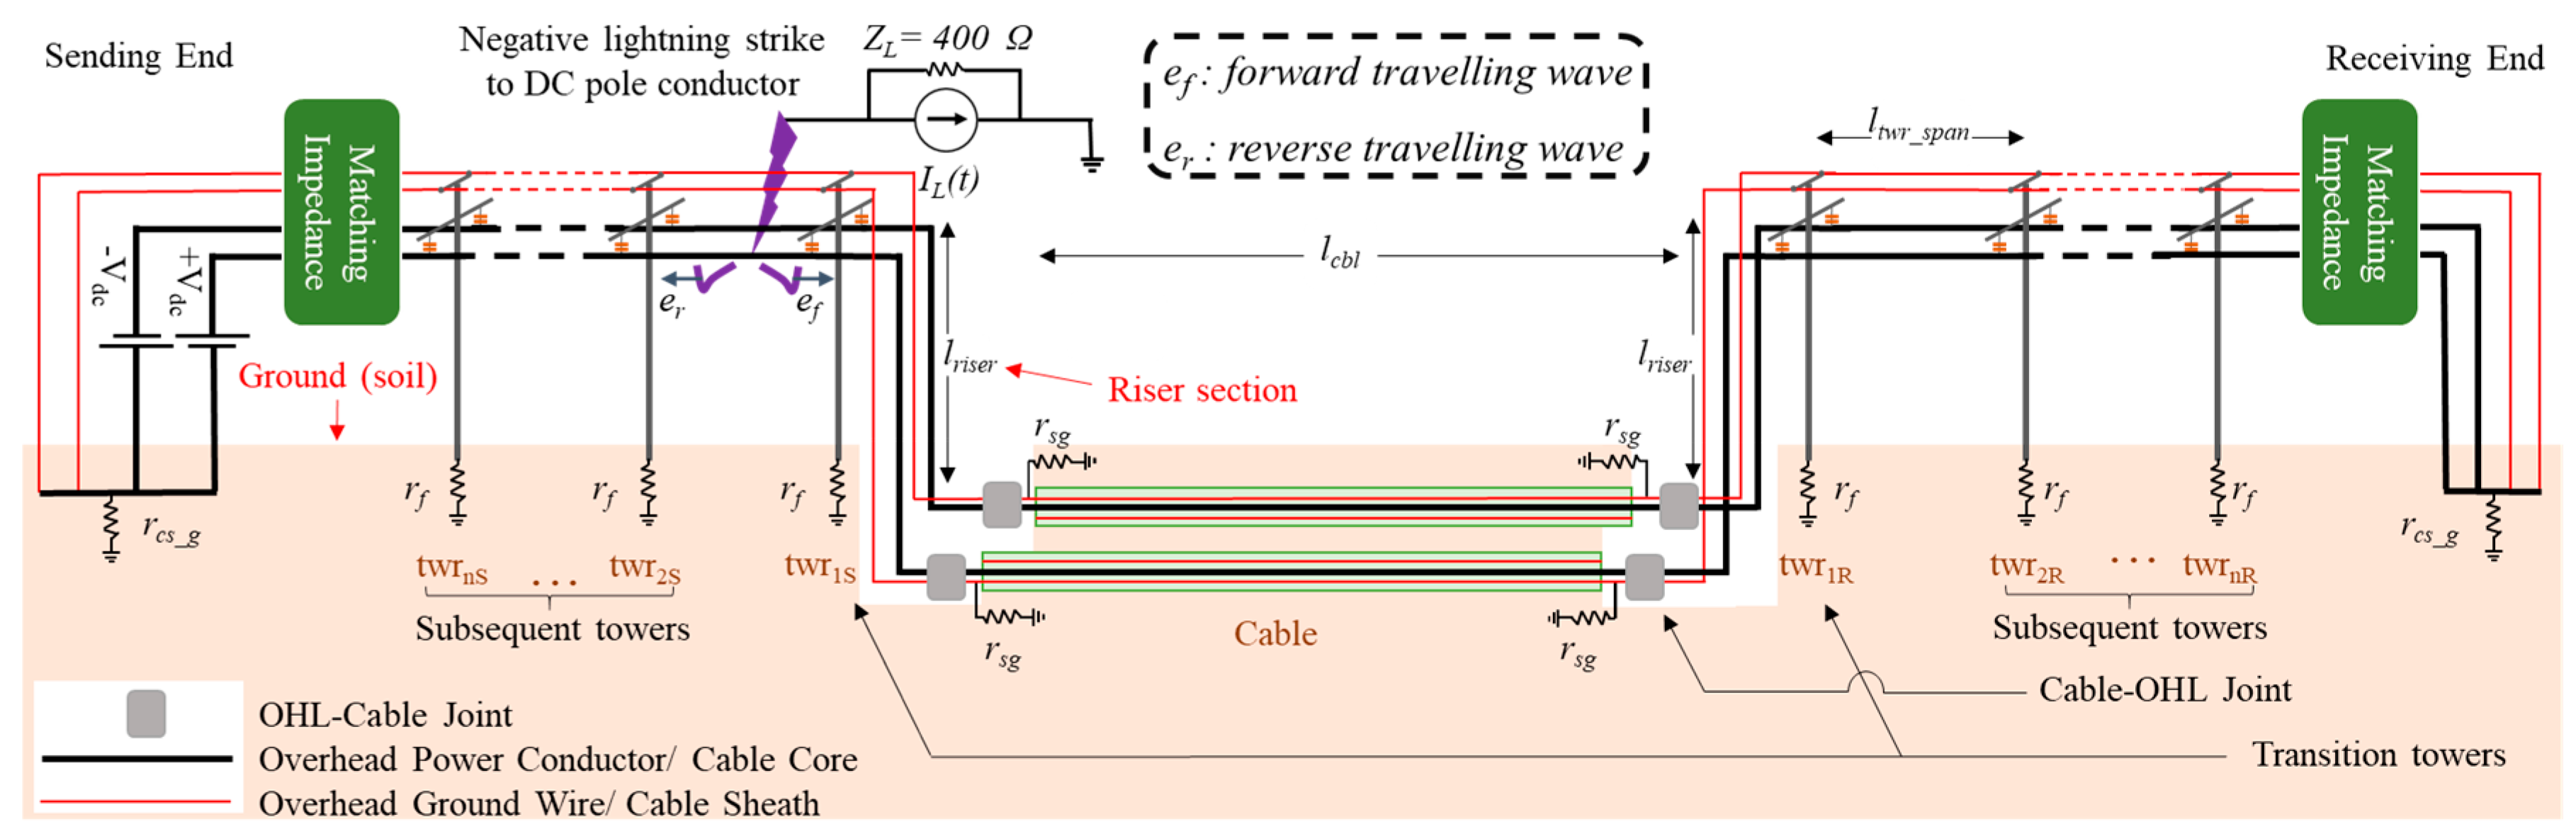
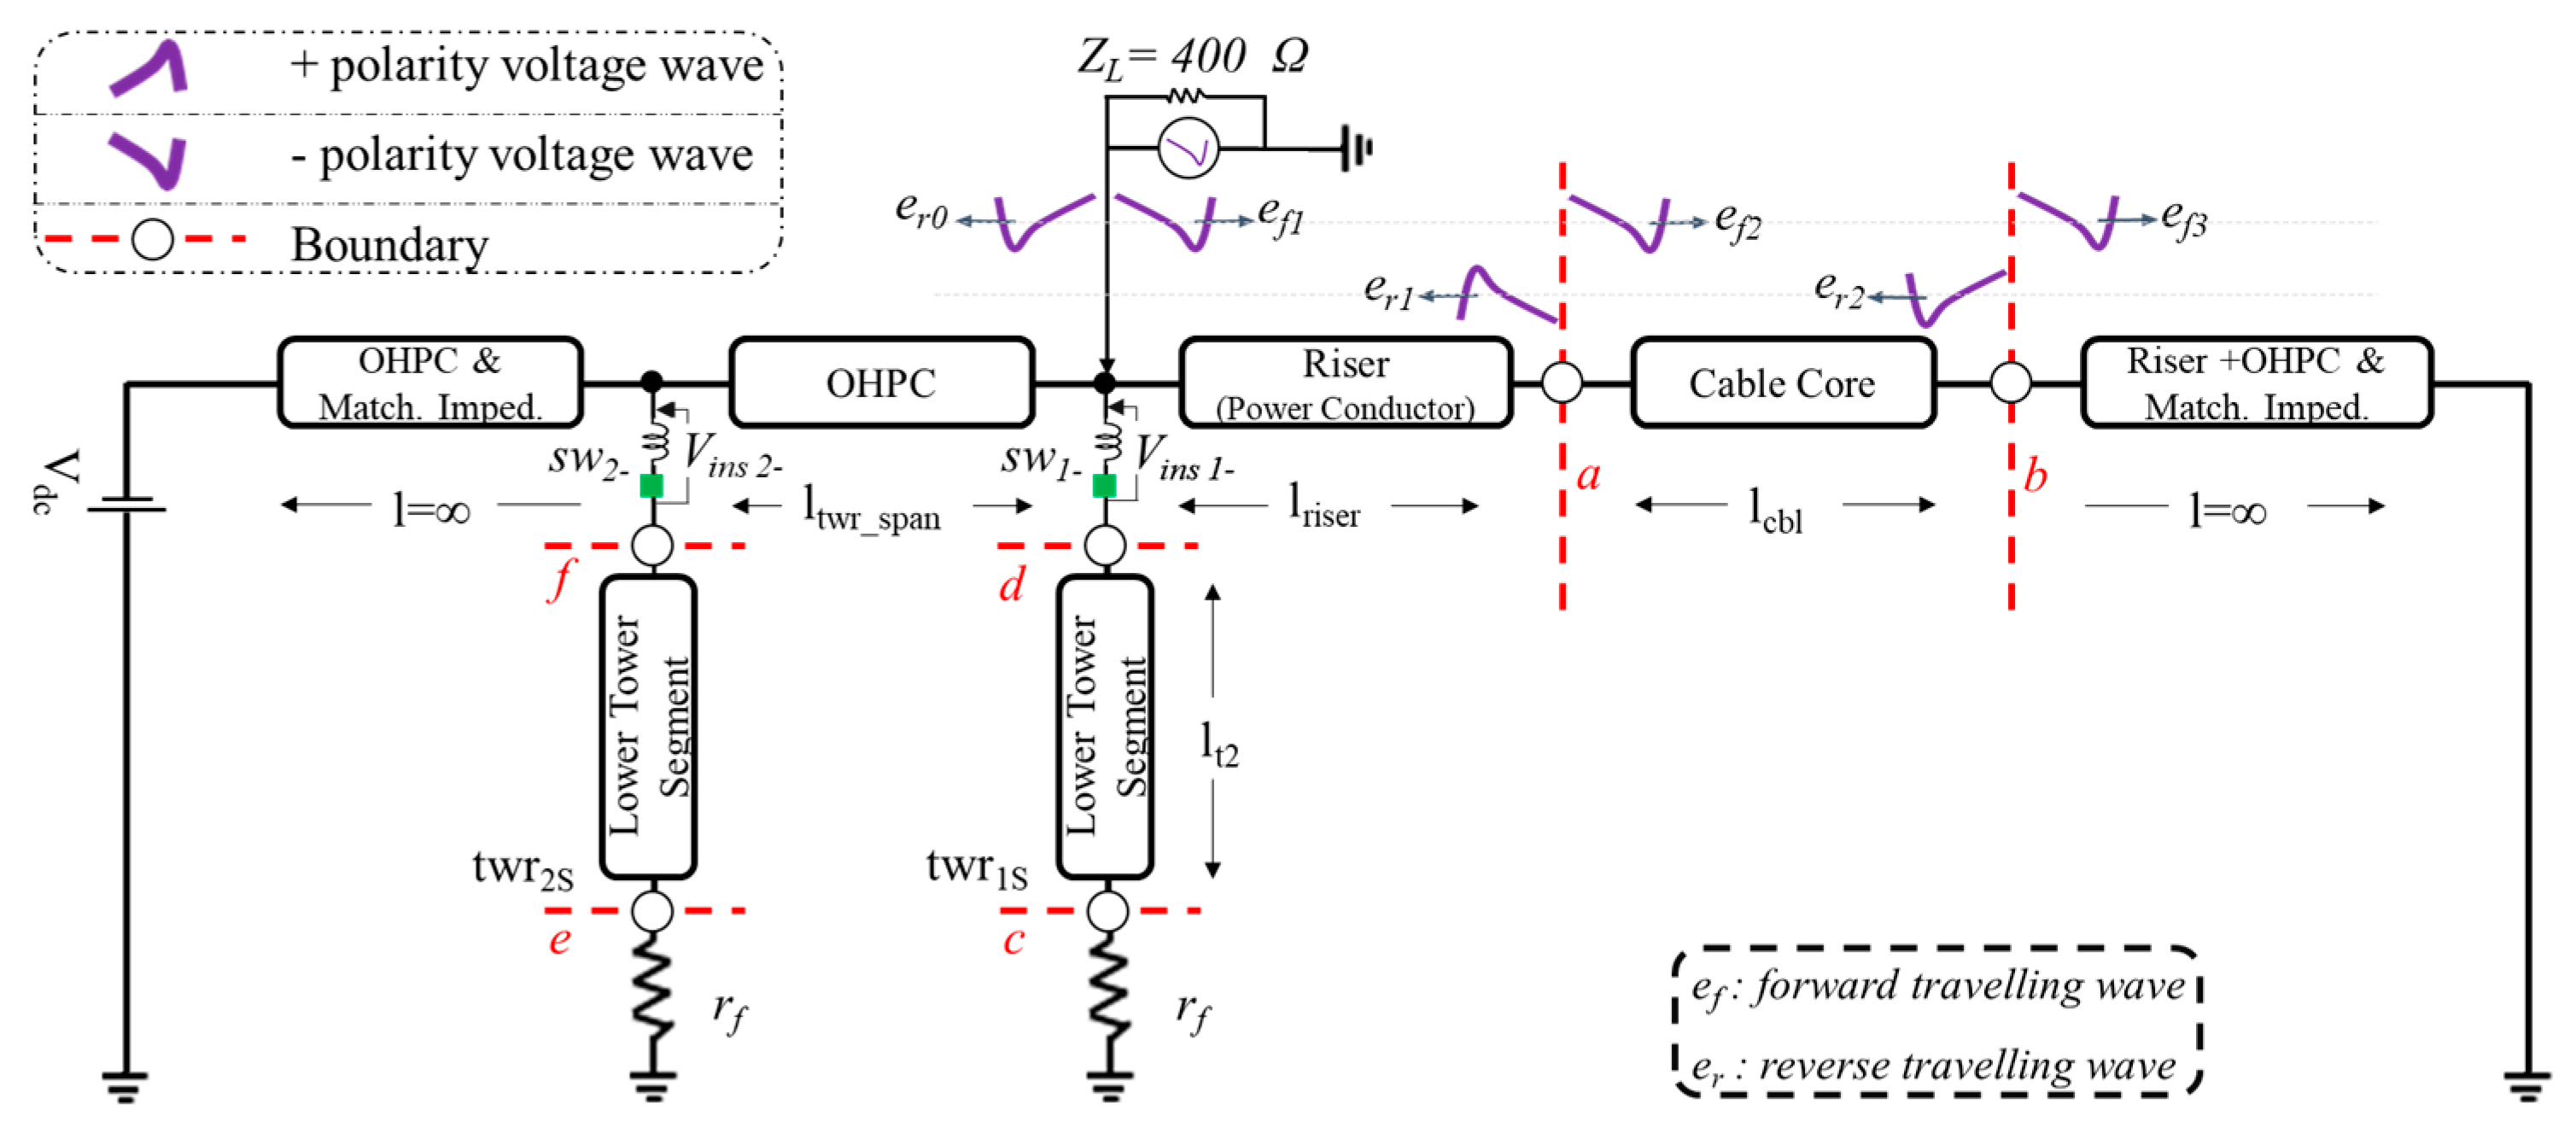
2. System Description and Fast Front Transient Models
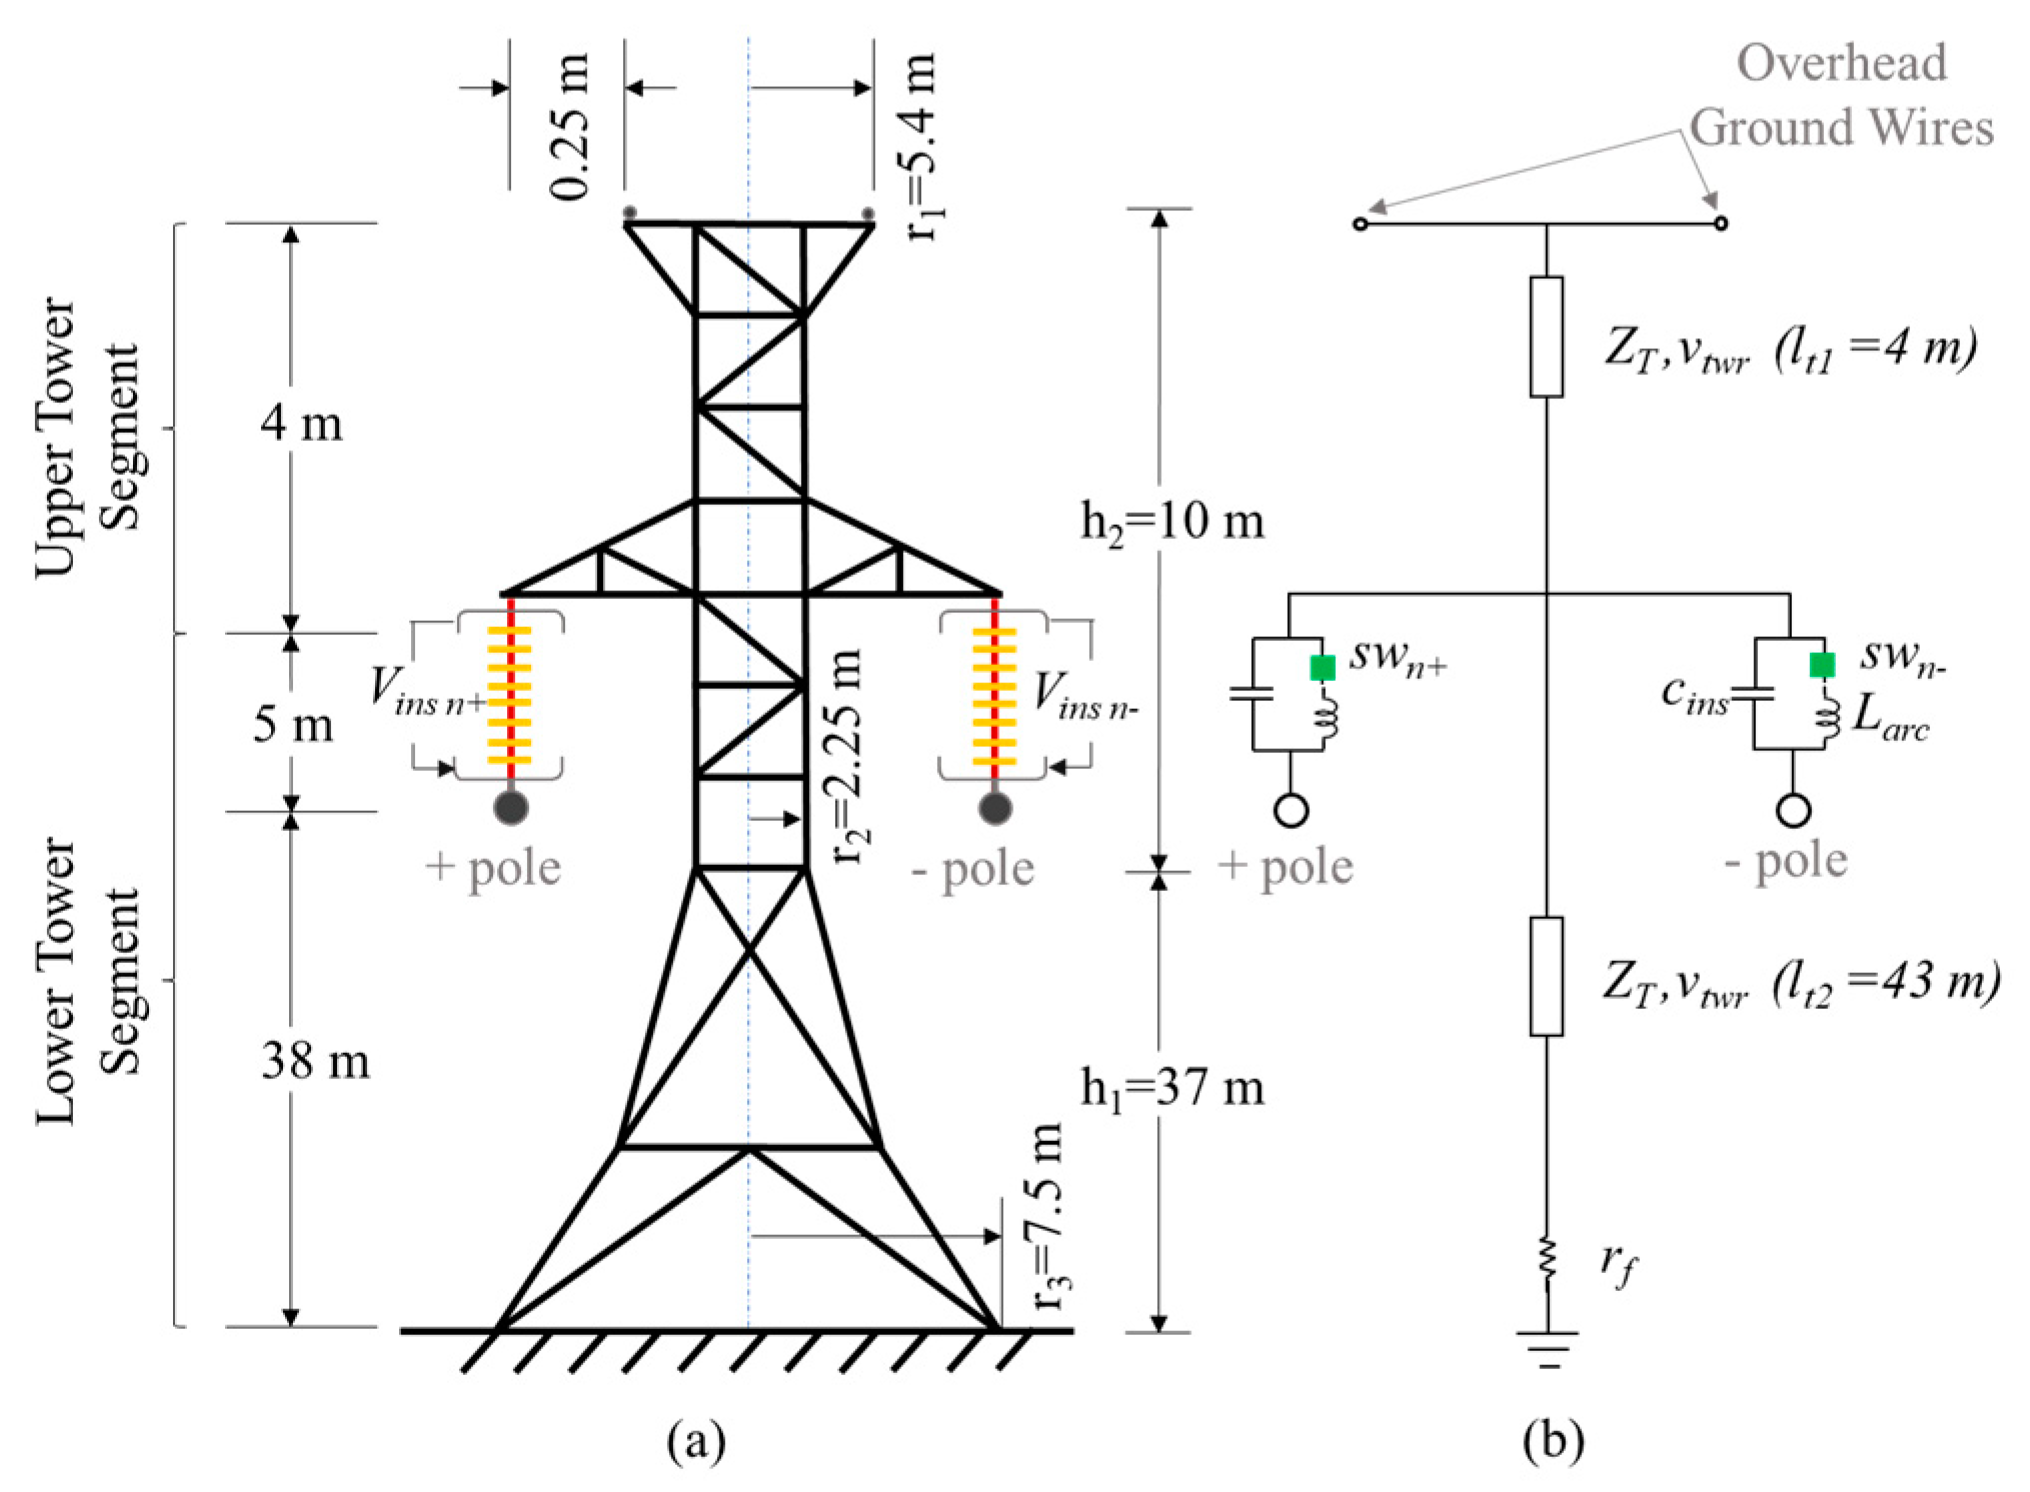
2.1. Tower
| T | intermediate value →{r1h2 + r2(h1+ h2) + r3h1}/(h1+ h2)2 |
| h1 | height from base to waist, |
| h2 | height from waist to top. |
| r1 | radius of tower at top, |
| r2 | radius of tower at waist, |
| r3 | radius of tower at base. |
2.2. Footing Impedance of Tower
2.3. Insulators
| ti | Corona inception time, µs |
| tl | Leader propagation time, µs |
| ts | Streamer propagation time, µs |
| E50 | Average gradient at the critical flashover (CFO) voltage, kV/m |
| E | Maximum gradient in the gap before breakdown, kV/m |
| L | Leader length, m |
| g | Gap length, m |
| V(t) | Voltage across gap, kV |
| K | Leader coefficient, m2/kV2.s |
| E0 | Critical leader inception gradient, kV/m |
2.4. Transmission Line
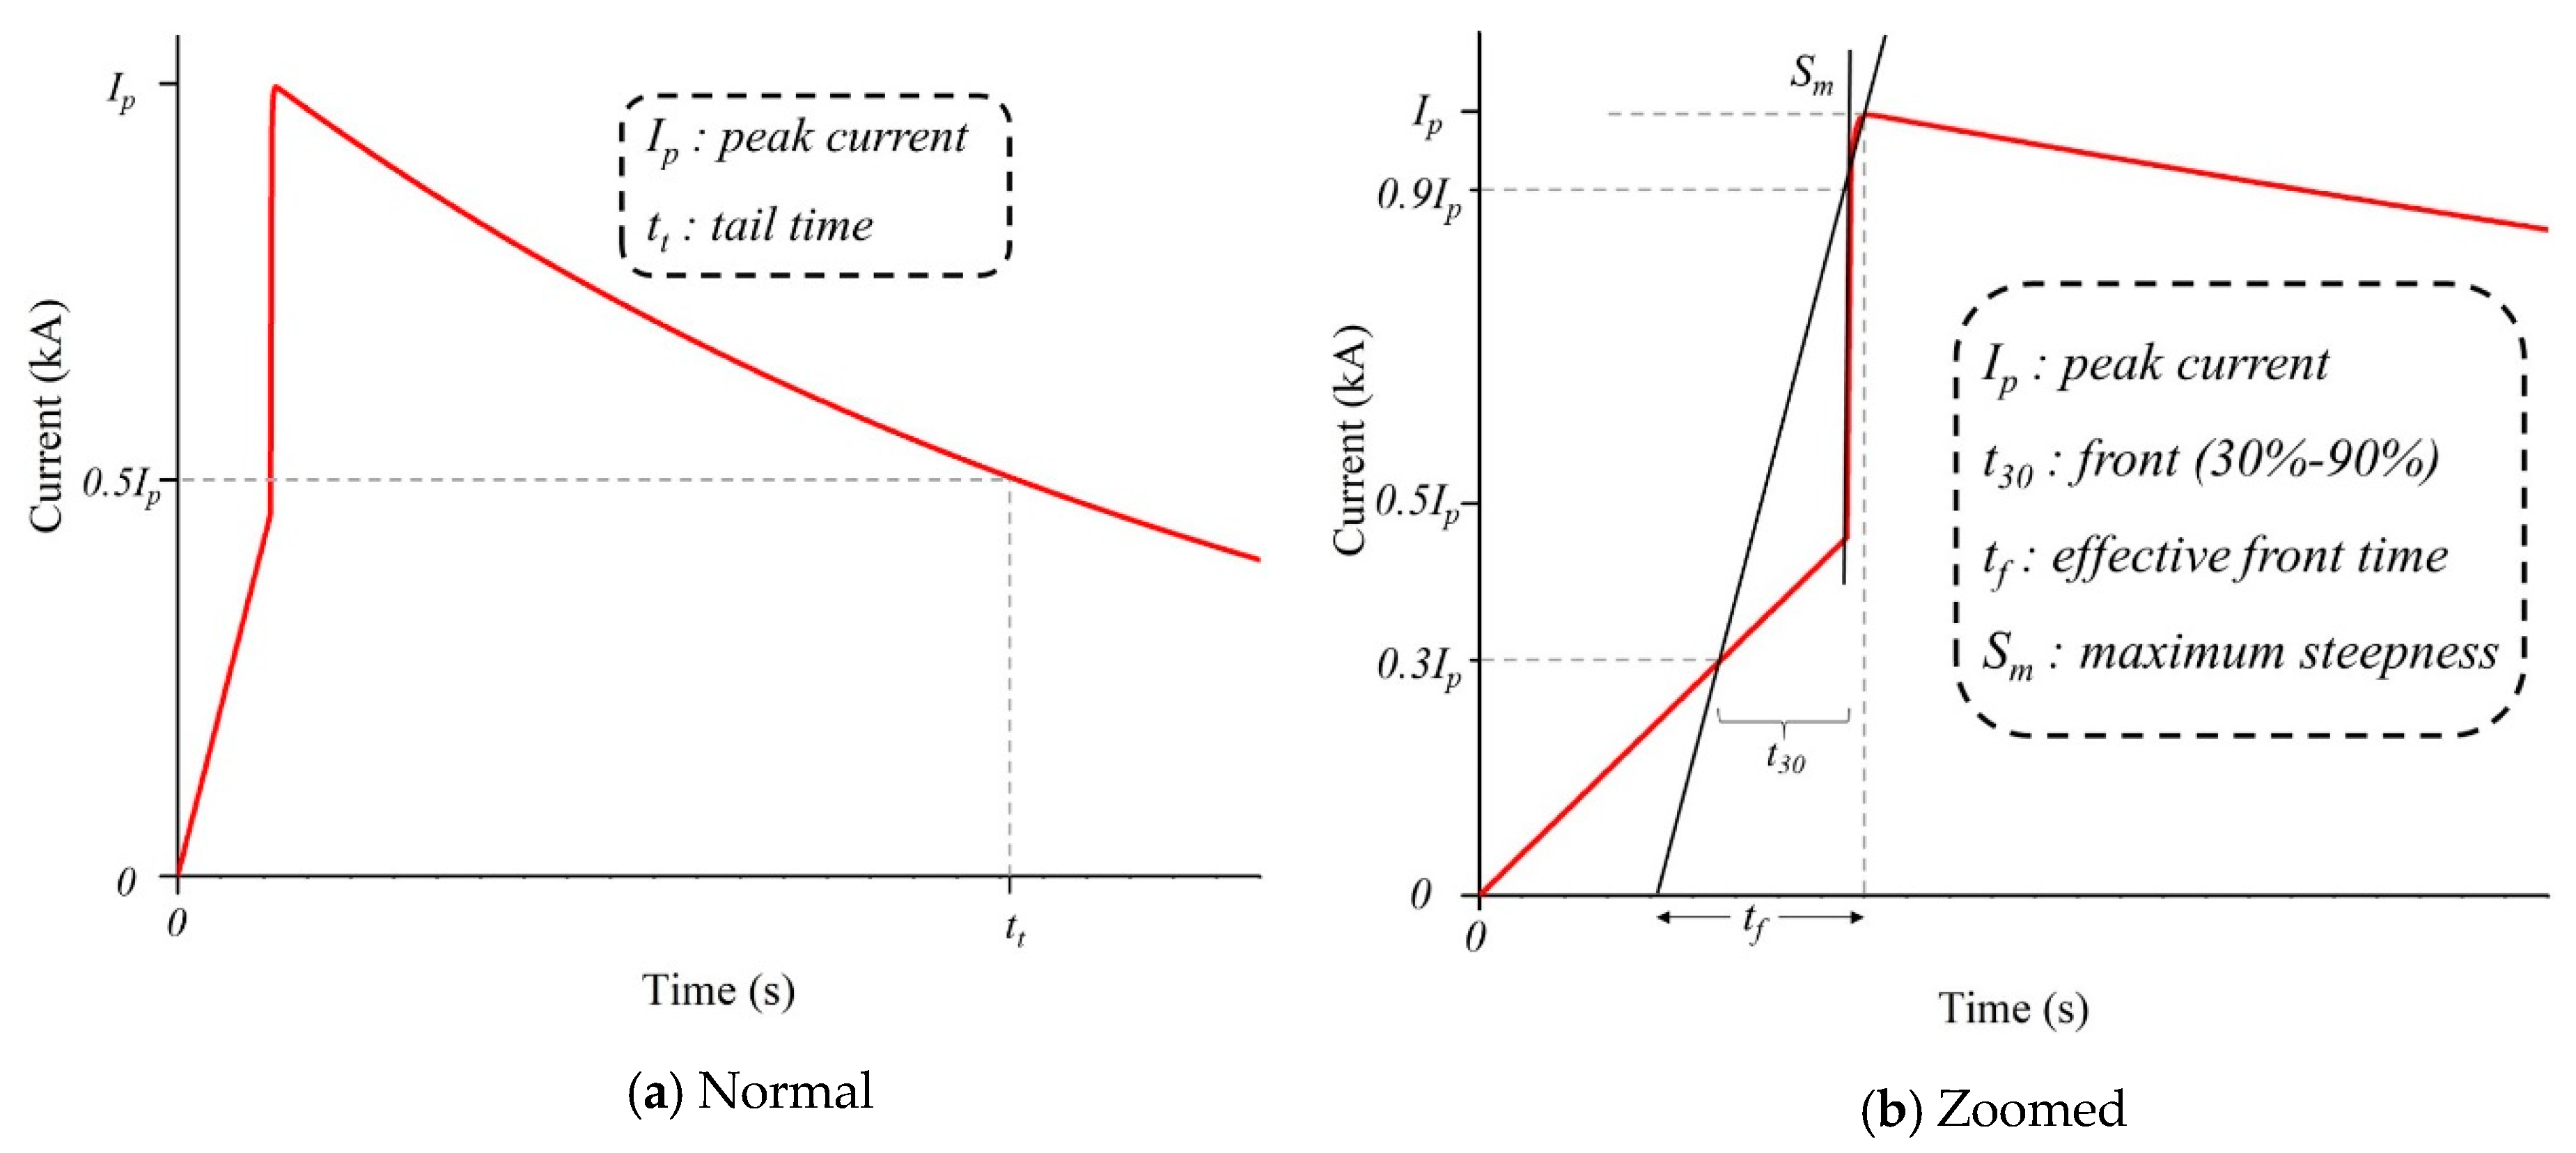
2.5. Lightning Strike
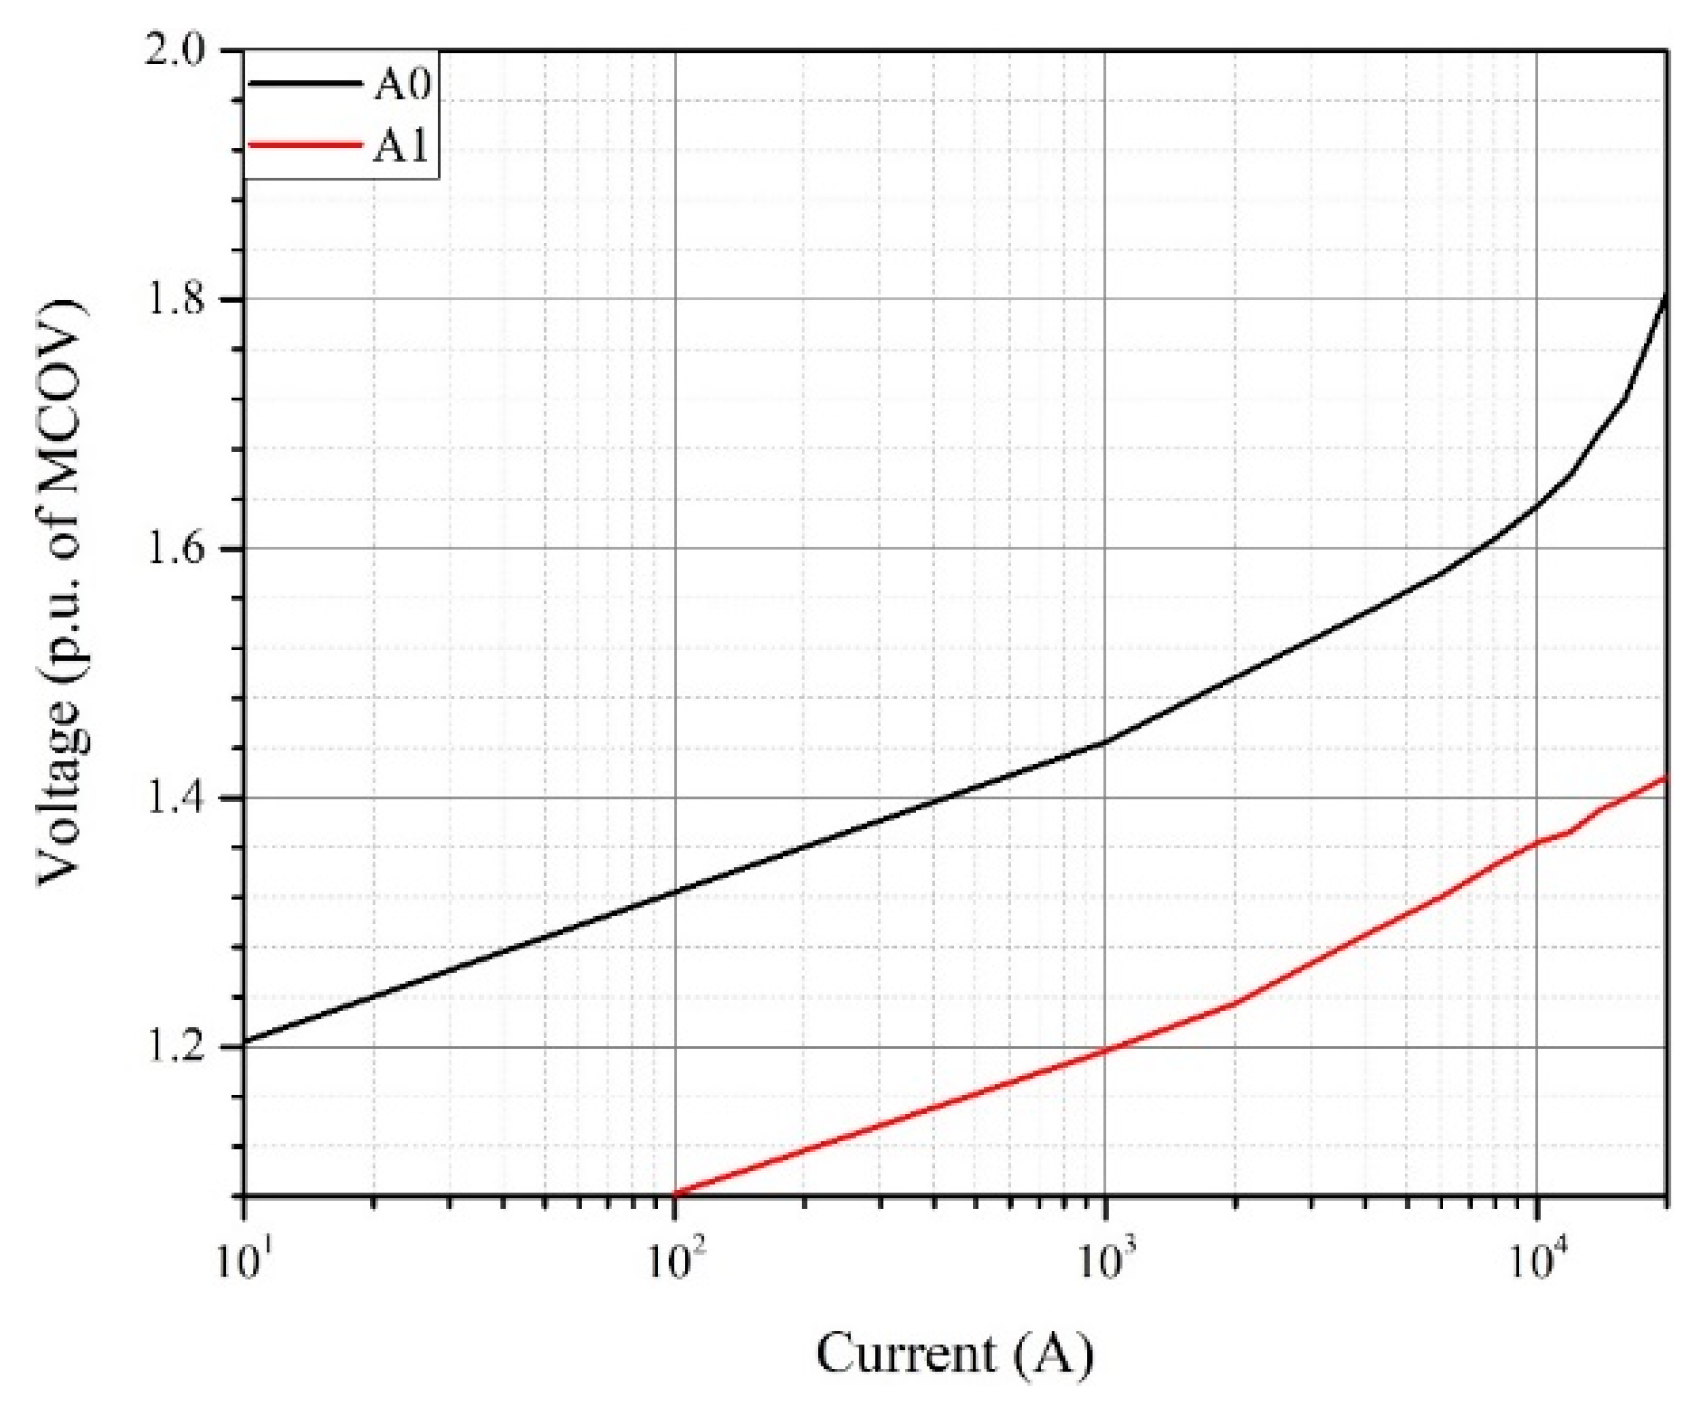
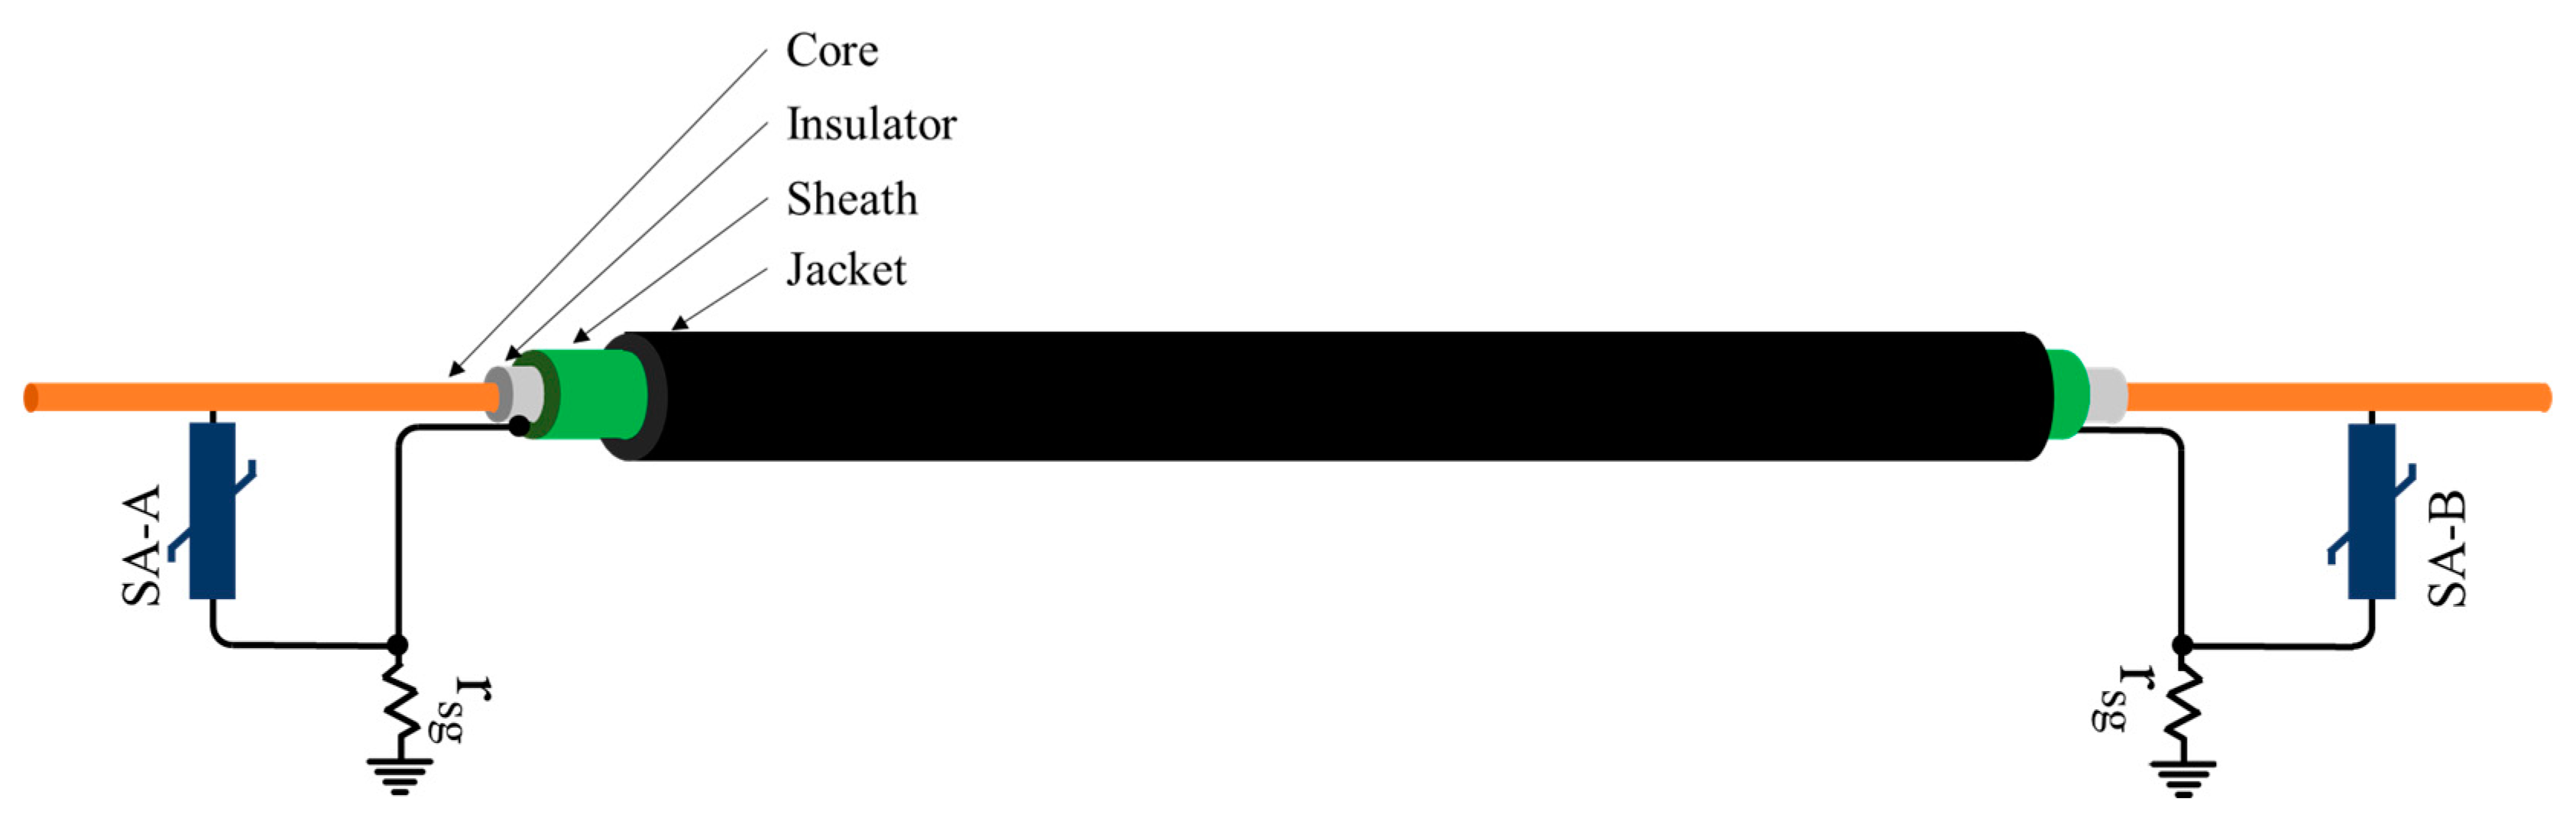
2.6. Surge Arrester
- Lightning impulse protective levels (LIPL), V10: 1130 kV (10 kA, 8 × 20 µs)
- Switching impulse protective levels (SIPL), Vss: 960 kV (3 kA, 30 × 60 µs)
| d | height of the arrester [m] |
| n | number of parallel columns of metal oxide in arrester |
3. Results and Discussion
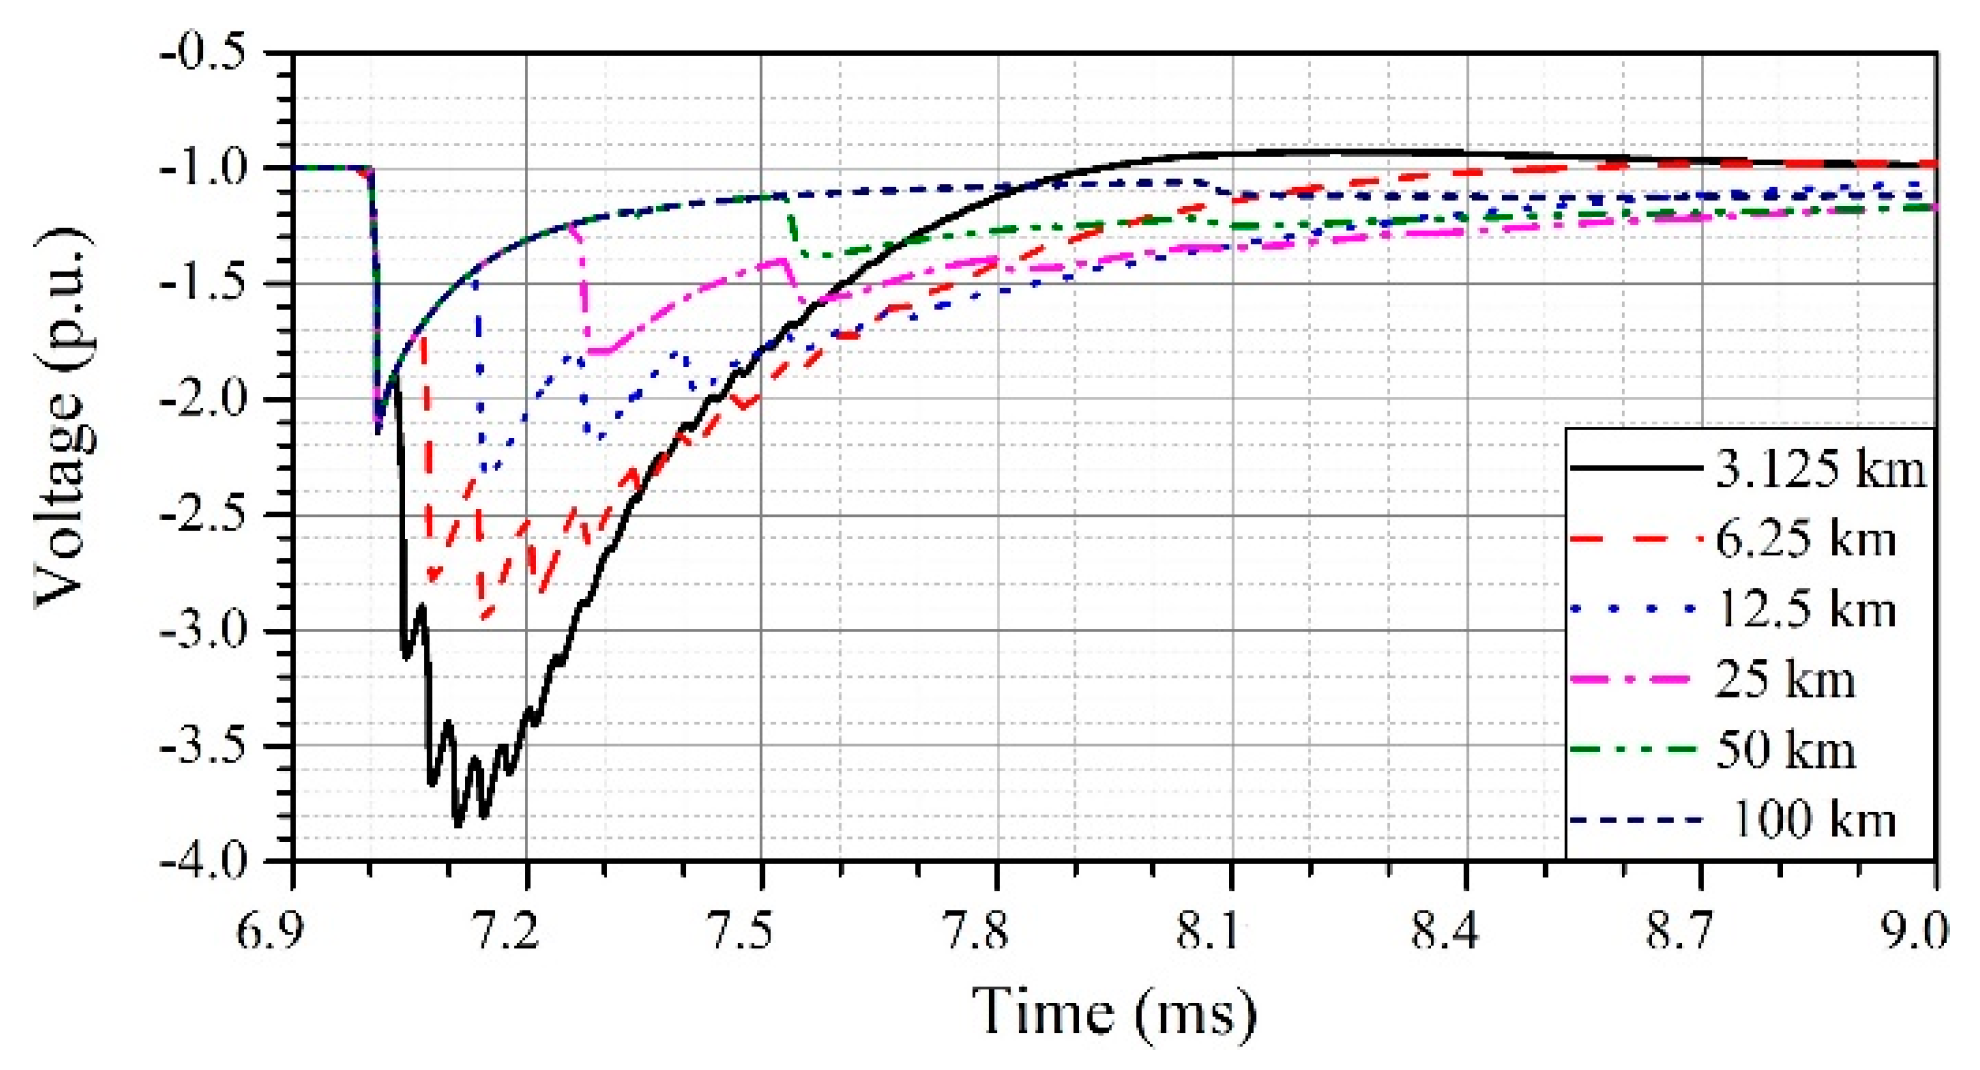
3.1. Overvoltage Analysis
3.1.1. Lightning Strike on an Overhead Power Conductor
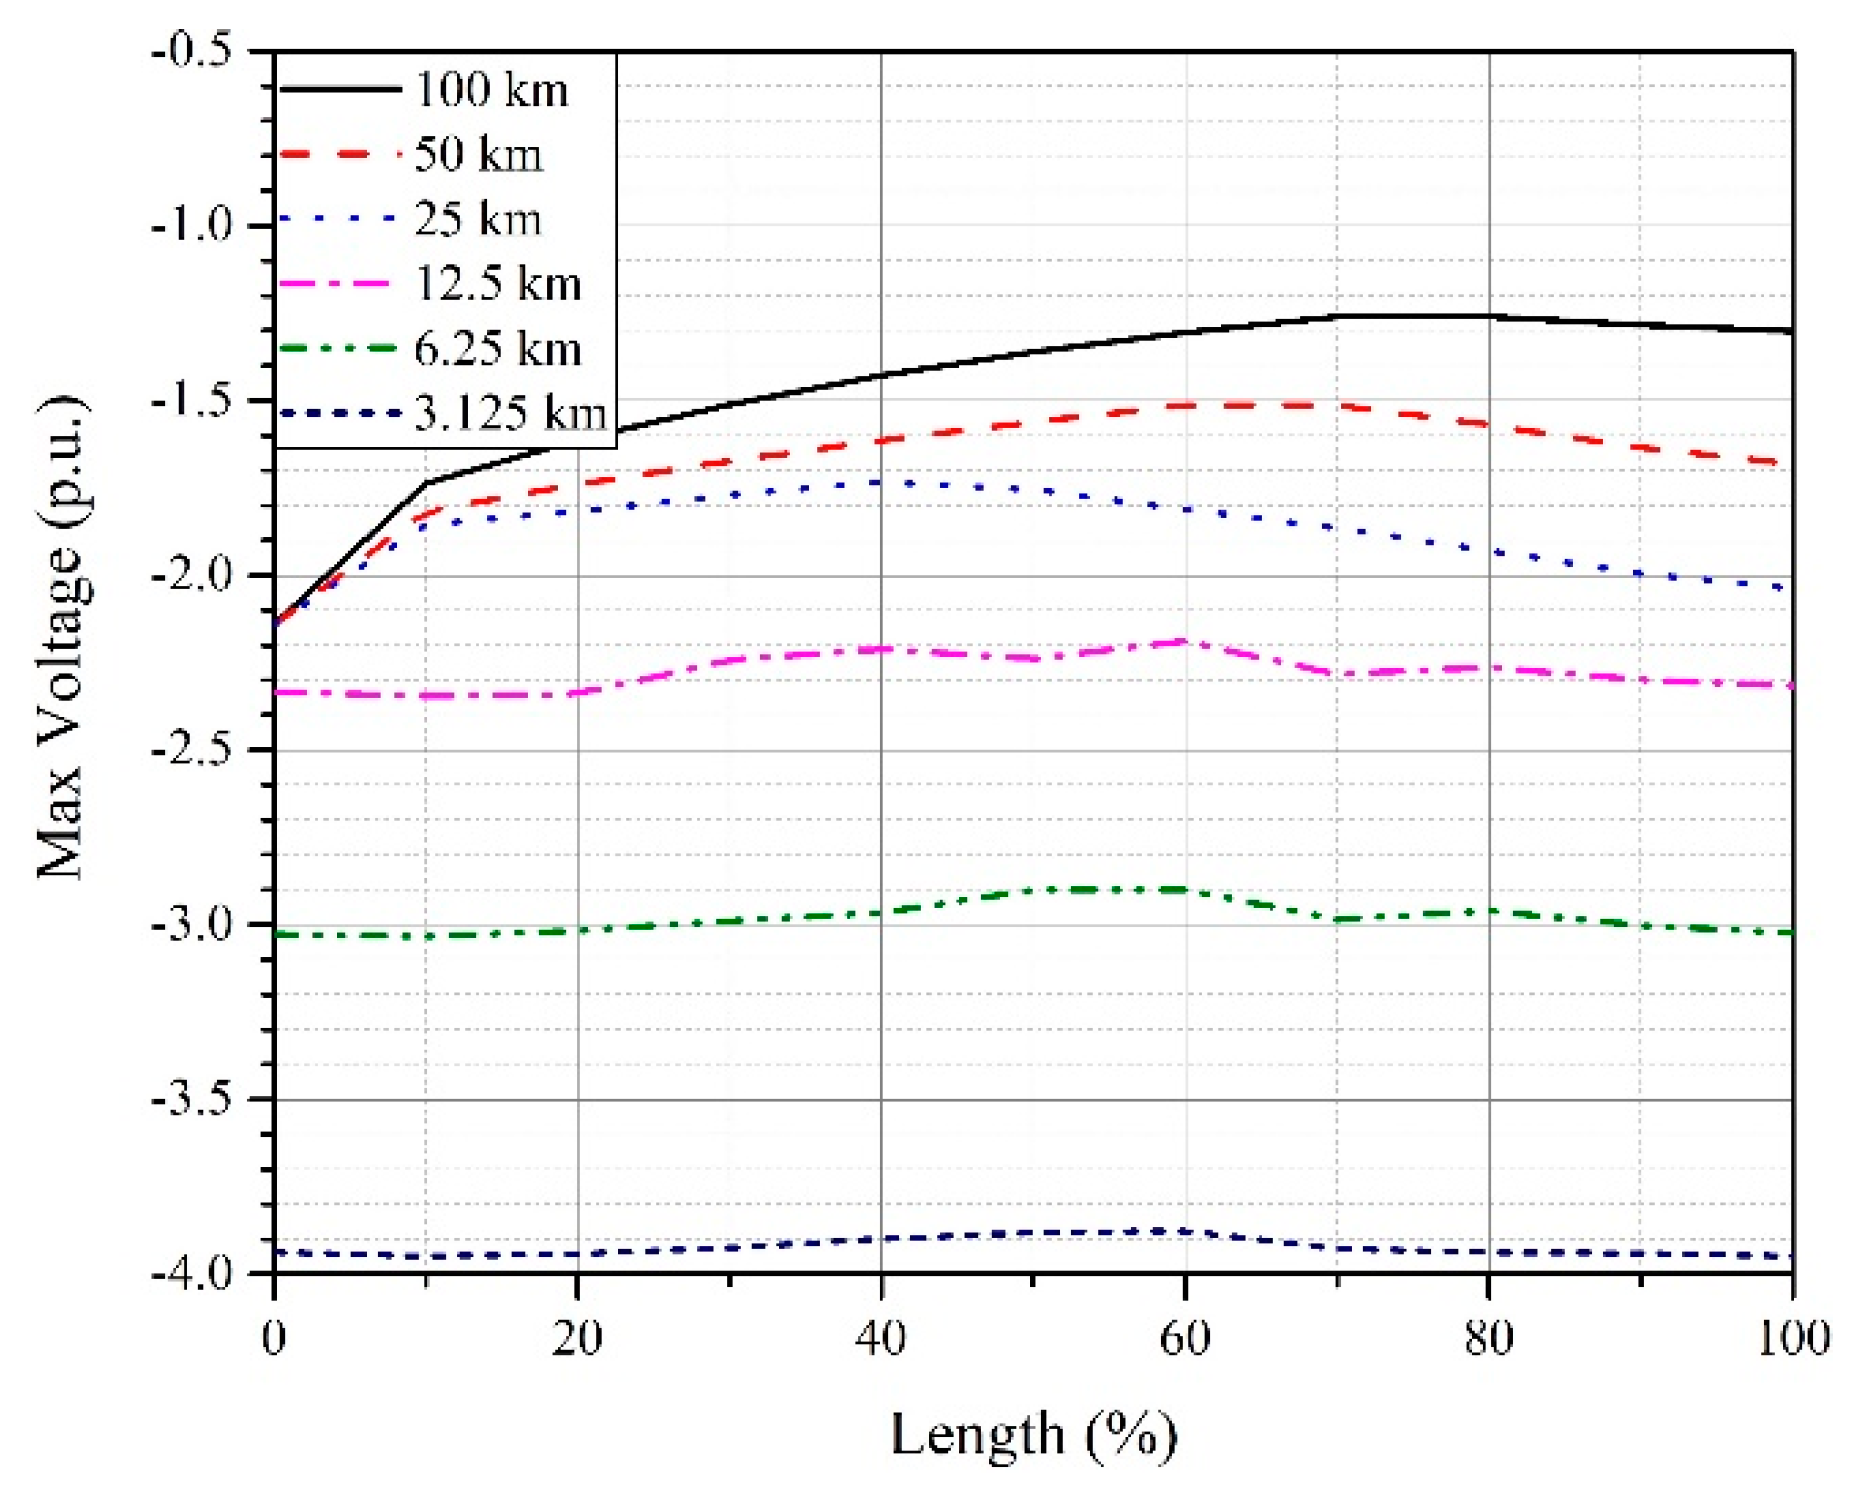
Core-Ground Overvoltage
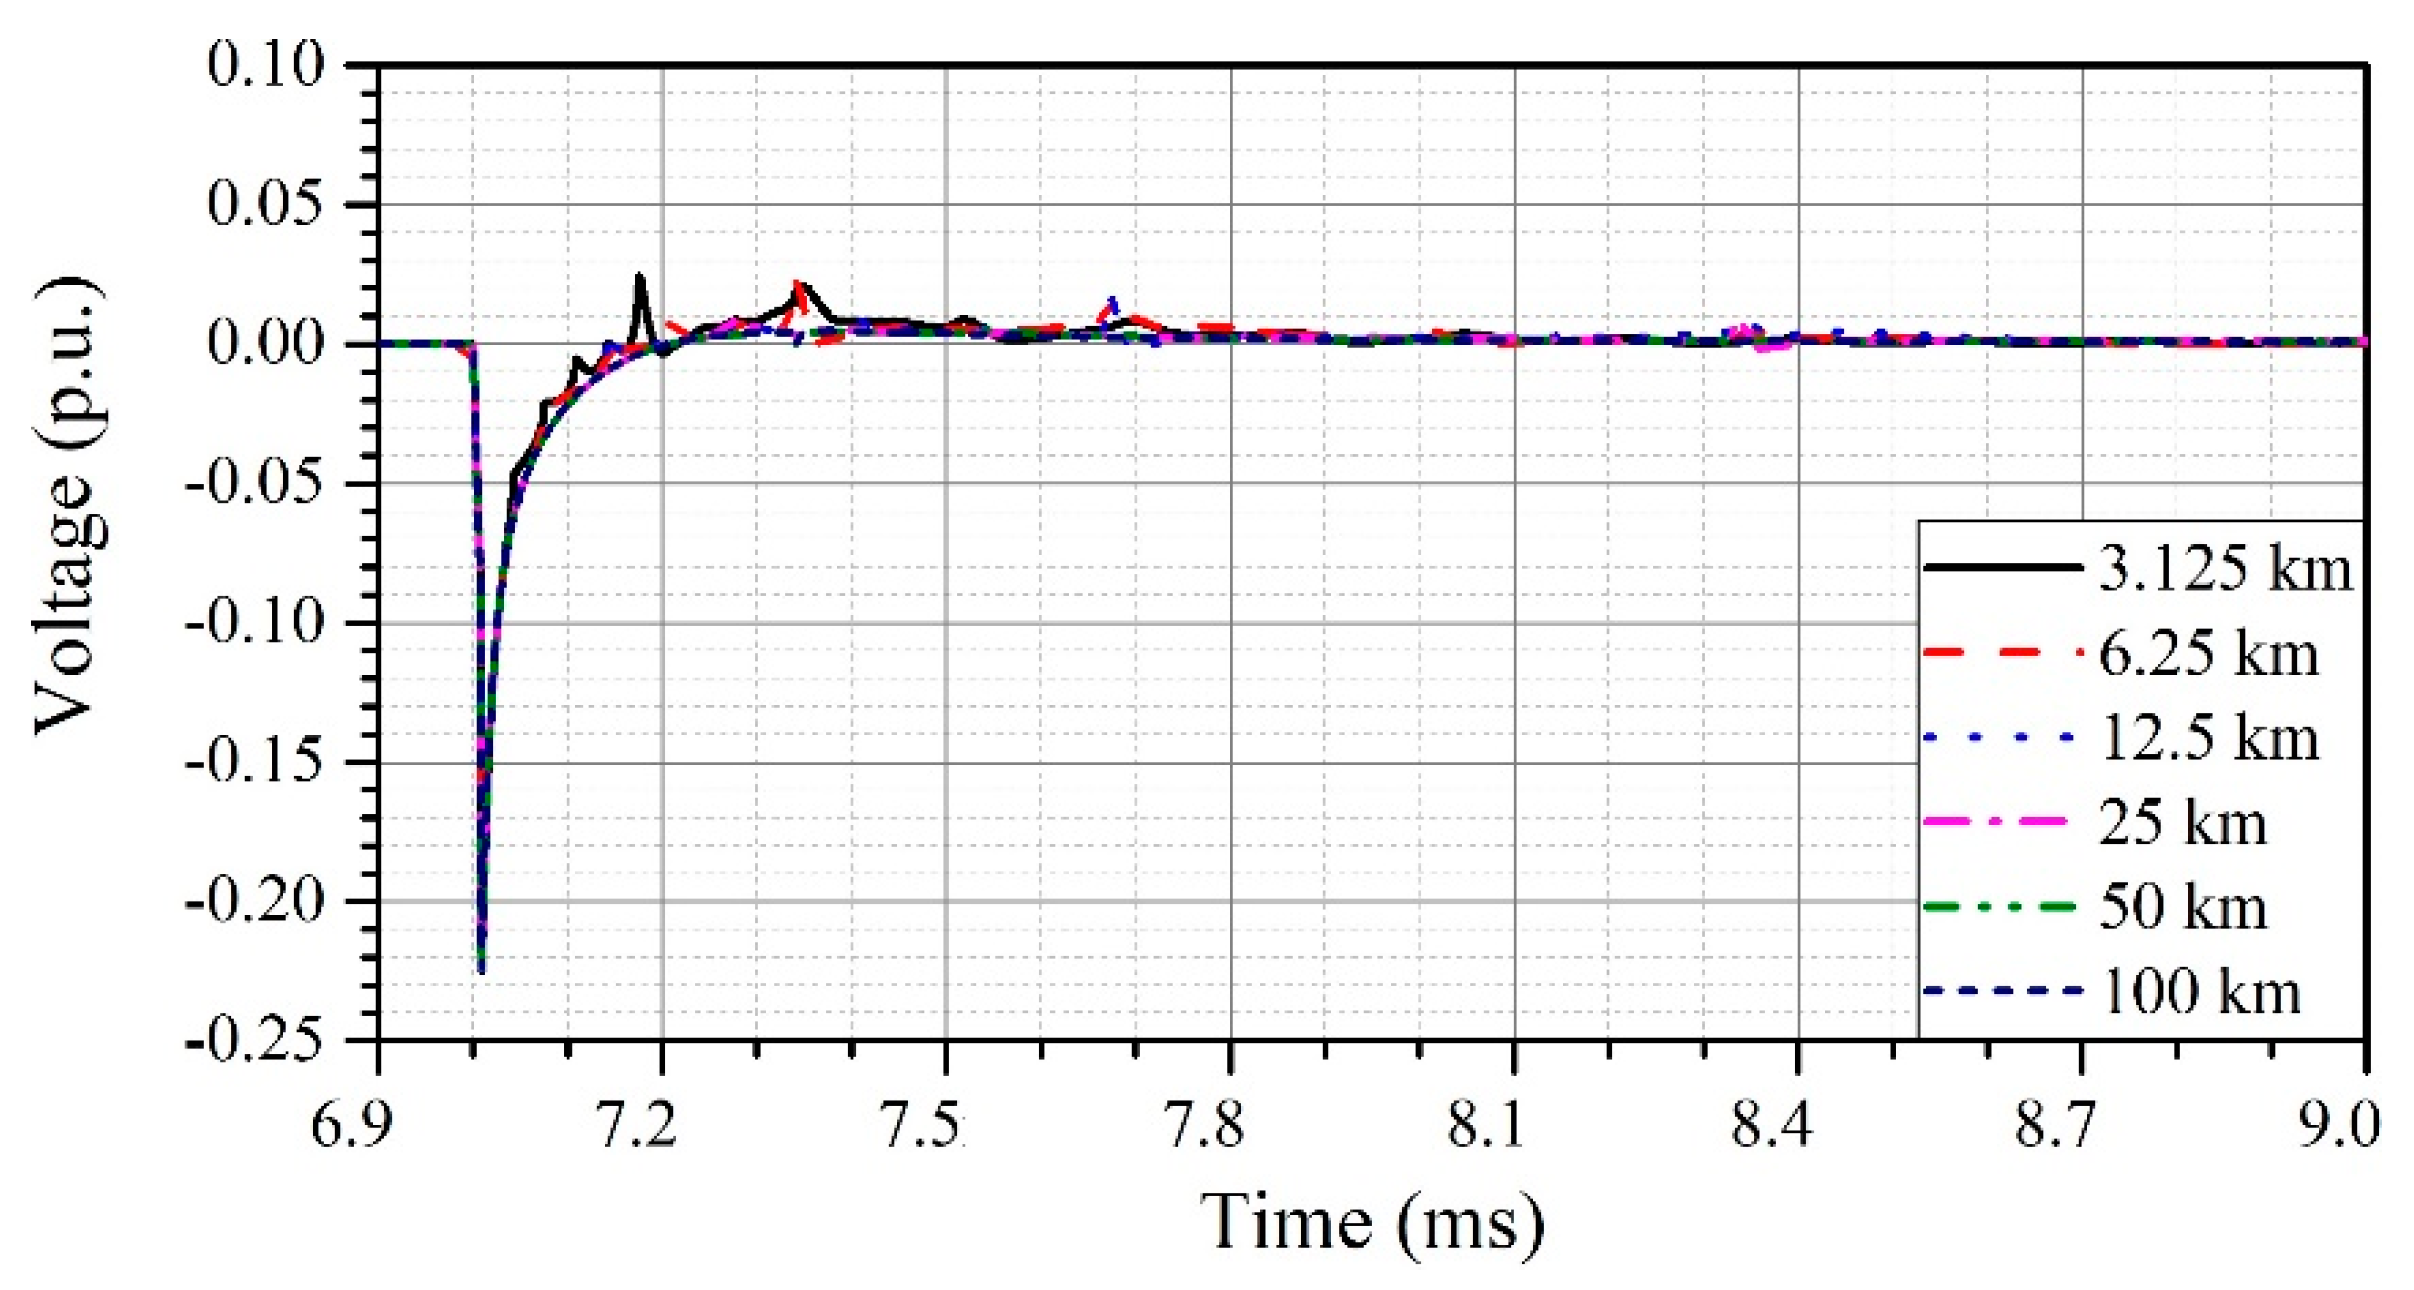
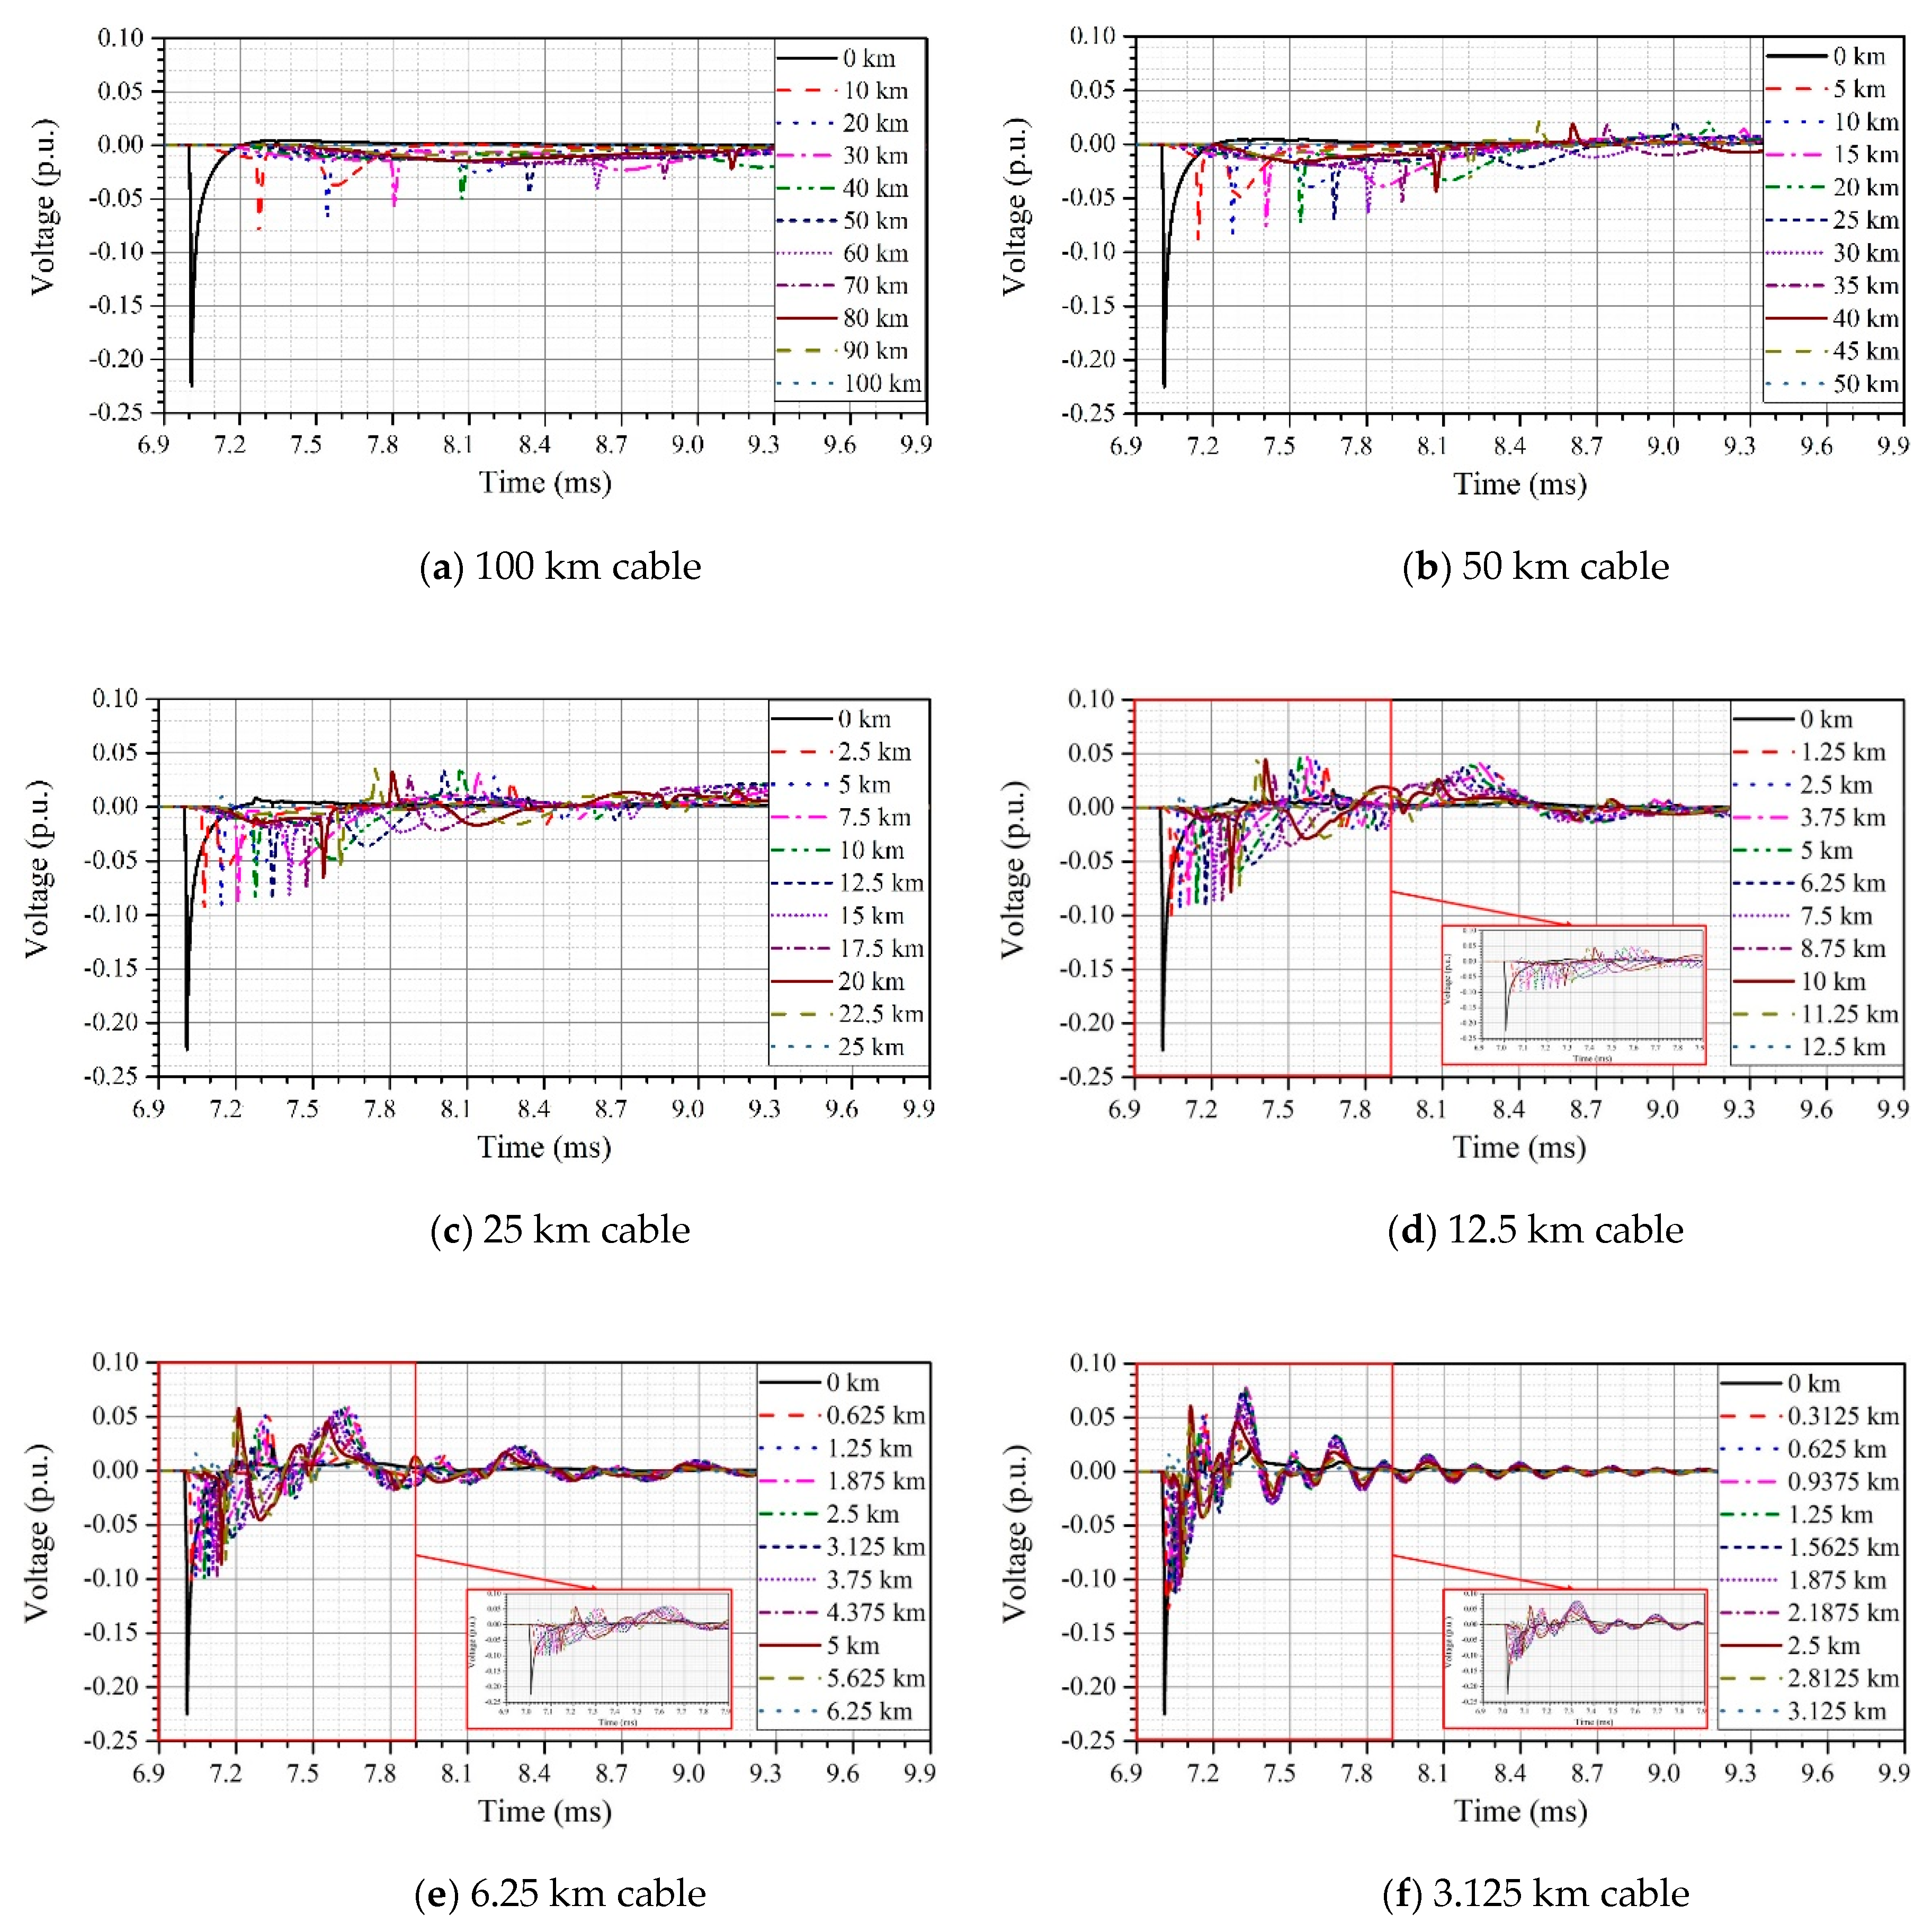
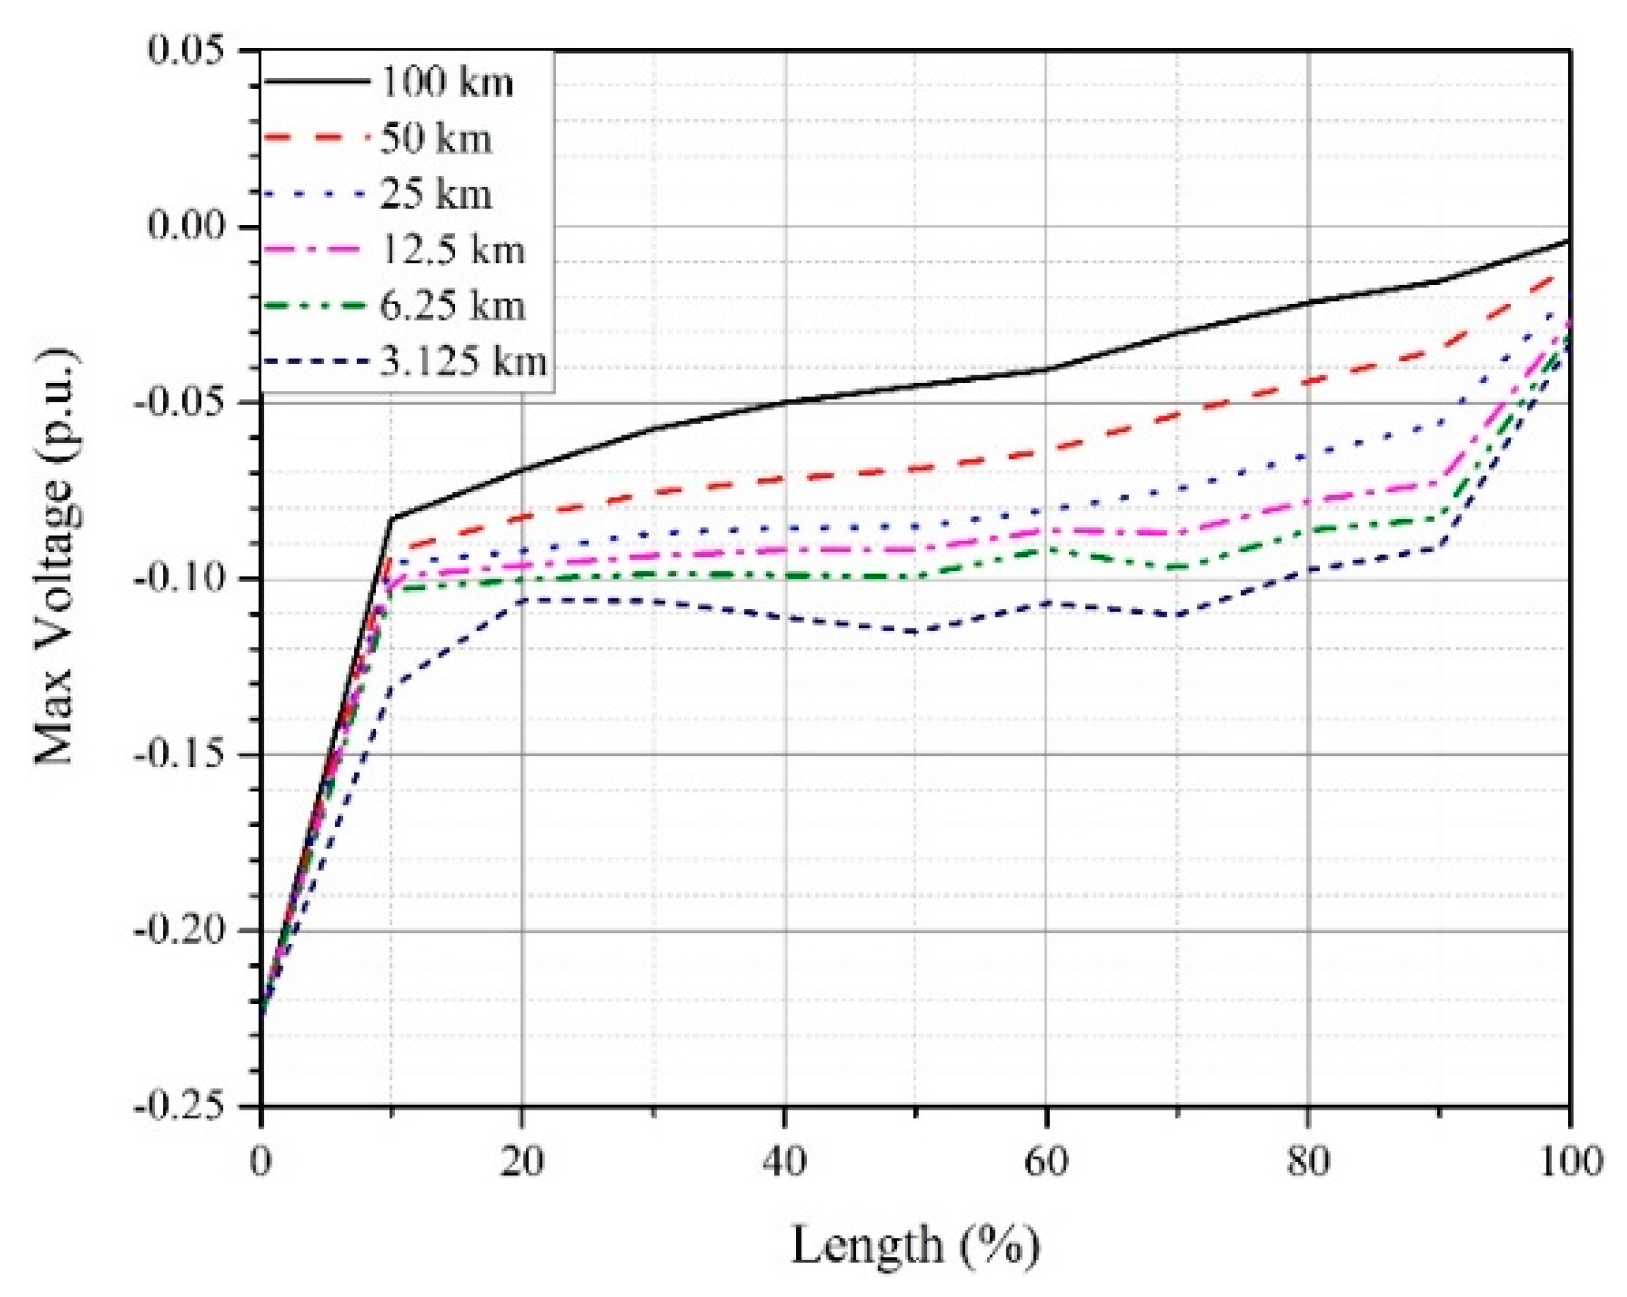
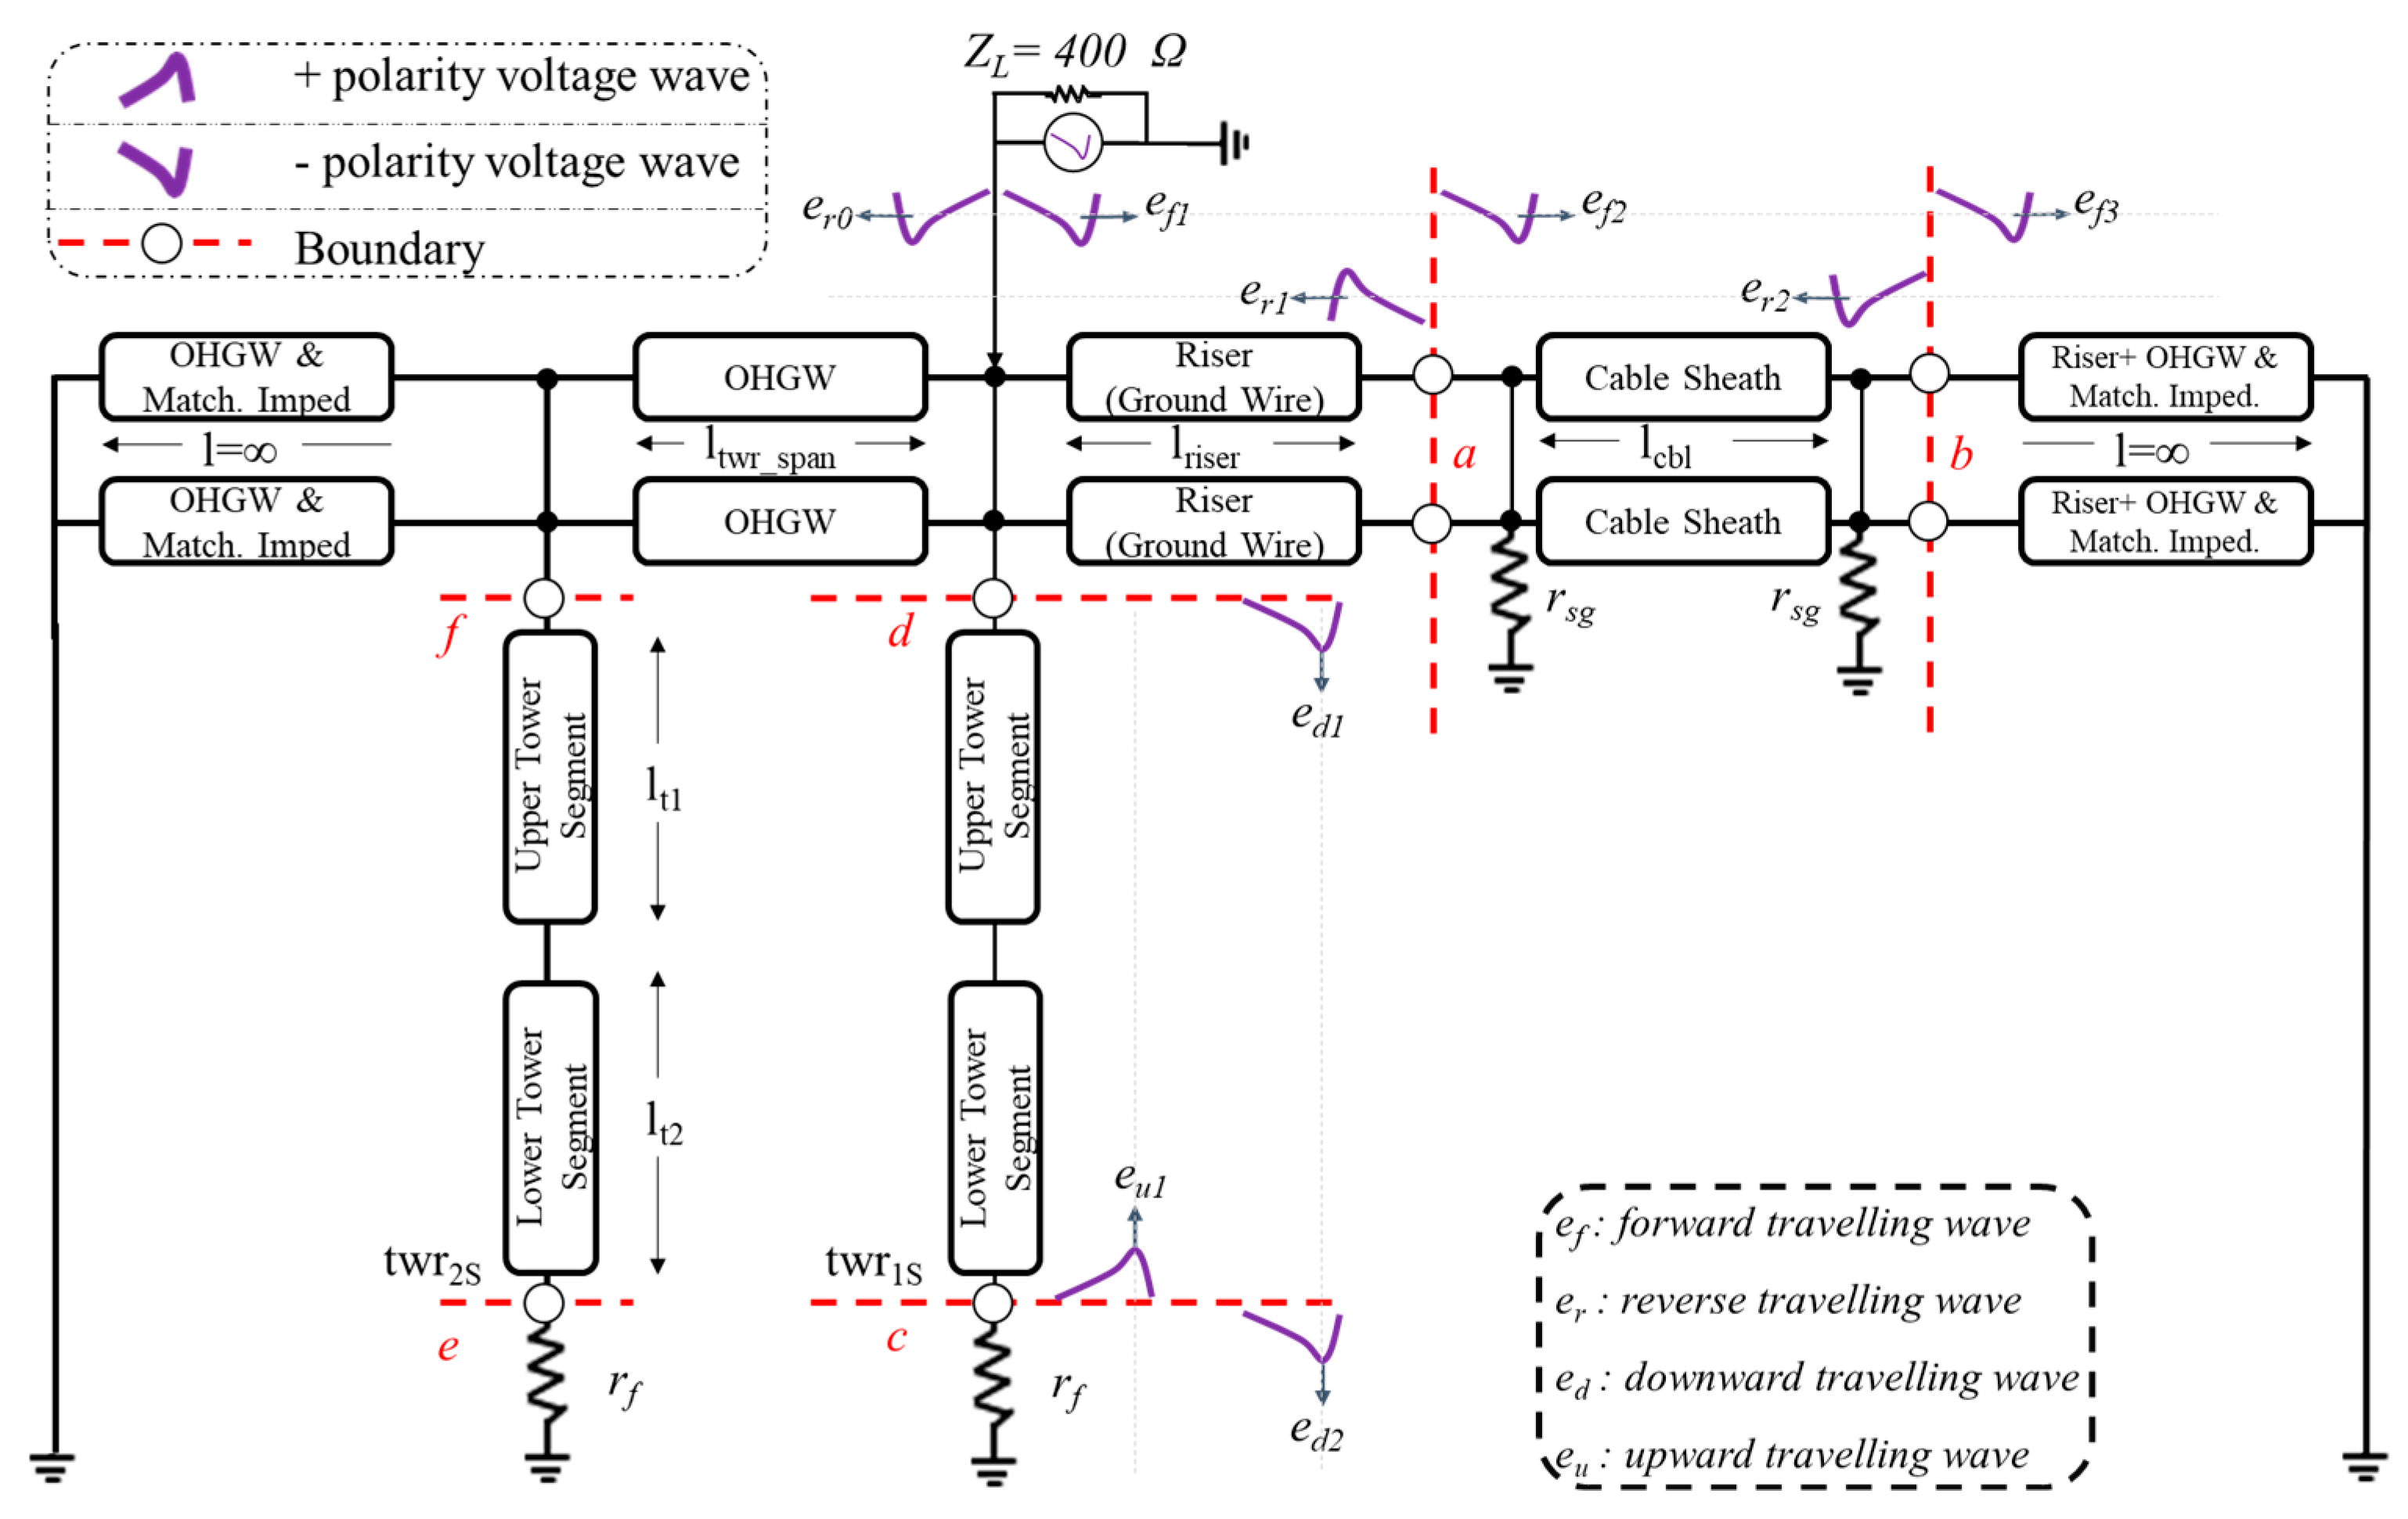
Sheath-Ground Overvoltage
3.1.2. Lightning Strikes on an Overhead Ground Wire/Tower Top
3.2. Insuation Coordination Requirement
3.2.1. Core-Ground Overvoltage
3.2.2. Sheath-Ground Overvoltage
Overhead Power Conductor Strike
Overhead Ground Wire/Tower Top Strike
3.3. Insulation Coordination: Impact and Analysis
3.3.1. Core-Ground Overvoltage
3.3.2. Sheath-Ground Overvoltage
3.3.3. Flashover Performance of Overhead Line Insulators
Strike on Overhead Power Conductors
Strike on Overhead Ground Wire/Tower Top
4. Conclusions
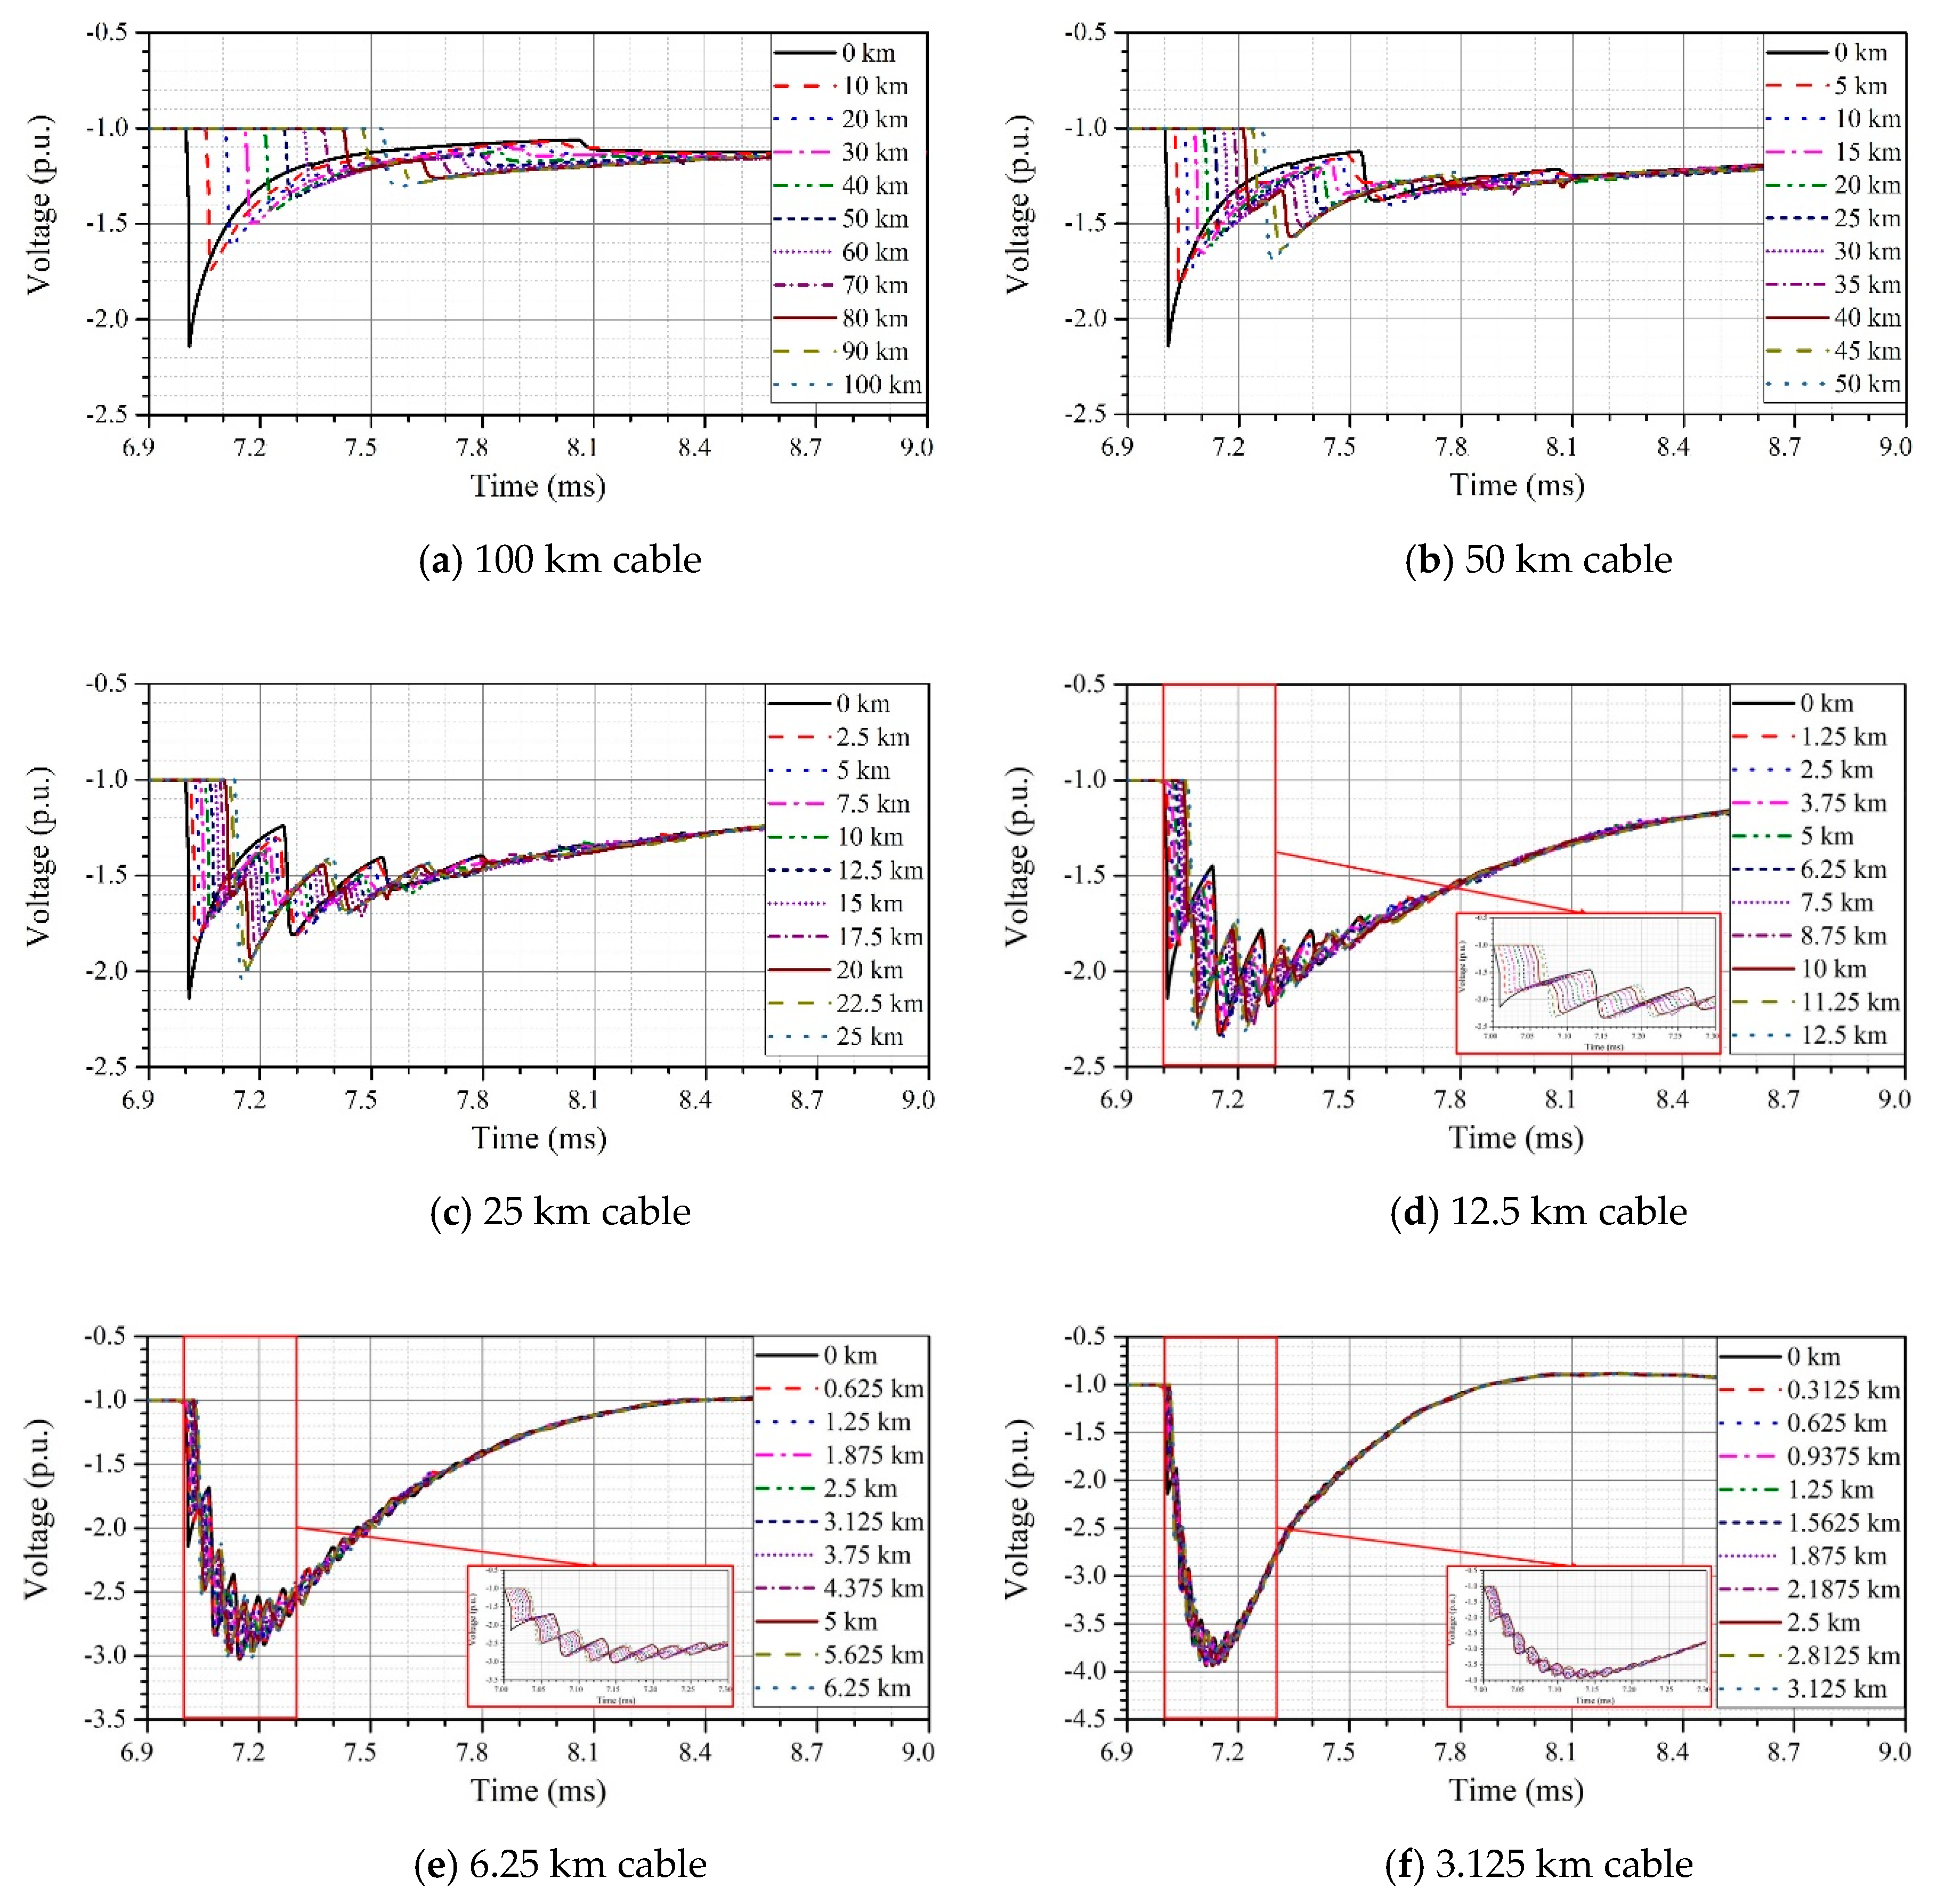
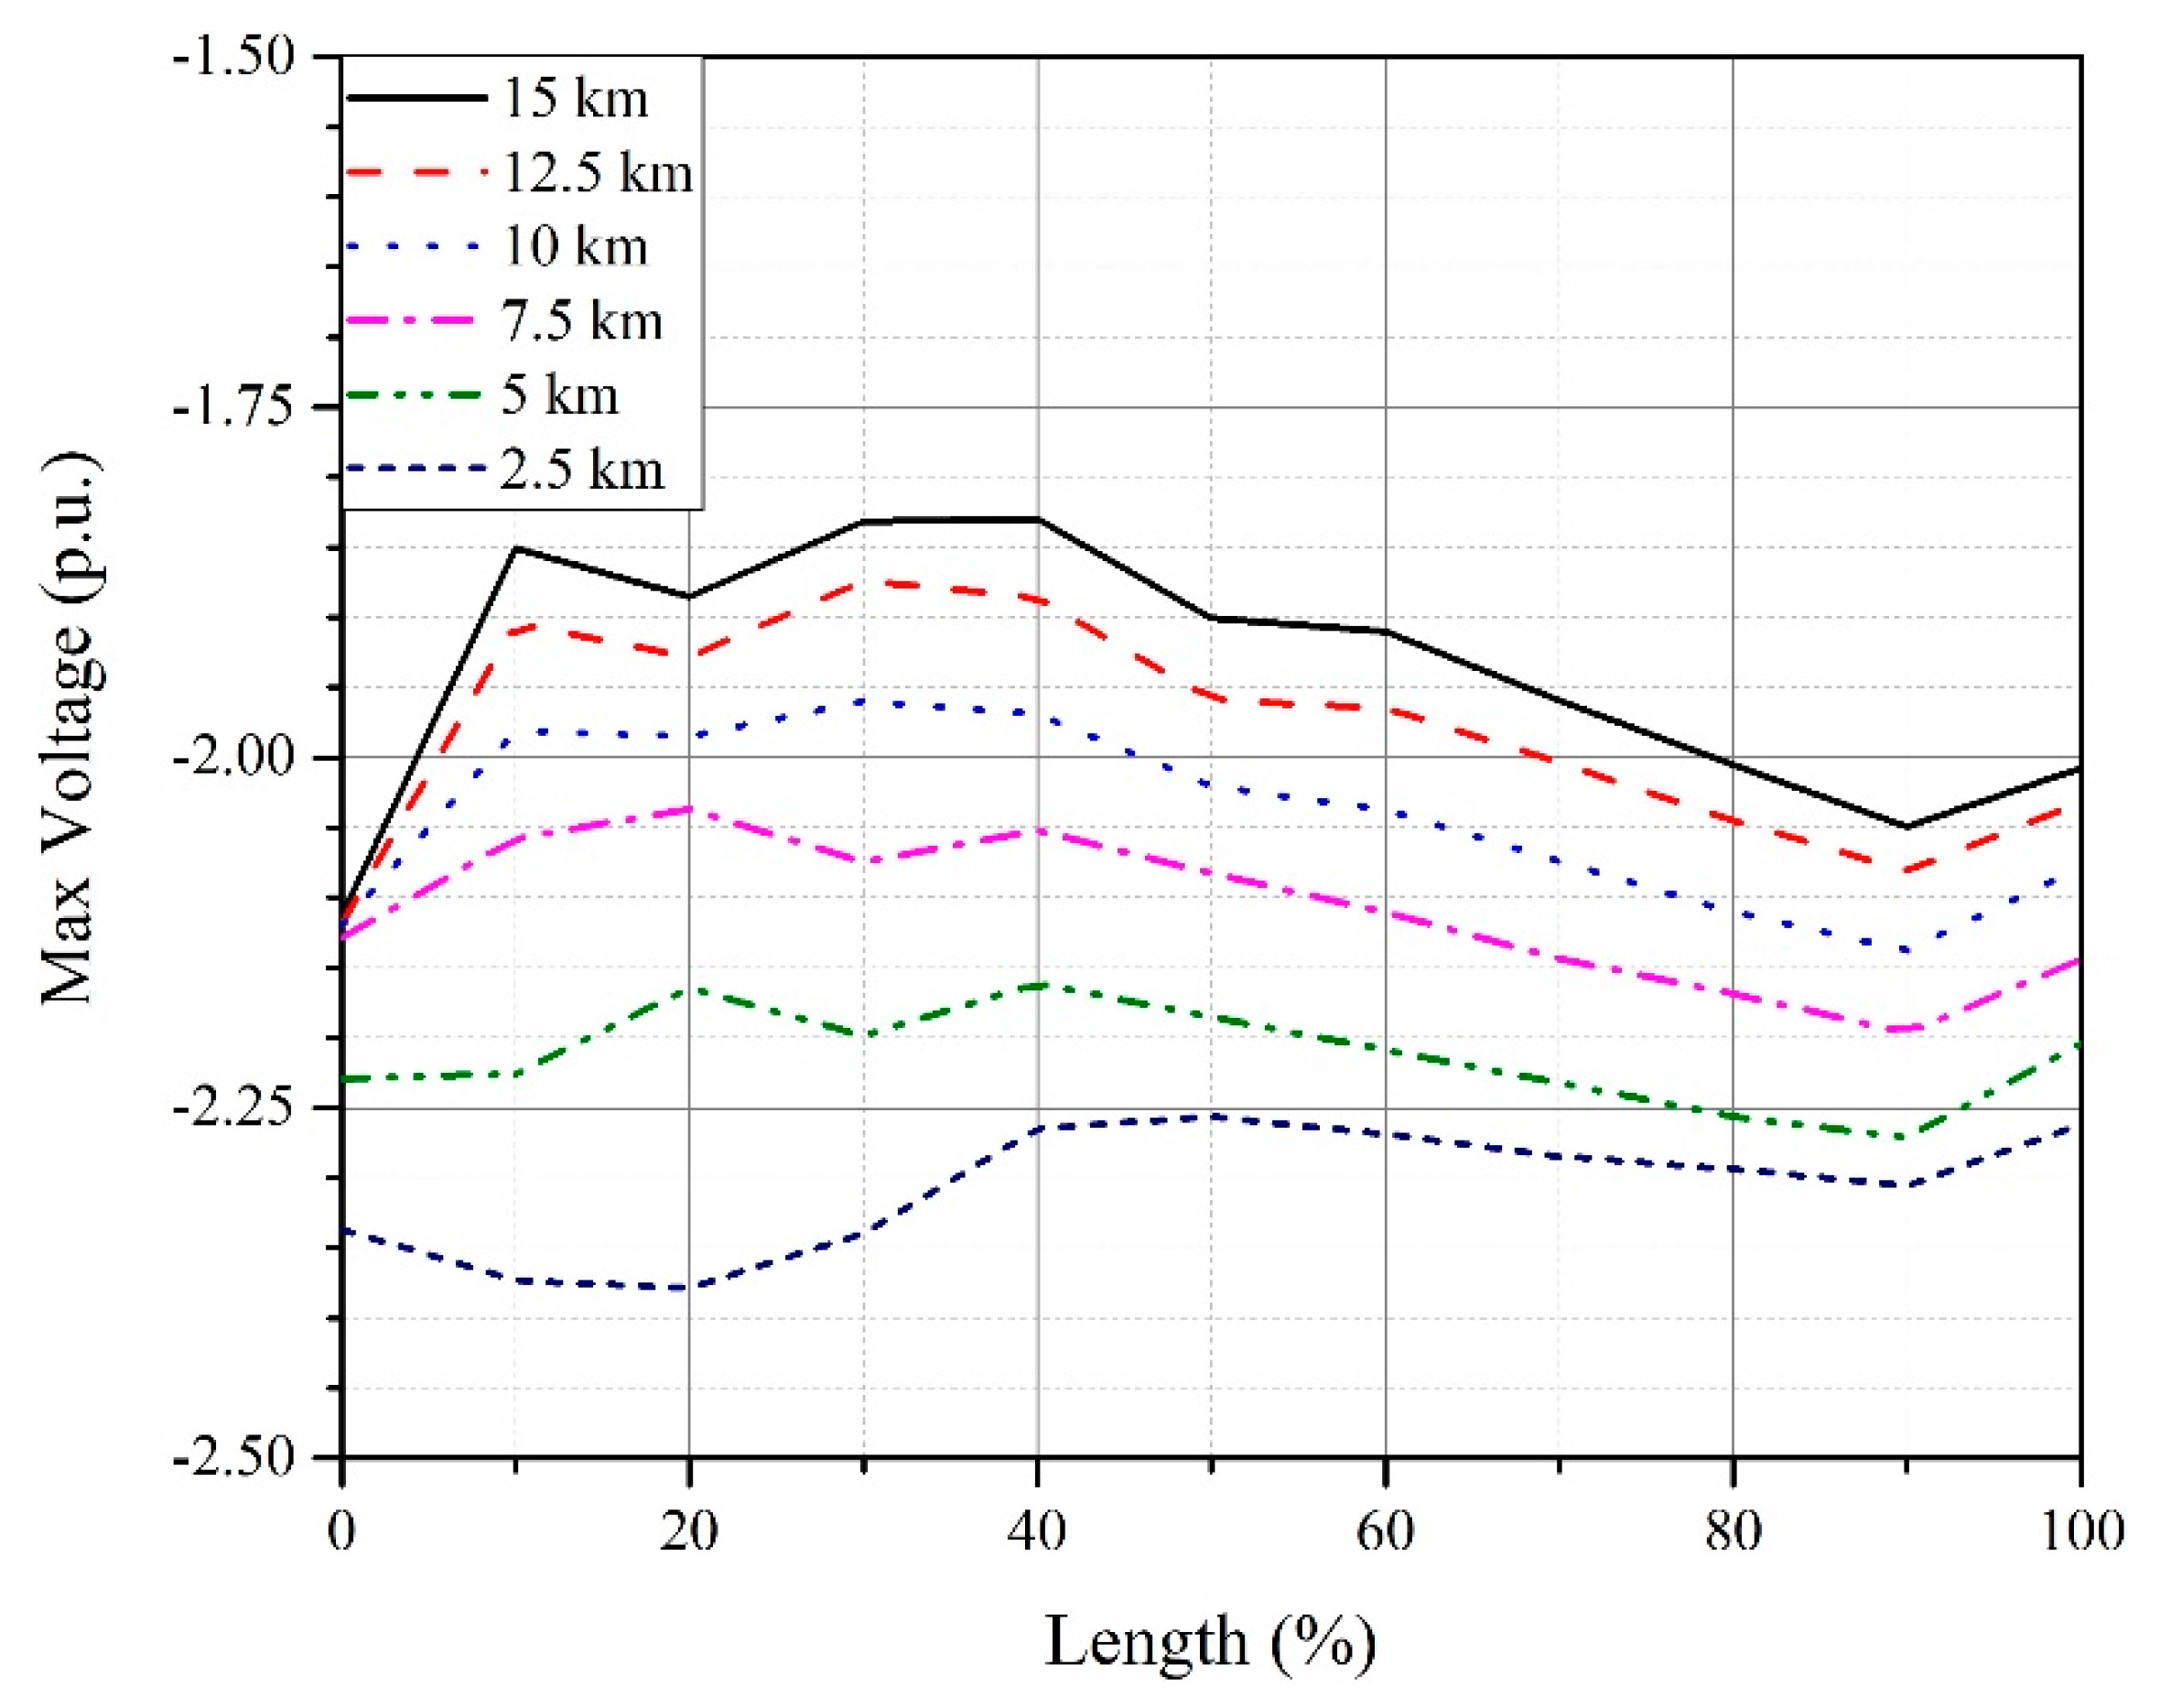
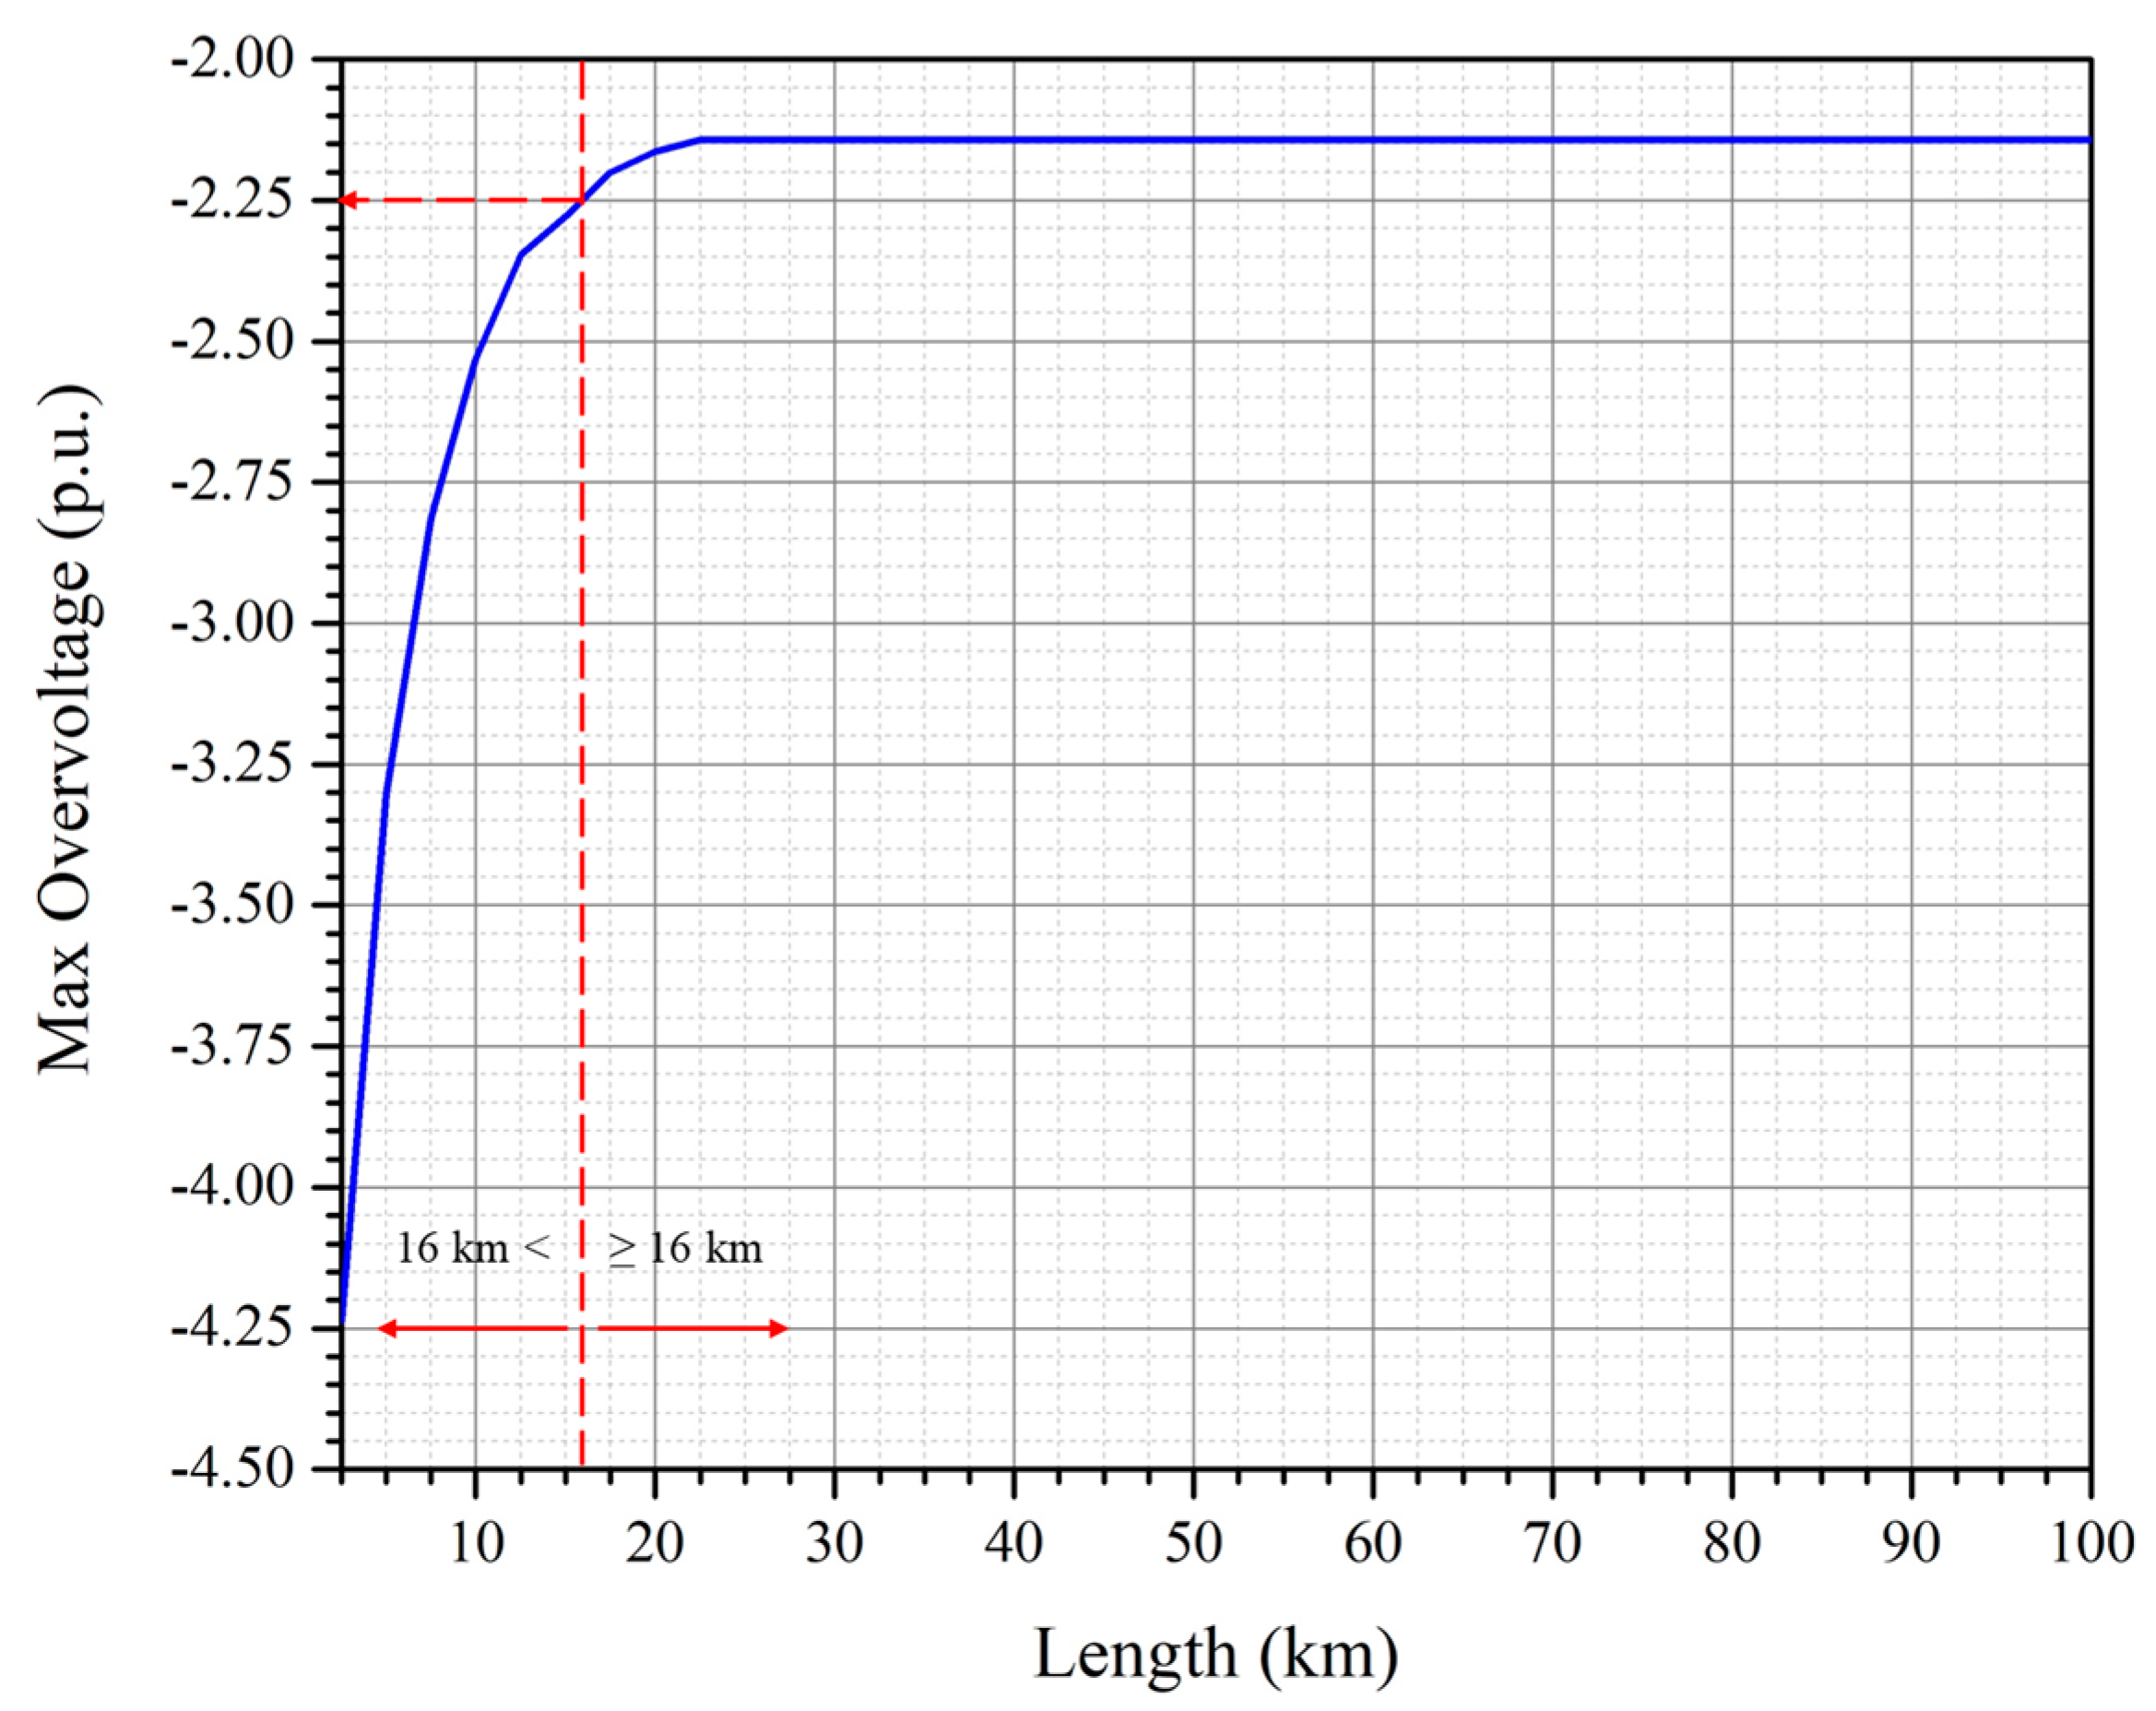
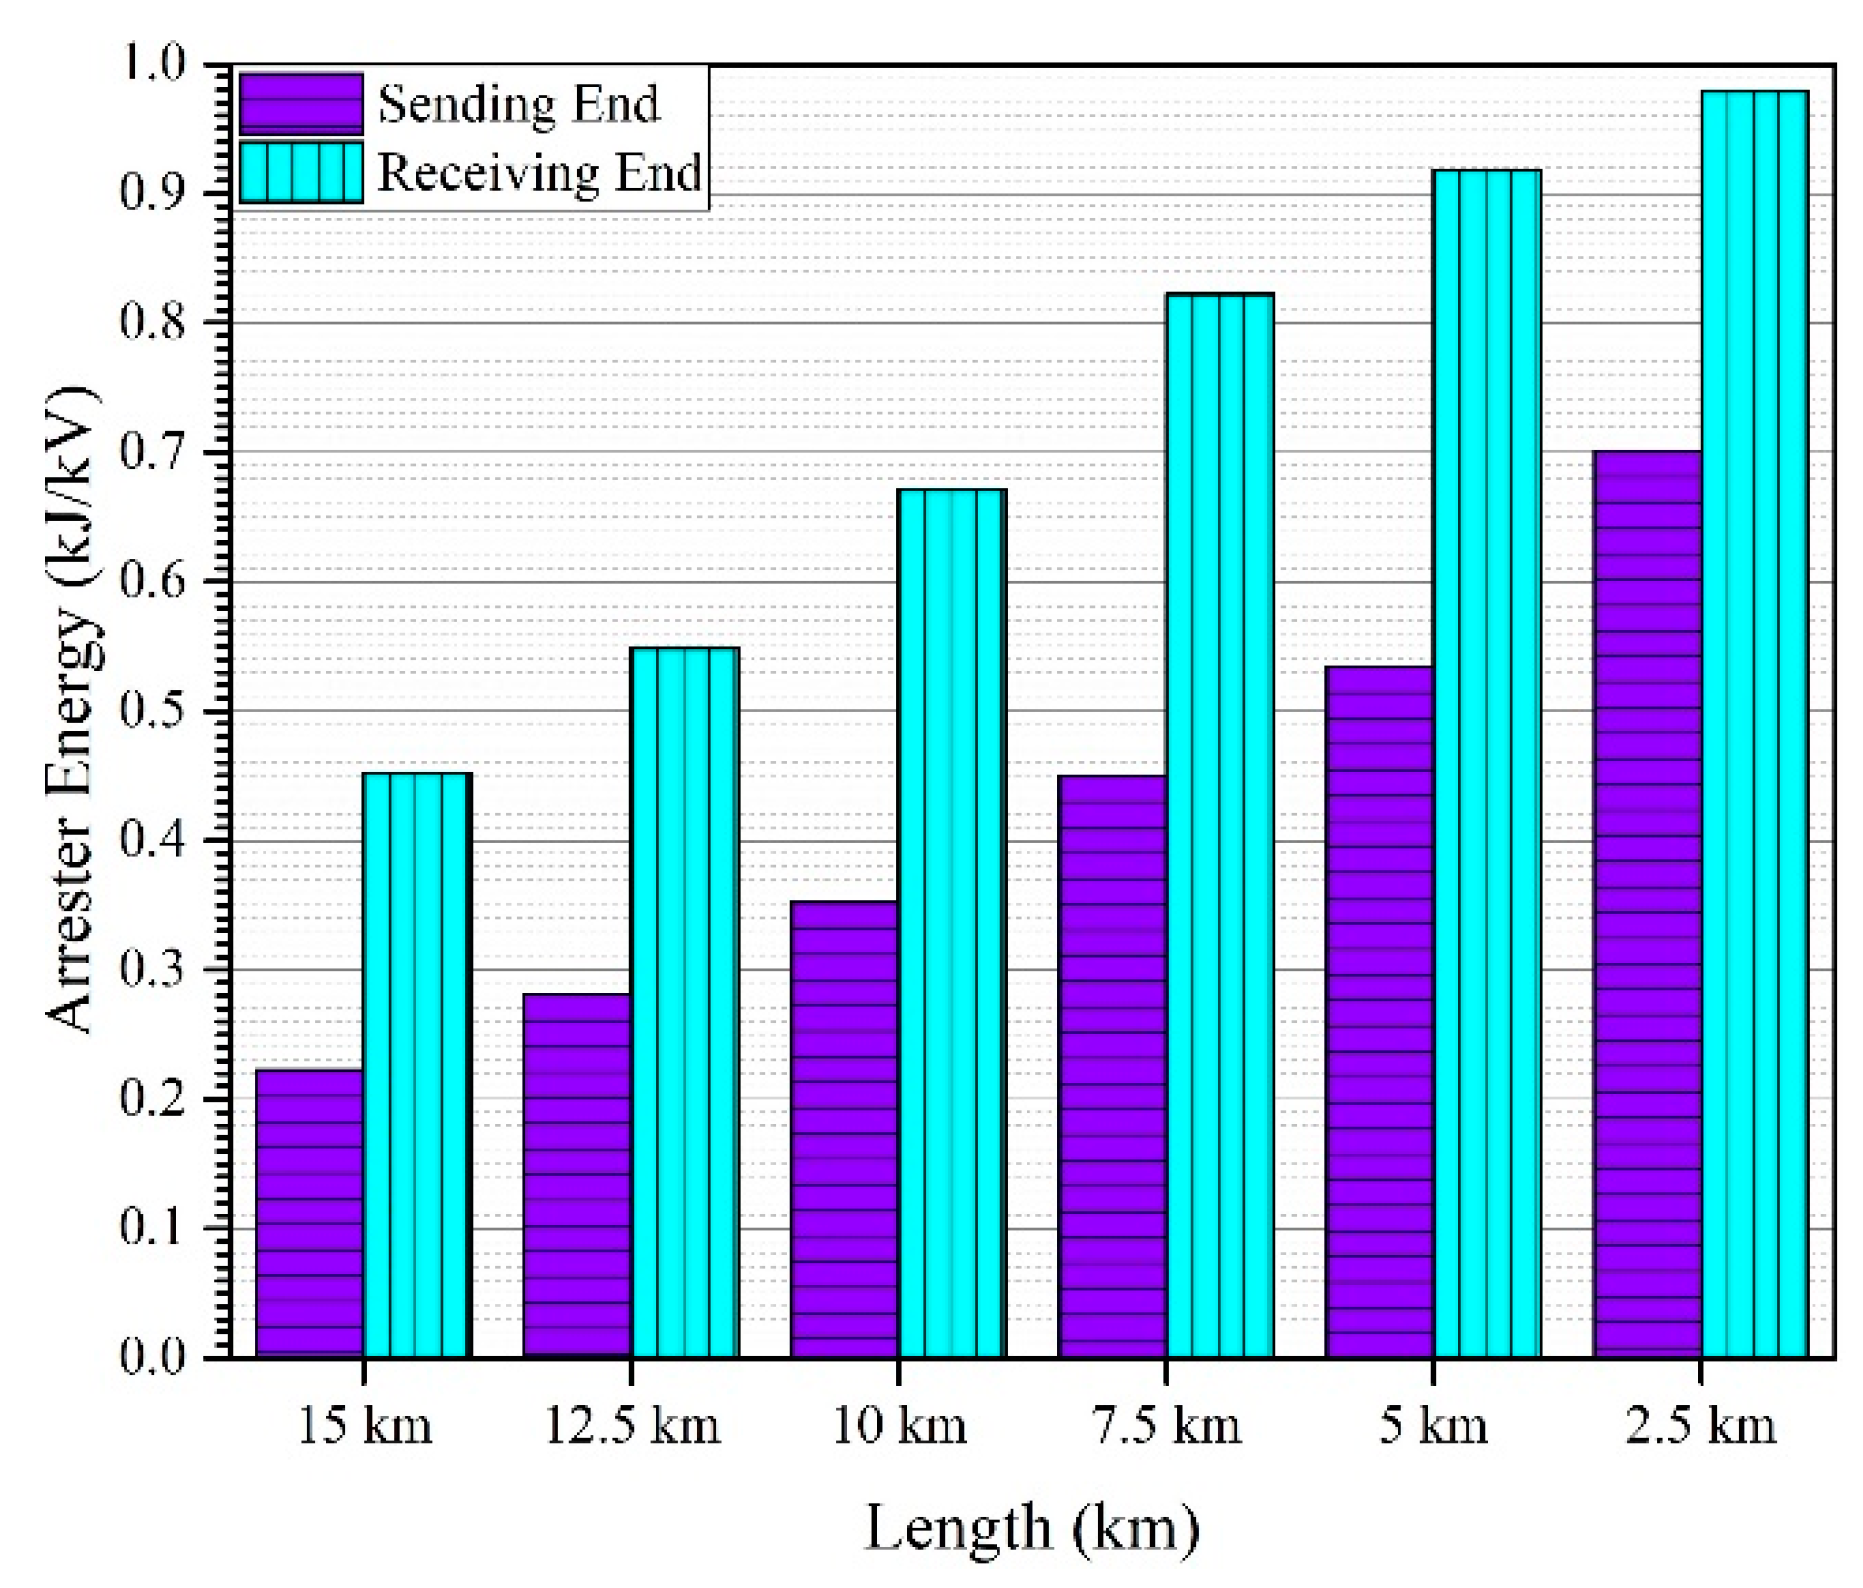
- The maximum core-ground overvoltage increases with a decrease in the length of the cable. This behavior is experienced due to a positive reflection coefficient at the receiving end boundary of the cable. For cables, shorter than 16 km, the magnitude of overvoltage is expected to exceed the LIPL of the cable. Therefore, surge arresters should be installed at the terminals of such cables.
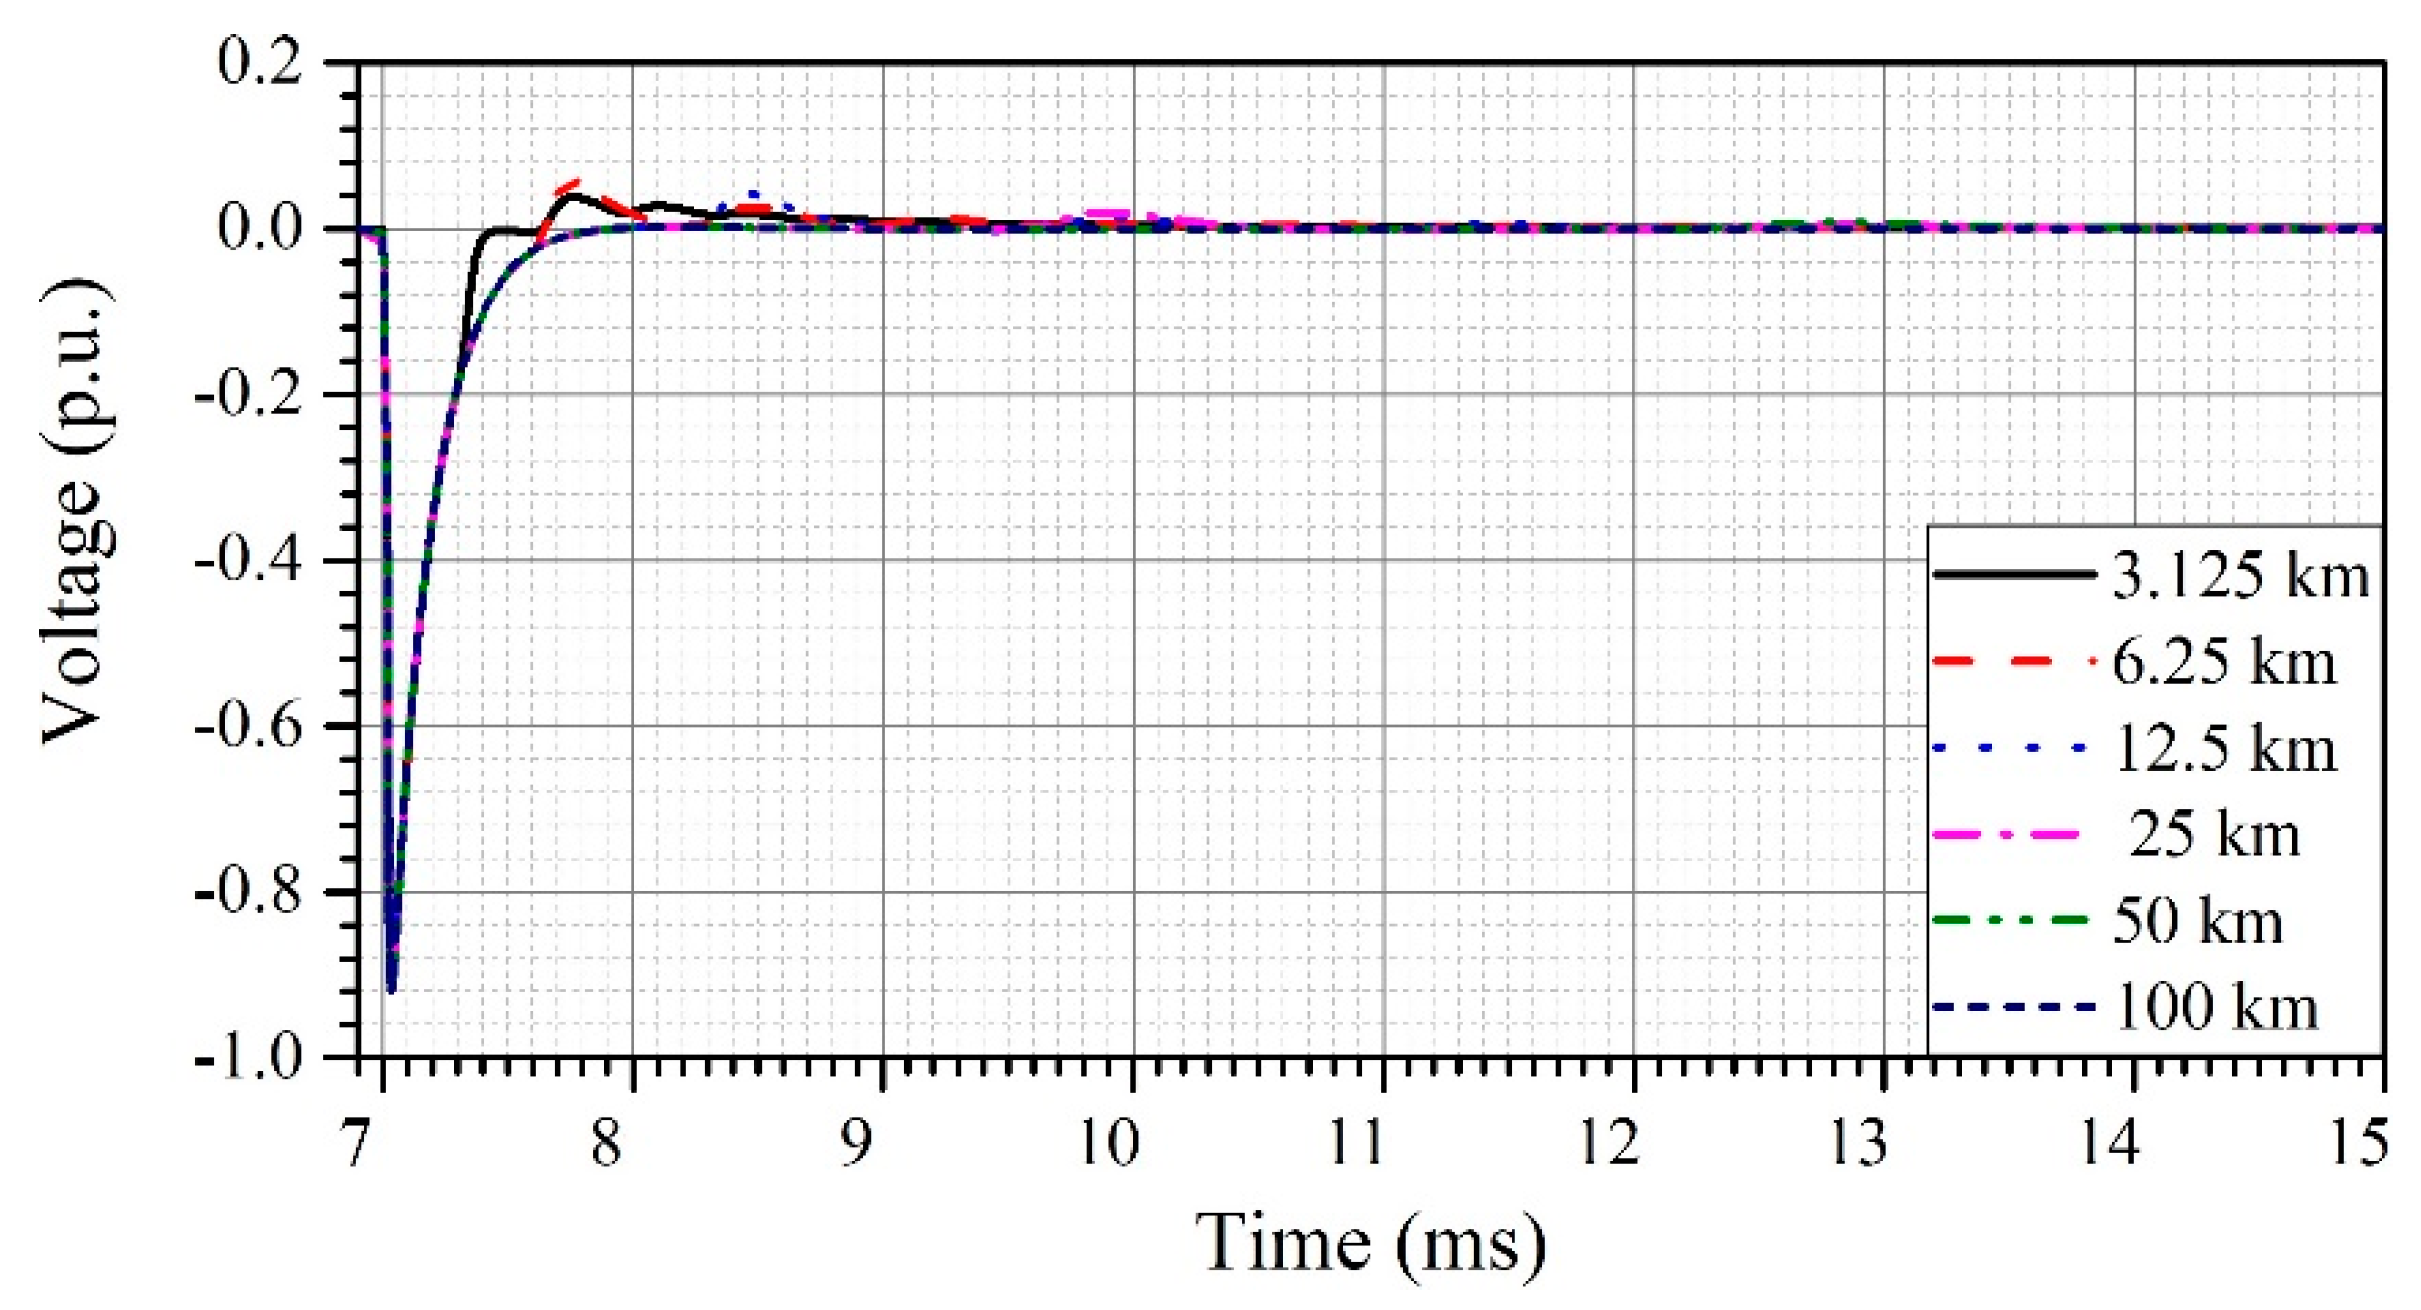
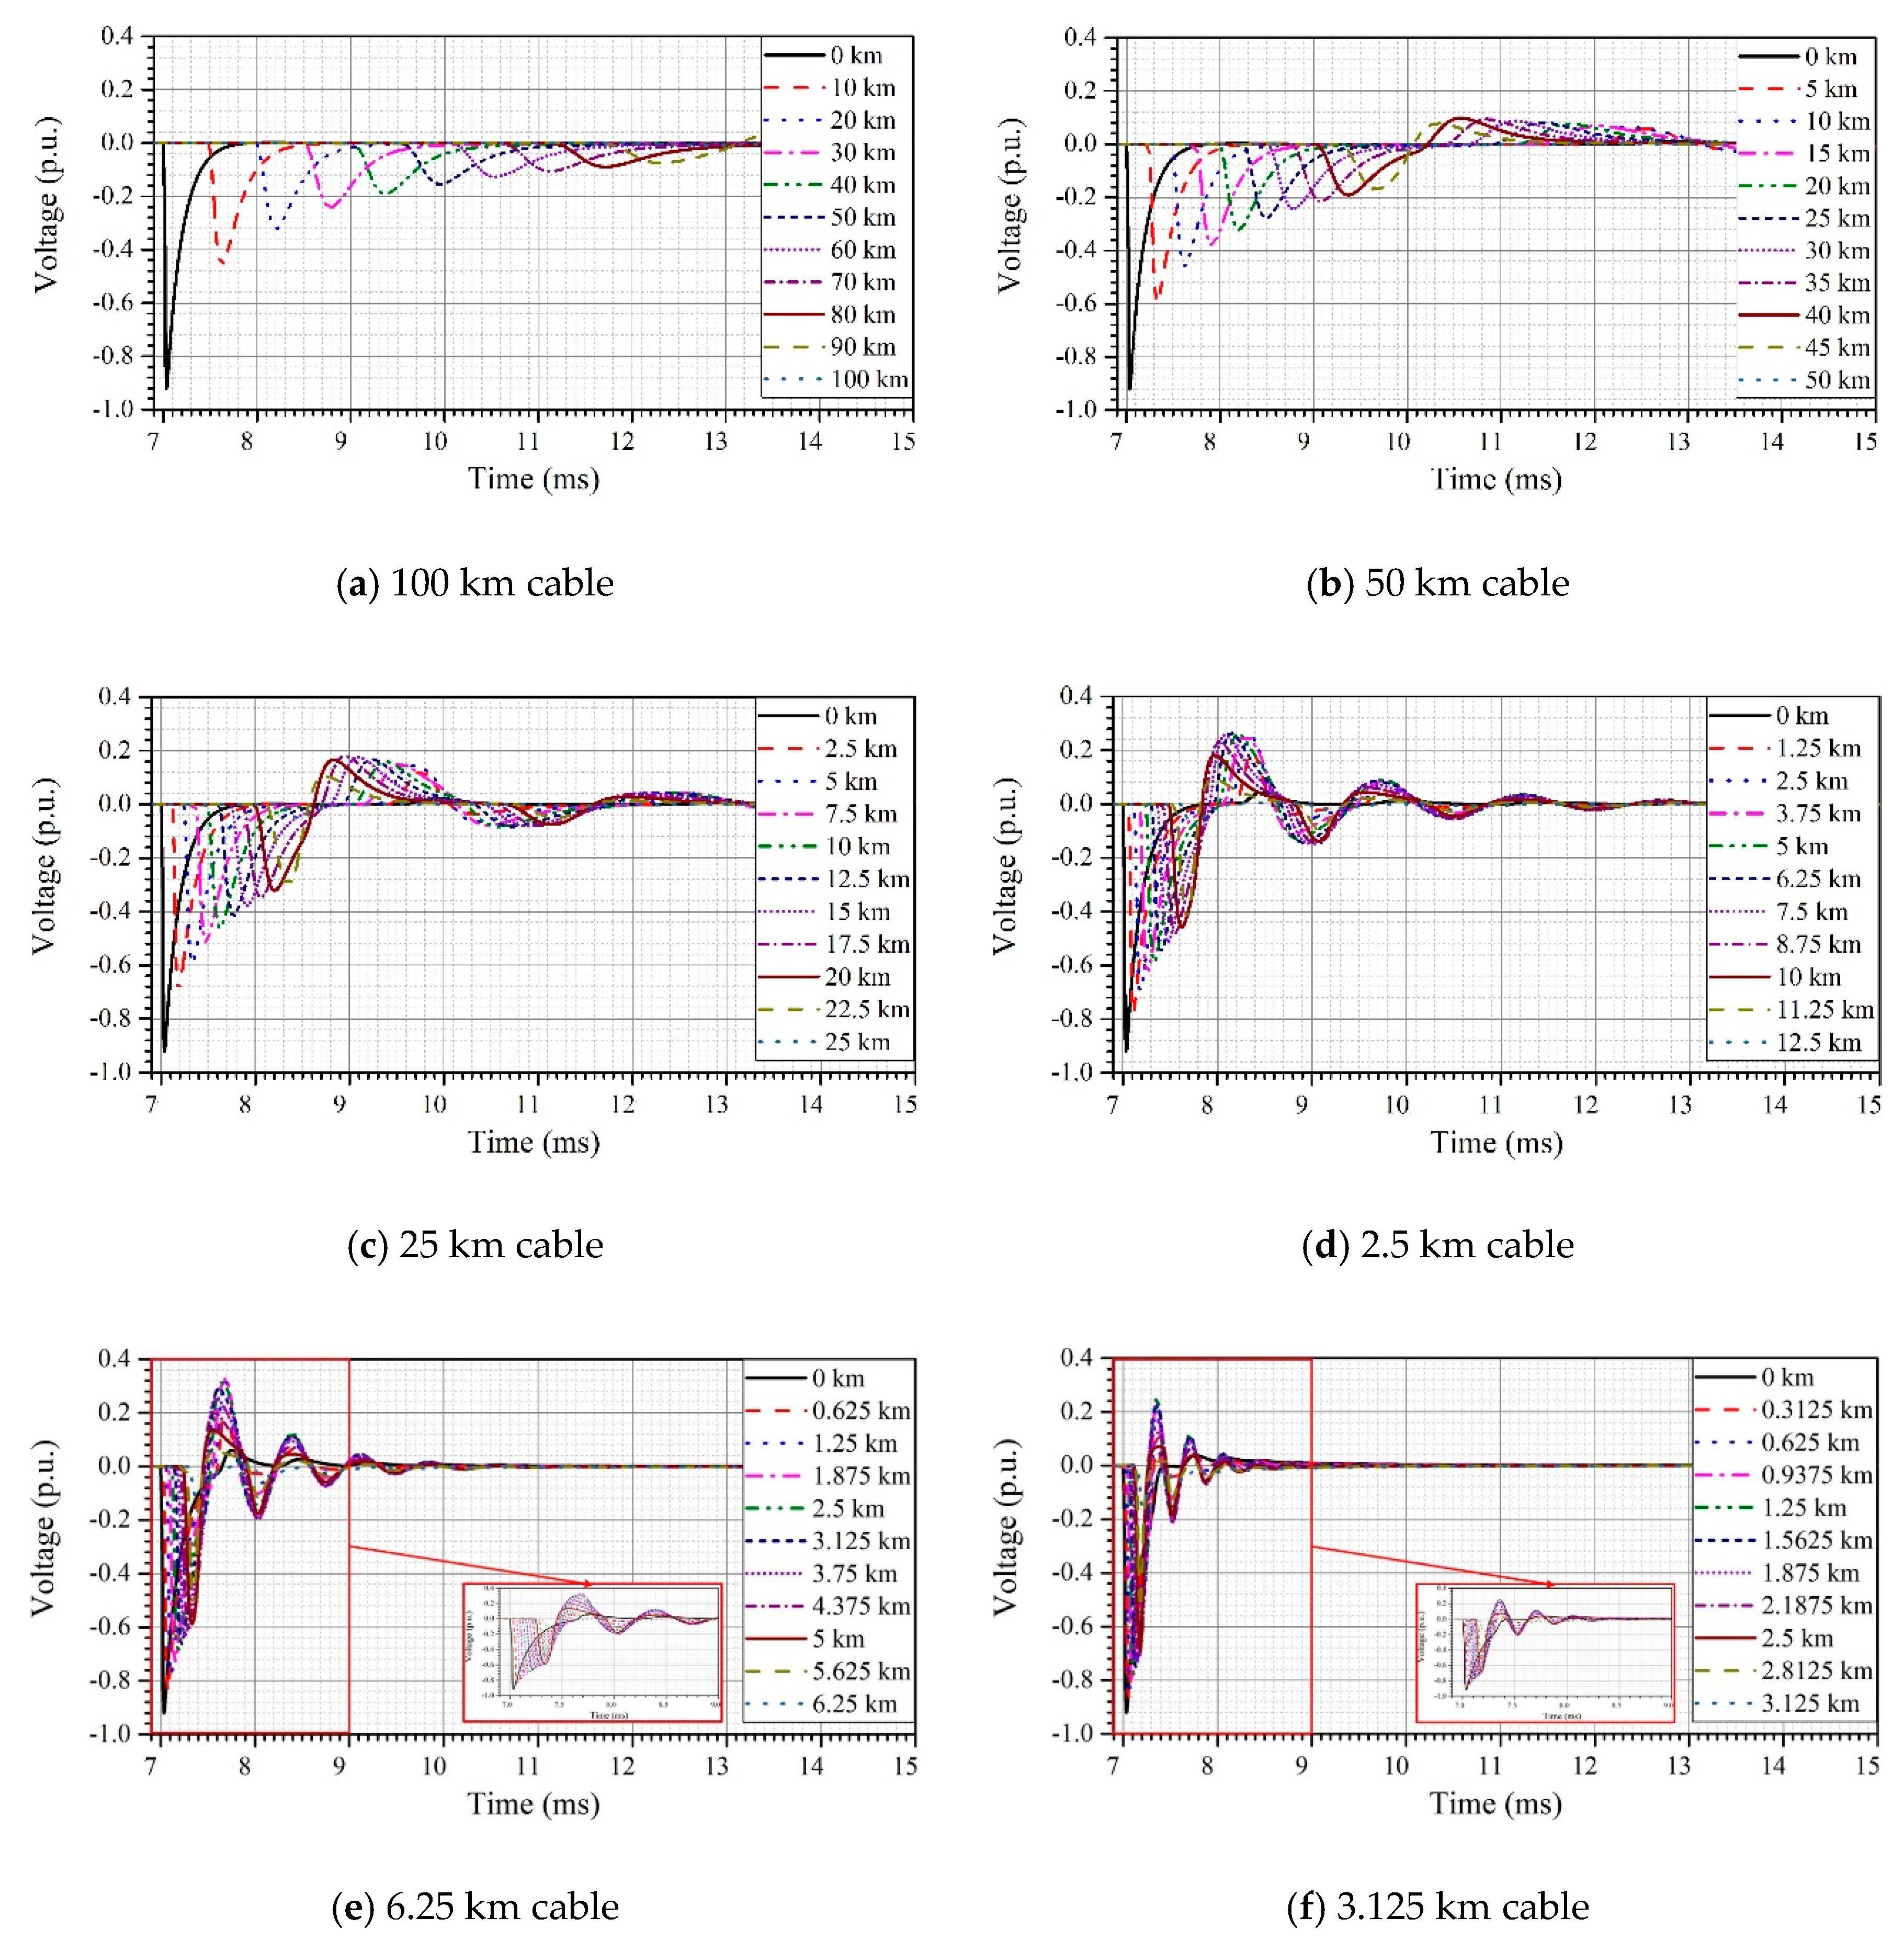
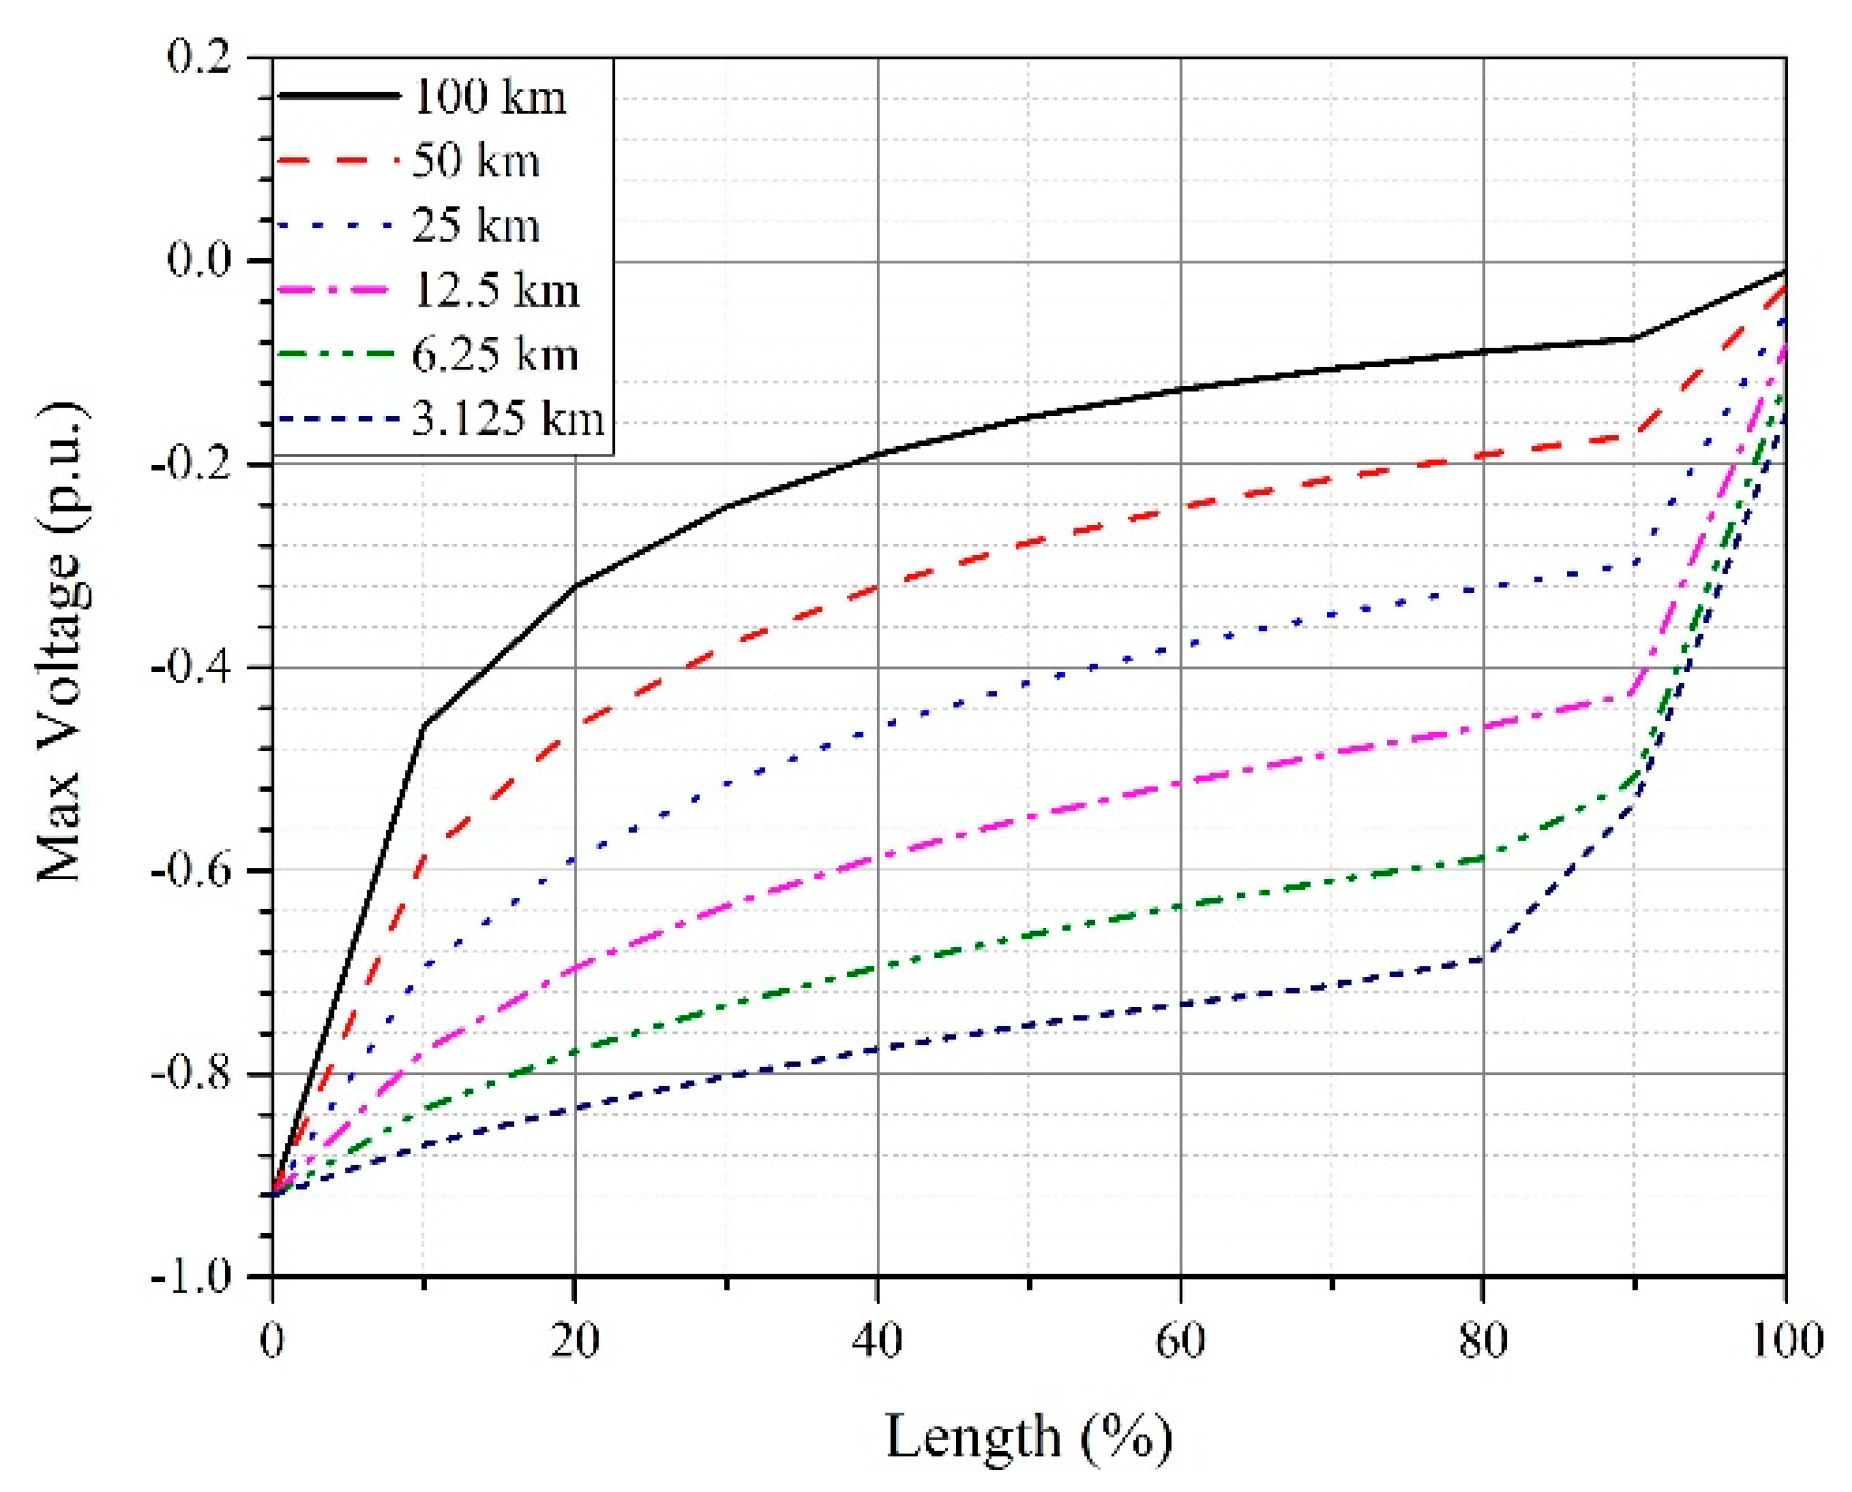
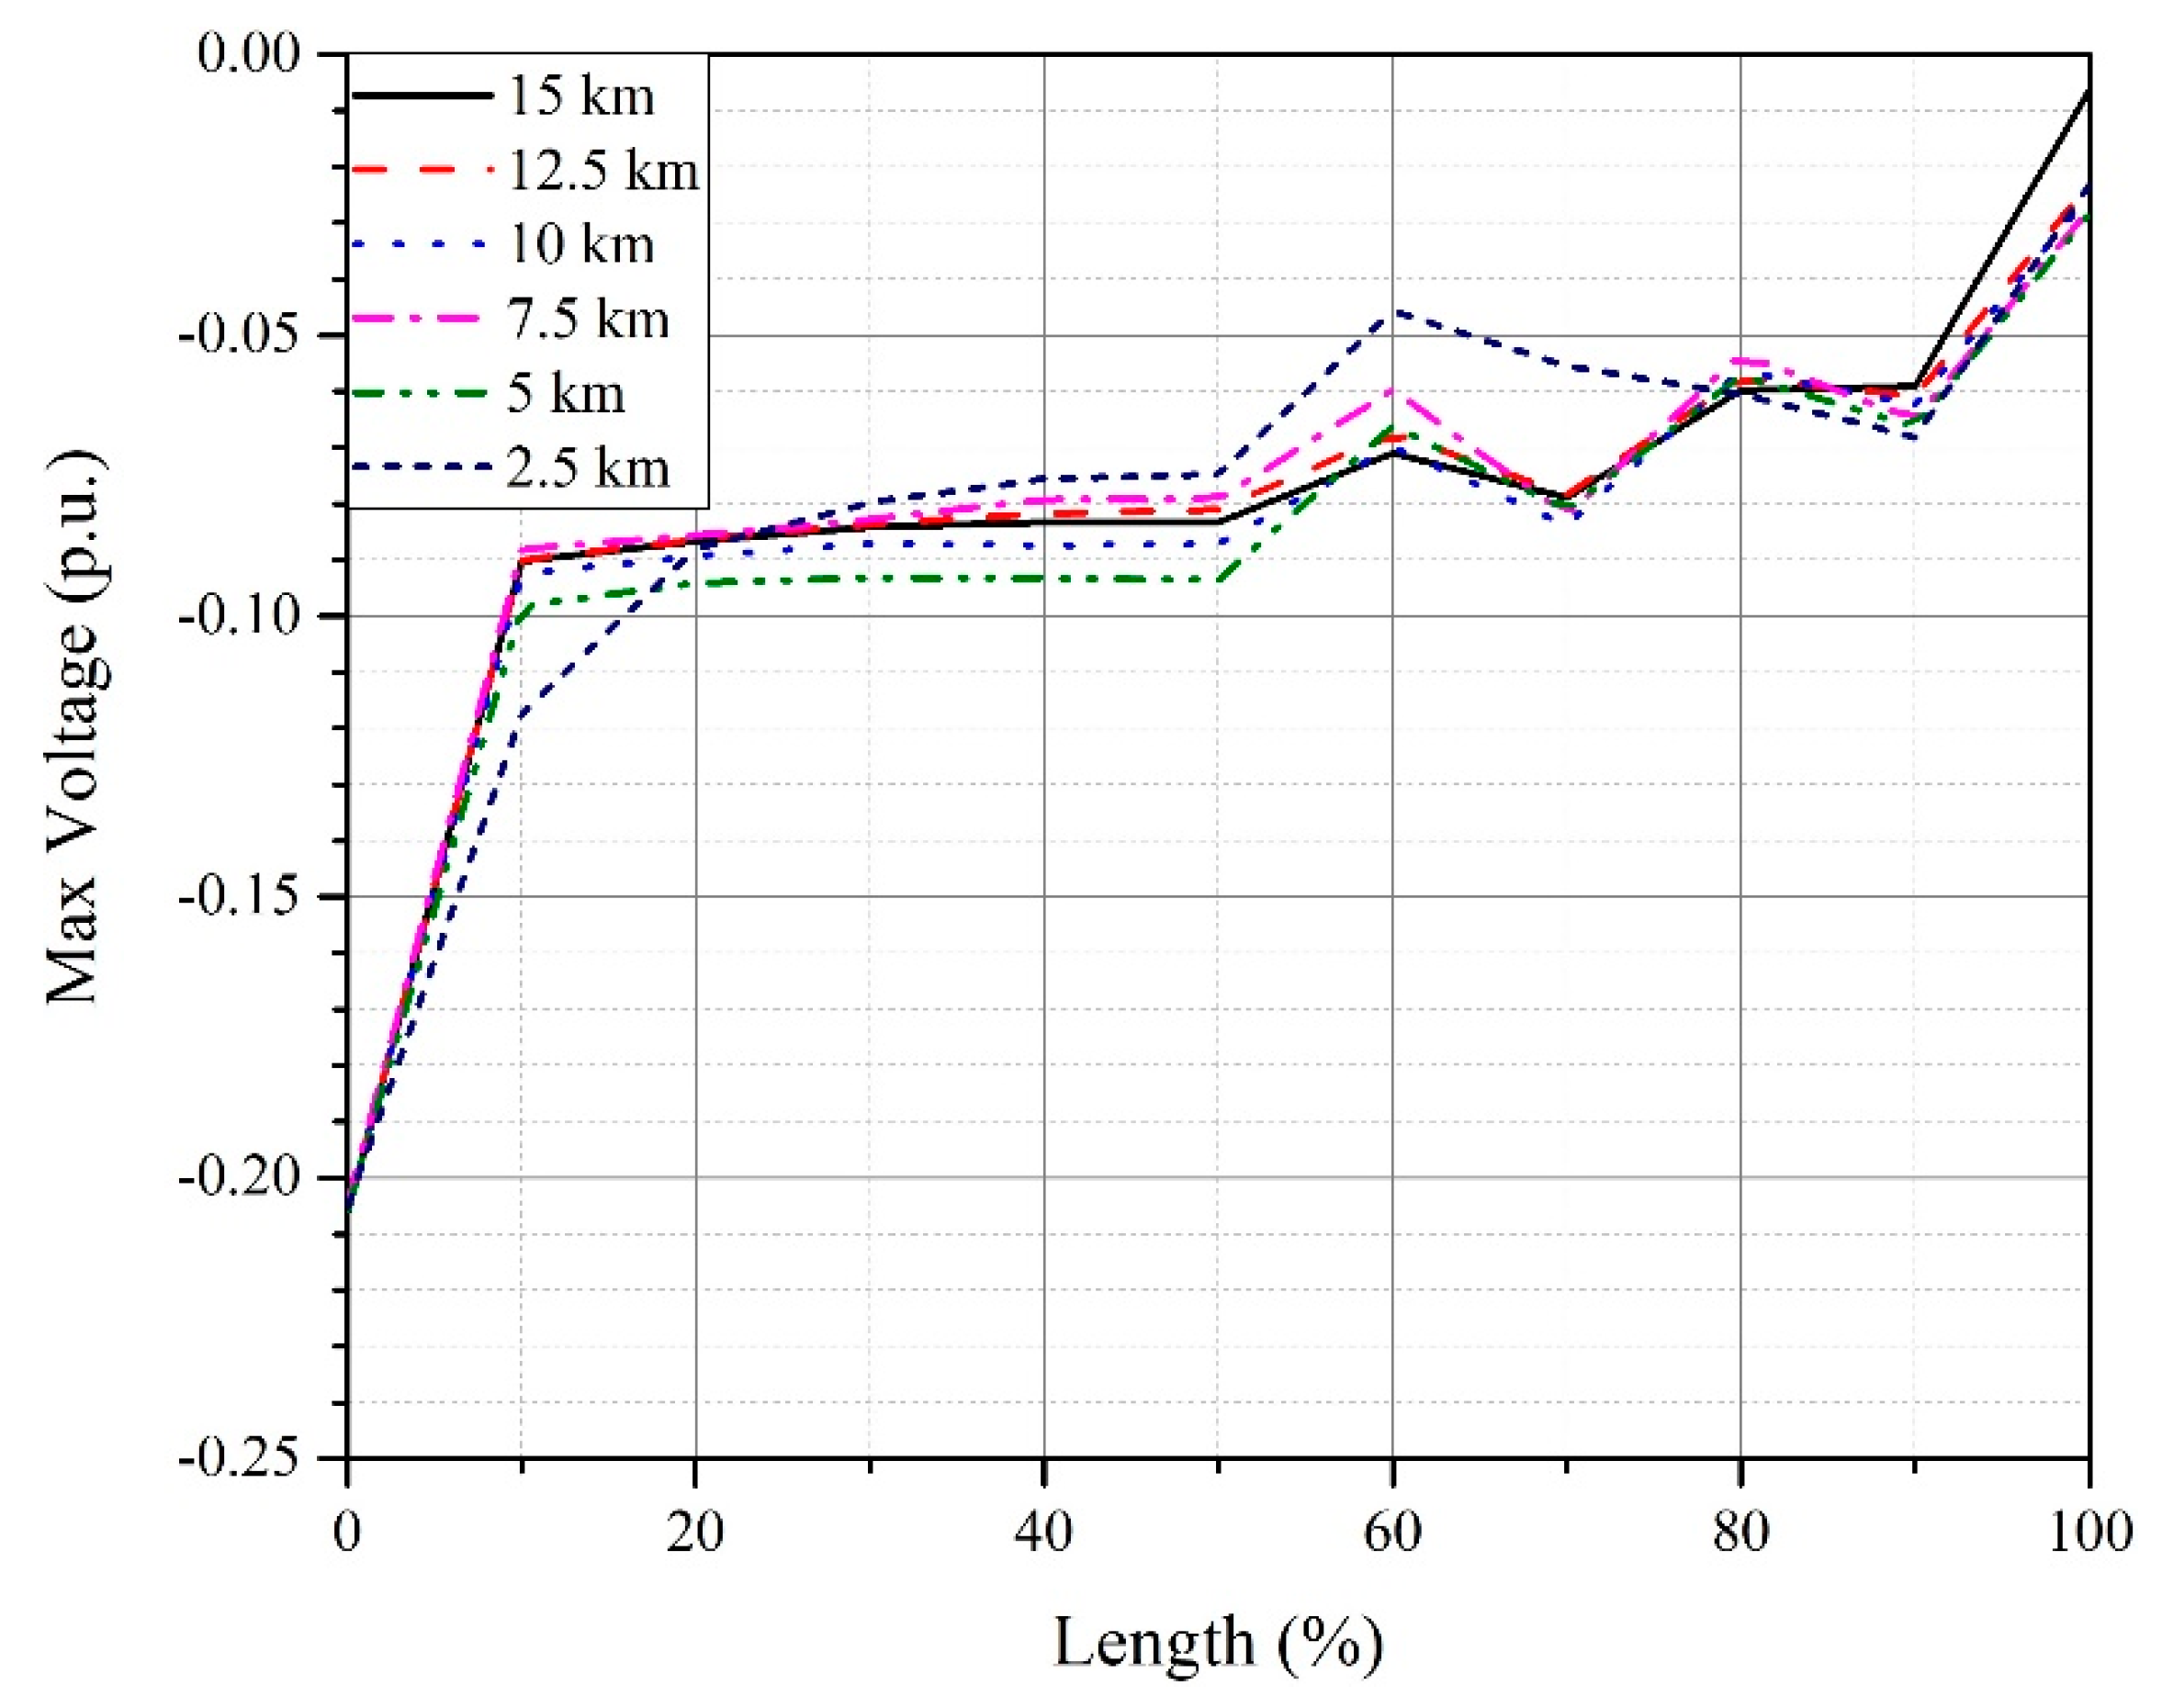
- The maximum sheath-ground overvoltage is independent of the length of the cable due to the negative reflection coefficient at the receiving end boundary of the sheath.
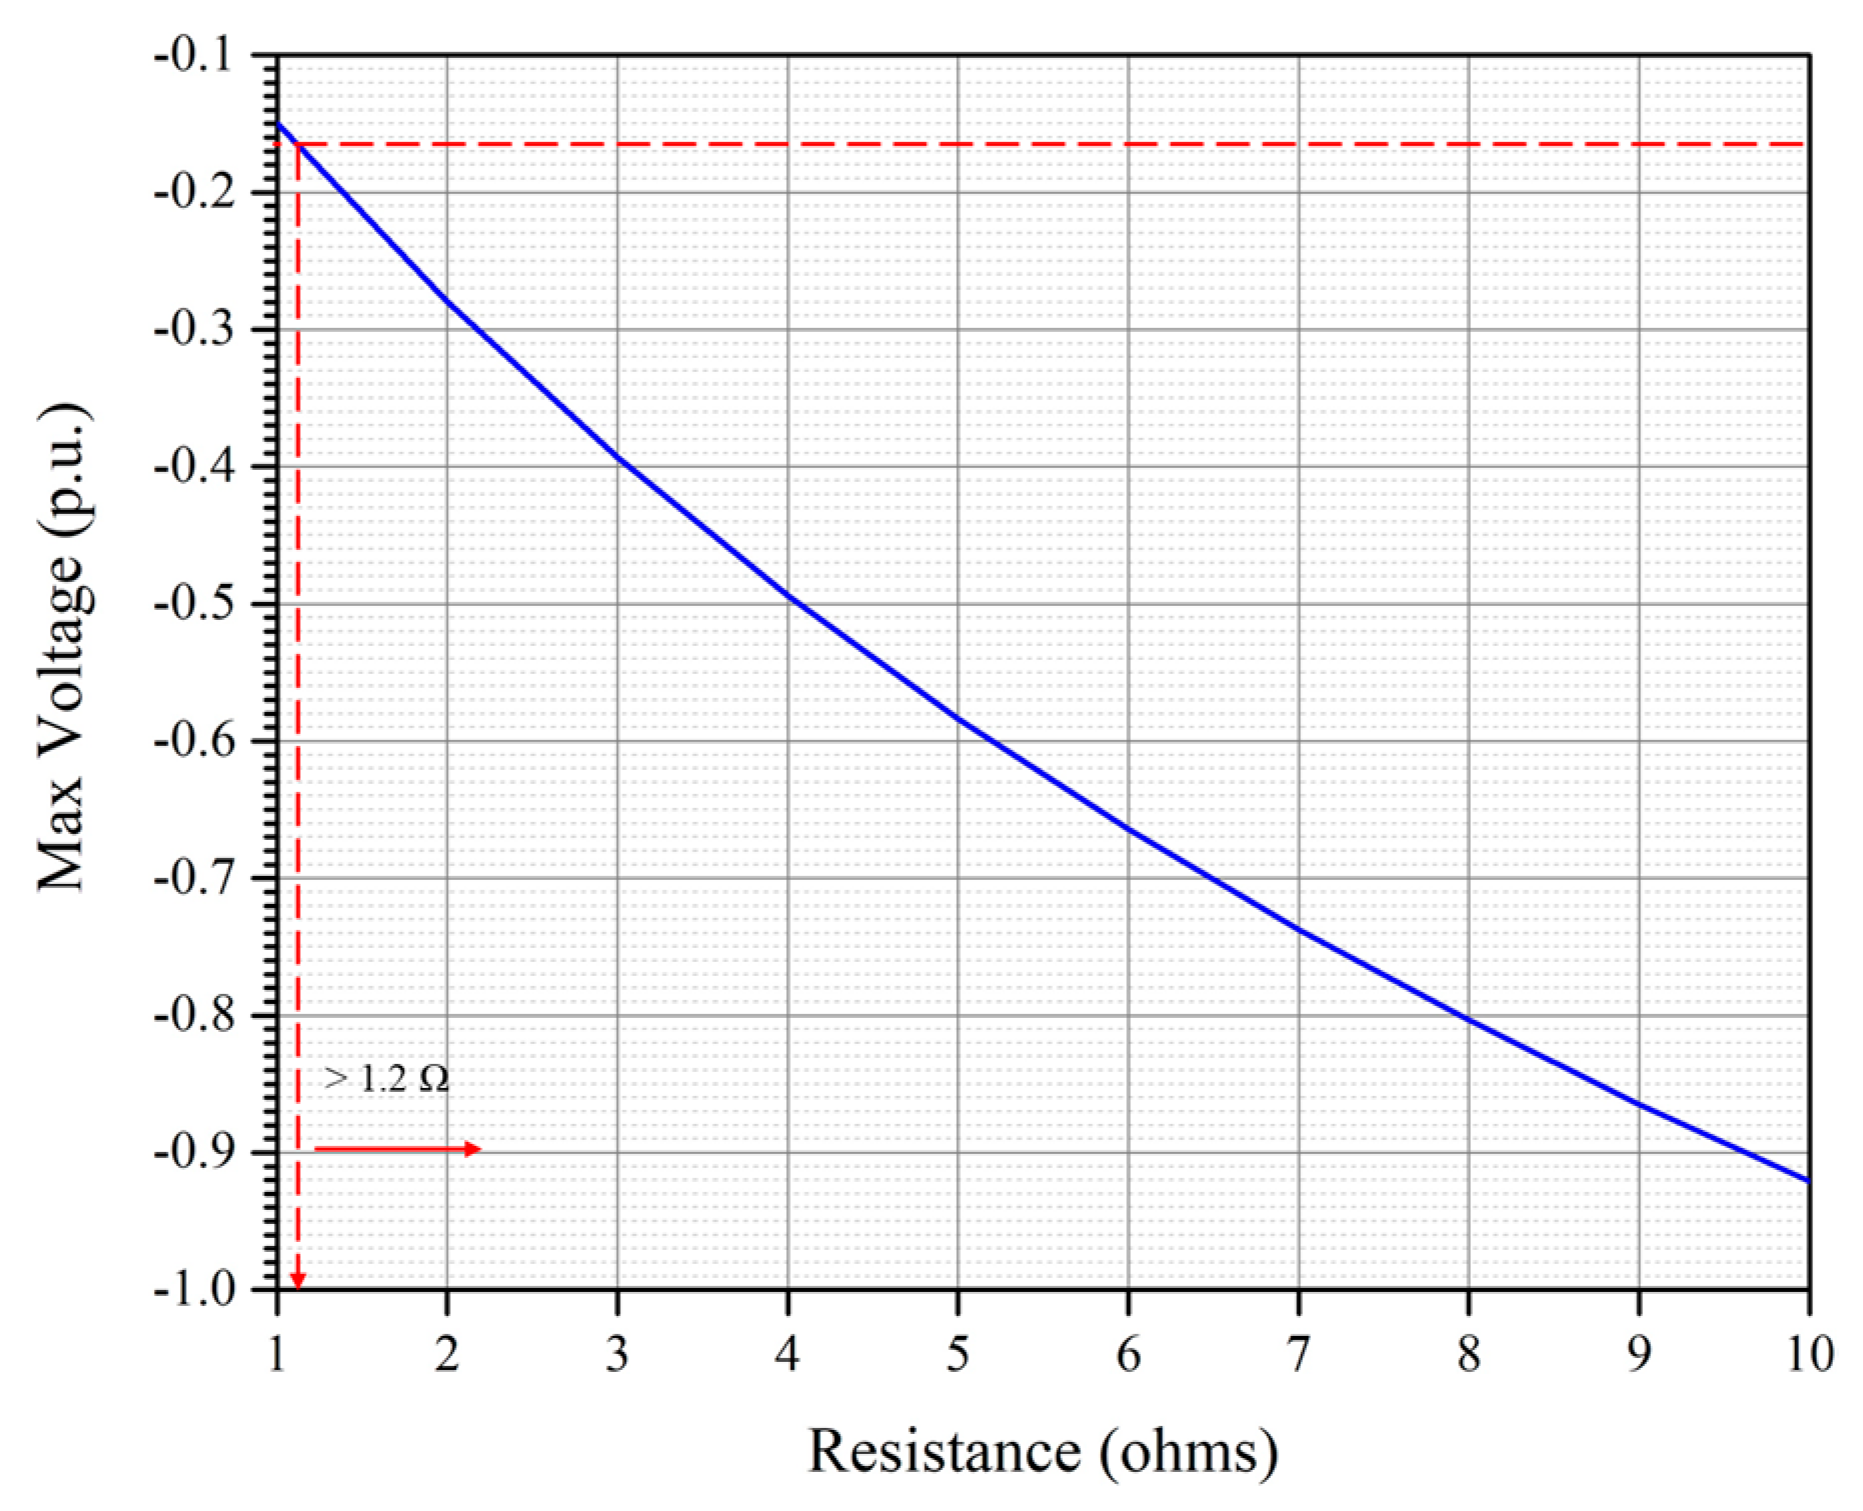
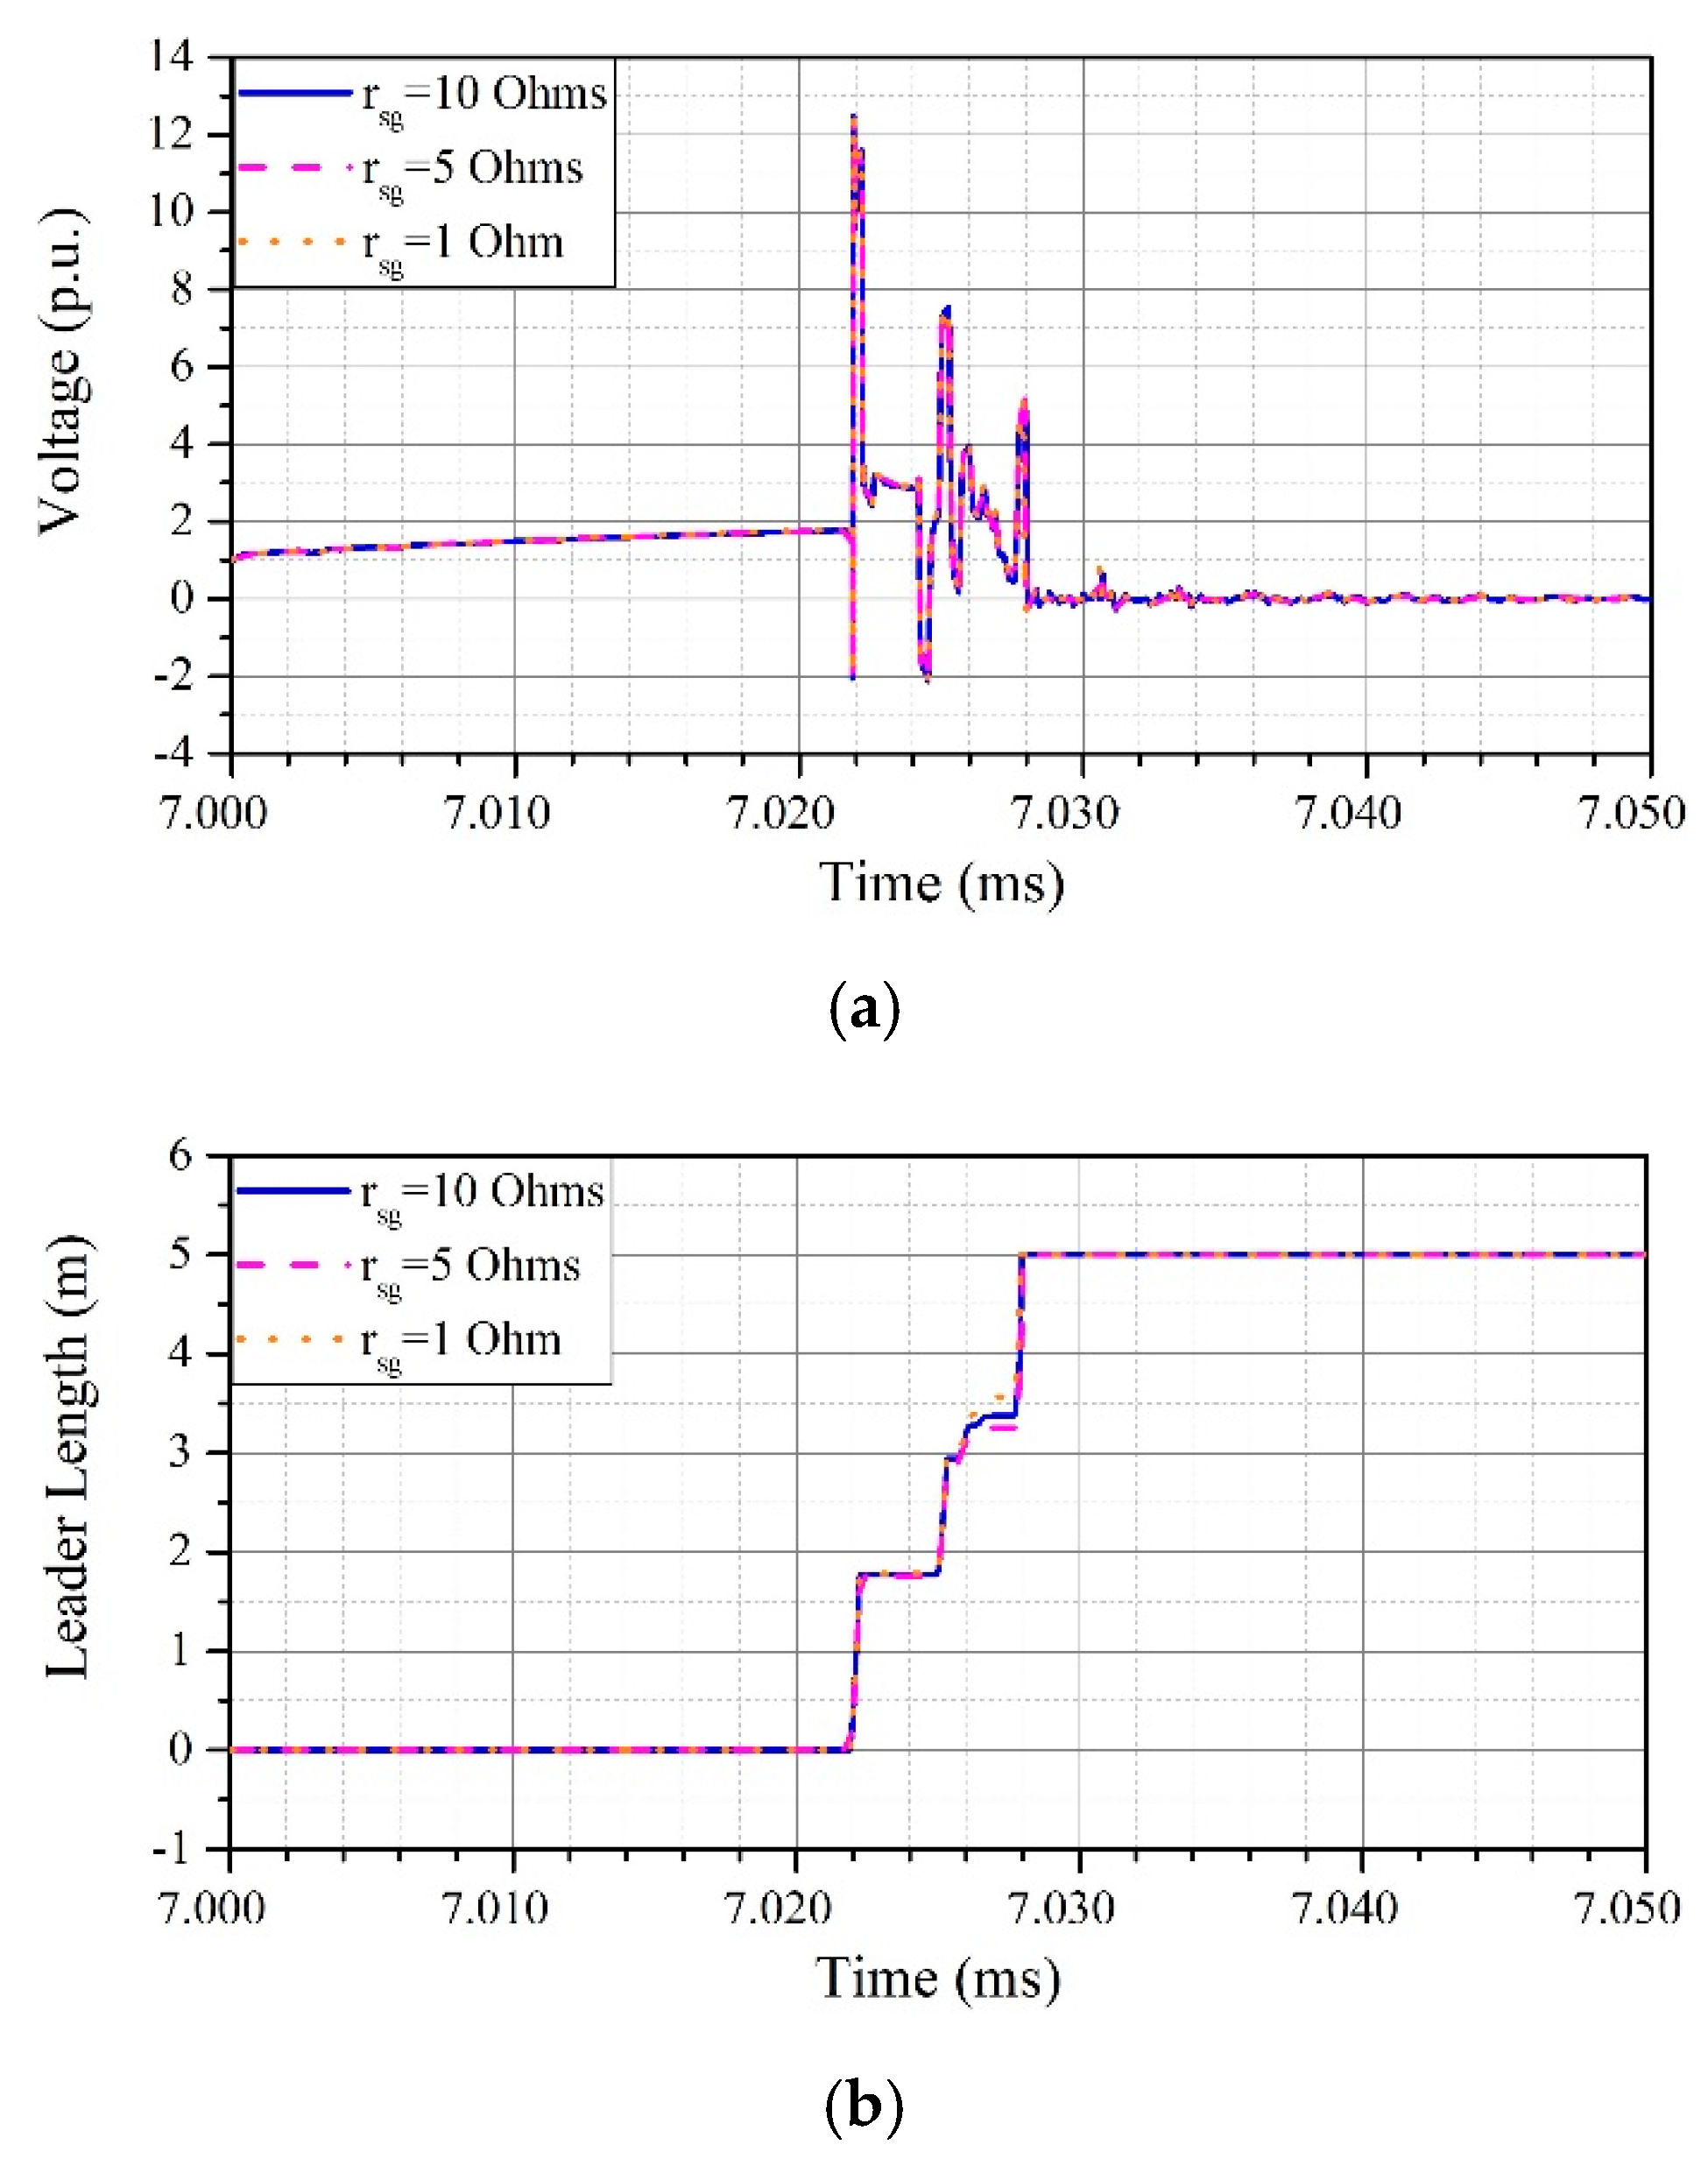
- The sheath-ground overvoltage can exceed the LIWL of the jacket significantly for high sheath grounding impedances. The SG overvoltage can be limited within the LIPL of the jacket by limiting the sheath grounding impedance up to 1.2 ohms.
- As concluded in our previous work [15] the sending end subsequent tower “twr2S” is most vulnerable to flashover in the case if OHPC as well as OHGW strikes. The flashover due to OHGW strikes can be prevented by limiting the footing impedance of twr2S to 6 ohms.
Author Contributions
Funding
Conflicts of Interest
References
- Jovcic, D.; Ahmed, K. Introduction to line commutated HVDC. In High Voltage Direct-Current Transmission Converters, 2nd ed.; Wiley: West Sussex, UK, 2019; Volume 1, pp. 1–3. [Google Scholar]
- Siepmann, W.; Kirby, N.M.; Xu, L.; Luckett, M. HVDC transmission for large offshore wind farms. Power Eng. J. 2002, 16, 135–141. [Google Scholar]
- CIGRÉ Brochure 496. Recommendations for Testing DC Extruded Cable Systems for Power Transmission at a Rated Voltage up to 500kV; Working Group B1.32; CIGRÉ: Paris, France, 2012. [Google Scholar]
- IEC 62067. Power Cables with Extruded Insulation and Their Accessories for Rated Voltages above 150 kV (170 kV) up to 500 kV (550 kV)—Test Methods and Requirements; Report; IEC: Geneva, Switzerland, 2011. [Google Scholar]
- CIGRÉ Brochure 86. Overvoltages on HVDC Cables Final Report; Joint Working Group 33/21/14.16; CIGRÉ: Paris, France, 1994. [Google Scholar]
- Bui-Van, Q.; Beaulieu, G.; Huynh, H.; Rosenqvist, R. Overvoltage studies for the St. Lawrence river 500-kV DC cable crossing. IEEE Trans. Power Deliv. 1991, 6, 1205–1215. [Google Scholar] [CrossRef]
- Goertz, M.; Wenig, S.; Gorges, S.; Kahl, M.; Beckler, S.; Christian, J.; Suriyah, M.; Leibfried, T. Lightning overvoltages in a HVDC Transmission System comprising Mixed Overhead-Cable Lines. In Proceedings of the International Conference on Power System Transients, Seoul, Korea, 26–29 June 2017. [Google Scholar]
- Goertz, M.; Wenig, S.; Hirsching, C.; Kahl, M.; Suriyah, M.; Leibfried, T. Analysis of Extruded HVDC Cable Systems Exposed to Lightning Strokes. IEEE Trans. Power Deliv. 2018, 33, 3009–3018. [Google Scholar] [CrossRef]
- Silva, F.F.; Pedersen, K.S.; Bak, C.L. Lightning in hybrid cable overhead lines and consequent transient overvoltages. In Proceedings of the International Conference on Power System Transients, Seoul, Korea, 26–29 June 2017. [Google Scholar]
- Henriksen, T. Calculation of lightning overvoltages using EMTP. In Proceedings of the International Conference on Power System Transients, Lisbon, Portugal, 3–7 September 1995. [Google Scholar]
- Colla, L.; Gatta, F.M.; Geri, A.; Lauria, S. Lightning overvoltages in hv-ehv “mixed” overhead-cable lines. In Proceedings of the International Conference on Power System Transients, Lyon, France, 4–7 June 2007. [Google Scholar]
- Massaro, F.; Morana, G.; Musca, R. Transient behaviour of a “mixed” overhead-cable EHV line under lightning events. In Proceedings of the International Universities Power Engineering Conference, Glasgow, UK, 1–4 September 2009. [Google Scholar]
- Hoogendorp, G.; Popov, M.; van der Sluis, L. Lightning Induced Overvoltages in Mixed 380 kV OHL-Cable-OHL connections. In Proceedings of the International Conference on Power System Transients, Vancouver, BC, Canada, 18–20 July 2013. [Google Scholar]
- Gomes, T.V.; Schroeder, M.A.O.; Alipio, R.; de Lima, A.C.S.; Piantini, A. Investigation of Overvoltages in HV Underground Sections Caused by Direct Strokes Considering the Frequency-Dependent Characteristics of Grounding. IEEE Trans. Electromagn. Compat. 2018, 60, 2002–2010. [Google Scholar] [CrossRef]
- Asif, M.; Lee, H.-Y.; Khan, U.A.; Park, K.-H.; Lee, B.W. Analysis of Transient Behavior of Mixed High Voltage DC Transmission Line Under Lightning Strikes. IEEE Access 2019, 7, 7194–7205. [Google Scholar] [CrossRef]
- Lennerhag, O.; Lundquist, J.; Engelbrecht, C.; Karmokar, T.; Bollen, M.H.J. An Improved Statistical Method for Calculating Lightning Overvoltages in HVDC Overhead Line/Cable Systems. Energies 2019, 12, 3121. [Google Scholar] [CrossRef]
- Ametani, A.; Kawamura, T. A Method of a Lightning Surge Analysis Recommended in Japan Using EMTP. IEEE Trans. Power Deliv. 2005, 20, 867–875. [Google Scholar] [CrossRef]
- Ametani, A.; Nagaoka, N.; Ohno, T.; Baba, Y. Transient on Overhead Lines. In Power System Transients: Theory and Applications, 2nd ed.; CRC Press: Boca Raton, FL, USA, 2017; Volume 1, pp. 176–193. [Google Scholar]
- Ishii, M.; Kawamura, T.; Kouno, T.; Ohsaki, E.; Shiokawa, K.; Murotani, K.; Higuchi, T. Multistory transmission tower model for lightning surge analysis. IEEE Trans. Power Deliv. 1991, 6, 1327–1335. [Google Scholar] [CrossRef]
- Datsiso, Z.G.; Mikropoulous, P.N. Effect of tower modelling on the minimum backflashover current of overhead transmission lines. In Proceedings of the 19th International Symposium on High Voltage Engineering, Pilsem, Czech Republic, 23–28 August 2015. [Google Scholar]
- Martinez, J.A.; Castro-Aranda, F. Tower modeling for lightning analysis of overhead transmission lines. In Proceedings of the IEEE Power Engineering Society General Meeting, 22–25 May 2005; IEEE: San Francisco, CA, USA, 2005; pp. 1345–1350. [Google Scholar]
- A Simplified Method for Estimating Lightning Performance of Transmission Lines. IEEE Trans. Power Appar. Syst. 1985, PAS-104, 918–932. [CrossRef]
- Chisholm, W.; Chow, Y.; Srivastava, K. Travel Time of Transmission Towers. IEEE Trans. Power Appar. Syst. 1985, PAS-104, 2922–2928. [Google Scholar] [CrossRef]
- Alipio, R.; Visacro, S. Frequency Dependence of Soil Parameters: Effect on the Lightning Response of Grounding Electrodes. IEEE Trans. Electromagn. Compat. 2013, 55, 132–139. [Google Scholar] [CrossRef]
- Cavka, D.; Mora, N.; Rachidi, F. A Comparison of Frequency-Dependent Soil Models: Application to the Analysis of Grounding Systems. IEEE Trans. Electromagn. Compat. 2014, 56, 177–187. [Google Scholar] [CrossRef]
- Imece, A.F.; Durbak, D.W.; Elahi, H.; Kolluri, S.; Lux, A.; Mader, D.; McDemott, T.E.; Morched, A.; Mousa, A.M.; Natarajan, R.; et al. Modeling guidelines for fast front transients. IEEE Trans. Power Deliv. 1996, 11, 493–506. [Google Scholar]
- CIGRÉ Technical Brochure 63. Guide to Procedures for Estimating the Lightning Performance of Transmission Lines; Working Group 33.01; CIGRÉ: Paris, France, 1991. [Google Scholar]
- IEC Technical Report 60071-4. Insulation Co-Ordination—Part 4: Computational Guide to Insulation Co-Ordination and Modelling of Electrical Networks, 1st ed.; Report; IEC: Geneva, Switzerland, 2004. [Google Scholar]
- Morched, A.; Gustavsen, B.; Tartibi, M. A universal model for accurate calculation of electromagnetic transients on overhead lines and underground cables. IEEE Trans. Power Deliv. 1999, 14, 1032–1038. [Google Scholar] [CrossRef]
- Gustavsen, B.; Irwin, G.; Mangelrød, R.; Brandt, D.; Kent, K. Transmission Line Models for the Simulation of Interaction Phenomena Between Parallel AC and DC Overhead Lines. In Proceedings of the International Conference on Power System Transients, Budapest, Hungary, 20–24 June 1999. [Google Scholar]
- Stern, E.; Nash, C.; Shhoeniger, C.; Bartzsch, C.; Acquaotta, G.; Bacchini, M.; Orini, A. The Neptune regional transmission system 500 kV HVDC project. In Proceedings of the Conseil International des Grands Réseaux Electriques, Paris, France, 24–29 August 2008. [Google Scholar]
- Bewley, L.V. Travelling Waves on Transmission System, 1st ed.; Dover: New York, NY, USA, 1963; Volume 1. [Google Scholar]
- Chowdhuri, P.; Anderson, J.G.; Chisholm, W.A.; Field, T.E.; Ishii, M.; Martinez, J.A.; Marz, M.B.; McDaniel, J.; McDermott, T.E.; Mousa, A.M.; et al. Parameters of lightning strokes: A review. IEEE Trans. Power Deliv. 2005, 20, 346–358. [Google Scholar] [CrossRef]
- Mikropoulos, P.N.; Tsovilis, T.E. Lightning attachment models and maximum shielding failure current of overhead transmission lines: Implications in insulation coordination of substations. IET Gener. Transm. Distrib. 2010, 4, 1299–1313. [Google Scholar] [CrossRef]
- Modeling of metal oxide surge arresters. IEEE Trans. Power Deliver. 1992, 7, 302–309. [CrossRef]


| Symbol | Quantity | Value |
|---|---|---|
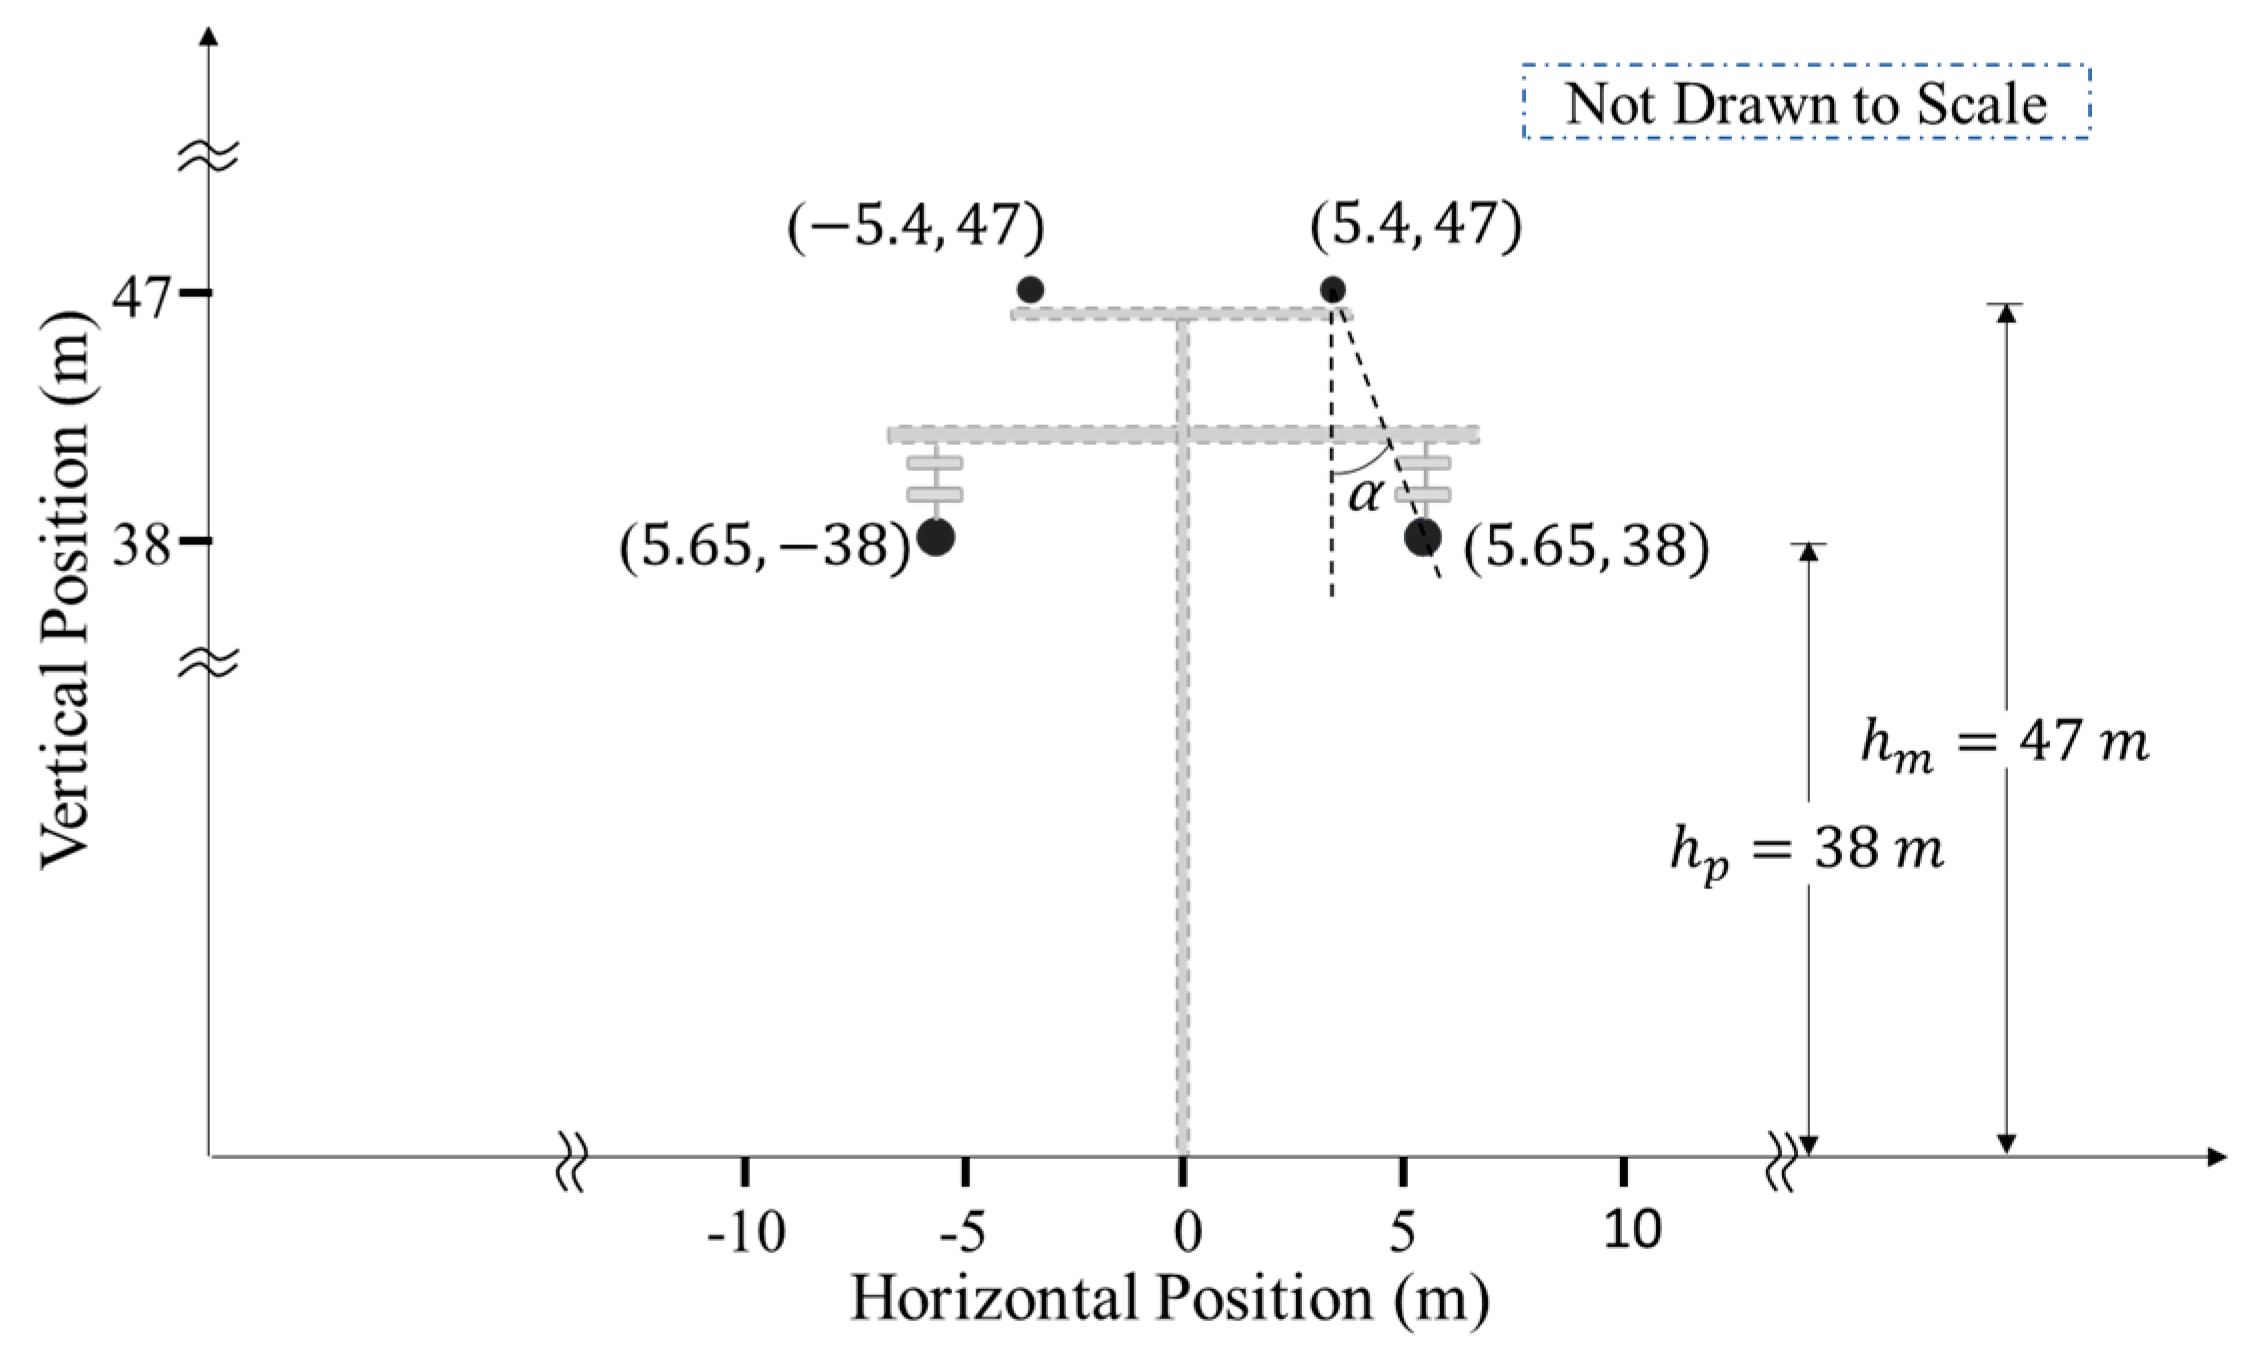
| h | Height of tower | 47 m |
| lt1 | Length of upper tower segment | 4 m |
| lt2 | Length of lower tower segment | 43 m |
| ZT | Characteristic impedance of tower segments | 139 Ω |
| rf | Footing impedance | 10 Ω |
| rsg | Sheath-grounding impedance | 10 Ω |
| cins | Capacitance of insulator | 2.75 pF |
| Larc | Insulator arc inductance | 5 µH |
| ltwr_span | Length of tower span | 350 m |
| vsheath | Wave velocity on cable sheath | 2.7 × 10⁷ m/s |
| vcore | Wave velocity on cable core | 6.4 × 10⁷ m/s |
| vOHPC | Wave velocity on OHPC | 2.8 × 10⁸ m/s |
| vOHGW | Wave velocity on OHGW | 2.8 × 10⁸ m/s |
| Zsheath | Characteristic impedance of cable sheath | 27.1 Ω |
| Zcore | Characteristic impedance of cable core | 72.7 Ω |
| ZOHGW | Characteristic impedance of OHGW | 541.8 Ω |
| ZOHPC | Characteristic impedance of OHPC | 465.3 Ω |
| vtwr | Wave velocity on tower segments | 2.55 × 10⁸ m/s |
| lriser | Length of riser section | 50 m |
| K | Leader coefficient | 1.3 m2/kV2.s |
| E0 | Critical leader inception gradient | 600 kV/m |
| y | Time of lightning strike | 0.007 s |
| Parameters of Strike | OHPC Strike | OHGW/Tower Top Strike | |
|---|---|---|---|
| Ip | peak current | 20 kA | 200 kA |
| t30 | front (30%–90%) | 3 µs | 8 µs |
| tf | effective front time | 5 µs | 13.33 µs |
| tt | tail time | 77.5 µs | 200 µs |
| Sm | maximum steepness | 20 kA/µs | 48 kA/µs |
| n | wave-shape constant | 18.6 | 11.171 |
| A | // | 1.061 kA/µs | 4.325 kA/µs |
| B | // | 3.257 × 10⁻¹⁷ kA/µs | 9.247 × 10⁻¹⁴ kA/µs |
| tn | // | 8.653 µs | 21.858 µs |
| t1 | // | 99.324 µs | 257.004 µs |
| t2 | // | 0.1 µs | 0.416 µs |
| I1 | // | 20.020 kA | 200.324 kA |
| I2 | // | 2.0201 kA | 20.324 kA |
| Components of Surge Arrester Model | n = 1, d = 6 m |
|---|---|
| L1 | 90 µH |
| R1 | 390 Ω |
| L0 | 1.2 µH |
| R0 | 600 Ω |
| C | 16.66667 pF |
| Cable Length (km) | Maximum Overvoltage (p.u.) | Distance from Sending End (%) |
|---|---|---|
| 100 | −2.141 | 0 |
| 50 | −2.141 | 0 |
| 25 | −2.141 | 0 |
| 12.5 | −2.345 | 10 |
| 6.25 | −3.032 | 10 |
| 3.125 | −3.948 | 10 |
© 2019 by the authors. Licensee MDPI, Basel, Switzerland. This article is an open access article distributed under the terms and conditions of the Creative Commons Attribution (CC BY) license (http://creativecommons.org/licenses/by/4.0/).
Share and Cite
Asif, M.; Lee, H.-Y.; Park, K.-H.; Shakeel, A.; Lee, B.-W. Assessment of Overvoltage and Insulation Coordination in Mixed HVDC Transmission Lines Exposed to Lightning Strikes. Energies 2019, 12, 4217. https://doi.org/10.3390/en12214217
Asif M, Lee H-Y, Park K-H, Shakeel A, Lee B-W. Assessment of Overvoltage and Insulation Coordination in Mixed HVDC Transmission Lines Exposed to Lightning Strikes. Energies. 2019; 12(21):4217. https://doi.org/10.3390/en12214217
Chicago/Turabian StyleAsif, Mansoor, Ho-Yun Lee, Kyu-Hoon Park, Ayesha Shakeel, and Bang-Wook Lee. 2019. "Assessment of Overvoltage and Insulation Coordination in Mixed HVDC Transmission Lines Exposed to Lightning Strikes" Energies 12, no. 21: 4217. https://doi.org/10.3390/en12214217
APA StyleAsif, M., Lee, H.-Y., Park, K.-H., Shakeel, A., & Lee, B.-W. (2019). Assessment of Overvoltage and Insulation Coordination in Mixed HVDC Transmission Lines Exposed to Lightning Strikes. Energies, 12(21), 4217. https://doi.org/10.3390/en12214217