Article

CO2 Efficiency Break Points for Processes Associated to Wood and Coal Transport and Heating

Institute of Administrative and Social Sciences, Faculty of Economics and Administration, University of Pardubice, Studentská 84, 532 10 Pardubice, Czech Republic
*
Author to whom correspondence should be addressed.
Energies 2019, 12(20), 3864; https://doi.org/10.3390/en12203864
Submission received: 27 May 2019 / Revised: 1 October 2019 / Accepted: 8 October 2019 / Published: 12 October 2019

Abstract

:
This paper aims to deal with CO2 emissions in energy production process in an original way, based on calculations of total specific CO2 emissions, depending on the type of fuel and the transport distance. This paper has ambition to set a break point from where it is not worthwhile to use wood as an energy carrier as the alternative to coal. The reason for our study is the social urgency of selected problem. For example, in the area of public sector decision-making, wood heating is promoted regardless of the availability within the reasonable distance. From the current state of the research, it is also clear that none of the studies compare coal and biomass fuel transportation from the point of view of CO2 production. For this purpose, an original methodology has been proposed. It is based on a modified life cycle assessment (LCA), supplemented with a system of equations. The proposed methodology has a generalizable nature, and therefore, it can be applied to different regions. However, calculation inputs and modelling are based on specific site data. Based on the presented numerical analysis, the key finding is the break point for associated processes at a distance of 1779.64 km, since when that it is better to burn brown coal than wood in terms of total CO2 emissions. We can conclude that, in some cases, it is more efficient to use coal instead of wood as fuel in terms of CO2 emissions, particularly in regard to transport distance and type of transport.

1. Introduction

In past decades, the issues of nature’s conservation, sustainability, energy intensity, and greenhouse gas emissions reduction have been not only problems for practitioners and scholars, but it also, increasingly, are becoming political problems. An example might be the upward discussions on this subject, which in some cases present hugely different opinions of the regional but also national political leaders. There is the question of how much importance is attached to individual opinion streams. When searching for the objective attitude, it is important to rely on quantifiable data and high-quality research. Even though the aforementioned areas have been relatively well researched, some gaps still might be identified. The political decision-making process and related presentation of key theses and strategies might be ideologically burdened. The correctness and relevance of the proposed policies should not be relativized, particularly because of the gravity of this issue. In this case, a science based on empirical and quantifiable findings is the only fair and verifiable tool. The challenge of this article is to look at the selected issues using the optics of quantifiable and measurable variables. In the context of the urgency of the open topic, the total specific CO2 emissions from the transport and burning processes of coal and wood, depending on the transport distances, were selected as indicators of environmental burden and energy intensities. How effective is the replacement of fossil fuels with biofuels (wood in our case) in relation to transport distance for the reduction of CO2 emissions? This question will be answered in the following text. Many authors have dealt with the issue of CO2 emissions, transport, and solid fuels. Therefore, we would like to mention the most important work that has been published in this area. Describing current state of the art will help us to create a broader theoretical basis for our practical part, and at the same time to find a research gap that has not been explored so far.
The introductory part of this work will be opened by a global perspective of the problem, from the point of view of the international authorities, because energy efficiency is directly related to climate change issues, primarily in terms of searching for new, more efficient, and sustainable technologies. The United Nations (UN) initiated the establishment of the International Panel on Climate Change (IPCC). This UN body, among other agenda, has been publishing reports on climate change, in particular, the current Fifth Assessment Report (AR5). The report takes into account the impact of human activities on climate change. Factors that can amplify the effects of adaptation and mitigation can be considered good-quality public administration, such as the use of green technologies or a sustainable way of life [1]. Key documents with global impact are the United Nations Framework Convention on Climate Change and the Kyoto Protocol and the Paris Agreement. The United Nations Framework Convention on Climate Change (the convention) has been the initial platform for international climate negotiations from 1992. Its objective is to stabilize the concentration of greenhouse gases in the atmosphere in order to prevent dangerous changes in the climate system [2]. The 1998 Kyoto Protocol (UN) obliges the countries involved to reduce their greenhouse gas emissions. The Czech Republic signed and ratified this document in 1998 and 2001 [3]. In 2015, the Paris Agreement defining a long-term perspective on climate protection was adopted by the stakeholders of the Convention. EU countries agreed to reduce greenhouse gas emissions by at least 40% by 2030 compared to 1990 and they ratified the agreement in October 2017 [4]. At European Union level, a few documents with significant impact on energy and efficiency needed to be mentioned. Firstly, the Covenant of Mayors for Climate and Energy whose participants declare to act according to Paris Agreement [5]. Currently, there are 11 signatories to this initiative from the total of approximately 6250 municipalities and towns in the Czech Republic [6]. Directive 2010/31/EU of the European Parliament and of the Council on the energy performance building is a document from 2010, according to which buildings account for 40% of total energy consumption in the Union [7]. Directive 2012/27/EU of the European Parliament and of the Council on energy efficiency, amending Directives 2009/125/EU and 2010/30/EU and repealing Directives 2004/8/EC and 2006/32/EU from 2012 states that the energy efficiency is a tool to fight the dependence on energy imports, energy shortages, economic difficulties, and climate change [8]. The Czech Republic as a member state of the European Union, and therefore, coordinates and harmonizes the priorities and objectives of its policies. An important state body is the Government Council for Sustainable Development of the Czech Republic, which is administered by the Office of the Government of the Czech Republic. The importance of this office is underlined by the fact that the chairman is the Prime Minister, and other significant members include the Minister of the Environment, the Minister of Finance, the Minister of Industry and Trade, the Minister of Labour and Social Affairs [9]. It consists of nine Committees, such as the Sustainable Energy Committee, which deals with possibilities of implementing international sustainable development documents and other energy documents into Czech environment [10]. The Advisory and Working Body, whose activities are provided by the Ministry of Industry and Trade, is the Government Council for energy and raw materials strategy of the Czech Republic [11]. In case of legislation, it is necessary to mention Act number 165/2012 Coll., on supported energy sources and on amendments to certain acts that regulates the field of renewable sources, secondary energy sources, and high-efficiency combined heat and power generation, including adjustments of stakeholders’ behaviour (state administration, natural persons, and legal entities) [12]. The state energy policy from 2004 (updated in 2010 and 2015) acknowledges clearly formulated priorities and strategic objectives of the Czech Republic for future decades; e.g., principles of sustainable development [13,14]. The Ministry of the Environment of the Czech Republic, in cooperation with other institutions, created The Strategy on Adaptation to Climate Change in the Czech Republic, which was approved by the Government of the Czech Republic in 2015. The document assesses the impacts of climate change [15]. In 2010, the Government of the Czech Republic approved The Strategic Framework for Sustainable Development of the Czech Republic, defining the concepts of sustainable development in the Czech Republic, defining basic principles, objectives, priorities, and economic, social, and environmental indicators [16]. In 2017, this document was followed by the strategic framework called The Czech Republic 2030. Sustainable development should be measured, according to the document, by improving quality of life of individuals and society, taking into account the legacy to future generations [17].

2. Literature Review

There are many authors studying impact of fossil fuel combustion emissions on human health and the air quality; therefore, the aforementioned issues are reflected in both academic and scientific circles [18,19,20]. There are no doubts that coal use results in environmental degradation and causes negative health consequences [20,21]. According to [22], where the human health and ecotoxicological impacts of electricity production from wood to coal fuel were compared, ”Improvements in power plant efficiency, silviculture management, and reduced transport distance have the potential to reduce the respiratory effects of bioenergy systems.“ In terms of emissions, studies mainly deal with pollutant emissions produced by the combustion of solid fuels by households or industrial activities [23,24,25,26]. Other types of studies deal with the reduction of emissions of CO2, NOx, and other pollutants in the atmosphere caused by burning fossil fuels [27,28]. As [29] claims, bioenergy represents a sustainable greenhouse gas (GHG) reduction option. In their work, they raise concerns about the climate change impacts of bioenergy and uncertainties within the bioenergy supply chains, and that evaluation methods generate large variations in emission profiles. However, as [29,30,31] claim, biomass in terms of forest residues is supposed to have large global availability and might achieve large GHG emissions savings. In the study of Thakur et al. [32] it is concluded that “Forest residues can provide an almost carbon neutral energy source that has lower GHG emissions than fossil fuels and requires very little energy for processing and growth compared to what is produced.“ However, those authors deal with an issue of chipping options when preparing forest residues for power plant processing. In their work, the transportation distance seems to be crucial in terms of reduction of energy consumption and emissions. The general view has been that carbon emitted from biomass combustion is assumed to be low-level or carbon neutral—as supported by IPCC [33]. The explanation is that amount of CO2 released from biomass fuel (e.g., wood as the major biomass resource) combustion equals the amount of CO2 trees absorb during their growth. However, this opinion about biomass carbon neutrality has been questioned in recent years. Scientists have been arguing that biomass energy produces emissions, and therefore, is unlike other renewables. Sedjo and Cherubini at al. explain in their works, that sustainable foresting may be carbon neutral. However, in the short term, using wood biomass energy can generate increases in atmospheric carbon. “The issue arising from the violation of the temporal boundary is the waiting time needed to achieve carbon neutrality” [34,35]. Nian and Johnson state, that in some cases, biomass fuels can be far more carbon positive than fossil fuels [36,37].
Even the Environmental Protection Agency (EPA) is considering regulations against biomass energy’s carbon emissions [34].
However, it should not be overlooked that the carbon contained in wood was absorbed from the atmosphere, unlike that of fossil fuels, a relatively short time ago, usually in tens or hundreds of years, when it was grown. By returning it back to the atmosphere, it is not possible to change the balance of its concentration if the area of forest land is maintained, where the growth of new tree species absorbs this carbon dioxide again, thus it is sustainable. Since this study assumes this kind of sustainability, we consider CO2 emissions from biomass to be CO2-neutral. Let us add that, of course, extensive clearing or burning of forest stands does not represent sustainability.
However, at the same time European Commission, and Joint Research Centre on Directorate Energy, Transport, and Climate states, that the European Union’s CO2 emissions increased again, by 1.3%, in 2015 [38]. This was caused by an increase of 4.6% in natural gas consumption, mainly utilized in power generation and space heating, and by an increase of 4% in diesel consumption in transport [38]. Additional emissions from the combustion of gas could be offset by the employment of local biomass sources, especially wood as fuel, but additional emissions due to transport are not obvious for this solution. The International Energy Agency compares the CO2 emissions of fossil fuels in a broad way, but does not compare them with neutral biofuels [39]. In terms of biomass trade, there are several studies that have been investigating trade in biomass for energy purposes. In study [40], an initial overview of the global status of the production and biomass trade for energy is presented. Proskurina, Junginger, and Heinino [41] investigated emerging energy biomass trade streams, in other words, biomass producing and consuming countries regarding liquid and solid biofuels (including roundwood).
Nevertheless, environmental risks caused by coal energy includes, besides direct emissions from the coal burning process, indirect emissions, such as coal mining emissions and transportation emissions. The carbon emission factor of the coal-to-energy chain is calculated based on the life-cycle assessment that is provided in [42]. Based on his conclusions, CO2 is the most direct GHG emission and mainly results from coal combustion, which accounts for 93.8% of the total GHG emissions. The remaining 6.2% of total GHG indirect emissions are from the energy consumption in the mining, transportation, and washing processes. Different authors have introduced their LCA (life cycle assessment) studies on the carbon emissions of coal-fired electricity generation in different countries; for example, in the UK [43], Japan [44], Canada [18], and Germany [45]. Only very few works focus on coal and biomass together; for example, Morrison and Golde [46] analysed the environmental impacts associated with producing electricity from wood pellets and coal. According to their conclusions, “Utilizing wood pellets in lieu of coal results in a GWP reduction of 90–92% per kWh of electricity generation.” One of the most current papers of Sterman, Siegel, and Rooney-Varga [47] solves a very similar problem, whether replacing coal with wood lowers CO2 emissions. However, it does not include the transport effect, which can change the whole emission reduction effect, since the wood is significantly less dense, so its transportation with a growing distance may be significantly less efficient than the transportation of coal. The work of Zhang et al. [18] proves that there is huge advantage for electricity-generating companies to substitute biomass fuel for coal (reducing emissions by 91% and 78% relative to a coal and natural gas combined cycle). A study on the Chinese environment investigated a life-cycle comparison of the energy, environmental, and economic impacts of coal versus wood pellets for generating heat. In that work, the authors presented the conclusion on wood pellets system significantly reduces various emissions in comparison to coal [18]. In the following chapters, the data collection, evaluation, and processing; the methods used; the methods of calculations; and the modelling, will be described. Subsequently, on the basis of the proposed methodology and modelling results, the overall environmental burden (the indicator was CO2) monitored will be described. Then, the results will be discussed and conclusions and recommendations will be provided. In the last chapter, the results of the theoretical and practical part of the research will be summarized; we will try to formulate the weaknesses, and the possibilities of further research. The aim of this paper is to examine how the total volume of CO2 produced in connection with the transport and combustion of selected solid fuels develops. Therefore, the following working hypothesis can be defined: the break point at which the total CO2 emissions from the coal and wood transport and combustion process equals is less than 1500 km. From the above, a possible range of methods follows.
Based on the provided facts in the analyses of LCA, transportation of solid fuel is one of the biggest indirect sources of GHG emissions. It is also clear that none of those studies compares coal and biomass fuels’ transportations from the point of view of CO2 production. In addition, the LCA method is quite problematic where it comes to its practical application. Among the most common LCA issues in practice are, first, the high demands on time and input data; second, the uncertainty regarding the content of some particles of the analysed LCA chain; and third, that in practice, it is not necessary to analyse the complete LCA chain, which may be debatable with respect to the abovementioned point. That last statement is supported by several works [48,49,50,51]. That logic brings us, for practical purposes, unambiguously to a deeper analysis of the selected part of the LCA chain. The analysis is presented in this paper for two parts of the LCA, the first of which is represented by the transport process and its output streams, and the second is represented by the energy utilization of the conveyed fuel and its output streams. The latter is represented by the total calculated CO2 emissions. The first reason is that transport is an integral part of both processes in terms of emissions associated with the use of these fuels, and therefore, forms one whole with the combustion process. Solid fuels cannot be used energetically without being transported to the final consumer. Alternatively, other means of transport may also be used; other results would be obtained when using an alternative mode of transport (train, ship, etc.). The second reason is that it was possible to obtain unambiguous data for both partial processes, and in that connection, to obtain clear outputs with respect to the nature of the phenomenon under investigation. The overall view would probably be changed by taking into account other parts of the LCA chain. However, this article, based on the above-mentioned arguments, prefers accurate and practically useful calculations of the defined part of the LCA. The third reason is that during the solution, it became clear that the model was easily transferable to other conditions. An example may be the fact that the originally intended application of the model in the Czech environment has been limited to a certain extent, due to the relatively short transport distances (see chapter 3). While under conditions of longer transport distances, the model clearly demonstrates the expectedly significant increase in inefficiency for shipping, including the so-called break point: the point from which coal is more efficient than wood in terms of CO2 emissions (see chapter 3). Nevertheless, our study emphasizes issue of CO2 emissions that are generated by transportation of coal and wood, depending on transport distance. In other words, our study solves the question of coal and wood transportation effectiveness in terms of CO2 production by the break point determination.

3. Materials and Methods

After detailed literature research, which deals with CO2 emissions from wood combustion and transportation, we have come up with following findings.
  • Studies dealt with the partial aspects of CO2 production, without dependence on the transport of individual raw materials. CO2 emissions are comparable in both processes under review and represent at the same time energy consumption.
  • Previous studies were concerned with setting specific LCA values for the ratio of direct and indirect emissions in specific regions. In this study, we deal with general but significant connections of the transport of solid fuels and direct emissions from their combustion.
  • The output of this study is the determination of the unique relationship between the selected, and some of the most widely used types of solid fuels, and the transport distance and total specific CO2 emissions from these processes.
The main output of the work is the analysis of CO2 emissions’ development from transport depending on the type of solid fuel considered, while direct emissions from the combustion of these solid fuels are taken into account also. In the analysis, a break point was defined. In other words, a break point where is the maximum meaningful distance for timber transport. This point clearly quantifies the distance in which the total CO2 production from transport and wood burning process equals total CO2 production from transport and coal burning process. The analysis was divided into two sub-processes; namely, the determination of the CO2 emissions from the combustion of the considered fuels and CO2 emissions from transport.

3.1. Fuel

For auxiliary calculations of different fuels, the energy contents, volumes, and CO2 emissions of selected fossil fuels’ combustions need to be determined. Those are average values of efficiency and corresponding emissions for commonly utilized types of boilers and stoves fired by coal and wood. The energy content parameters of the combustion process for coal were determined from two sources. In general, the parameters for coal combustion may vary; however, in this work, brown coal was analysed. It may vary in parameters such as ash content, sulphur, water, and so on, but CO2 emissions should be comparable regardless of the specific source. The value for the CO2 emissions produced is, therefore, calculated from two independent sources for different types of lignite.
The first source was the coal-fired process from Umberto’s software tool library, which predicts a 70% efficiency of the burning stove. The second one was the information on the website of the Czech coal producer called Severočeské doly, a.s. According to Umberto library, 80.80 kg of coal produces 1,000,000 kJ of heat. This corresponds to 12.376 MJ/kg by taking into account the 70% efficiency of the heating system.
The primary energy input is calculated according to the formula:
Enp = En/η
where Enp represents primary energy consumption, En represents energy obtained by burning a certain volume of coal in kg, and η represents efficiency of the process.
The CO2 emissions from the combustion of 1 MJ of primary energy, ep, is evaluated as
ep = em × η
where em represents specific emissions and η represents efficiency of the process.
For the assessment of transport effects, it is important to take into account the amount of energy that can be transported, in each particular form of fuel, in one shipment. This requires data on the density and energy contents of the transported fuels. For coal, this data is directly available [52].
For wood, it is necessary to employ the following formula:
ρw = Mn × vff
where ρw represents density of 1 m3 of cut and chopped loose wood, Mn is the average mass of wood calculated from a combination of different tree species in 1 m3, and vff represents the percentage volume of clean wood in free-flowing 1 m3 of cut and chipped wood.
The following option is considered for wood. For calculating itself, it is necessary to set additional values, especially the energy contained in the wood Ep. The precise type of wood, its proportion, or wood moisture is unknown both in short-term and in long-term; therefore, the value of Ep was determined in accordance with the average calorific value of the wood and in accordance with expected moisture content based on [53]. CO2 emissions from the biomass burning process itself are herein considered as neutral, so they cannot be counted as total additional CO2 emissions.
The value of the wood mass, mw, corresponding to this volume, is calculated for the bulk space meters according to the relationship:
mw = Vw × ρw
where the mass of wood is in kg and the volume of wood Vw is in m3. Analogically mc and mb for coal are evaluated from volume Vc of coal respectively.
The determination of the calorific value for wood is a little bit problematic in Central European conditions. A relatively wide range of different tree species can be used, which differ both in calorific value and in density. Another problem is that the calorific value of the same wood type varies according to the volume of moisture contained. The information portal TZB info, which focuses on the issue of energy in the long term, provides data from which these typical calorific values can be derived [54], and subsequently, adjusted for real conditions. When determining the average energy content of firewood, items that are not meaningfully usable from an economic, environmental or physical point of view have been omitted. In Table 1 there are expected values of wood with 40–50% moisture contained, which is not possible to burn in common types of boilers, and wood with 0% moisture contained, that does not exist in normal conditions.
Let us assume in this study that wood is cultivated in the Czech Republic and it is commonly dried for a year in roofed areas; exceptionally wet wood stays there for 2 years. Let us, therefore, assume that the wood has a total calorific value of 14.215 MJ/kg, which is the average calculated from the values given in Table 1. The selected wood types represent the most commonly used species in the Czech Republic. The final value is, therefore, average, and at the same time corresponds to a water content of 20%.
The total amount of energy included in one load was calculated based on this calculation of energy content from values shown in Table 1 as follows:
Ew1l = Ew × mw
where Ew is the energy included in 1 m3 of wood. Alternatively, from energies Ec in coal, the total amount of energy included in one load Ec1l coal was evaluated.
For brown coal, it was also necessary to determine the corresponding CO2 emissions from the combustion process. Due to the neutrality of biomass emissions, CO2 emissions for wood were set to zero (Sw = 0). The emissions for coal are determined according to the formula:
Sb = Eb1l × ep

3.2. Transportation

In addition to emissions from energy consumed by transport, the associated processes, such as transport, are examined in this case also. As the means of transport were considered truck, train and ship. Data for a train is specific to the conditions of the Czech Republic, as it is based on the structure of the electric energy mix and is, therefore, not transferable. However, the data for shipping are transferable, since the propulsion of river cargo ships is similar and most of the ships in Europe that use diesel fuel.
When considering a truck with an average transport capacity of 8–10 m3 (in our study, the Tatra 815 S3 was selected with parameters according to Table 2. This type of truck is commonly utilized not only in the Czech Republic, but also in other countries. It has an average transport capacity of 8–10 m3.), the increase in total transport emissions of fossil fuel and renewable energy in the form of wood is caused due to the increasing consumption of fossil fuel consumed by transporting the wood to its customer. For analysis, a truck with the parameters listed in Table 2 was selected.
As the mass of transported fuels differs considerably, it is obvious that this effect will be reflected in the fuels’ consumption during transport. Therefore, it was necessary to establish a function that describes the relationship between the weight of the transported cargo and the fuel consumption. Let us assume for simplicity that the consumption depends on the additional mass linearly. The dependency function for selected Tatra 815 S3 vehicle is in the form:
y = 32.5 + (x/350.8197)
where y represents the total consumption in l/100 km and x represents the weight of the load in kg.
Based on knowledge of fuel consumption in l/100 km, CO2 emissions can also be determined. For CO2 emissions produced by transport, Ekoblog.cz reports the calculation of the specific emissions of diesel fuels [58]: “Specific emissions of CO2 per kilometre driven by diesel combustion = 10,084/3.7584 × Specific consumption (l/100 km)/100 = Specific consumption × 26.83 (g CO2/km)”.
Transport-related emissions from transport by truck as the second component of the total CO2 emissions St(truck), can thus be evaluated based on formula:
St(truck) = qt × y
where qt is the coefficient of diesel fuel CO2 emission (26.83 in this case) and y represents the consumption in litres per 100 km. Last but not least, the total number of trips to transport the same amount of energy, Nt, should be evaluated. This number can be determined as the ratio of the amount of energy transported per carriage relative to the brown coal according to the formula:
Ntw = Ec1l/Ew1l
where Ntw represents the number of trips needed to transport the same amount of energy in the form of wood, which corresponds to one fully loaded car with a coal. The value Ntc is less than always 1, because it is given by relation Ntc = Ec1l/Ec1l. Consumers will primarily demand a certain amount of energy, not fuel; however, when a specific fuel volume is demanded in the order, estimation of the amount of energy is required.
The data are available in a different form for train and ship transport. According to the original study, which was conducted in 2004 under the conditions of the Czech Republic [59].
The following values were researched for rail transport. It is true that the study may not be perceived to be completely up-to-date, but given the developments in the field of automobile transport, significant changes in energy consumption cannot be expected, since the measures being considered, especially recovery, have not yet been implemented. In addition, these are average values.
Since similar studies are rare in this field and the data structure exactly matches the purpose of the research, we consider these data to be sufficient.
Shipping transports according to Table 3. 410,000,000 t of cargo over a distance of 1 km, consumes 128,000 GJ. It uses 0.312 MJ for the transport of one ton of cargo per km. Emissions were calculated analogously.
Railway motor transport transports 1,690,000,000 tons of cargo per km and consumes 2,272,000 GJ. It therefore consumes 2,272,000 GJ/1,690,000,000 tkm for the transport of one ton of cargo per km, which is 1.344 MJ.
Therefore, we need 1.344 MJ of diesel to transport one ton of cargo over a distance of 1 km using diesel railways.
In case of electric railway transport, we calculated the outputs according to the same formula. Railway electric transport transports 13,040,000,000 t of cargo per 1 km and consumes 2,761,000 GJ. It therefore consumes 2,761,000 GJ/13,040,000,000 tkm for the transport of one ton of cargo per km, which is 0.212 MJ.
Therefore, we need 0.212 MJ of electricity to transport one ton of cargo over a distance of 1 km using an electrified railway.
The cargo volume according the Table 3 for electric and motor railway transport is a ratio of 88.53/11.47%. Therefore, the resulting emissions calculated for rail transport were combined from those two items, which together constitute the weighting for the weighted average calculation.
Specific CO2 emissions can be calculated in a similar way as for truck by substituting into the formula (there).
Under the conditions of the current electric energy mix, according to a decree of the Ministry of Trade and Industry [60], 1 kWh (3600 kJ) of electricity is produced with 1.17 kg of CO2 in case of the Czech Republic.
Total emissions from river transport (shipping) are also calculated by substituting for Equation (8). The auxiliary calculation that had to be performed here is to convert the tonne/kilometre data according to Table 3 and to specific CO2 emissions according to the formula.
St(ship) = (Etkm/Ed) × 2.683
where Etkm represents the energy consumption for transport of 1 t cargo for distance 1 km by ship, Ed represents the amount of energy included in 1 L of diesel fuel, and the number 2.683 is the weight of CO2 emitted by combustion of 1 L of diesel in kg.
Total rail transport emissions can be also calculated from ton-kilometers, but according to Formula (8) CO2 emissions can only be calculated for that part of rail transport which is realized using diesel locomotives. Under the conditions of the Czech Republic, this represents 11.47% of freight rail transport, while the remaining 88.53% is transport on electrified lines. To calculate CO2 emissions, it is therefore, necessary to use data from the Ministry of Industry and Trade, which states an emission coefficient of 1.17 CO2 per kJ [60].
Emissions for freight transport on electrified lines were calculated by multiplying the amount of energy per ton transported over a kilometer by an electrified railway by the amount of emissions determined by the Ministry of Industry and Trade. The formula used was:
St(train-e) = ((Etkm × Ef)/3600) * 1000
where Etkm represents amount of energy for transport of 1 ton cargo over distance 1 km on an electrified line, and Ef is the emission coefficient according the directive 425/2004 Coll. of the Ministry of Industry and Trade ČR. The 3600 is the conversion factor from kWh to J, and multiplication by 1000 was necessary to express the result in grams.
The following three relationships are original and key results of proposed methodology. These functions define the relationship between CO2 emissions and monitored process parts. The total amount of wood CO2 emissions, yw, for transport and combustion together is given by:
yw = (x × St(L=0) + x × St(L = w)) × Ntw
yc = ((x × St(L=0) + x × St(L=c)) × Ntc) + Sc
Equations (12) and (13) characterize the total CO2 emission of wood and the total CO2 emission of brown coal yc. Analogously2, CO2 emissions for other modes of transport are calculated.
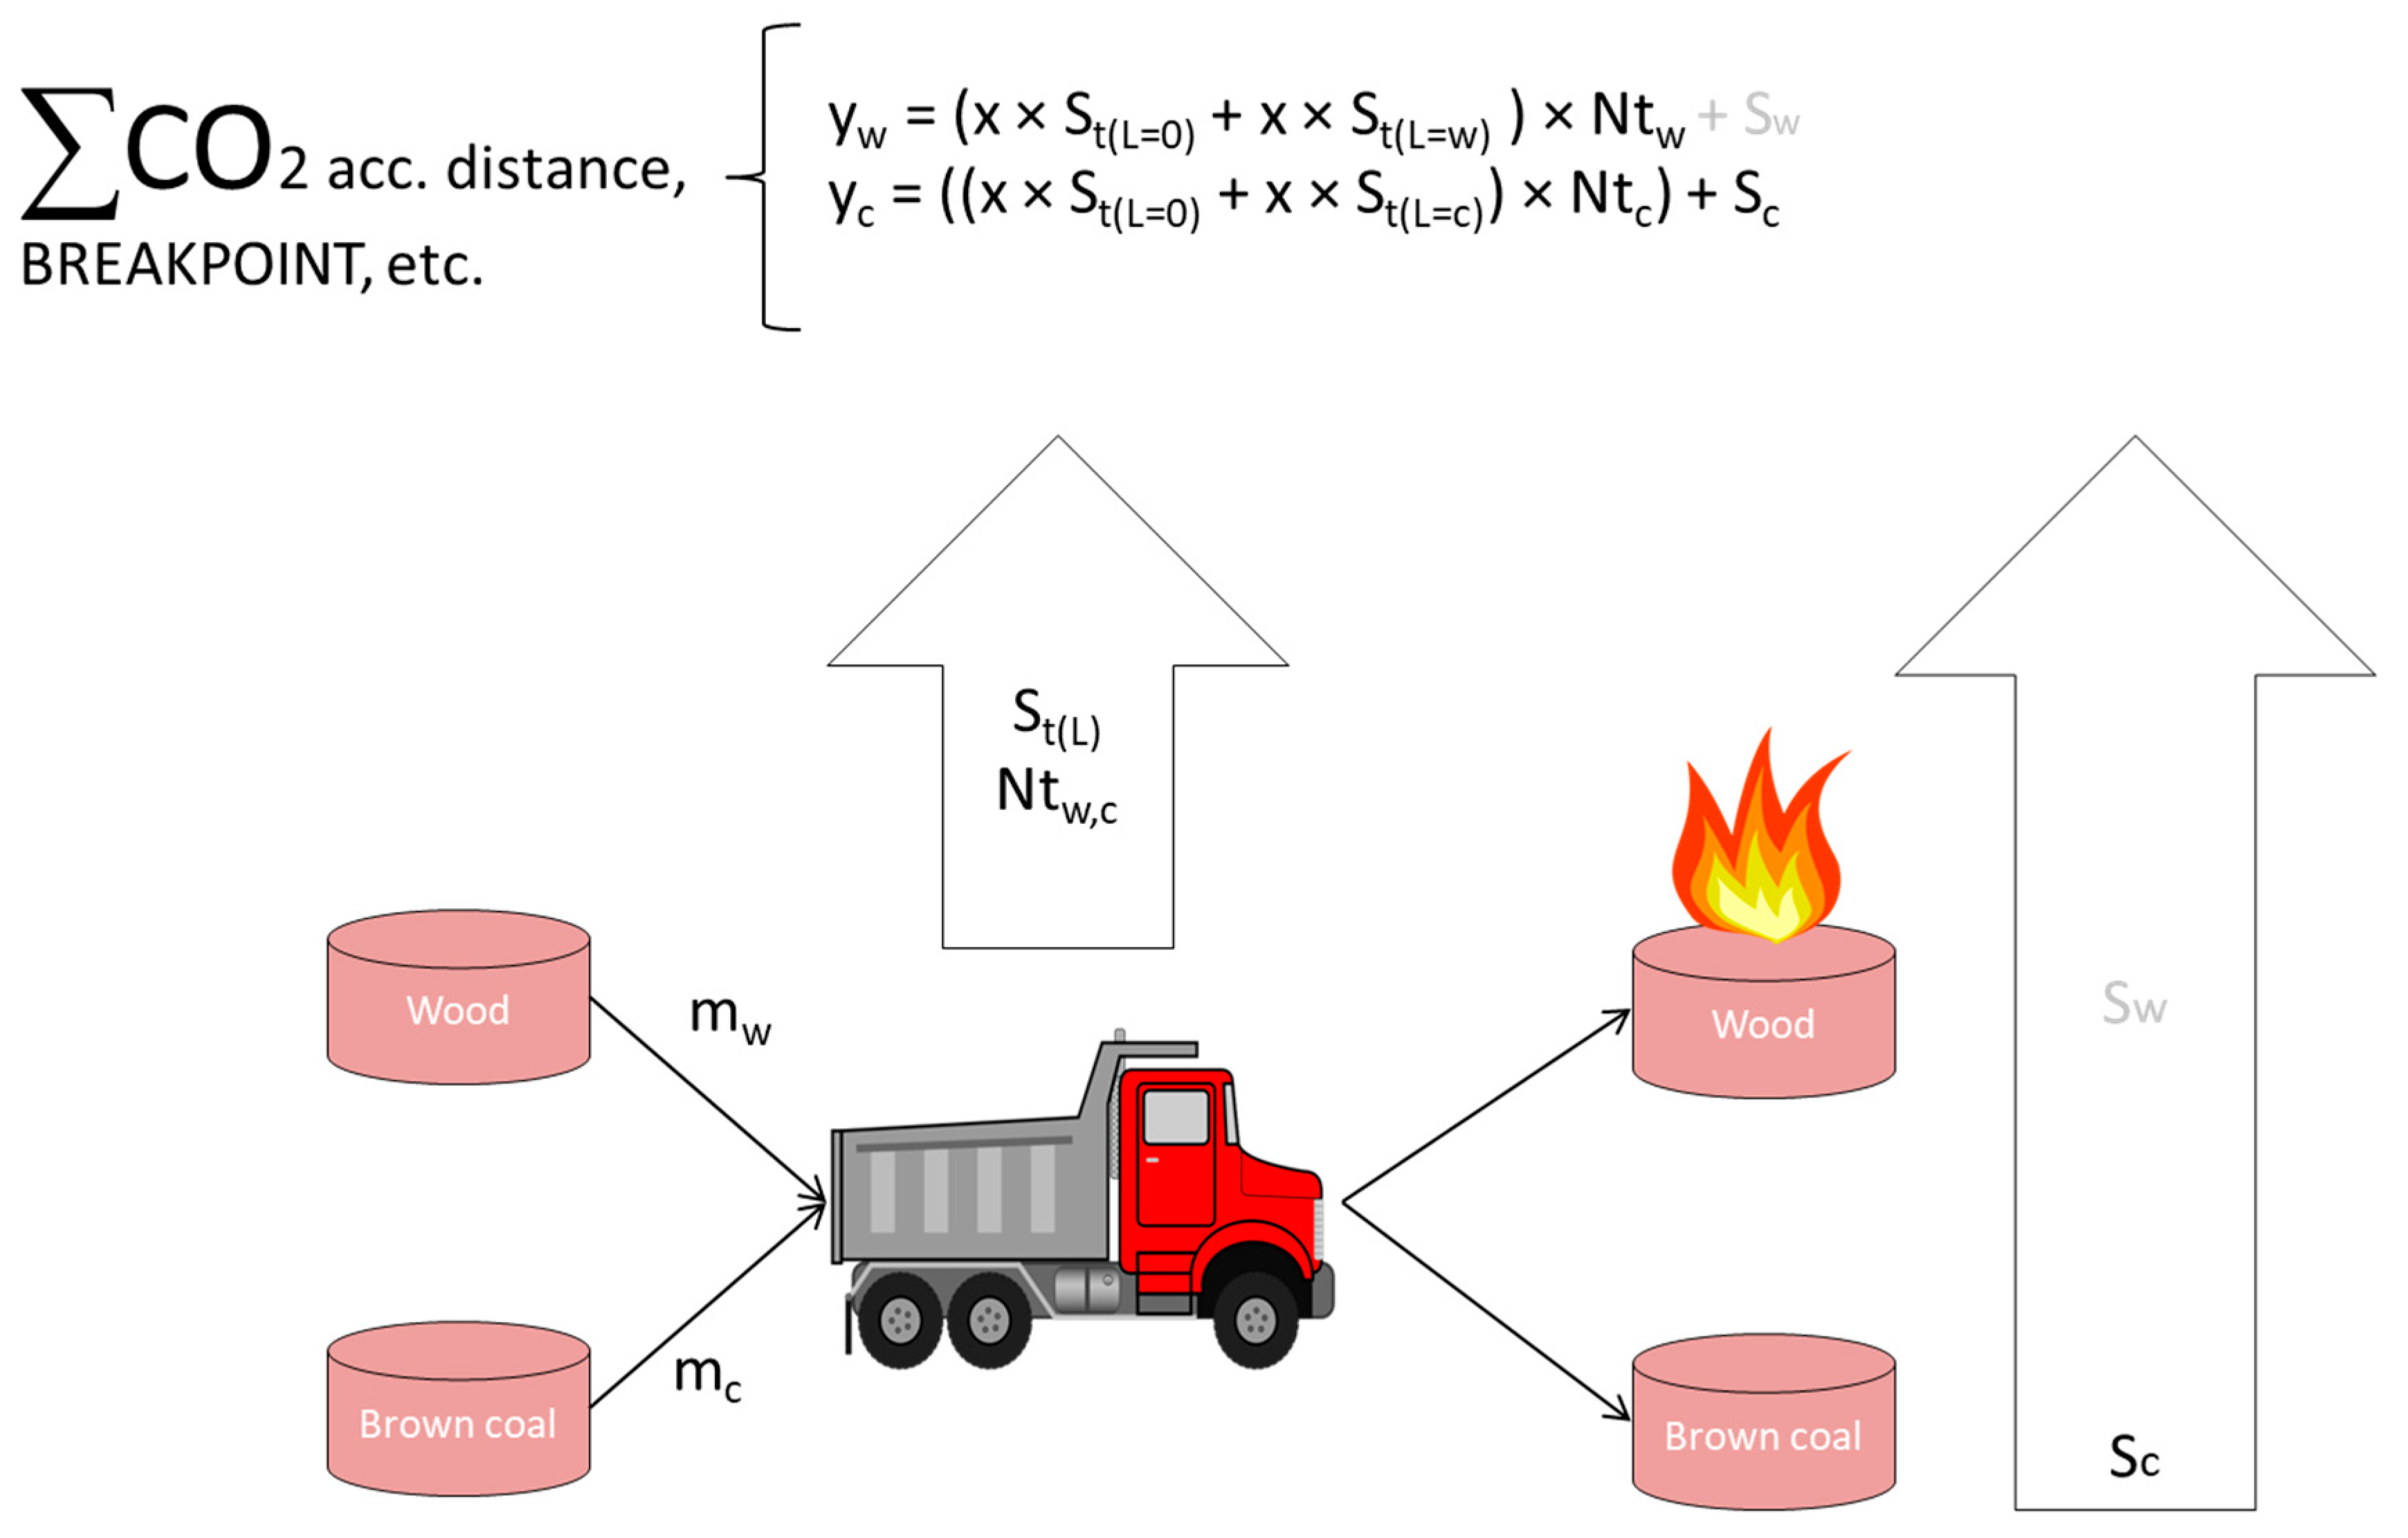
The whole methodology can be illustrated as depicted in Figure 1. The first arrow symbolises transportation and the second one corresponds to the combustion process. The variable Sw is not considered in the Equation (11), because of its zero value. But for the completeness and better clarity of proposed procedure, it is shown in Figure 1 and distinguished by the grey text colour. This model can then be further extended to other transport types.
4. Results

As we recognized the knowledge gap during the literature review, the previous chapter proposed an original methodology for calculating inefficiency in terms of CO2 emission and transport distance. This inefficiency relates to the nature of the material being transported. In the following paragraphs, the case study with specific empirical values (valid for the Czech Republic) is provided and the break point for wood is revealed.

4.1. Calculations

In the following chapters are the results of calculations based on formulae defined in the methodology section, first, for the CO2 from the combustion of fuels used for heating, and second for fuels and energy types used for transport of fuels used for heating.
The following formulas show the process of the evaluation of the specific CO2 emissions per unit of energy (MJ) when coal is assumed as the fuel. The emission data obtained from the Umberto software environment library [61] and the Bílina mine website were used for the calculation [62].
In line with the proposed methodology, the primary energy consumption, Enp, was determined at first by substitution into Equation (1).
Enp = En/η =12.376/0.7 = 17.68 MJ/kg
The result, giving the calorific value of the coal itself, without taking into account the efficiency of the equipment, is equal to 17.68 MJ/kg. This is in correspondence with calorific value for Ledvice coal, that is equal to 17.6 MJ/kg, as listed on the site of the mining company [62].
For this coal, Biom suggests emissions of 102.9 g CO2/MJ for combusted brown coal with a humidity of 39.5% [63]. The Umberto software-based calculation gave 151.27g CO2/MJ, which is 70% relative to the efficiency of the combustion plant. By substituting into Equation (2), we calculated the emission value for the fuel itself:
ep2 = em × η = 151.27 × 0.7 = 105.889 g CO2/MJ
For the evaluation of total CO2 emissions from coal, the average value of these two values was used:
ep = (102.9 + 105.889)/2 = 104.3945 g CO2/MJ
Substituting the empirical data from the above-mentioned sources [61,62], quite similar values were obtained. From those partial results, which are presented in the Equations (15) and (16), the average value was calculated. This is a substantial sub-result, since it has been found that the specific CO2 emissions converted to energy in MJ do not differ significantly for different coal types. This fact makes it possible to assume that the resulting value can be utilized with little error for other types.

Wood as a Fuel no Number if There Is only One Subsection

The average energy value of firewood used most often in the Czech Republic for the following calculations was set in methodology chapter as 14.215 MJ/kg. In case of applying this procedure to another area with a different composition of used tree species, it is possible to update the calorific value and recalculate the results for any conditions.
Within the following relationship (Equation (17)), the weight of 1 m3 of pure wood mass was calculated after processing to a length of 33 cm. The value ρw indicates the specific value of the wood processed to 33 cm and loose to the body of the transport device. The weight was calculated for this blend of wood as 582 kg/m3 of pure wood; the expected volume of bulk timber was 0.41 m3 of pure wood volume per 1m3 of the loading area. A value of 0.41 m3 is the diameter for a non-irrigated field of 33 cm, which is the most commonly used one [64].
ρw = Mn × vff = 582 × 0.41 = 238.62 kg/m3
In the case of fuel transport, it is necessary to work with data that can be compared for further actions. Therefore, Table 4 provides a summary and supplementation of the data and weights of the fuels compared to their volume.
Another important limiting factor is the mode of transport. The reason for this is the possibility of using different types of transport, and therefore, different specific CO2 emissions can be expected, due to variable energy consumption per kilometre and variable transport capacity.
In Section 4.2 and Section 4.3, the amount of energy contained in the transported solid fuels is described with full utilization of the capacity of the means of transport considered.
It is also necessary to take into account maximum weight of the load to be transported with respect to the weighed means of transport. The reason for this is to verify the possibility of using the full transport volume potential for the considered fuel and type of vehicle. The article considered that Tatra 815 S3 truck has two important limits: the weight limit of 10,700 kg and the volume limit of 8 m3 of transported cargo.

4.2. Calculation for Wood

Based on the aforementioned calculations and data in Table 4, the bulk density of wood was taken to be 238.62 kg/m3. The weight of transported wood was evaluated by substituting into Equation (4):
mw = Vw × ρw = 8 × 238.62 = 1909 kg
A fully loaded truck brings 8 m3 of wood that weighs 1909 kg. Even if there the maximal load, the weight capacity of 10,700 kg will not be exceeded. Therefore, wood transport is limited by the volume of the hull.
To express the total CO2 emissions from the monitored processes, it is necessary to express the total transported volumes of energy. This is necessary in order to determine the number of trips corresponding to the transport of the same amount of energy in the form of different types of fuels (wood and coal).
Therefore, it would be possible to transport 1.9 t of wood in one trip. Substituting into Equation (5) we got the energy content of that mass of wood:
Ew1l = Ew × mw = 14.23 MJ/kg × 1909 kg = 27,165 MJ
The resulting value represents the amount of energy in wood that can be transported by fully loaded transport vehicle.

4.3. Calculation for Brown Coal

Analogous calculations were done and results for brown coal were obtained. Those values were already calculated for bulk material.
Substituting into Equation (4):
mc = 8 × 1300 = 10,400 kg
8 m3 of brown coal would weigh 10,400 kg. Even of there were maximum load capacity, the weight limit would not be exceeded.
Substituting into Equation (5):
Ec1l = 17.6 MJ/kg × 10,400 kg = 183,040 MJ
The resulting value of Ec1l represents the amount of energy that can be transported in the case of a fully loaded transport vehicle and brown coal. Again, unlike wood, it was necessary to calculate the amount of CO2 emissions generated by burning this brown coal.
Substituting into Equation (6):
Sc = 183,040 MJ × 104.3945 g = 19.108 t CO2
The corresponding CO2 emissions contained in 8 m3 of brown coal are 19.108 t of CO2.
The results in Section 4.2 and Section 4.3 present the first part of both combined processes to monitor CO2 emissions. The next section opens the second part of the combined process calculations, focusing on the emissions from the transport process.

4.4. Calculation for Transport

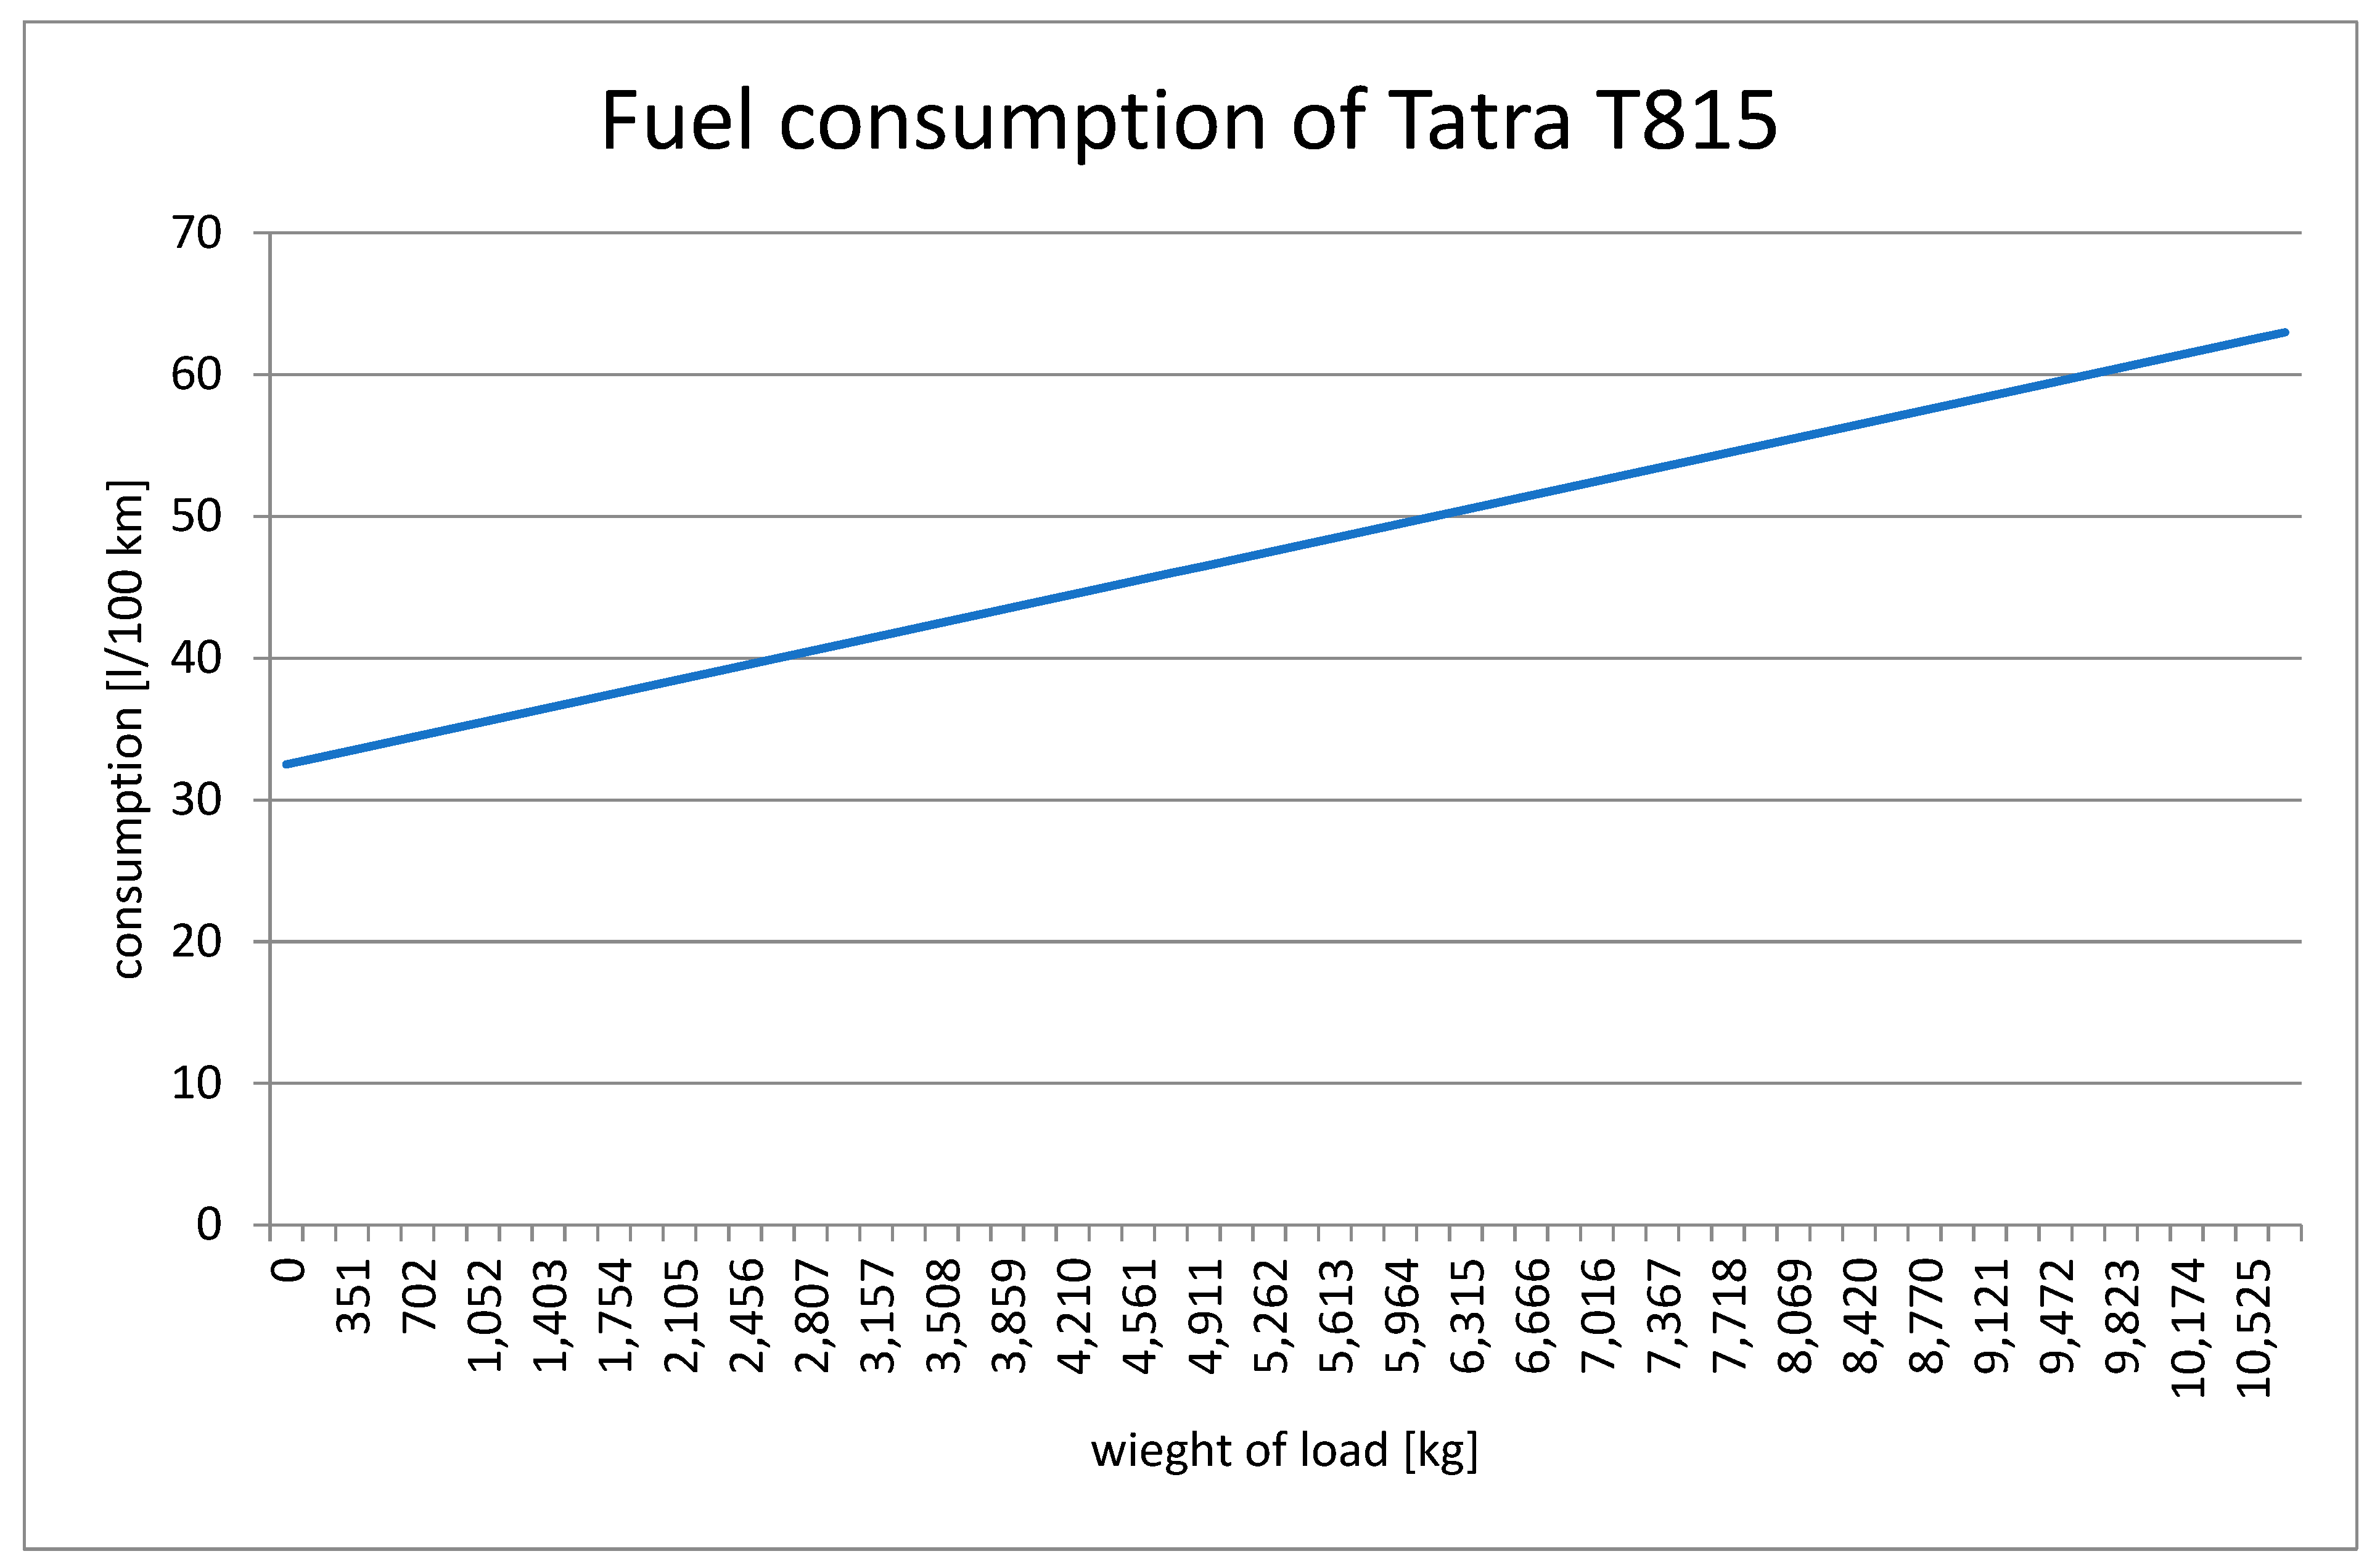
The Tatra 815 S3 with an average transport capacity of 8–10 m3, has fuel consumption for any load weight within the load interval shown in Figure 2. That dependency is given by Equation (7).
Expected consumption will differ because the weight will vary considerably in the cases considered. The basic fuel consumption of 32.5/63 L/100 km represents the range for an empty and fully loaded truck. Consumption, however, is given above all by the weight of the load, not its size (considering the air resistance does not make sense to include). The graph of Tatra 815′s diesel fuel consumption is shown in Figure 2.
By substituting into Equation (7), consumption for the transport of the material concerned was obtained. Then, with the help of determined functional dependency, the fuel consumption of the selected vehicle was able to be calculated for any weight of the load being carried.
The results for the distribution of individual types of fuels are given in Table 5. The table also summarizes the results for the combustion process of transported fuels, which is the summary of the previous parts of the calculations. The values in Table 5 were converted to 8 m3, representing the fully loaded Tatra 815 S3. The first column shows the weight of a fully loaded vehicle with a particular solid fuel; the second column shows the CO2 emissions of selected solid fuels; and the third column summarizes the fuel consumption per 100 km of the right fuels selected by the vehicle.
Specific consumption and specific CO2 emissions are included in Table 6. Because CO2 emissions were the chosen identifier of the reviewed (analysed) processes, the emissions of CO2 per 1 km were determined (Table 6). The results were calculated based on [58] by substituting the values of the third column of Table 5 as a variable x in Equation (7). The results were further converted to g/km and presented in Table 6. The reason is to compare the emissions related to transport of each type of solid fuel (mentioned in 1st column of Table 5). In general, is also possible to use this data for comparisons with other types of trucks or even different transport means.
Table 6, therefore, summarizes the emissions per kilogram of a given load. The order of rows is identical as in Table 5. The value of 871.975 g/km, contained in the second column of Table 6, corresponds to emissions per kilometre without a load; the value of 1017.9302 g/km corresponds to emissions per kilometre of a fully wood-loaded truck; the following values apply accordingly for driving a fully loaded car carrying brown coal. Since energy is being demanded in the form of energy volume, it is then necessary to express how much energy is transported in a fully loaded truck. That could be expressed by how many times the path must be taken to transport the same amount of energy relative to the chosen fuel variant. That is shown in Table 7, where Nt(w,c) are calculated according to Equation (9).
The first column of Table 7 describes the solid fuel types; the second column contains the amount of energy contained in the solid fuel per trip considering the type of transport. The third column shows the recalculated number of trips to be performed in order to carry the same amount of energy in all cases. Trips are recalculated according to the volume of solid fuel transported. The initial values and the results after substitution into Equation (5) are given in the second column. As a reference, the value for brown coal was used.
The number of trips were left in decimal form, because research’s subject was the specific emissions of CO2 for the whole process. They are average values, not specific numbers of trips and specific deliveries. These values apply when carriers use their transmission capacities optimally. The actual condition is likely to exhibit worse parameters, since the used vehicle is not always loaded at 100%.
As can be seen from the data in Table 7, the smallest amount of transported energy is represented by transport of wood. For transporting the same amount of energy (that falls on one fully loaded carriage of brown coal) an average of 6.738 rides is needed.
Break Point Determination
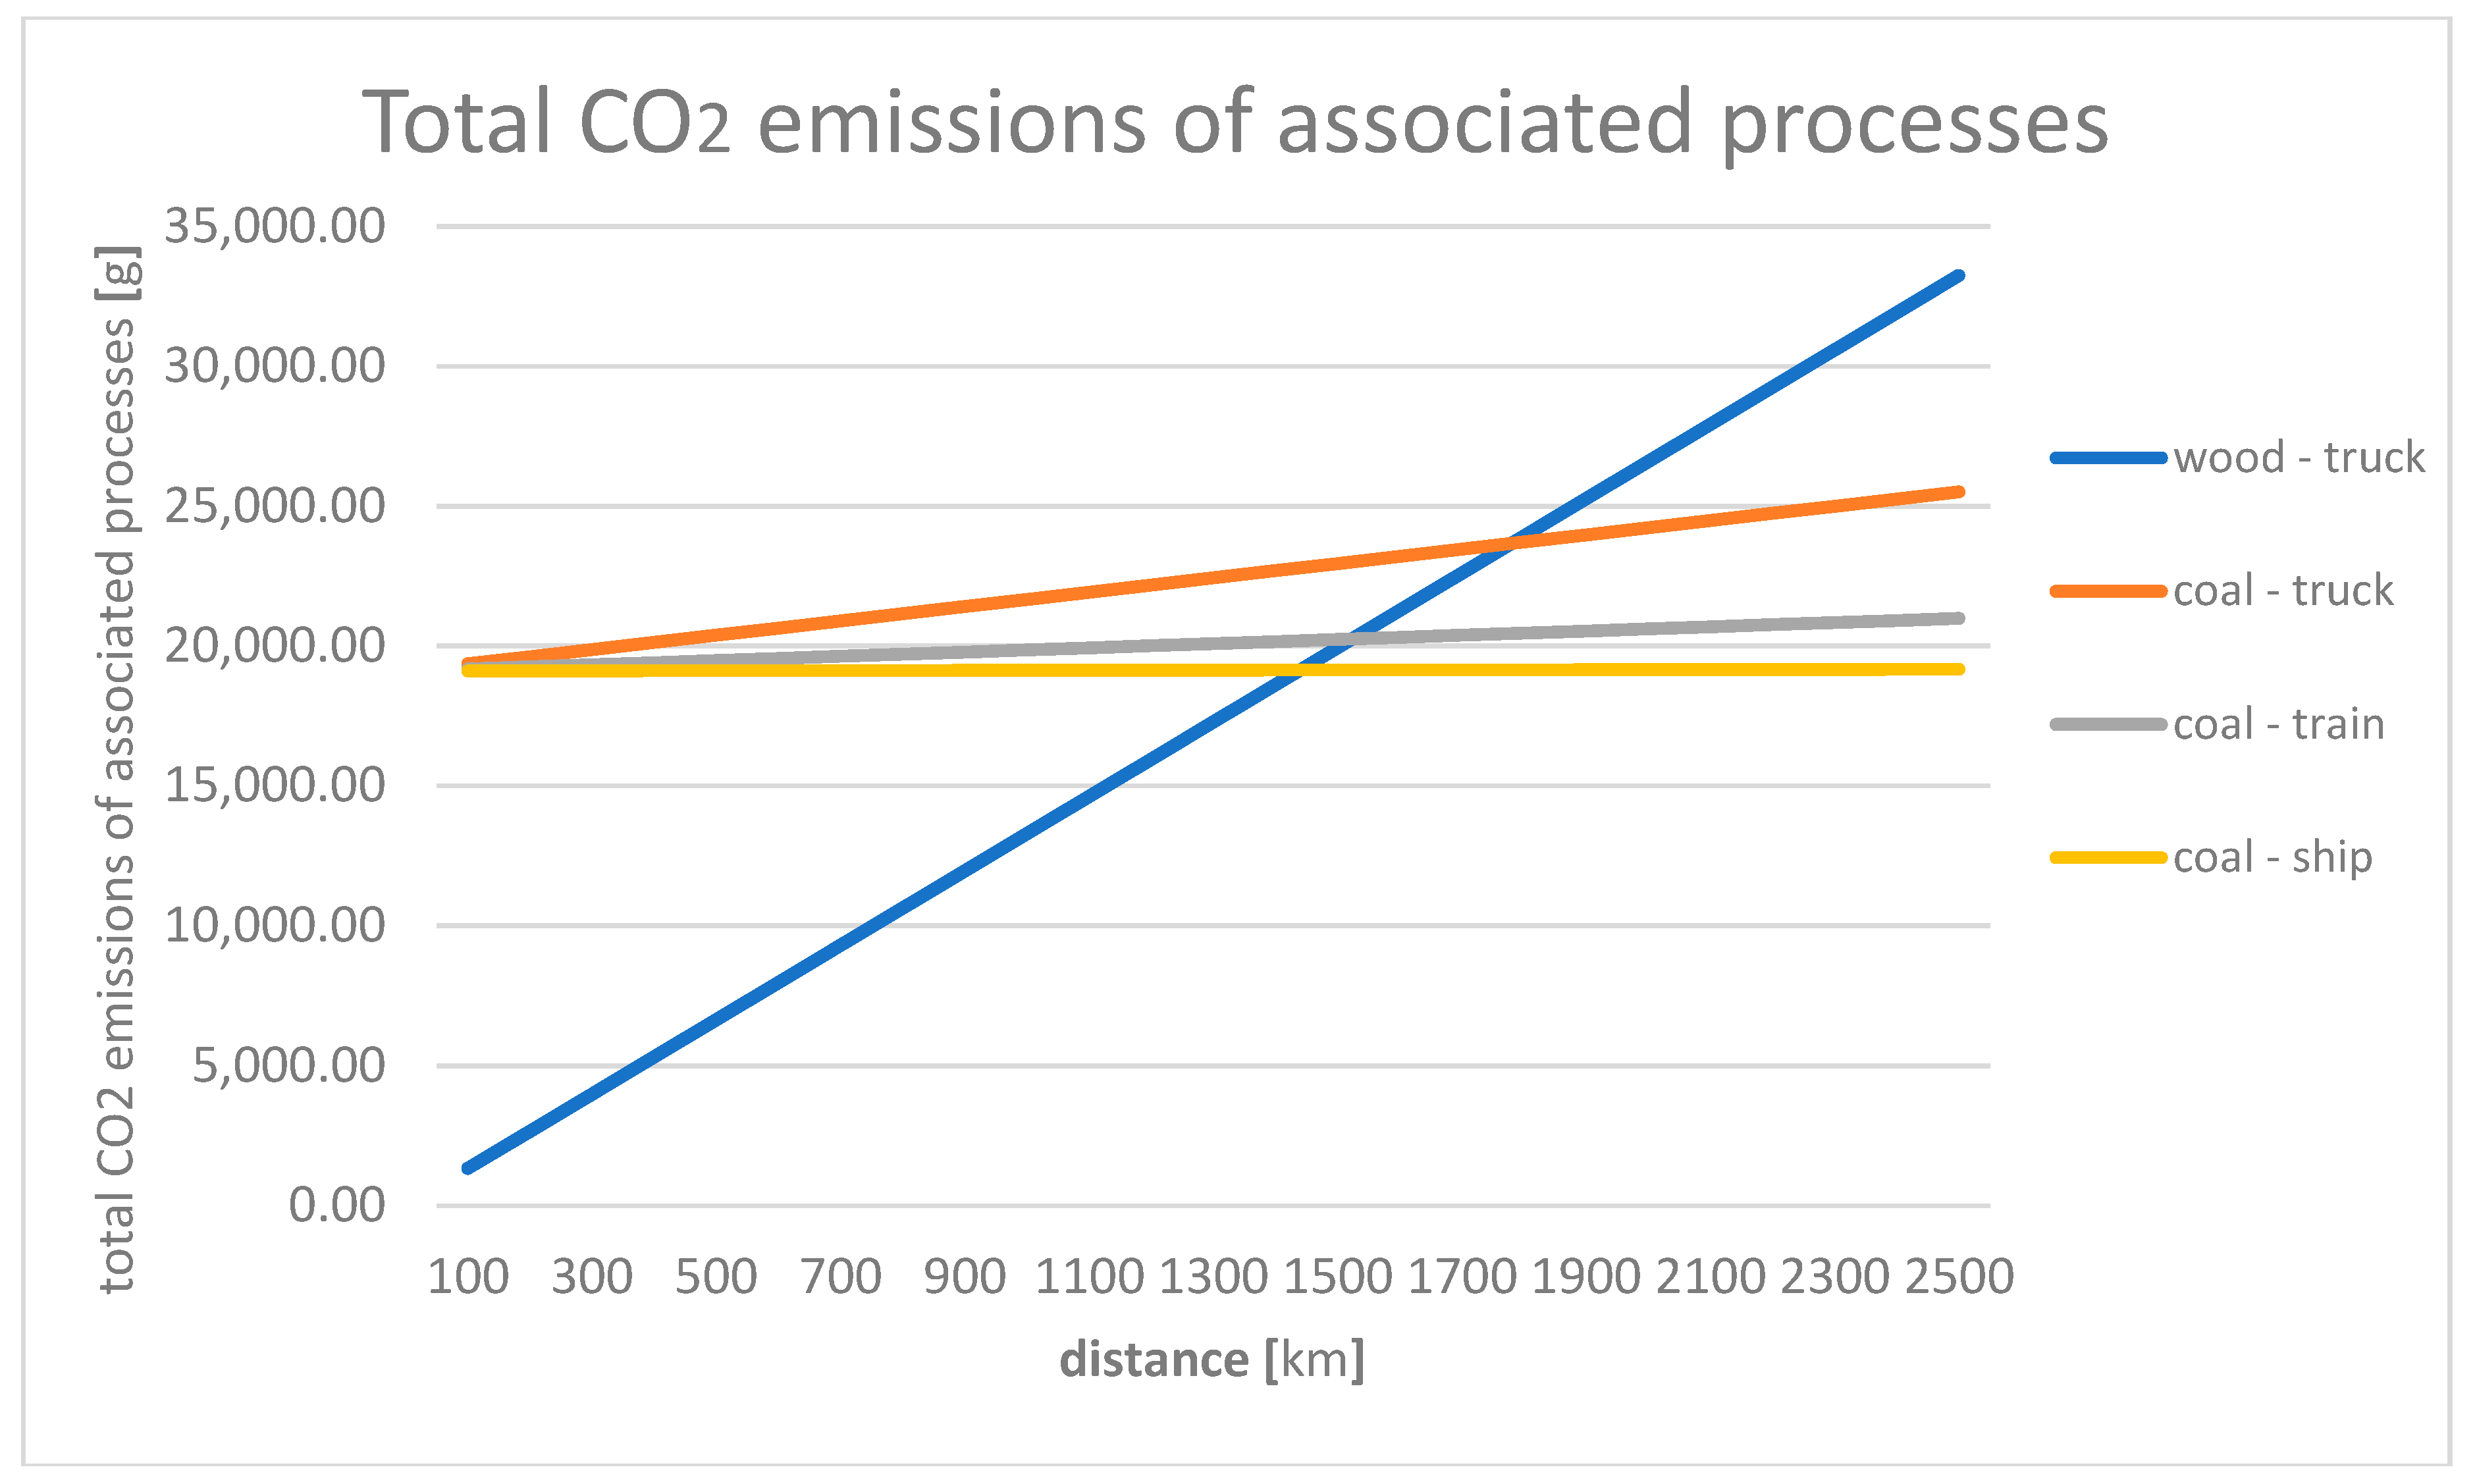
The key finding of this article was the determination of CO2 efficiency break point for different kinds of transport that can be evaluated directly from Figure 3.
The evaluation of the CO2-efficiency break point for associated processes has not been explored so far, so it was confirmed as a research gap. This was already demonstrated in the introduction, where a detailed overview of current state of the art and review of previous works with similar topic can be found. There are many studies with comparable topics, but neither of them examined the overall fossil CO2 emissions by combining several processes within the supply chain as we have proposed. Studies [29,30,31] addressed biofuel reduction of CO2 emissions; however, they did not address the problem of combining those factors. Contribution [32] dealt with the combined process of biomass combustion and transport; nevertheless, in terms of total energy involving the woodworking process. Environmental break points were not established for the efficiency of these processes, as we proposed, and a comparison with the combined process for fossil fuel was not included. Many other sources have been found, e.g., [38,39,40,41,42], addressing either the combination of transport and biofuels, or the determination of fossil fuel emissions. However, they examine the problem from a different point of view, with a different range and context. In studies [43,44,45], authors applied the LCA methodology, but none of them combined the LCA methodology together with the associated processes involving transport and combustion, and the comparison of biofuels with fossil fuels. Contributions [46,47] dealt with emissions from biomass and coal combustion together, but only for electricity generation. As was explained in detail earlier, all of those studies addressed selected issues from different points of view and with different scopes and contexts. Moreover, none of them had the ambition to set a specific breakpoint for the combination of transport and post-combustion of fossil fuels and biofuels in the CO2 emissions context.
From a theoretical point of view, it has been shown that such points actually exist. Based on the solution of the system of defined equations, its value was calculated for the selected conditions: ca. 1780 km for transport by truck, ca. 1500 km by train, and ca. 1400 km by ship. As can be seen from Figure 3, according to various fuel parameters, break points for different fuel and transport combinations can be also determined. In the case of Figure 3, it shows a combination of wood and brown coal truck, train, and ship transport. On a practical level, a break point can be used to assess the effectiveness, sustainability, and environmental impact of any associated process. This coupled process is bounded by fuel transport and combustion.
From our results, it is obvious that, for normal distances in the order of kilometres or tens of kilometres, the difference in total specific CO2 emissions is not significant. However, the overall emission curve for the wood transport process is considerably larger due to its lower weight curves than those for brown coal. This points to the fact that the combined process of burning wood and its transport is prone to a rapid increase in total CO2 emissions over longer distances. As the model neglects CO2 emissions associated with logging, the results for wood will be even more unfavourable than the ones show in Figure 2.
For distances of 1780, 1500, and 1400 km for trucks, trains, and ships, respectively (points where the blue curve crosses the others), it is better to burn brown coal than wood in terms of total CO2 emissions.

5. Discussion and Conclusions

At the beginning of the discussion and before stating final conclusion, it is necessary to be aware of following facts, which underline the originality of the approach of researched in this paper, and at the same time, illustrate its benefits.
First, the aim of this paper was to deal with CO2 emissions in energy production process based on calculation of the total specific CO2 emissions of a combined process and setting the break point according to chosen factors. The outcomes are evident from the graphical interpretation of the results in Figure 3. Key factors were the type of fuel and the transport distance. The break point, where it is not worthwhile to use wood as an energy carrier as the alternative to coal, has been found. As can be seen in the search section, such an approach has not yet been applied in this context. Also, the dependence of specific CO2 emissions from transport on the type of transported solid fuel was also revealed. Results were achieved within the original methodology, applied within the LCA framework. The general novelty of this paper is, with reference to the literature search, in the original view of analysing CO2 emissions in the case of associated processes and with reference to the political level. Novel benefits are outlined in the following paragraphs. An example could be the discussed fuel transport in terms of energy volume or the interconnection of transport, cargo carried, and specific CO2 emissions.
Second, the proposed methodology opens two issues to be discussed. First issue concerns its practical use. The second issue is about its general use of the methodology. In case of the practical use, it should be taken into account that, although the process and the associate input parameters were designed for the Central European environment (namely, the Czech Republic), the calculations facilitate its use in other regions of the world. This is mainly due to the conditions in Central Europe. Original results show an unusually large transport distance for which the total specific CO2 emissions are lower for one fuel (the calculated break-point).
Limitations of Study
While working on this study, we came across limitations that we consider necessary to state in order to broaden the perspective of the researched issue. What matters is the locality, because the choice of locality and its specifics determines other input parameters. Those are mainly the type of wood, type of transport, and transport distances. In case of the locality we chose, it is the environment of the Czech Republic, which in many aspects can be extended to the Central European region. This implies the specifics for the selected type of transport, also the means of transport, as well as certain above-mentioned parameters in case of rail transport and related CO2 emission factors. Selected types of wood and their parameters are connected with the choice of the locality, which of course significantly contribute to the final results. At the same time, the selected location determines the transport distances common to the region. It should be noted, however, that when developing the methodology, the emphasis was placed on the possibility of its universality in terms of transferability to other environments and related, different input parameters. We believe that due to careful construction and a detailed description of the methodology, non-local application should be feasible without major obstacles.
Practical Use of the Methodology
Since the aim was to determine a theoretical break-point, it was necessary to think about the practical application of this result. In Europe, the usual fuel transport distance when using trucks is within range of tens to hundreds of kilometres. The break-points calculated in this study were 1779.64, 1500, and 1400 km, showing the fact that in Europe, transport efficiency is not a major problem in terms of specific CO2 emissions. On the other hand, this distance limits the usability of the breakpoints itself and the circumstances resulting from it, even though the model shows the increasing inefficiency expressed by specific CO2 emissions from traffic for any distance. But there are regions in the world where truck transport is realized for hundreds to thousands of kilometres. An example might be South America or some regions in Asia, where, due to insufficient rail networks trucks are used for long-distance transport. Thus, even though the original intention was to concentrate on the practical application of the model in Central Europe, the calculations in practice appear to be inappropriate for this region; but possibly worth considering for other regions. Because we did not consider it essential to change the input parameters typical of Central Europe (namely, the Czech Republic) for the purposes of this article, we used the Tatra 815 S3, which is a truck typical of the Czech Republic. In addition, parameters typical for coal and wood extracted in the Czech Republic were also used. However, the strength of this model lies in its easy generalization by the alteration of several input parameters to match the specific conditions of particular regions. For application in other regions, it is necessary to perform a parameter correction for a particular means of transport used. That could be related to another mode of transport as well. As far as trucks are concerned, the consumption and transport capacity of a particular vehicle needs to be known. For more accurate calculations, it is also appropriate to take into account the weight and average calorific value for the usual composition by species of burned wood, in regions where there is a completely different composition of trees (e.g., tropical). For coal, it is recommended to verify the parameters, especially in terms of its weight per unit volume and calorific value of a specific type of coal. For example, in South America, the practical application of this model gains it merit. For Europe’s conditions, the meaning of the results can be seen not directly in determining the breakpoint itself, but in determining the rate of increasing inefficiency of wood use as a fuel with growing distance (in terms of total specific CO2 emissions).
General Use of the Methodology
At the theoretical level, it has been shown that CO2 is a suitable indicator for conjoined processes’ analyses, even though the use of CO2 for such applications has been underestimated. This was underlined by the works in the literature review; e.g., [18,46,47,65] compared to the results of this article.
Generally speaking, the intent that we opened at the beginning of the study was to deal with transport and combustion as a combined process. Parts of this process cannot be separated in practice, and we believe that it is not possible to deal only with emissions issues in the combustion process as a determinant that will represent the induced environmental burden. Calculations of total specific CO2 emissions from the combustion and transport of wood can be considered only as a partial result. On this basis, it was possible to establish a functional relationship between the distance and overall emissions. This functional relationship was expressed by three equations and it was considered the basis of the original methodology. The break point, which was the final outcome of this work, was then, the final result of the above-mentioned equations.
Overall Conclusions and Discussion
The proposed methodology can also be evaluated in terms of overall conclusions, in terms of some partial results, and finally, in terms of the possibilities of generalization. The structure of the two parts of the work provide both a relatively complex view of, and some partial conclusions for the process of determination of total specific-emissions of CO2 from the combustion of solid fuels and the emissions from the transportation of those fuels. The part which deals with the determination of CO2 emissions from the combustion processes of selected solid fuels shows one of multiple possible views on the relatively accurate determination of some parameters of the combustion process’s outputs. The values for wood were based on knowledge of the average composition of harvested trees corresponding to the conditions of Central Europe. The portability of the model to other regions is, of course, also possible, as already mentioned. However, a possible correction of parameters for the composition of local tree species is appropriate. Values for coal can usually be found on suppliers’ or mining companies’ websites. For these fuels, it is also possible to recommend validation and eventual value correction when applying the model to other regions. The energy content of the coal can shift the proposed breakpoint either to a greater distance, or alternatively, shorten the distance.
Increasing the amount of energy in wood will move the breakpoint closer to the beginning of the graph. Reducing the amount of energy will move the breakpoint to greater distances. For transport parameters, a simple model was designed to determine the change in consumption in relation to the freight load. In practice, the course of the function is not entirely linear. Most likely, it will be exponential, as the rolling resistance of the tires will also appear. As the straight line is not used at the speeds considered therein, such influences are not very significant; therefore, the linear function y = 32.5 + (x/350.8196721) was constructed as is depicted on Figure 2. It can be said that the analysis has demonstrated the sensitivity of the timber supply process to transport when the process is considered in terms of CO2 emissions. The results show that the total specific emissions of CO2 from the comparison processes equalize only at the distance of 1779.64 km. With the reference to practical utilization, this problem should be seen in the fact that, already, at a distance of 355 km, the amount of CO2 corresponds to 1/5 of the emissions that would be produced by heating with brown coal. Such a quantity of emissions largely limits the positive effects resulting from the neutrality of CO2 emissions from the energy use of biomass. Besides the practical application, it raises questions about the results of the policies aiming to meet the requirement of the Paris Climate Conference. The final summary of this transmits this simple message: We have shown that there is a point that represents a turning point in which it is more efficient to burn coal than wood. Efficiency refers to the total CO2 emissions of the combined process. Therefore, it can be stated that wood is not always a more environmentally friendly alternative, because, as we have shown, under certain circumstances it is more environmentally friendly to use coal.

Author Contributions

Conceptualization, R.B. and J.F.; Methodology, R.B. and J.F.; Software, R.B.; Validation, R.B. and J.F.; Formal Analysis, R.B. and J.F.; Investigation, R.B., J.F. and P.L.; Resources, R.B., J.F. and P.L.; Data Curation, R.B., J.F. and J.H..; Writing-Original Draft Preparation, R.B. and J.F.; Writing-Review & Editing, R.B. and J.F.; Visualization, R.B. and J.F.; Supervision, R.B. and J.F.; Project Administration, R.B., J.F., P.L. and J.H.; Funding Acquisition, R.B., J.F., P.L. and J.H.

Funding

This article was supported by the grant No. SGS_2019_19 of the Student Grant Competition.

Conflicts of Interest

The authors declare no conflict of interest.

References

  1. IPCC. Climate Change 2014, Synthesis Report, Summary for Policymakers. 2014. Available online: 1url.cz/Ft9K6 (accessed on 7 October 2017).
  2. United Nations. United Nations Framework Convention on Climate Change. 1992. Available online: 1url.cz/Ct9rt (accessed on 7 October 2017).
  3. United Nations. Kyoto Protocol to the United Nations Framework Convention on Climate Change. Available online: https://unfccc.int/resource/docs/convkp/kpeng.pdf (accessed on 7 October 2017).
  4. European Commission. Covenant of Mayors for Climate & Energy. Available online: http://www.covenantofmayors.eu/IMG/pdf/covenantofmayors_text_en.pdf (accessed on 7 October 2017).
  5. United Nations. Paris Agreement. Available online: 1url.cz/3t9rr (accessed on 7 October 2017).
  6. Ministry of the Environment of the Czech Republic. Covenant of Mayors for Climate and Energy. Available online: https://www.mzp.cz/cz/pakt_starostu_a_primatoru (accessed on 7 October 2017).
  7. Recast, E.P.B.D. Directive 2010/31/EU of the European Parliament and of the Council of 19 May 2010 on the Energy Performance of Buildings. Off. J. Eur. Union 2010, 18, 2010. [Google Scholar]
  8. European Parliament. Directive 2012/27/EU of the European Parliament and of the Council of 25 October 2012 on energy efficiency, amending Directives 2009/125/EC and 2010/30/EU and repealing Directives 2004/8/EC and 2006/32/EC. Off. J. Eur. Union 2012, 315, 1–56. [Google Scholar]
  9. Government of the Czech Republic. Government Council for Sustainable Development. Available online: https://www.vlada.cz/cz/ppov/rada vlady-pro-udrzitelny-rozvoj--120432/ (accessed on 30 December 2017).
  10. Government of the Czech Republic. Government Council for Sustainable Development. Available online: https://www.vlada.cz/cz/ppov/udrzitelny-rozvoj/vybory-rvur/vybor-proududitelnou-energetiku-130368/ (accessed on 30 December 2017).
  11. Ministry of Industry and Trade. Government Council for Energy and Raw Materials Strategy of the Czech Republic. 2017. Available online: https://www.mpo.cz/dokument147240.html (accessed on 30 January 2018).
  12. Chamber of Deputies of the Czech Republic. Act No. 165/2012 Coll. On Supported Energy Sources and on Amendments to Certain Acts; Chamber of Deputies of the Czech Republic: Prague, Czech Republic, 2012.
  13. Ministry of Industry and Trade. State Energy Policy. Available online: https://mpo.cz/dokument5903.html (accessed on 30 December 2017).
  14. Ministry of Industry and Trade. State Energy Policy. Available online: https://www.mpo.cz/dokument158059.html (accessed on 30 December 2017).
  15. Ministry of the Environment of the Czech Republic. Strategy on Adaptation to Climate Change in the Czech Republic. Available online: https://www.mzp.cz/C125750E003B698B/en/strategy_adaptation_climate_change/$FILE/OEOK_Adaptation_strategy_20171003.pdf (accessed on 30 December 2017).
  16. Ministry of Industry and Trade. Strategic Framework for Sustainable Development of the Czech Republic. Available online: https://www.mpo.cz/assets/dokumenty/41073/45840/553766/priloha001.pdf (accessed on 20 February 2018).
  17. Office of the Government of the Czech Republic, Department for Sustainable Development. Strategic framework Czech Republic 2030. Available online: https://www.cr2030.cz/wp-content/uploads/Strategický_rámec_ČR2030_komplet.zip (accessed on 20 August 2018).
  18. Zhang, Y.; Mc Kenzie, J.; Cormier, D.; Lyng, R.; Mabee, W.; Ogino, A.; MacLean, H.L. Life cycle emissions and cost of producing electricity from coal, natural gas, and wood pellets in Ontario, Canada. Environ. Sci. Technol. 2009, 44, 538–544. [Google Scholar] [CrossRef] [PubMed]
  19. Butt, E.W.; Rap, A.; Schmidt, A.; Scott, C.E.; Pringle, K.J.; Reddington, C.L.; Richards, N.A.D.; Woodhouse, M.T.; Ramirez-Villegas, J.; Yang, H.; et al. The impact of residential combustion emissions on atmospheric aerosol, human health, and climate. Atmos. Chem. Phys. 2016, 16, 873–905. [Google Scholar] [CrossRef] [Green Version]
  20. Mumford, J.L.; He, X.Z.; Chapman, R.S.; Harris, D.B.; Li, X.M.; Xian, Y.L.; Jiang, W.Z.; Xu, C.W.; Chuang, J.C. Lung cancer and indoor air pollution in Xuan Wei, China. Science 1987, 235, 217–221. [Google Scholar] [CrossRef]
  21. Finkelman, R.B.; Tian, L. The health impacts of coal use in China. Int. Geol. Rev. 2018, 60, 579–589. [Google Scholar] [CrossRef]
  22. Weldu, Y.W.; Assefa, G.; Jolliet, O. Life cycle human health and ecotoxicological impacts assessment of electricity production from wood biomass compared to coal fuel. Appl. Energy 2017, 187, 564–574. [Google Scholar] [CrossRef]
  23. Miehe, R.; Scheumann, R.; Jones, C.M.; Kammen, D.M.; Finkbeiner, M. Regional carbon footprints of households: A German case study. Environ. Dev. Sustain. 2016, 18, 577–591. [Google Scholar] [CrossRef]
  24. Chafe, Z.; Brauer, M.; Héroux, M.E.; Klimont, Z.; Lanki, T.; Salonen, R.O.; Smith, K.R. Residential Heating with Wood and Coal: Health Impacts and Policy Options in Europe and North America. 2015. Available online: http://www.euro.who.int/__data/assets/pdf_file/0009/271836/ResidentialHeatingWoodCoalHealthImpcts.pdf (accessed on 20 August 2018).
  25. Liu, Z.; Guan, D.; Wei, W.; Davis, S.J.; Ciais, P.; Bai, J.; Peng, S.; Zhang, Q.; Hubacek, K.; Marland, G.; et al. Reduced carbon emission estimates from fossil fuel combustion and cement production in China. Nature 2015, 524, 335–338. [Google Scholar] [CrossRef] [Green Version]
  26. Junninen, H.; Mønster, J.; Rey, M.; Cancelinha, J.; Douglas, K.; Duane, M.; Borowiak, A. Quantifying the impact of residential heating on the urban air quality in a typical European coal combustion region. Environ. Sci. Technol. 2009, 43, 7964–7970. [Google Scholar] [CrossRef]
  27. Walmsley, M.R.; Walmsley, T.G.; Matthews, L.; Atkins, M.J.; Neale, J.R.; Kamp, P.J. Pinch analysis techniques for carbon emissions reduction in the New Zealand industrial process heat sector. Chem. Eng. Trans. 2015, 45, 1087–1091. [Google Scholar] [CrossRef]
  28. Nussbaumer, T. Combustion and co-combustion of biomass: Fundamentals, technologies, and primary measures for emission reduction. Energy Fuel 2003, 17, 1510–1521. [Google Scholar] [CrossRef]
  29. Röder, M.; Whittaker, C.; Thornley, P. How certain are greenhouse gas reductions from bioenergy? Life cycle assessment and uncertainty analysis of wood pellet-to-electricity supply chains from forest residues. Biomass Bioenergy 2015, 79, 50–63. [Google Scholar] [CrossRef]
  30. AEBIOM European Biomass Association; Network, B.B.; US Industrial Pellet Association. Forest Sustainability and Carbon Balance of EU Importation of North American Forest Biomass for Bioenergy Production; BC Bioenergy Network: Vancouver, BC, Canada, 2013. [Google Scholar]
  31. Colnes, A.; Doshi, K.; Emick, H.; Evans, A.; Perschel, R.; Robards, T.; Saah, D.; Sherman, A. Biomass Supply and Carbon Accounting for Southeastern Forests; Biomass Energy Resource Center, Forest Guild, Spatial Informatics Group: Burlington, NJ, USA, 2012. [Google Scholar]
  32. Thakur, A.; Canter, C.E.; Kumar, A. Life-cycle energy and emission analysis of power generation from forest biomass. Appl. Energy 2014, 128, 246–253. [Google Scholar] [CrossRef]
  33. IPCC. Agriculture, Forestry and Other Land Use. Intergovernmental Panel on Climate Change, IPCC Guidelines for National Greenhouse Gas Inventories. 2006. Available online: http://www.ipcc-nggip.iges.or.jp/public/2006gl/vol4.html (accessed on 10 August 2019).
  34. Sedjo, R.A. Comparative life cycle assessments: Carbon neutrality and wood biomass energy. Resour. Future DP 2013, 11–13. [Google Scholar] [CrossRef]
  35. Cherubini, F.; Peters, G.P.; Berntsen, T.; Strømman, A.H.; Hertwich, E. CO2 emissions from biomass combustion for bioenergy: Atmospheric decay and contribution to global warming. Glob. Chang. Biol. Bioenergy 2011, 3, 413–426. [Google Scholar] [CrossRef]
  36. Nian, V. The carbon neutrality of electricity generation from woody biomass and coal, a critical comparative evaluation. Appl. Energy 2016, 179, 1069–1080. [Google Scholar] [CrossRef]
  37. Johnson, E. Goodbye to carbon neutral: Getting biomass footprints right. Environ. Impact Assess. Rev. 2009, 29, 165–168. [Google Scholar] [CrossRef]
  38. Olivier, J.G.J.; Janssens-Maenhout, G.; Muntean, M.; Peters, J.A.H.W. Trends in Global CO2 Emissions; 2016 Report; Netherlands Environmental Assessment Agency: Hague, The Netherlands, 2016. [Google Scholar]
  39. International Energy Agency. CO2 Emissions from Fuel Combustion; IEA: Paris, France, 2017. [Google Scholar]
  40. Heinimö, J.; Junginger, M. Production and trading of biomass for energy—An overview of the global status. Biomass Bioenergy 2009, 33, 1310–1320. [Google Scholar] [CrossRef]
  41. Proskurina, S.; Junginger, M.; Heinimö, J.; Tekinel, B.; Vakkilainen, E. Global biomass trade for energy—Part 2: Production and trade streams of wood pellets, liquid biofuels, charcoal, industrial roundwood and emerging energy biomass. Biofuels Bioprod. Biorefin. 2019, 13, 371–387. [Google Scholar] [CrossRef]
  42. Yu, S.; Wei, Y.M.; Guo, H.; Ding, L. Carbon emission coefficient measurement of the coal-to-power energy chain in China. Appl. Energy 2014, 114, 290–300. [Google Scholar] [CrossRef]
  43. Odeh, N.A.; Cockerill, T.T. Life cycle analysis of UK coal fired power plants. Energy Convers. Manag. 2008, 49, 212–220. [Google Scholar] [CrossRef]
  44. Hondo, H. Life cycle GHG emission analysis of power generation systems: Japanese case. Energy 2005, 30, 2042–2056. [Google Scholar] [CrossRef]
  45. Schreiber, A.; Zapp, P.; Kuckshinrichs, W. Environmental assessment of German electricity generation from coal-fired power plants with amine-based carbon capture. Int. J. Life Cycle Assess. 2009, 14, 547–559. [Google Scholar] [CrossRef]
  46. Morrison, B.; Golden, J.S. Life cycle assessment of co-firing coal and wood pellets in the Southeastern United States. J. Clean. Prod. 2017, 150, 188–196. [Google Scholar] [CrossRef] [Green Version]
  47. Sterman, J.; Siegel, L.; Rooney-Varga, J. Does replacing coal with wood lower CO2 emissions? Dynamic lifecycle analysis of wood bioenergy. Environ. Res. Lett. 2018, 13. [Google Scholar] [CrossRef]
  48. Millet, D.; Bistagnino, L.; Lanzavecchia, C.; Camous, R.; Poldma, T. Does the potential of the use of LCA match the design team needs? J. Clean. Prod. 2007, 335–346. [Google Scholar] [CrossRef]
  49. Tarantini, M.; Loprieno, A.D.; Cucchi, E.; Frenquellucci, F. Life Cycle Assessment of waste management systems in Italian industrial areas: Case study of 1st Macrolotto of Prato. Energy 2009, 613–622. [Google Scholar] [CrossRef]
  50. Ng, C.Y.; Chuah, K.B. Evaluation of Eco design alternatives by integrating AHP and TOPSIS methodology under a fuzzy environment. Int. J. Manag. Sci. Eng. Manag. 2012, 7, 43–52. [Google Scholar] [CrossRef]
  51. Omar, W.M.S.; Doh, J.H.; Panuwatwanich, K. Variations in embodied energy and carbon emission intensities of construction materials. Environ. Impact Assess. 2014, 49, 31–48. [Google Scholar] [CrossRef] [Green Version]
  52. Periodická Tabulka. Hustota Pevných Látek. Available online: http://www.prvky.com/hustota.html (accessed on 20 February 2018).
  53. TZB Info. Calorific Value and Measurement Units of Firewood. 2016. Available online: http://www.tzb-info.cz/tabulky-a-vypocty/12-vyhrevnosti-a-merne-jednotky-palivoveho-dreva (accessed on 23 August 2018).
  54. TZB Info. Calorific Value of Fuels. 2017. Available online: http://vytapeni.tzb-info.cz/tabulky-a-vypocty/11-vyhrevnosti-paliv (accessed on 29 August 2018).
  55. Tatra. Technical Data of Individual Versions. Available online: http://tatratech.wz.cz/prospekty/t815-2/260s43.html (accessed on 25 August 2018).
  56. Švik, P. Nákladní Doprava. Available online: http://www.petrsvik.cz/autodoprava.htm (accessed on 29 August 2018).
  57. Tatra. Technical Data. Available online: http://tatratech.wz.cz/prospekty/t815/t815s3.html (accessed on 13 December 2017).
  58. Ekoblog.cz. Technologie a Životní Prostředí. 2017. Available online: http://www.ekoblog.cz/?q=emise (accessed on 20 February 2018).
  59. Zeman, J. Specific Energy Intensity of Individual Modes of Transport in the Czech Republic. (In Czech: Měrná Energetická Náročnost Jednotlivých Druhů Dopravy v ČR). Ekolist. Available online: https://ekolist.cz/cz/publicistika/nazory-a-komentare/merna-energeticka-narocnost-jednotlivych-druhu-dopravy-v-cr (accessed on 28 August 2019).
  60. Doležel, J. Calculation of Carbon Dioxide (CO2) Savings (in Czech: Výpočet Úspor Emisí Oxidu Uhličitého (CO2)) Ministry of Industry and Trade ČR. Available online: https://www.mpo.cz/dokument6794.html (accessed on 28 August 2019).
  61. UMBERTO Software. Ver. 5.5. Hamburg 2009. Advanced Tool for Material and Energy Flow Management. For Windows XP or Higher. Available online: https://www.ifu.com/umberto/ (accessed on 28 August 2019).
  62. Doly Bílina. Bílinské Uhlí z SD a.s. Doly Bílina—Ledvícké Uhlí. Available online: http://www.bilinske-uhli.cz (accessed on 7 September 2017).
  63. Biom. Alternativní Energetické Zdroje a Měrné Emise CO2. Available online: https://biom.cz/cz/odborne-clanky/alternativni-energeticke-zdroje-a-merne-emise-co2 (accessed on 12 January 2018).
  64. Dřevoprodukt. Measurement of Firewood. Available online: http://www.drevoprodukt.cz/upload/mereni_paliv_drivi.pdf (accessed on 12 January 2018).
  65. Wang, C.; Chang, Y.; Zhang, L.; Pang, M.; Hao, Y. A life-cycle comparison of the energy, environmental and economic impacts of coal versus wood pellets for generating heat in China. Energy 2017, 374–384. [Google Scholar] [CrossRef]
Figure 1. Illustration of process of the total CO2 emission evaluation for transport and combustion together. Source: own processing.
Energies 12 03864 g001
Figure 2. The result of the function describing the consumption of Tatra T815 S3, depending on the weight of the load. Source: own processing.
Energies 12 03864 g002
Figure 3. Total CO2 emissions of associated processes of selected fuels and related break points. Source: own processing.
Energies 12 03864 g003
Table 1. Wood types and characteristics.
Wood TypeMoisture [%]Calorific Value [MJ/kg]
Deciduous wood (oak, beech 50/50%)1514.605
Coniferous wood (spruce, pine 50/50%)1515.584
Logs (spruce, pine 50/50%)2014.28
Logs (spruce, pine 50/50%)3012.18
Wood chips (oak, beech, spruce, pine each 25%)1016.4
Wood chips (oak, beech, spruce, pine each 25%)2014.28
Wood chips (oak, beech, spruce, pine)3012.18
Source: own processing according to [54].
Table 2. Technical specifications of selected vehicle.
Type of VehicleT-815 S3 6 × 6
Curb weight11,300 kg
Payload10,700 kg
Total vehicle weight22,000 kg
Engine typeT-3−929 −11
Engine displacement15,825 cm3
Highest engine power280/2200 kW/Nm
Basic fuel consumption 32.5/63l/100 km
Volume of the hull8 m3
Source: [55,56,57].
Table 3. Outputs, energy consumption and number of ton-kilometers (tkm) per 1 TJ of energy consumed by transport type.
Outputs, Corrected Energy Consumption, and Number of Ton-Kilometers (tkm) per 1 TJ of Energy Consumed in the Czech Republic in 2004.
Type of transportTransport volume (106 tkm)Energy consumption (TJ)Number of tkm/TJ
Truck transport46,01058,116791,693
Railway motor transport16902272743,908
Railway electric transport13,04027614,723,200
Shipping4101283,203,125
Source: [59].
Table 4. Bulk density of the fuel.
Type of FuelBulk Density of Fuel ρw [kg/m3]
Wood238.62
Brown coal1100–1500
Source: own processing from [52].
Table 5. Summary table.
FuelWeight of Load Carried by 1 Ride (mw,c) [kg]CO2 Emissions from Combustion of Fuel by Weight According to Column 2 (Sc (Sw = 0)) [t]Corresponding Consumption of Fuel with the Load According to the Column 2 (y) [L/100 km]
Without load0032.5
Wood1909037.94
Brown coal10,40019.10862.14
Source: own processing.
Table 6. Specific consumption of l/100 km and specific CO2 emissions.
Specific Consumption of L/100 km (y)Specific CO2 Emissions (St) [g/km]
32.5871.975
37.941017.9302
50.741361.3542
62.141667.2162
Source: own processing.
Table 7. Transported energy and number of rides for selected fuels.
FuelTransported Energy on a Fully Loaded T815 (Ew1l) [MJ], Train and ShipNumber of Trips (Nt(w,c))
Wood (w)27.1656.738
Brown coal (cc)183.0401
Brown coal (ct)183.040x
Brown coal (cs)183.040x
Source: own processing.