


Abstract
The reduction of emissions from deforestation and forest degradation (REDD) constitutes part of the international climate agreements and contributes to the Sustainable Development Goals. This research is motivated by the risks associated with the future CO2 price uncertainty in the context of the offsetting of carbon emissions by regulated entities. The research asked whether it is possible to reduce these financial risks. In this study, we consider the bilateral interaction of a REDD supplier and a greenhouse gas (GHG)-emitting energy producer in an incomplete emission offsets market. Within this setting, we explore an innovative financial instrument—flobsion—a flexible option with benefit-sharing. For the quantitative assessment, we used a research method based on a two-stage stochastic technological portfolio optimization model established in earlier studies. First, we obtain an important result that the availability of REDD offsets does not increase the optimal emissions of the electricity producer under any future CO2 price realization. Moreover, addressing concerns about a possible “crowding–out” effect of REDD-based offsets, we demonstrate that the emissions and offsetting cost will decrease and increase, respectively. Second, we demonstrate the flexibility of the proposed instrument by analyzing flobsion contracts with respect to the benefit-sharing ratio and strike price within the risk-adjusted supply and demand framework. Finally, we perform a sensitivity analysis with respect to CO2 price distributions and the opportunity costs of the forest owner supplying REDD offsets. Our results show that flobsion’s flexibility has advantages compared to a standard option, which can help GHG-emitting energy producers with managing their compliance risks, while at the same time facilitating the development of REDD programs. In this study we limited our analysis to the case of the same CO2 price distributions foreseen by both parties; the flobsion pricing under asymmetric information could be considered in the future.
1. Introduction
The 2015 Paris Climate Agreement encourages implementation and support of activities related to the reduction of emissions from deforestation and forest degradation (REDD+) [1], a climate change mitigation strategy based on the idea to reward countries for reducing their deforestation and forest degradation through financial benefits generated by carbon credits. However, the implementation of REDD+ is a complex international problem [2,3,4] despite it is considered as a relatively low-cost mitigation option [5,6], and its integration into the global mitigation strategy has the potential for larger emissions reductions to be made [7]. This integration can be done by linking REDD as an emission reduction credit program to major cap-and-trade programs [8]. In this context, credits that could be supplied by REDD projects are an attractive mitigation option; a range of literature is devoted to that topic, for example, References [9,10,11].
REDD principles, as part of the SDG 15 are contributing directly to the Sustainable Development Goals (SDG) [12]. However, there is an ongoing discussion related to uncertainties and risks in REDD implementation [13,14,15]. A substantial problem for a potential REDD investor is the missing legal background [16], which may mean that the future acceptance of emission credits generated by REDD projects (to be funded today) is not guaranteed. This uncertainty regarding acceptance and related conditions creates unacceptable risks for those potentially interested in funding/investing in REDD projects (e.g., energy companies in potential need for offsetting their emissions). To overcome this problem, establishment of the intermediaries such as the REDD Acceleration Fund [17] was recently suggested, along with approaches based on optionality in purchasing REDD-based offsets [10]. There are promising pioneering steps being made in California, heading towards a law on REDD acceptance for compliance purposes. The state of California has a placeholder in the suggested California Tropical Forest Standard allowing international credits of up to 2% of an entity’s annual compliance obligation; however, it has not yet issued a detailed standard or introduced regulations to operationalize REDD application [18].
Accepting existing uncertainties, we explore bilateral interaction between a REDD supplier and a greenhouse gas (GHG)-emitting energy producer in the context of an incomplete REDD offsets market. We develop the FI-REDD model established in a series of publications [19,20]. FI-REDD is a two-stage stochastic technological portfolio optimization model describing an interaction between the REDD-offsets supplier, electricity producer and consumers. In this study, in order to contract REDD offsets in the model, we employ a novel financial instrument—a flexible option with a benefit-sharing mechanism called “flobsion” [21]. This instrument is different from the REDD offset contracts modeled in previous studies. In essence, a flobsion complements an option with a benefit-sharing mechanism. While the general idea of benefit-sharing is important within the REDD context [22], in our approach benefit-sharing stands for possible sharing of the profits stemming from flobsions. The FI-REDD model with exponential utility functions [23] allows the risk-averse behavior to be combined with benefit-sharing so that their impact on contracted amounts of flobsions can be analyzed.
Another modification consists of expanding the FI-REDD model by introducing the opportunity costs of the forest owner. Opportunity cost is the economic benefit forgone from the alternative land/forest use [24]. It sets a minimum amount to be paid to keep the land in forest. Thus, opportunity cost forms the basis for economic analyses of REDD [25]. In our model, the REDD supplier takes into account the opportunity cost curve, when making the decision about supplying REDD offsets.
The key driver of this research is the high uncertainty in future prices and associated risks in the context of REDD offsetting. The research question is about the possible reduction of these risks using flobsion [21] and comparison of flobsion with the standard option in the REDD context. The elaboration of this instrument is an important step in the field of modeling financial instruments supporting REDD programs [6,10].
The structure of the paper is as follows. First, we analytically investigate the construction of flobsion in FI-REDD model. This allows the important result to be demonstrated, namely, that energy producers would not increase their emissions if they had acquired flobsions. Second, we present modeling results and sensitivity analysis with respect to price distributions and opportunity costs. Finally, we discuss analytical and numerical results, as well as policy implications and possible future research directions.
2. Methodology
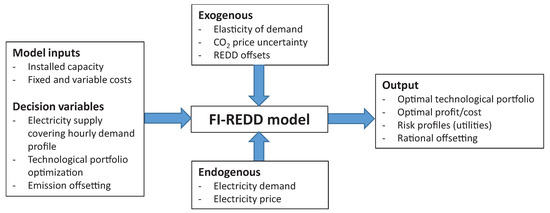
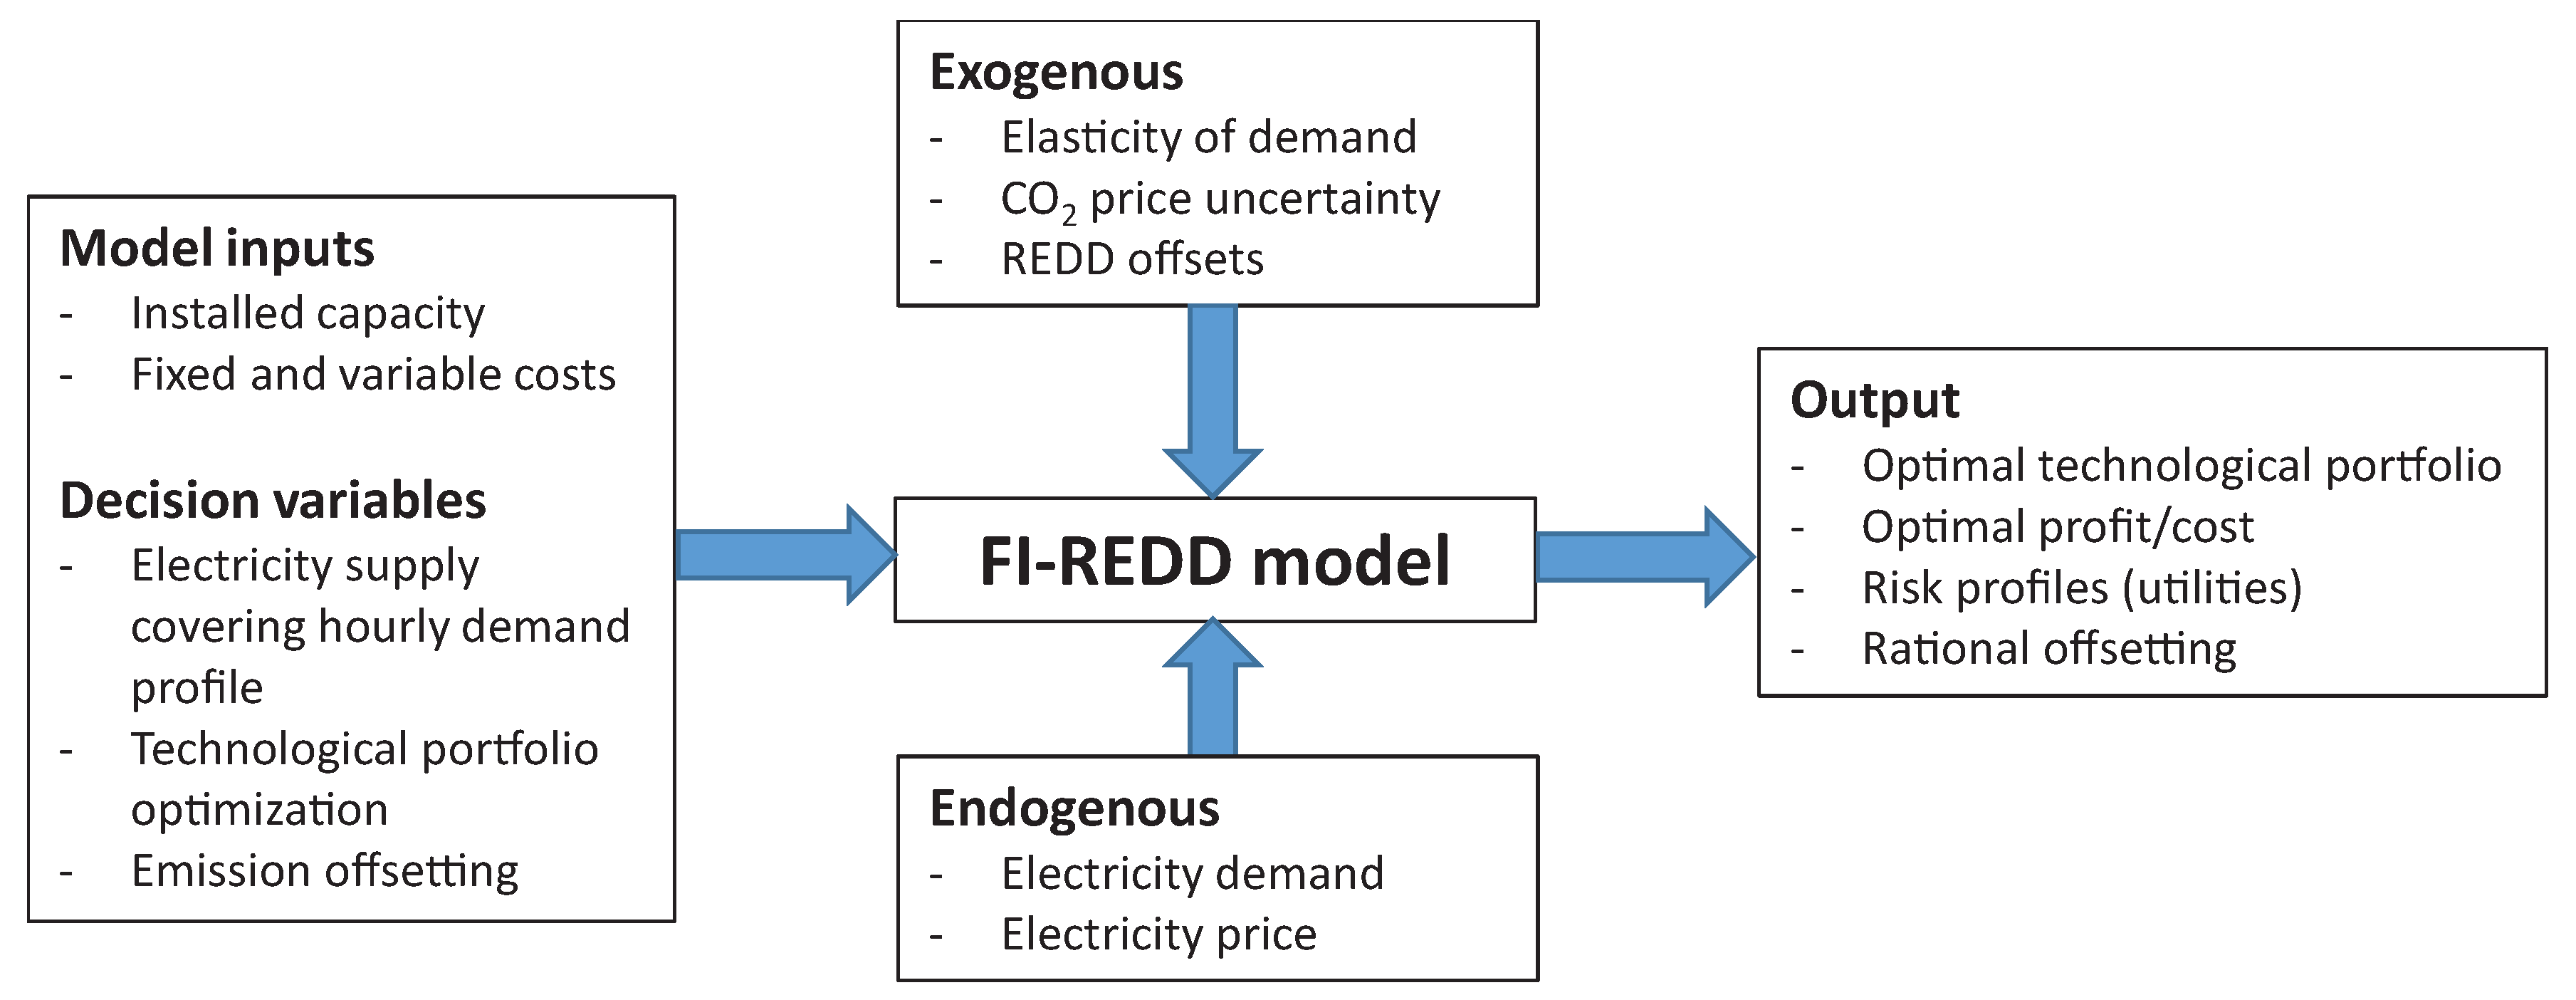
In this paper we further develop the FI-REDD model established in our previous work [19,20]. The model takes into account the potential market power of energy producers, which gives them flexibility in their decision-making under uncertain emission costs. The scheme of the model is shown in Figure 1. The model deals with optimization of the technological mix under market power, related to optimal scheduling of power systems [26] and market pricing in the power industry [27]. We propose an idea for setting a fair price of the REDD offsets, based on the indifference principle in two-stage problem setting. Utility-indifference pricing is a well-established approach to the valuation of derivative securities in incomplete markets [28]. The indifference price is defined as the price of the derivative toward which the investor is indifferent whether to use the derivative to maximize their expected utility or not to use it [29]. We use fair prices to evaluate REDD offsets [19] under future price uncertainty. In the first stage (period), where details about the future REDD offsets market are uncertain, the parties (supplier and consumer of REDD offsets) assign their offset prices (buying and selling) in such a way that their profits or, generally, their utilities, stay the same in the second period (in which the REDD offsets price is revealed) no matter whether they have contracted REDD offsets in the first period or not.
Figure 1.
Scheme of the FI-REDD model.
We implement flobsion as the REDD offset in the model. Flobsion complements the standard option with a benefit-sharing mechanism. Methodologically, the idea is close to revenue-sharing contracts in supply chain coordination, under which a supplier receives a percentage of revenue generated by retailer [30]. Here we specifically consider a situation where benefits are shared between the REDD supplier and consumer. Therefore, we prefer the term “benefit-sharing” to distinguish our study from “revenue-sharing” in supply chain coordination, for example, Reference [31].
In this study we also advance the decision-making of the forest owner by implementing an opportunity costs curve in the model. Opportunity costs are foregone economic benefits from forest-uses, which are alternative to REDD. These include social-cultural costs and indirect costs [24]. In this study we use non-linearly increasing opportunity cost with respect to the amount of offsets supplied. We also perform sensitivity analysis with respect to the opportunity costs.
In summary, our methodology combines the following approaches:
- Two-period technological portfolio optimization
- Exponential risk-preferences
- Utility-indifference pricing
- Optionality of purchasing emission offsets
- Benefit-sharing mechanism
In this section we provide the theoretical framework accompanied by some analytical results. In particular, we derive formulas for indifference prices, which form the basis of our analysis. These will allow us to construct the risk-adjusted fair prices of a seller and a buyer of REDD flobsions for all admissible benefit-sharing ratios and strike prices. The prices will, in turn, help in identifying the amounts and prices of contracted flobsions.
2.1. Decision-Making of the Electricity Producer
We consider two optimization problems of the electricity producer in the “second” period, which is when REDD offsets are traded on a market (as opposed to the “first” period when there is no such market). The first optimization problem is decision-making under the realized price without REDD offsets, that is, flobsions in this study. The electricity producer can modify its technological mix to reduce emissions or raise the electricity price, thus making the consumer bear some of the costs [19]. The second problem is complemented by REDD-offsets flobsions. The electricity producer can use flobsions either to offset emissions or to sell on the market at the price. In the latter case, the income from selling REDD offsets should be shared with the forest owner. The use of the flobsion also depends on the level of the strike price compared to the price. Let us start with the first problem.
2.1.1. Optimization without Flobsions
For every price realization, , the electricity producer chooses technological mix, x, to maximize its profit :
where —technological mix, X—feasibility domain (all admissible technological portfolios), — price realization, —profit component without emission cost and E—emissions corresponding to technological mix x. In the problem formulation: profit is the objective function, technological mix is the control variable and emission prices are exogenous variables.
Let us denote optimal technological mix by and corresponding profit and emissions as
The solution of the problem (1) delivers an optimal response of the electricity producer in terms of profits and emissions to prices.
2.1.2. Definition of Flobsion
A common “call” option for an asset (e.g., for an emission offset) or simply an option, implies that a buyer pays an amount p to the seller of the option for the future possibility of purchasing the asset at an agreed “strike” price . The owner of the option decides in the future whether to make such a purchase or not, so that for them it is a possibility but not an obligation.
A flobsion is a generalized form of option. A buyer pays the amount to the seller of a flobsion for the future possibility of purchasing the asset at the agreed “strike” price plus the discounted difference between the asset’s market price and , if that difference is positive (or just otherwise). If the flobsion holder decides to purchase an asset within the period of validity of a flobsion, they would pay the amount:
meaning that an asset is being purchased at a market price and the flobsion is not being executed if , where is a discount to the market price using as a base. In the case of a flobsion, a future asset purchase is still optional for the buyer as in the case of a standard option. The price for the future purchase of an asset in the case of a flobsion, though not fixed, is still tied to the market price. For , meaning a 100% discount to the market price (retaining the strike price), a flobsion turns into an option.
2.1.3. Optimization with Flobsions
Let us consider the profit of the electricity producer with flobsion at a price realization in the second period:
where is the volume of offsets covered by flobsions and contracted in the first period, —maximum amount of flobsions supplied by forest owner, —benefit-sharing ratio, —flobsion strike price, —the price the electricity producer pays for flobsion in the first period, and
Equation (5) can be interpreted as follows. When the price realization is lower than the strike price, the electricity producer does not use flobsion. In the case where the price realization exceeds the strike price, the electricity producer pays the price for flobsions to the forest owner and also shares their profit from the price difference (between the price and the strike price) with the forest owner. The sharing is determined by ratio , such that the electricity producer gets a share of and share goes to the forest owner. Moreover, the electricity producer has two options: either to emit more than the amount contracted through flobsions and pay the price for the non-offset emissions or to emit less than the amount contracted through flobsions and sell the unused offsets on the market at respective price. Additionally the price is paid to the forest owner for flobsions in the first period, that is, that is the sunk cost.
Let us expand Equation (5) for the case with respect to emissions in the second period.
Case 1. If , then
Case 2. If , then
Equations (7) and (8) are the same, showing the equivalence between offsetting emissions and selling offsets on the market for price . We can simplify Equation (5) as follows:
Let us formulate the optimization problem with REDD flobsions in the second period.
Given the flobsion strike price , benefit-sharing ratio , amount of REDD offsets contracted in the first period at price , the electricity producer maximizes their profit at every price realization :
where is defined in Equation (9). Let us denote optimal technological mix by and corresponding profit by .
Lemma 1.
Proof.
Corollary 1.
Optimal profit with REDD flobsions, , at every price realization is calculated as follows:
Corollary 2.
Optimal emissions in the problem with REDD flobsions are the same as in the problem without REDD flobsions:
Remark 1.
Corollary 2 shows that the optimal emissions of the electricity producer with REDD flobsion stay the same as in the case without REDD flobsion. This indicates that there is no risk that energy producers will change their production and emit more as compared to the case without offsets. This is explained by the fact that offsets can be sold at the market price and that this opportunity is the highest profit, the energy producers can get from the offsets they possess.
2.2. Decision-Making of the Forest Owner
We consider a forest owner, who decided to allocate part of their forest to REDD+ offsets and who assesses the value of the forest covering the offsets in amount , where is the maximum available volume. There are two possibilities in the second period: the forest owner meets the price either without participating in REDD or with an obligation corresponding to flobsions sold to the electricity producer.
Forest owner’s profit without selling flobsions in the first period is calculated as follows:
where is opportunity cost associated with forest values alternative to REDD+. If the forest owner did not engage in contracting flobsions in the first period, they still can sell the amount in the second period at the market price or can take advantage of other opportunities (e.g., selling wood), whichever delivers a greater profit.
When forest owner engages in contracting flobsion in the first period, their profit at price realization in the second period is calculated the following way:
where is the price paid to the forest owner for flobsions in the first period by the electricity producer. When price realization is below strike price , the forest owner has the income from selling flobsions in the first period, . Moreover, as the electricity producer does not exercise flobsions in this case, the forest owner decides whether to sell that amount of flobsions on the market by comparing market price with opportunity cost. When price realization is higher than the strike price, the first term in Equation (13), the case , stands for the income from selling the flobsion in the first period and the second term is the profit coming from the electricity producer (cf. Equation (9)) including the strike price and shared benefits with parameter .
Let us note that we consider deterministic opportunity costs of the forest owner. This is based on the assumption that forest value is rather stable over time as compared to the offsets price.
2.3. Indifference Prices of the Forest Owner and Electricity Producer
To calculate indifference prices, we consider discrete distribution of prices with probabilities , , corresponding to price realizations , where N is the number of realizations and assume the growing sequence . Let us consider expected utilities of the electricity producer and without and with flobsion, respectively. Now we consider prices and as unknowns and find them from indifference equations. The fair price of the electricity producer is determined by the utility-indifference equation:
meaning that the expected utility stays the same, no matter if the electricity producer contracts flobsions in the first period or not. Where is the solution to problem without flobsions (1) and —with flobsions (10) at i-th price realization.
Similarly, if we denote utilities of the forest owner by and , then their fair price is determined by equity:
where and are profits (12) and (13), respectively, at i-th price realization.
Indifference prices can be derived numerically for any distribution and utility. However, analytical derivation is not always possible [19]. Below we consider risk-neutral and exponential utilities, which allow for analytical derivation and modeling risk-preferences. When the indifference curves are constructed for a range of flobsions’ amounts, we can check whether the amount can be contracted by comparing the prices of the electricity producer and forest owner. Namely, the amount can be contracted if the buyer’s price is not less than the seller’s price: .
2.3.1. Risk-Neutral Utilities
In the case of risk-neutral (r.-n.) utilities the indifference prices are calculated according to equations (see Appendix A.1):
where is the largest number when . In this case the price of the electricity producer does not depend on the flobsions’ amount. The price of the forest owner depends on the quantity only via the opportunity cost .
Lemma 2.
In the risk-neutral case for , the volume of flobsions can be contracted if the following inequality holds:
Proof.
Let us calculate the difference between (14) and (15), when :
Therefore, Equation (16) guarantees that seller’s price exceeds buyer’s price for amount , that is, . □
Remark 2.
Lemma 2 shows that in the risk neutral case, whether the amount of flobsions is contracted or not, depends on the relationship between the opportunity costs of the forest owner and the price distribution above the strike price and it is independent of the benefit-sharing ratio δ.
2.3.2. Exponential Utilities
In the case of exponential utilities (risk preferences, r.-p.) the indifference prices are calculated according to equations (see Appendix A.2):
where is the parameter of risk preferences [23]. When the risk-adjusted prices converge to the risk-neutral ones.
3. Modeling Results
In this section we present modeling results making use of the methodology described above. We employ the FI-REDD model calibrated in previous studies. Basically, to calculate the indifference prices, we need information only about optimal profits of the electricity producer (see Corollary 1). In the example we take the following distribution:
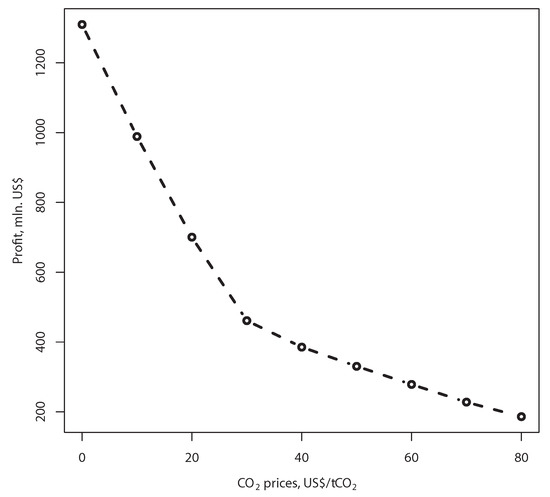
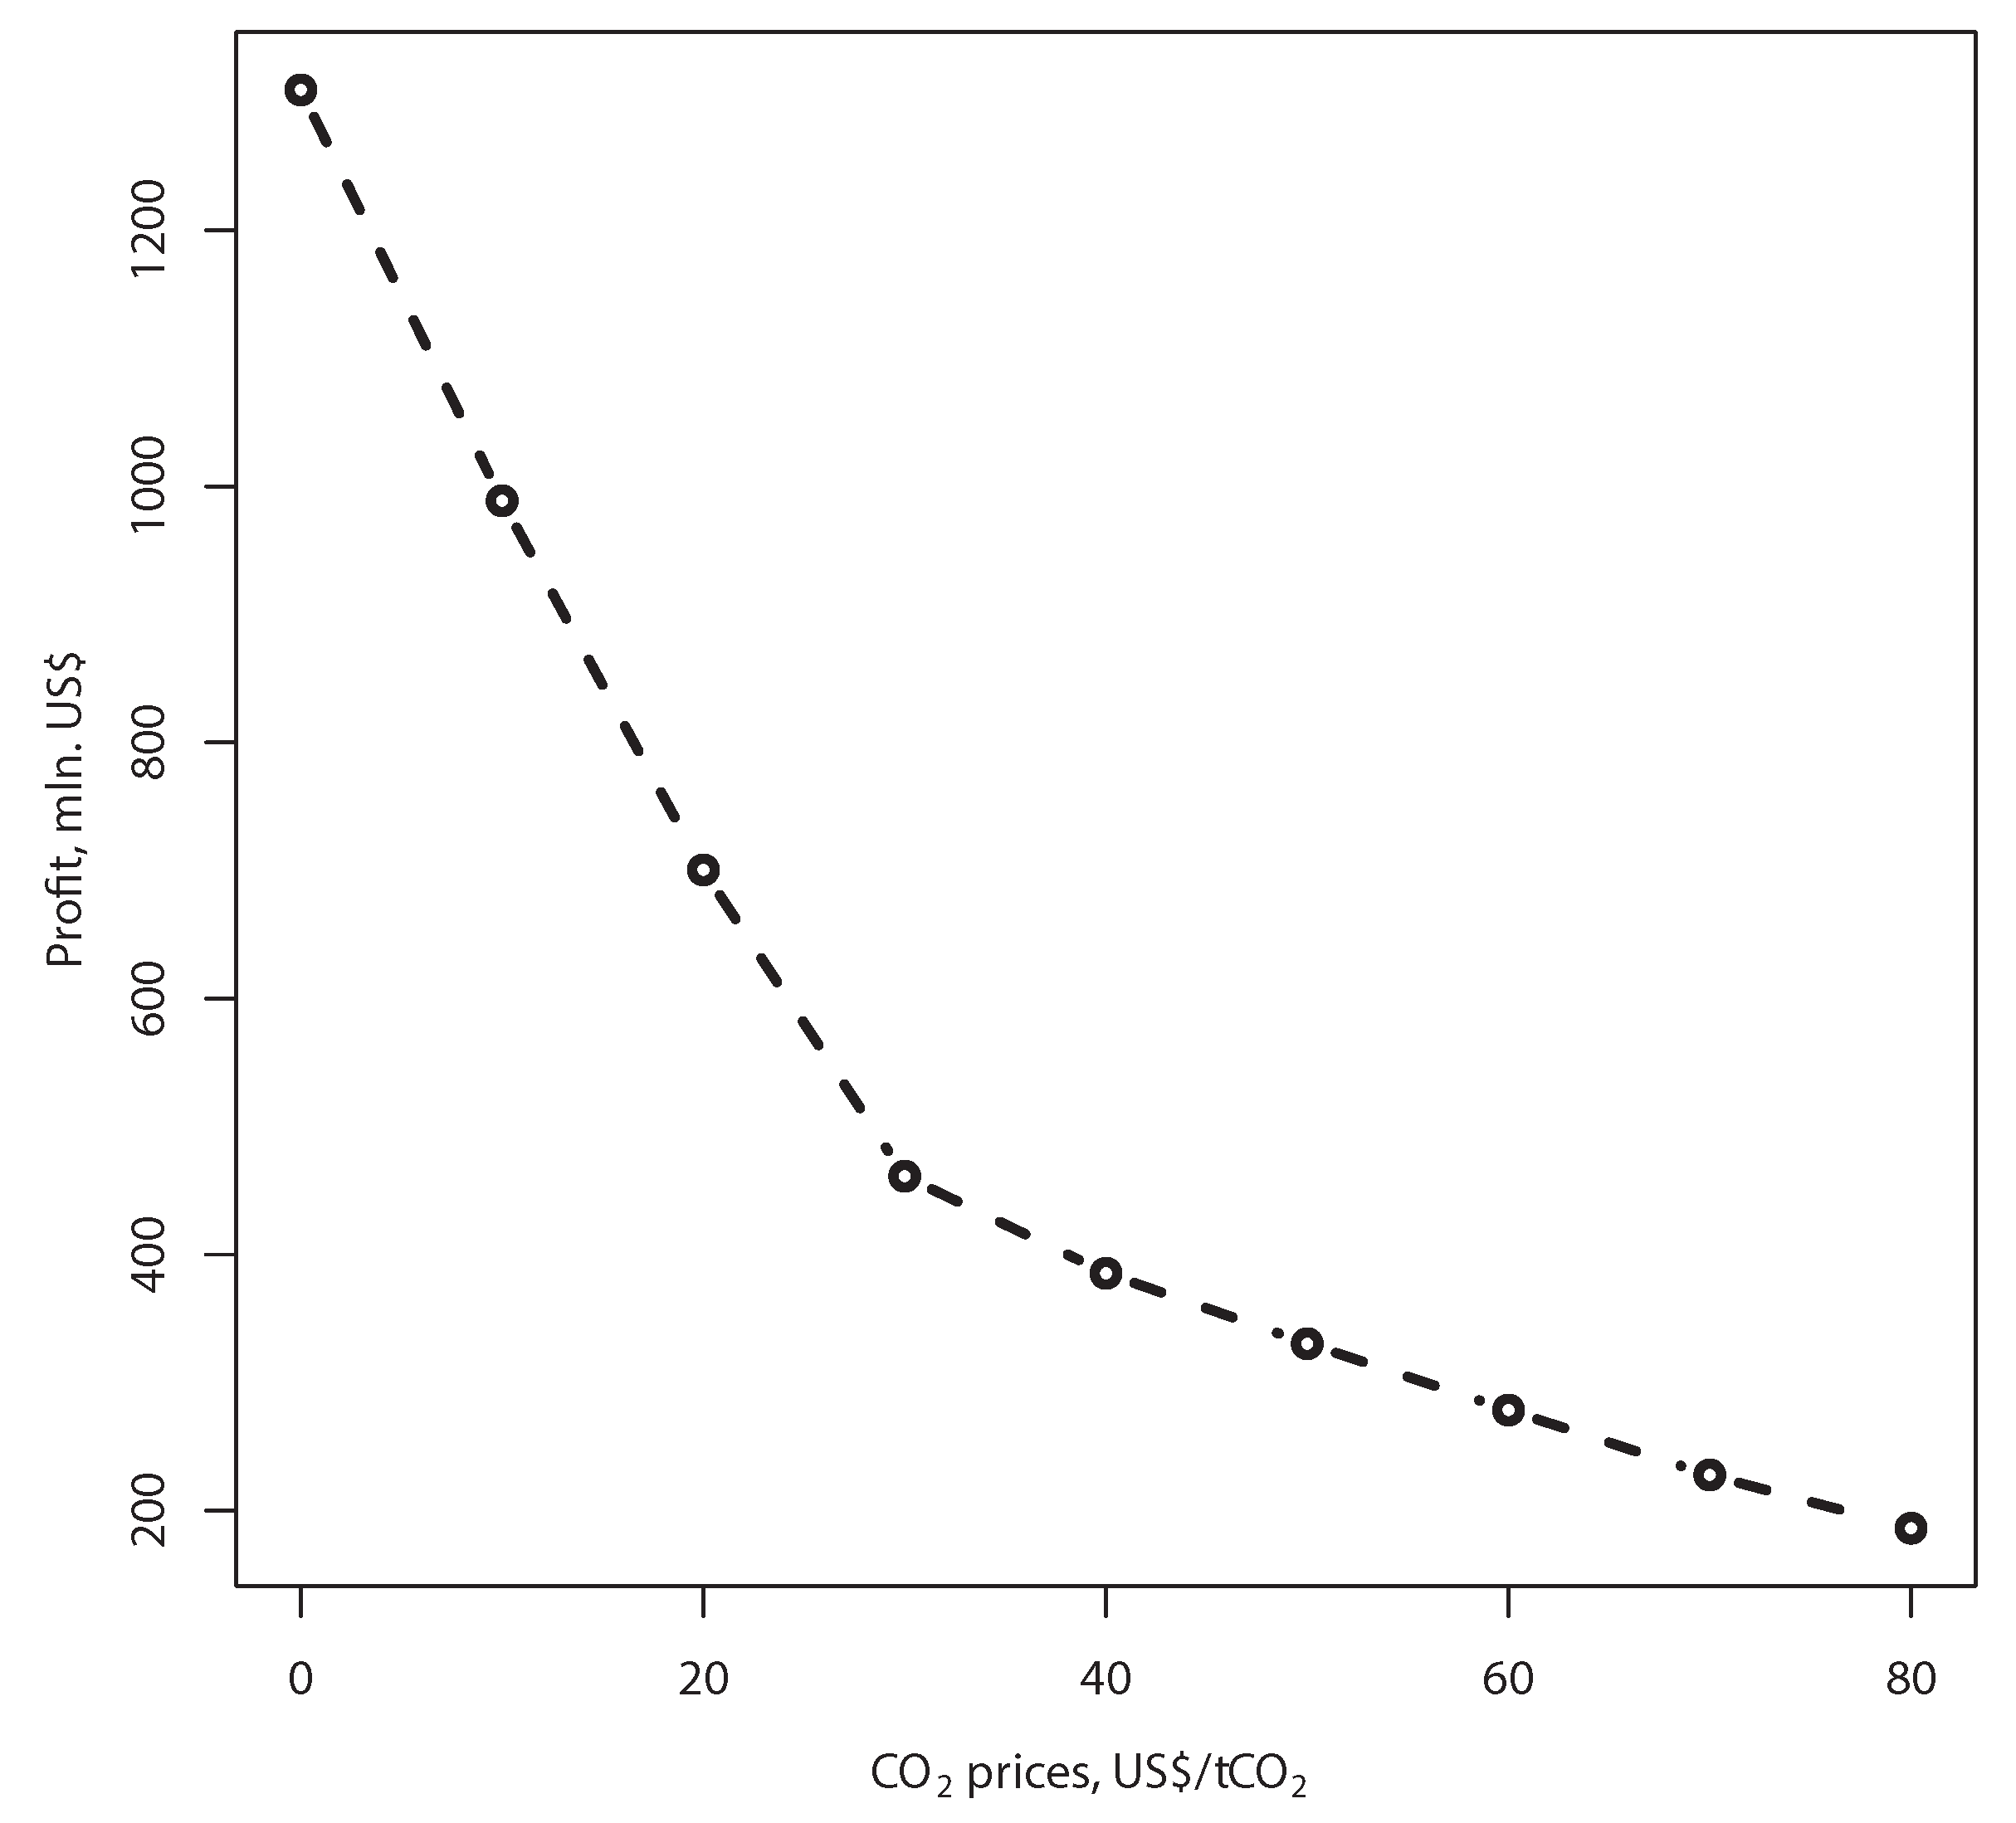
where price varies from 0 US$/ to 80 US$/ with the step 10 US$/. Here we consider the uniform distribution, that is, each price realization has the same probability equal to . Profits of the electricity producer at each price realization are shown in Figure 2.
Figure 2.
Annual profit of the electricity producer in the FI-REDD model with respect to growing price, adapted from Reference [19].
In our experiments we vary offsets’ amount in the range from 1 to 100 . For the forest owner we assume the following opportunity cost function:
where is measured in tons of and K is a scaling coefficient. Opportunity costs increase with the amount of flobsions, equivalent to the forest area allocated for offsets. The more forest is allocated to flobsion, the higher is the opportunity cost. We choose the price range consistent with the price distribution. Below we consider the case, , when opportunity cost varies between 0 US$/ (for zero offsets) and 81 US$/ (for 100 ). This range is consistent with some empirical studies (e.g., Reference [32]).
3.1. Impacts of Risk-Aversion on Contracted Amounts and Equilibrium Prices
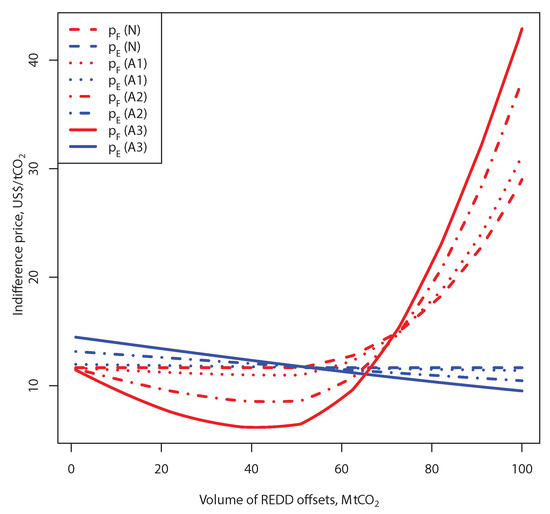
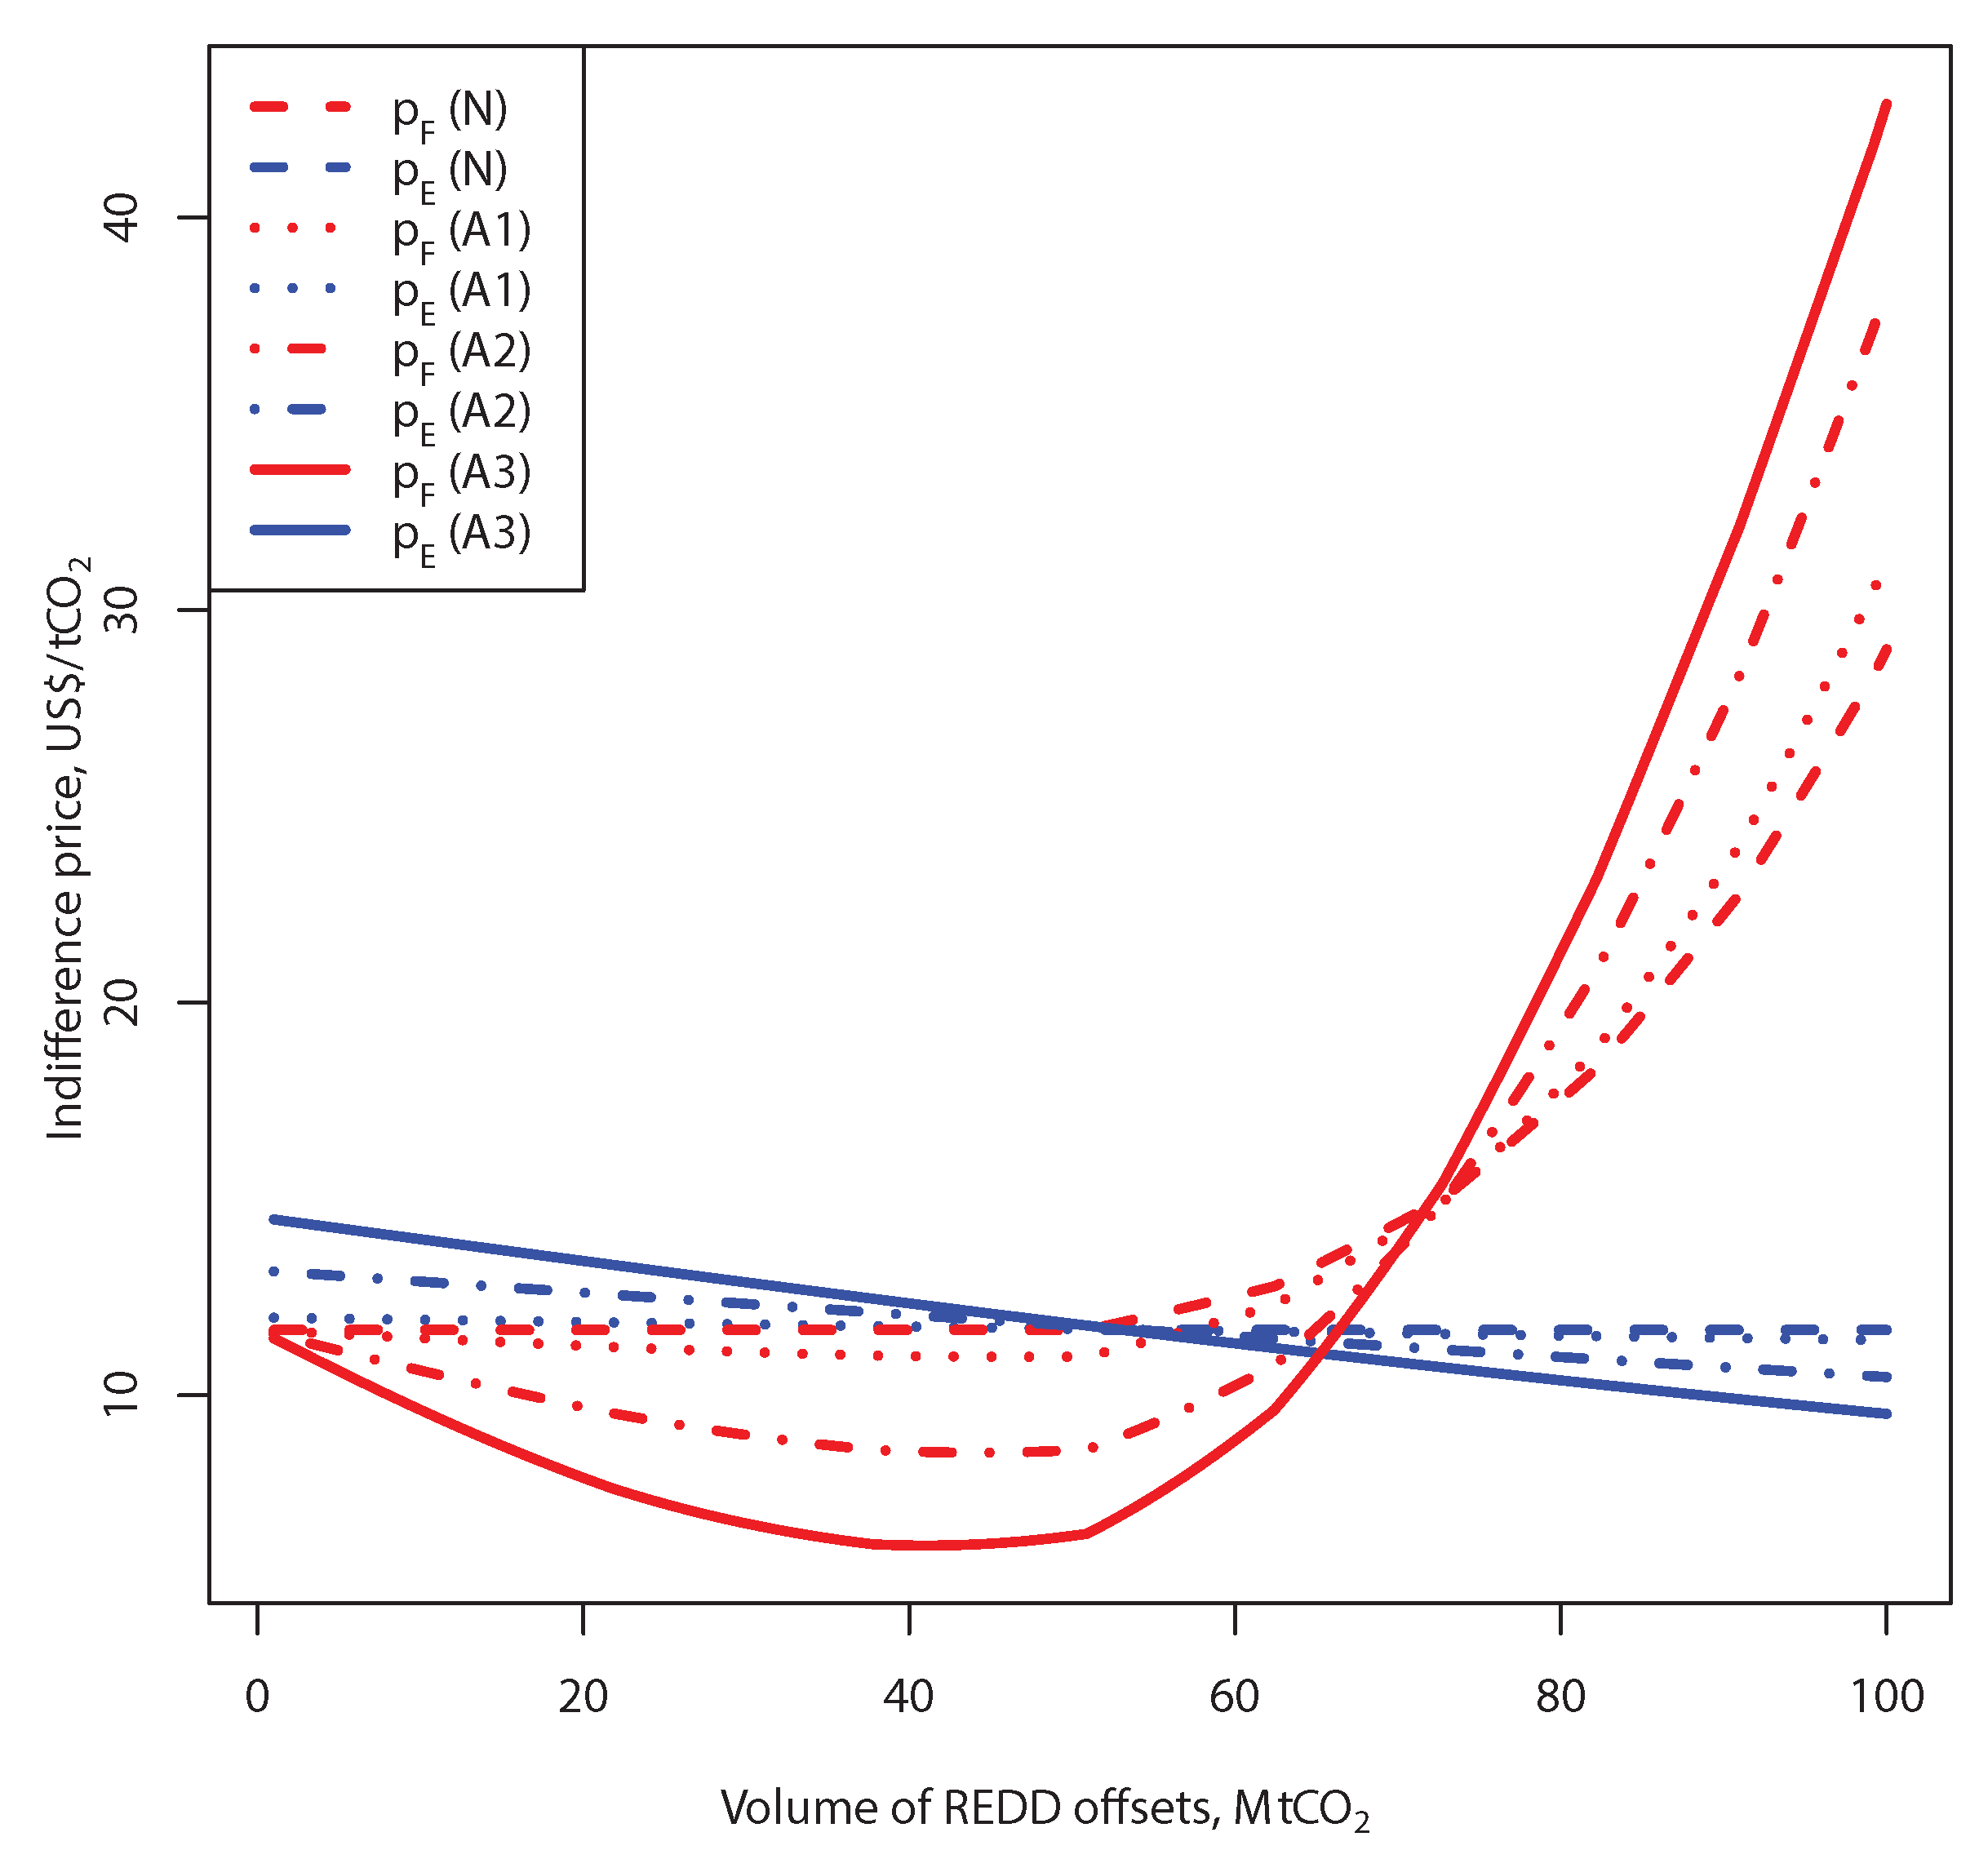
In our experiments we compare risk-neutral case with risk-averse cases. In Figure 3 we show risk-neutral indifference curves (dashed) lines based on Equations (14) and (15) and risk-averse (solid curves) based on Equations (17) and (18), corresponding to coefficient for the strike price US$/ and benefit-sharing ratio . We also show curves for two intermediate values of the risk-preference parameter and .
Figure 3.
Indifference prices in the FI-REDD model with flobsions. Comparison of risk-neutral case (N) with risk-averse cases: A1, A2 and A3, for benefit-sharing parameter , strike price US$/, distribution (19) and opportunity cost (20) with . Blue curves correspond to indifference prices of the electricity producer and red curves of the forest owner.
In the study we use the following notations for the cases with considered risk-preferences:
- N—risk-neutral ();
- A1—risk-aversion parameter ;
- A2—risk-aversion parameter ;
- A3—risk-aversion parameter .
Blue curves correspond to indifference prices of the electricity producer and red curves—of the forest owner. In the risk neutral case the price of the electricity producer is constant. The price of the forest owner (15) stays the same until the amount of offsets 50.9 and increases afterwards. Therefore, for the fixed parameter and strike price US$/, the contracted amount is 50.9 at the price 11.67 US$/ contracted via flobsion (and assuming an additional future payment). For small values of parameter (case A1) the indifference curves are close to the risk-neutral lines. The figure shows how the risk-aversion (cases A1, A2 and A3) transforms the indifference curves of the parties. The price of the electricity producer is a monotonically declining with respect to amount of flobsions, while the price of the forest owner becomes rather U-shaped as demonstrated in the figure. This shape can be explained by relatively low opportunity costs for the smaller amounts of flobsions and, therefore, the risk-averse forest owner prefers to sell those via flobsion to have a “guaranteed” higher income. However, when opportunity costs are high, a rational forest owner would avoid entering into a REDD-offsetting contract. In the particular case indicated in Figure 3, risk-aversion increases the contracted amount of flobsions, that is, the maximum amount 65.3 can be contracted at the intersection of solid lines (A3) at the equilibrium price 11.09 US$/.
3.2. Contracted Amounts and Equilibrium Prices with Respect to Benefit-Sharing Ratio
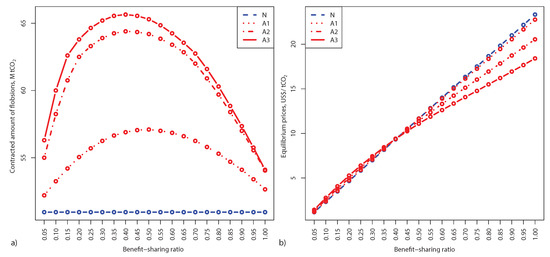
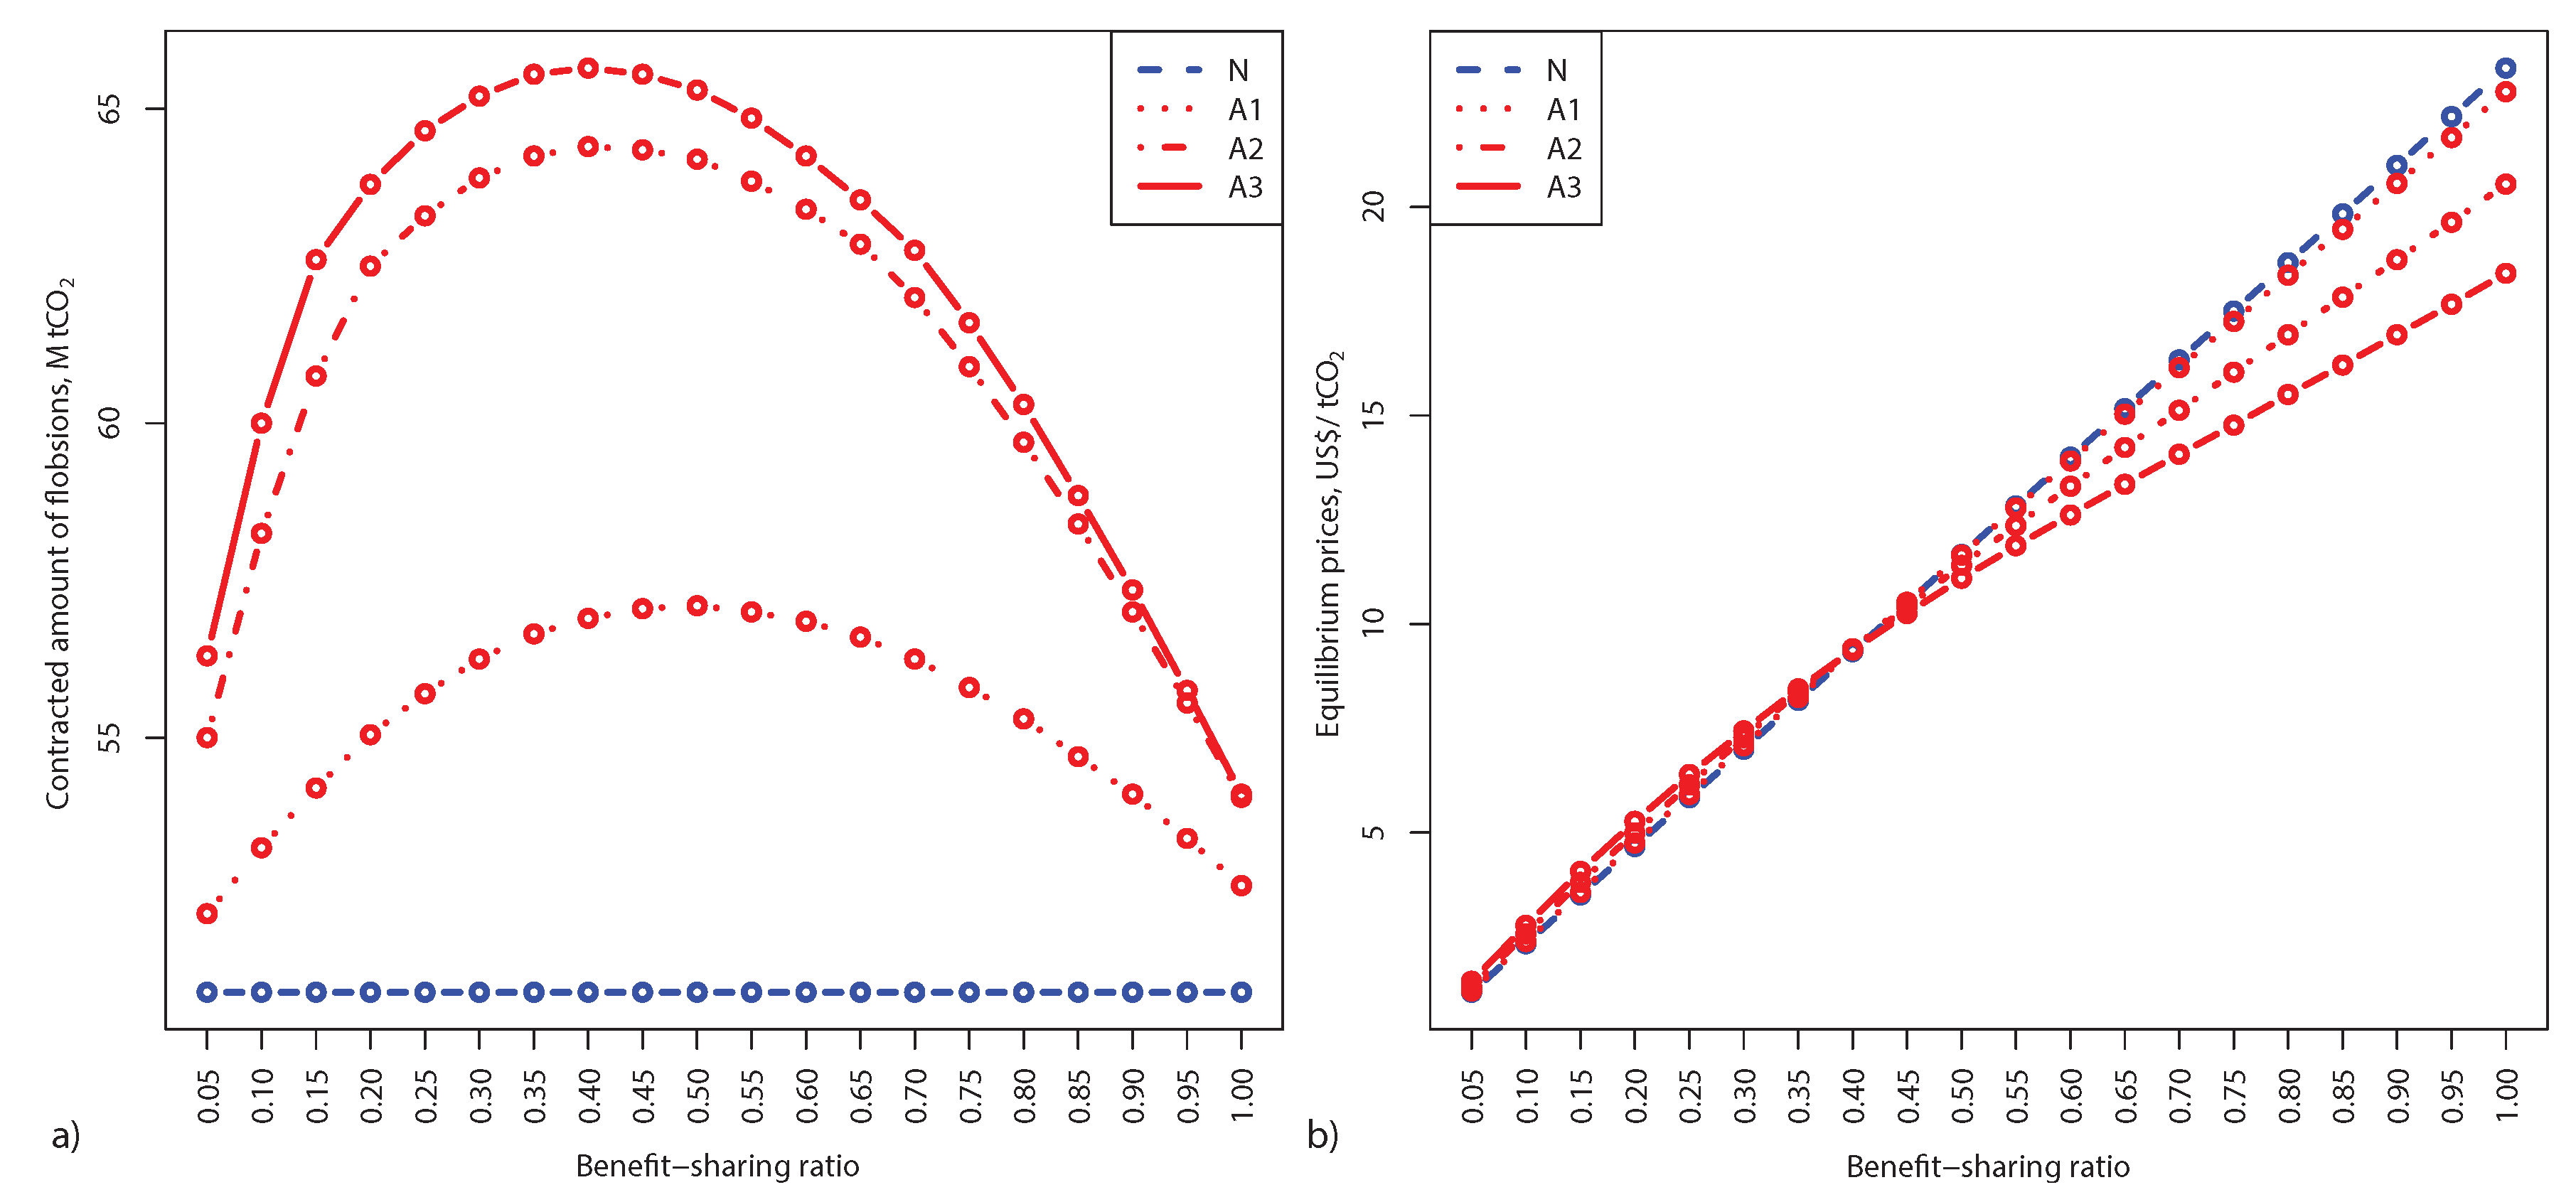
Let us fix the strike price as in Figure 3, US$/ and calculate the contracted amounts for all possible benefit-sharing ratios. According to Remark 3, we consider the case of zero discount (and hence zero-purchase price) as degraded and, therefore, stick to the range of . Contracted amounts are shown in Figure 4a. In the risk-neutral case (dashed blue line) the contracted amount is constant and equals 50.95 . As the plots show risk-aversion increases the contracted amounts for this strike price. An interesting feature is that there is a nonlinear dependence of the contracted amount with respect to benefit-sharing ratio in the risk-averse case. Red curves are concave with respect to benefit-sharing ratio, meaning that there is a maximum amount of contracted flobsions for every risk-aversion parameter. Here for A1 the maximum contracted amount is 57.1 , that is reached at the benefit-sharing ratio, . For A2 the maximum amount is 64.4 at and for A3—65.65 at . Note, that here we considered discrete values of with the step 0.05.
In Figure 4b we show the equilibrium prices corresponding to contracted amounts in Figure 4a. The prices are increasing with respect to growing benefit-sharing ratio. Note, that the maximum price is achieved when . This case corresponds to standard option. Thus, flobsion decreases the equilibrium price compared to option due to additional flexibility in choosing the benefit-sharing ratio. We also find out that for lower benefit-sharing ratios the equilibrium prices in the risk-averse case (red curves) are higher as compared to the prices in the risk-neutral case (blue line) but it is opposite for higher benefit-sharing ratios. This can be explained by the risk-aversion of the electricity producers, who are more comfortable with higher ratios. However, together with the price increasing at higher ratios, the amounts of contracts decline as shown in Figure 4a.
3.3. Impacts of Strike Prices on Contracted Amounts and Equilibrium Prices
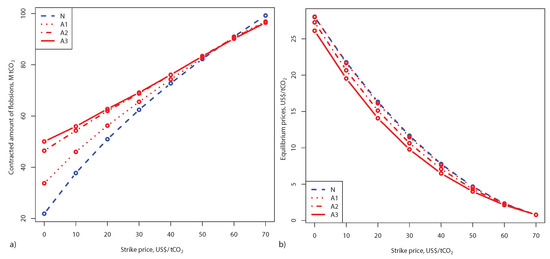
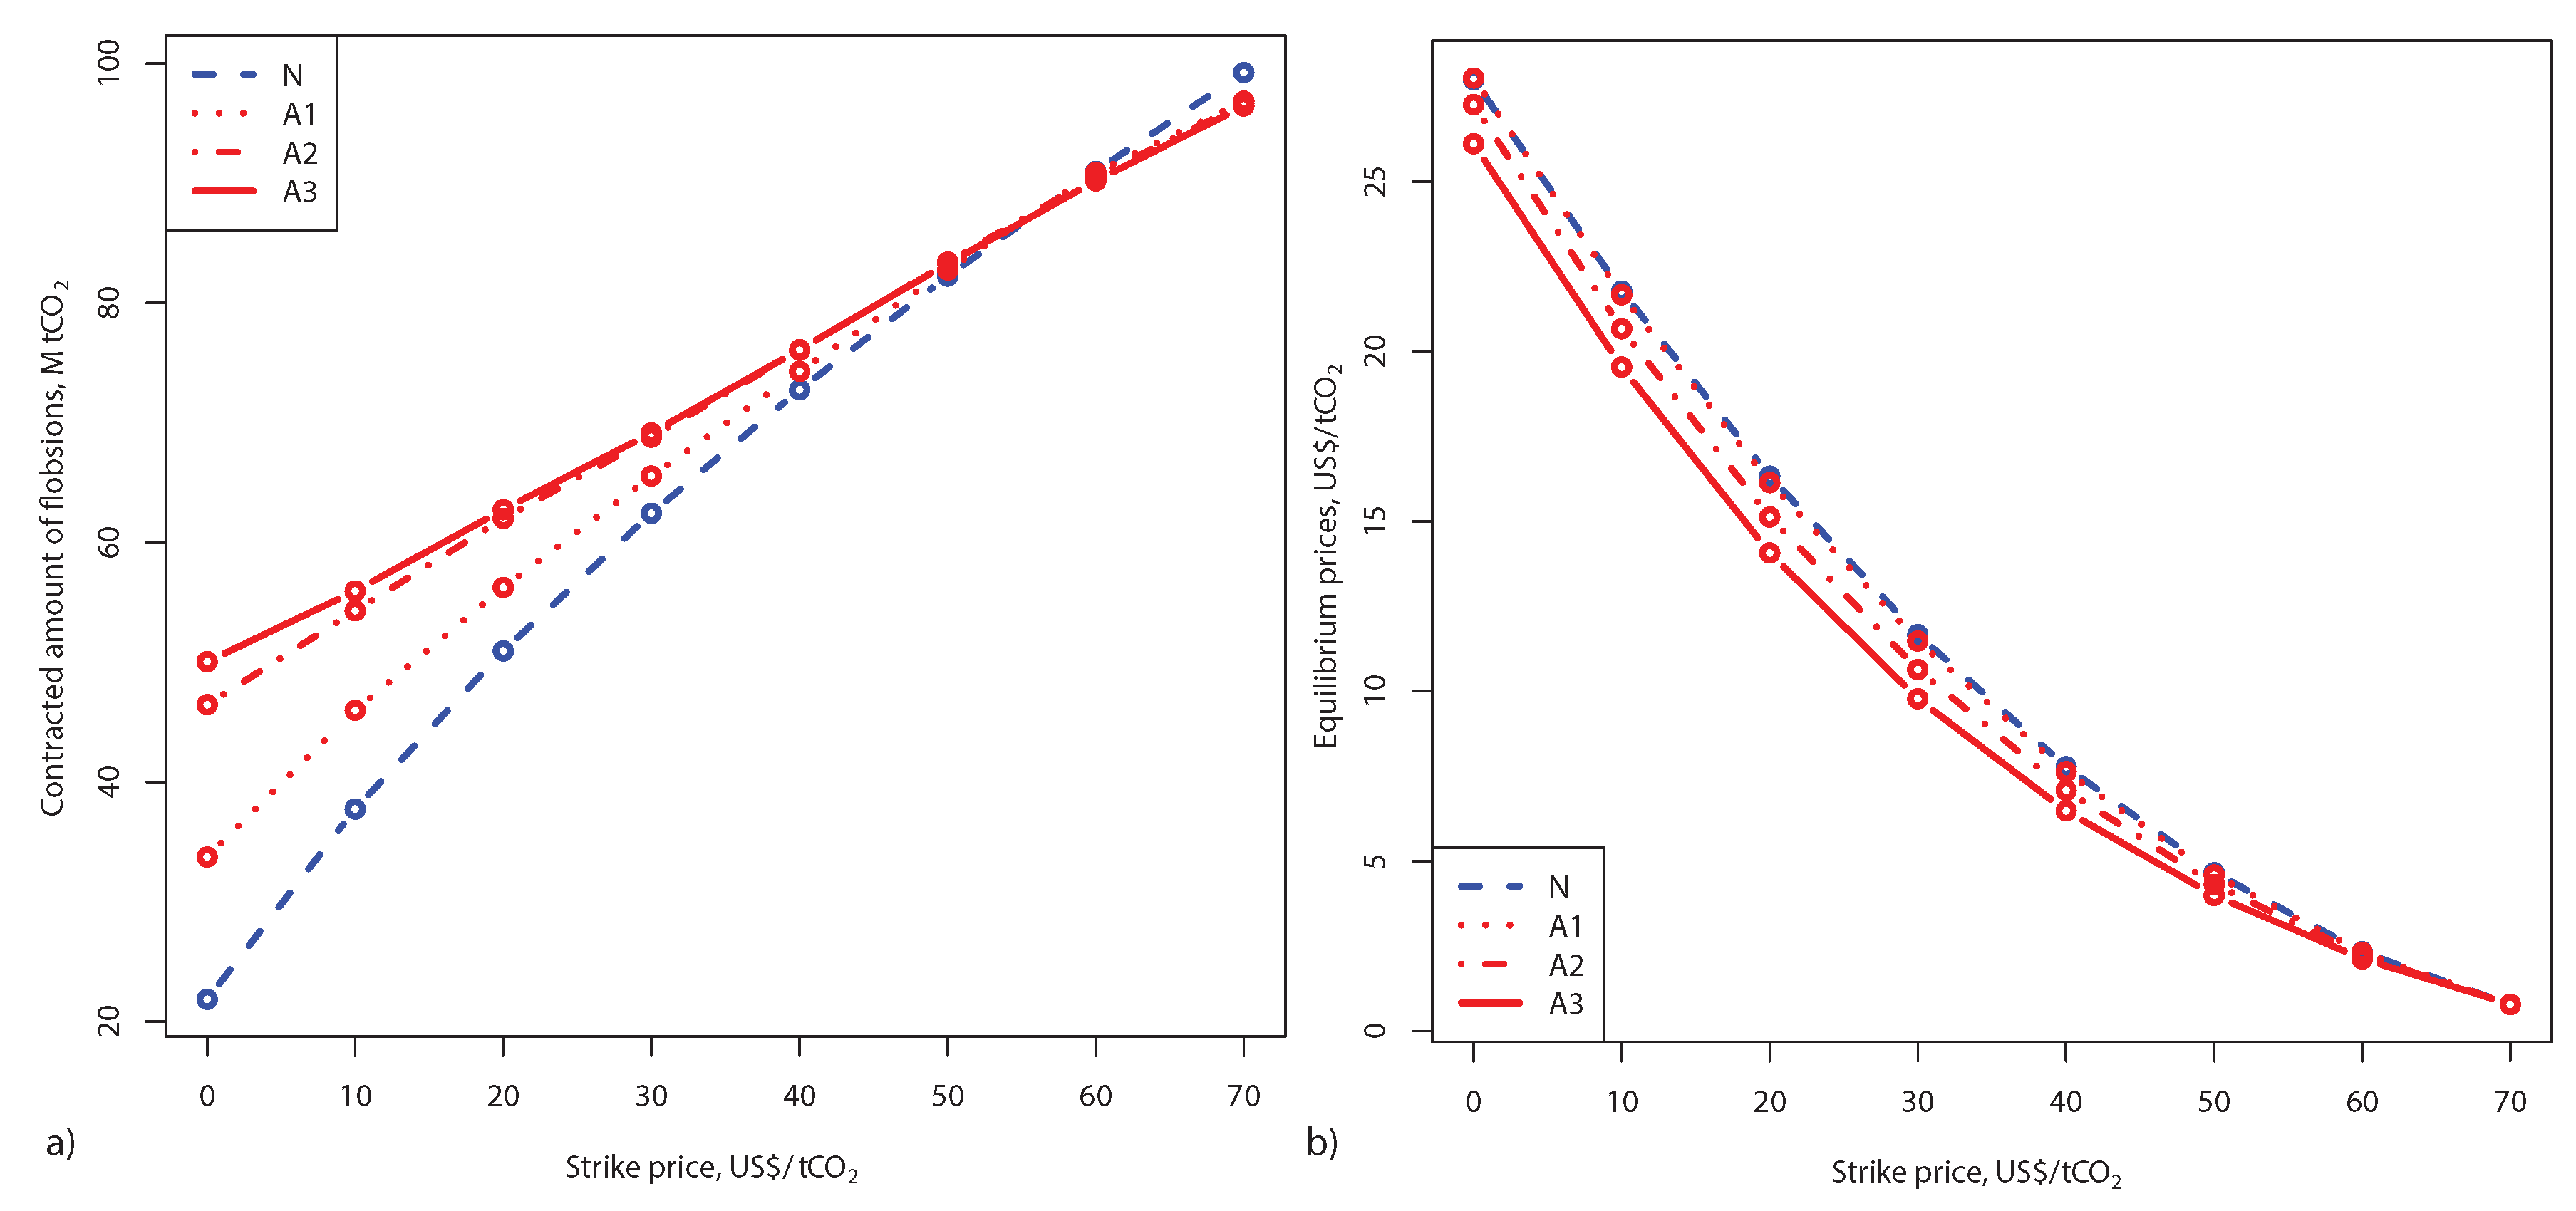
To be consistent with price distribution (19), we consider 8 strike prices varying in the range from 0 to 70 US$/ with the step 10 US$/. In Figure 5a we show how contracted amounts of flobsions change with respect to for the fixed benefit-sharing ratio . One can see that contracted volumes increase with the growing strike price in all cases. The smallest amounts in all cases can be contracted at zero strike price: 21.85 (N), 33.75 (A1), 46.45 (A2), 50.05 (A3).
Moreover, risk aversion increases the contracted amounts for small values of the strike price. This can be explained by the relatively high opportunity costs of the forest owner compared to the low strike price and at the same time by higher prices expected by the electricity producer. This situation changes when the strike price is relatively high; for larger values of the strike price the risk-averse amounts start to converge to risk-neutral case. At final rather extreme strike price, US$/, which is close to maximum price, the amount contracted in risk-neutral case exceeds the amount in risk-averse cases. This can be explained by the high value of the benifit-sharing ratio, considered in this case.
Figure 5a shows that maximum contracted amounts for take place at maximum strike price US$/: 99.25 (N), 96.85 (A1), 96.65 (A2), 96.45 (A3).
The equilibrium prices with respect to are shown in Figure 5b for . The case A1 is very close to N in terms of prices. All equilibrium prices decrease with respect to growing , as a higher strike price implies less possibilities for the energy producer to “earn” on a discount as compared to the market price. In the risk-neutral case the price varies from 0.78 to 28 US$/, while in the risk-averse case A3—from 0.79 to 26.12 US$/.
3.4. Full Flexibility Of Flobsion
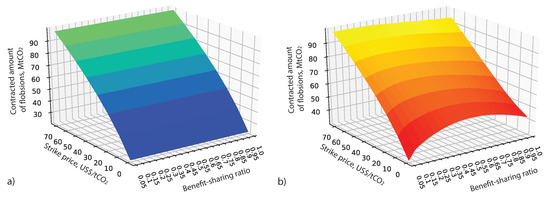
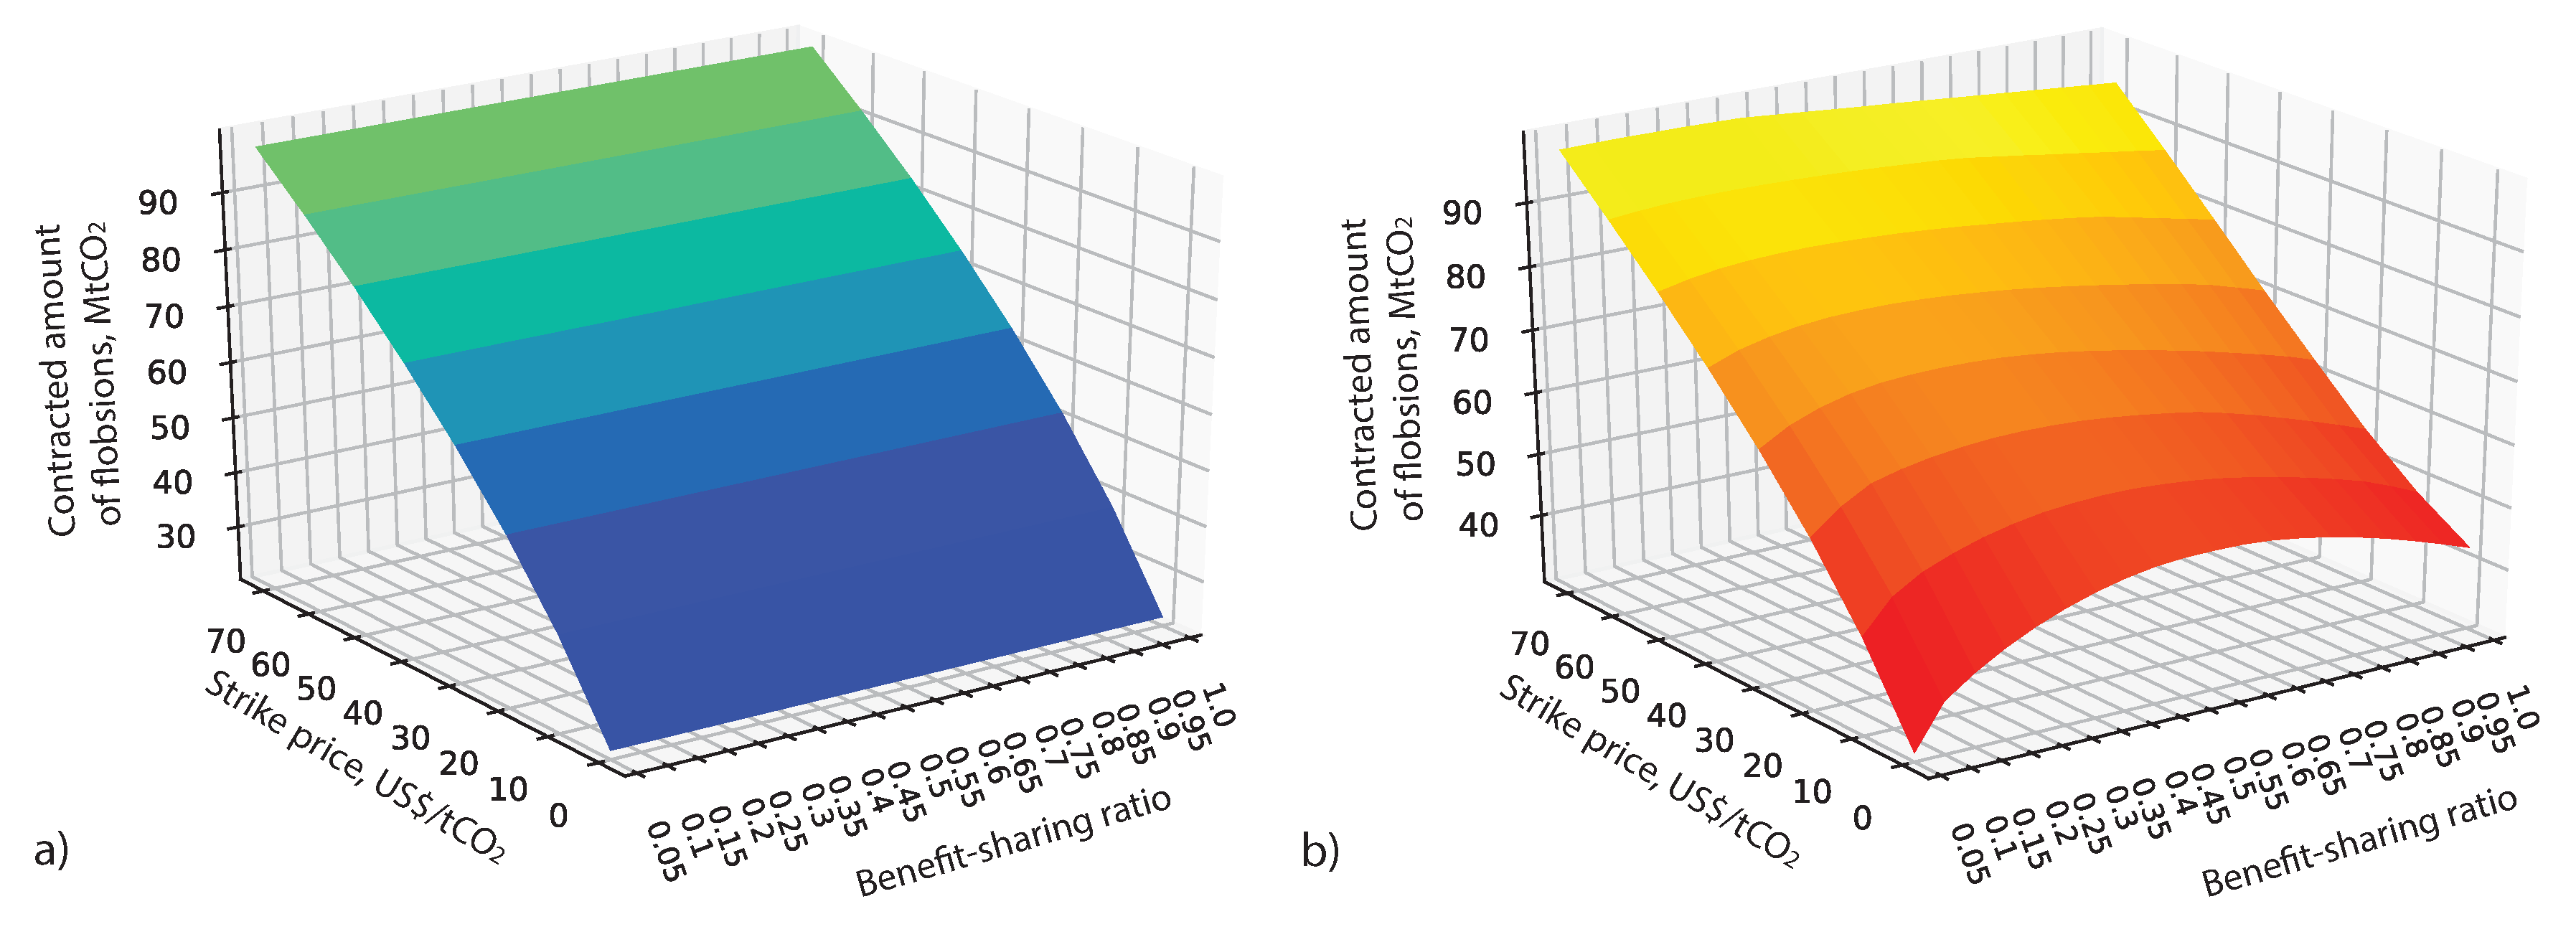
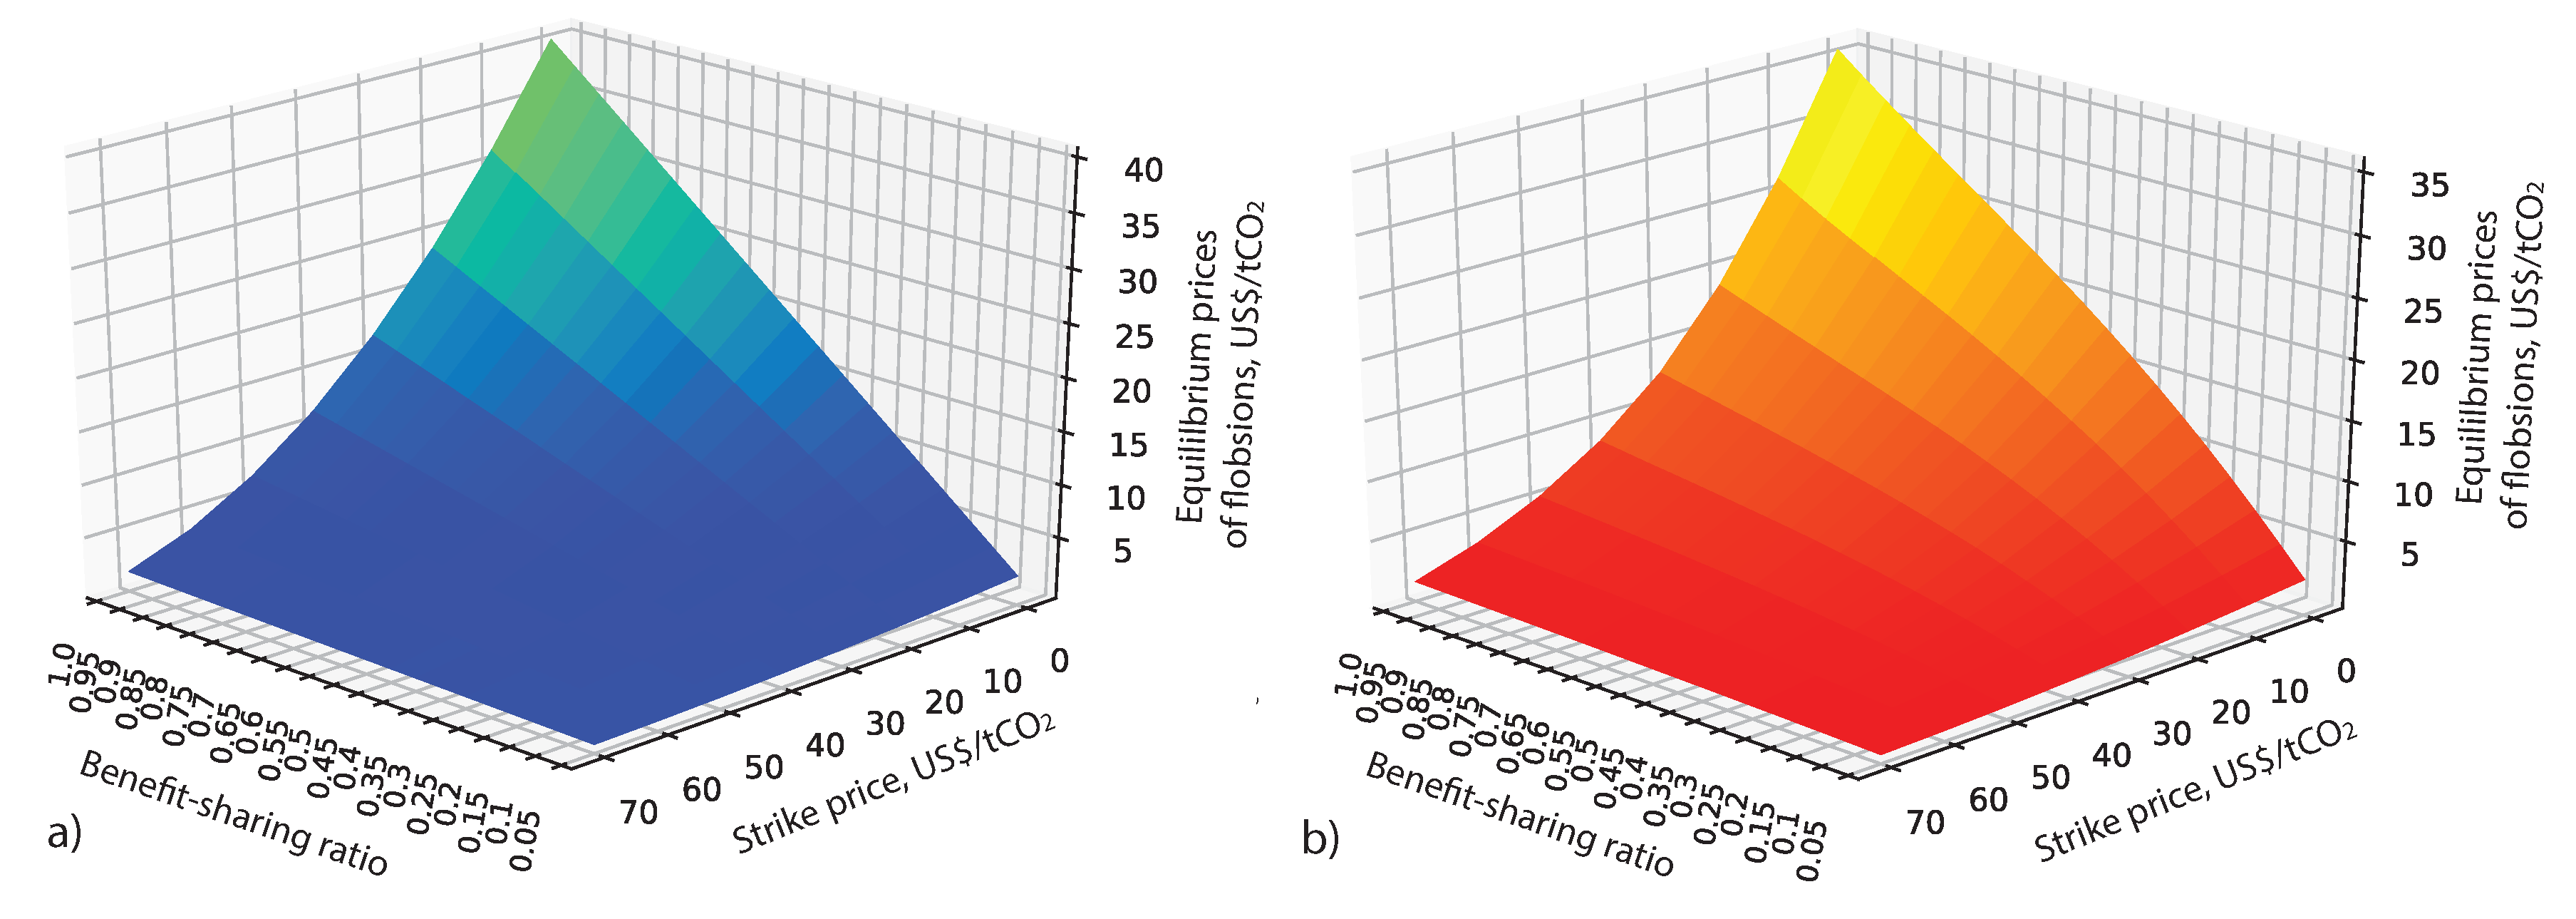
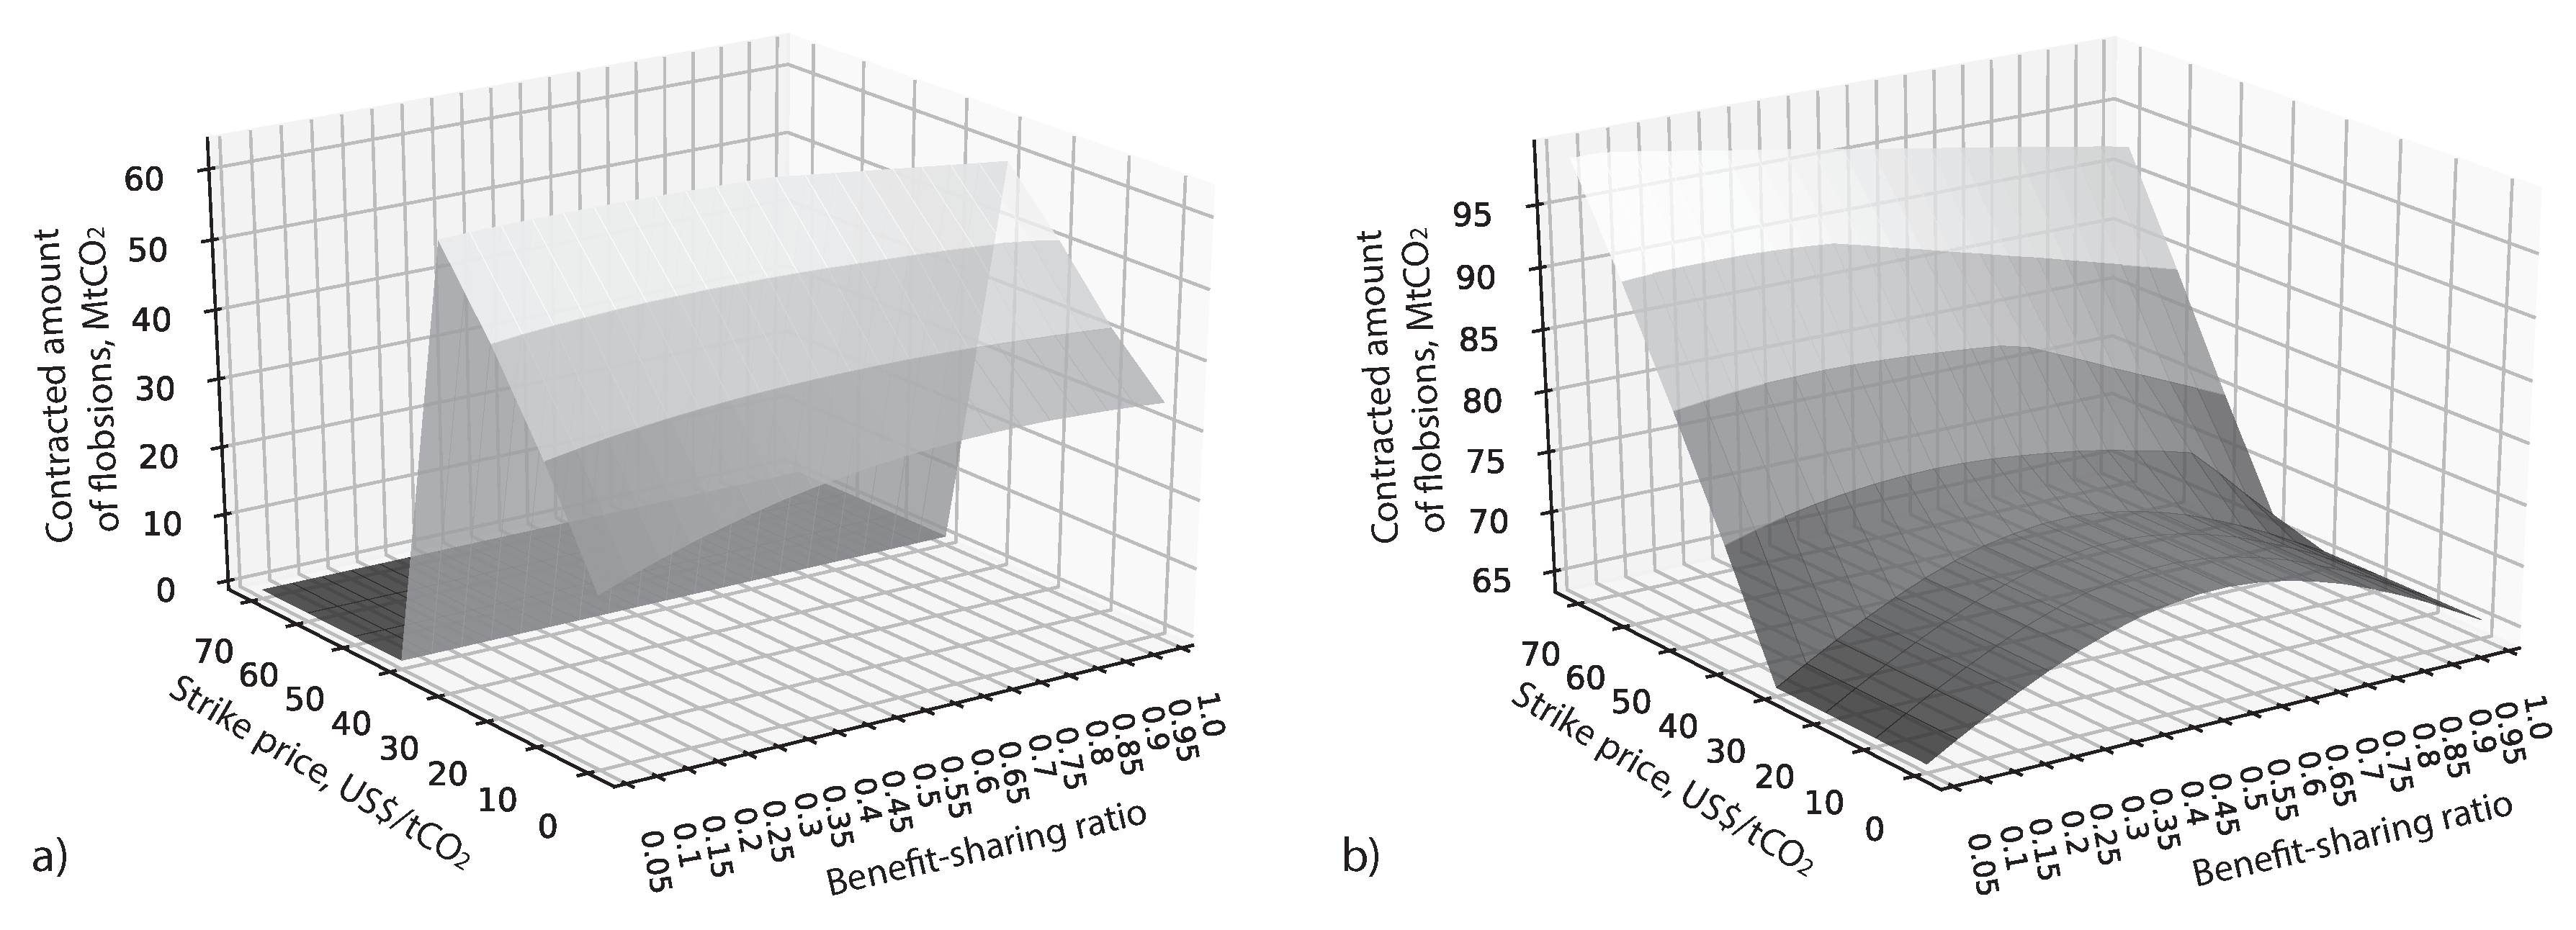
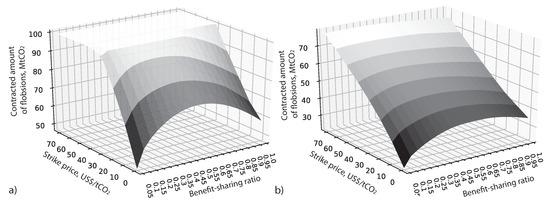
Let us now consider all combinations of benefit-sharing ratios and strike prices and their impacts on contracted amounts of flobsions and their prices. Figure 6a shows the contracted amount with respect to and in the risk-neutral case N. We see that the surface has a concave shape, increasing with respect to growing . We also note, that the surface levels are constant with respect to . However, looking at the corresponding equilibrium prices in Figure 7a we observe an evident decrease of the prices with respect to declining . Thus, even in the risk-neutral case benefit-sharing has a positive effect of decreasing the equilibrium price. Figure 7a shows that highest prices at every correspond to largest , that is, the case of standard option.
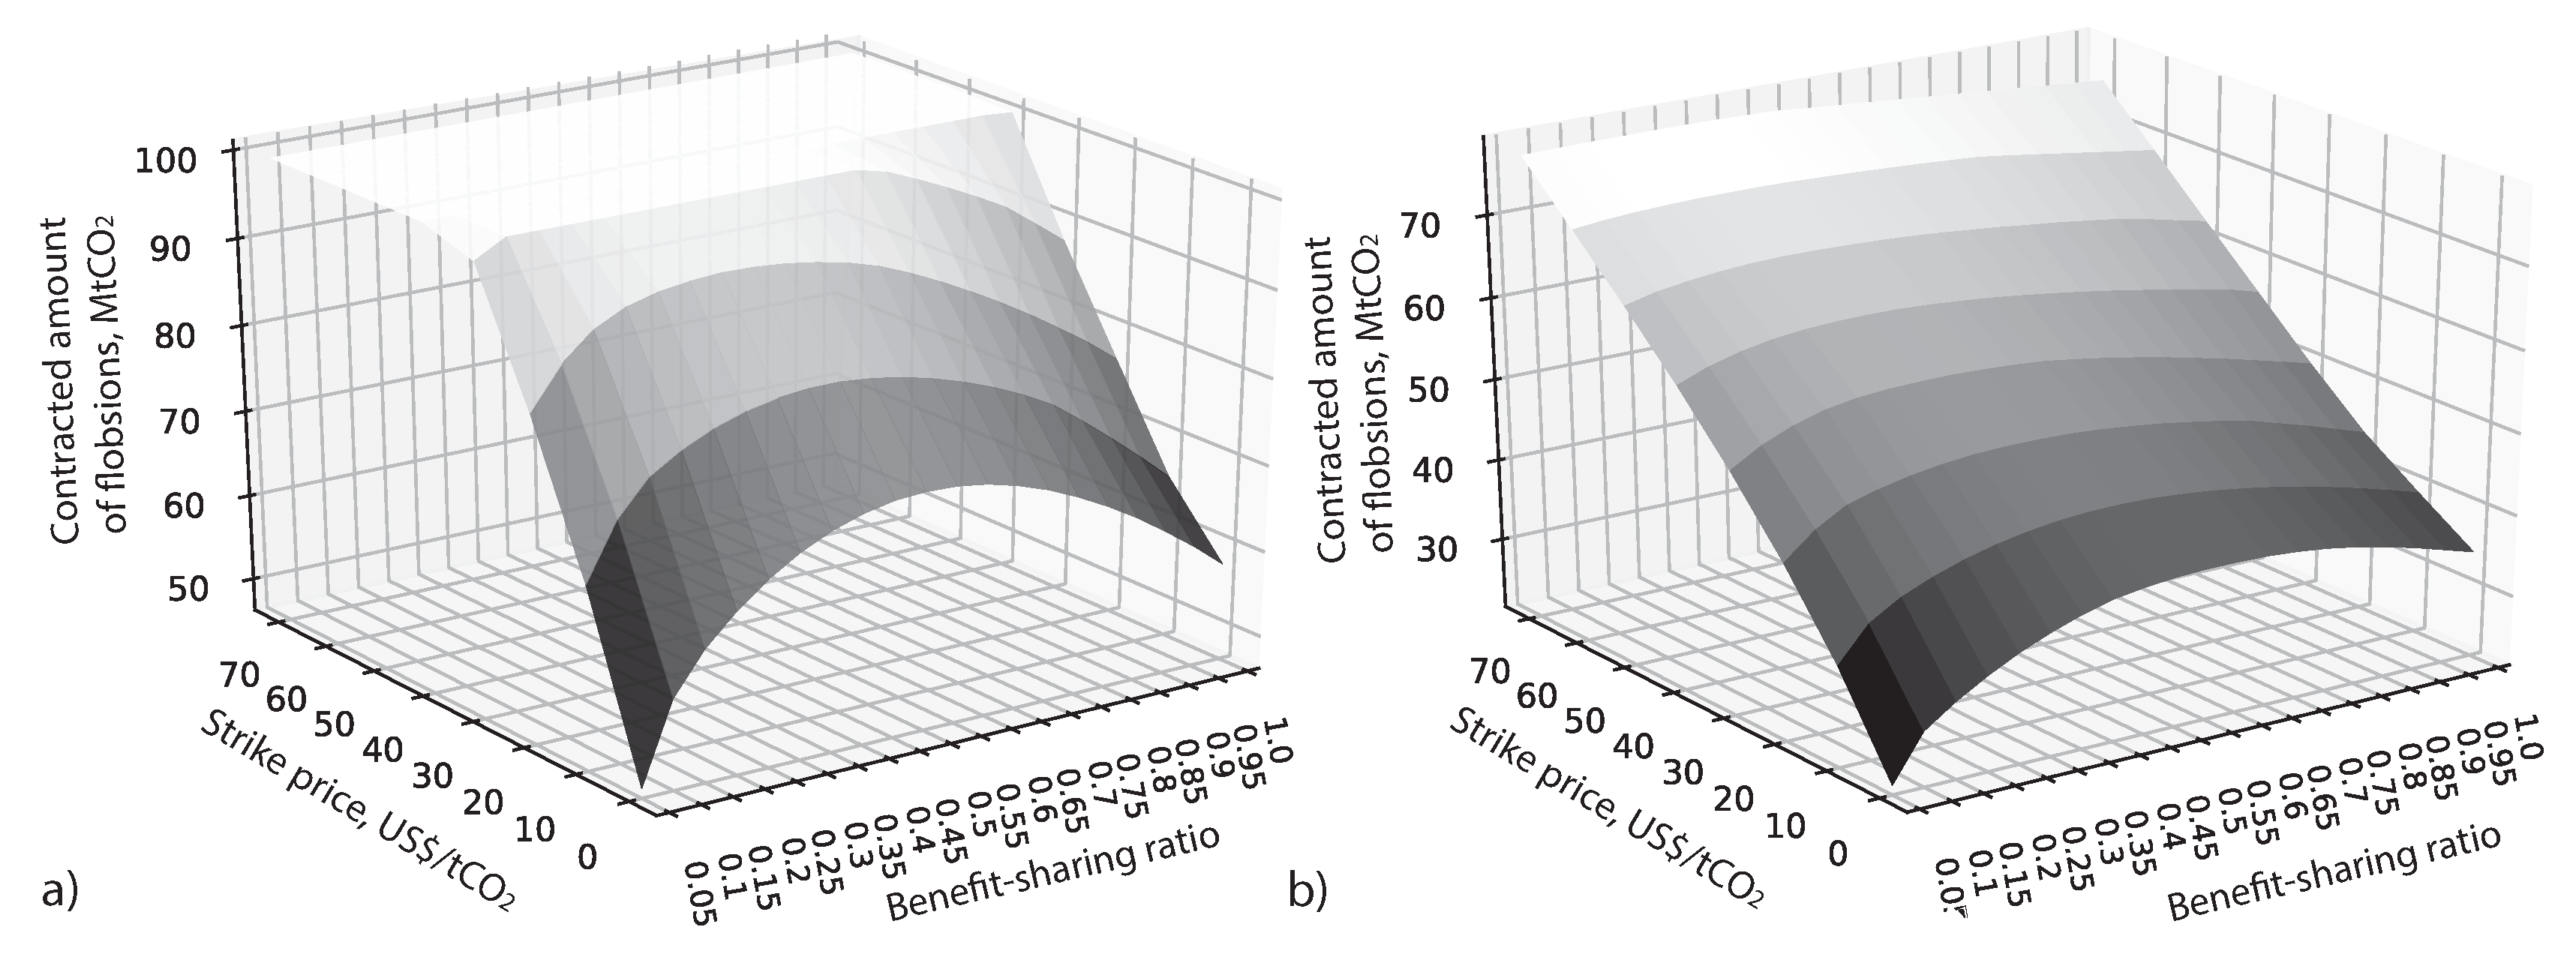
Figure 6b shows how the risk-aversion case A3 transforms the risk-neutral surface (cf. Figure 6a). The minimum value in case A3, 30.45 , corresponds to and , while the maximum is 99.45 corresponds to and . Both minimum and maximum values in case A3 are larger than in case N, where the values are 21.85 and 99.25 , respectively.
3.5. Sensitivity Analysis
In this section we perform sensitivity analysis of modeling results with respect to opportunity cost of the forest owner and price distribution envisioned by both decision-makers. For illustration we take the risk-averse case A3 and compare the contracted amount of flobsions to those depicted in Figure 6b.
3.5.1. Non-Uniform Price Distributions
The analysis above was performed for the uniform distribution. However, analytical formulas are valid for arbitrary distribution. In order to check how modeling results change with respect to distributions, we analyze two non-uniform cases. In the first case, prices are the same as in (19) but the probabilities are shifted to lower price realizations, meaning that decision-makers envision smaller prices more likely to happen. We consider the following distribution:
The mean price in this case is 20 US$/, which is half less than 40 US$/ in (19). The contracted amounts are shown in Figure 8a. We see that they are becoming zero after the strike price reaches the highest price with positive weight US$/, as the electricity producer would not buy any offsets. For the surface stays at zero level for all benefit-sharing ratios. Before this threshold, determined by distribution (21) the surface is qualitatively similar to the one with uniform distribution (cf. Figure 6b) but the values are lower due to lower expected values in the right side of the distribution. The value at and is 23.5 , which is 30.45 in Figure 6b. The largest contracted amount, 62.95 , is achieved when and , that is the maximum feasible strike price in this case. Qualitatively the outcomes stay similar to the case with uniform distribution.
The second alternative distribution is opposite to the previous one as it assumes more weight put on higher price realizations. We consider the following distribution:
The mean price in this case is 60 US$/. The results are depicted in Figure 8b. For , which correspond to the range of prices with zero probability in the distribution, the surface has steady shape. For this range the contracted amounts does not change with respect to strike price but still have concave shape with respect to . Note that the contracted amounts are larger compared to the case with uniform distribution (cf. Figure 6b). This is explained by the fact that parties put more value on flobsions in the situation of the foreseen higher prices. The minimum value in Figure 8b is 63.95 . For strike prices higher than , we see the increase in contracted amounts. Comparing the figure to Figure 6b, we observe a sharper incline towards smaller benefit-sharing ratios. This can be interpreted as the risk-averse electricity producer is ready to pay higher prices in the face of high price realizations and forest owner is fine with providing a larger discount. The maximum 99.25 is achieved at and . Let us note that this maximum does not coincide with the one in the case of uniform distribution 99.45 although the expected prices and probability coincide. This is due to the fact that a risk-averse decision maker takes into account the entire price distribution while calculating indifference prices as stated in Equations (17) and (18).
3.5.2. Sensitivity to Opportunity Costs
For illustration, we are not changing the shape of the opportunity cost curve but vary the scaling parameter K in Equation (20) that was set to above. We consider lower opportunity cost curve by setting , meaning that the maximum cost is US$/. The case of lower opportunity cost curve is shown in Figure 9a for the uniform distribution. In this case flobsions are very attractive to forest owner and they are willing to contract larger amounts compared to the case of higher opportunity costs (cf. Figure 6b). When the strike price is high, the maximum amount of flobsions is contracted. This happens when and for a set of benefit-sharing ratios and when for all . For surface conserves the concavity properties with respect to and . The lower opportunity costs increase the minimum contracted amount, which constitutes 47.3 in this case.
In Figure 9b we show the case of higher opportunity cost curve with parameter in Equation (16), meaning that the highest cost is US$/. In this case the shape of the surface is similar to the one in Figure 6b but quantitatively the contracted amounts decrease. The minimum contracted amount is 22.55 , while the maximum—is 78.15 . This is due to the fact that for each flobsions’ amount the opportunity cost curve becomes higher, while price distribution stays the same. Here the maximum value is achieved at the highest strike price for the range of benefit-sharing ratios , indicating that at that highest strike price, the contracted amounts start to reach some saturation level similar to Figure 9a.
4. Discussion
In this paper the FI-REDD model was elaborated by implementing a flobsion and an opportunity cost of the forest owner (REDD supplier). The results showed (Lemma 1) that REDD offsets provided to the energy producer would not change the optimal emissions compared to the case of no offsets. This delivers an important signal to policy makers. Even if the offsets are provided to the electricity producer at no cost, it is not rational to change the technological portfolio from the optimal one (determined solely by the carbon price) and emit more. When the market for offsets is established, it is more profitable to sell the offsets on the market. Moreover, in the situation of higher emission costs, the optimal emissions will decrease compared to the situation with zero emissions costs as shown in Reference [19].
The impact of risk-preferences on the volume of contracted flobsions was analyzed. In the risk-neutral case, the contracted amounts at every strike price are the same for both the flobsion and the standard option. However, the price in the case of the standard option coincides with flobsion’s price only at the largest benefit-sharing ratio, which is equal to one. For lower benefit-sharing ratios, the equilibrium prices of the flobsion are lower compared to the standard option. They decrease together with decreasing benefit-sharing ratio. This price decrease is more vivid for lower strike prices.
In the risk-averse case, the situation is similar in terms of prices and, moreover, the benefit-sharing ratio allows the maximum contracted amount of flobsions to be found for every strike price. In particular, for relatively small strike prices compared to the maximum range of prices, the choice of benefit-sharing ratio allows for a considerable increase in the contracted amounts. That fact is of a potential interest in the REDD context, larger contracted volumes mean more forest being allocated for the generation of carbon offset sand that it is hence protected under the REDD umbrella. The contracted amounts also increase when there is stronger risk-aversion.
The findings show that contracted amounts increase as the strike price grows. This is quite a natural result, as the higher strike prices are advantageous for both parties—forest owner and electricity producer. Thereafter, the equilibrium prices also decrease with growing strike prices. The full set of benefit-sharing ratios and strike prices and how they impact the contracted amount and the equilibrium prices is illustrated in Figure 6 and Figure 7. Interestingly, the risk-averse case shows that at every strike price, there are values of the benefit-sharing ratio that deliver the maximum of contracted amounts.
As the research was based on the FI-REDD model, a similar range of offset amounts and prices was used. The opportunity cost curve was chosen to be consistent with these data for illustrative purposes. Nevertheless, to check how the results react to a different setup a sensitivity analysis was performed. The analysis shows that qualitative features remain valid. The contracted amounts are higher when higher prices are more likely and lower when lower prices are more likely, in both cases compared to uniform distribution. We also show that lower opportunity costs facilitate the contracting of more offsets, while higher ones decrease the contracted amounts. The results of the sensitivity analysis did not provide any irregularities, as the situation of symmetric information of a buyer and a seller with respect to future price distribution was considered.
5. Conclusions
While the flobsion construct apparently has more universal applications, we see how good its fit is in the REDD-offsetting context. This is because it supports the provision of up-front financing for the development of offset-generating projects, while at the same time providing enough flexibility for a balance of interest to be found between the offsets buyer and seller in the face of uncertainties associated with future terms of offsetting. The problem of the acceptance and fungibility of REDD-based offsets with emission allowances is still open at both national and international level [33,34]. This situation leads to necessity to alleviate corresponding risks, and flobsion might be helpful in this regard.
Despite technical details of potential policies remaining uncertain, there is progress towards inclusion of REDD-based offsetting for compliance at a legal level (e.g., California). Although policy changes create opportunities, at the same time they can create risks for certain market players. The flobsion’s properties prove it to be a potential candidate to accommodate and alleviate those risks, and, therefore, accelerate the implementation of new policies.
The numerical results on the flobsion’s properties presented in this paper cover a rich set of cases with respect to the varied parameters—the strike price and the benefit-sharing ratio (discount)— and therefore make this work complete for practical applications. Such instruments could be considered in terms of providing flexibility in the future through the benefit-sharing mechanism, thereby reducing the initial investment. However, it is important for decision-makers to clearly formulate their policies and in particular to formalize the legal aspects of the acceptance of the flobsion (issued today) in the future, as well as the sharing agreements. Although it is beyond the scope of this paper, we would like to draw attention to the legal aspects of community-based human rights [35] and consideration of the needs of indigenous peoples [36], in the implementation of REDD.
Further research could be directed towards exploration of flobsion applications beyond REDD. The asymmetric information of a buyer and seller in terms of future uncertainties would also be an interesting analysis.
Author Contributions
Conceptualization, A.K., N.K., R.L. and M.O.; methodology, A.K. and N.K.; software, formal analysis, writing—original draft preparation, A.K.; writing—review and editing, N.K., R.L. and M.O.
Funding
This work was supported by the project “Delivering Incentives to End Deforestation: Global Ambition, Private/ Public Finance and Zero-Deforestation Supply Chains” funded by the Norwegian Agency for Development Cooperation under agreement number QZA-0464, QZA-16/0218.
Conflicts of Interest
The authors declare no conflict of interest. The funders had no role in the design of the study; in the collection, analyses, or interpretation of data; in the writing of the manuscript, or in the decision to publish the results.
Abbreviations
The following abbreviations are used in this manuscript:
| GHG | Greenhouse Gas |
| REDD | Reducing emissions from deforestation and forest degradation |
| SDGs | Sustainable Development Goals |
| FI-REDD | Financial instruments for REDD (model) |
Appendix A. Derivation of Indifference Prices for Flobsions
Appendix A.1. Indifference Prices for Risk-Neutral Utilities
For the utility of the electricity producer without REDD we have:
where is the largest index when .
Using Equation (11), we get the expected mean utility with REDD flobsions:
By applying indifference principle we get the price:
Utility of the forest owner without flobsion (12):
Using Equation (13), we can calculate utility of the forest owner with flobsion:
By applying the indifference condition , we derive the following indifference price of the forest owner:
Appendix A.2. Indifference Prices for Exponential Utilities
For the electricity producer without REDD flobsions we get the following utility:
where is the parameter of risk preferences. Expected utility of the electricity producer with REDD flobsions is calculated as follows:
For the forest owner without flobsion we have:
and with flobsion:
We get the following indifference price:
References
- United Nations Framework Convention on Climate Change. Adoption of the Paris Agreement; United Nations Office at Geneva: Geneva, Switzerland, 2015. [Google Scholar]
- Corbera, E.; Schroeder, H. Governing and implementing REDD+. Environ. Sci. Policy 2011, 14, 89–99. [Google Scholar] [CrossRef] [Scilit]
- Law, E.A.; Thomas, S.; Meijaard, E.; Dargusch, P.J.; Wilson, K.A. A modular framework for management of complexity in international forest-carbon policy. Nat. Clim. Chang. 2012, 2, 155. [Google Scholar] [CrossRef] [Scilit]
- McDermott, C.L. REDDuced: From sustainability to legality to units of carbon—The search for common interests in international forest governance. Environ. Sci. Policy 2014, 35, 12–19. [Google Scholar] [CrossRef] [Scilit]
- Busch, J.; Strassburg, B.; Cattaneo, A.; Lubowski, R.; Bruner, A.; Rice, R.; Creed, A.; Ashton, R.; Boltz, F. Comparing climate and cost impacts of reference levels for reducing emissions from deforestation. Environ. Res. Lett. 2009, 4, 044006. [Google Scholar] [CrossRef] [Scilit]
- Lubowski, R.N.; Rose, S.K. The potential for REDD+: Key economic modeling insights and issues. Rev. Environ. Econ. Policy 2013, 7, 67–90. [Google Scholar] [CrossRef] [Scilit]
- Koch, N.; Reuter, W.H.; Fuss, S.; Grosjean, G. Permits vs. offsets under investment uncertainty. Resour. Energy Econ. 2017, 49, 33–47. [Google Scholar] [CrossRef] [Scilit]
- Angelsen, A.; Rudel, T.K. Designing and implementing effective REDD+ policies: A forest transition approach. Rev. Environ. Econ. Policy 2013, 7, 91–113. [Google Scholar] [CrossRef] [Scilit]
- Bosetti, V.; Lubowski, R.; Golub, A.; Markandya, A. Linking reduced deforestation and a global carbon market: Implications for clean energy technology and policy flexibility. Environ. Dev. Econ. 2011, 16, 479–505. [Google Scholar] [CrossRef] [Scilit]
- Golub, A.A.; Fuss, S.; Lubowski, R.; Hiller, J.; Khabarov, N.; Koch, N.; Krasovskii, A.; Kraxner, F.; Laing, T.; Obersteiner, M.; et al. Escaping the climate policy uncertainty trap: Options contracts for REDD+. Clim. Policy 2018, 18, 1227–1234. [Google Scholar] [CrossRef] [Scilit]
- Houghton, R.A.; Duffy, P.B.; Nassikas, A. Forests: The Bridge to a Fossil-Free Future. 2016. Available online: http://whrc.org/wp-content/uploads/2018/01/PB_Forests.pdf (accessed on 1 October 2019).
- United Nations Development Programme. Sustainable Development Goals—Goal 15 Life on Land. 2016. Available online: http://www.undp.org/content/undp/en/home/sustainable-development-goals/goal-15-life-on-land.html (accessed on 1 October 2019).
- Plugge, D.; Baldauf, T.; Köhl, M. The global climate change mitigation strategy REDD: Monitoring costs and uncertainties jeopardize economic benefits. Clim. Chang. 2013, 119, 247–259. [Google Scholar] [CrossRef] [Scilit]
- Fletcher, R.; Dressler, W.; Büscher, B.; Anderson, Z.R. Questioning REDD+ and the future of market-based conservation. Conserv. Biol. 2016, 30, 673–675. [Google Scholar] [CrossRef] [Scilit] [PubMed]
- Boer, H.J. The role of government in operationalising markets for REDD+ in Indonesia. For. Policy Econ. 2018, 86, 4–12. [Google Scholar] [CrossRef] [Scilit]
- Laing, T.; Taschini, L.; Palmer, C. Understanding the demand for REDD+ credits. Environ. Conserv. 2016, 43, 389–396. [Google Scholar] [CrossRef] [Scilit]
- The Rockefeller Foundation. REDD+ Acceleration Fund. 2017. Available online: https://assets.rockefellerfoundation.org/app/uploads/20170706180732/Redd-Acceleration-Fund.pdf (accessed on 1 October 2019).
- Keohane, N. California Sets Stage for Global Forest Protection through State’s Cap-and-Trade Program. 2018. Available online: https://www.edf.org/media/california-sets-stage-global-forest-protection-through-states-cap-and-trade-program (accessed on 1 October 2019).
- Krasovskii, A.; Khabarov, N.; Obersteiner, M. Fair pricing of REDD-based emission offsets under risk preferences and benefit-sharing. Energy Policy 2016, 96, 193–205. [Google Scholar] [CrossRef] [Scilit]
- Krasovskii, A.; Khabarov, N.; Obersteiner, M. CO2-intensive power generation and REDD-based emission offsets with a benefit-sharing mechanism. Energy Syst. 2017, 8, 857–883. [Google Scholar] [CrossRef] [Scilit]
- Khabarov, N.; Lubowski, R.; Krasovskii, A.; Obersteiner, M. Flobsion—Flexible Option with Benefit Sharing. Int. J. Financ. Stud. 2019, 7, 22. [Google Scholar] [CrossRef] [Scilit]
- Dunlop, T.; Corbera, E. Incentivizing REDD+: How developing countries are laying the groundwork for benefit-sharing. Environ. Sci. Policy 2016, 63, 44–54. [Google Scholar] [CrossRef] [Scilit]
- Raiffa, H. Decision Analysis: Introductory Lectures on Choices und Uncertainty; Addison-Wesley: Boston, MA, USA, 1968. [Google Scholar]
- White, D.; Minang, D. Estimating the Opportunity Costs of REDD+: A Training Manual; World Bank Institute: Washington, DC, USA, 2010; 200p. [Google Scholar]
- Boucher, D.H. Out of the Woods: A Realistic Role for Tropical Forests in Curbing Global Warming; Union of Concerned Scientists: Cambridge, MA, USA, 2008. [Google Scholar]
- Che, Q.; Lou, S.; Wu, Y.; Zhang, X.; Wang, X. Optimal Scheduling of a Multi-Energy Power System with Multiple Flexible Resources and Large-Scale Wind Power. Energies 2019, 12, 3566. [Google Scholar] [CrossRef] [Scilit]
- Lisin, E.; Kurdiukova, G.; Okley, P.; Chernova, V. Efficient Methods of Market Pricing in Power Industry within the Context of System Integration of Renewable Energy Sources. Energies 2019, 12, 3250. [Google Scholar] [CrossRef] [Scilit]
- Staum, J. Incomplete markets. Handb. Oper. Res. Manag. Sci. 2007, 15, 511–563. [Google Scholar]
- Musiela, M.; Zariphopoulou, T. An example of indifference prices under exponential preferences. Financ. Stoch. 2004, 8, 229–239. [Google Scholar] [CrossRef] [Scilit]
- Cachon, G.P.; Lariviere, M.A. Supply chain coordination with revenue-sharing contracts: Strengths and limitations. Manag. Sci. 2005, 51, 30–44. [Google Scholar] [CrossRef] [Scilit]
- Li, S.; Zhu, Z.; Huang, L. Supply chain coordination and decision making under consignment contract with revenue sharing. Int. J. Prod. Econ. 2009, 120, 88–99. [Google Scholar] [CrossRef] [Scilit]
- Graham, V.; Laurance, S.G.; Grech, A.; McGregor, A.; Venter, O. A comparative assessment of the financial costs and carbon benefits of REDD+ strategies in Southeast Asia. Environ. Res. Lett. 2016, 11, 114022. [Google Scholar] [CrossRef] [Scilit]
- Dooley, K.; Gupta, A. Governing by expertise: The contested politics of (accounting for) land-based mitigation in a new climate agreement. Int. Environ. Agreem. Polit. Law Econ. 2017, 17, 483–500. [Google Scholar] [CrossRef] [Scilit]
- Beltran, A.M.; Angelsen, A.; den Elzen, M.; Gierløff, C.W.; Böttcher, H. Analysing the Options and Impacts of Including REDD Credits in Carbon Markets; Technical Report; PBL Working Paper 7; PBL: The Hague, The Netherlands, 2013. [Google Scholar]
- Raftopoulos, M. REDD+ and human rights: Addressing the urgent need for a full community-based human rights impact assessment. Int. J. Hum. Rights 2016, 20, 509–530. [Google Scholar] [CrossRef] [Scilit]
- Aguilar-Støen, M. Better Safe than Sorry? Indigenous Peoples, Carbon Cowboys and the Governance of REDD in the Amazon. Forum Dev. Stud. 2017, 44, 91–108. [Google Scholar] [CrossRef] [Scilit]
© 2019 by the authors. Licensee MDPI, Basel, Switzerland. This article is an open access article distributed under the terms and conditions of the Creative Commons Attribution (CC BY) license (http://creativecommons.org/licenses/by/4.0/).