Desiccant-Assisted Air Conditioning System Relying on Solar and Geothermal Energy during Summer and Winter †

Abstract
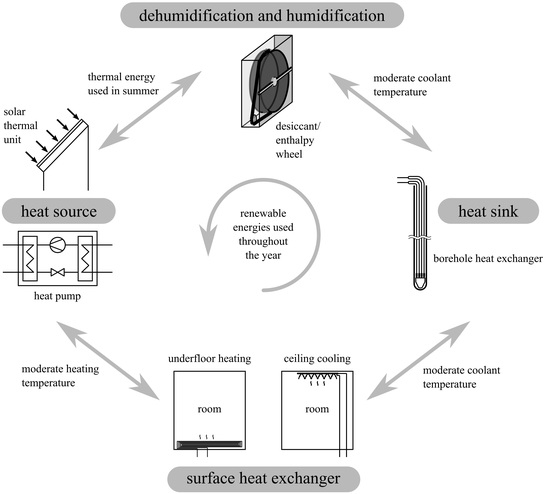
1. Introduction
1.1. Desiccant Assisted Air Conditioning
1.2. Air Dehumidification and Moisture Recovery
1.3. Previous and Ongoing Investigations of the Considered System
2. Materials and Methods
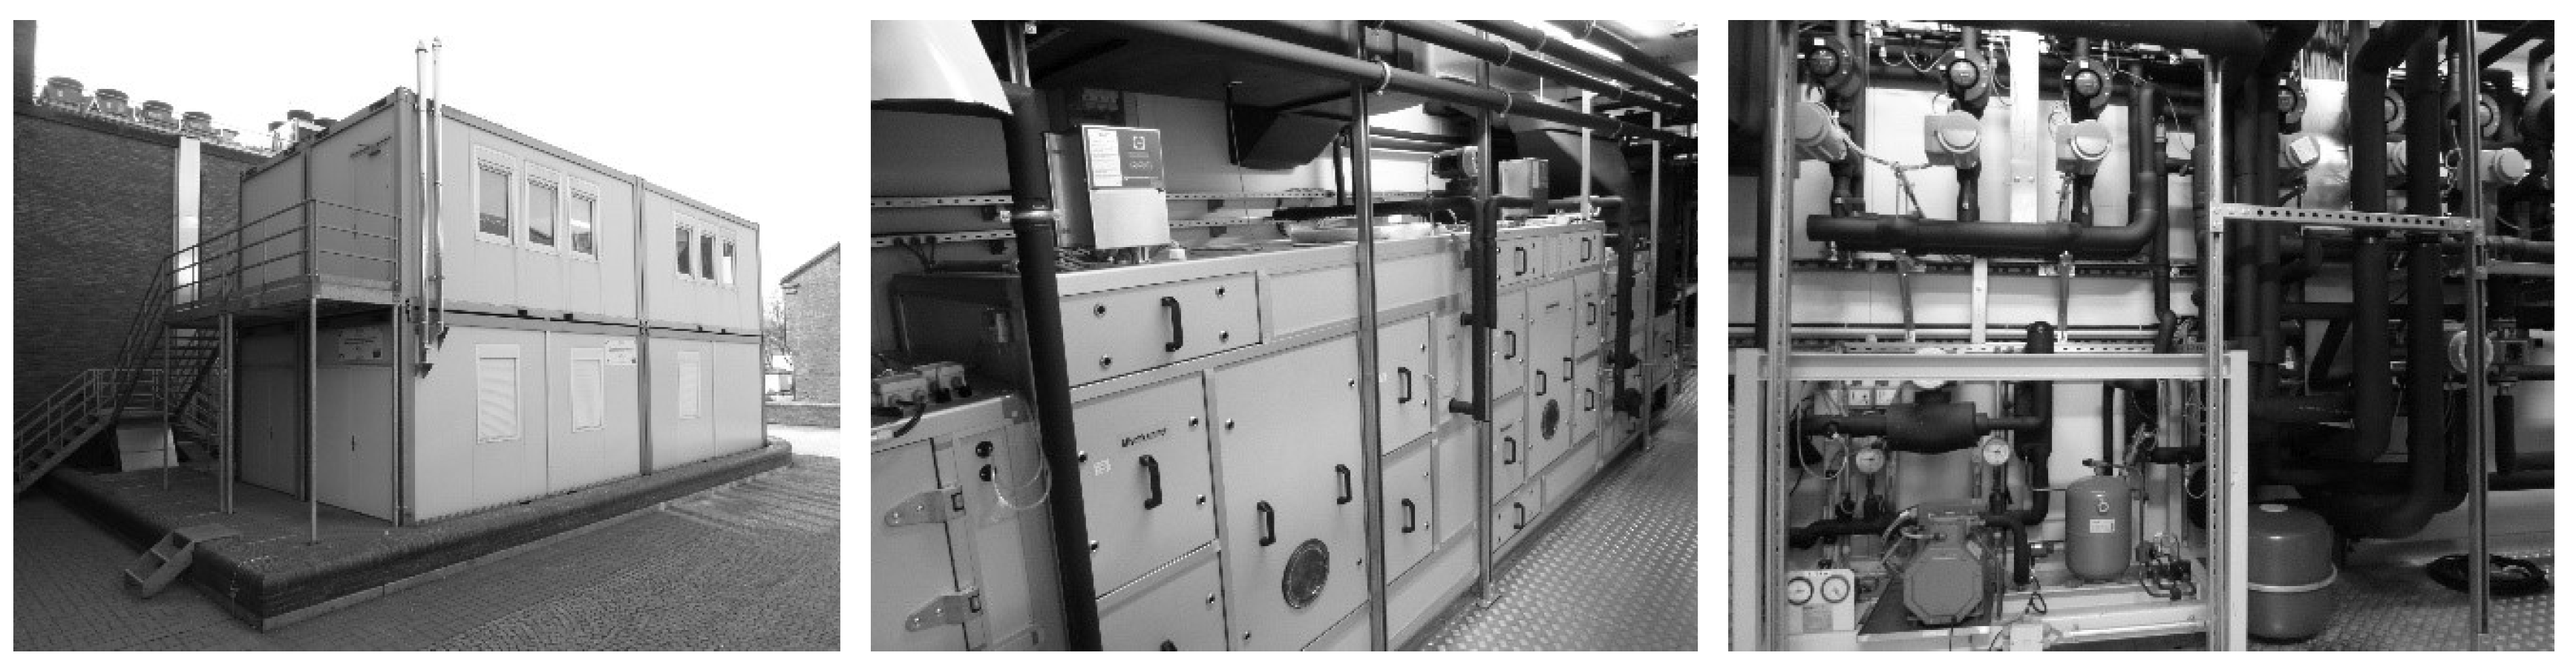
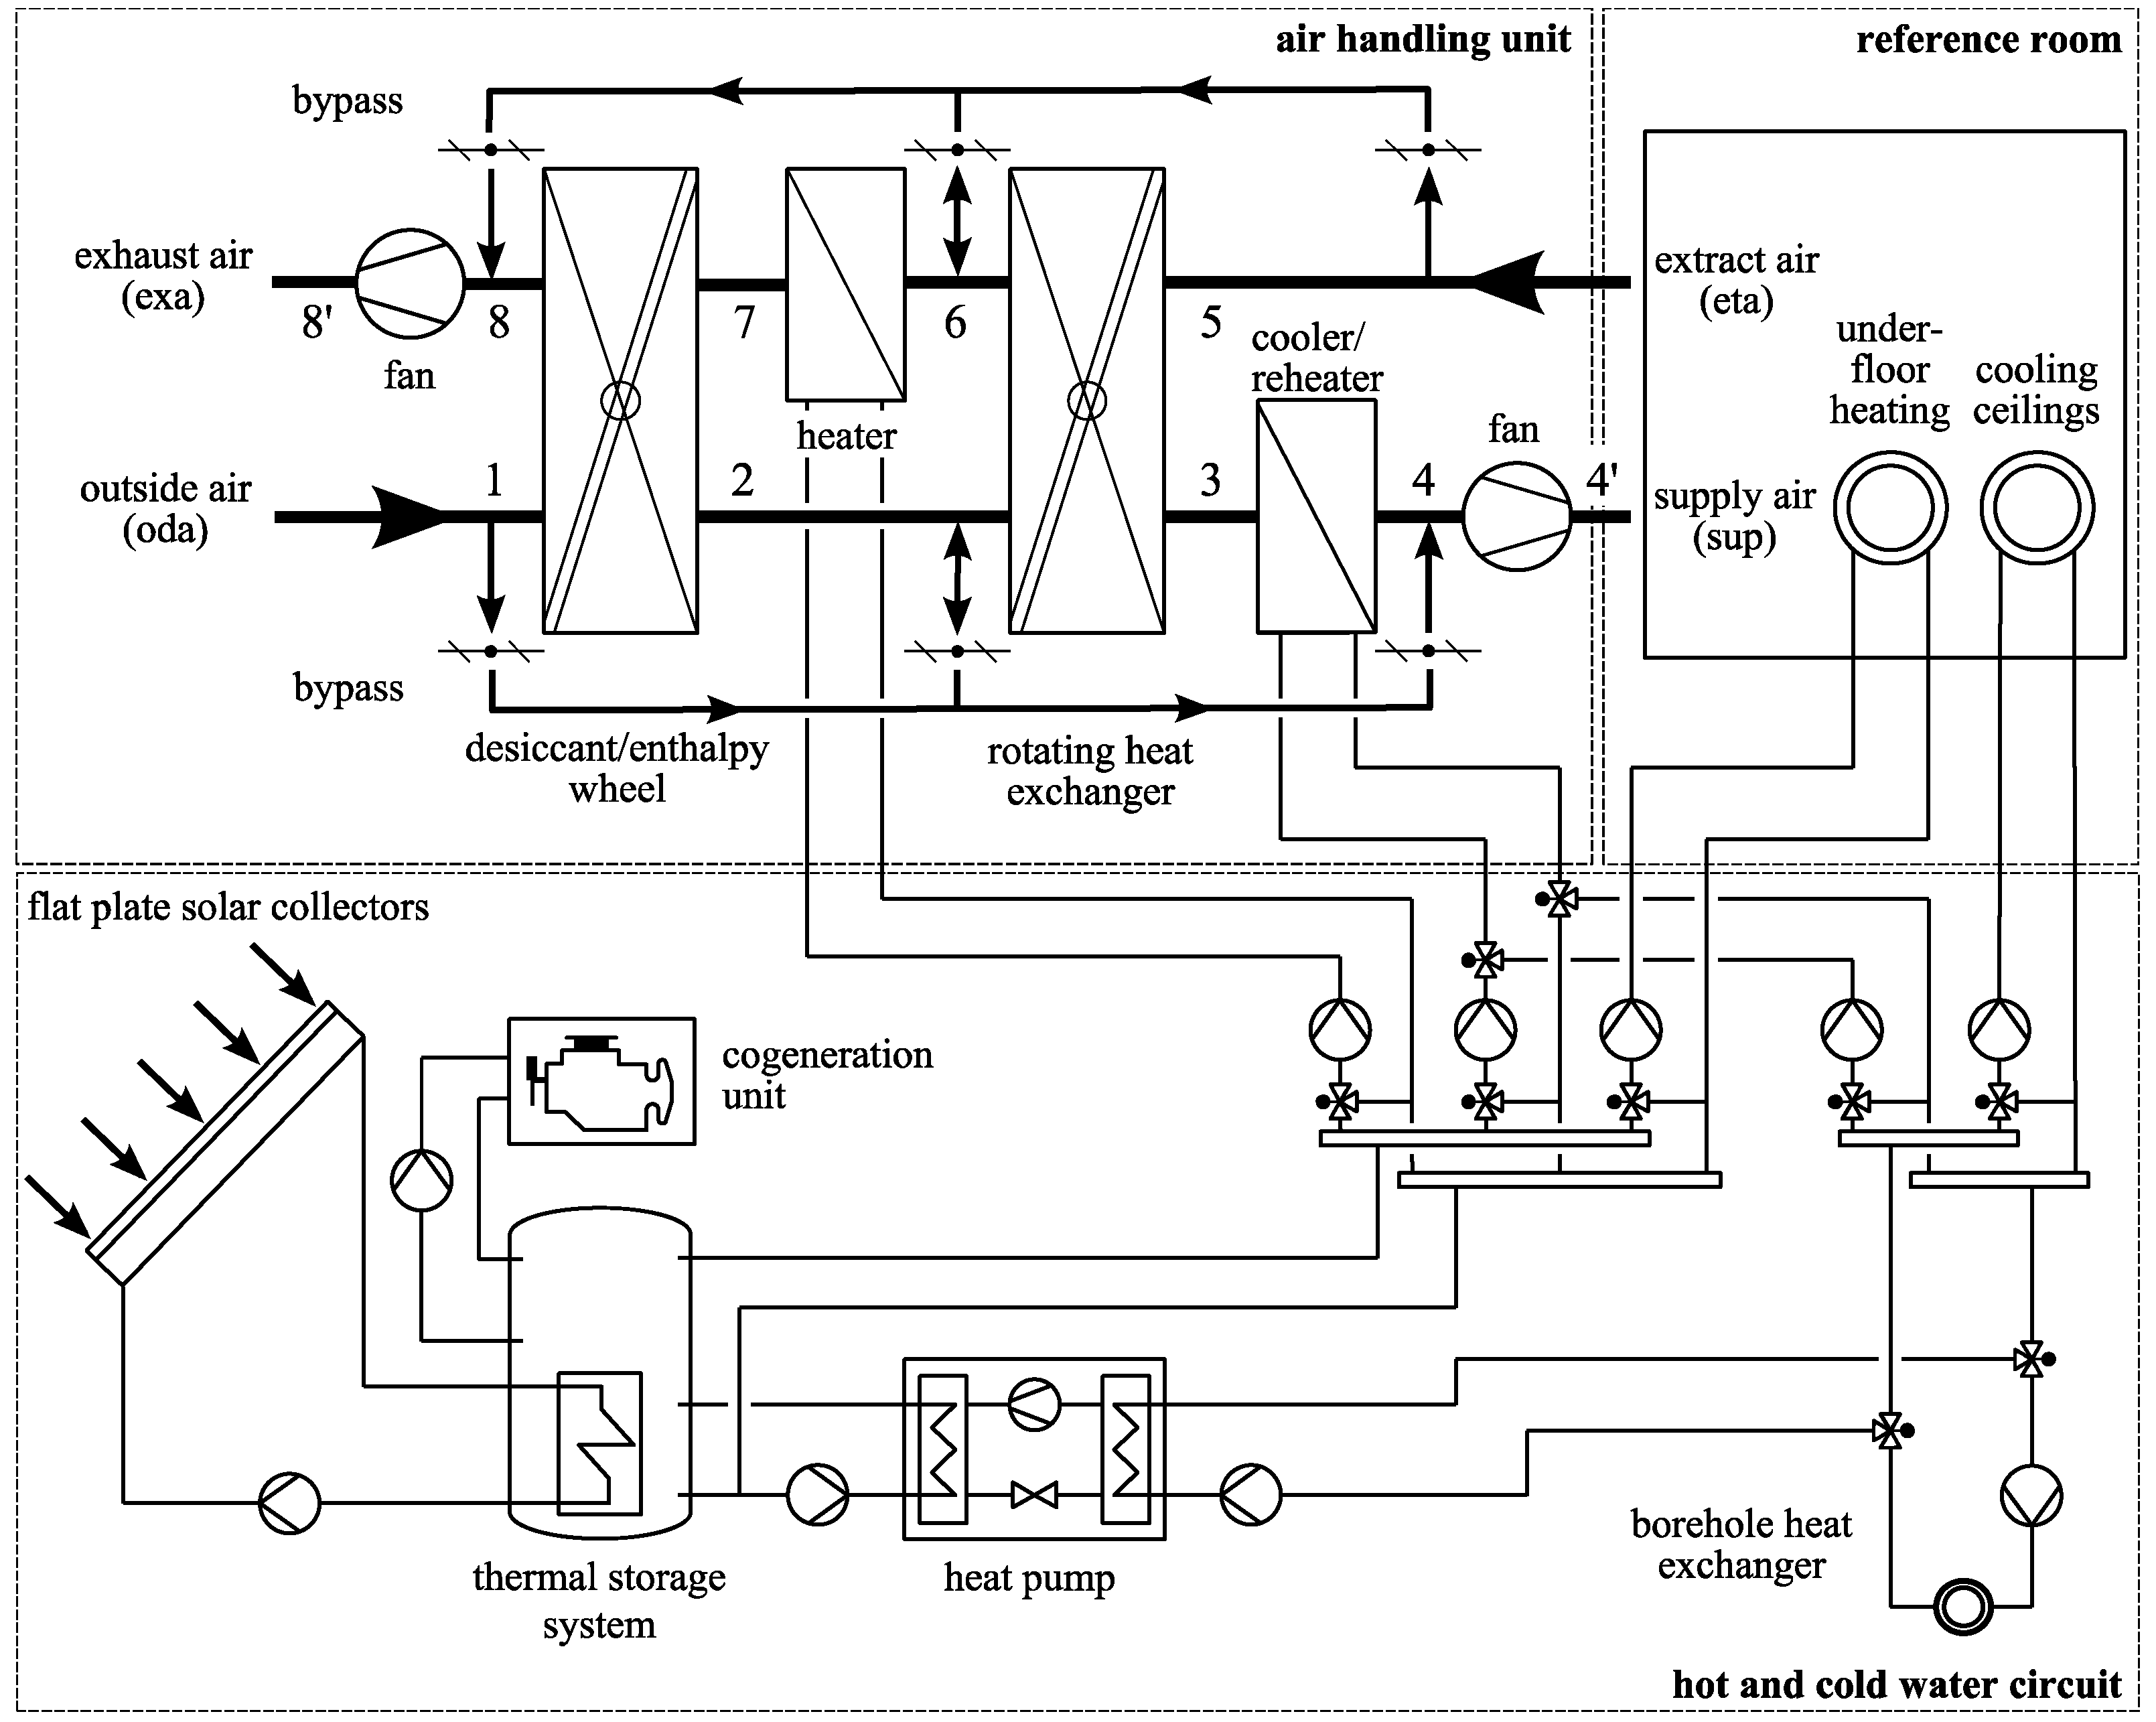
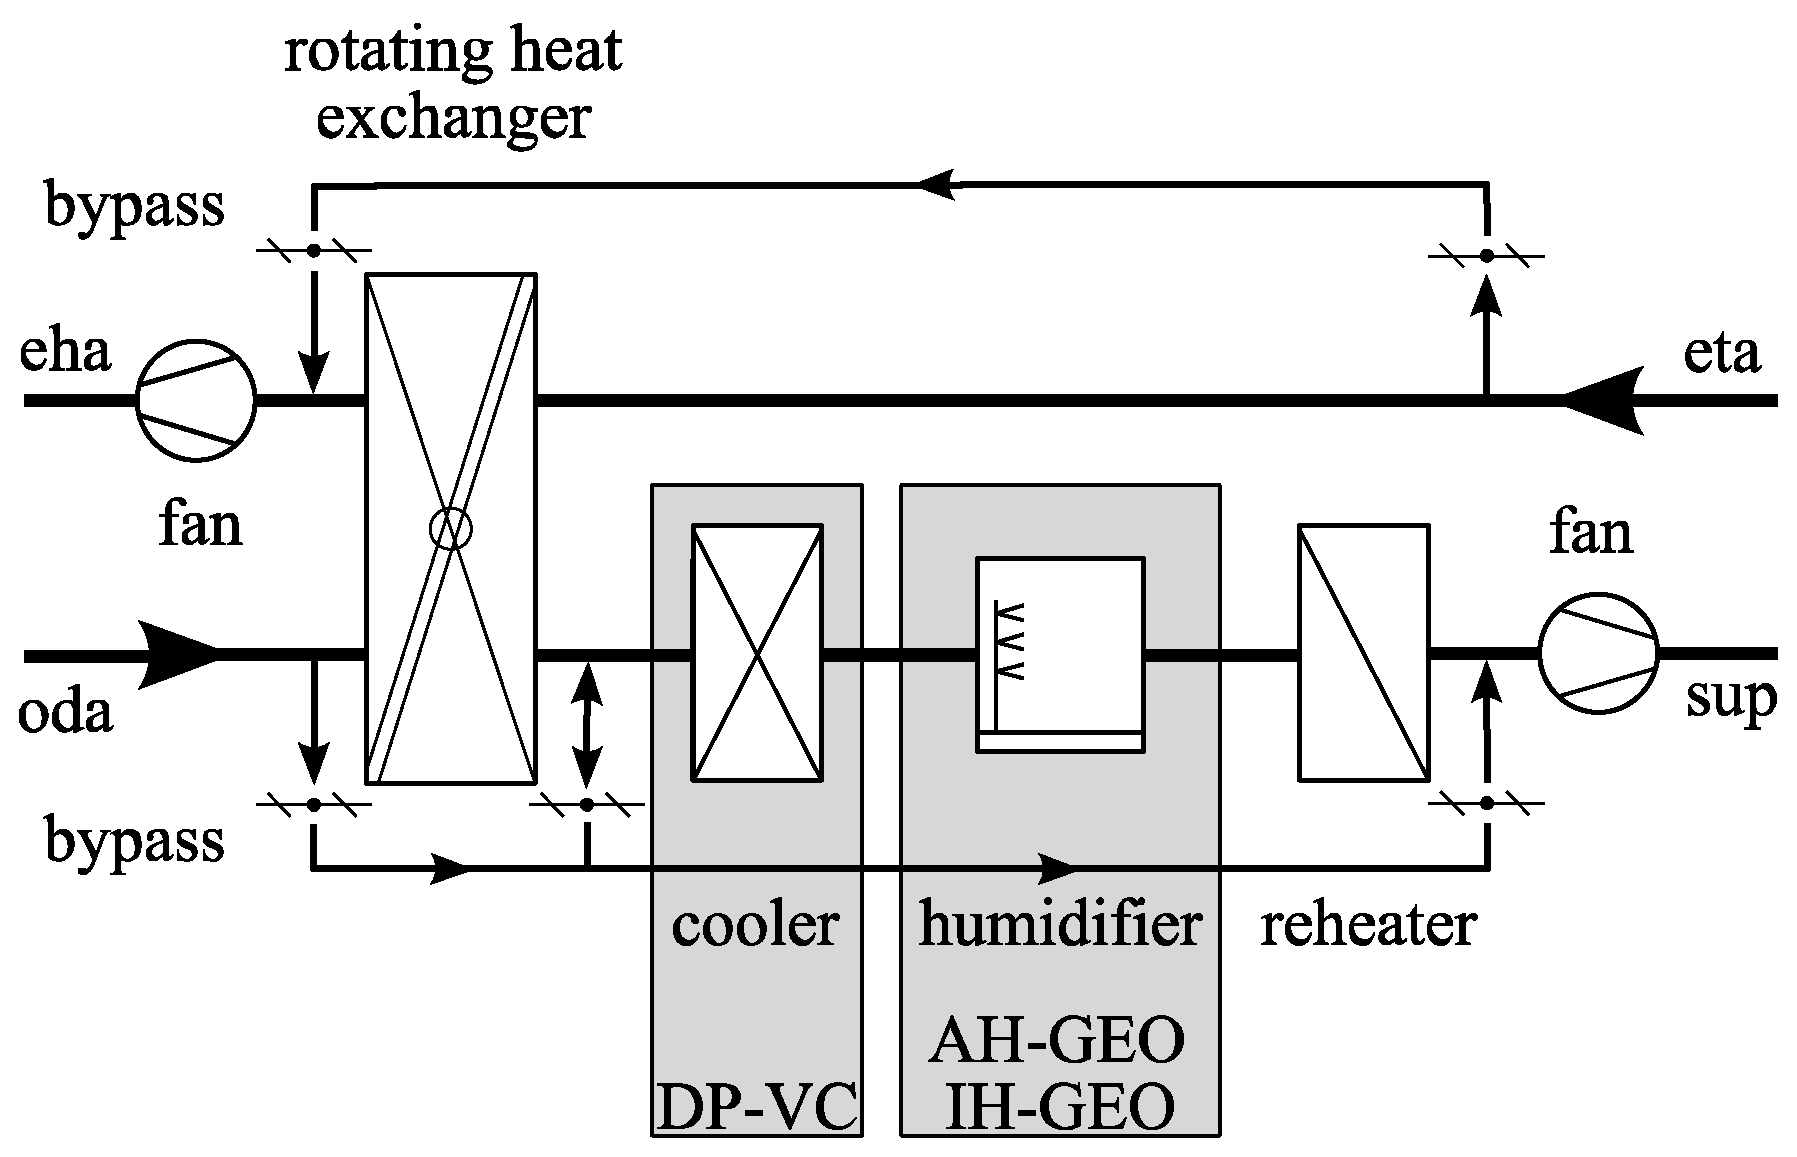
2.1. Air Conditioning System
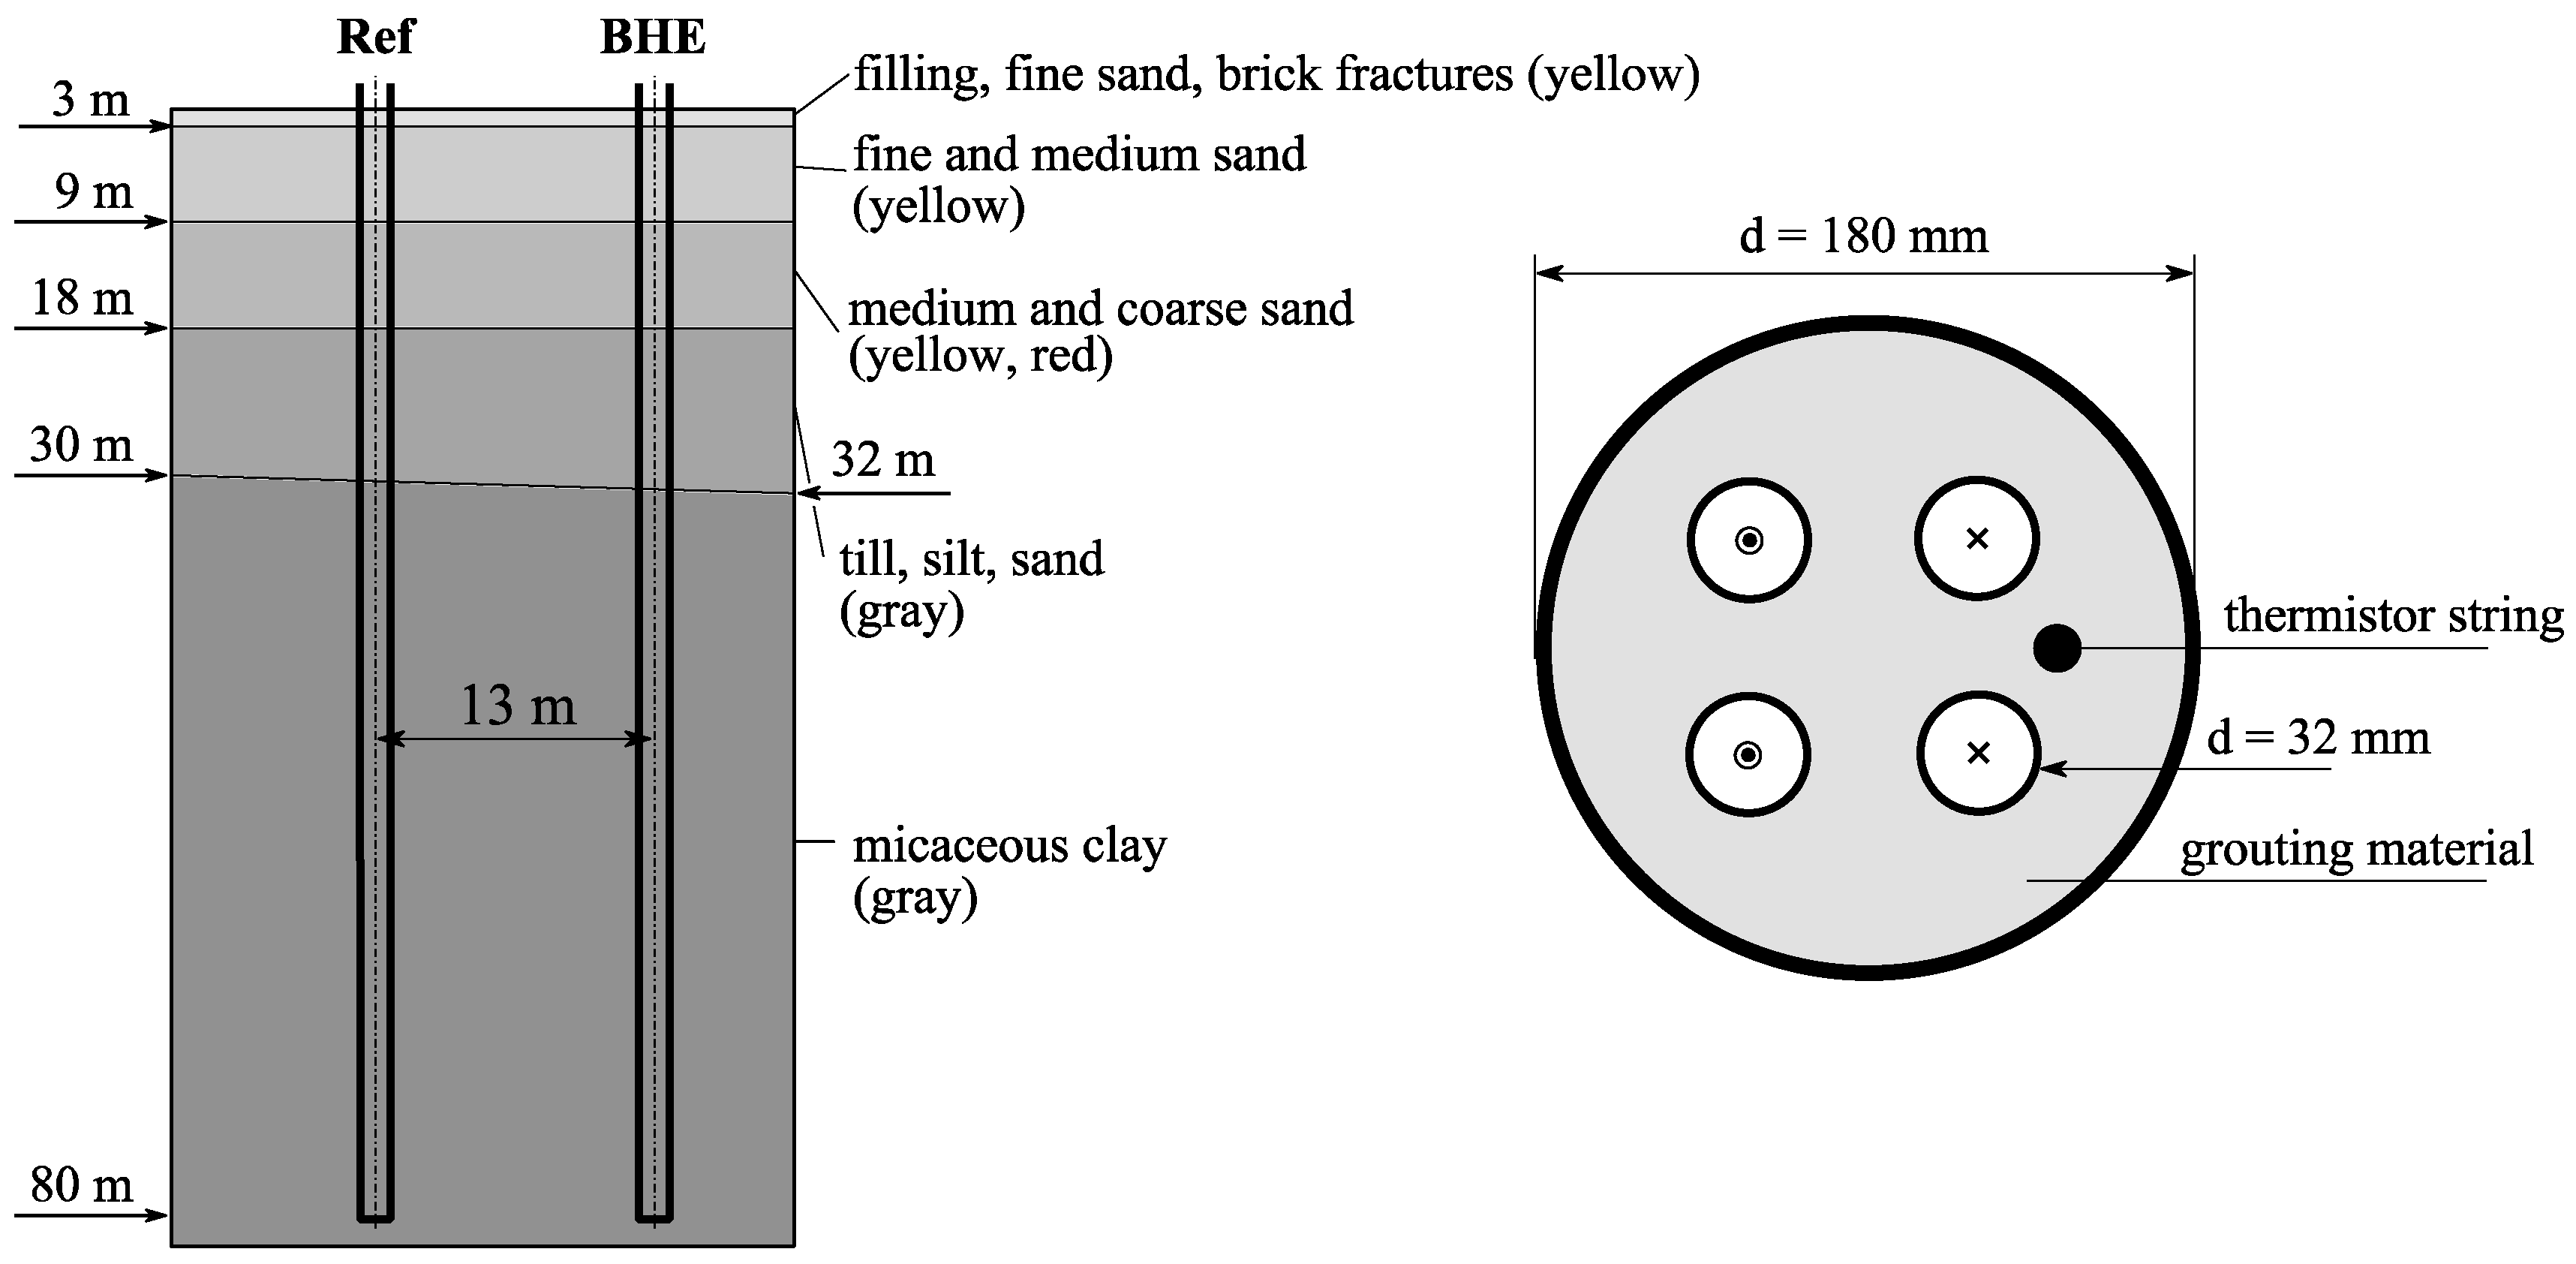
2.2. Geothermal System
2.3. Data Acquisition
3. Results and Discussion
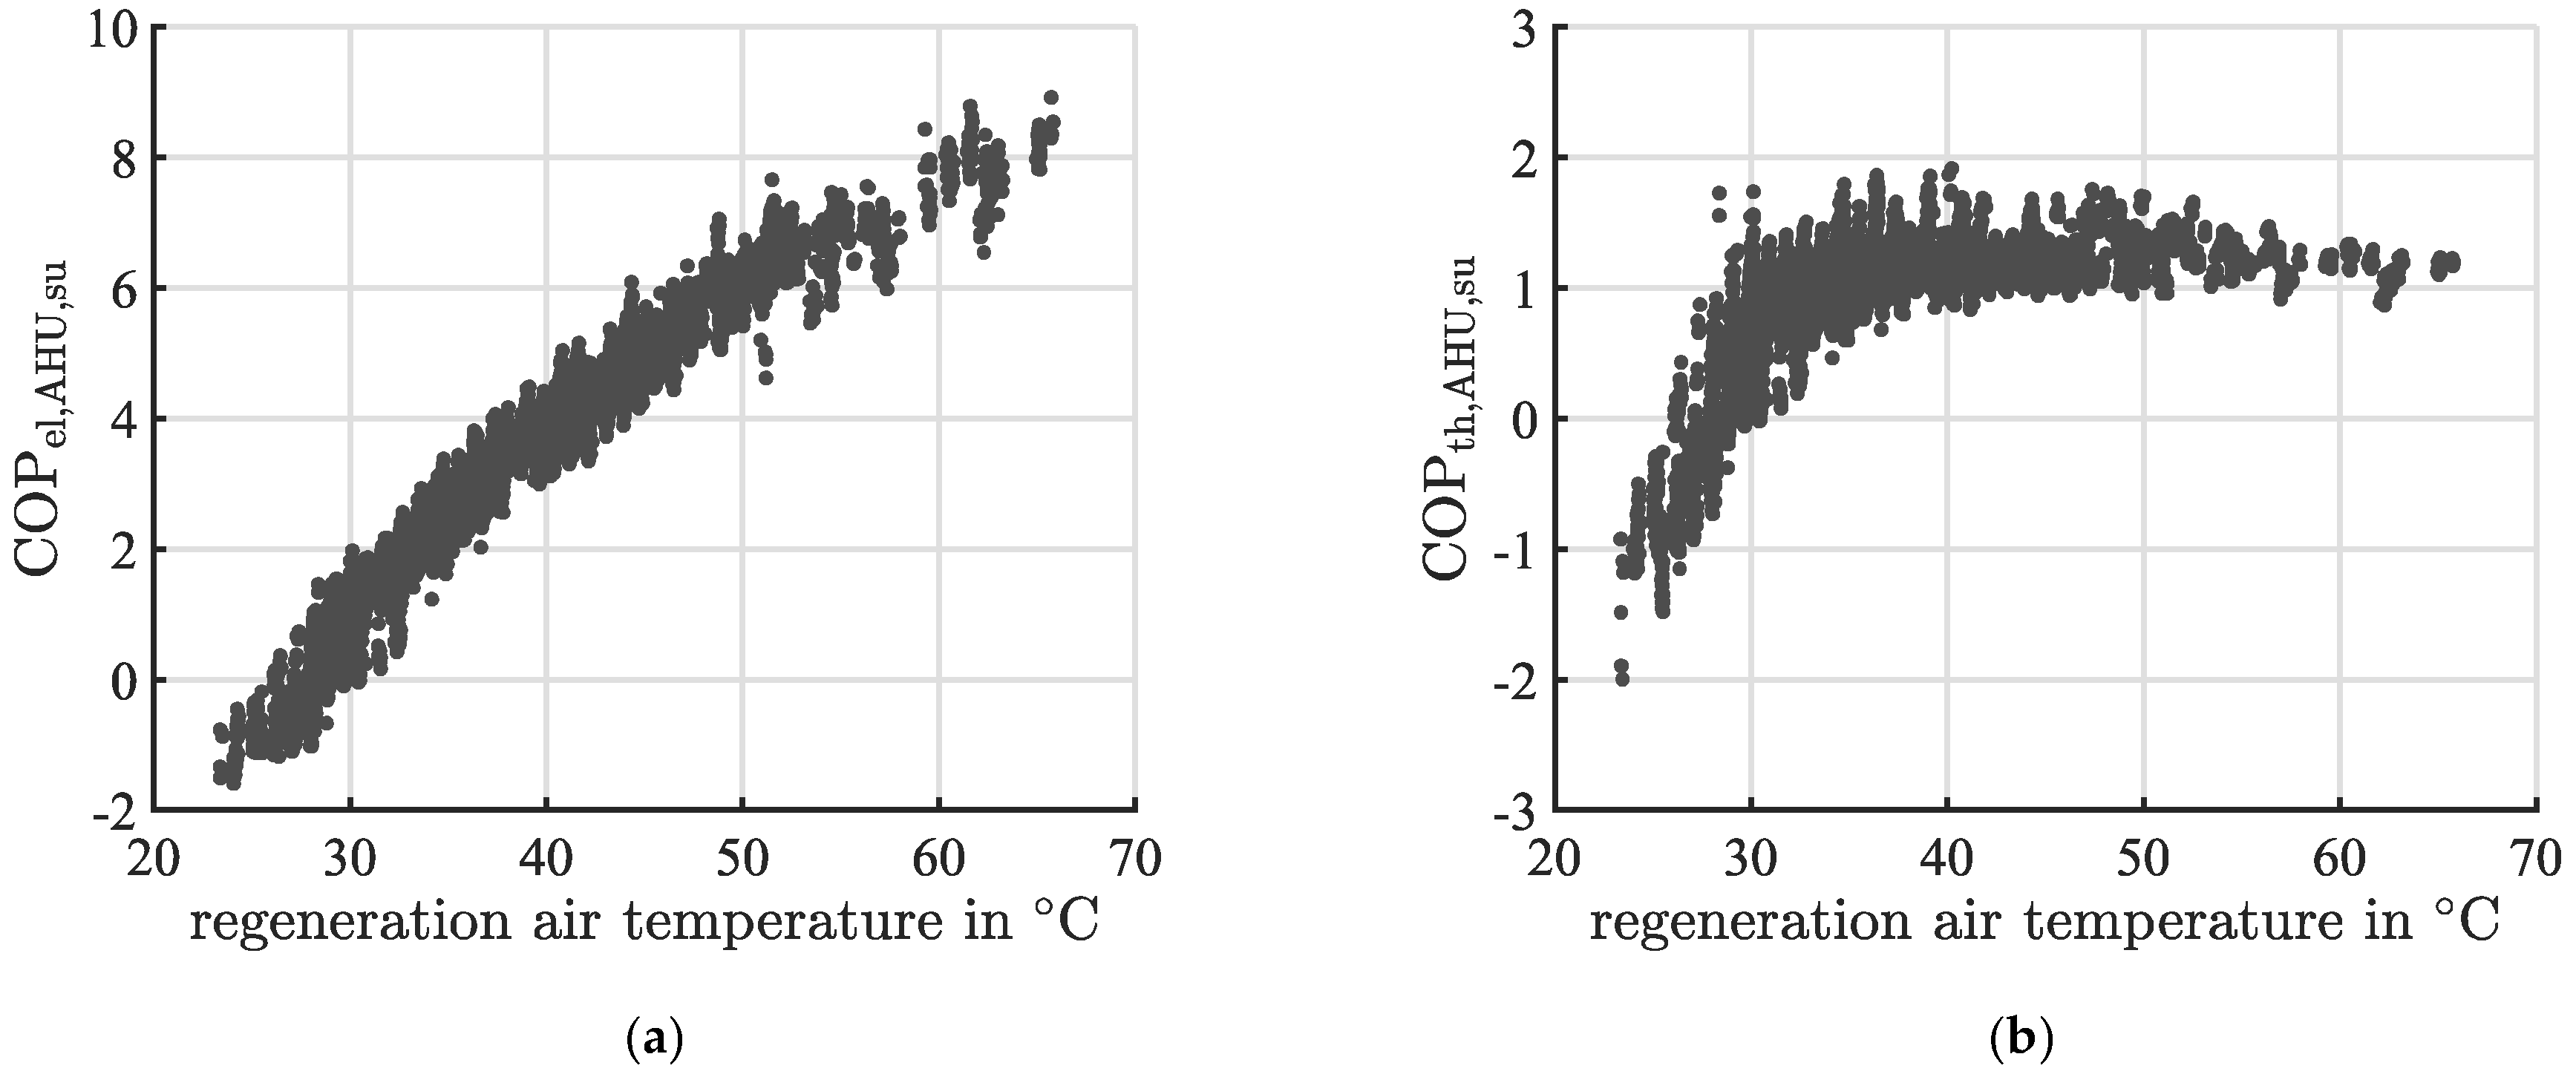
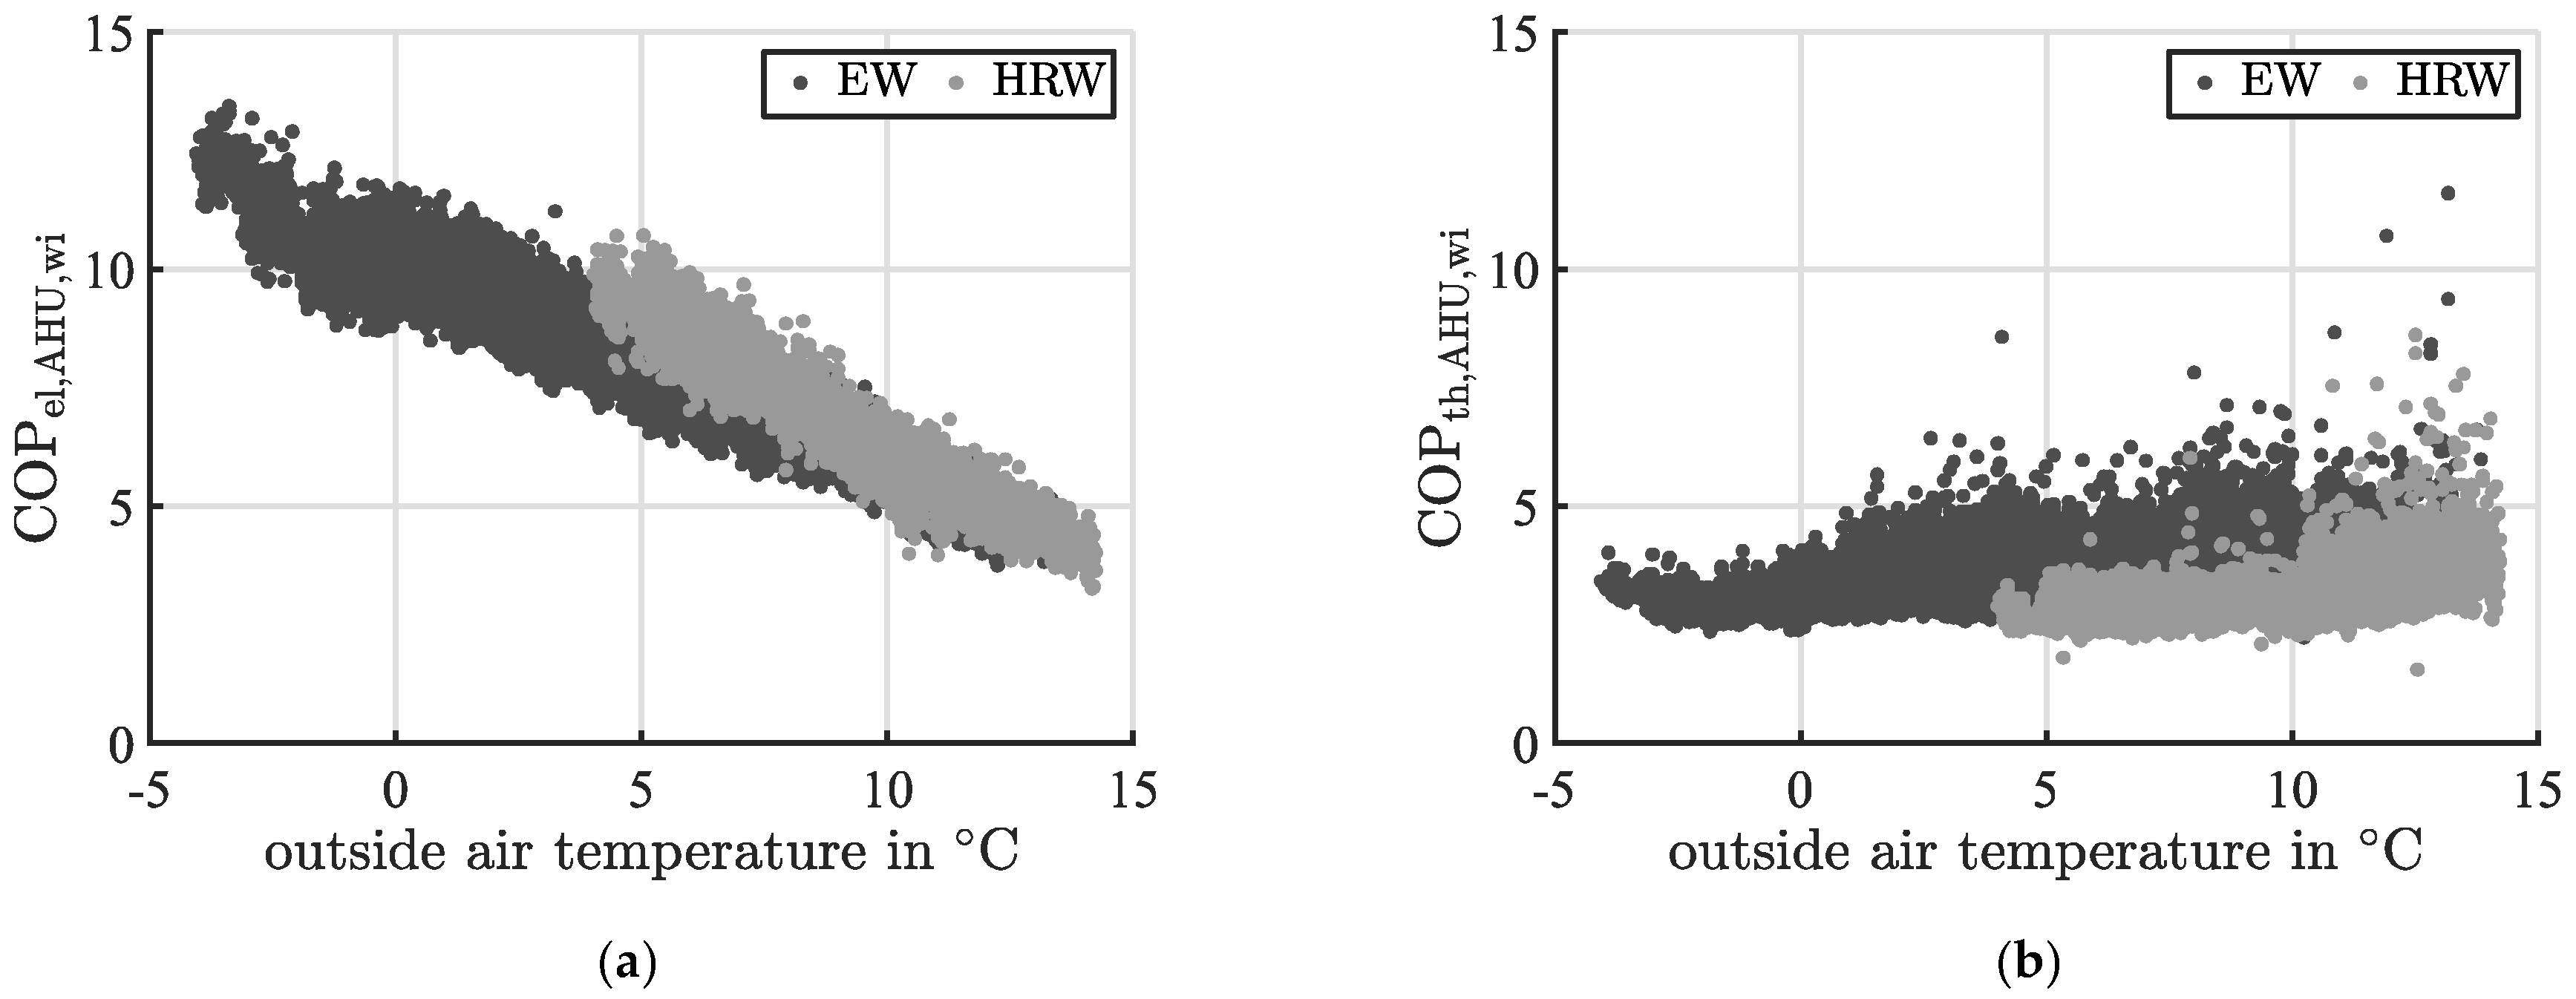
3.1. Performance Evaluation of the Air Conditioning System
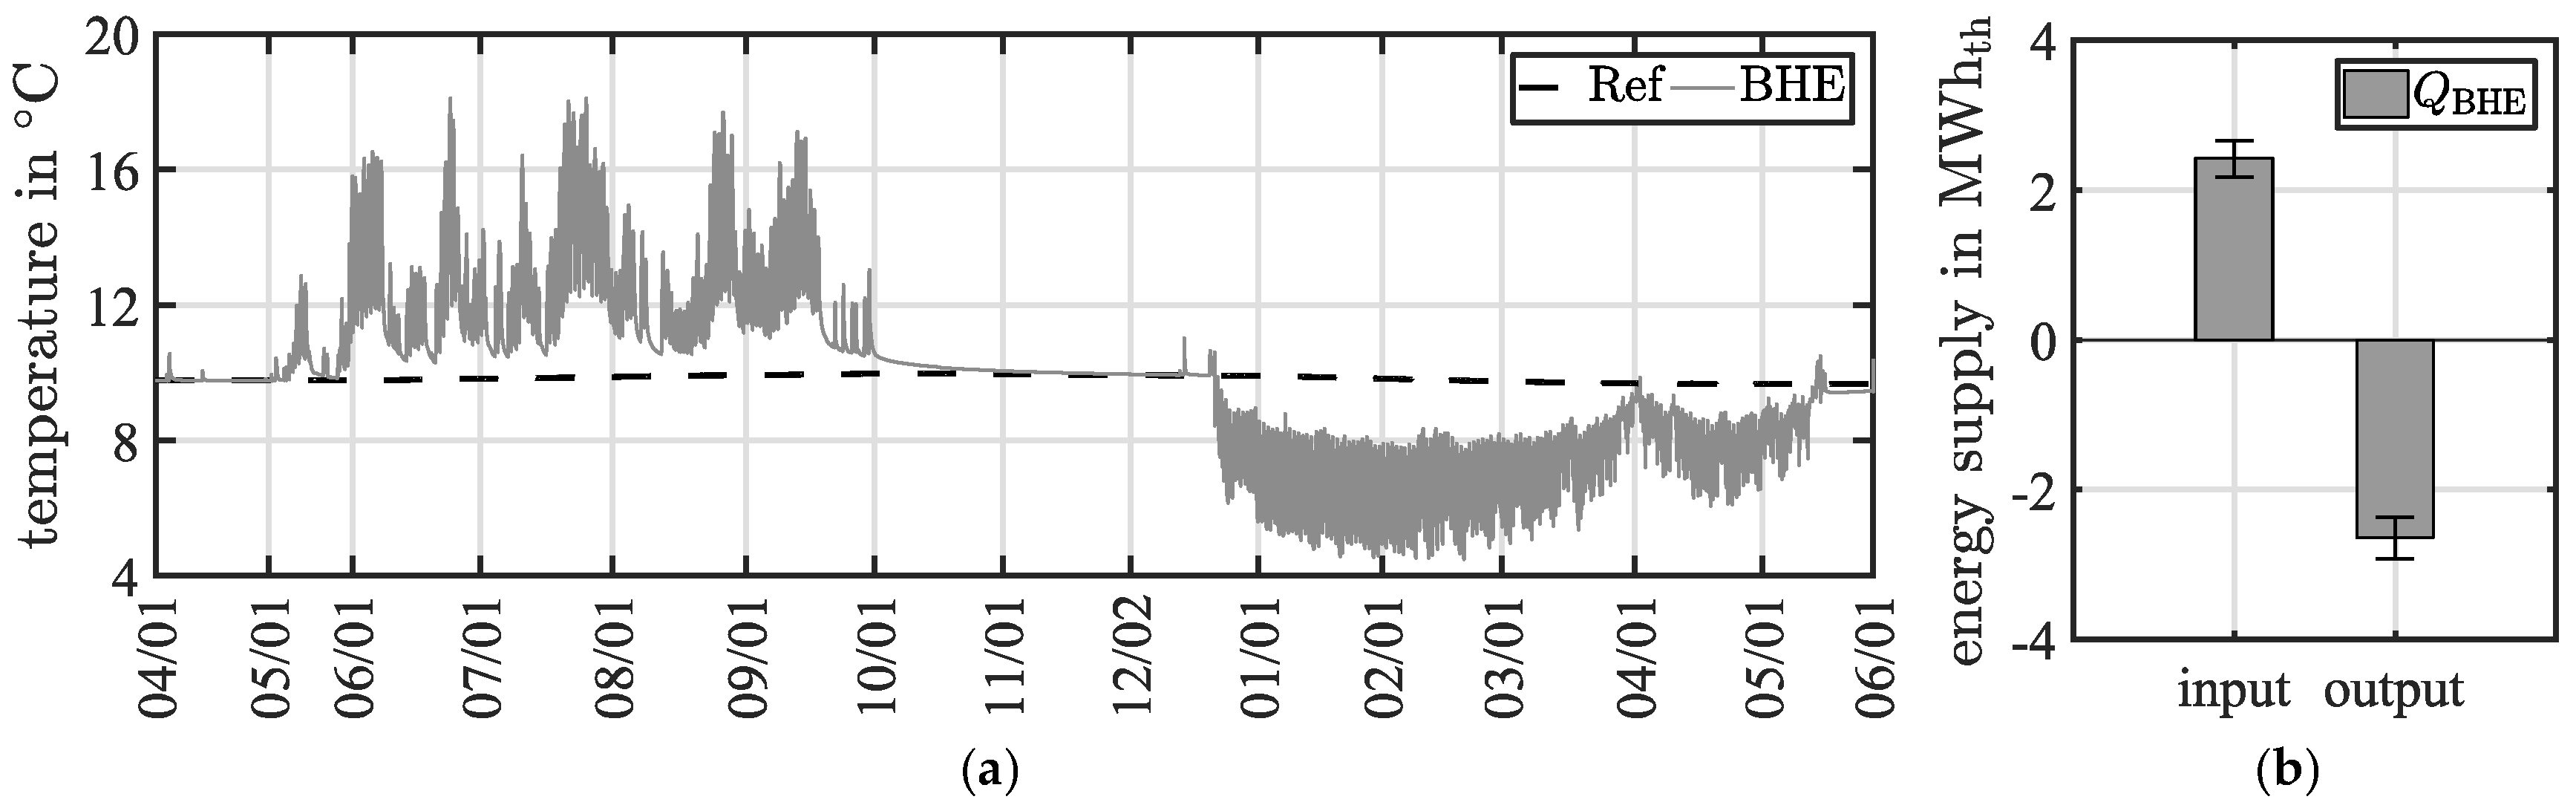
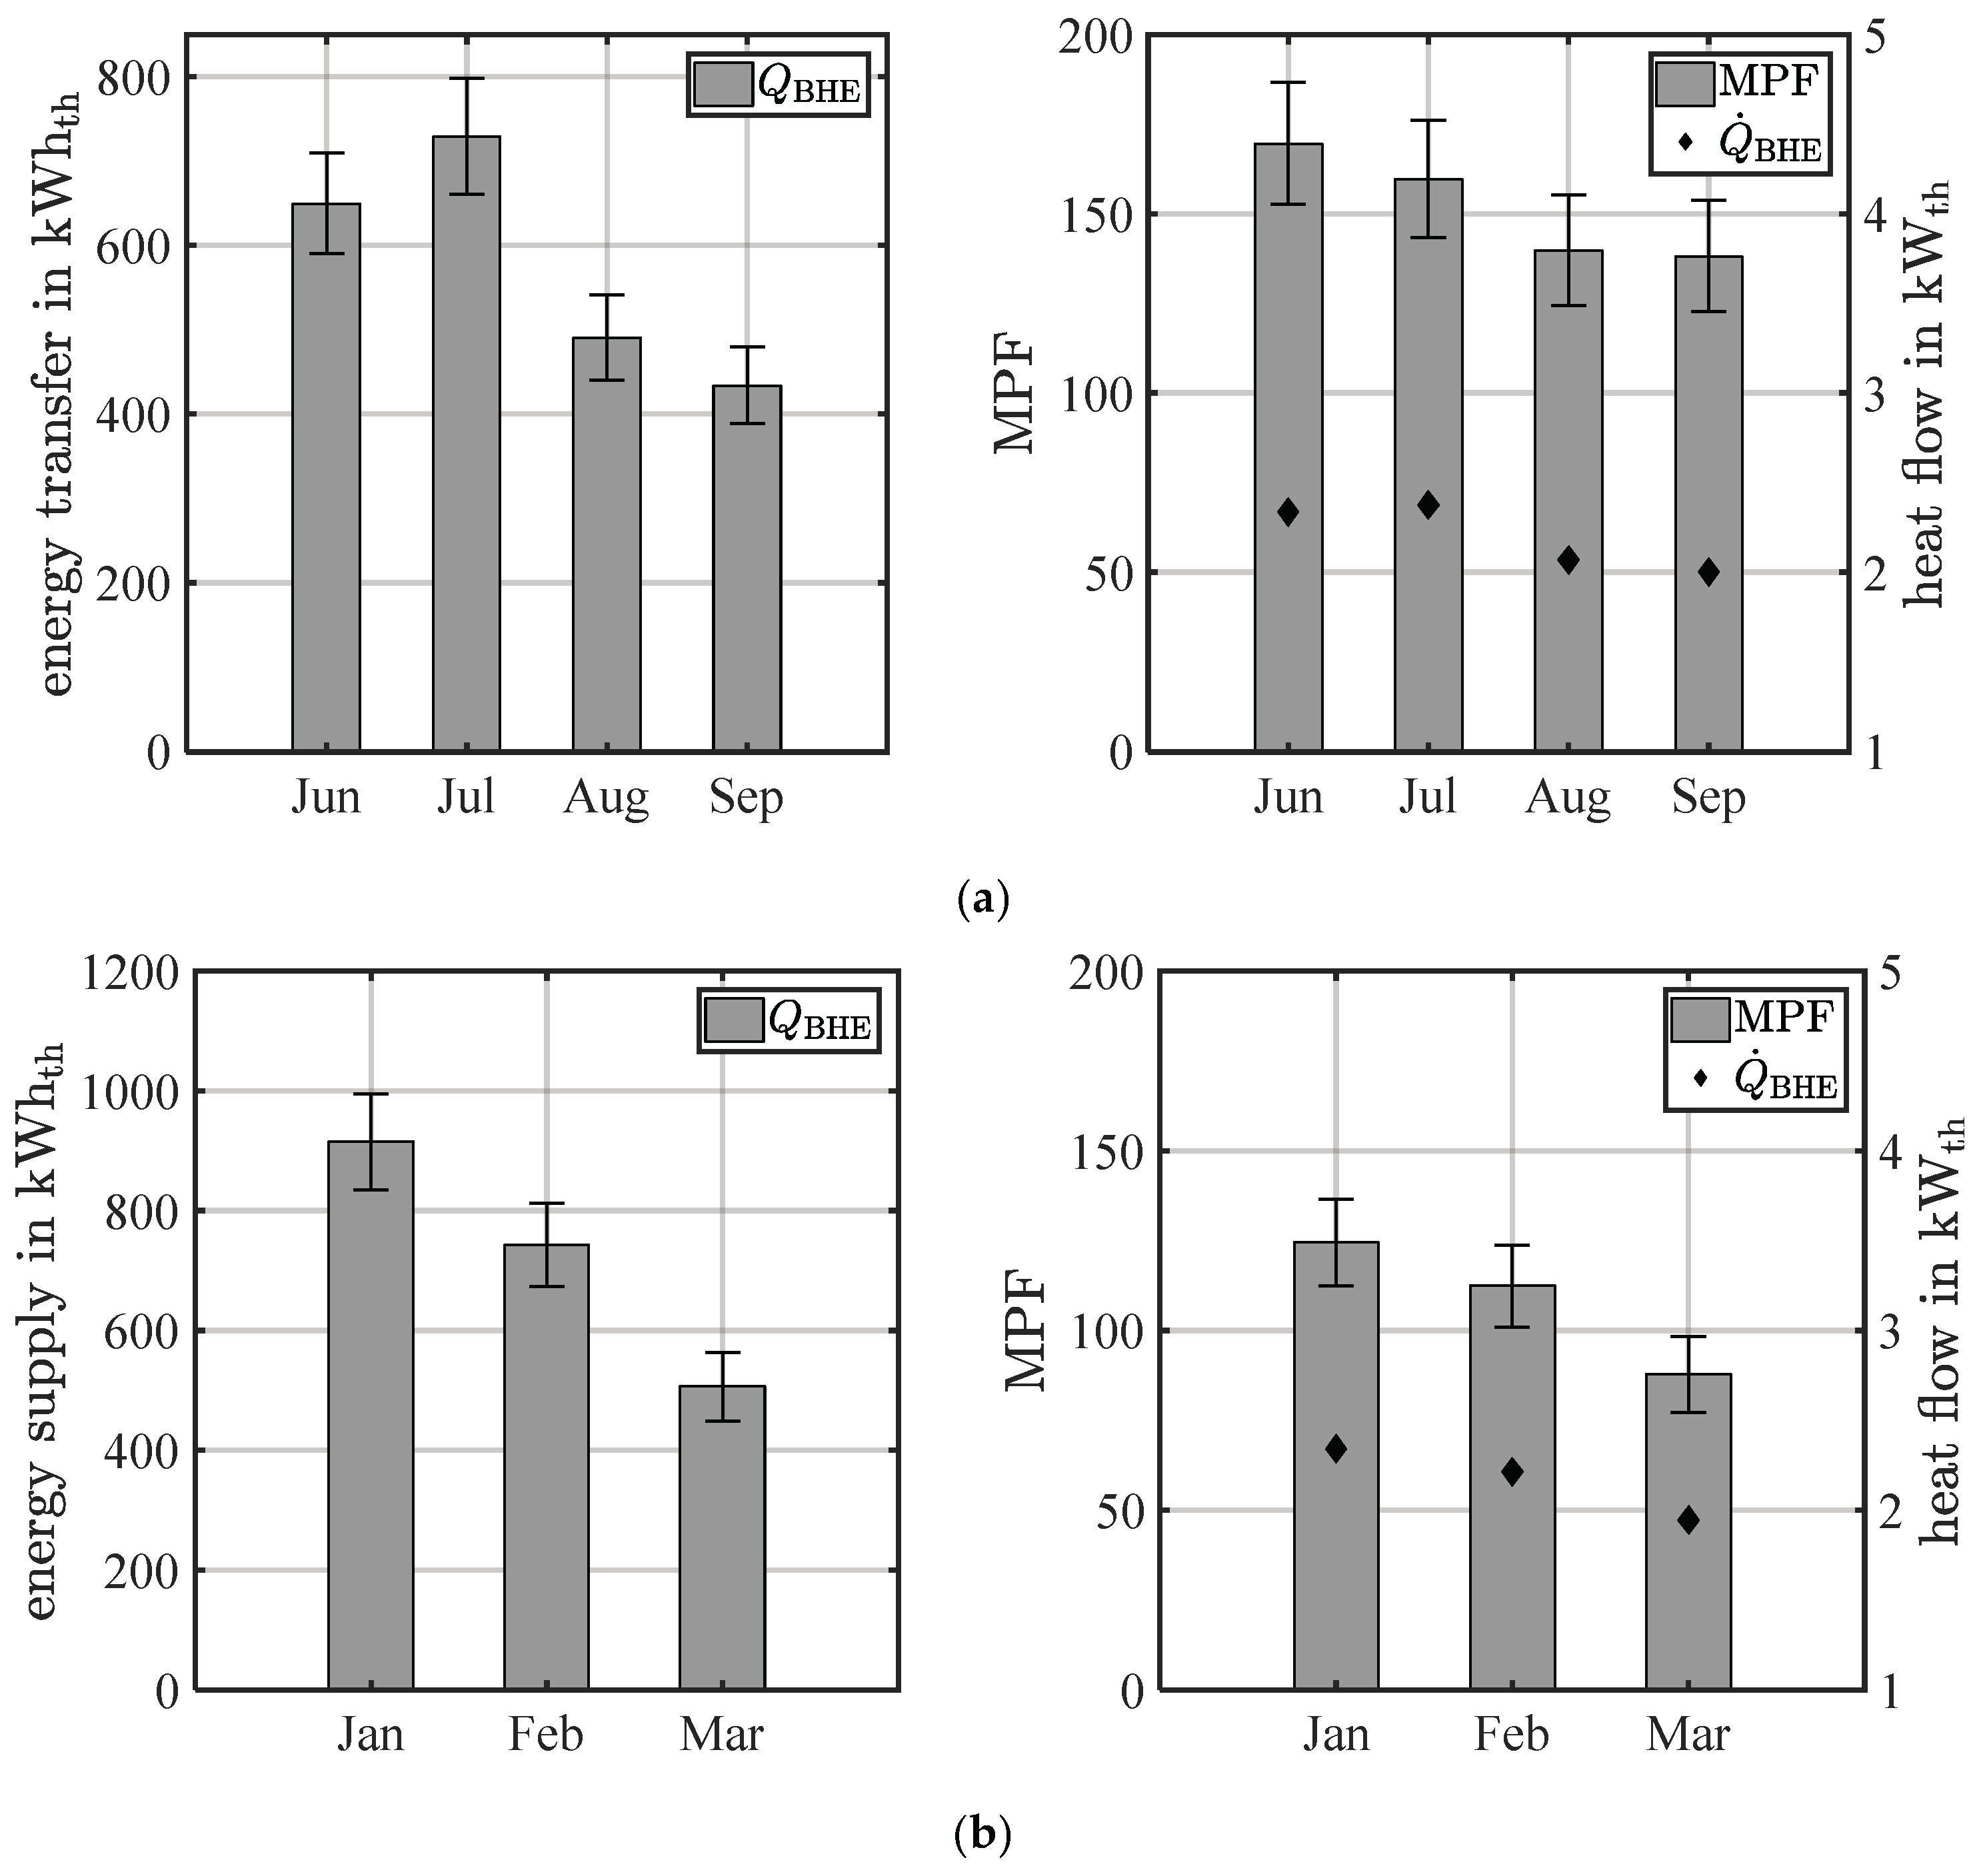
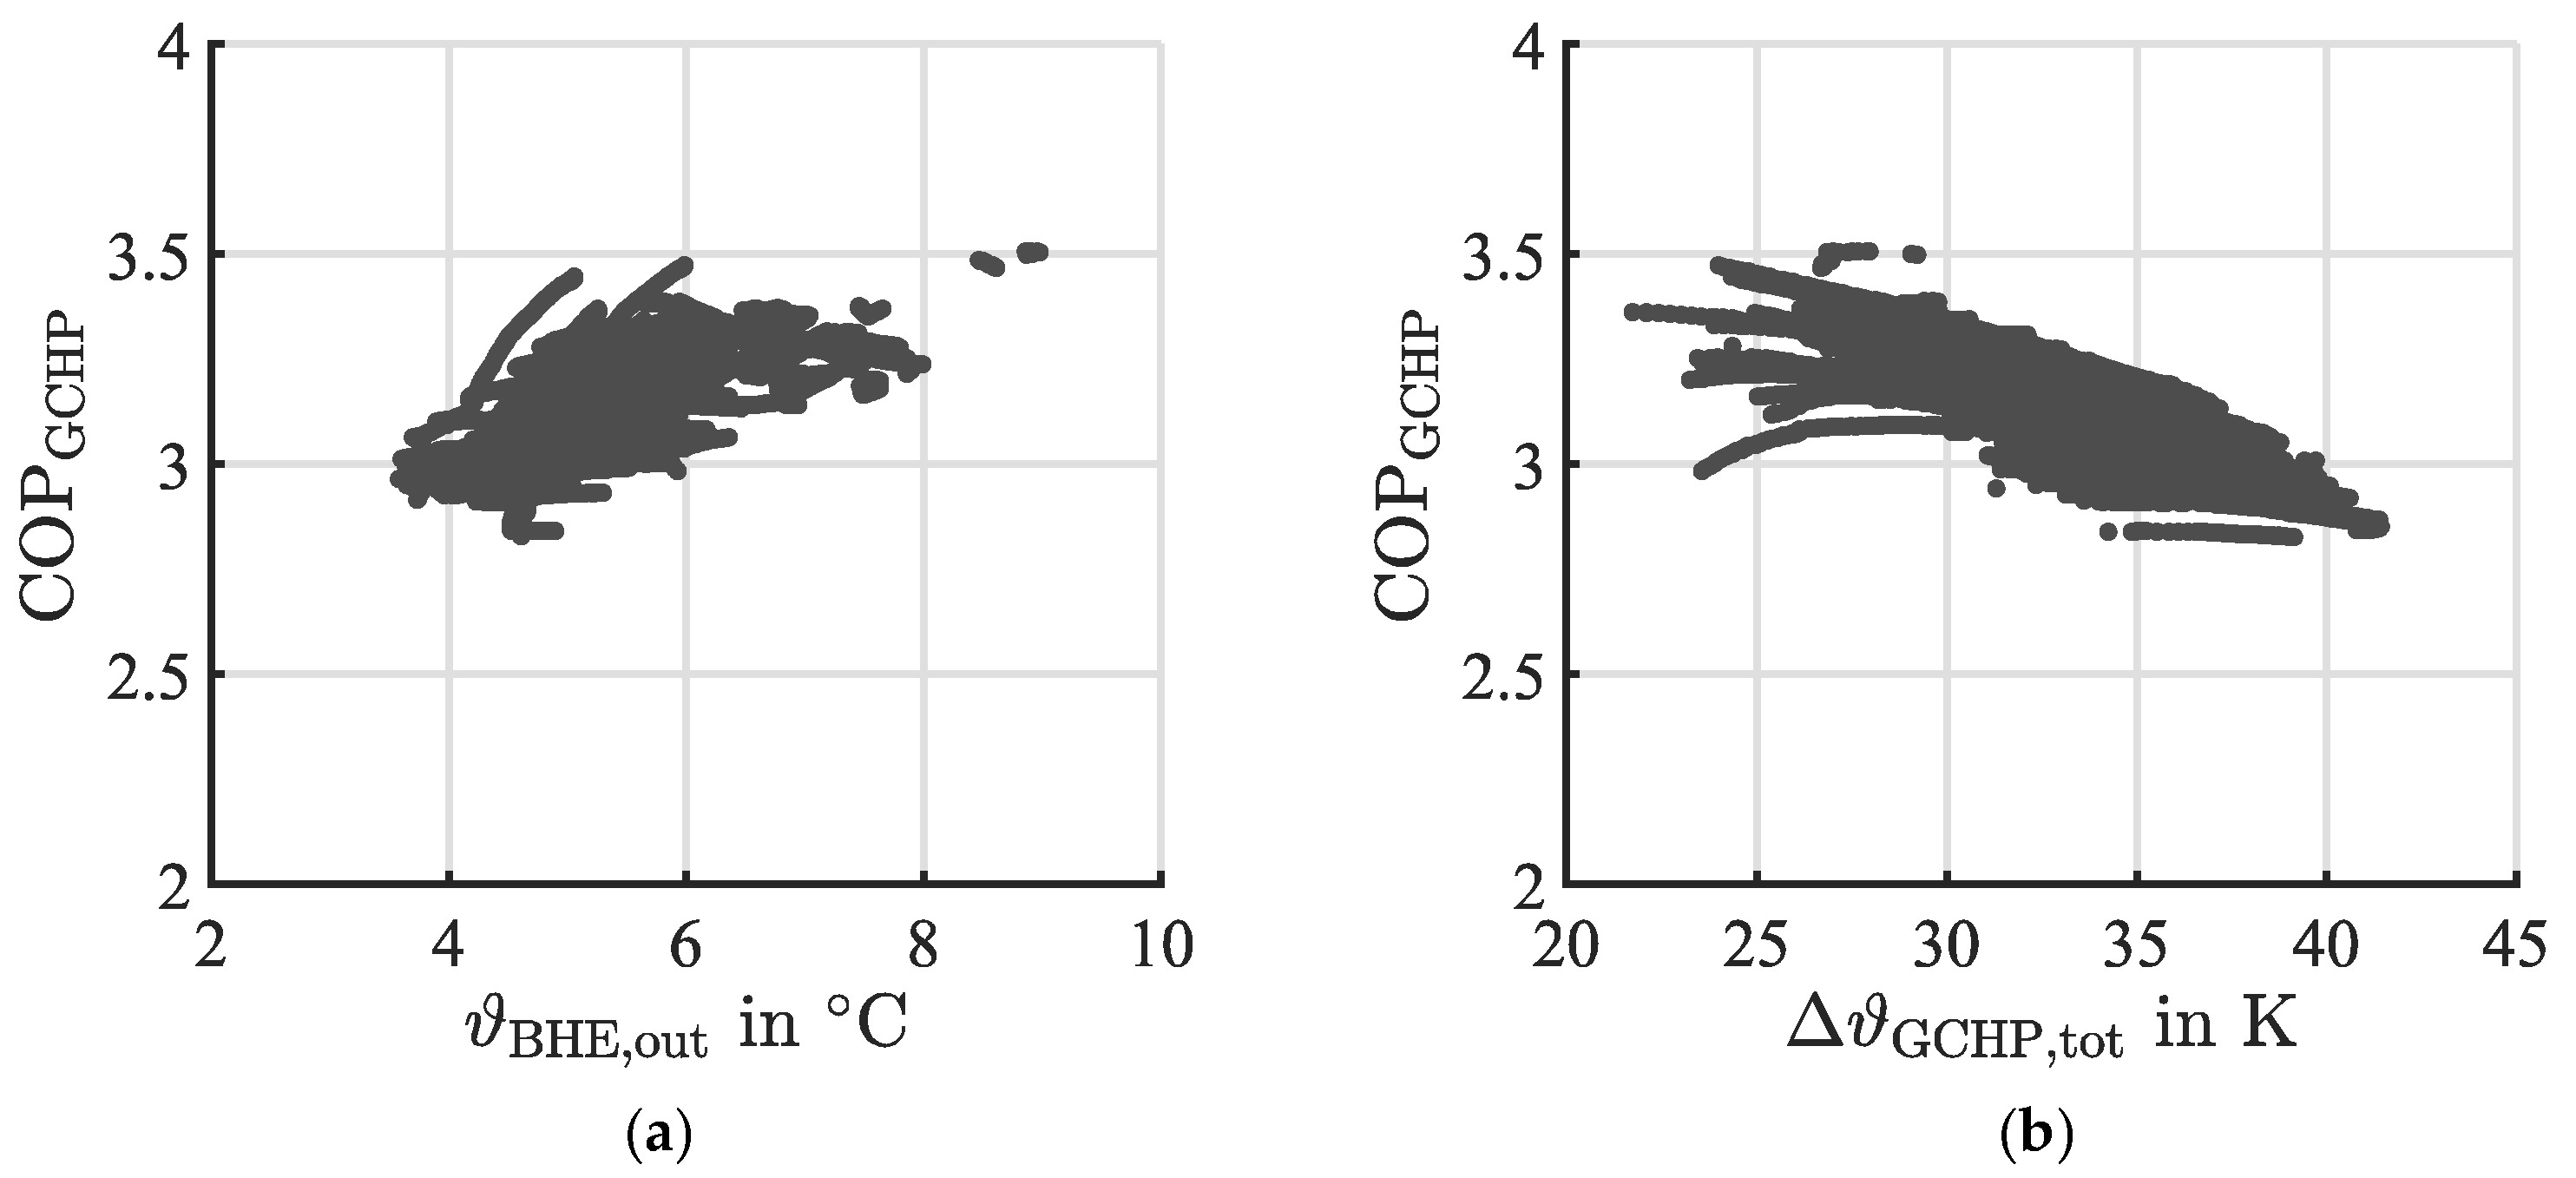
3.2. Performance Evaluation of the Geothermal System
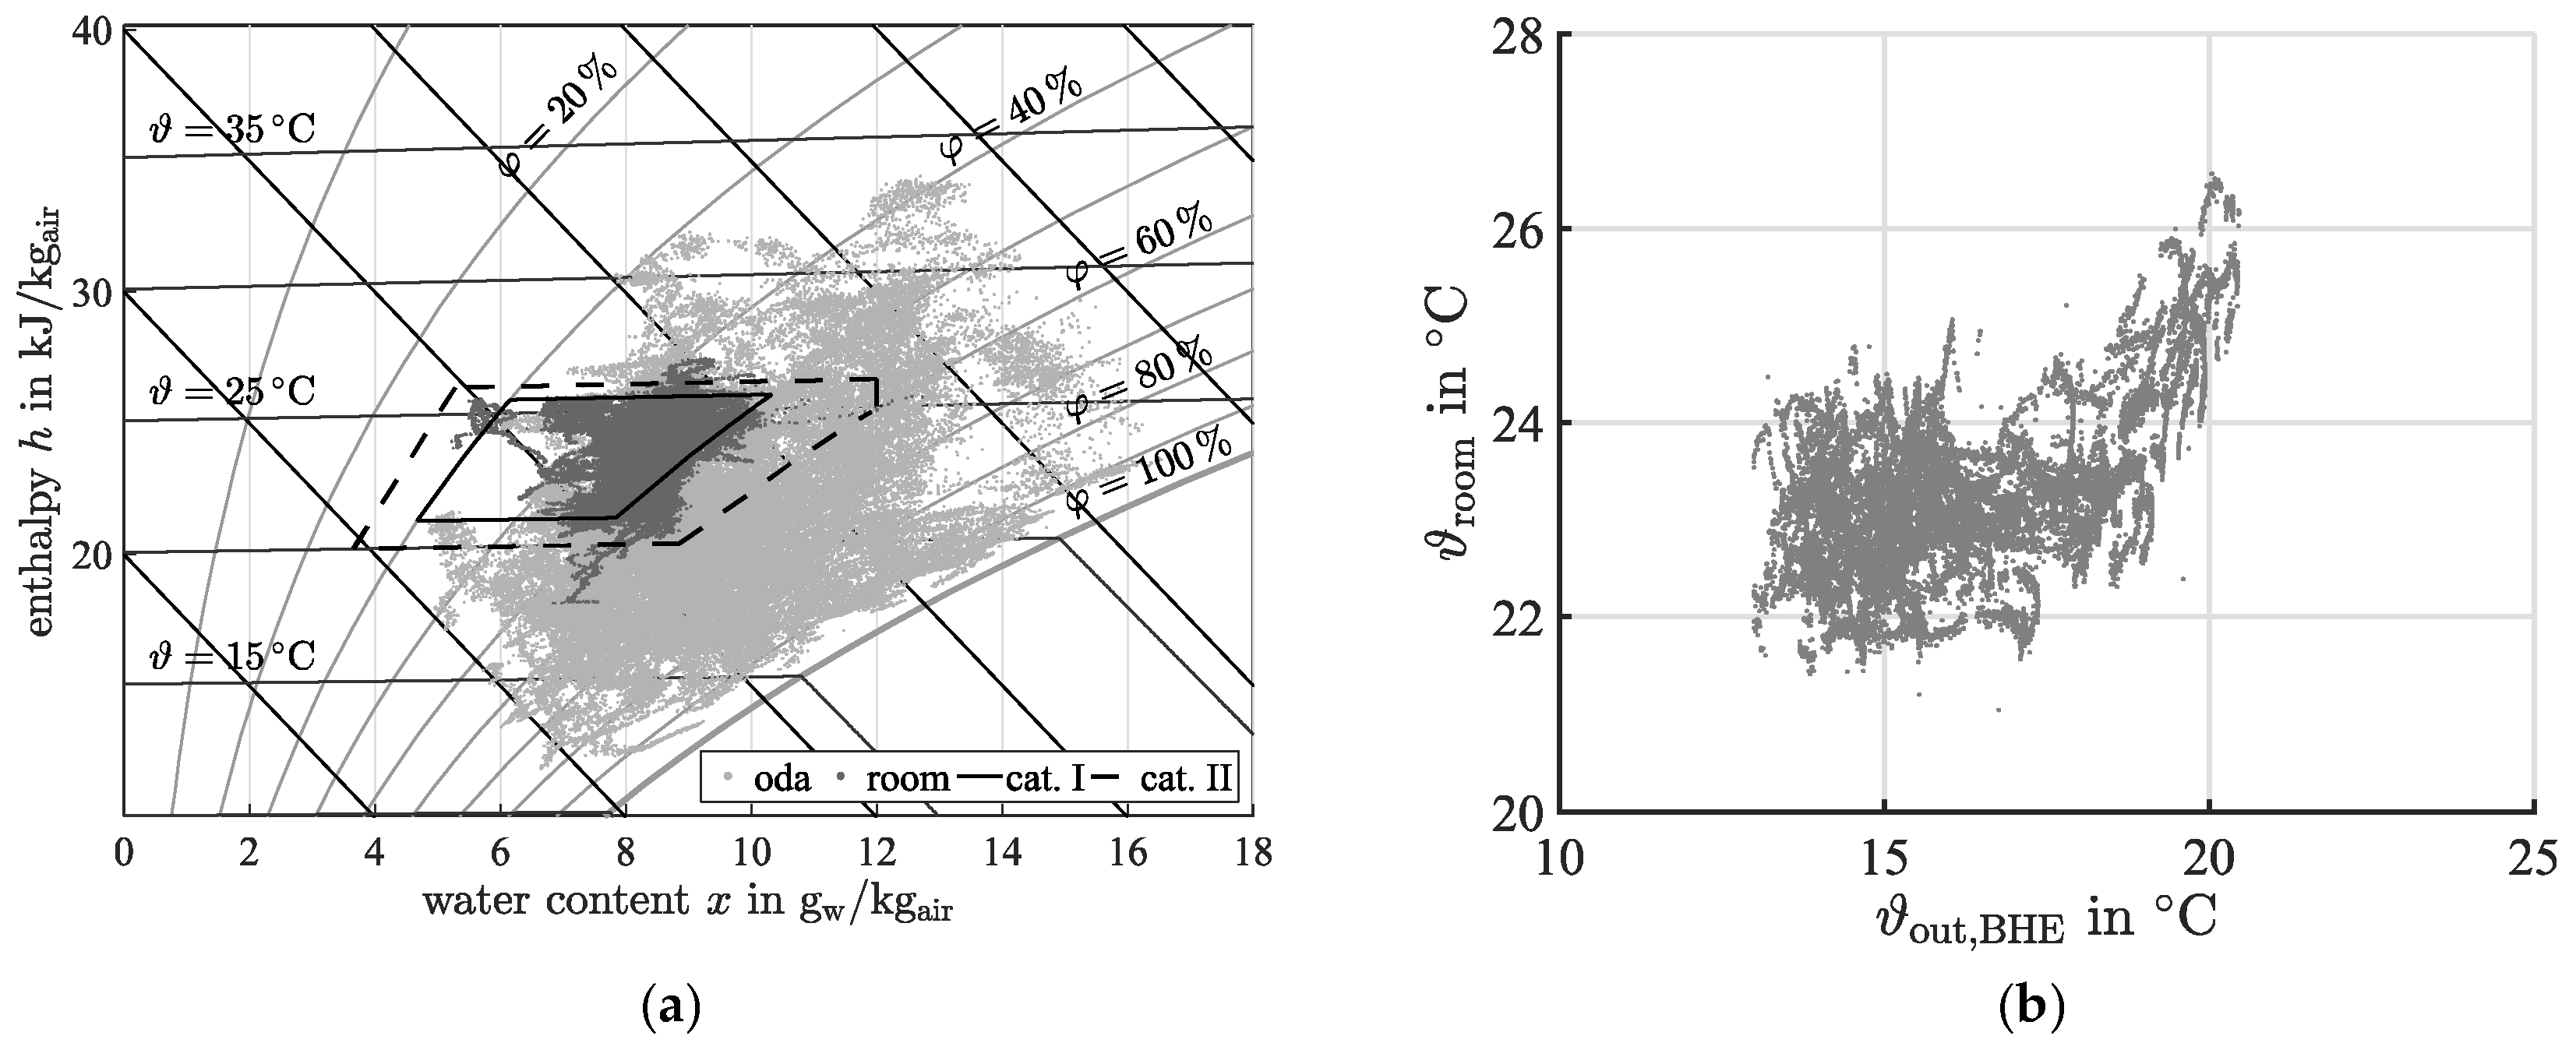
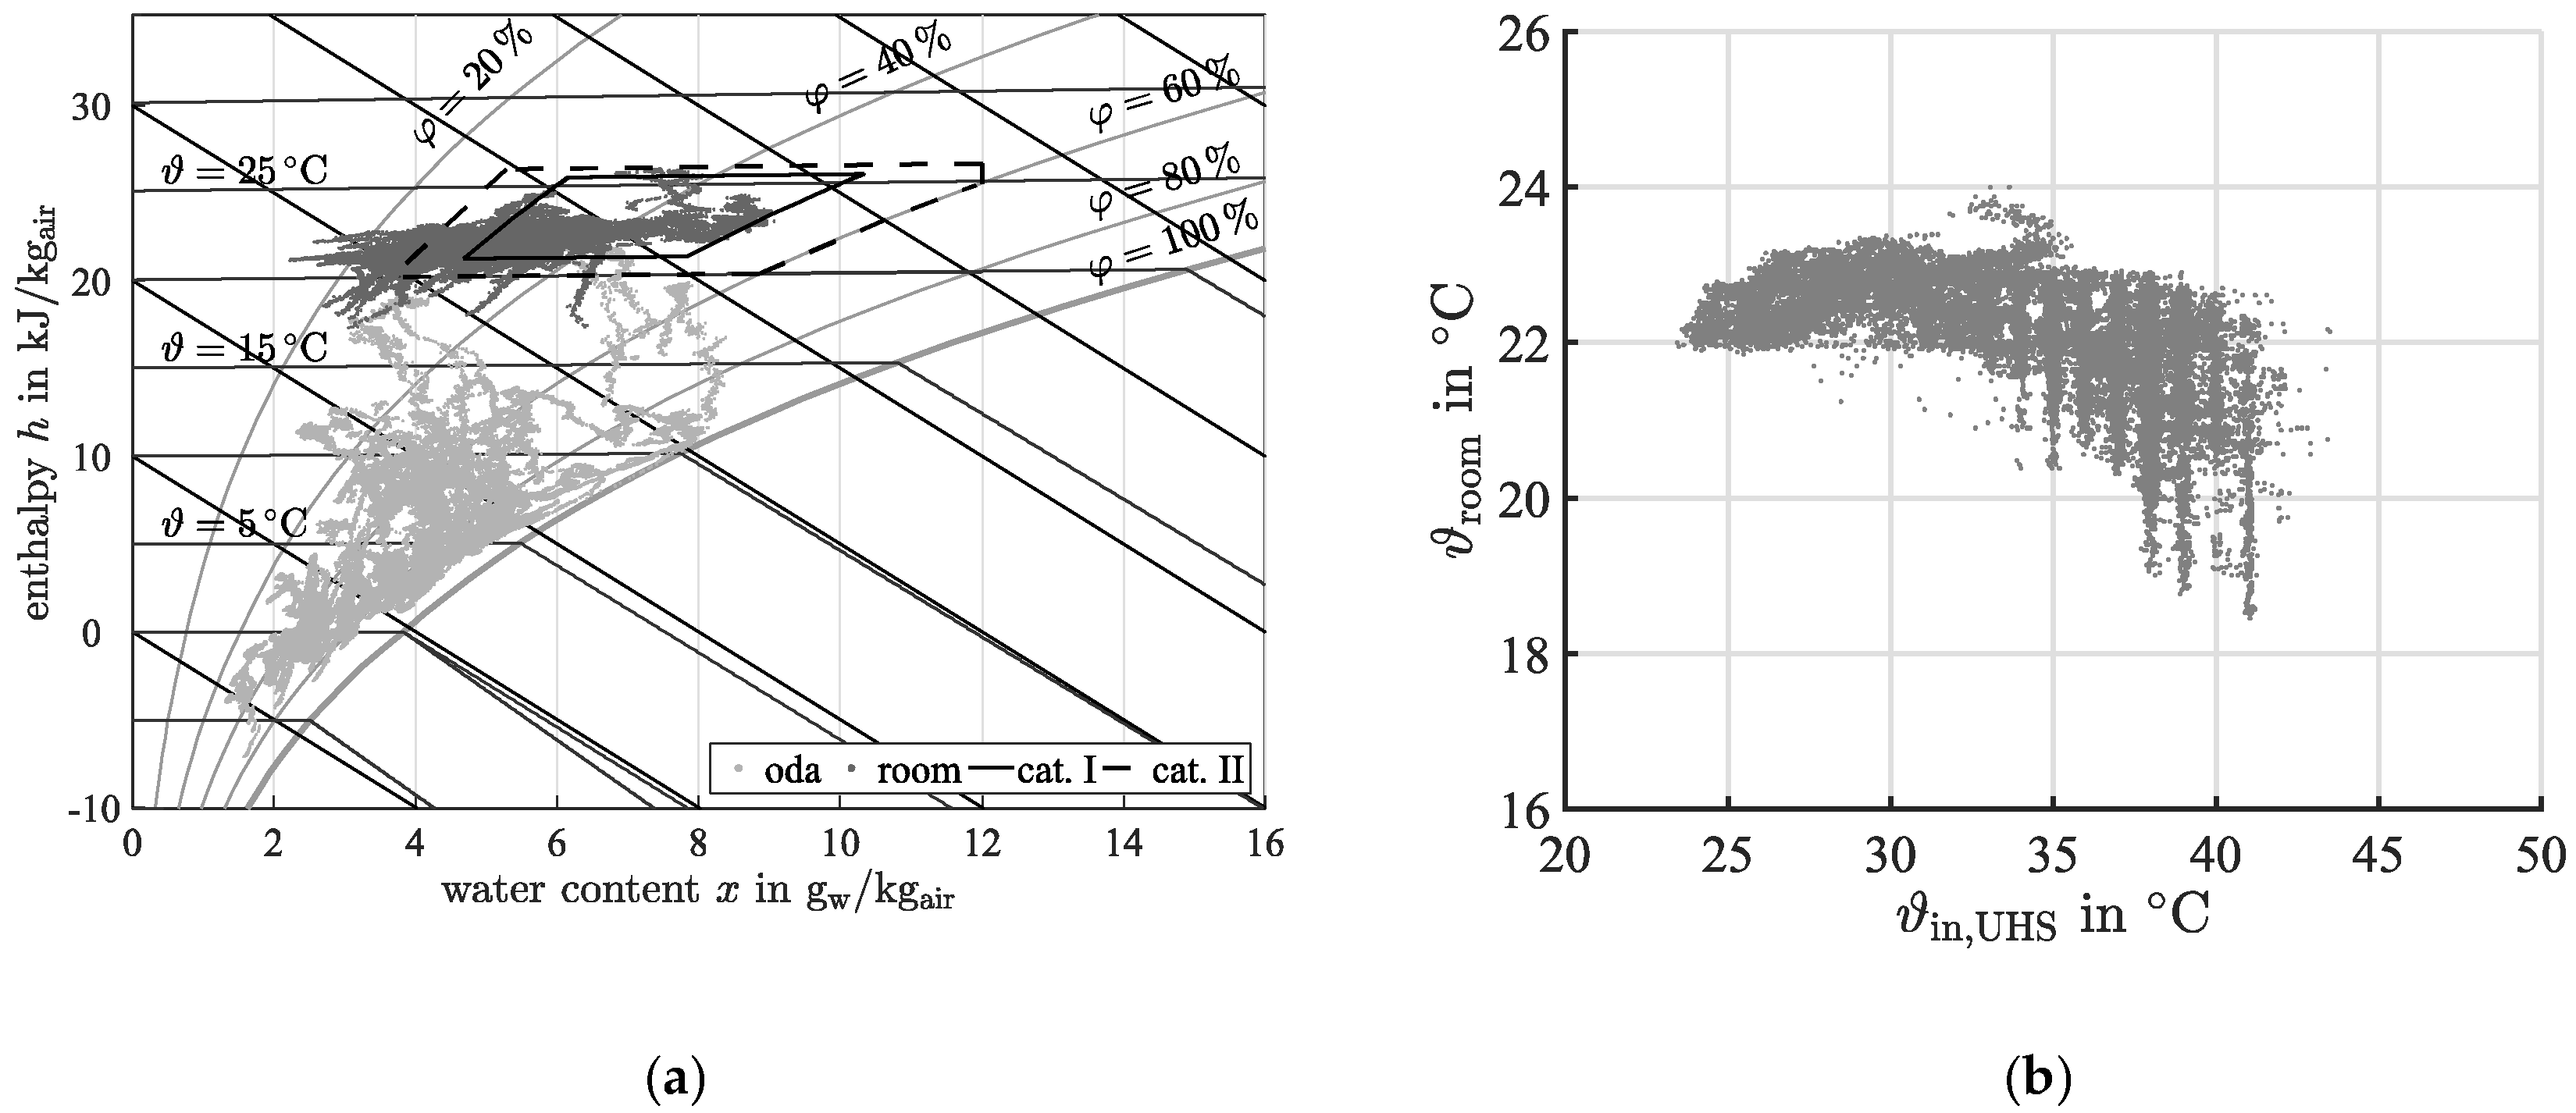
3.3. Evaluation of Thermal Comfort
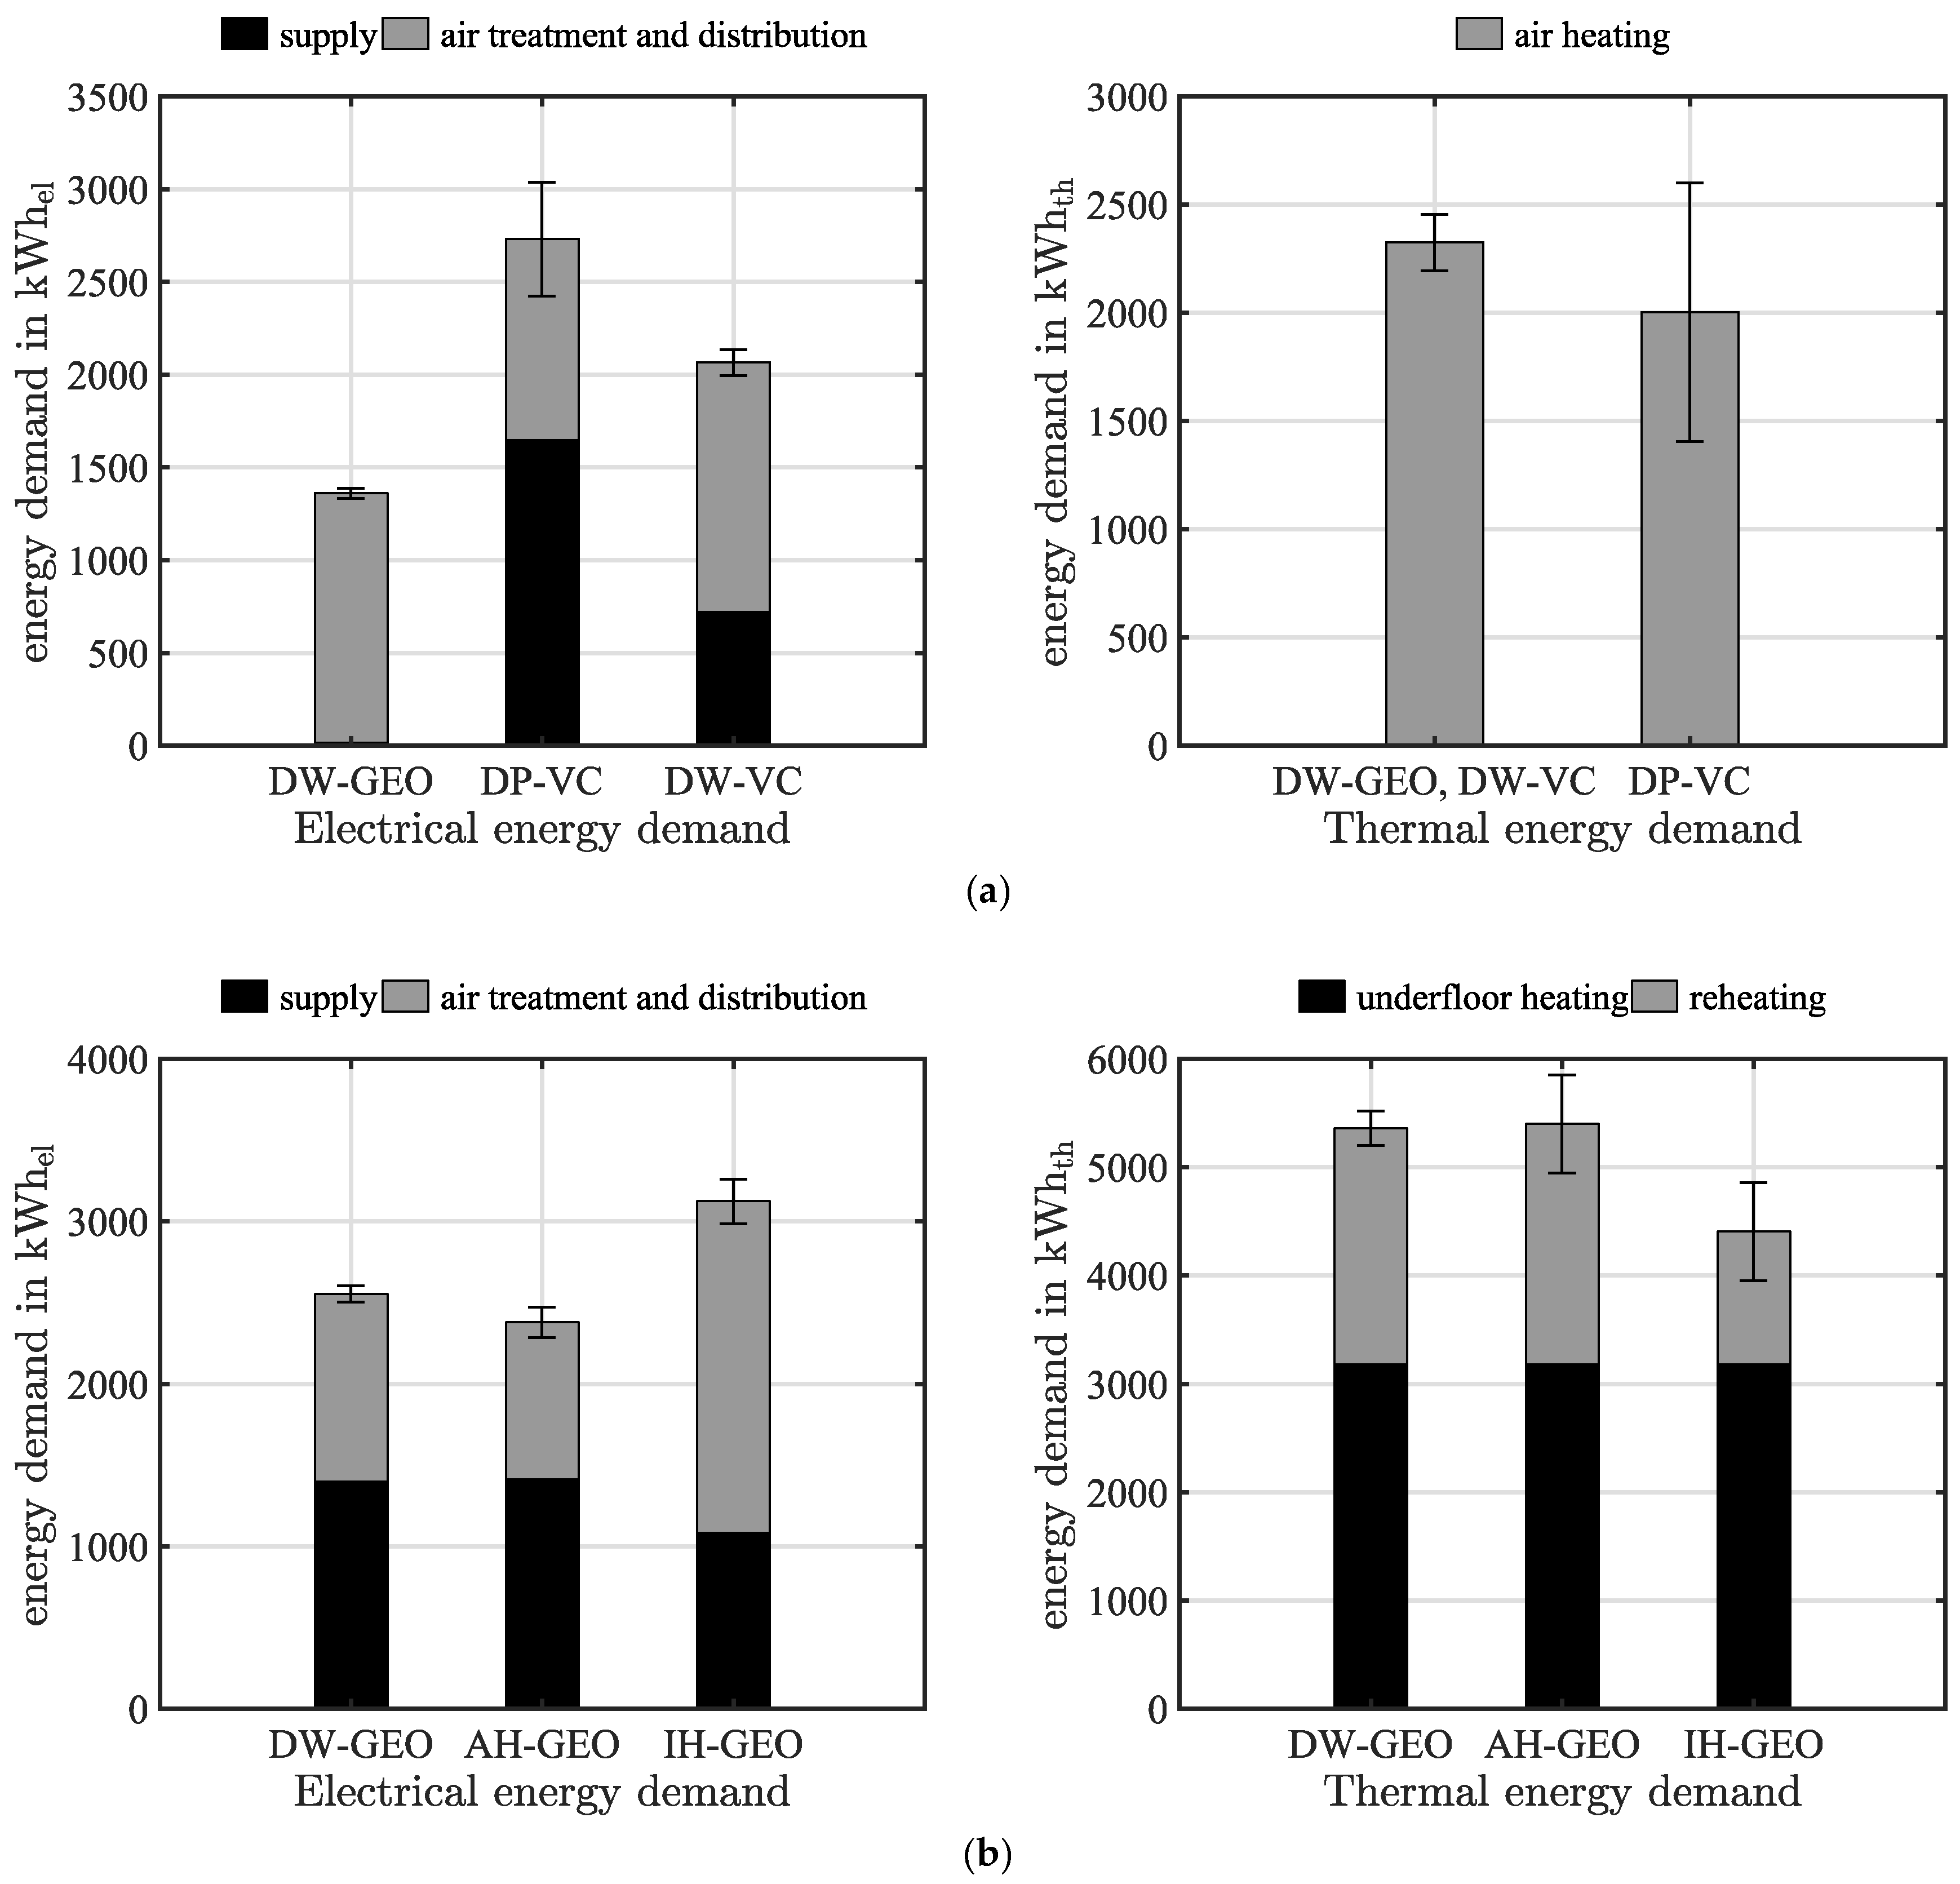
3.4. System Comparison
4. Conclusions
Author Contributions
Funding
Conflicts of Interest
Nomenclature
| Latin symbols | |
| A | area, m2 |
| cp | specific heat capacity, J·kg−1·K−1 |
| COP | coefficient of performance, dimensionless value |
| d | diameter, m |
| DCOP | dehumidification efficiency, dimensionless value |
| h | specific enthalpy, J·kg−1 |
| mass flow, kg·s−1 | |
| MPF | monthly performance factor, dimensionless value |
| P | electrical power, W |
| thermal energy, J | |
| thermal power, W | |
| r0 | specific evaporation enthalpy, J·kg−1 |
| SPF | seasonal performance factor, dimensionless value |
| volume flow, m3·s−1 | |
| W | electrical energy, J |
| x | water content, |
| Greek symbols | |
| temperature, °C | |
| thermal conductivity, | |
| time, | |
| relative humidity, | |
| heat recovery efficiency, dimensionless value | |
| moisture recovery efficiency, dimensionless value | |
| Dimensionless values | |
| difference | |
| averaged quantity, dimensionless value | |
| Subscripts and Abbreviations | |
| AH | air heater |
| AH-GEO | “Adiabatic Humidification and GEOthermal system”, reference system with adiabatic humidification and heat pump (winter) |
| AHU | air handling unit |
| AUX | auxiliary energies |
| BHE | borehole heat exchanger |
| CHP | combined heat and power generation |
| DP-VC | “Dew Point and Vapor Compression chiller”, reference system with vapor compression chiller and dehumidification by cooling below dew point temperature (summer) |
| DW | desiccant wheel |
| DW-GEO | “Desiccant Wheel and GEOthermal system”, investigated system |
| DW-VC | “Desiccant Wheel and Vapor Compression chiller”, reference system with vapor compression chiller and desiccant assisted dehumidification (summer) |
| el | electrical |
| eta | extract air |
| exa | exhaust air |
| EW | enthalpy wheel |
| GCHP | ground-coupled heat pump |
| h | heating |
| HRW | heat recovery wheel |
| HVAC | heating, ventilation and air conditioning |
| IH-GEO | “Isothermal Humidification and GEOthermal system”, reference system with isothermal humidification and heat pump (winter) |
| in | inlet |
| m | month |
| max | maximum |
| min | minimum |
| nom | nominal |
| oda | outside air |
| out | outlet |
| p | period |
| PU | circulation pump |
| Ref | reference |
| RH | reheater |
| set | set point |
| STU | solar thermal unit |
| su | summer |
| sup | supply air |
| th | thermal |
| UHS | underfloor heating system |
| w | water |
| wi | winter |
References
- Davis, L.W.; Gertler, P.J. Contribution of air conditioning adoption to future energy use under global warming. Proc. Natl. Acad. Sci. USA 2015, 112, 5962–5967. [Google Scholar] [CrossRef] [PubMed]
- International Energy Agency. The Future of Cooling—Opportunities for Energy-Efficient Air Conditioning. Available online: https://webstore.iea.org/the-future-of-cooling (accessed on 20 March 2019).
- International Energy Agency. Energy Technology Perspectives 2010—Scenarios & Strategies to 2050. Available online: https://webstore.iea.org/energy-technology-perspectives-2010 (accessed on 20 March 2019).
- Isaac, M.; Van Vuuren, D.P. Modeling global residential sector energy demand for heating and air conditioning in the context of climate change. Energy Policy 2009, 37, 507–521. [Google Scholar] [CrossRef]
- Enteria, N.; Mizutani, K. The role of the thermally activated desiccant cooling technologies in the issue of energy and environment. Renew. Sustain. Energy Rev. 2011, 15, 2095–2122. [Google Scholar] [CrossRef]
- Vakiloroaya, V.; Samali, B.; Fakhar, A.; Pishghadam, K. A review of different strategies for HVAC energy saving. Energy Convers. Manag. 2014, 77, 738–754. [Google Scholar] [CrossRef]
- Shehadi, M. Review on humidity control technologies in buildings. J. Build. Eng. 2018, 19, 539–551. [Google Scholar] [CrossRef]
- Jani, D.B.; Mishra, M.; Sahoo, P.K. Solid desiccant air conditioning—A state of the art review. Renew. Sustain. Energy Rev. 2016, 60, 1451–1469. [Google Scholar] [CrossRef]
- Kojok, F.; Fardoun, F.; Younes, R.; Outbib, R. Hybrid cooling systems: A review and an optimized selection scheme. Renew. Sustain. Energy Rev. 2016, 65, 57–80. [Google Scholar] [CrossRef]
- Ge, T.S.; Dai, Y.J.; Wang, R.Z. Review on solar powered rotary desiccant wheel cooling system. Renew. Sustain. Energy Rev. 2014, 39, 476–497. [Google Scholar] [CrossRef]
- La, D.; Dai, Y.J.; Li, Y.; Wang, R.Z.; Ge, T.S. Technical development of rotary desiccant dehumidification and air conditioning: A review. Renew. Sustain. Energy Rev. 2010, 14, 130–147. [Google Scholar] [CrossRef]
- Al-Alili, A.; Hwang, Y.; Radermacher, R. Performance of a desiccant wheel cycle utilizing new zeolite material: Experimental investigation. Energy 2015, 81, 137–145. [Google Scholar] [CrossRef]
- Eicker, U.; Schürger, U.; Köhler, M.; Ge, T.; Dai, Y.; Li, H.; Wang, R. Experimental investigations on desiccant wheels. Appl. Therm. Eng. 2012, 42, 71–80. [Google Scholar] [CrossRef]
- Ruivo, C.R.; Angrisani, G.; Minichiello, F. Influence of the rotational speed on the effectiveness parameters of a desiccant wheel: An assessment using experimental data and manufacturer software. Renew. Energy 2015, 76, 484–493. [Google Scholar] [CrossRef]
- Angrisani, G.; Minichiello, F.; Sasso, M. Improvements of an unconventional desiccant air conditioning system based on experimental investigations. Energy Convers. Manag. 2016, 112, 423–434. [Google Scholar] [CrossRef]
- Chen, C.-H.; Hsu, C.-Y.; Chen, C.-C.; Chiang, Y.-C.; Chen, S.-L. Silica gel/polymer composite desiccant wheel combined with heat pump for air-conditioning systems. Energy 2016, 94, 87–99. [Google Scholar] [CrossRef]
- Angrisani, G.; Roselli, C.; Sasso, M. Experimental assessment of the energy performance of a hybrid desiccant cooling system and comparison with other air-conditioning technologies. Appl. Energy 2015, 138, 533–545. [Google Scholar] [CrossRef]
- Al-Alili, A.; Hwang, Y.; Radermacher, R. A hybrid solar air conditioner: Experimental investigation. Int. J. Refrig. 2014, 39, 117–124. [Google Scholar] [CrossRef]
- Fong, K.F.; Lee, C.K.; Chow, T.T.; Fong, A.M.L. Investigation on solar hybrid desiccant cooling system for commercial premises with high latent cooling load in subtropical Hong Kong. Appl. Therm. Eng. 2011, 31, 3393–3401. [Google Scholar] [CrossRef]
- Ghali, K. Energy savings potential of a hybrid desiccant dehumidification air conditioning system in Beirut. Energy Convers. Manag. 2008, 49, 3387–3390. [Google Scholar] [CrossRef]
- Mazzei, P.; Minichiello, F.; Palma, D. Desiccant HVAC systems for commercial buildings. Appl. Therm. Eng. 2002, 22, 545–560. [Google Scholar] [CrossRef]
- El-Agouz, S.A.; Kabeel, A.E. Performance of air conditioning system with geothermal energy under different climatic conditions. Energy Convers. Manag. 2014, 88, 464–475. [Google Scholar] [CrossRef]
- Wrobel, J.; Walter, P.S.; Schmitz, G. Performance of a solar assisted air conditioning system at different locations. Sol. Energy 2013, 92, 69–83. [Google Scholar] [CrossRef]
- Casas, W.; Schmitz, G. Experiences with a gas driven, desiccant assisted air conditioning system with geothermal energy for an office building. Energy Build. 2005, 37, 493–501. [Google Scholar] [CrossRef]
- Angrisani, J.; Diglio, G.; Sasso, M.; Calise, F.; Dentice d’Accadia, M. Design of novel geothermal heating and cooling system: Energy and economic analysis. Energy Convers. Manag. 2016, 108, 144–159. [Google Scholar] [CrossRef]
- Beccali, M.; Finocchiaro, P.; Nocke, B. Energy performance of a demo solar desiccant cooling system with heat recovery for the regeneration of the adsorption material. Renew. Energy 2012, 44, 40–52. [Google Scholar] [CrossRef]
- De Antonellis, S.; Intini, M.; Joppolo, C.M.; Molinaroli, L.; Romano, F. Desiccant wheels for air humidification: An experimental and numerical analysis. Energy Convers. Manag. 2015, 106, 355–364. [Google Scholar] [CrossRef]
- Kawamoto, K.; Cho, W.; Kohno, H.; Koganei, M.; Ooka, R.; Kato, S. Field Study on Humidification Performance of a Desiccant Air-Conditioning System Combined with a Heat Pump. Energies 2016, 9, 89. [Google Scholar] [CrossRef]
- La, D.; Dai, Y.; Li, H.; Li, Y.; Kiplagat, J.K.; Wang, R. Experimental investigation and theoretical analysis of solar heating and humidification system with desiccant rotor. Energy Build. 2011, 43, 1113–1122. [Google Scholar] [CrossRef]
- Preisler, A.; Brychta, M. High potential of full year operation with solar driven desiccant evaporative cooling systems. Energy Procedia 2012, 30, 668–675. [Google Scholar] [CrossRef][Green Version]
- Zhang, L.Z.; Niu, J.L. Performance comparisons of desiccant wheels for air dehumidification and enthalpy recovery. Appl. Therm. Eng. 2002, 22, 1347–1367. [Google Scholar] [CrossRef]
- Strindehag, O.; Josefsson, I.; Henningson, E. Emission of bacteria from air humidifiers. Environ. Int. 1991, 17, 235–241. [Google Scholar] [CrossRef]
- Speerforck, A.; Schmitz, G. Experimental investigation of a ground-coupled desiccant assisted air conditioning system. Appl. Energy 2016, 181, 575–585. [Google Scholar] [CrossRef]
- Speerforck, A. Investigation of a Desiccant Assisted Geothermal Air Conditioning System, 1st ed.; Verlag Dr. Hut: Munich, Germany, 2019. [Google Scholar]
- Speerforck, A.; Ling, J.; Aute, V.; Radermacher, R.; Schmitz, G. Modeling and simulation of a desiccant assisted solar and geothermal air conditioning system. Energy 2017, 141, 2321–2336. [Google Scholar] [CrossRef]
- Niemann, P.; Richter, F.; Speerforck, A.; Schmitz, G. Performance investigation of a desiccant assisted solar and geothermal air conditioning system during winter and summer. In Proceedings of the International Sustainable Energy Conference on Renewable Heating and Cooling in Integrated Urban and Industrial Energy Systems, Graz, Austria, 3–5 October 2018; pp. 208–217. [Google Scholar] [CrossRef]
- Slayzak, S.J.; Ryan, J.P. Desiccant Dehumidification Wheel Test Guide: Technical Report; No. NREL/TP-550-26131; National Renewable Energy Laboratory: Golden, CO, USA, 2000.
- Indoor Environmental Input for Design and Assessment of Energy Performance of Buildings Addressing Indoor Air Quality, Thermal Environment, Lightning and Acoustics, 12-2012 ed.; DIN EN 15251; Beuth: Berlin, Germany, 2012.


| Subsystem | Measured Value | Comment |
|---|---|---|
| AHU | Air temperature and relative humidity | Inlet and outlet of each component |
| Pressured drop | Across each component | |
| Air volume flow | At positions 4 and 8 for sup and eta | |
| Hydraulic circuits | Fluid volume flow | Inlet or outlet of each circuit |
| Fluid temperature | Inlet and outlet of each circuit | |
| BHE | Soil temperature | Thermistor string embedded in the borehole; temperature measurement in depths of 10, 15, 20, 40, 60 and 80 m |
| Reference room | Thermal comfort | Temperature and humidity ratio within the conditioned space |
| Measured Value | Sensor Type or Principle | Measurement Uncertainty |
|---|---|---|
| Air/water temperature | Pt 100 (accuracy class W 0.1) | |
| Soil temperature | Thermistor string | |
| Relative humidity | Capacitive humidity sensor | for |
| Volume flow (air) | Differential pressure | of reading |
| Volume flow (water) | Electromagnetic flow meter | of reading |
| Pressure difference | Ceramic fulcrum lever technology | of full scale (range: or ) |
| Electric power | AC energy meter | of reading |
| Operation Mode | Summer | Winter |
|---|---|---|
| DW (su)/EW (wi) | 76% | 70% |
| HRW | 19% | 30% |
| Simple air exchange | 5% | <1% |
| Parameter | DP-VC | DW-VC | AH-GEO | IH-GEO |
|---|---|---|---|---|
| Related period | Summer | Summer | Winter | Winter |
| Air dehumidification | Cooling below dew point tem-perature | Similar to DW-GEO | Not considered | Not considered |
| Air humidification | Not considered | Not considered | Electrical impeller humidifier (adiabatic) | Electrical steam humidifier (isothermal) |
| Supply air temperature | 18 °C | 22 °C | 22 °C | 22 °C |
| Heating power | Similar to DW-GEO, adjusted | Similar to DW-GEO | Similar to DW-GEO, adjusted | Similar to DW-GEO, adjusted |
| Cooling power | Vapor compres-sion chiller | Vapor compres-sion chiller | Not considered | Not considered |
| Energy Demand | DW-GEO | DP-VC | DW-VC | AH-GEO | IH-GEO |
|---|---|---|---|---|---|
| Cooling period | |||||
| Supply (in ) | 15 | 1649 | 720 | ||
| Air treatment and distribution (in ) | 1348 | 1082 | 1348 | ||
| Air heating (in ) | 2326 | 2004 | 2326 | ||
| Heating period | |||||
| Supply (in ) | 1401 | 1414 | 1082 | ||
| Air treatment and distribution (in ) | 1153 | 964 | 2043 | ||
| Underfloor heating (in ) | 3180 | 3180 | 3180 | ||
| Reheating () | 2182 | 2223 | 1225 | ||
© 2019 by the authors. Licensee MDPI, Basel, Switzerland. This article is an open access article distributed under the terms and conditions of the Creative Commons Attribution (CC BY) license (http://creativecommons.org/licenses/by/4.0/).
Share and Cite
Niemann, P.; Richter, F.; Speerforck, A.; Schmitz, G. Desiccant-Assisted Air Conditioning System Relying on Solar and Geothermal Energy during Summer and Winter. Energies 2019, 12, 3175. https://doi.org/10.3390/en12163175
Niemann P, Richter F, Speerforck A, Schmitz G. Desiccant-Assisted Air Conditioning System Relying on Solar and Geothermal Energy during Summer and Winter. Energies. 2019; 12(16):3175. https://doi.org/10.3390/en12163175
Chicago/Turabian StyleNiemann, Peter, Finn Richter, Arne Speerforck, and Gerhard Schmitz. 2019. "Desiccant-Assisted Air Conditioning System Relying on Solar and Geothermal Energy during Summer and Winter" Energies 12, no. 16: 3175. https://doi.org/10.3390/en12163175
APA StyleNiemann, P., Richter, F., Speerforck, A., & Schmitz, G. (2019). Desiccant-Assisted Air Conditioning System Relying on Solar and Geothermal Energy during Summer and Winter. Energies, 12(16), 3175. https://doi.org/10.3390/en12163175