1. Introduction
Hydrogen is potentially a reliable, affordable and sustainable energy carrier. Its production, however, usually involves fossil fuels. The hydrogen generation by electrolysis using renewable energies is a promising carbon free approach, but to become economically appealing, it needs to be improved in terms of efficiency and durability. Electrolysis can be performed either in acidic, neutral or basic conditions. Proton exchange membranes (PEM) use a solid electrolyte working in an acidic environment and that allows it to operate at a high current density. However, to avoid corrosion of the materials employed as electrodes, noble and rare metals are required, resulting in high costs and low sustainability. Alkaline electrolytes usually operate at lower current density, but they may offer the advantage of being able to use cheaper earth-abundant materials. Nickel is one of the most commonly employed metals as an electrode for alkaline electrolysis, thanks to its low cost, high stability in alkaline environment and low overpotential for the hydrogen evolution reaction (HER), compared to other earth abundant transition metals (Fe, Ni, Co and Mn) [
1,
2,
3,
4,
5,
6,
7,
8,
9]. However, due to the hydrogen absorption, promoted by the strong Ni-H
ad bond strength, nickel may be deactivated during operation, despite its initial high electrochemical activity. As a consequence, performance degradation is observed, with an increase of the overpotential under constant current stress [
10,
11,
12]. In order to optimize the nickel electrode performance, an interesting approach is covering the electrode surface with a platinum layer [
13,
14,
15], which is the best catalyst for HER, [
16,
17] exhibiting high current density and nearly zero HER overpotential [
18]. However, platinum is also very expensive, and therefore, its amount should be reduced as much as possible to reduce the costs.
Porous and 3D electrodes, such as open cell metallic foams, have been developed in the recent years as a good alternative to the flat electrodes. They are of interest because of their rigid, open porous network, which affords these materials a large surface area for electrochemical reactions [
19,
20,
21,
22,
23]. The foams are lightweight, which offers high strength and rigidity, as well as good stability in several electrolytes, including strong alkaline conditions. Moreover, the high porosity of metallic foams can, at least in part, overcome the hydrogen oversaturation, which produces voltage increase and mass transport resistance at high current density [
24]. In the present study, we have therefore employed Ni foam covered by a Pt layer. It has been shown that a layer of Pt with thickness in the range of 10–50 nm can be successfully deposited on Ni foam by spontaneous galvanic displacement, obtaining a uniform coverage of 3D structured foams [
25,
26,
27]. It was shown in a previous study that by using an Au buffer layer, even a single monolayer of Pt could be deposited on a 3D bulk substrate, such as Ni foam. [
13] Although effective in reducing the amount of Pt, this procedure does not reduce the cost, since Au is about 30% more expensive than Pt [
28]. In this paper we investigate the minimum amount of Pt that assures the complete coverage of the Ni foam, without the aid of any buffer of other noble metals. The effect of the different Ni foam morphologies and their possible failure mechanisms were studied. Indeed, since the noble metal is deposited on the curved surfaces of the foam, the intrinsic stress is expected to play an important role. By increasing the thickness of the Pt layer, a critical value is found, above which cracks can be generated, producing the film delamination, and therefore inducing detachment of the Pt layer with a detrimental effect on the electrode performance. The stability of several electrodes is compared.
2. Materials and Methods
Electrodes with size 1 × 1 cm2 were cut from Ni foam sheets. The foam sheet had a thickness of 1.6 mm and a porosity of 95%. In order to evaluate the effect of the pore size while keeping constant the porosity and thickness, two foams with different pore density were studied. Foam with 20 pores per linear cm (samples A) was purchased by Goodfellow. Foam with 38 pores per linear cm (samples B) was purchased by MTI Corporation. For foam A, with lower pore density, the average pore diameter was about 450 μm. For foam B the pore diameter was about 230 μm. Since the specific surface area was inversely proportional to the pore diameter, foam A was expected to have a lower surface area than foam B.
The samples were degreased in acetone at 60 °C, with sonication. The native oxide was then removed in a solution made of 0.01 M HCl for 30 min at 60 °C. After such a preparation, the platinum was deposited on the Ni foam by spontaneous galvanic displacement, obtained by immersion in a solution with 1 mM Na
2PtCl
6 and 0.01 M HCl. Nickel has a negative electrochemical potential, −0.25 V, compared to that of Platinum (+0.68 V). Therefore, the noble metal deposition occurred through the oxidation of the conductive substrate at the open-circuit potential. During the immersion, the Pt ions reduced and deposited in the metallic state, while Ni atoms were oxidized, and dissolved into the solution by HCl [
26,
27]. Different samples were prepared with deposition times from 30 s to 16 min. In order to produce a uniform coverage, the depositions were performed by stirring the solution at 600 rpm and by adding Isopropyl Alcohol (C
3H
8O IPA) at a concentration of 5% [
25]. The deposition process was followed by rinsing the foams in deionized water and then they were dried in the air at 25 °C overnight.
For the electrochemical measurements, a three electrodes system has been employed, with a Pt wire as a counter electrode (CE) and a saturated calomel electrode (SCE, saturated KCl) as a reference. Bare Ni foam and electrodes functionalized with Pt were employed as working electrodes and tested for HER. The electrolyte was 1 M KOH and the experiments were performed at room temperature. The current-voltage measurements were performed using a Keithley 2600-Source Current Unit. To obtain the Tafel plots, quasi-steady-state conditions were established by using a slow sweep rate (0.86 mV/s). The measurements were performed by adopting a fixed cell geometry, which minimizes the distance between the working electrode and the reference electrode. In these conditions, the variation between different electrodes was expected to be due only to the variation of the electrode/electrolyte interface.
The stability was tested in a two electrodes cell at a distance of 2 mm, using for HER, the Ni foam functionalized with Pt, and for oxygen evolution reaction (OER), an electrode of bare Ni foam of the same area. Constant current stress was performed at a current density of 50 mA cm−2. For comparison, the stability of bare Ni foam for HER has been also investigated.
Scanning Electron Microscopy (SEM) using a ZEISS FE-SEM SUPRA 35 equipped with an Energy Dispersive X-ray (EDX) microanalysis system (X-MAX, 80 mm2 by Oxford Instruments, Abingdon, UK) has been employed for the morphological characterization. The amount of platinum deposited on the Ni foam was determined by EDX at 15 keV in plan view configuration. It has been then converted into the equivalent film thickness by performing the same EDX measurement on a Pt sputtered flat film of known thickness.
Transmission Electron Microscopy (TEM) analyses were performed on a JEOL JEM 2010F operating at 200 keV.
3. Results
The current-voltage characteristics of bare and Pt coated Ni foam have been obtained in a 1 M KOH solution using SCE as a reference electrode and a Pt wire as an electrode for OER.
Figure 1a,b show the current-voltage characteristics versus reversible hydrogen electrode (RHE) for sample A (20 pores/cm) and B (38 pores/cm), respectively.
In both the samples (i.e., A and B), the onset voltage, taken at 50 mA/cm
2, drops afters Pt deposition. A slightly higher onset voltage value is observed for the shortest deposition time and for the longest deposition times (see 12 min and 16 min in
Figure 1b).
Furthermore, the electrocatalytic activity was obtained by using the Tafel plot method. On a single electrode, the Tafel equation can be stated as:
where η is the overpotential, A is the Tafel slope,
I is the current density and
I0 is the current at equilibrium. In general, the information obtained from Tafel plots can be used to determine the reaction mechanisms involved in an electrochemical process and also to compare the electrocatalytic activity of various electrocatalysts. However, the Tafel slope depends not only on the reaction mechanism and on the intrinsic activity of the material toward the process, but also on its three-dimensional structure, such as porosity and roughness. In the case of multi-component electrodes, Tafel polarization plots are difficult to analyze because the same reaction can occur at different rates at different components and can also have different reaction mechanisms. For these reasons, since HER may occur simultaneously on Pt and Ni, in this paper, the Tafel plots are used to perform comparative analysis of the activity of Ni foam with different morphology and Pt coating.
Figure 1c,d show the overvoltage versus the logarithm of the current density taken at the onset of the reaction for the Ni foam A and B, respectively. By linearly fitting the data shown in
Figure 1c,d, the Tafel slopes have been calculated.
In order to correlate the deposition time to the amount of deposited Pt, EDX spectra have been acquired using the SEM equipment. The amount of Pt has been evaluated on the external surface of the foam and it has been normalized to the total amount of Pt and Ni, i.e., wt% Pt/(wt% Pt + wt% Ni). As an example,
Figure 2 shows the EDX spectrum acquired for Ni foam A (with 20 pores/cm) functionalized by Pt deposition for 4 min. The normalized Pt amount in the sample shown in
Figure 2 is equal to about 15 wt%.
A sample consisting of flat nickel (100 nm thick) on a silicon substrate has been employed for calibration of the measurement of the deposited Pt thickness. On the flat Ni, various Pt layers with different thicknesses were deposited by magnetron sputtering. Pt thickness has been measured by cross-sectional SEM, while the weight percentage of Pt has been measured by EDX performed in the SEM in plan view. We found a perfectly linear dependence between the measured Pt thickness and the Pt weight percentage, so we used such data to transform the EDX measurements of Pt weight percentage in Pt film thickness. Such a calibration has been used to convert the weight percentage measured by EDX in plan view SEM on the Ni foam to the thickness of the Pt film deposited on it.
Figure 3a shows the Pt thickness as a function of the deposition time for the two studied foams. In sample B, shown as squares in the figure, the deposition rate is higher, as indicated by the rapid increase of the Pt thickness as a function of time, for short deposition times. However, for longer deposition times, the thickness tends to form a saturation value and the measurement error increases. Sample A, with 20 pores/cm, exhibits almost the same trend but the deposition rate is much lower.
Once the thickness of the Pt film deposited on Ni foam is measured, however, the evaluation of the total amount of Pt in the electrodes is not straightforward. In a previous work [
25], we developed an experimental approach that allows to us evaluate the Pt loading based on SEM cross section analysis. The advantage of this approach is the possibility of also evaluating the uniformity of the coverage in the various Ni foam layers. More details of the procedure are given in the
Supplementary Material. In
Figure S1, a SEM micrograph in cross section is also shown. According to the procedure described in the
Supplementary Material, we have evaluated the loading of the studied Ni foams. The Pt loading versus deposition time is shown in
Figure 3b. It is clear that the higher density and lower size of pores in Ni foam B is related to a higher exposed surface, and therefore for the same Pt thickness, a larger amount of Pt is deposited per unitary electrode area.
Figure 4 shows the Tafel slope as a function of Pt thickness for the two studied foam morphologies. The bare Ni foam with 20 pores/cm (A) exhibits a larger slope in absolute value, compared to Ni foam B. Such results are in agreement with the lower specific surface area expected for the lower density and larger pores that characterize Ni foam A [
29]. For Ni foam A, the slope changes from −141 mV/dec (bare Ni) to about −80 mV/dec, and this value remains almost constant with increasing thickness. This strongly suggests that a Pt layer almost uniformly covers the Ni foam after 4 min deposition, as well as for longer deposition time. The activity is not largely affected by the Pt thickness above 20 nm.
In the case of foam B, with 38 pores/cm and smaller pore diameter, the behavior is different. Indeed, the bare Ni foam B exhibits a Tafel slope of −120 mV/dec, and the minimum absolute value (−48 mV/dec) decreases as the Pt thickness increases, reaching a minimum value (−48 mV/dec) for a thickness of 70 nm. For higher Pt thickness, the activity becomes worse and the Tafel slope increases in absolute value, reaching a value of about −60 mV/dec.
To gain further insight on these results, structural analyses have been performed. The deposited Pt layer has been analyzed by TEM, as shown in
Figure S2. The high resolution micrograph shows that the Pt is deposited in crystalline grains.
Figure 5 shows a SEM micrograph of Ni foam (B), with 38 pores/cm obtained after several deposition times.
Figure 5a–c and d have been acquired after Pt deposition with thicknesses of 30 nm, 70 nm, 75 nm and 85 nm, respectively. No delamination is observed for deposited Pt with thickness below 75 nm, although some isolated cracks may be detected. After deposition of Pt films of about 75 nm, many cracks appear. For Pt thickness of 85 nm, the film starts to delaminate. The critical thickness, i.e., the maximum Pt thickness for which no delamination occurs (around 70 nm), roughly corresponds to the maximum electrochemical activity, as shown in
Figure 4 by square symbols. For higher deposited Pt thickness, the film starts to delaminate. A worsening in the current-voltage characteristics and activity is observed (
Figure 1 and
Figure 4).
A similar situation is also observed in Ni foam A, with larger pores.
Figure 6a–c show the SEM micrographs of sample A (20 pores/cm) as obtained after Pt deposition with thickness 20 nm, 50 nm and 65 nm, respectively. As shown in
Figure 6c, for 65 nm of Pt thickness, numerous cracks appear, which act as starting points for delamination. Also in this case (foam A), the critical thickness is around 70 nm.
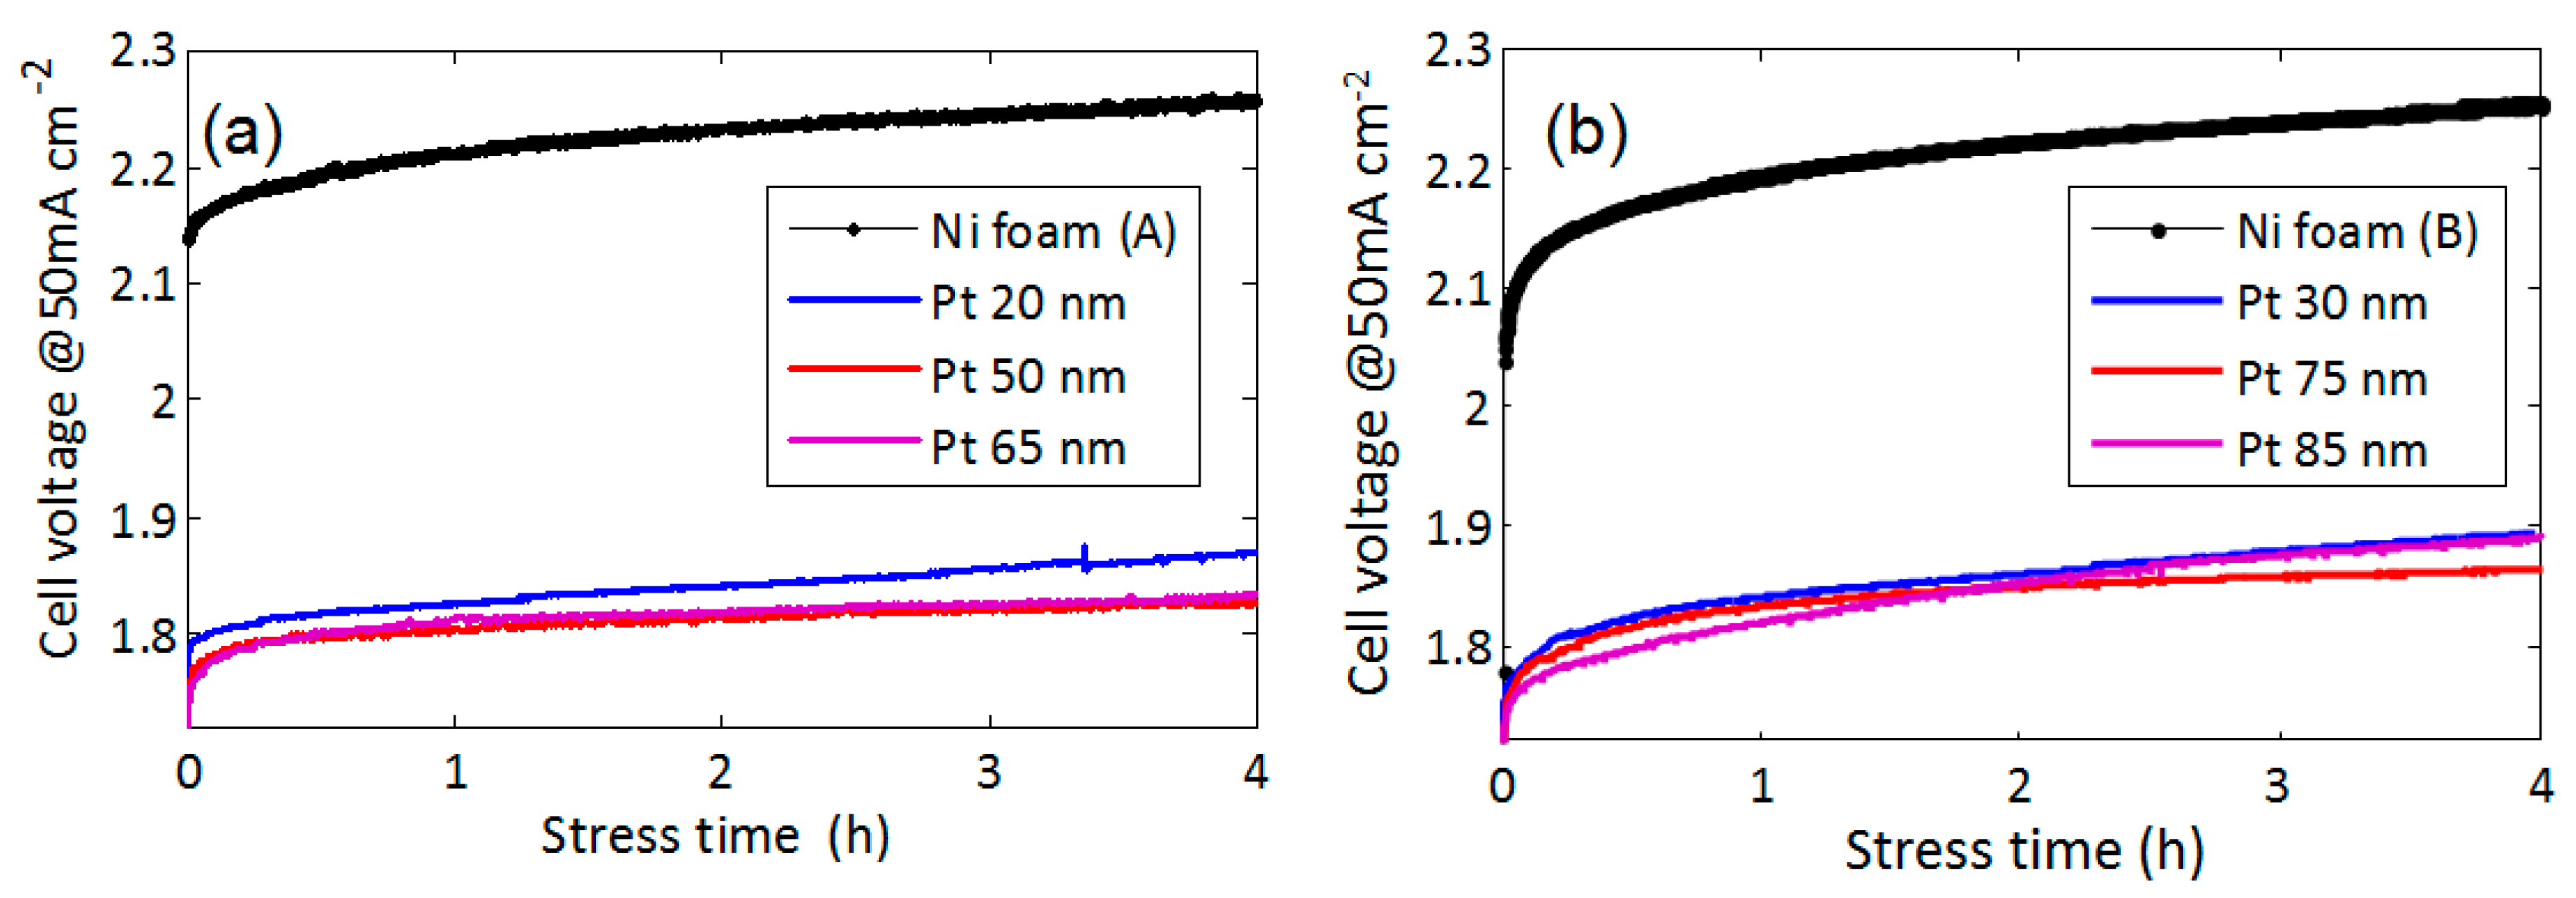
The stability of the functionalized electrodes is shown in
Figure 7. The voltage has been measured as a function of time during constant current stress of 50 mA/cm
2. We compared foams A and B with different Pt coverage. Pt film with a thickness 20 nm (foam A) or 30 nm (foam B) is effective in reducing the overvoltage, but it exhibits less stability than films with thickness in the range of 50–75 nm. This may be due to disuniformity in the film thickness, leading to some uncovered Ni areas. Electrodes covered with Pt thickness in the range of 50–75 nm show the best performance in terms of stability. The presence of cracks in this thickness range seems to be not detrimental for the stability. For higher thickness (85 nm), the stability becomes worse, since, as shown in
Figure 5d, extensive Pt film delamination may occur.
All the results are summarized in
Table 1. By comparing the bare Ni foams, we find that larger pores (foam A) in general produce a smaller increase of the voltage versus time, probably because the bubbles are more easily released.
4. Discussion
Figure 1 and
Figure 2 show that the electroless deposition using galvanic displacement is an effective method to deposit Pt on Ni foam with different pore sizes, obtaining about 0.3 V reduction in the onset voltage at 50 mA/cm
2, for both the studied foams.
Data shown in
Figure 3 indicate that the Pt deposition rate is largely influenced by the foam morphology. In particular, a higher deposition rate is obtained for the foam B, characterized by smaller and denser pores, but also with a different shape, having more concave triangular shape. Due to geometrical factors, more sharper regions are present, at which preferential mass transport may occur, producing faster deposition rates. Such a result is in agreement with previous reports regarding the effect of the shape in electroless deposition, for example, in the case of Ag on micro and nano-patterned Si [
30].
Once the Pt is deposited on the foam, it follows the same curvature radius and it is therefore subjected to tensile or compressive stress. Crack formation starts to release the stress. According to Thouless [
31], no delamination occurs, even in the presence of cracks, as long as the thickness is below a maximum value h
c. The critical value h
c, above which delamination from a crack in the film is initiated, is:
where
σ is the stress and
KF the toughness of the film, indicating the ability of the material to absorb energy and plastically deform without fracturing. Typical values of fracture toughness for Pt can be found in the literature. It is reported that the material toughness for thin films is strongly dependent on the thickness. In particular, it has been shown that whilst in thick films typical values are between 25 MPa m
1/2 and 50 MPa m
1/2, in Pt film with a thickness of 500 nm, values from 2.5 MPa m
1/2 to 4 MPa m
1/2 have been reported [
32]. According to the critical thickness experimentally measured (about 75 nm), and considering an average toughness value of 3 MPa m
1/2, we can estimate the critical stress at which delamination occurs. Almost the same value is obtained for both the samples, equal to about 8 GPa.
It has been shown in several studies [
33,
34,
35,
36,
37] that films more brittle than the substrate (such as SiO
x, Cr or Ta on polyimide [
35,
36,
37]) develop cracks perpendicular to the tensile loading direction at low strains (<1%); once the crack density has reached a plateau, buckling between the cracks occurs at approximately 10% strain, depending on the film thickness and the Poisson’s ratios of the film and substrate material [
35,
36,
37]. Such a situation is clearly visible in
Figure 8, showing a SEM image of a Ni strut after 70 nm thick Pt deposition. Several parallel cracks are observed. The film starts to delaminate from the buckles, which crack at their apex propagating in the direction parallel to the stress. It is reported in literature that the buckles form as a consequence of the elastic mismatch between the film and the substrate. Although the mechanical properties (Young modulus and Poisson ratio) of Ni and Pt do not largely differ (200 GPa and 150 GPa, 0.3 and 0.38 for Ni and Pt, respectively), in the case of Pt deposited on Ni foam, a behavior very similar to that reported for Cr or Ta on polyimide [
36,
37] is observed. This can be explained by considering that the fracture toughness of bulk Nickel is about 120 MPa m
1/2, much higher than that of Platinum (50 MPa m
1/2 in bulk and 2.5 MPa m
1/2 in nanometric films [
32]). Moreover, the misfit strain between Ni and Pt is 10%; therefore, it is comparable to typical values at which buckling from the crack has been observed in Cr on polyimide.
The observed delamination clearly limits the maximum thickness of Pt that can be deposited on a 3D-structured Ni foam. For practical purposes, however, such as the use of Pt coated Ni foam as an electrode for hydrogen or oxygen evolution reduction, due to the high cost and rarity of Pt, one is more interested in the minimum amount of Pt required to get stable and uniform coating with good electrochemical activity. Data summarized in
Table 1 indicate that a trade off has to be found between the activity, the Pt coverage and the stability. Indeed, Ni foam A, with larger pores, exhibits better stability but a higher Tafel slope in absolute value. On the contrary, foam B has a higher specific surface area, which improves the activity, but it seems less stable, probably because of the smaller size of the pores. For foam A, the uniform coverage and almost the maximum activity (−80 mV/dec) and stability (8 mV/h) are obtained with a Pt loading of 0.02 mg/cm
2, corresponding to a layer thickness of 50 nm. In the case of foam B, the more stable electrode (exhibiting a degradation of 15 mV/dec under constant current stress) is obtained with a Tafel slope of −50 mV/dec, and a Pt loading of 0.05 mg/cm
2.


