Article

Ultrasonic Guided Wave Phased Array Focusing Technology and Its Application to Defrosting Performance Improvement of Air-Source Heat Pumps

1
School of Mechanical and Electrical Engineering, University of Electronic Science and Technology of China, Zhongshan Institute, Zhongshan 528400, China
2
School of Information Technology, Beijing Institute of Technology Zhuhai, Zhuhai 519614, China
3
School of Mechanical Engineering, Xi’an Jiaotong University, Xi’an 710049, China
*
Author to whom correspondence should be addressed.
Energies 2019, 12(16), 3117; https://doi.org/10.3390/en12163117
Submission received: 30 June 2019 / Revised: 7 August 2019 / Accepted: 9 August 2019 / Published: 14 August 2019
(This article belongs to the Section I: Energy Fundamentals and Conversion)

Abstract

:
Previous studies have indicated that a basic frost layer negatively affects the heat-transfer efficiency and is difficult to remove using a single ultrasonic transducer. Herein, an ultrasonic phased array technology is proposed for evaporator coil defrosting. First, the dispersion curve of the guided wave in the vibration transfer plate and frosting fin is calculated, and the advance time of each ultrasonic vibrator and the ultrasonic near-field pressures under different velocities are determined through numerical calculations using the MATLAB software. Next, according to the advance time, ultrasonic array focusing is performed to remove the basic frost layer. Finally, the power consumption, heat-supply enthalpy difference, and coefficient of performance (COP) of the air-source heat pump (ASHP) unit are analysed. The theoretical analysis, numerical calculations, and experimental results consistently revealed that ultrasonic array focusing compensates for the energy dissipation and expends the effective defrosting area. Additionally, the perpendicular stress elicited by the Lamb wave and the differential transverse shear stress generated by the SH wave exceed the tensile strength and adhesion stress of the basic frost layer. The basic frost layer cracks and falls away, owing to the combination of the ultrasonic stress effect and the cavitation effect. The defrosting power consumption of the ASHP unit under ultrasonic array excitation decreases from −3.27% to 0.12%, whereas the heat-supply enthalpy difference increases from 4.47% to 10.86%. Therefore, the percentage increment of the COP is between 7.16% and 11.12%, and the power consumption of the reverse-cycle defrosting is 3–12 times that of ultrasonic array defrosting.

1. Introduction

Frosting is an inevitable but common phenomenon in the fields of cryogenic engineering and refrigeration. When an air-source heat pump (ASHP) operates in an ambient environment with a low temperature and high humidity, frost forms and accumulates on the surface of its outdoor coils [1,2]. With increases in the thickness of the frost layer, the air pathway of the evaporator clogs, increasing the drop in air pressure and degrading the heat-transfer performance of the ASHP unit. In severe cases, this can lead to operational accidents or even financial ruin [3,4,5]. To ensure that an ASHP operates efficiently under frost conditions, periodic defrosting is necessary [6].
Previously, several defrosting methods have been proposed for ASHP units, such as (1) compressor shut-down defrosting [7], (2) hot gas by-pass defrosting (HGBD) [8,9,10,11], (3) electric heating defrosting [12,13], (4) fin surface treatment [14,15], and (5) reverse-cycle defrosting (RCD) [6,16,17]. Although these defrosting methods effectively delay or remove the frost accumulated on the surface of outdoor coils, they exhibit limitations and problems. For example, compressor shut-down defrosting is easily affected by ambient temperature changes. The method completely fails when the ambient temperature is <0 °C. Electric heating defrosting may consume large amounts of electric power, which reduces the coefficient of performance (COP) of the ASHP unit. Fin surface treatment is an effective method for restraining the frost formation on the evaporator; however, the frost suppression effect disappears once the fin surfaces are covered with frost. Additionally, the hydrophobic coating decomposes when exposed to the sun.
Currently, RCD is the most widely used standard defrosting method for ASHP units. During RCD, a refrigerant with a high temperature and high pressure not only melts the frost layer, but also evaporates the retained frost-melting droplets on the fin surfaces. However, RCD also exhibits a few disadvantages, such as a large energy consumption during the defrosting process, low indoor thermal comfort and system operation efficiency, internal thermal shocks of the refrigeration system, and a ‘pentium oil’ phenomenon during high- and low-pressure switching [18,19,20]. In order to overcome the aforementioned problems, HGBD has been proposed to ensure heating indoors during defrosting without switching the reverse-cycle valve [21]. Although HGBD has several advantages for frost removal, it exhibits problems, including a long defrosting time and large variations in the discharge pressure and temperature, and is typically used in industrial units [9,22].
Ultrasonic defrosting, which was first proposed by K. Adachi et al. [23,24], is a new non-heating defrosting technology. The authors indicated that ultrasonic vibrations with an amplitude of 3.4 μm and a frequency of 37 kHz suppressed frost accumulation on a plate by approximately 60%. Q. Yan [25] observed that transverse-wave defrosting was more effective than longitudinal-wave defrosting, and that a double ultrasonic source was better than a single ultrasonic source for defrosting. D. Li [26,27,28] discovered that frozen water droplets were instantaneously cracked and removed from the cold surface, owing to the interface shear stress and impact stress excited by ultrasonic vibrations and acoustic pressure. Palacios [29,30] and Overmeyer [31,32] investigated the interfacial stress and ice bonding strength under different ultrasonic excitation frequencies and amplitudes. They reported that ultrasonic vibrations with specific excitation frequencies and amplitudes promoted instantaneous ice layer delamination.
Furthermore, previous studies indicated that the main defrosting mechanism for independent frost crystals was the resonance effect, and the COP of an ASHP unit with ultrasonic vibration increased by 6.51–15.33% [33,34]. However, it is difficult for a single ultrasonic transducer to remove the basic frost layer and satisfy the ultrasonic defrosting requirements of a large-scale evaporator. Therefore, ultrasonic phased array technology is proposed herein for solving the defrosting problem with a single ultrasonic transducer. The following were achieved in this study: (1) defrosting of the entire evaporator surface via the cooperative action of ultrasonic array transducers, (2) realisation of energy focusing scanning on a specific tube via time and distance control, (3) elimination of the stagnation point of guided waves on the evaporator surface, (4) compensation for the energy loss during guided wave propagation by array transducers, (5) destruction of the basic frost layer by directional focusing of energy, and (6) accurate and effective evaluation of the ultrasonic array defrosting efficiency.

2. Experimental Setup and Basic Theory

2.1. Basic Theory of Ultrasonic Array Focusing

According to the principle of ultrasonic phased array technology, the deflection and focusing of the ultrasonic beam are realised by controlling the transmission delay time of array elements. To determine the delay time, the ultrasonic velocity in the vibration transfer plate and frost layer are calculated using Equations (1) and (2). Regarding the velocity calculation, the material parameters and calculation results are listed in Table 1. The expressions are as follows [35]:
c L = λ + 2 μ ρ = ( 1 ν ) E ρ ( 1 + ν ) ( 1 2 ν )
c S = E ρ 1 2 ( 1 + ν ) = G ρ
where c L , c S represent the longitudinal and transverse wave velocities, respectively; E represents the Young’s modulus; λ is the Lamé constant; ρ represents the material density; μ = G represents the shear modulus; and ν represents the Poisson’s ratio.
To implement the calculation of the ultrasonic phased array field, the transmission time delay of all elements is initially calculated. As illustrated in Figure 1, the calculation of the focusing time delay corresponds to time-delay deviation between an arbitrary array element and the first element. We assume that the ultrasonic beam is focused along the angle of θ with the normal vector, and the following geometric relationship is obtained according to the Pythagorean theorem [36]:
( F cos θ ) 2 + { F sin θ [ ( i 1 ) d N 1 2 d ] } 2 = [ F ( c t n c t 0 ) ] 2
where F represents the distance between the ultrasonic array centre and focusing point, θ represents the steering angle, d represents the distance between adjacent ultrasonic transducer, and N represents the total number of ultrasonic array transducers; i = 1 , 2 , , n represents serial number of ultrasonic transducer; t i is required delay time for the ith element.
We obtain the following equation after simplification:
t n = F c [ 1 1 + d 2 F 2 ( n N + 1 2 ) 2 2 d F ( n N + 1 2 ) sin θ ] + t 0
According to Taylor’s series expansion, polynomials above the 2nd order are ignored, and Equation (4) is rewritten as follows:
1 + d 2 F 2 ( n N + 1 2 ) 2 2 d F ( n N + 1 2 ) sin θ 1 d F ( n N + 1 2 ) sin θ + 1 2 [ d F ( n N + 1 2 ) cos θ ] 2
We combine Equations (4) and (5), and the ultrasonic beam focusing delay time of the adjacent element is expressed as follows:
Δ τ n = t n t n 1 = F c { [ 1 sin θ d F ( n 1 N 1 2 ) + 1 2 cos 2 θ d 2 F 2 ( n 1 N 1 2 ) 2 ] [ 1 sin θ d F ( n N 1 2 )                         + 1 2 cos 2 θ d 2 F 2 ( n N 1 2 ) 2 ] } = d sin θ c + d 2 2 c F ( N 2 n ) cos 2 θ

2.2. Experimental Setup

To establish the relationship between the ultrasonic attenuation characteristics and the ultrasonic array transducers, a laser vibrometer experimental table was set up, as illustrated in Figure 2. This included a vibration detection system, an ultrasonic power source (the input power was adjusted from 300 to 2400 W and the accuracy of the input frequency was 1 Hz), a POLYTEC PSV-400 scanning vibrometer (the measurement accuracy for the frequency was 1 Hz, and the resolution ratio was 0.01 nm), a 400 mm × 500 mm × 1.5 mm copper plate, and a controller (used to control the switching part of each group transducer; the control accuracy was 0.01 s), and six ultrasonic transducers (the resonance frequency was 40 kHz and the rated power was 60 W) were linear fixed under the copper plate. All the devices included in the system were connected prior to the start of the experiment, and the vibration amplitude of each measuring point on the surface of the copper plate was recorded to establish a quantitative relationship between amplitude and defrosting effectiveness.
To verify the efficiency of basic frost layer removal using the ultrasonic phased array focusing system, the defrosting system was installed in a programmable constant temperature and humidity cabinet, as illustrated in Figure 3. As illustrated in Figure 3, the micro-channel cooling system was used to maintain the stability of the temperature field around the copper plate. A TOPRIE TP700 temperature and humidity recorder was used to record the surface temperature variation of the copper plate (the temperature measurement accuracy is 0.2 °C, and the relative humidity is 2%; the temperature measurement range is from 40 °C to 60 °C, and the relative humidity measurement range is from 20% to 98%). Thermocouples #1 to #7 were placed around the microscope lens and were used to measure the cold surface temperature variation when the ultrasonic array transducers were operated; the distance from the lens centre to each thermocouple was about 6.8 cm. Thermocouple #8 was attached to the microscope supporter to measure the ambient temperature of the cabinet. Throughout the experiment, the control precisions of the temperature and relative humidity (RH) in the cabinet were 0.1 °C and 1%, respectively, and the detection accuracies of the temperature and humidity measurement instruments were 0.1 °C and 0.1%, respectively.

2.3. Test Procedures

Prior to the laser vibrometer experiment, 11 × 15 points were arranged on the copper plate surface to detect the vibration attenuation characteristics under ultrasonic array excitation. Six ultrasonic transducers divided into two groups were fixed on the reverse side of the copper plate, as illustrated in Figure 4. The distance between adjacent test points was 32 mm, and the distances between the test points and the upper and lower boundaries were 32 and 48 mm, respectively. Initially, the first group of ultrasonic transducers were switched on (including I, II and III), and the vibration amplitudes of the test points in each row were measured several times. Subsequently, all the ultrasonic transducers were opened (including I to VI), the vibration amplitude of each points was measured several times, and the average vibration amplitude of each test point was determined.
In the basic frost layer removal experiment, liquid droplets with similar volumes were dropped in each square using a pipette, and the constant temperature and humidity cabinet was subsequently switched on. The ambient temperatures of the cabinet were −18, −13, −8 and −3 °C. The cabinet continued to operate for 30 min after the ambient temperature reached the set value. When the temperature of the copper plate was in a steady state and the droplets on the copper plate surface were completely frozen, the ultrasonic array transducers were switched on to conduct the basic frost layer removal experiment. During the experiment, the copper plate surface temperature was recorded every 6 s.

3. Results and Discussions

3.1. Numerical Analysis of Ultrasonic Guided Waves

The application of ultrasonic defrosting technology is limited, owing to the insufficient understanding of the ultrasonic propagation mechanism in the frost copper plate. Guided wave dispersion analysis reveals the defrosting mechanism of the basic frost layer and indicates appropriate optimisation methods. In studies [33,34], ultrasonic transducers were installed on a vibration transfer plate that was fixed on the tube through welding or tube-expansion. Guided wave dispersion is one of the main reasons for attenuation, and is due to the restriction of bounded structures. Therefore, the guided wave mode with small dispersion in the low-frequency section was selected as the defrosting mode.
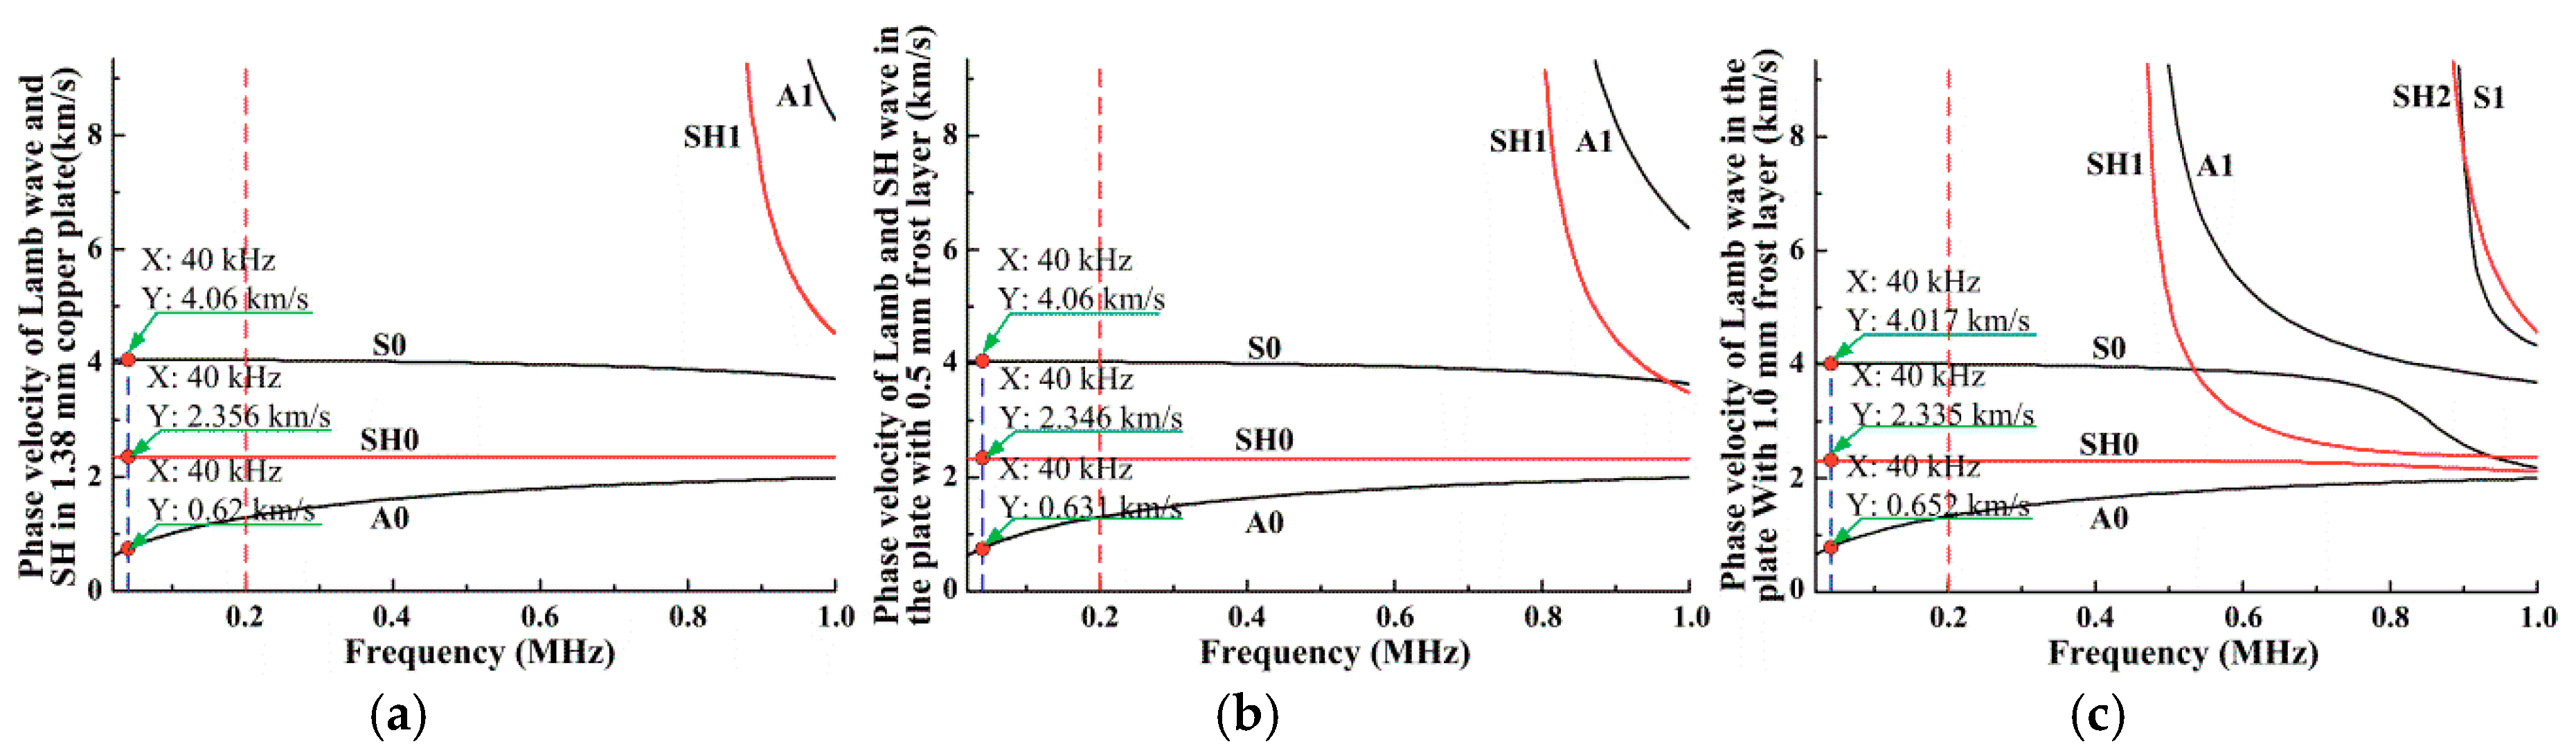
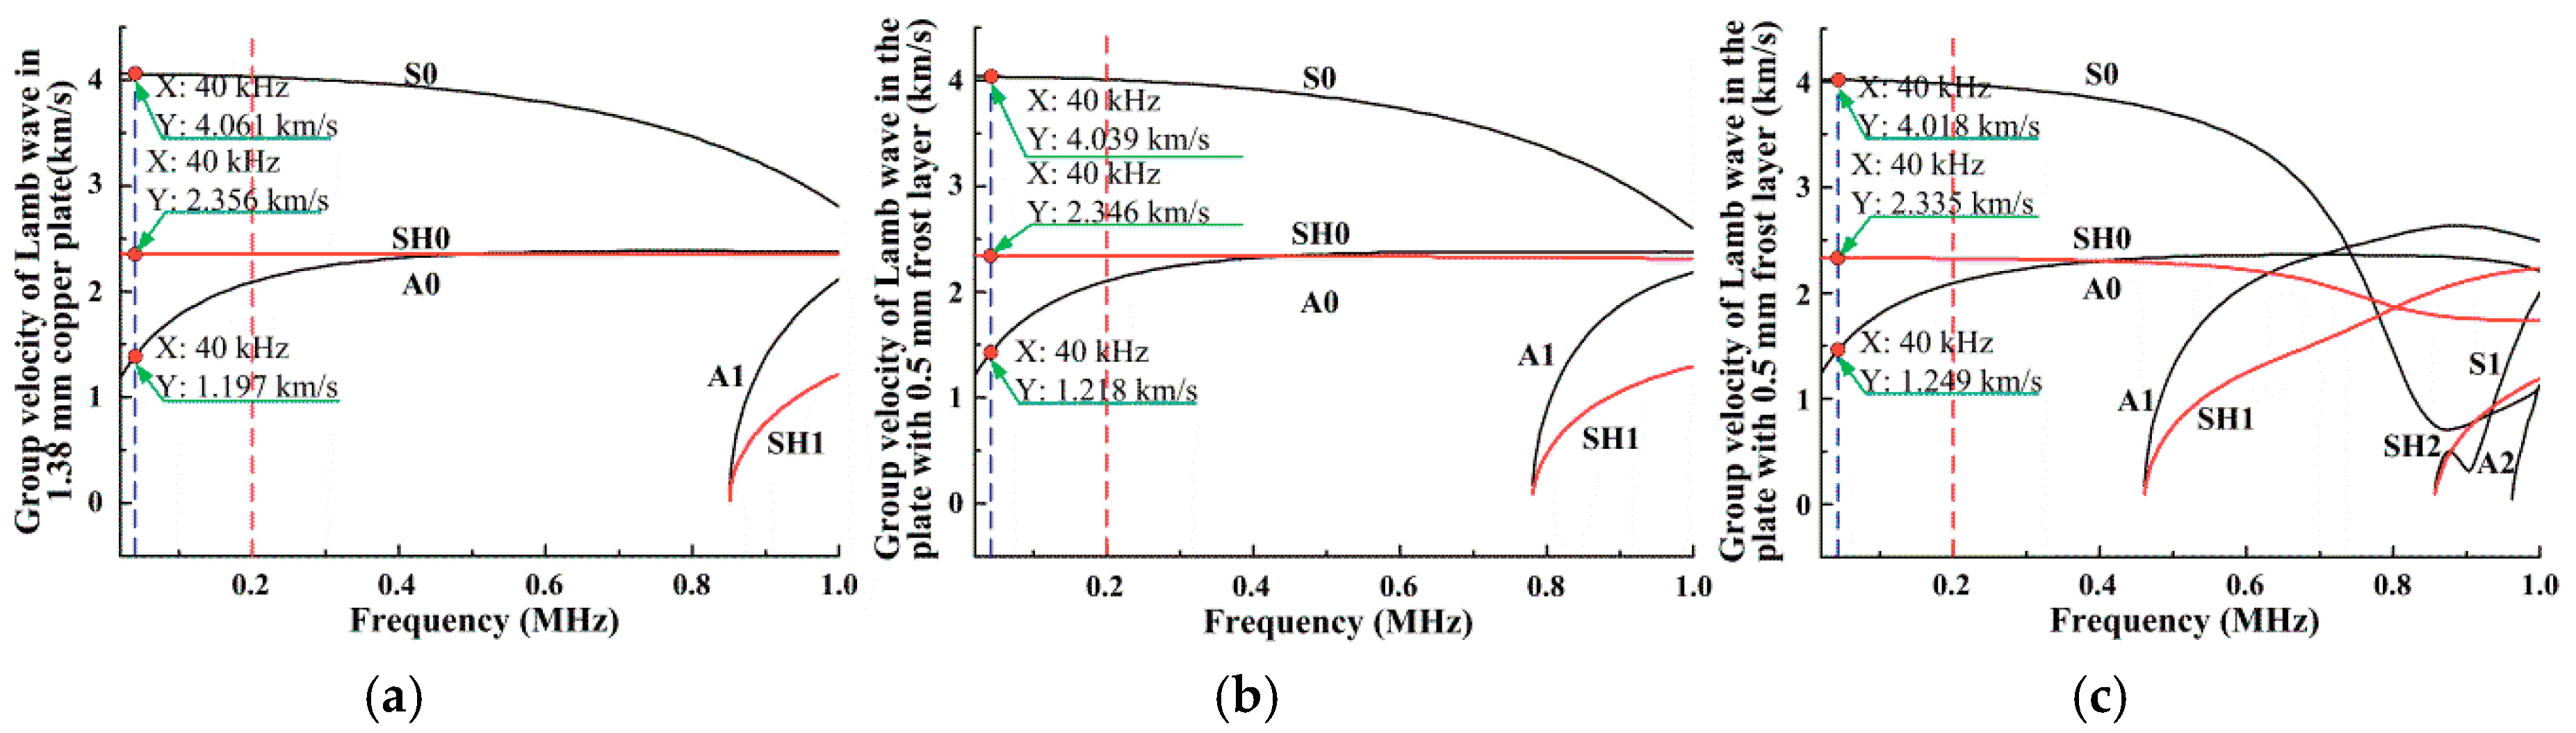
Figure 5 and Figure 6 illustrate the phase and group velocities of the Lamb wave and SH wave in a vibration transfer plate with different frost layer thicknesses. There were three types of guided wave modes in the vibration transfer plate when the excitation frequency was <200 kHz; the A0 and S0 modes of the Lamb wave and the SH0 mode of the SH wave. A comparison of the three types of guided wave modes indicated that the dispersions of the S0 mode and SH0 mode were smaller than that of the A0 mode. Therefore, the S0 and SH0 modes were selected for phased array focusing, because the vibration amplitude of the wave packet decreased quickly with an increase in the dispersion.
Additionally, with an increase in the frost layer thickness, the number of guided wave modes increased, and the dispersion regions of all modes shifted to a lower frequency. In this study, the resonance frequency of the ultrasonic transducer used for defrosting was 40 kHz, and the rated power was 60 W. As illustrated in Figure 5 and Figure 6, increases in the frost layer thickness reduced the phase velocity and group velocity of the SH0 mode from 2.356 to 2.335 km/s and reduced those of the S0 mode from 4.061 to 4.018 km/s. Generally, the phase velocity and group velocity only exhibited slight changes, because the dispersions of the S0 and SH0 modes were small under the excitation frequency of 40 kHz.

3.2. Numerical Calculation of Phased Ultrasonic Array Beam

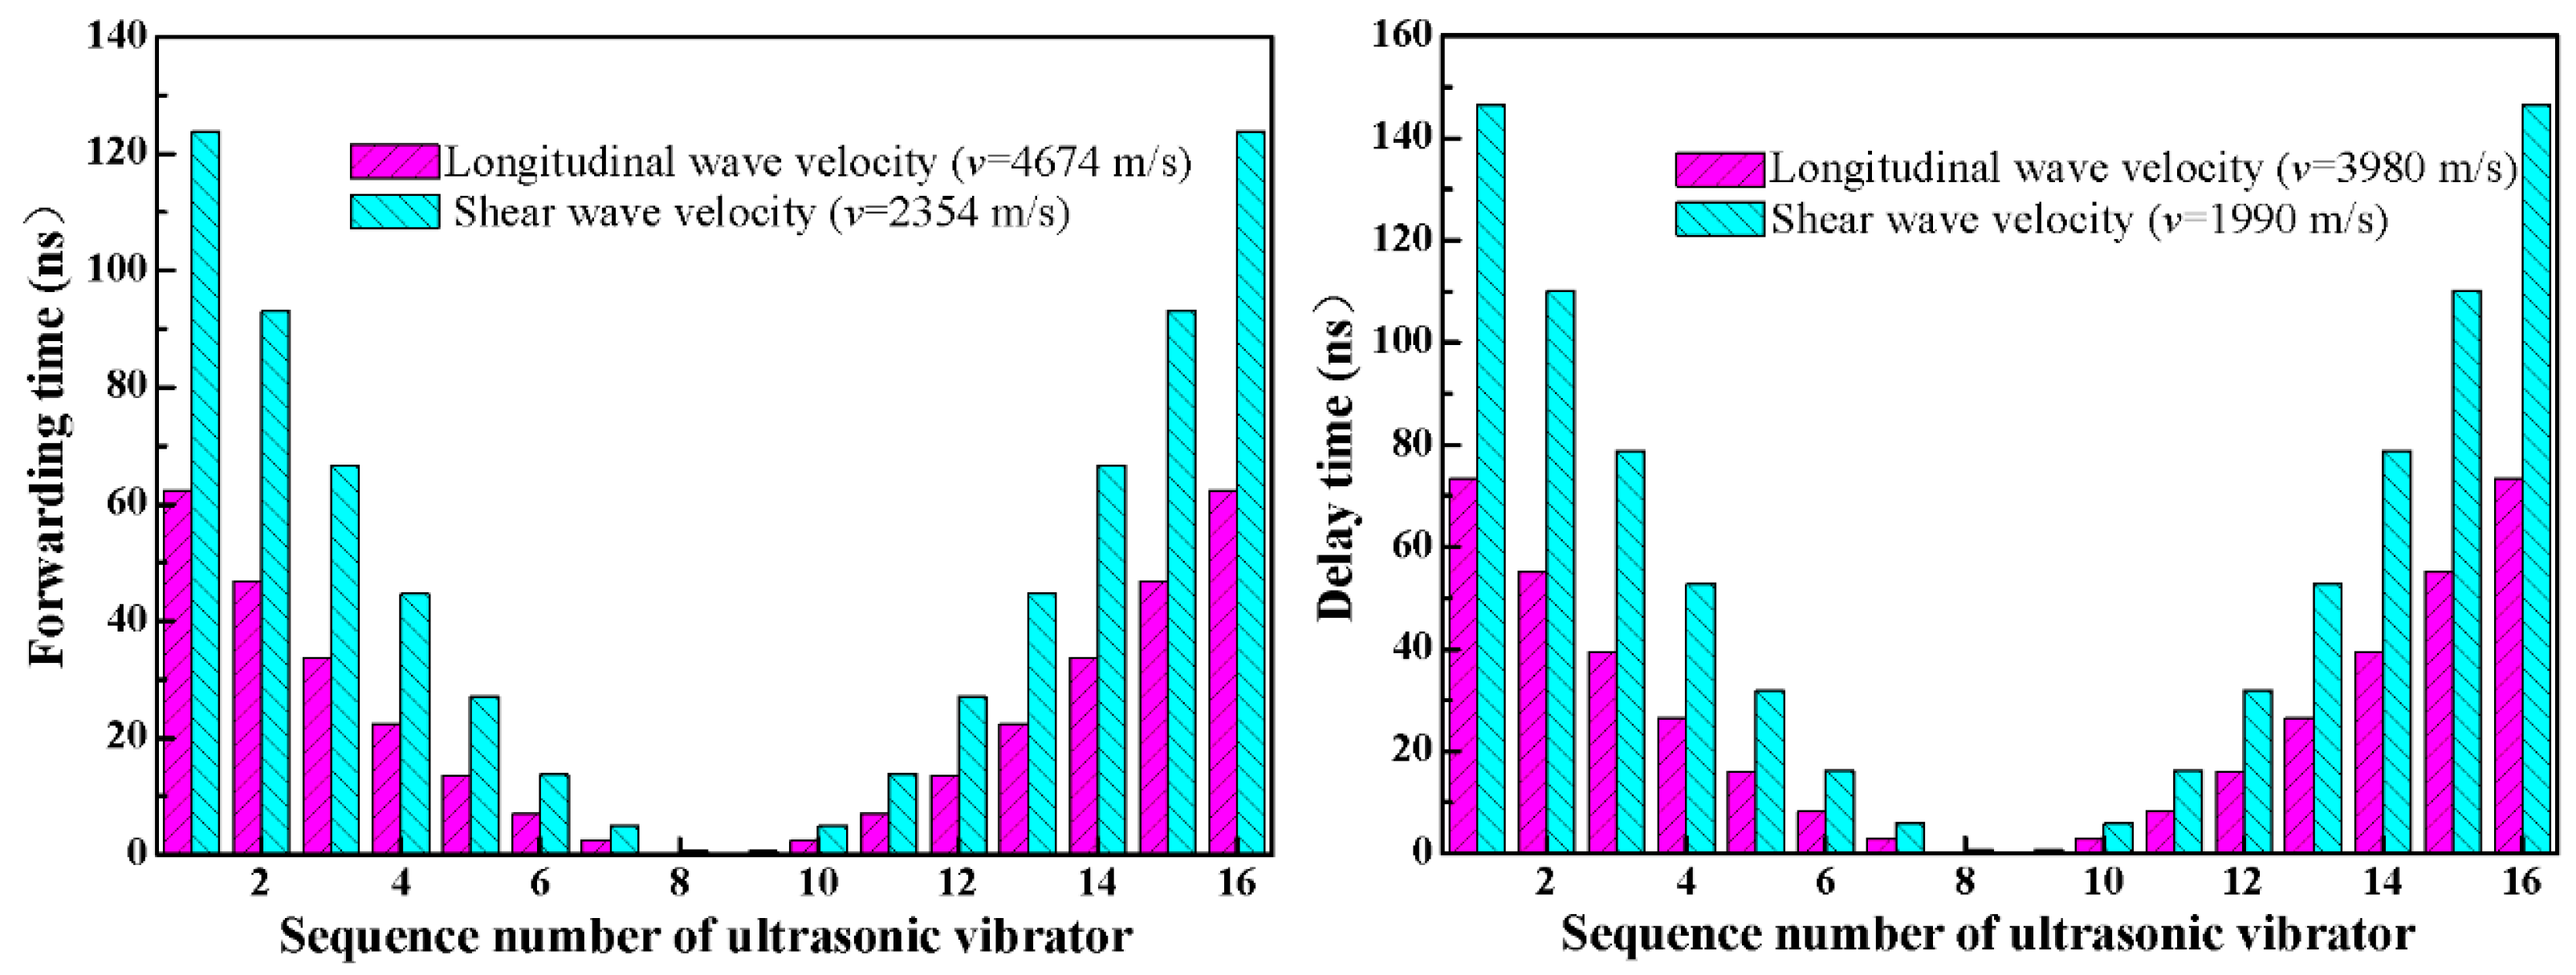
Figure 7 illustrates the advance time of each ultrasonic vibrator on the copper plate and frost layer. As shown in 
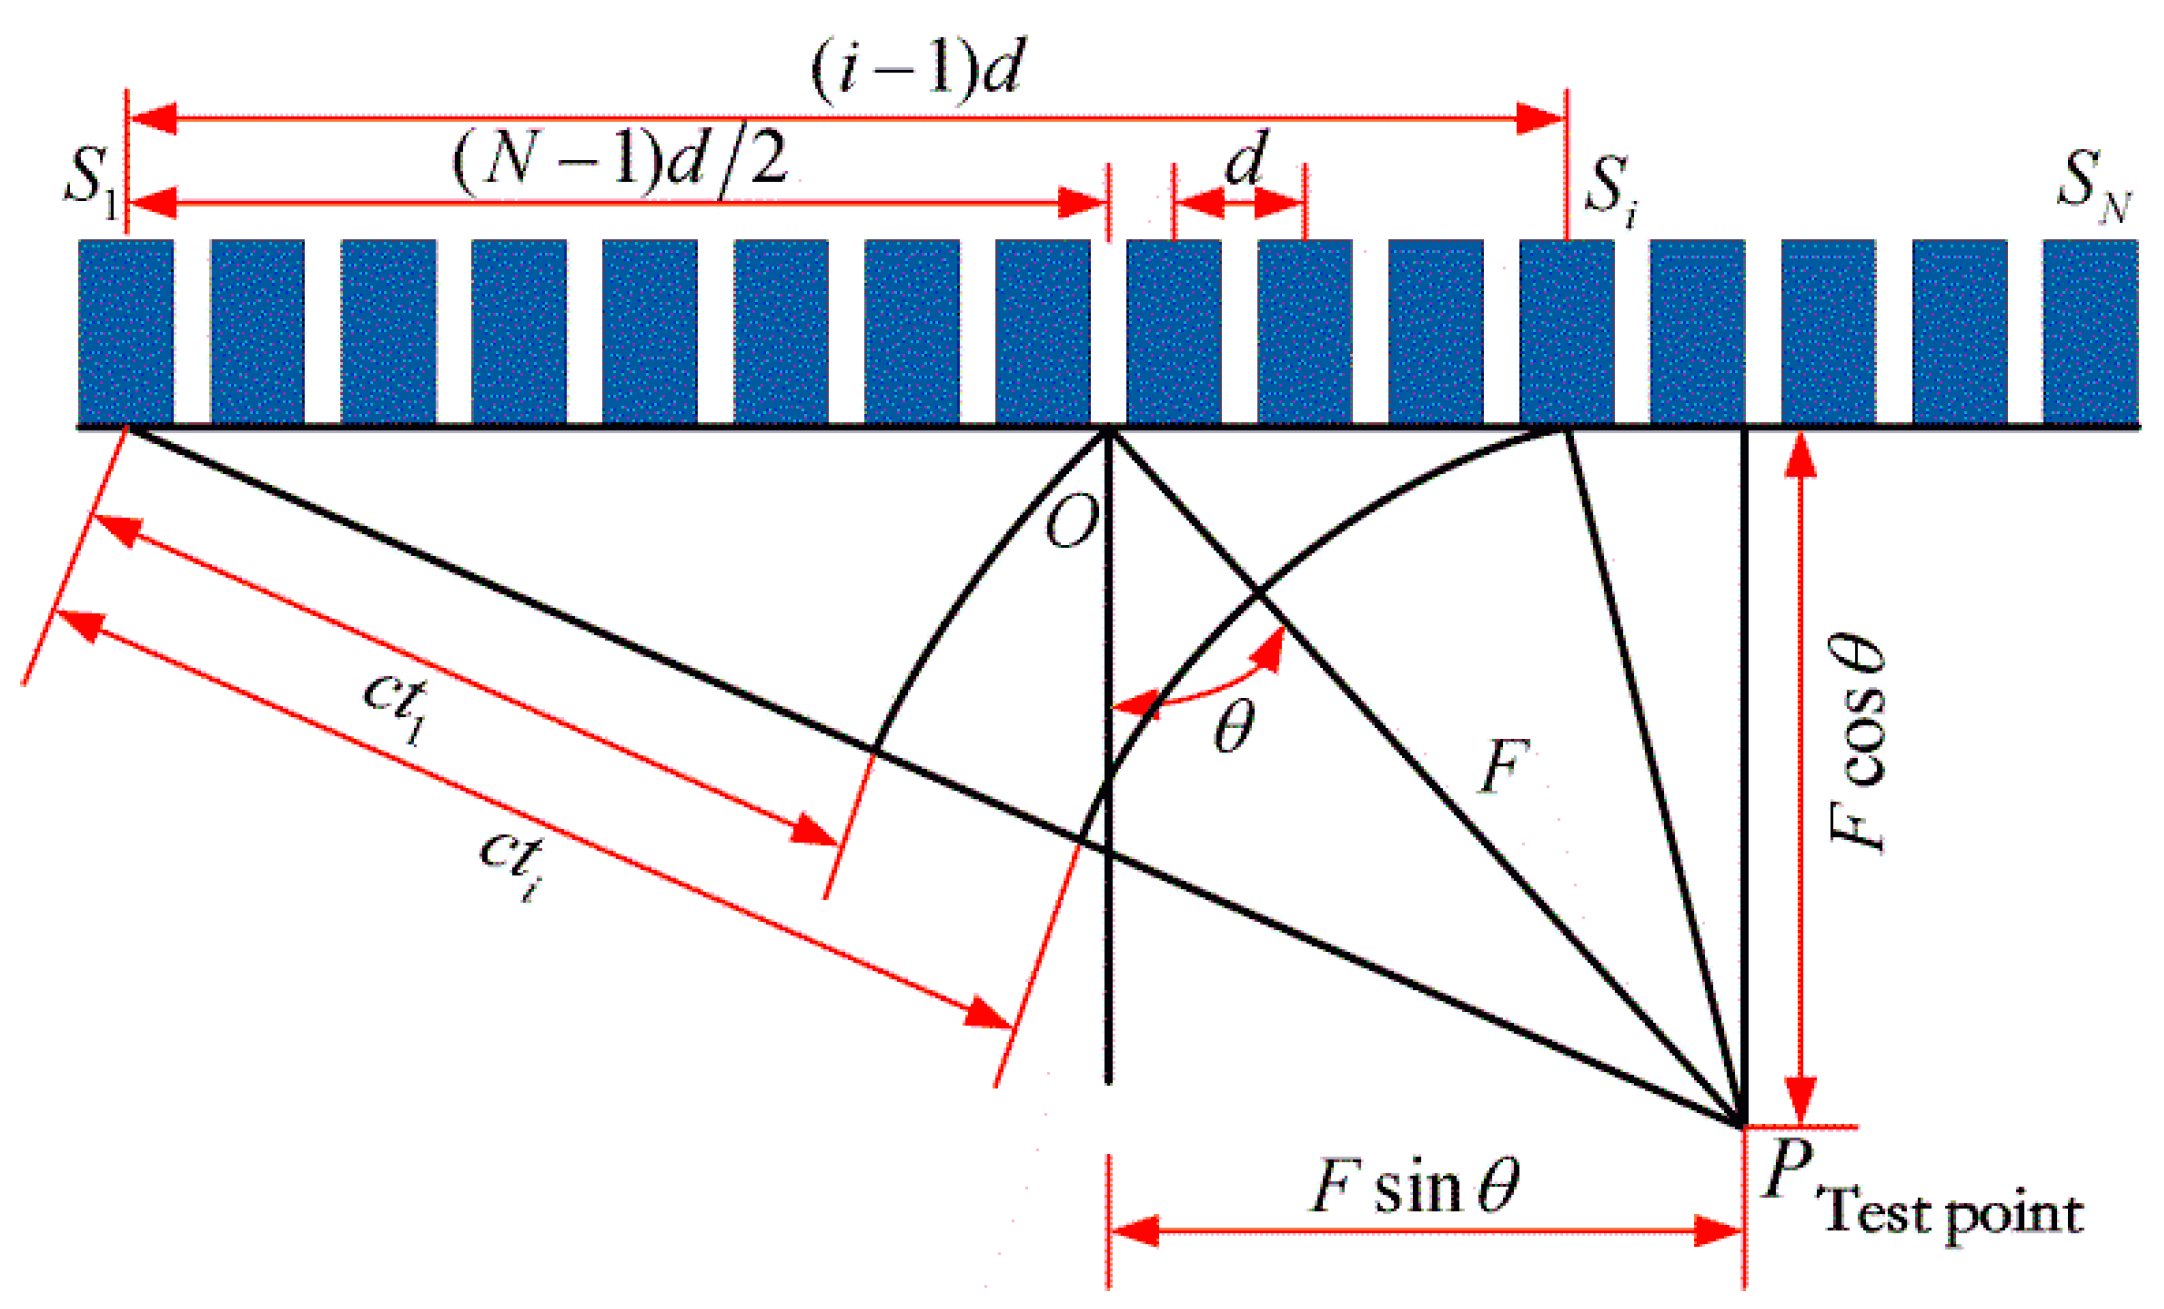
Figure 7, when the installation space of each ultrasonic transducer was 60 mm, the ultrasonic frequency was 40 kHz, and the focusing point was 560 mm from the centre of the linear array vibrators. The advance time of each ultrasonic transducer was calculated for different wave velocities and different materials. With an increase in the wave velocity, the advance time decreased. The advance time of each vibrator was calculated using Equation (6). Finally, with respect to the deflection of the focused beam, the distance between the focusing point and each vibrator was calculated, and the advance time was subsequently determined according to the distance.
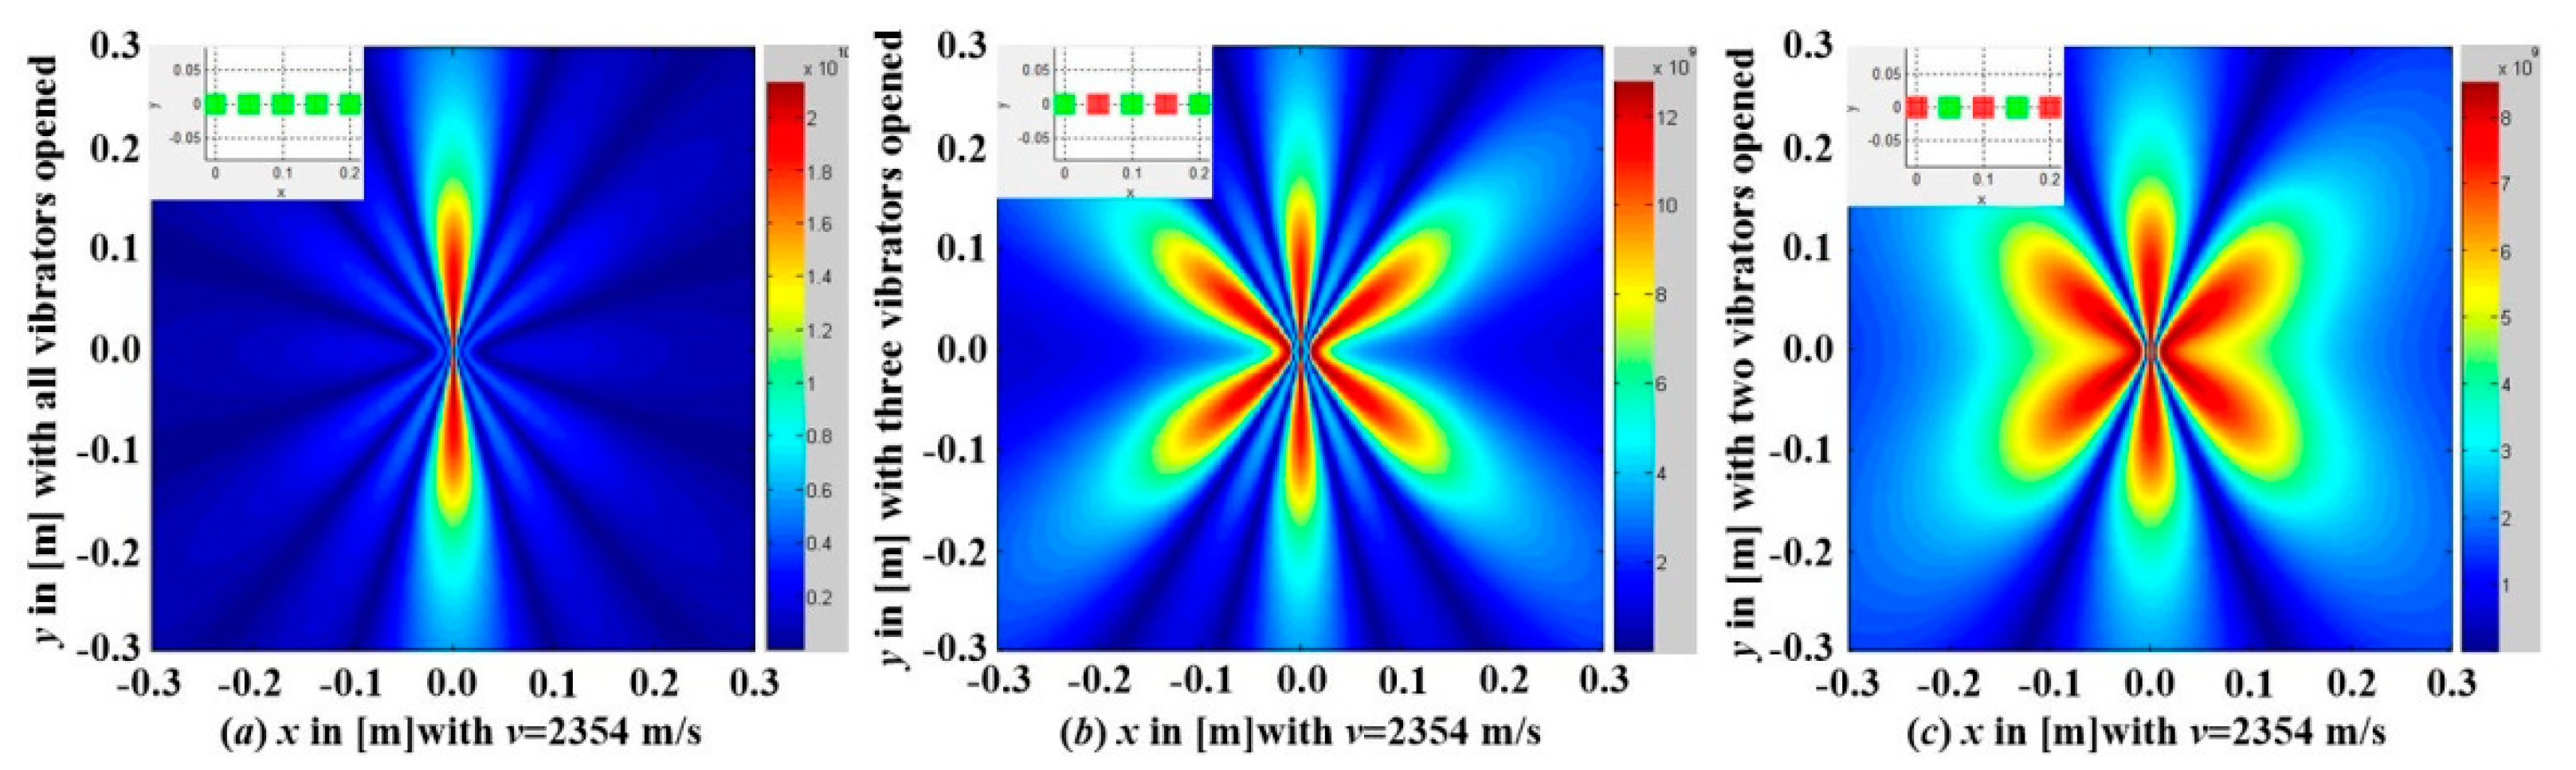
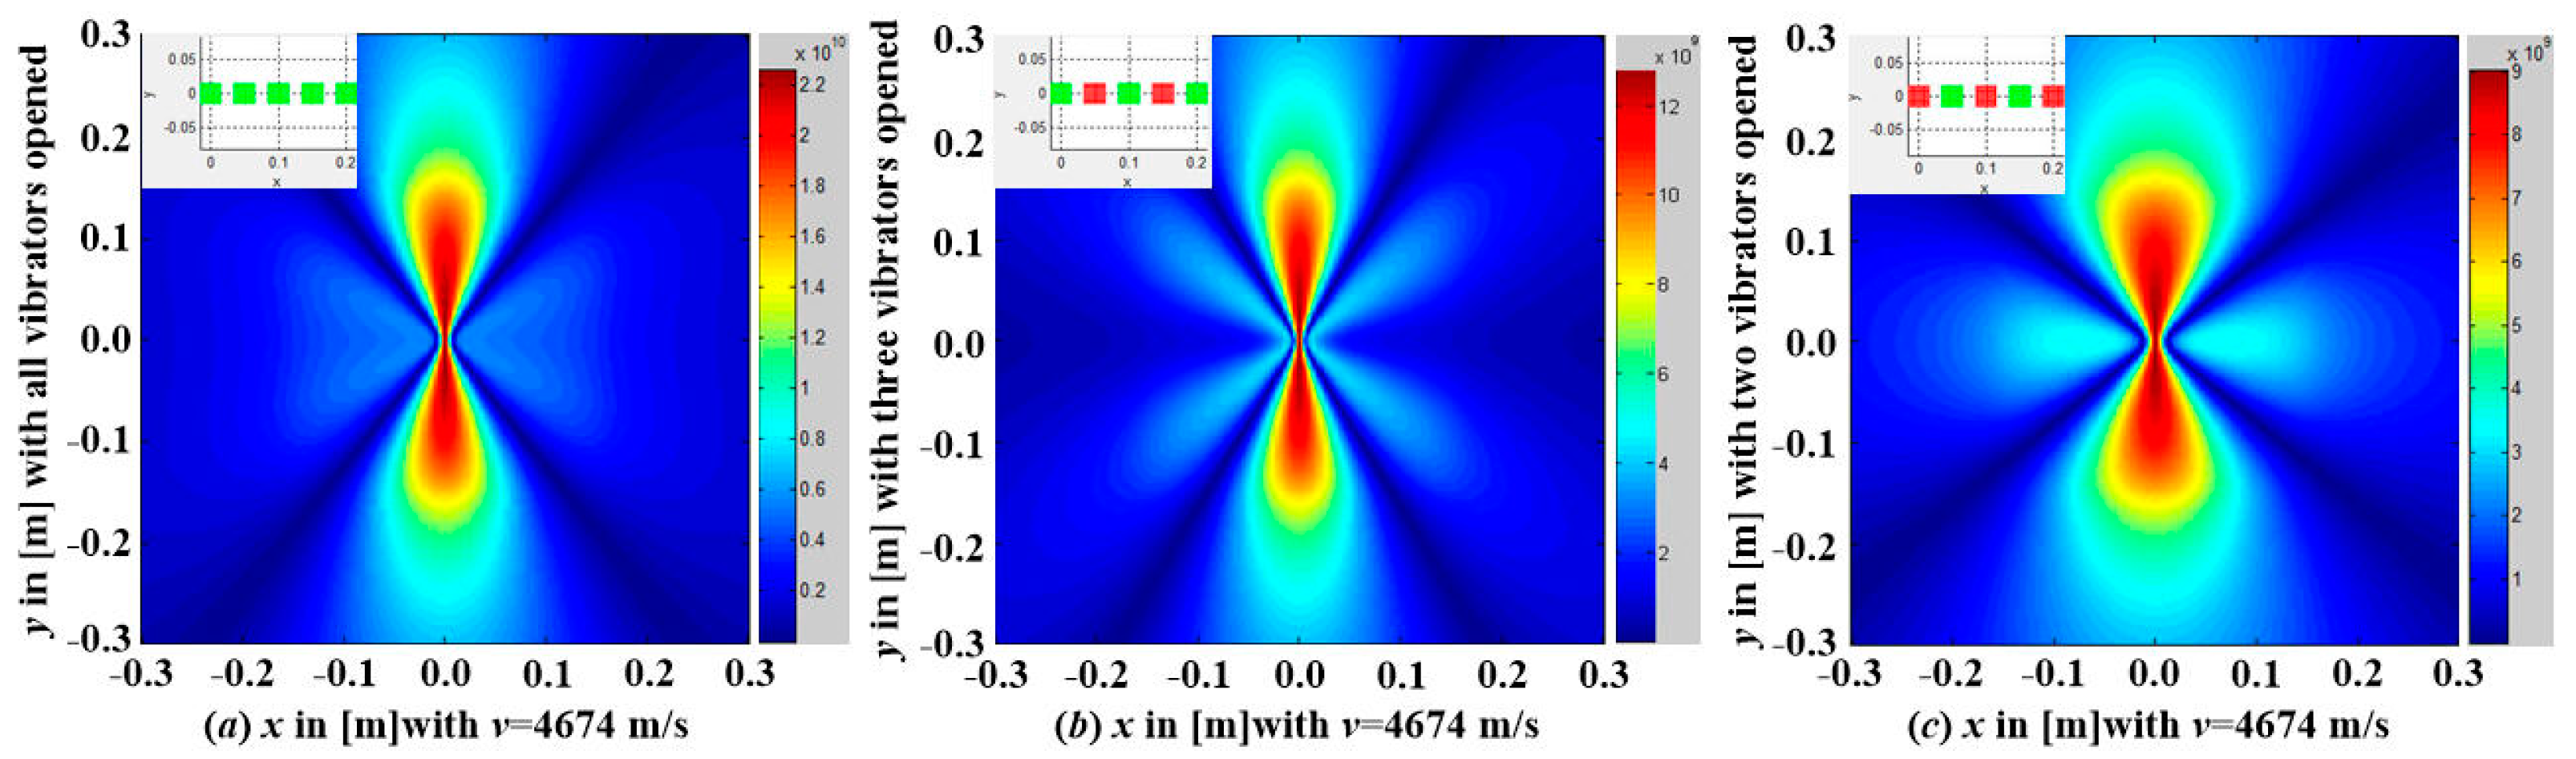
Figure 8 and Figure 9 illustrate the ultrasonic near-field pressure in the XY plane with v = 2345 m/s and v = 4674 m/s, respectively. As illustrated in Figure 8a, when the installation intervals of each ultrasonic transducer were 50 mm and all transducers were opened, there were five ultrasonic focusing beams in the XY plane, and each focusing beam was symmetrically distributed along the X and Y axes. Additionally, the strongest area of focusing for the ultrasonic field was at the location of the middle transducer, owing to the ultrasonic directivity characteristic, and the strongest focusing field exhibited a radial distribution. Furthermore, the other ultrasonic focusing beam was symmetrically distributed on both sides of the strongest focusing beam, and an angle related to the wave velocity and installation intervals of the ultrasonic transducer was formed between the beam centre axis and the coordinate axis. A comparison of Figure 8b,c indicates that the ultrasonic focusing field intensity decreased with a decrease in the number of opened ultrasonic transducers. As illustrated in Figure 8b, three focusing beams with the same intensity were formed, the intensities of the other two focusing beams were relatively low, and the width of the focusing beam was minimal and was symmetrically distributed along the two coordinate axes. In addition to the middle focusing beam, the widths of the focusing beams on the left-most and right-most sides were identical, and the intensities were also identical.
The location of the focusing beam in Figure 8a is similar to that in Figure 9a. The strongest focusing ultrasonic field only appears at the location of the middle transducer with increases in the wave velocity. When the ultrasonic transducers are linearly arrayed, a few low-energy focusing areas always exist in the XY plane for the focusing of a single linear array of transducers owing to the directivity patterns of the ultrasonic fields. Additionally, it is difficult to achieve coverage of the entire XY plane under the ultrasonic focusing field. Therefore, multiple sets of linear arrayed transducers should operate cooperatively in practice, and the relative positions of multiple sets of transducer arrays should be arranged in a staggered manner according to the focusing patterns of the ultrasonic field. The focused field covering the whole plane is realised through the cooperation of multiple sets of ultrasonic transducers, and the distribution of the focused field is optimised to realise the effective defrosting on the whole plane.

3.3. Basic Frost Layer Removal with Ultrasonic Array Transducers

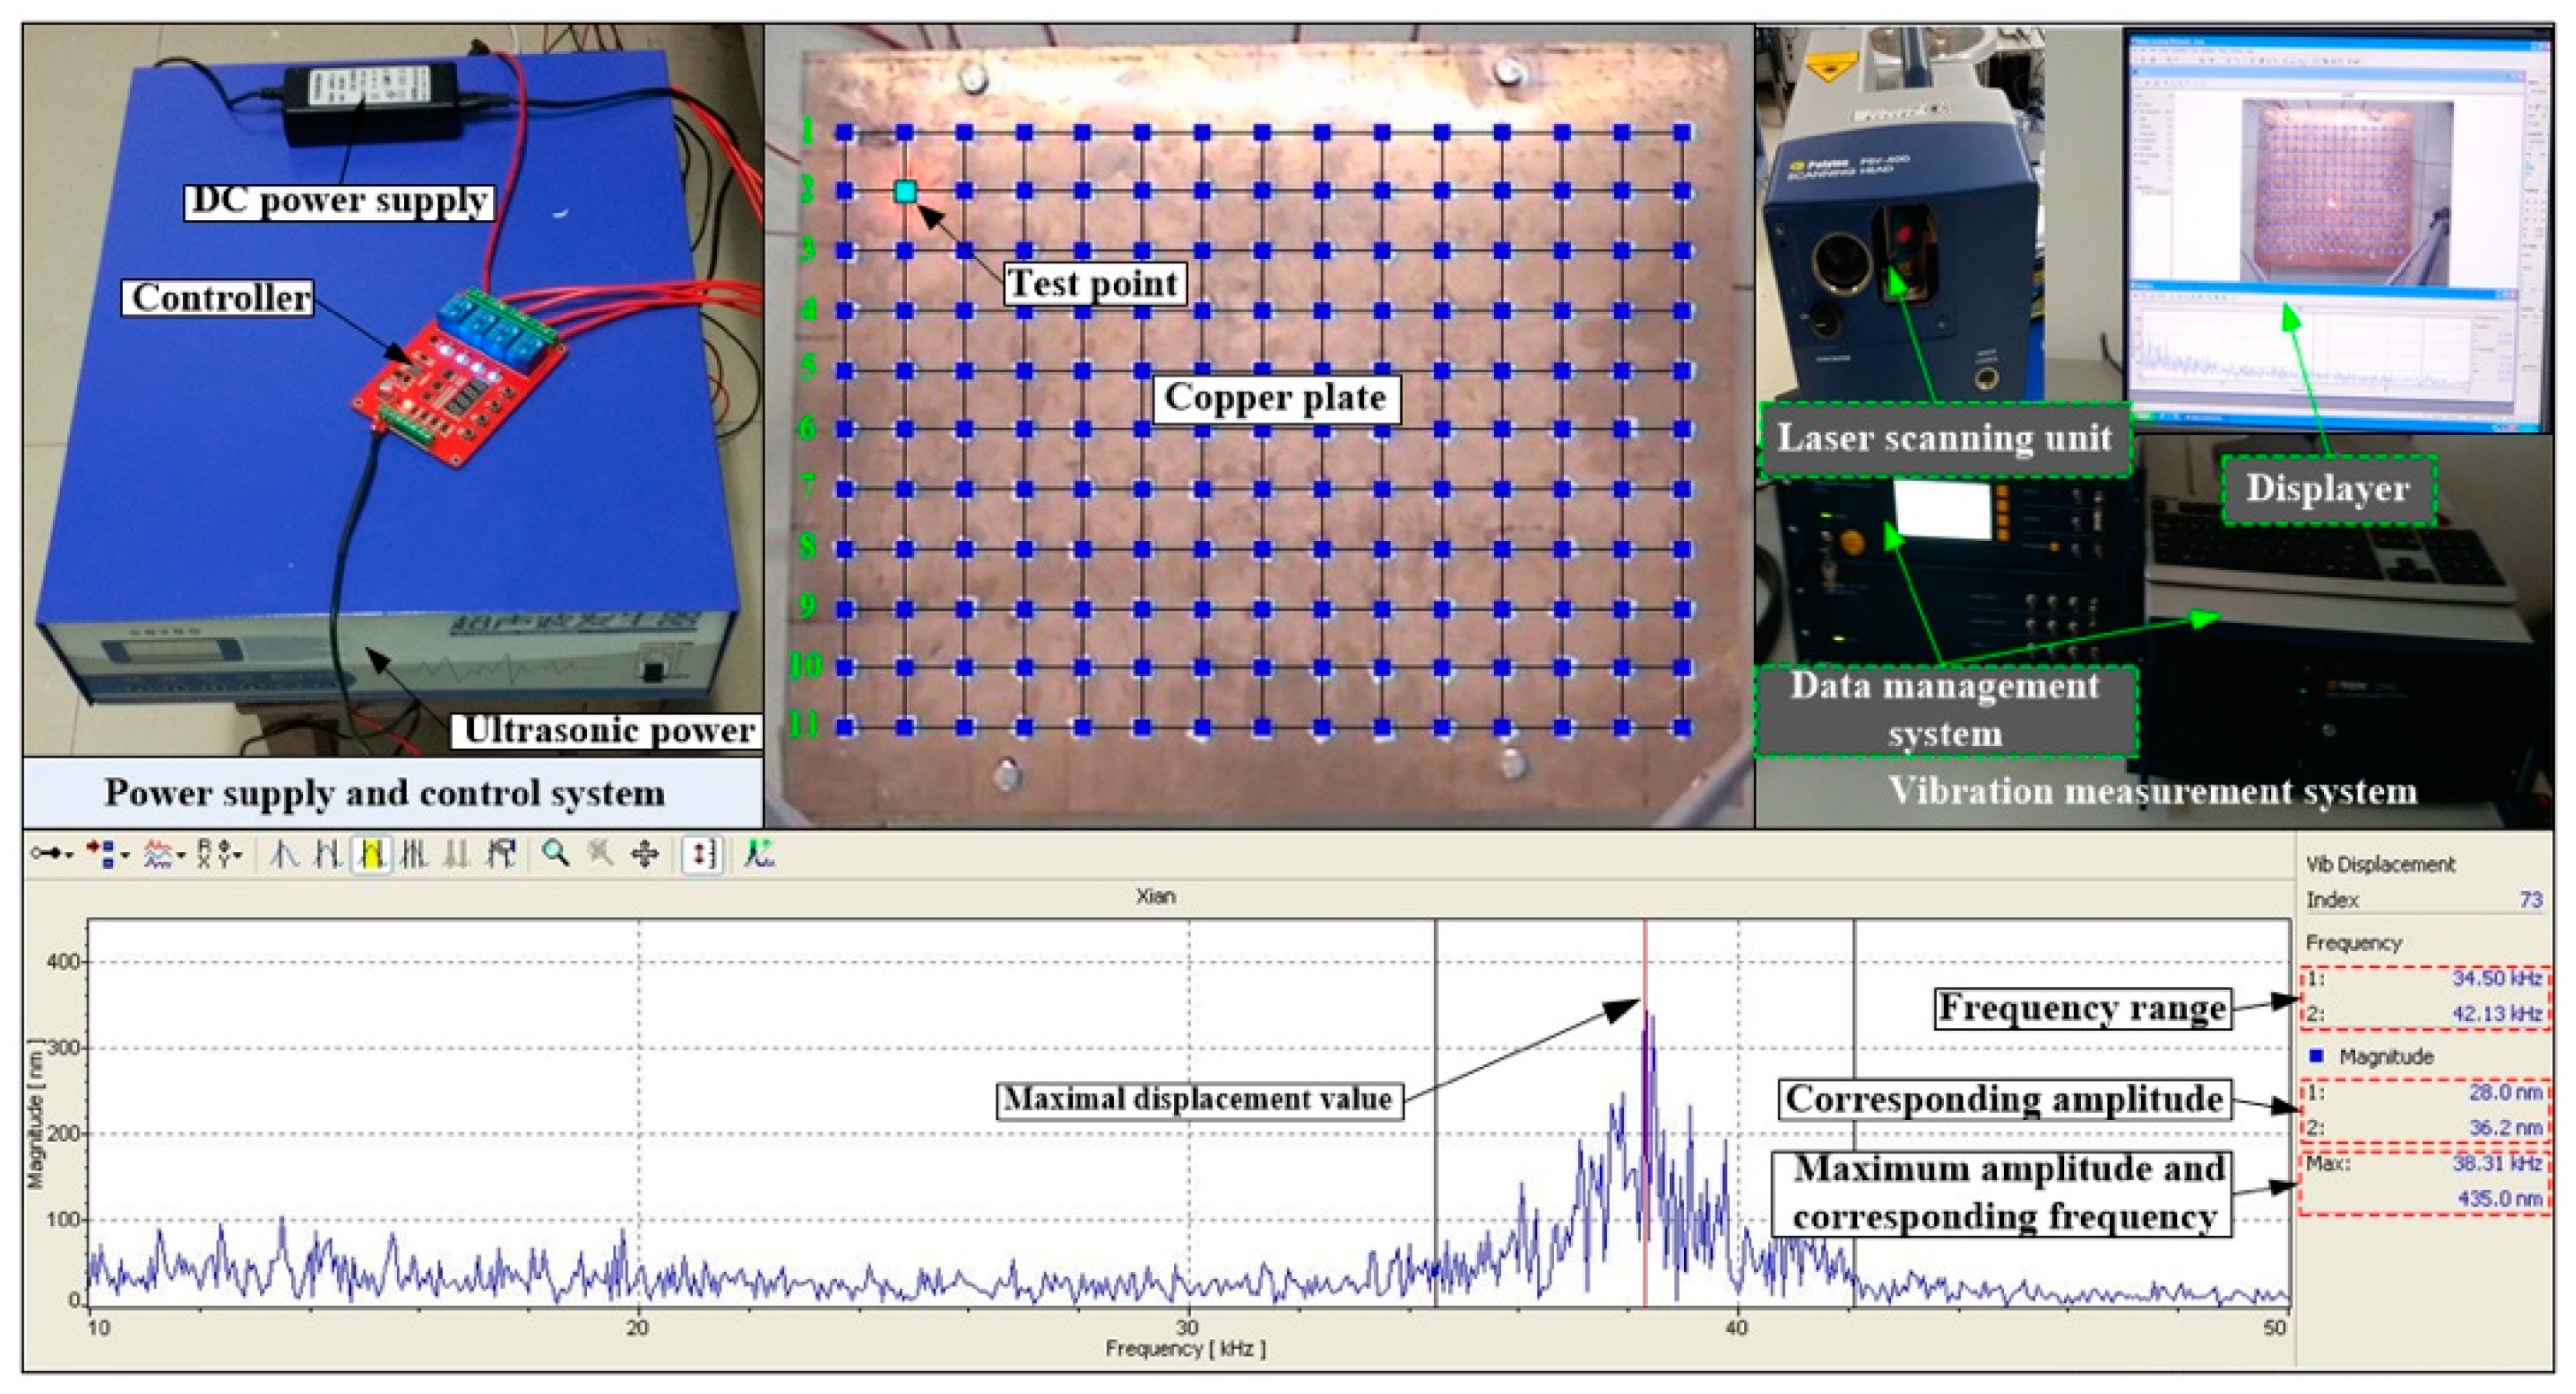
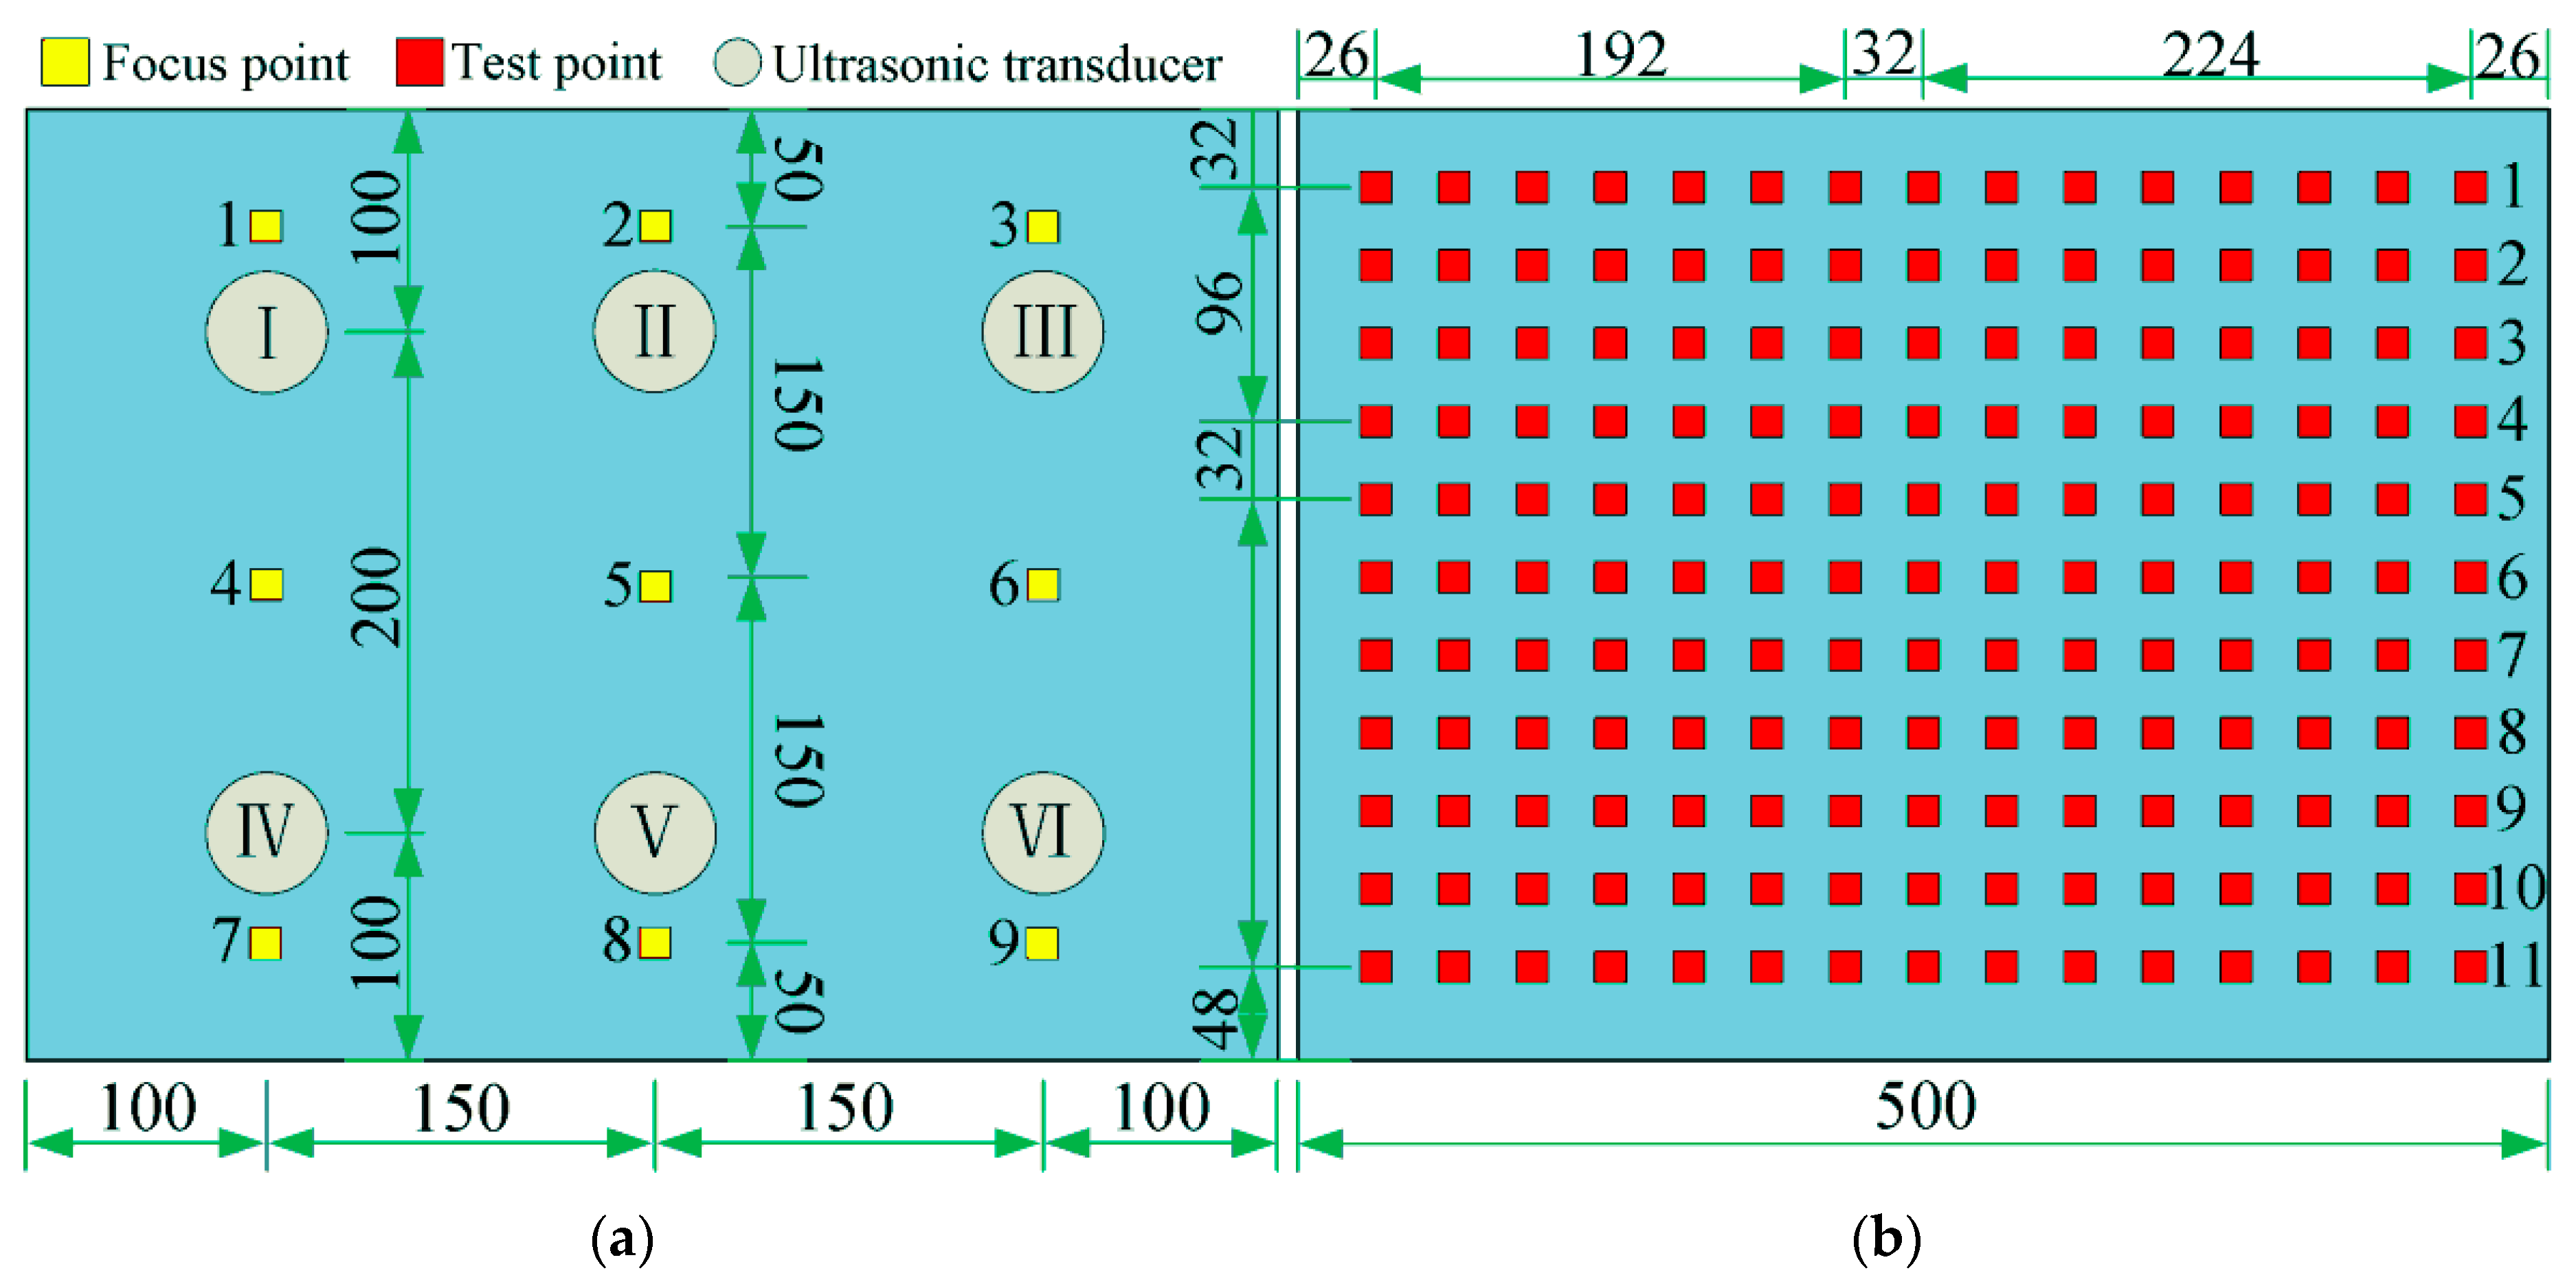
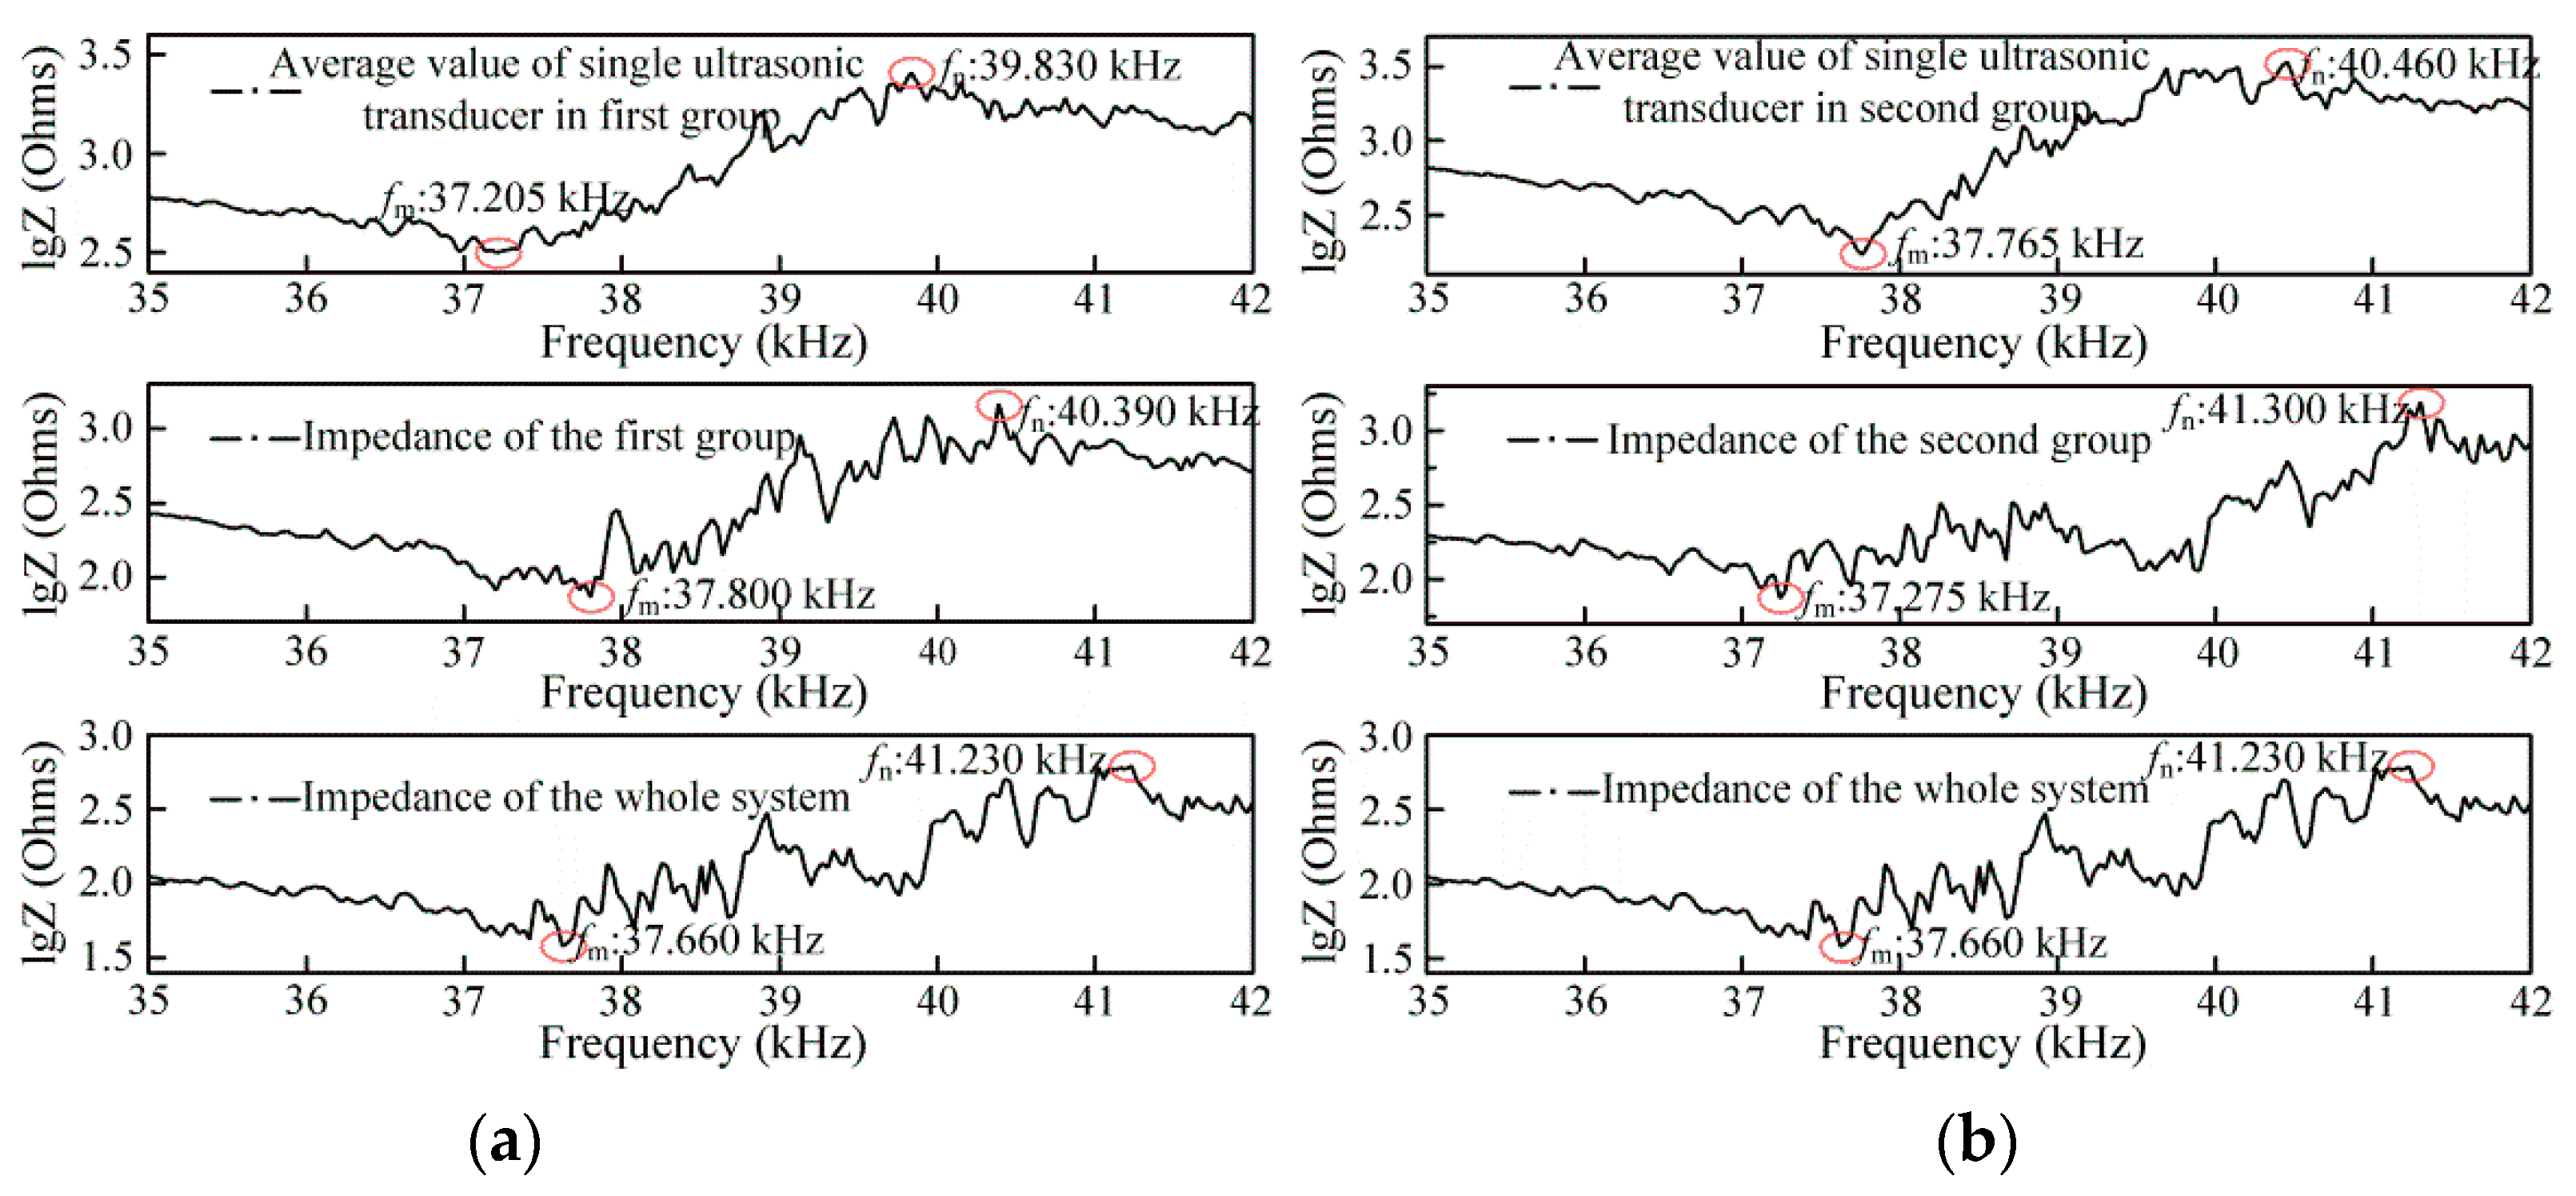
To improve the electro-mechanical conversion efficiency of the ultrasonic transducer, the working frequency of the ultrasonic power supply should be identical or close to the resonance frequency of the ultrasonic transducer at which the mechanical resonance of piezoelectric vibrator occurs, and the vibration amplitude of the vibrator and elastic energy should be maximised. In the present study, two groups of ultrasonic transducers were installed on the copper plate and exhibited boundary dimensions of 505 mm × 405 mm × 1.38 mm. Each group contained three ultrasonic transducers. The installation interval of each of the two groups was 130 mm and the spacing between any two transducers was 215 mm. The impedance of each group and the phased array system is measured using a PV-70A impedance analyser. The average impedance of a single ultrasonic transducer in each group is illustrated in Figure 10.
Impedance analysis was used to realise the mutual matching between the output frequency of the ultrasonic power supply and the resonance frequency of the ultrasonic transducer, and it also made the piezoelectric vibrator operate at its resonant frequency to improve the mechanical quality factor and electromechanical coupling coefficient of the ultrasonic transducers. Figure 10 illustrates the impedance of a single ultrasonic transducer, the average impedance of a single transducer for each group, the impedance of each transducer group, and the complete system impedance variation with respect to the frequency when the ultrasonic transducers were in a free condition or fixed on the copper plate. As illustrated in Figure 10, when the ultrasonic transducer was fixed on the copper plate, the resonant frequency of the transducer shifted to the low-frequency region, and the impedance at the resonant frequency increased. The analysis results indicate that the external load was typically considered to be zero during the transducer design process, and the external load caused a resonance frequency difference between the transducer design and the actual working process. Therefore, given the influence of the external load, the designed resonant frequency of the transducer generally slightly exceeded the actual working resonant frequency.
Additionally, the frequency and impedance consistency adjustment are more difficult than single ultrasonic transducer because the external load is unknown during the ultrasonic design process; thus, the ultrasonic power supply is often needed to solve the impedance-variation problem and tuning problem. When an ultrasonic transducer is under a certain working frequency, a phase angle θ exists between the voltage and current of the transducer owing to the static reactance and static capacitance, and the output power of the transducer is P = V I cos θ . To maintain the maximal output power of the transducer, a reactance is often added in series or parallel at the ultrasonic power output end to ensure that the phase angle is close to zero, and the ultrasonic power load subsequently corresponds to the pure resistance load. Therefore, the impedance of the vibrator system was initially analysed, and it was necessary to adjust the output frequency of the ultrasonic power supply to the frequency corresponding to the minimum system impedance to improve the coupling process between the ultrasonic power supply and ultrasonic transducer.
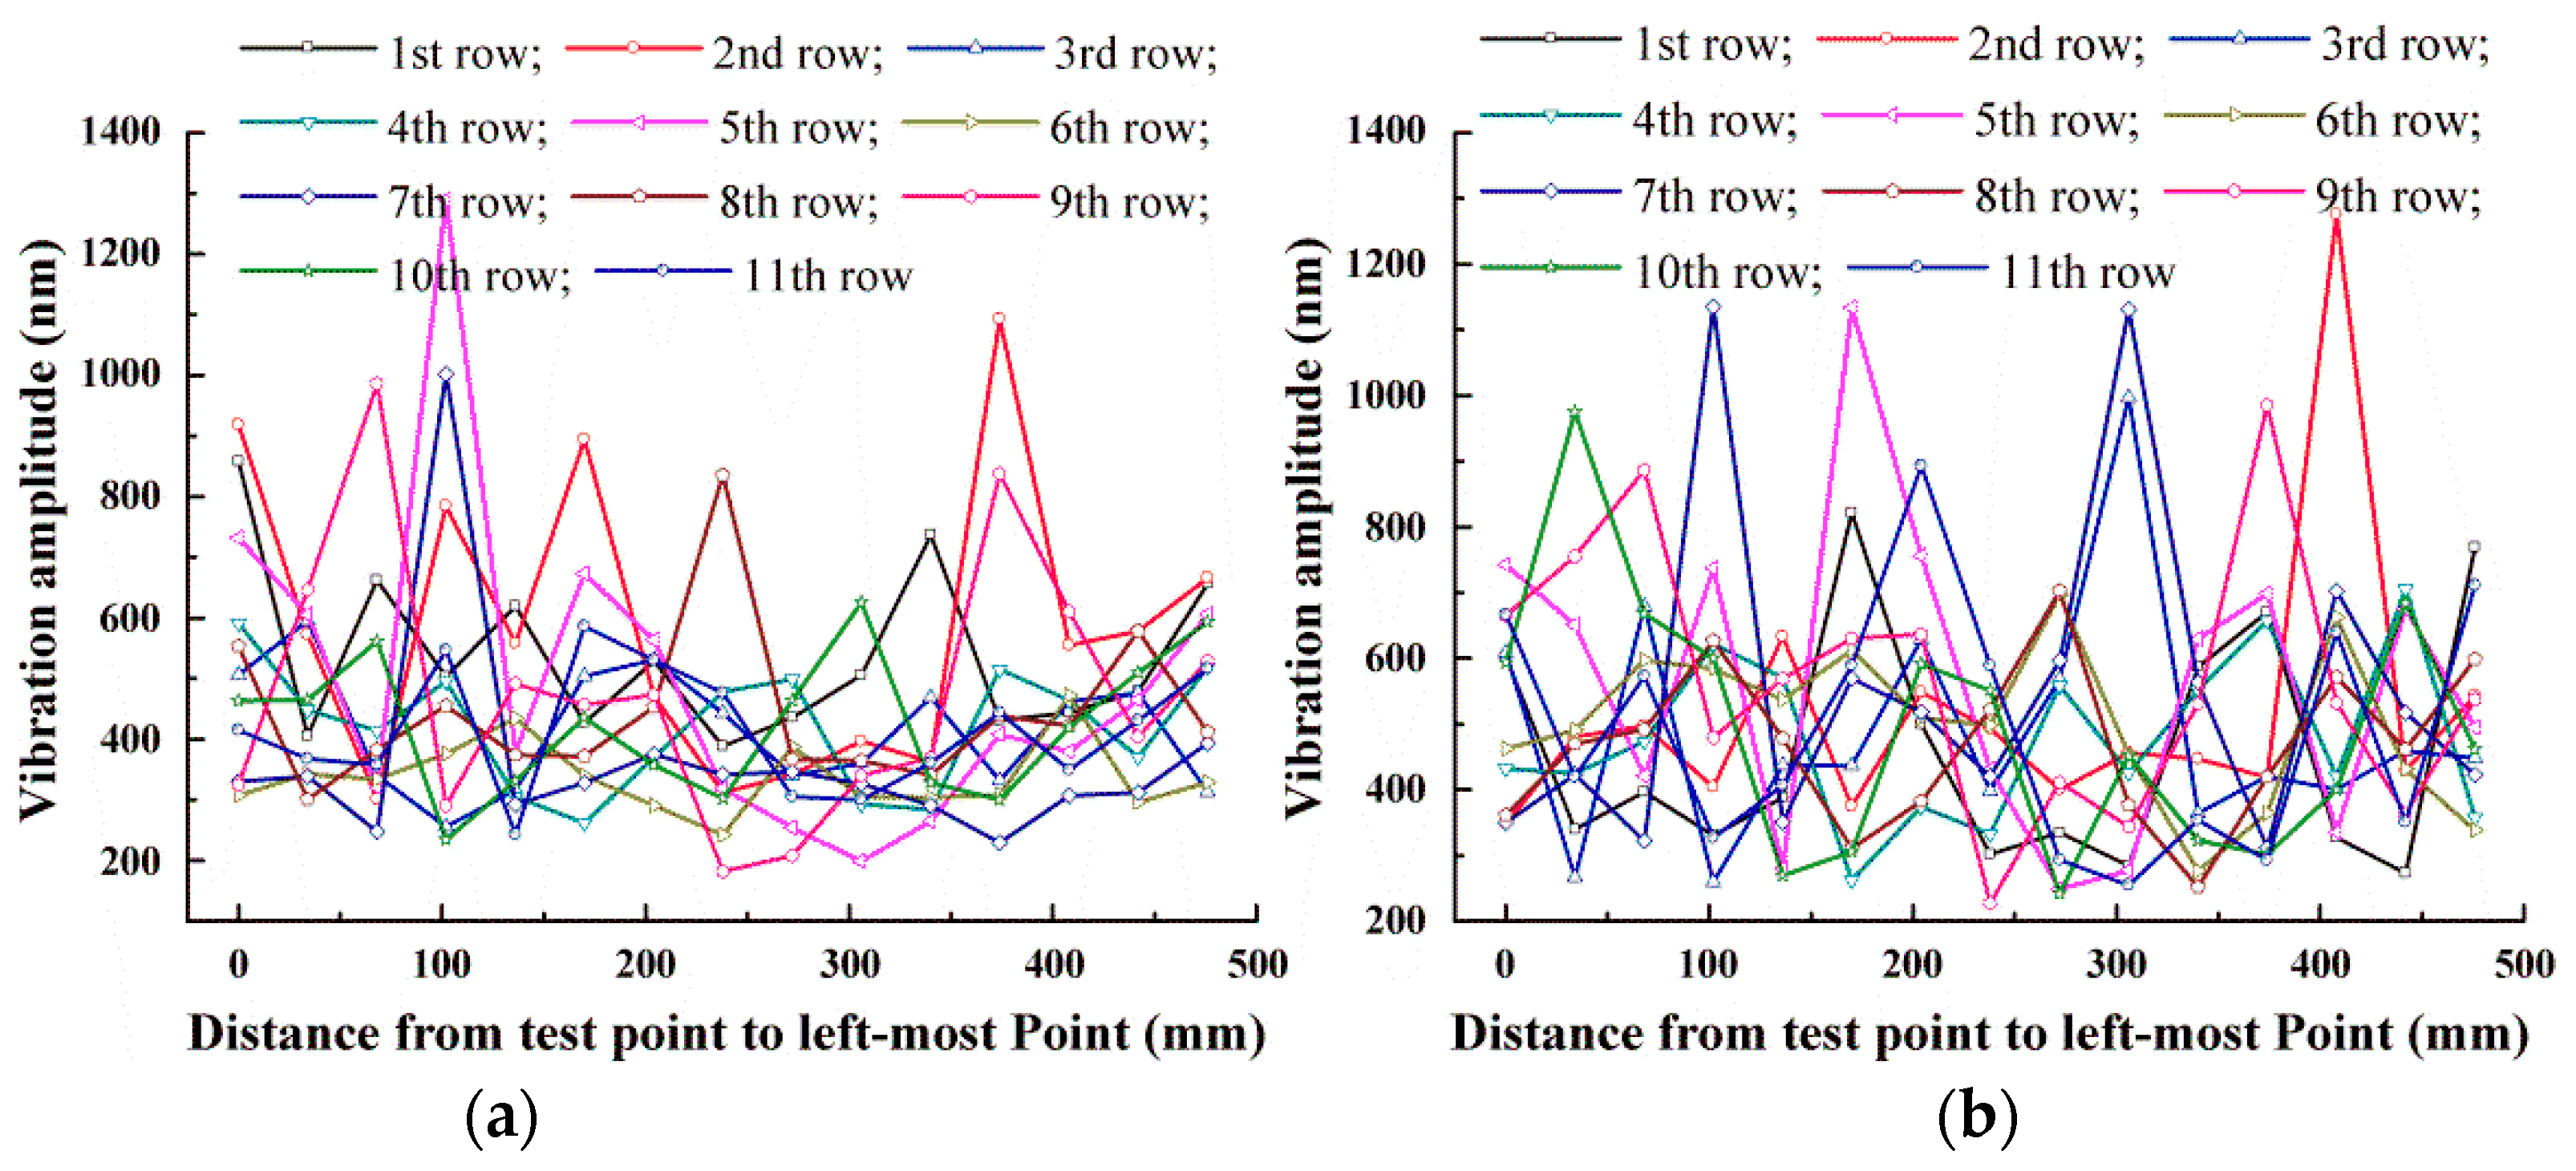
Figure 11 illustrates the vibration characteristics on the copper plate when different ultrasonic transducers were opened. As illustrated in Figure 11, the vibration amplitude of each test point on the copper plate surface exceeds 200 nm, and the amplitude is greater when the test point closer to ultrasonic transducer. The position of the amplitude peak appeared at the fourth point of the fifth row when three ultrasonic transducers were opened. On the surface of the copper plate, only two test points exceeded 1 mm in vibration amplitude, and the vibration amplitude value was relatively significant at both ends and insignificant in the middle. According to the calculations and experimental measurements, the average vibration amplitude was approximately 447.7 nm, and the vibration peak appeared at the test points near the transducers, while the vibration attenuation characteristics approximately exhibited a wave distribution. The analysis results suggest that, given the effect of the installation quality and installation position of each transducer, there were differences in the reflection and refraction waves from the multiple-propagation interface superimposed at certain points. Therefore, the ultrasonic energy attenuation on the copper plate surface exhibited a nonsymmetrical distribution.
Additionally, the maximum amplitude peak appeared at the 13th point of ninth row when six ultrasonic transducers were fully operated. On the copper plate surface, the vibration amplitude of five points exceeded 1 mm, and the vibration amplitude distribution was relatively uniform. Furthermore, the vibration peak alternately appeared at every two or three test points, and the average amplitude was approximately 508.8 nm. A comparison of Figure 11a,b indicates that although the amplitude of the operated ultrasonic transducer in Figure 11b was twice as large as that in Figure 11a, the average amplitude in Figure 11b was not twice that in Figure 11a. The analysis reveals that it was difficult to use a single ultrasonic power supply to match the resonance frequency of each ultrasonic transducer in the vibration system. Furthermore, the vibration amplitude at a certain point on the copper plate surface exhibited the superposition effect of multiple reflection waves and refraction waves at this point. Therefore, a linear increase in the number of transducers did not lead to a linear increase in the vibration amplitude.
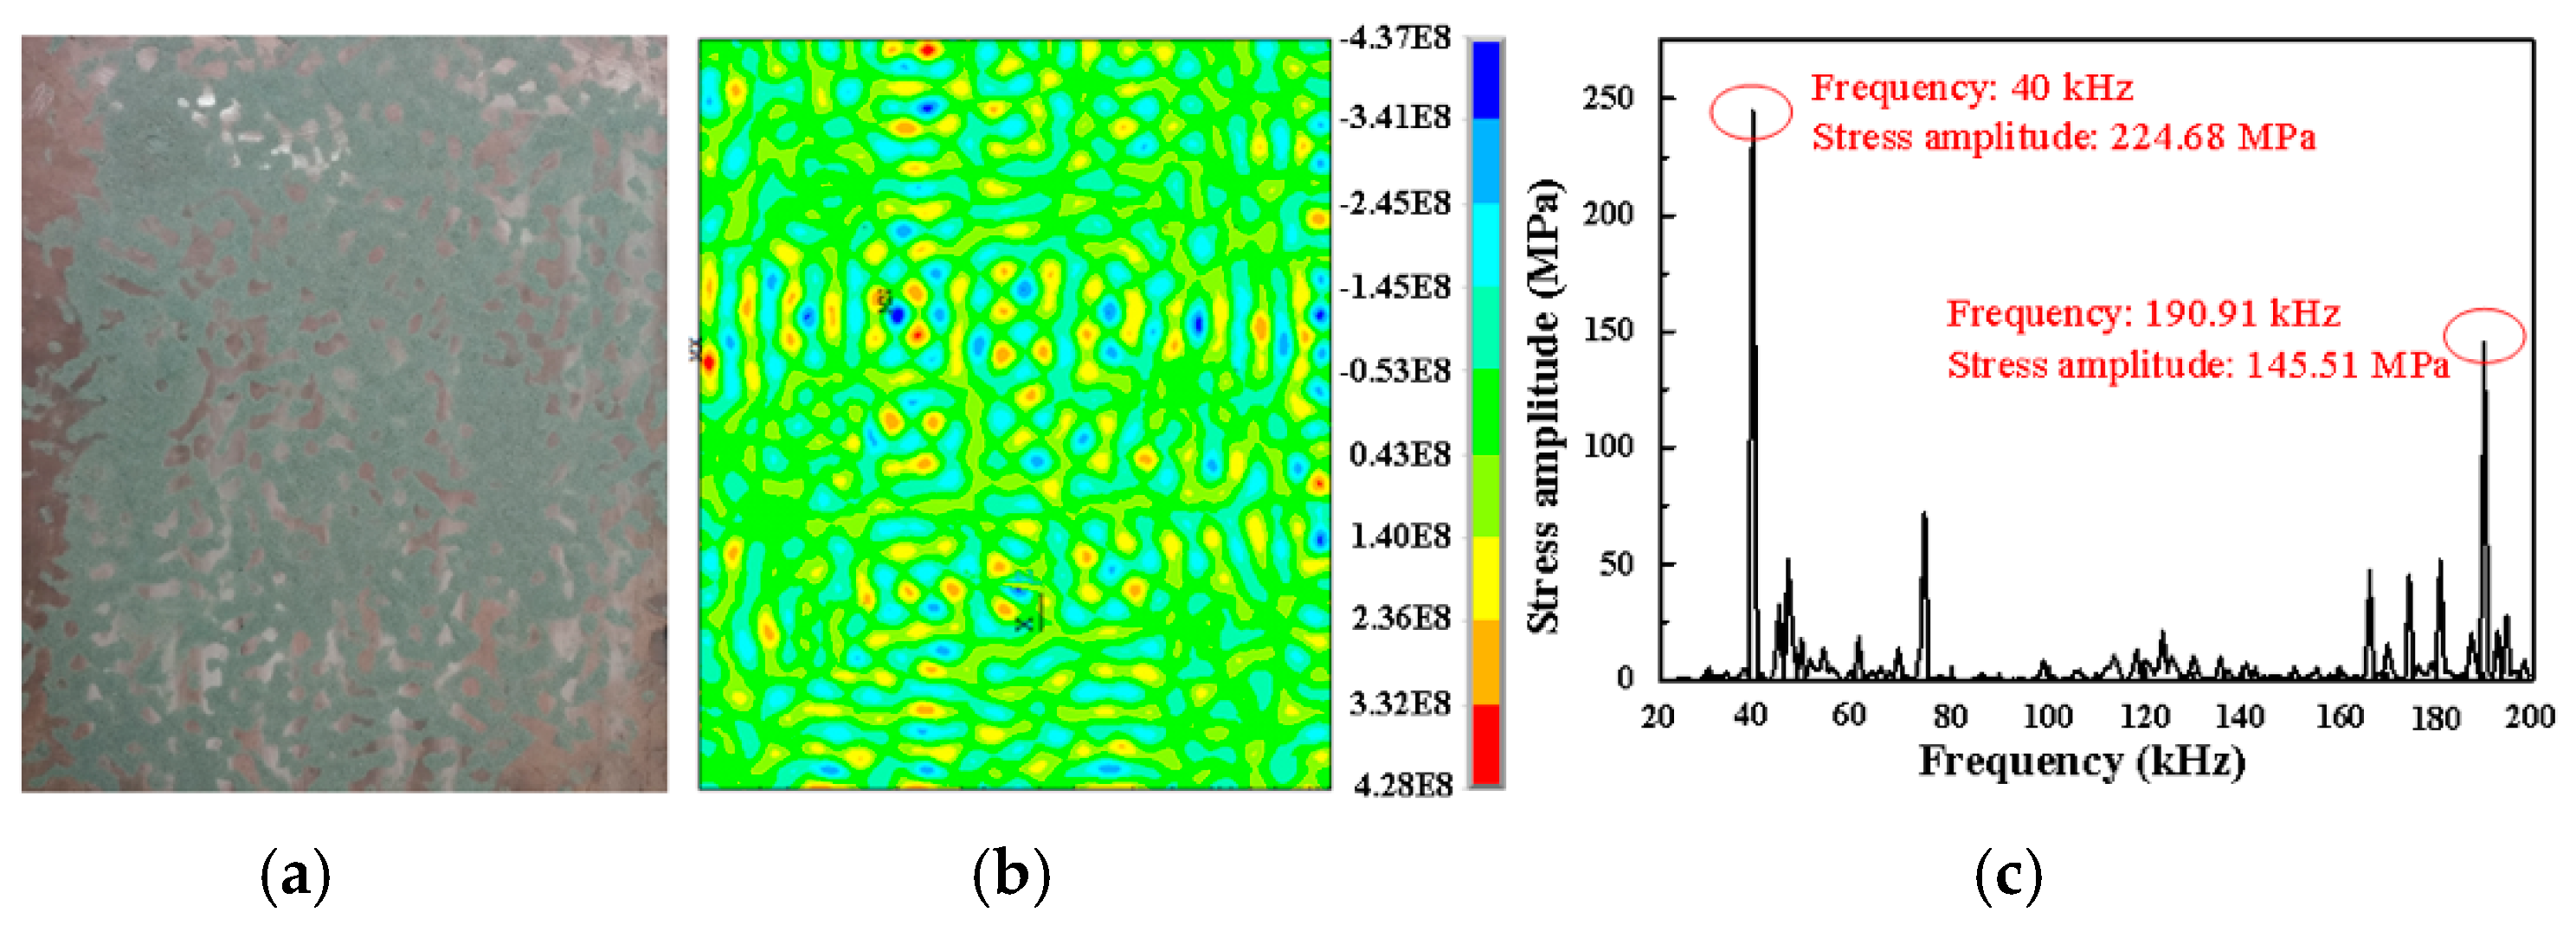
To identify the vibration characteristics of the copper plate and the ultrasonic energy attenuation characteristics under multiple-transducer excitation of 40 kHz, the vibration shape and amplitude-frequency curve for a 0.38-mm-thick copper plate are illustrated in Figure 12. A comparison of Figure 12a,b indicates that when six transducers were fully operated, the measured vibration shape and the stress distribution characteristics of the finite-element calculation on the copper plate surface were similar without consideration of the energy dissipation. Furthermore, the actual vibration shape and simulated stress distribution on the copper plate surface were approximately wave-like, an evident superposition phenomenon appeared in a certain region, and the positive and negative stress regions appeared alternately. The analysis results indicate that when multiple ultrasonic beams excited by the ultrasonic transducers propagated in the copper plate, the wave groups were mutually superposed on the copper plate surface through reflection and refraction with the interface. According to the principle of wave superposition, when multiple ultrasonic beams are superposed on each other with identical or similar frequencies, the vibration amplitude increases in certain areas along the wave propagation direction, while it decreases in other areas, even forming a standing wave. In the visualisation experiment of the ultrasonic vibration energy distribution, small sand particles were maintained as beating and could not remain in certain regions of the copper plate surface, while in other regions, the small sand particles were essentially motionless and simply moved slowly to the area under the influence of ultrasonic vibration. Therefore, the vibration-strengthening areas and vibration-attenuation areas that formed on the plate surface appeared alternately, and corresponding stress-strengthening and stress-attenuation areas were formed on the copper plate surface.
Additionally, a comparison of the amplitude-frequency curves for multiple nodes indicated that the maximum vibration amplitude appeared at 40 and 191 kHz when the six ultrasonic transducers were operated, as illustrated in Figure 12b. The analysis suggests that differences in the excitation frequency and number of opened transducers led to differences in the distance between the measured node and the centre of the vibration source as well as the wave phase in the measured node. Therefore, there were differences in the maximum vibration amplitudes in different modes for different frequencies, because the excitation frequency and installation distance of the ultrasonic transducer affected the amplitude superposition effect.
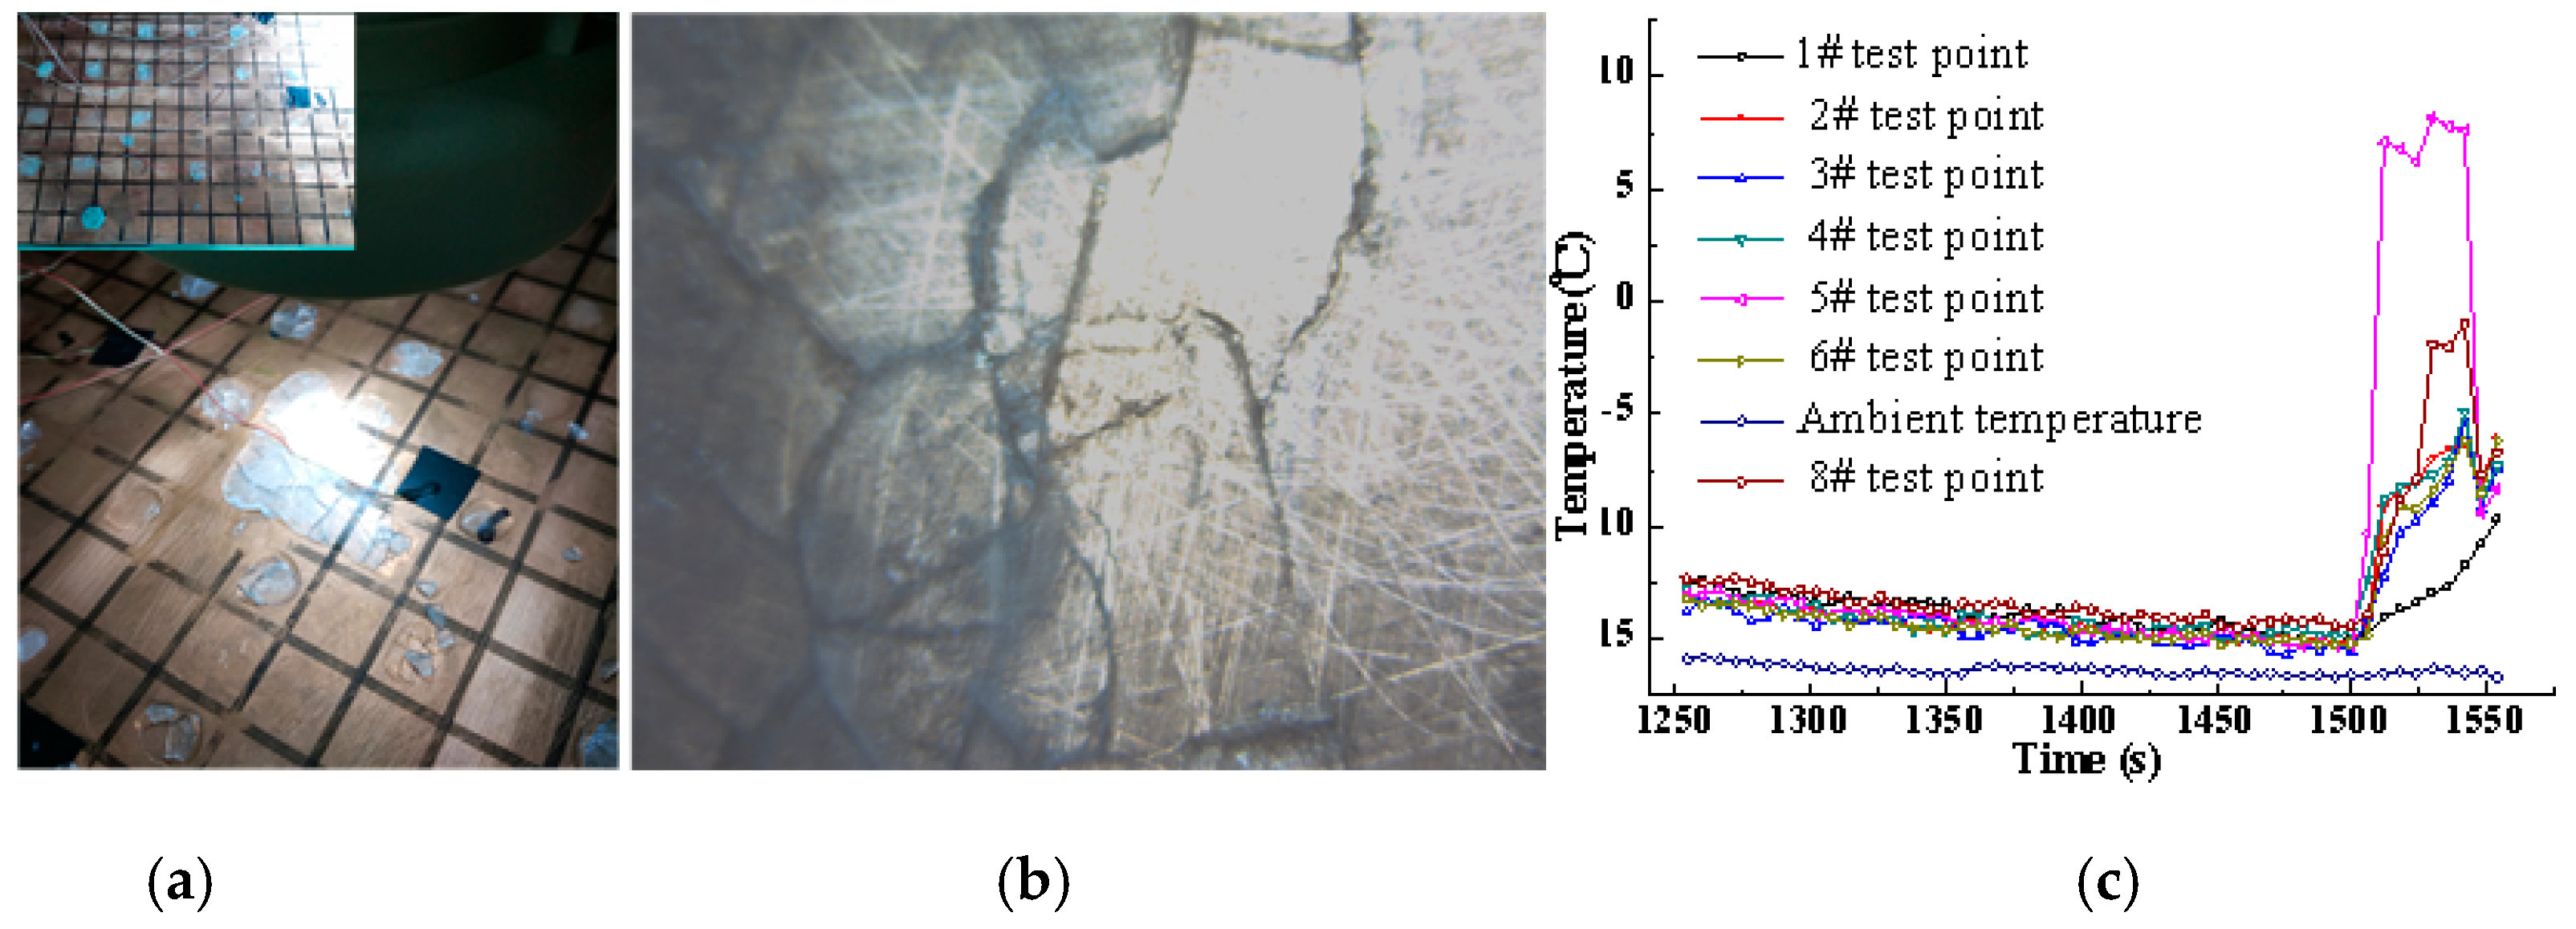
Figure 13 illustrates a macroscopic image of the basic frost layer removal, a macroscopic image of the basic frost layer cracking, and the temperature variation under ultrasonic excitation. During the experiment, the frozen droplets did not crack immediately when the ultrasonic transducers were opened; most of the frozen droplets began to crack when the ultrasonic transducers had been operating for approximately 8 s. The frozen droplets at different locations on the copper plate surface cracked at different times, and the frozen droplets at certain locations were not removed throughout the entire frost layer removal process. The locations where the frozen droplets were removed changed with respect to the number of opened ultrasonic transducers, and the number of removed frozen droplets decreased with a decrease in the number of opened ultrasonic transducers. The microscale observation of the basic frost layer removal indicated that the frozen droplets at certain locations on the copper plate surface rapidly cracked from the centre of the droplets after the ultrasonic transducers were opened for approximately 8 s. Subsequently, a thin water film appeared at the interface between the frozen droplets and copper plate, and the thickness of the water film gradually increased until the frozen droplets completely fell off. Conversely, the frozen droplets at other locations did not exhibit changes during the entire defrosting process.
As illustrated in Figure 13c, when the ultrasonic transducers were opened and the ambient temperature in the cabinet remained unchanged, the test point on the copper plate surface experienced a sudden increase in temperature, and the temperature increase was more evident if the test point was near the ultrasonic transducer. The analysis results indicate that the ultrasonic energy was focused at the interface between the copper plate and frozen droplets owing to the difference in the material parameters of the copper and ice, and the ultrasonic energy focusing increased the interface temperature. Simultaneously, the frozen droplets were under the effect of high-frequency alternating stress and temperature increases, and a thin water film formed at the interfaces. As time passed, the thickness of the water film increased under ultrasonic cavitation until the frozen droplets were completely removed. Finally, the Lamb wave and SH wave excited by the ultrasonic vibration in the copper plate were responsible for ice layer cracking and delamination; thus, the cracking of frozen droplets initially occurred, and the frozen droplets subsequently shifted under ultrasonic vibration. Therefore, the main mechanism of the removal of frozen droplets was related to perpendicular stress excited by the Lamb wave exceeding the tensile strength of the ice, which caused the cracking of the frozen droplets. Additionally, the differential transverse shear stress at the interface was generated by the SH wave, owing to the wave velocity differential, and the heating effect at the interface was produced by ultrasonic guided waves because of the concentration of energy. This increased the water-film thickness and caused shifting due to the ultrasonic cavitation effect and shear stress. Hence, the combination of the ultrasonic stress effect and cavitation effect was the main reason for the ice layer removal.

3.4. Analysis of Ultrasonic Array Defrosting Performance

With restrictions on the effective defrosting area of a single ultrasonic transducer, the large-capacity ASHP typically uses ultrasonic array transducers for defrosting purposes for evaporators in practical applications, and the ultrasonic array can increase the defrosting power consumption. Therefore, the COP is used to evaluate the ultrasonic array defrosting efficiency. 
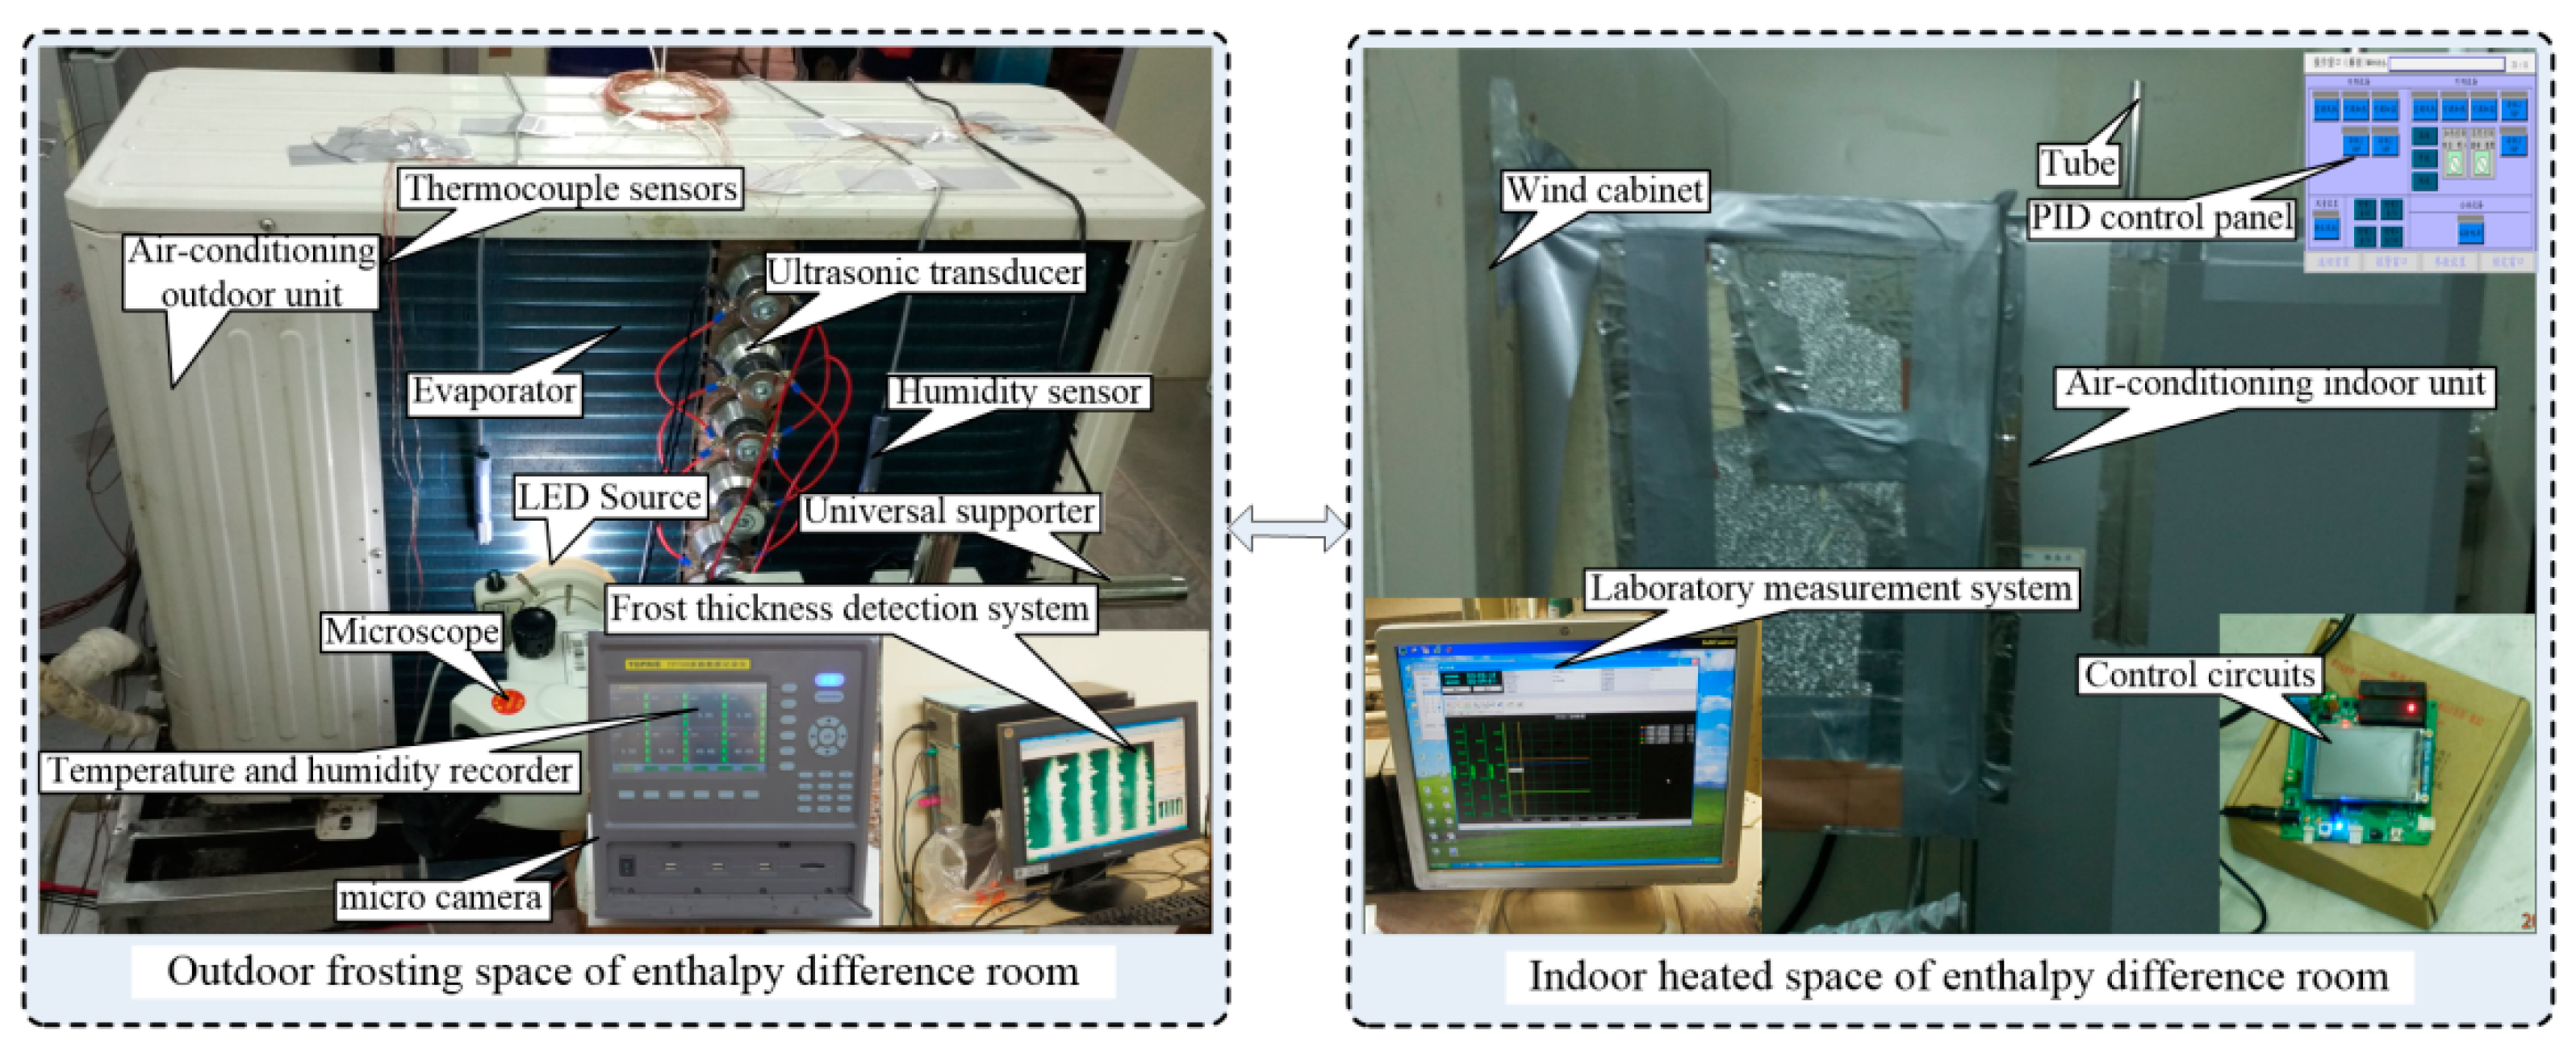
Figure 14 illustrates photographs of the defrosting experiment involving the ASHP unit installed in an enthalpy laboratory, which included a temperature and humidity recorder (the measurement accuracies for the temperature and RH were 0.2 °C and 2%, respectively, and the measurement ranges were −40 °C to 100 °C and 20% to 98%, respectively), a frost layer thickness measuring system (with an accuracy of 0.01 mm), a laboratory measurement system (the measurement accuracies for the temperature and RH were 0.1 °C and 1%, respectively, and that for the power consumption was 0.5 W), and control circuits.
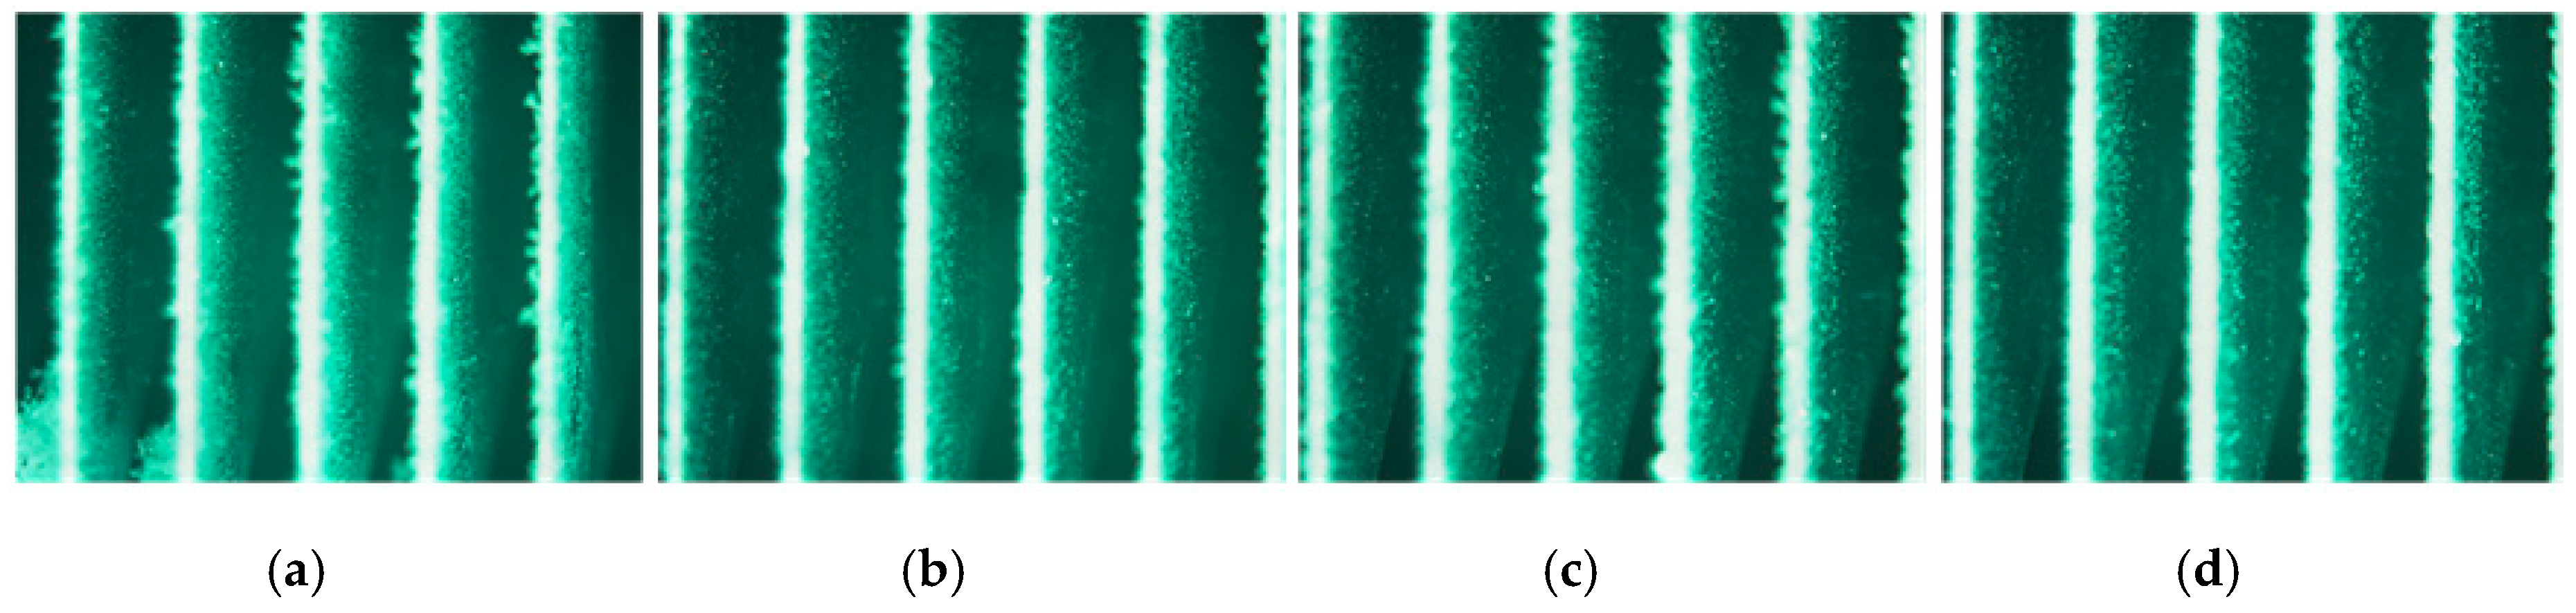
A GREE 3HP commercial ASHP unit installed in an artificial environment laboratory was selected as the experimental unit. Under the conditions of DB (dry bulb temperature) = 2 °C, RH = 85%, microscopic images of the frost fin were captured under different ultrasonic loading modes when the ASHP unit operated for 60 min, as illustrated in Figure 15. A comparison of the microscopic images of the fin frost indicated that the thinnest frost layer occurred in mode III (mode I: without ultrasonic vibration; mode II: intermittent 50 s, vibration 10 s; mode III: intermittent 110 s, vibration 10 s; mode IV: intermittent 170 s, vibration 10 s; mode V: intermittent 230 s, vibration 10 s), and the thickest frost layer occurred in mode V. The results indicate that more energy was input to the evaporator under the working conditions of the ultrasonic array transducers, which compensated for the energy dissipation during the ultrasonic transfer process and increased the effective defrosting area. Furthermore, the density of the stress-concentration regions increased owing to reflection and refraction wave superposition, which explains the thin basic frost layer on the fin surface.
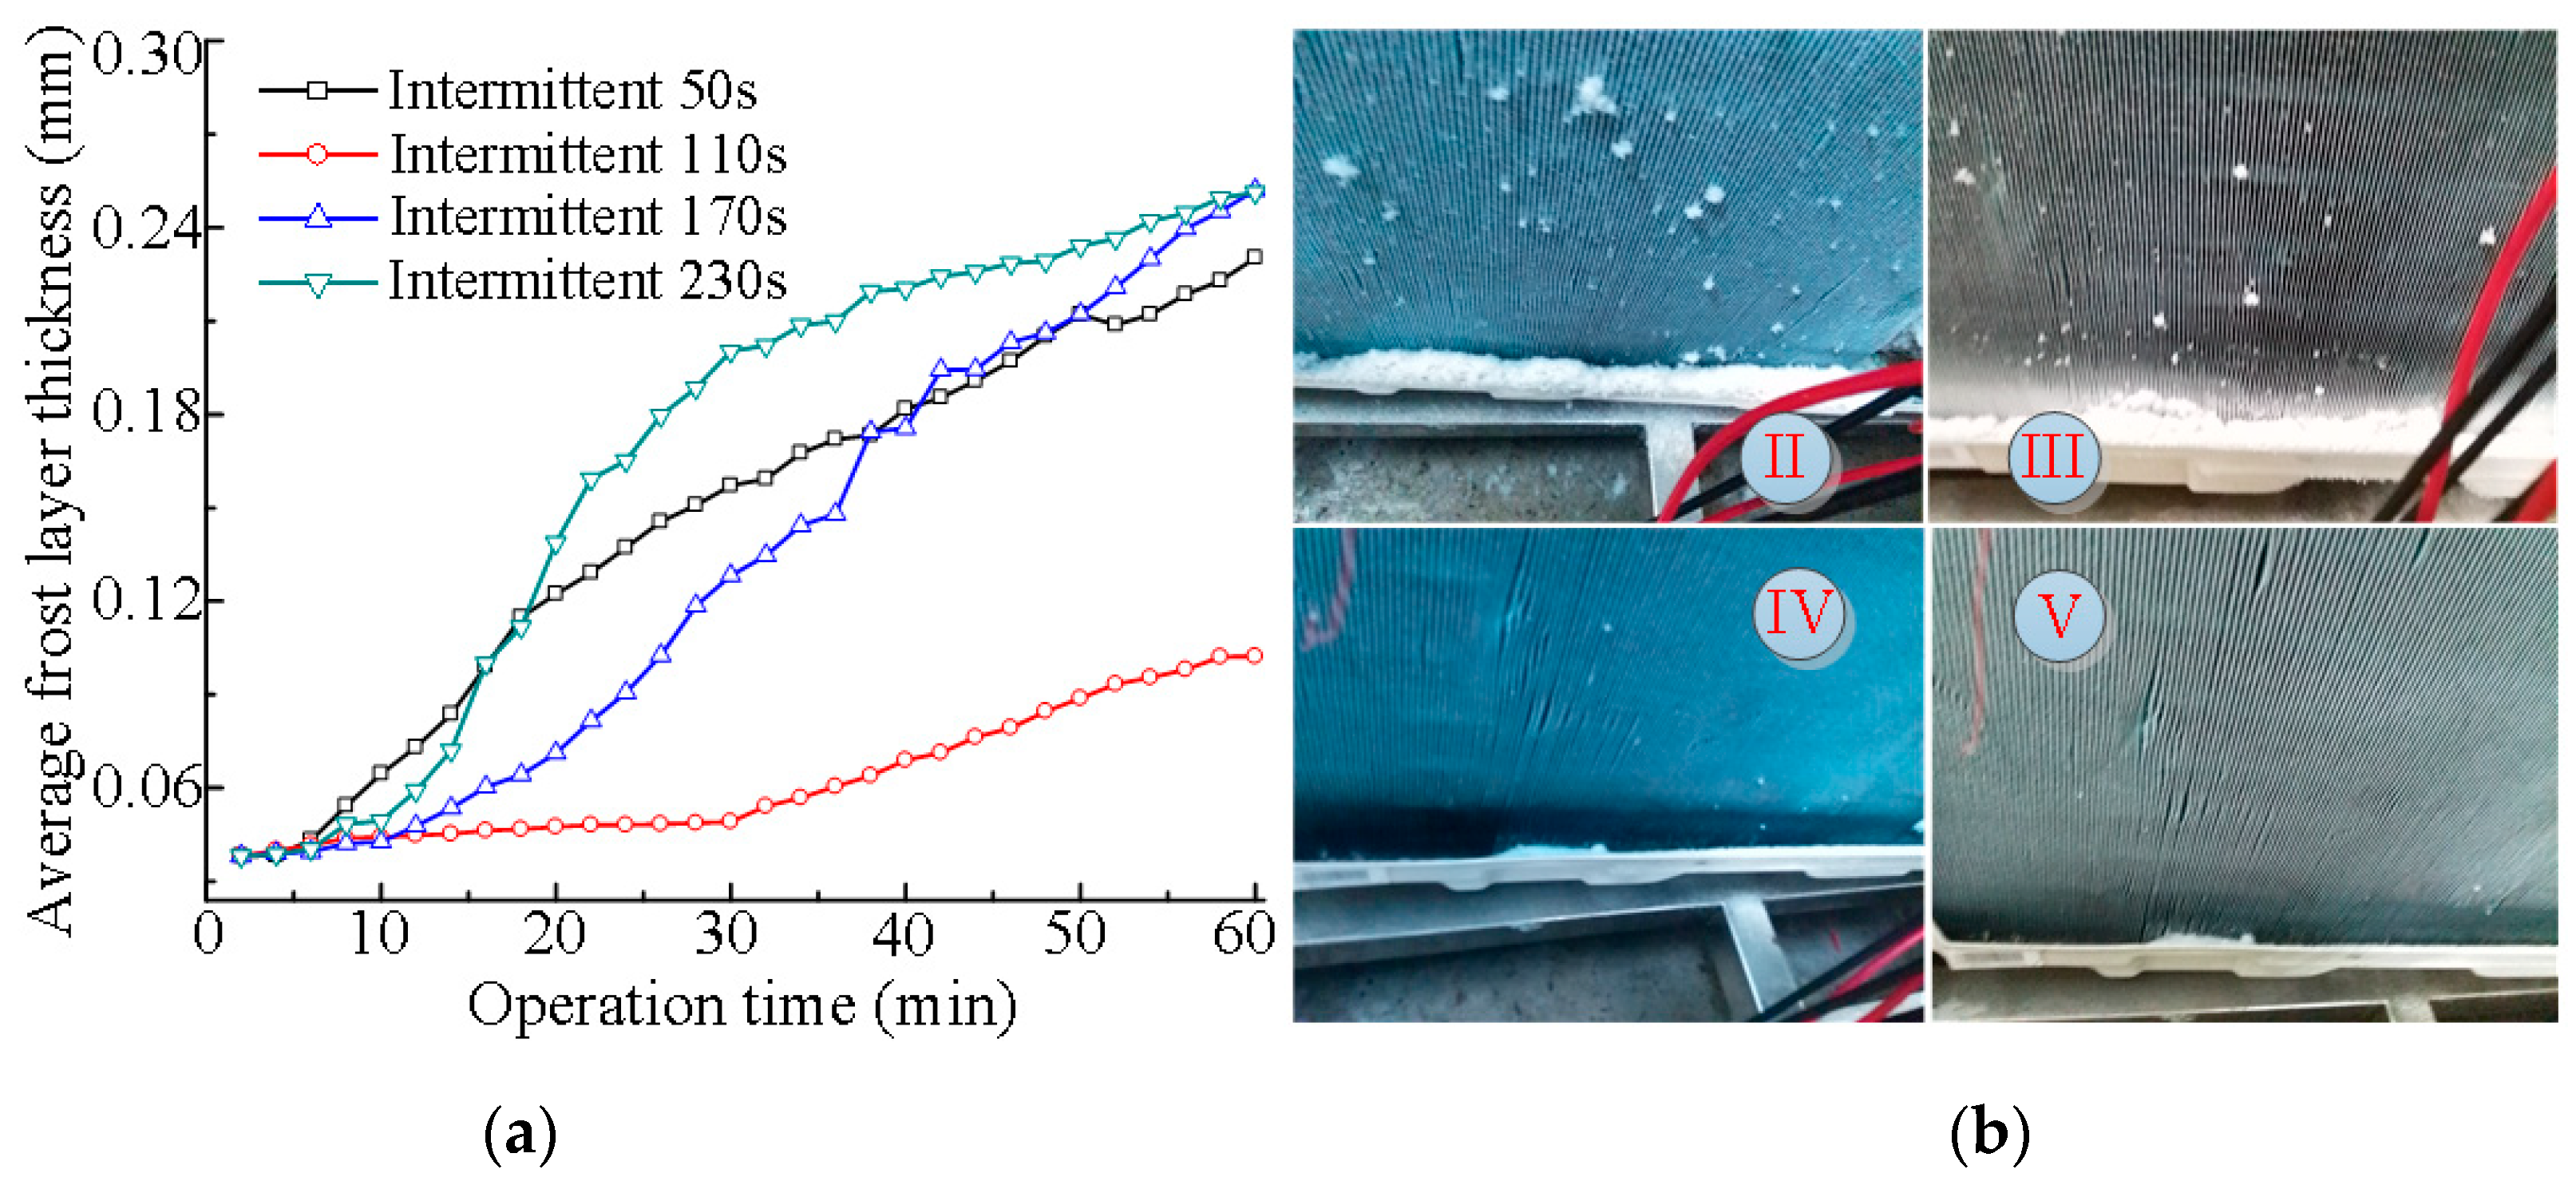
Figure 16 illustrates the measured frost layer thickness and macroscopic frost images of the fin surface in different ultrasonic loading modes. The microscopic images of the frost on the cold surface indicate that the frost layer thickness on the fin surface was maintained at <0.15 mm after the ASHP unit operated in the optimal ultrasonic loading mode for approximately 60 min. The space between adjacent fins was 1.5 mm; thus, the blocking probability of the air-flow channel was <10%. Furthermore, the experimental results indicate that the intermittent defrosting method using the ultrasonic array was feasible for the ASHP unit, and the frost layer thickness on the fin surface increased in the following order: mode III < mode II < mode IV < mode V. As illustrated in Figure 16b, only a few frost heap residues remained on the evaporator surface, and the changes in the trend of the frost layer thickness matched the amount of frost removed from the evaporator. In summary, without considering the effects of the operation environment and measurement error, the defrosting dead angle was eliminated using the intermittent ultrasonic array defrosting method and did not realise the frosting operation of the ASHP unit.
To evaluate the engineering application value of a defrosting method, it is necessary to reasonably assess its defrosting energy consumption and defrosting efficiency. Given the existence of the frost layer, the COP is affected by reductions in the heat-transfer efficiency of the evaporator. Therefore, the COP was used to evaluate the ultrasonic array defrosting efficiency for the ASHP unit. During the ultrasonic array defrosting experiment, five ultrasonic transducers (resonance frequency of 40 kHz, and rated power of 50 W) were fixed on the vibration transfer plate. When the ambient temperature and RH reached a steady state (DB = 2 °C, RH = 85%), the five transducers (with an installation space of 132 mm) were opened to ensure that the evaporator underwent forced vibration.
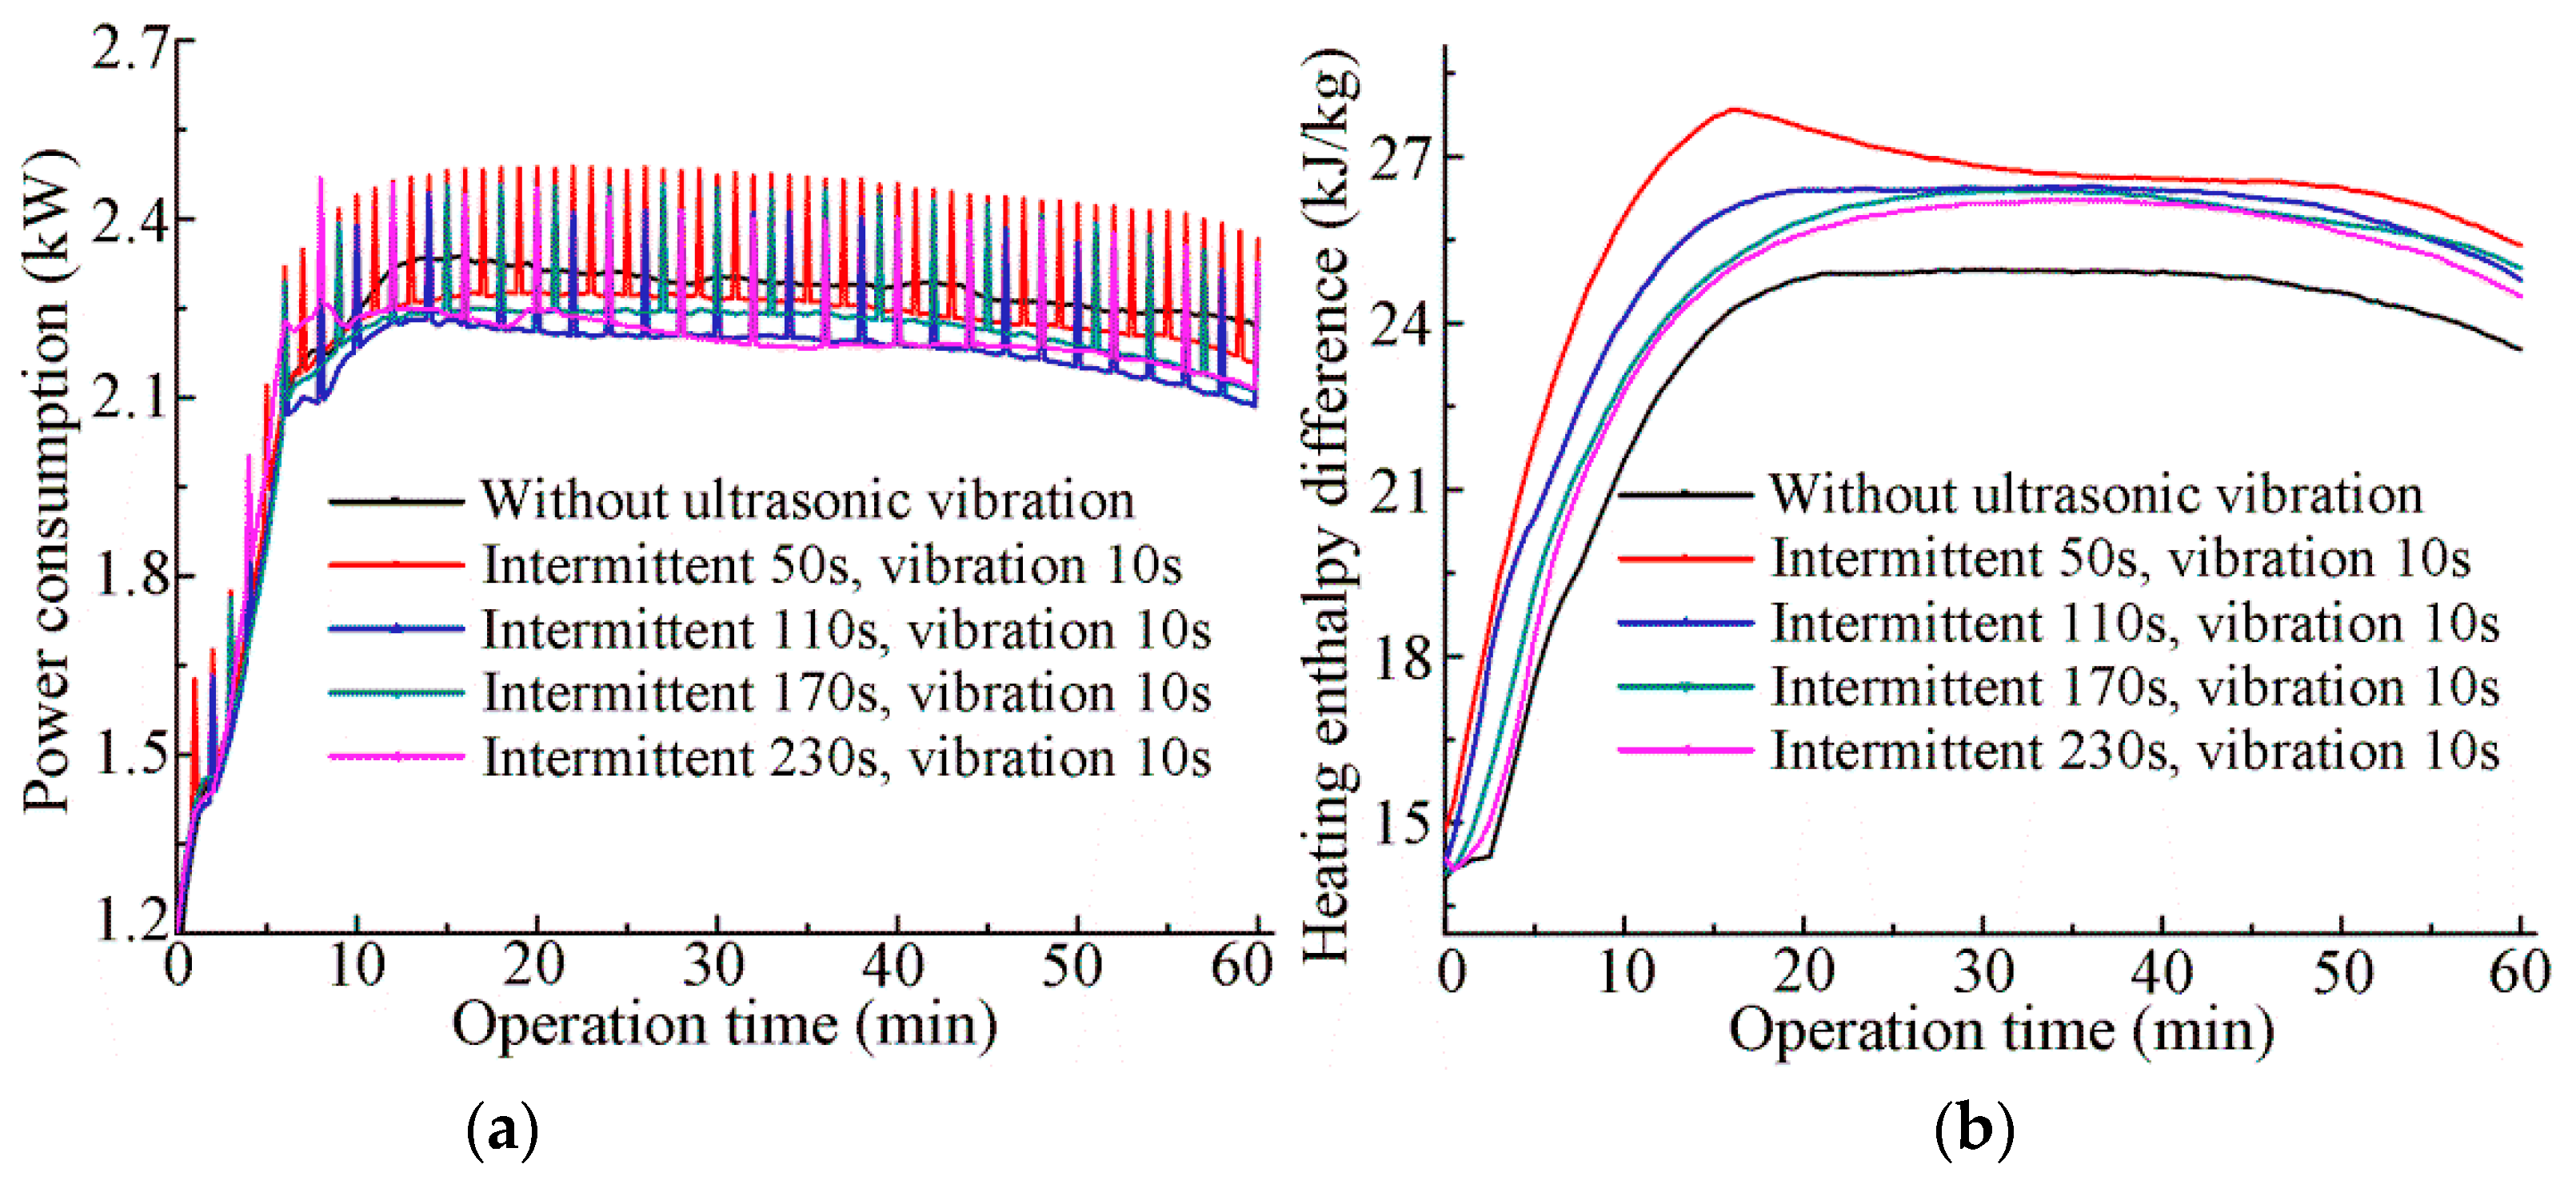
Figure 17 illustrates the energy consumption and heating capacity in different intermittent ultrasonic vibration modes. As shown, the power consumption of the ASHP unit rapidly increased at the initial operation stage, and subsequently reached a steady state. Furthermore, under different ultrasonic loading modes, the power-consumption peak of the ultrasonic array system appeared on the power curve at each corresponding intermittent time, and the peak value was approximately 210 W. The rated power of the ultrasonic transducer was 50 W, and the corresponding rated power of the ultrasonic array system was 250 W. The experiment results indicate that there were differences in the actual work frequencies of the ultrasonic transducers due to installation inconsistencies, and the single power supply was significant such that each ultrasonic transducer was in the resonance condition. Thus, the actual power consumption was smaller than the rated power consumption.
Additionally, the heat supply enthalpy difference increased after the operation of the ultrasonic array transducers, and the added value of the heat supply decreased with an increase in the intermittent time. This suggests that air flow near the fin surface was disturbed by ultrasonic vibration, which increased the heat-exchange efficiency of the evaporator. Furthermore, the thermal resistance of the evaporator decreased because part of the frost layer was removed under the ultrasonic vibration. Without considering the influence of the ambient conditions, the average power consumption and heat-supply enthalpy difference in different ultrasonic loading modes were calculated by integrating the power-consumption curve and heat-supply enthalpy difference curve. According to the average power consumption and heat-supply enthalpy difference, the COPs of the ASHP unit under different ultrasonic loading modes were obtained, as listed in Table 2.
As indicated by Table 2, under the ultrasonic vibration, the power consumption of the ASHP unit decreased, while the average heat-supply enthalpy difference increased. We selected mode I as the standard; the rate of decrease of the power consumption ranged from −3.27% to 0.12%, and the rate of increase of the heat supply enthalpy difference ranged from 4.47% to 10.86%. According to the results, the energy efficiency index (a well-accepted national industrial standard of China) of the experimental ASHP unit corresponded to the secondary energy efficiency (the corresponding COP was between 3.2 and 3.39), and the increment percentage of the COP ranged between 7.16% and 11.12%. Therefore, the ultrasonic array defrosting clearly improved the operation efficiency and reduced the energy consumption of the ASHP unit; thus, its industrial application can overcome a few of the disadvantages of the existing defrosting methods.
Furthermore, the defrosting cycle of the ASHP unit is approximately 120 min under the frosting condition, and the entire defrosting duration is approximately 10 min, as indicated by previous studies [6,17]. Therefore, the power consumptions of the RCD and ultrasonic array defrosting over 120 min were calculated as follows:
W RCD = P t = 2200 × 10 × 60 = 1320 kJ
W Ultrasonic array = P t = 210 × 10 × 120 = 252 kJ ( Intermittent   50   s ,   vibration   10   s ) = 210 × 10 × 120 / 2 = 126 kJ ( Intermittent   110   s ,   vibration   10   s ) = 210 × 10 × 120 / 3 = 84 kJ ( Intermittent   170   s ,   vibration   10   s ) = 210 × 10 × 120 / 4 = 63 kJ ( Intermittent   170   s ,   vibration   10   s )
Compared with the traditional RCD, the power consumption of the RCD was 3–12 times that of ultrasonic array defrosting. Additionally, very little frost accumulated on the evaporator surface after the ASHP unit had been in operation for 60 min, and only a thin frost layer was present on the fin surface. Thus, the ultrasonic array vibration improved the heat-transfer efficiency of the evaporator and the environmental adaptability of the ASHP unit. Moreover, the ASHP unit continued to operate in the heating mode during the ultrasonic array defrosting process, and the thermal comfort of the indoor space was improved without temperature fluctuations. Therefore, the ultrasonic array defrosting method has a high efficiency and small power consumption, and its engineering application was proven to be feasible in the experiment.

4. Conclusions

Ultrasonic array focusing defrosting technology and its application to the defrosting performance improvement of ASHP units were investigated. According to the results, the following conclusions can be drawn.
(1)
A reasonable delay time was applied to each ultrasonic vibrator, and directional focusing of the ultrasonic array beam was achieved. The consistency in the results of theoretical analysis, numerical calculations, and experimental verification indicated that an intensive stress concentration area was formed by ultrasonic array focusing.
(2)
Ultrasonic array focusing compensated for the energy dissipation of a single ultrasonic source in the propagation process, and the effective defrosting area increased because a part of the basic frost layer in the stress concentration area cracked and fell off. The main mechanism of the basic frost layer removal was a combination of the ultrasonic stress effect and the cavitation effect.
(3)
The perpendicular stress elicited by the Lamb wave and the differential transverse shear stress generated by the SH wave exceeded the tensile strength and adhesion stress of the basic frost layer. Thus, the basic frost layer cracked and peeled away from the cold surface.
(4)
Power consumption and enthalpy difference analyses revealed that the power consumption decreased from −3.27% to 0.12%, and the heat-supply enthalpy difference increased from 4.47% to 10.86%. Therefore, the increment percentage of the COP was between 7.16% and 11.12%, and the power consumption of RCD was 3–12 times that of the ultrasonic array defrosting.

Author Contributions

H.T. conceived and designed the experiments, including experimental bench and experimental procedure design, and finally performed the experiments. X.Z. performed ultrasonic power supply and control circuit design. L.Z. performed experimental data analysis and numerical simulation. T.T. performed design and guidance of paper writing ideas. G.X. performed the guidance of the general idea.

Funding

This research was funded by the National Natural Science Fund of China (No. 51575422) and the Research Startup Foundation of UESTC (No. 418YKQN01).

Conflicts of Interest

The authors declare that they have no known competing financial interests or personal relationships that could have appeared to influence the work reported in this paper.

Nomenclature

E Young’s modulus
λ Lamé constant
ν Poisson’s ratio
c S Transverse wave velocity
F Distance between ultrasonic array centre and focusing point
θ Steering angle
Δ τ n Delay time of adjacent element
N Total number of ultrasonic array transducers
μ = G Shear modulus
ρ Density
c L Longitudinal wave velocity
Z Impedance
d Distance between adjacent ultrasonic transducers
t i Required delay time for the ith element
c Wave speed in the medium

References

  1. Wang, F.; Liang, C.; Zhang, X.; Zhang, Y. Effects of surface wettability and defrosting conditions on defrosting performance of fin-tube heat exchanger. Exp. Therm. Fluid Sci. 2018, 93, 334–343. [Google Scholar] [CrossRef]
  2. Qiao, H.; Aute, V.; Radermacher, R. Modeling of transient characteristics of an air source heat pump with vapor injection during reverse-cycle defrosting. Int. J. Refrig. 2018, 88, 24–34. [Google Scholar] [CrossRef]
  3. Nasr, M.R.; Kassai, M.; Ge, G.; Simonson, C.J. Evaluation of defrosting methods for air-to-air heat/energy exchangers on energy consumption of ventilation. Appl. Energy 2015, 151, 32–40. [Google Scholar] [CrossRef]
  4. Liu, Z.; Gao, W.; Lang, H.; Chi, Y. Experimental study on new type of defrosting system using outdoor air for frost-free household refrigerators. Appl. Therm. Eng. 2018, 134, 256–265. [Google Scholar] [CrossRef]
  5. Zhang, L.; Dong, J.; Jiang, Y.; Deng, S.; Huang, S. An experimental study on frosting and defrosting performances of a novel air source heat pump unit with a radiant-convective heating terminal. Energy Build. 2018, 163, 10–21. [Google Scholar] [CrossRef]
  6. Song, M.; Xia, L.; Deng, S. A modeling study on alleviating uneven defrosting for a vertical three-circuit outdoor coil in an air source heat pump unit during reverse cycle defrosting. Appl. Energy 2016, 161, 268–278. [Google Scholar] [CrossRef]
  7. Ameen, F.R.; Coney, J.E.R.; Sheppard, C.G.W. Experimental study of warm-air defrosting of heat-pump evaporators. Int. J. Refrig. 1993, 16, 13–18. [Google Scholar] [CrossRef]
  8. Huang, D.; Li, Q.; Yuan, X. Comparison between hot-gas bypass defrosting and reverse-cycle defrosting methods on an air-to-water heat pump. Appl. Energy 2009, 86, 1697–1703. [Google Scholar] [CrossRef]
  9. Wang, Z.; Yang, H.; Chen, S. Study on the operating performance of cross hot-gas bypass defrosting system for air-to-water screw heat pumps. Appl. Therm. Eng. 2013, 59, 398–404. [Google Scholar] [CrossRef]
  10. Hu, B.; Wang, X.; Cao, F.; He, Z.; Xing, Z. Experimental analysis of an air-source transcritical CO2 heat pump water heater using the hot gas bypass defrosting method. Appl. Therm. Eng. 2014, 71, 528–535. [Google Scholar] [CrossRef]
  11. Kim, J.; Choi, H.J.; Kim, K.C. A combined dual hot-gas bypass defrosting method with accumulator heater for an air-to-air heat pump in cold region. Appl. Energy 2015, 147, 344–352. [Google Scholar] [CrossRef]
  12. Yin, H.J.; Yang, Z.; Chen, A.Q.; Zhang, N. Experimental research on a novel cold storage defrost method based on air bypass circulation and electric heater. Energy 2012, 37, 623–631. [Google Scholar] [CrossRef]
  13. Melo, C.; Knabben, F.T.; Pereira, P.V. An experimental study on defrost heaters applied to frost-free household refrigerators. Appl. Therm. Eng. 2013, 51, 239–245. [Google Scholar] [CrossRef]
  14. Wang, F.; Liang, C.; Yang, M.; Zhang, X. Effects of surface characteristics on liquid behaviors on fin surfaces during frosting and defrosting processes. Exp. Therm. Fluid Sci. 2015, 61, 113–120. [Google Scholar] [CrossRef]
  15. Liang, C.; Wang, F.; Yan, L.; Wu, C.; Zhang, X.; Zhang, Y. Experimental study of the effects of fin surface characteristics on defrosting behavior. Appl. Therm. Eng. 2015, 75, 86–92. [Google Scholar] [CrossRef]
  16. Qu, M.; Pan, D.; Liang, X.; Deng, S.; Jiang, Y. A study of the reverse cycle defrosting performance on a multi-circuit outdoor coil unit in an air source heat pump—Part II: Modeling analysis. Appl. Energy 2012, 91, 274–280. [Google Scholar] [CrossRef]
  17. O’Neal, D.L.; Peterson, K.T.; Anand, N.K.; Schliesing, J.S. Refrigeration system dynamics during the reverse cycle defrost. Ashrae Trans. 1989, 95, 689–698. [Google Scholar]
  18. Dong, J.; Jiang, Y.; Deng, S.; Yang, Y.; Qu, M. Improving reverse cycle defrosting performance of air source heat pumps using thermal storage-based refrigerant sub-cooling energy. Build. Serv. Eng. 2012, 33, 223–236. [Google Scholar]
  19. Hu, W.; Jiang, Y.; Qu, M.; Ni, L.; Yang, Y.; Deng, S. An experimental study on the operating performance of a novel reverse-cycle hot gas defrosting method for air source heat pumps. Appl. Therm. Eng. 2011, 31, 363–369. [Google Scholar]
  20. Song, M.; Xu, X.; Deng, S.; Mao, N. An Experimental study on performance during reverse cycle defrosting of an air source heat pump with a horizontal three-circuit outdoor coil. Energy Procedia 2014, 61, 92–95. [Google Scholar]
  21. Song, M.; Deng, S.; Dang, C.; Mao, N.; Wang, Z. Review on improvement for air source heat pump units during frosting and defrosting. Appl. Energy 2018, 211, 1150–1170. [Google Scholar] [CrossRef]
  22. Choi, H.J.; Kim, B.S.; Kang, D.; Kim, K.C. Defrosting method adopting dual hot gas bypass for an air-to-air heat pump. Appl. Energy 2011, 88, 4544–4555. [Google Scholar] [CrossRef]
  23. Adachi, K.; Saiki, K.; Sato, H. Suppression of frosting on a metal surface using ultrasonic vibrations. Ieice Tech. Rep. Ultrason. 1998, 98, 9–12. [Google Scholar]
  24. Adachi, K.; Saiki, K.; Sato, H.; Ito, T. Ultrasonic frost suppression. Jpn. J. Appl. Phys. 2003, 42, 682–685. [Google Scholar] [CrossRef]
  25. Yan, Q.; Zhu, L.; Yan, N.; Zhang, M.; Hui, X. Study on ultrasonic defrost technology of refrigeration fan. J. Agric. Mach. 2003, 34, 74–75. [Google Scholar]
  26. Li, D.; Chen, Z.; Shi, M. Effect of ultrasound on frost formation on a cold flat surface in atmospheric air flow. Exp. Therm. Fluid Sci. 2010, 34, 1247–1252. [Google Scholar] [CrossRef]
  27. Li, D.; Chen, Z. Visualization of Effects of ultrasound on liquid droplet solidification and frost formation on cold flat surface. Heat Transf. Eng. 2014, 35, 1098–1104. [Google Scholar] [CrossRef]
  28. Li, D.; Chen, Z. Experimental study on instantaneously shedding frozen water droplets from cold vertical surface by ultrasonic vibration. Exp. Therm. Fluid Sci. 2014, 53, 17–25. [Google Scholar] [CrossRef]
  29. Palacios, J.L. Design, Fabrication, and Testing of an Ultrasonic De-Icing System for Helicopter Rotor Blades. Ph.D. Thesis, The Pennsylvania State University, State College, PA, USA, 2008. [Google Scholar]
  30. Palacios, J.; Smith, E.; Rose, J.; Royer, R. Ultrasonic de-icing of wind-tunnel impact icing. J. Aircr. 2011, 48, 1020–1027. [Google Scholar] [CrossRef]
  31. Overmeyer, A.; Palacios, J.L.; Smith, E.C.; Royer, R. Rotating Testing of a Low-Power, Non-Thermal Ultrasonic De-icing System for Helicopter Rotor Blades; SAE Technical Papers; SAE International: Warrendale, PA, USA, 2011; pp. 1–10. [Google Scholar]
  32. Overmeyer, A.; Palacios, J.; Smith, E. Ultrasonic De-Icing Bondline Design and Rotor Ice Testing. AIAA J. 2013, 51, 2965–2976. [Google Scholar] [CrossRef]
  33. Tan, H.; Tao, T.; Xu, G.; Zhang, S.; Wang, D.; Luo, X. Experimental study on defrosting mechanism of intermittent ultrasonic resonance for a finned-tube evaporator. Exp. Therm. Fluid Sci. 2014, 52, 308–317. [Google Scholar] [CrossRef]
  34. Tan, H.; Xu, G.; Tao, T.; Sun, X.; Yao, W. Experimental investigation on the defrosting performance of a finned-tube evaporator using intermittent ultrasonic vibration. Appl. Energy 2015, 158, 220–232. [Google Scholar] [CrossRef]
  35. Rose, J.L. Ultrasonic Guided Waves in Solid Media; Cambridge University Press: Cambridge, UK, 2014. [Google Scholar]
  36. Azar, L.; Shi, Y.; Wooh, S.C. Beam focusing behavior of linear phased arrays. NDT E Int. 2000, 33, 189–198. [Google Scholar]
Figure 1. Geometry of the linear phased array used to derive the focusing formula.
Energies 12 03117 g001
Figure 2. Detection of vibration attenuation characteristic on the copper plate under ultrasonic array excitation.
Energies 12 03117 g002
Figure 3. Ultrasonic array focusing defrosting system installed in a programmable constant temperature and humidity cabinet.
Energies 12 03117 g003
Figure 4. Ultrasonic array focusing model and test points. (a) Focus points and ultrasonic transducers, (b) distribution of test points.
Energies 12 03117 g004
Figure 5. Phase velocities of the Lamb wave and SH wave in a vibration transfer plate with/without a frost layer. (a) 1.38-mm-thick copper plate (b) plate with a 0.5-mm-thick frost layer (c) plate with a 1.0-mm-thick frost layer.
Energies 12 03117 g005
Figure 6. Group velocities of the Lamb wave and SH wave in a vibration transfer plate with/without a frost layer. (a) 1.38-mm-thick copper plate (b) plate with a 0.5-mm-thick frost layer (c) plate with a 1.0-mm-thick frost layer.
Energies 12 03117 g006
Figure 7. Advance time of each ultrasonic vibrator on the copper plate and frost layer.
Energies 12 03117 g007
Figure 8. Ultrasonic near field pressure in the XY plane with v = 2345 m/s.
Energies 12 03117 g008
Figure 9. Ultrasonic near field pressure in the XY plane with v = 4674 m/s.
Energies 12 03117 g009
Figure 10. Impedance curves of the ultrasonic transducers under different conditions. (a) First group of ultrasonic transducers; (b) second group of ultrasonic transducers.
Energies 12 03117 g010
Figure 11. Vibration characteristics on the copper plate with different ultrasonic transducers opened. (a) Three ultrasonic transducers opened; (b) all ultrasonic transducers opened.
Energies 12 03117 g011
Figure 12. Vibration shape and amplitude curve at the copper plate surface under ultrasonic excitation. (a) Actual vibration shape; (b) simulation vibration shape; (c) amplitude-frequency curve.
Energies 12 03117 g012
Figure 13. Basic frost layer removal and temperature variation of the copper plate with ultrasonic excitation. (a) Macro-frost layer removal; (b) micro-frost layer cracking; (c) temperature on copper plate.
Energies 12 03117 g013
Figure 14. Photographs of the defrosting experiment involving the ASHP unit installed in an enthalpy laboratory.
Energies 12 03117 g014
Figure 15. Microscopic images of the frost fin under the conditions of DB = 2 °C and RH = 85%. (a) Intermittent 50 s; (b) intermittent 110 s; (c) intermittent 170 s; (d) intermittent 230 s.
Energies 12 03117 g015
Figure 16. Average frost layer thickness and amount of the frost removed on evaporator. (a) Average frost layer thickness; (b) macro frosting image of evaporator.
Energies 12 03117 g016
Figure 17. Energy consumption and heating capacity in different intermittent ultrasonic vibration modes. (a) Power consumption; (b) heat-supply enthalpy difference.
Energies 12 03117 g017
Table 1. Material parameters and wave velocity calculation results.
Material TypeDensity (kg/m3)Poisson’s RatioYoung’s Modulus (MPa)Shear Modulus (MPa)Longitudinal Wave Velocity (m/s)Shear Wave Velocity (m/s)
Copper89000.3301.310 × 1050.430 × 10546742354
Frost8000.3437.759 × 1032.661 × 10339801990
Table 2. COPs of the ASHP unit in different ultrasonic loading mode.
Mode IMode IIMode IIIMode IVMode V
AverageIncrementalAverageIncrementalAverageIncrementalAverageIncrementalAverageIncremental
Power consumption2208.52211.30.12%2136.2−3.27%2162.4−2.09%2153.0−2.51%
Enthalpy difference23.2625.7910.86%25.017.52%24.555.56%24.304.47%
COP3.2~3.43.54~3.7610.72%3.56~3.7811.12%3.45~3.677.81%3.43~3.647.16%

