Article

Reversible Efficiency Variation of Tandem Amorphous/Microcrystalline Si Photovoltaic Modules in Outdoor Operation

by
Fabio Ricco Galluzzo
1,2,*,
Cosimo Gerardi
3,
Andrea Canino
3 and
Salvatore Lombardo
1
1
Istituto per la Microelettronica e Microsistemi—Consiglio Nazionale delle Ricerche, Zona Industriale, Ottava Strada n. 5, 95121 Catania, Italy
2
Dipartimento di Fisica e Astronomia, Università di Catania, Via S. Sofia, 64, 95123 Catania, Italy
3
ENEL Green Power, Contrada Blocco Torrazzesn—Z.I., 95121 Catania, Italy
*
Author to whom correspondence should be addressed.
Energies 2019, 12(15), 2876; https://doi.org/10.3390/en12152876
Submission received: 10 July 2019 / Revised: 22 July 2019 / Accepted: 23 July 2019 / Published: 26 July 2019
(This article belongs to the Special Issue Materials and Devices for Solar to Hydrogen Energy Conversion)

Abstract

:
The Staebler-Wronski effect in amorphous silicon based photovoltaic devices is responsible for degradation of their power conversion efficiency, within approximately the first one thousand hours of light soaking. Several experimental studies led to highlight the performance instability phenomena for the mentioned devices, underling that recovery and improvement of such performance are observable, by subjecting such devices (both of single-junction and tandem types) to DC reverse bias stresses under illumination, or to operation in the Maximum Power Point (MPP) under variable conditions of temperature and illumination. In this work, we present and discuss the results of novel recent outdoor tests on stabilized specimens (i.e., exposed to 1000 h extended light soaking, before our tests) of tandem amorphous/microcrystalline Si (a-Si/µc-Si) photovoltaic (PV) minimodules operating in their MPP, by analyzing the causes of the performance instability effects, systematically observed on a daily scale. During the mentioned tests, we have monitored the solar cell operating temperature and the incident solar spectrum at various times in different days to verify the effect of cell temperature and solar spectrum changes on the cell performances. The experimental results show a clear correlation between performance improvements of the photovoltaic modules and their thermal history during the outdoor tests, proving the interplay between defect build-up at a lower temperature and defect annealing at a higher temperature, taking place in the solar cells operated in MPP during conventional outdoor operation.

1. Introduction

The production of H2 as fuel with a low carbon footprint is a major direction of research in the area of renewables. Photoelectrochemical systems, which split water, able to provide the required potential difference, larger than the thermodynamic potential of water (µth > 1.23 eV); may be a solution in this field. For this purpose, the tandem amorphous-Si/microcrystalline Si solar cell or more in general the multi-junction amorphous Si based solar cells are very promising technologies, since they are low cost and characterized by high open circuit voltage. In fact, in [1] a solar water-splitting cells comprising of triple junction amorphous silicon cell interfaced to suitable hydrogen and oxygen evolution electrodes with earth abundant element catalysts was demonstrated. However, one of the main limitations in such a class of PV devices is the Staebler-Wronski effect, responsible for the degradation of their power conversion efficiency, within approximately the first one thousand hours of light soaking [2,3,4]. Several experimental studies [5,6,7,8,9,10] led to highlight performance instability phenomena for the mentioned devices, underling that recovery and improvement of such performance are observable, by subjecting such devices (both of single-junction and tandem types) to DC reverse bias stresses under illumination, or to operation in the Maximum Power Point (MPP) under variable conditions of temperature and illumination. In particular, in our previous work [10], we had observed relevant electric performances improvements, as a systematic phenomenon, during tests performed outdoor on stabilized tandem PV minimodules working continuously in the MPP; going from morning to afternoon illumination. Moreover, we had carried out a preliminary study on the possible causes of such a phenomenon, by concluding that it could be attributed to the combination of two factors. The first is the thermal heating at moderate temperatures of the specimens during the tests, which may produce defect annealing and performance improvement. As second possible cause, we had considered the change in the illumination conditions, in particular a variation in the solar spectrum. About the role of defect annealing, some works in the scientific literature [11,12,13,14,15] focused on the thermal behavior of amorphous silicon based solar cells, by observing that their heating, both in terms of thermal annealing at temperatures approximately above 150 °C (see [2,3]) and of thermal heating at lower and moderate temperatures (see, for instance [12,13,14]), in some cases, can lead to significant benefits on the power conversion efficiency. However, other studies (see, for instance [16,17,18,19]) had underlined the greater sensitivity of a-Si based thin film PV devices to solar spectrum variations, compared to other PV technologies, by remarking the need to pay attention to such variations. This has led us to investigate more thoroughly on the causes of the instability phenomena systematically observed outdoor. In this work, we present and discuss the results of novel recent outdoor tests on stabilized specimens (i.e., previously exposed to 1000 h extended light soaking) of tandem amorphous Si-microcrystalline Si PV mini-modules operating in their MPP, by analyzing in depth the causes of the electrical performance instability, systematically observed on a daily scale. During our tests, we have monitored the solar cell operating temperature and the incident solar spectrum at various times for different days. We demonstrate clear reversible change of PV module performance and we show evidence that the performance instability is due to an interplay between defect build-up during light soaking and defect annealing when the module temperature increases, both taking place during the outdoor tests in MPP. The major contribution of this work consists therefore in an accurate investigation on the correlation between the electrical performance of tandem a-Si/µc-Si PV devices, the solar cell temperature, and the solar spectrum variations, by highlighting the relevant role played by the solar cell temperature variations and the thermal annealing, which significantly affect the trend of such performance.

2. Materials and Methods

Numerous tests were performed outdoor (in Sicily, at latitude 37°26′N and longitude 15°3′E) in different days, on a group of stabilized specimens of tandem a-Si/µc-Si PV mini-modules. Three solar cells connected in a series make up each of these mini-modules. The mini-module dimensions are: 3.2 × 2.1 [cm × cm] (active area). The PV cell structure, as illustrated in more detail in [10], is a stack of a p-i-n a-Si:H cell deposited on SnO2:F transparent conductive oxide (TCO), which collects the blue portion of the solar spectrum layer, on which it is deposited a p-i-n microcrystalline Si cell devoted to the collection of the red part of the solar spectrum. The cell is then covered with an Al doped ZnO TCO and an Ag film metallization.
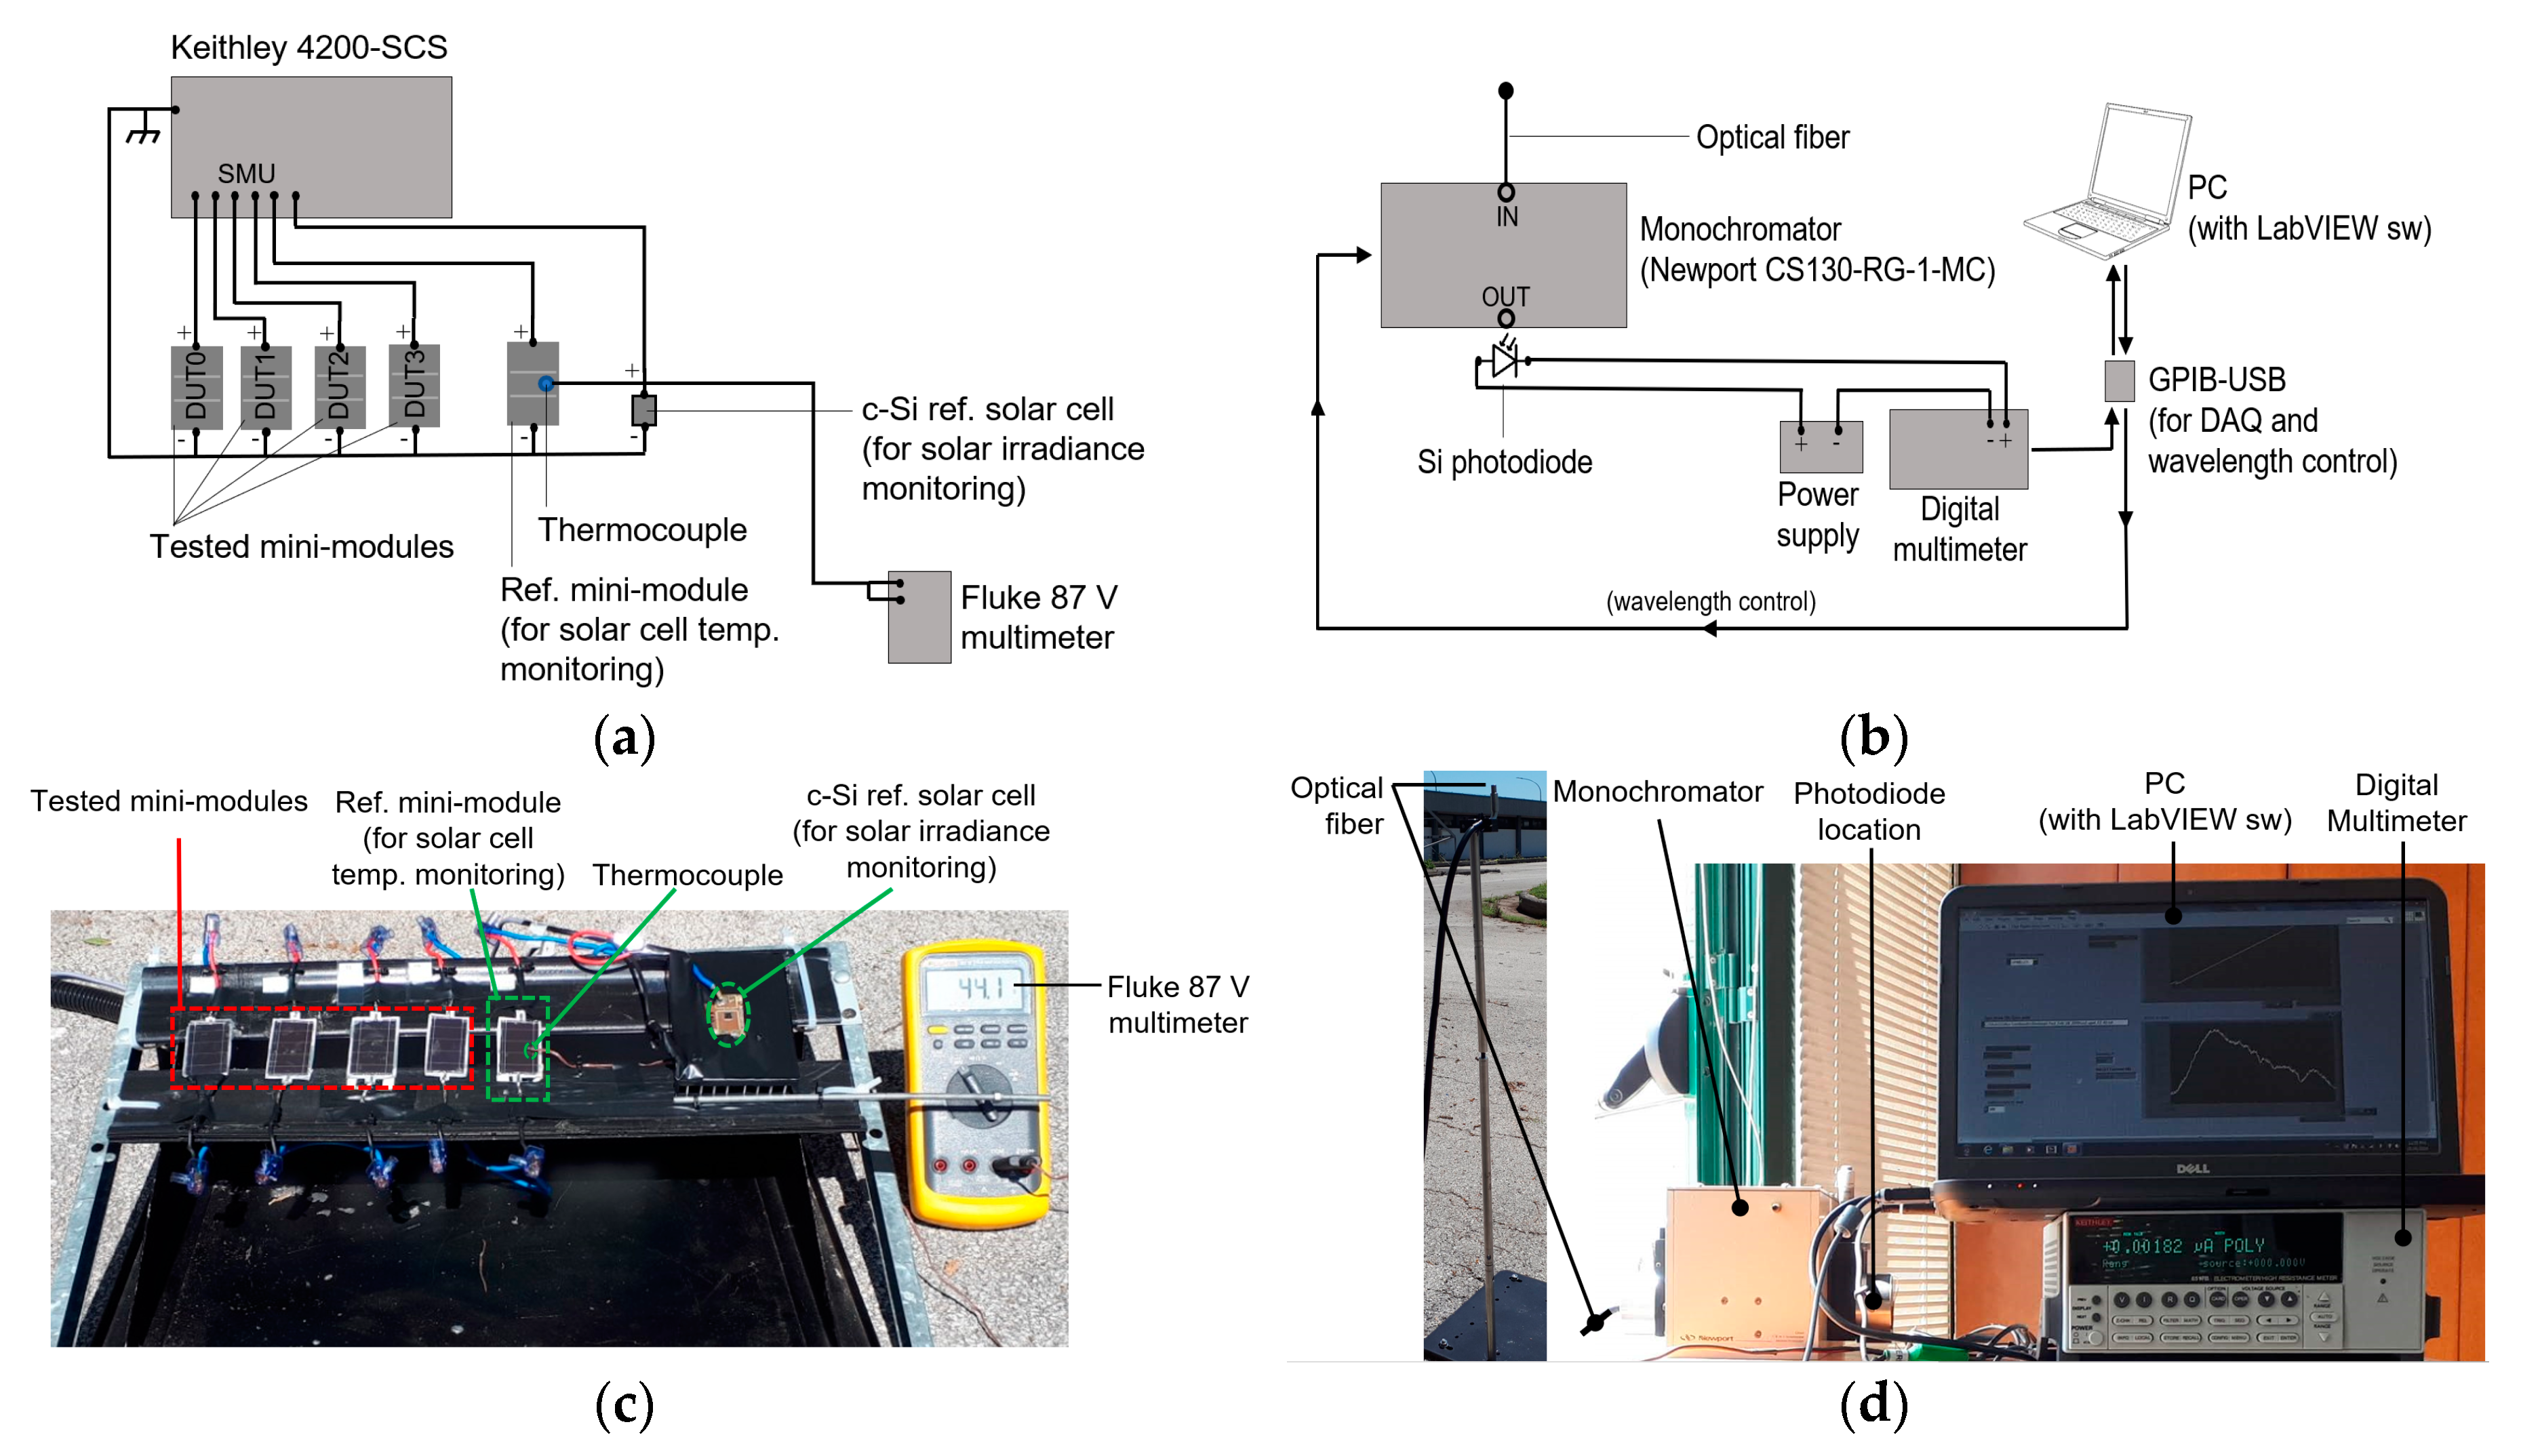
The outdoor experiments were performed as follows: five PV mini-modules were tested together with a crystalline Si reference solar cell, all located on a support with a tilt angle of about 21° oriented toward south (Figure 1a,c). Four of these mini-modules (specimens named DUT0, DUT1, DUT2, DUT3, being DUT the acronym of Device Under Test) were subjected to the monitoring of the electrical performance, while one was used as reference for detecting the solar cell operating temperature during the tests. The crystalline Si reference solar cell was used to measure the solar irradiance during the tests over the mini-module plane. A thermocouple in contact with the glass of the reference mini-module and interfaced with a Fluke 87 V multimeter, was used to measure the temperature of the PV module glass surface during the outdoor tests. From such measured temperature, we estimated the solar cell operating temperature by taking into account the glass thermal conductivity and the incident solar power density.
Each test consisted of 24 measure cycles, for a total duration of about 4 h (2 h before and 2 after mid-day). All mini-modules worked in their MPP for 10 min within each measure cycle. At the beginning of each cycle, the current vs. voltage (I-V) electrical characteristics of each mini-module under test were measured (through a Keithley 4200-SCS Semiconductor Characterization System, manufacturer: Keithley Instruments, Inc., Cleveland, Ohio, USA), together with the reference crystalline Si solar cell short circuit current (to monitor the solar irradiance) and the reference PV mini-module glass temperature (to monitor the solar cell temperature in the operating conditions). Moreover, the solar spectrum was monitored at different solar times of the different test days, in clear sky conditions, by using the system depicted in Figure 1b,d. This consists of a monochromator (Newport, model: CS130-RG-1-MC), an optical fiber, connected to the input of the monochromator, to collect the incident solar light, and a Si photodiode at the monochromator output. The system was used to measure the solar spectrum evolution in the range from 350 nm to 1100 nm at various times of the day.
Figure 1 shows schematics of the experimental set up used for the mini-module testing and for the solar spectrum monitoring (see Figure 1a,b, respectively), together with some pictures of the main components of such experimental set up (see Figure 1c,d).

3. Results and Discussion

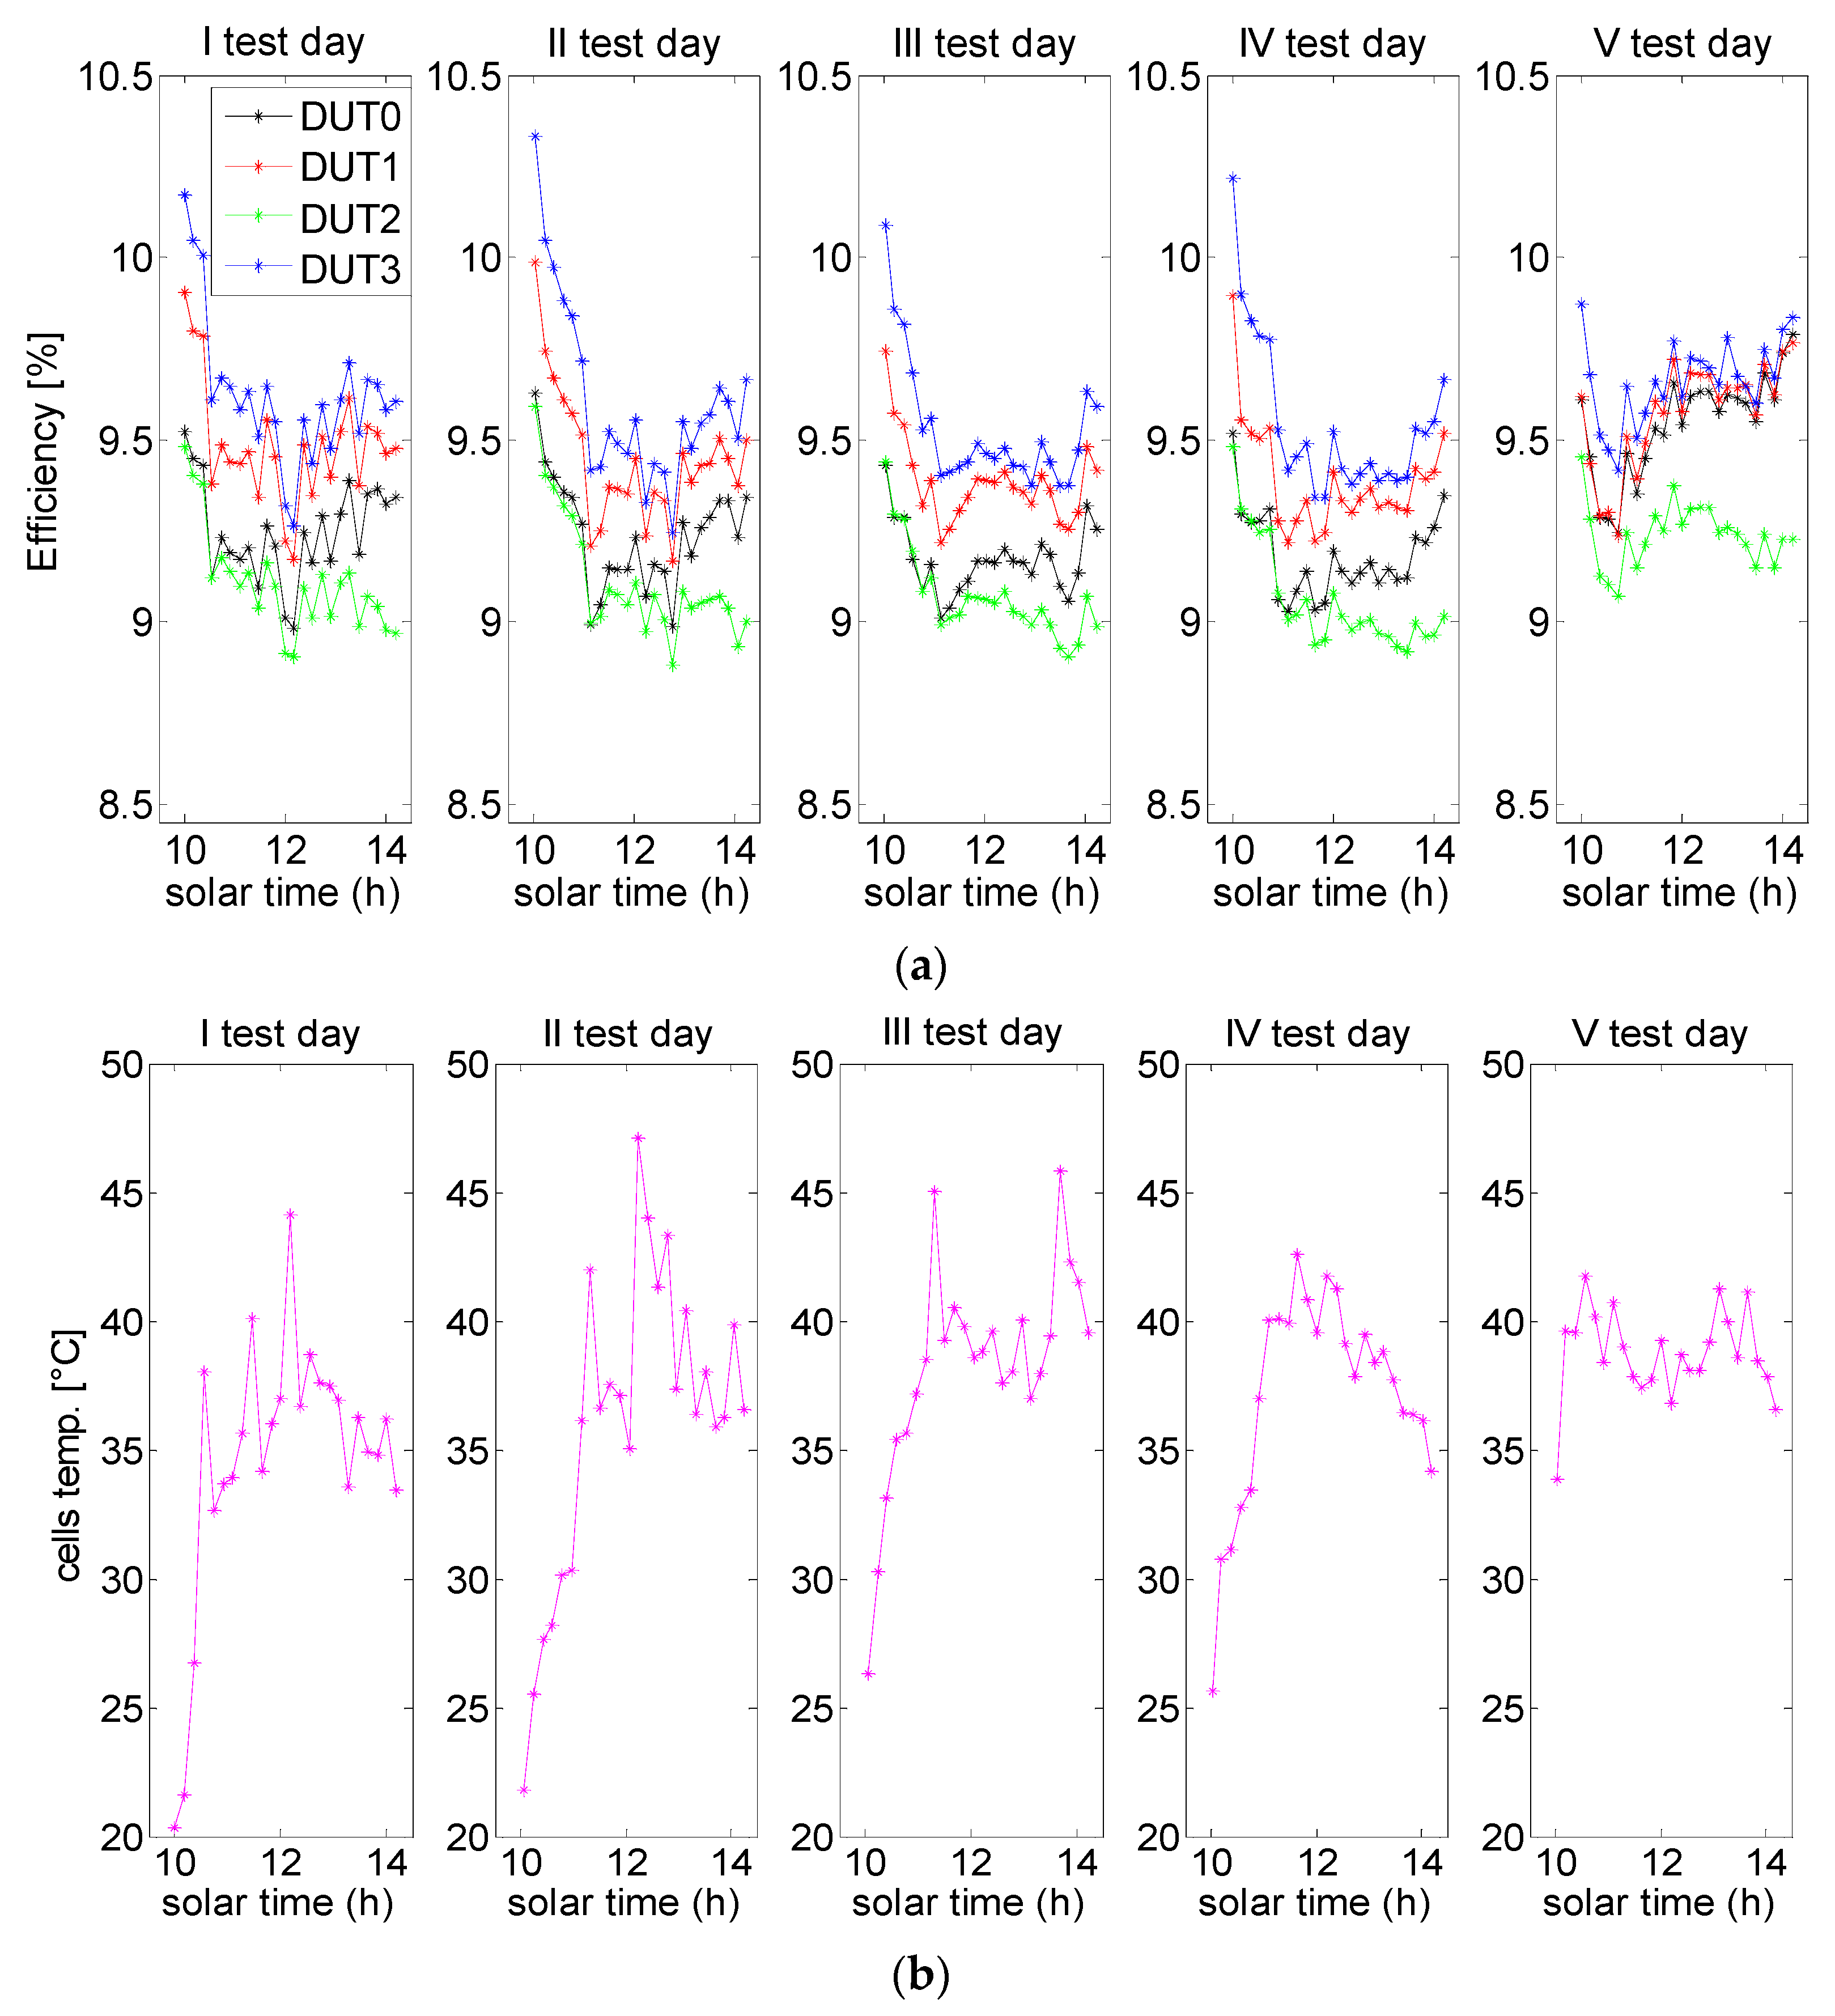
Figure 2 summarizes the main results of the tests performed, as derived from the experimental measurement set-up described in Section 2. In particular, the figure shows the trends as a function of the solar time of the mini-module power conversion efficiency (see Figure 2a) and of the mini-module solar cell temperature (see Figure 2b). At a first glance we note a systematic effect of mini-module performance worsening before mid-day, followed by a performance improvement, generally evident after mid-day. Moreover, a correlation among the mini-module efficiency and the mini-module solar cell temperature can be noted: generally, the efficiency improvements occur remarkably in the afternoon, after that the solar cells have undergone a considerable thermal heating during the morning.
To render such correlation more evident, we have plotted the mini-module efficiency as a function of the solar cell temperature. The resulting graphs are reported in Figure 3.
The experimental trends of 
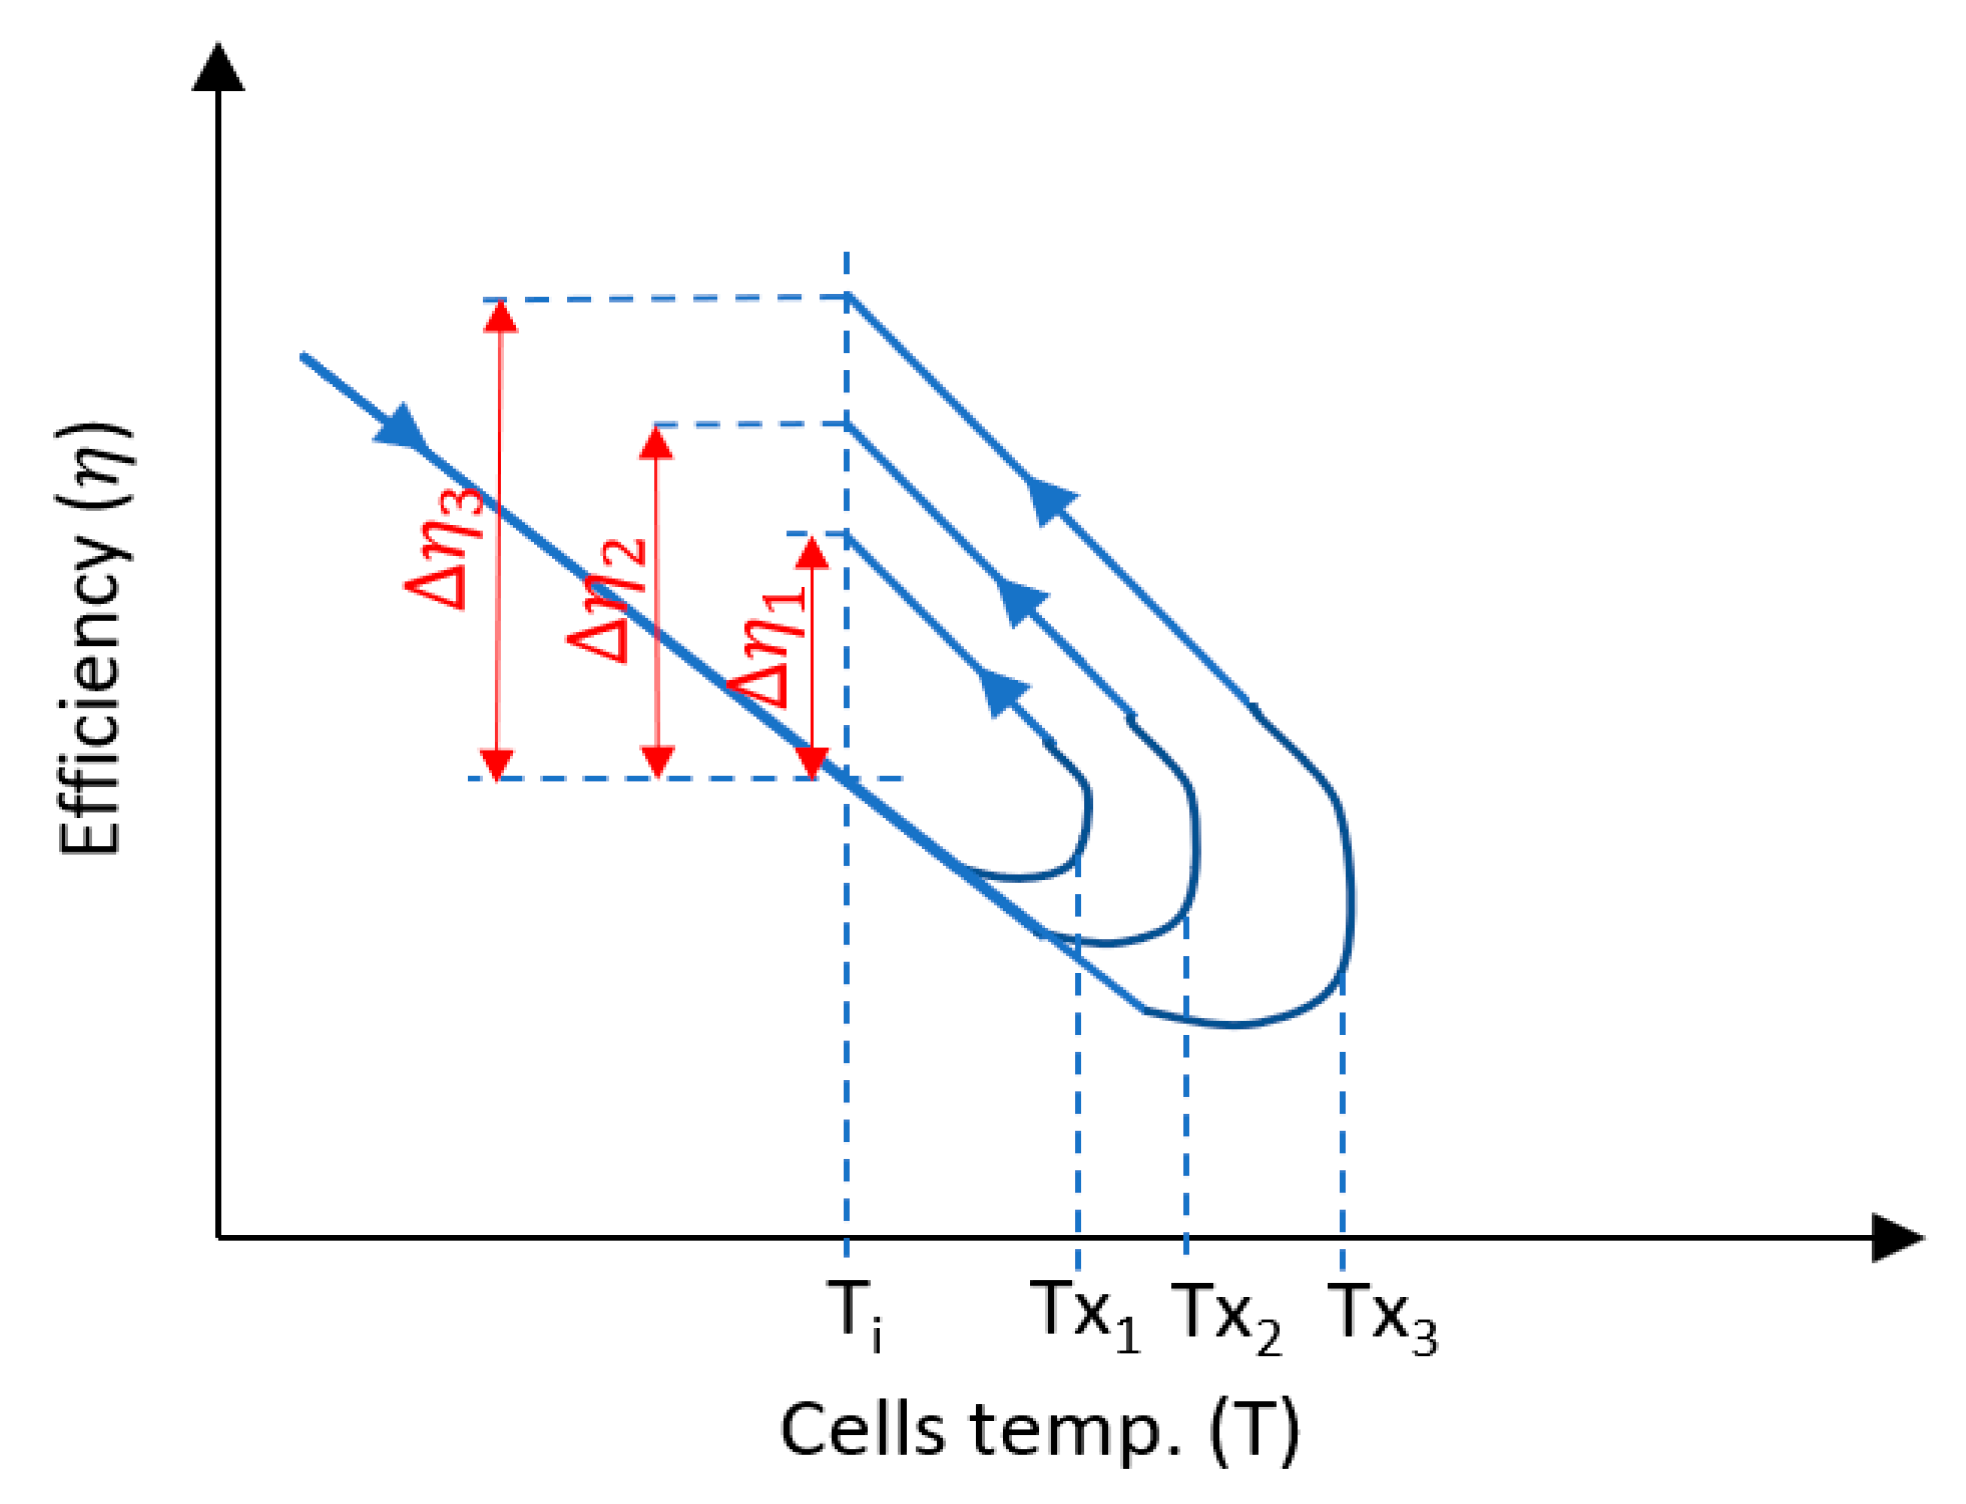
Figure 3 show some changes and vary from a case to the other, but overall, they can be schematized as depicted in Figure 4, which ideally sketches the case of a single mini-module subjected to stresses at various temperatures. As it is well known, as the solar cell temperature increases, the power conversion efficiency decreases. However, together with this usual trend, the a-Si:H/microcrystalline Si tandem solar cells present an additional effect of efficiency improvement, since as time evolves to the afternoon hours the efficiency goes back to higher values since the cell temperature decreases. However, the efficiency in the afternoon does not return to the morning value at the same temperature, but it reaches a larger value.
To explain such results, we propose that we are in the presence of an additional effect due to the annealing of the defects formed during light soaking in MPP. Such annealing improves the solar cell efficiency, so that a kind of hysteresis effect can be seen. In other words, if we start in the morning from a cold cell with high efficiency, as the cell temperature increases due to the solar irradiation, three effects take place at the same time: first, the cell efficiency decreases because of the cell temperature increase; second, the cell efficiency decreases because of the light soaking effect during MPP operation; but, third, around mid-day the solar cell reaches its highest temperature (Tx1, or Tx2, or Tx3 in the sketch of Figure 4), and this implies a moderate thermal annealing, which produces some defect annealing, which results in an efficiency improvement. When the maximum temperature achieved by the solar cells increases (Tx1 < Tx2 < Tx3), the power conversion efficiency growth, seen by comparing morning and afternoon value at the same cell temperature, increases too (Δη1 < Δη2 < Δη3), as a result of the increasing intensity of the solar cell thermal annealing. To confirm the correctness of the sketch of Figure 4 let us go back to the experimental data of Figure 2 and Figure 3. Let us consider as example the efficiency of the sample DUT0 and the temperature trends of the tests 2 and 4. In such cases, the cell maximum temperature values were quite different and were 47.1 °C and 42.6 °C, respectively. And in fact, at the same test temperature (36 °C), the efficiency increase Δη from morning to afternoon is higher in the test 2 (about 3.8%) compared to the test 4 case (about 1.8%).
Therefore, though the Staebler-Wronski effect is indeed a limitation for the performance of this type of solar cells, it is also true that during operation in MPP, if the module heats up to about 45–50 °C even for short times, of the order of one hour, as seen from the data of Figure 3 some efficiency recovery, of the order of 2%, takes place due to defect annealing.
Such a complex combination of different effects produces evident variations in the evaluation of the power conversion temperature coefficient of this type of PV modules. For example, in the test 2 of the DUT0, the temperature coefficient is about −0.23%/°C when considering the data points taken only during the morning. However, if we instead consider all the data points, including the morning, when the cells reach their maximum temperature value, and the afternoon measurements, the temperature coefficient becomes considerably lower, and equal to about −0.20%/°C.
Figure 5 shows the trends of the main electrical parameters of the mini-modules, as a function of solar cell temperature, during the test of day 2 in Figure 2 and Figure 3. Evidently, such trends are similar to those of the power conversion efficiency, leading to an overall improvement of the electrical performance, attributable to the thermal heating occurred around mid-day. The main influenced parameters appear to be the open circuit voltage (Voc) and the series resistance (Roc). Voc, for example, shows values in the afternoon for equal cell temperature clearly higher than those of the morning. Further discussion about such aspects is reported in the final part of the paper.
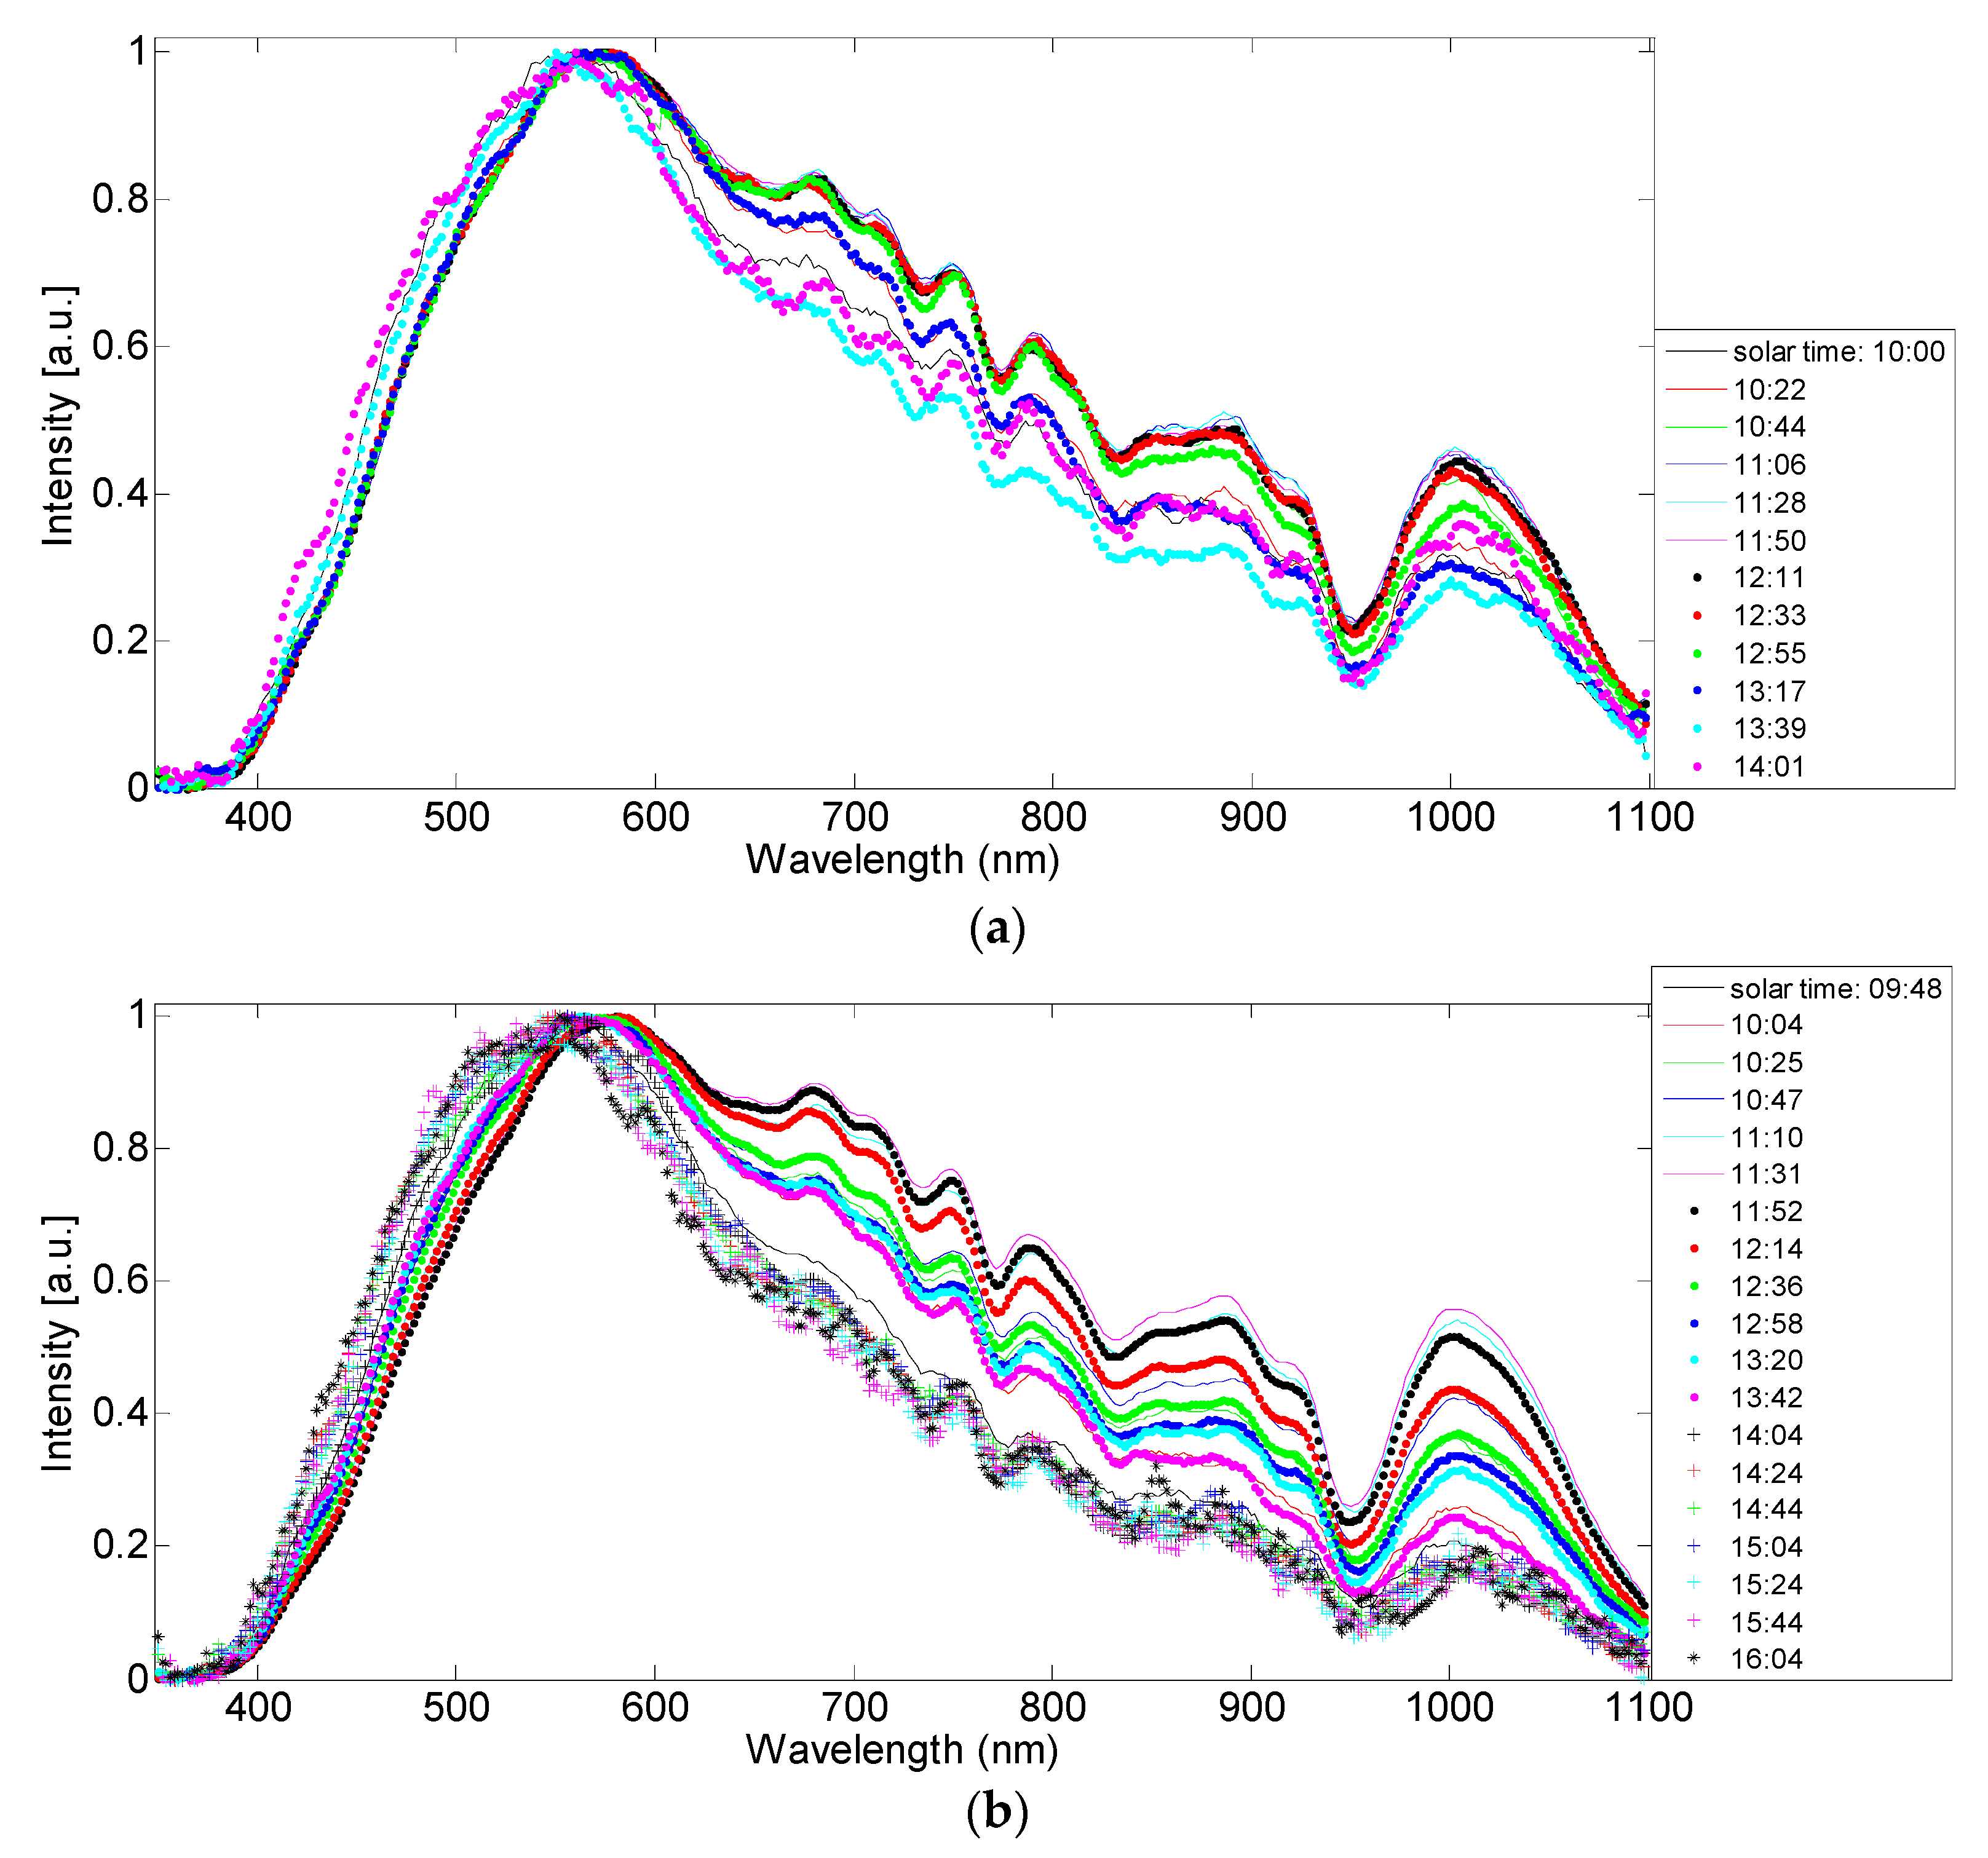
To check whether the performance changes observed in the PV mini-modules are correlated also to variations of the solar spectrum during the day, we have measured the solar spectrum evolution from morning to afternoon for various days. Figure 6a shows the solar spectra measured at different times of the test day 5, for which the PV module data are reported in Figure 2. To easily compare the data, each spectrum is normalized to its maximum value. From Figure 6a it is evident that from the morning to the afternoon a clear increase of the blue component of the spectrum occurs. Such solar spectrum variation from the morning to the afternoon is well reproducible and it has been observed in many other days (as in the example of Figure 6b). Similar results were found in other studies in the literature (for instance, see [17,20]), where the shift of the solar spectrum towards the blue over the course of the day was essentially attributed to an increase during the day in water vapor density present in the atmosphere.
Therefore, one may speculate that the efficiency changes of the PV mini-modules observed on going from the morning to the afternoon are due to the variations of the solar spectrum, which actually do occur, as shown above. However, this is not the case. In fact, the efficiency variations are not due to solar spectrum changes, but rather they are due to the mentioned mid-day annealing effects, as we demonstrate from a careful analysis of the PV module parameter time evolution, as described in detail in the next paragraph.
To clarify the cause of the efficiency variation observed, we have studied the time evolution of the main module electrical parameters. We assume that the spectral variation should mainly affect the fill factor and the short circuit current, as proposed in [20]. In fact, since a solar cell has generally an external quantum efficiency (EQE) curve which is not flat along the solar spectrum, one expects that as the incident solar spectrum shape changes, for the same flux of incident photons, the solar cell short circuit current (Isc) should change. That is, for example, a cell with higher EQE in the blue-green will have higher Isc when the spectrum shifts to the blue-green.
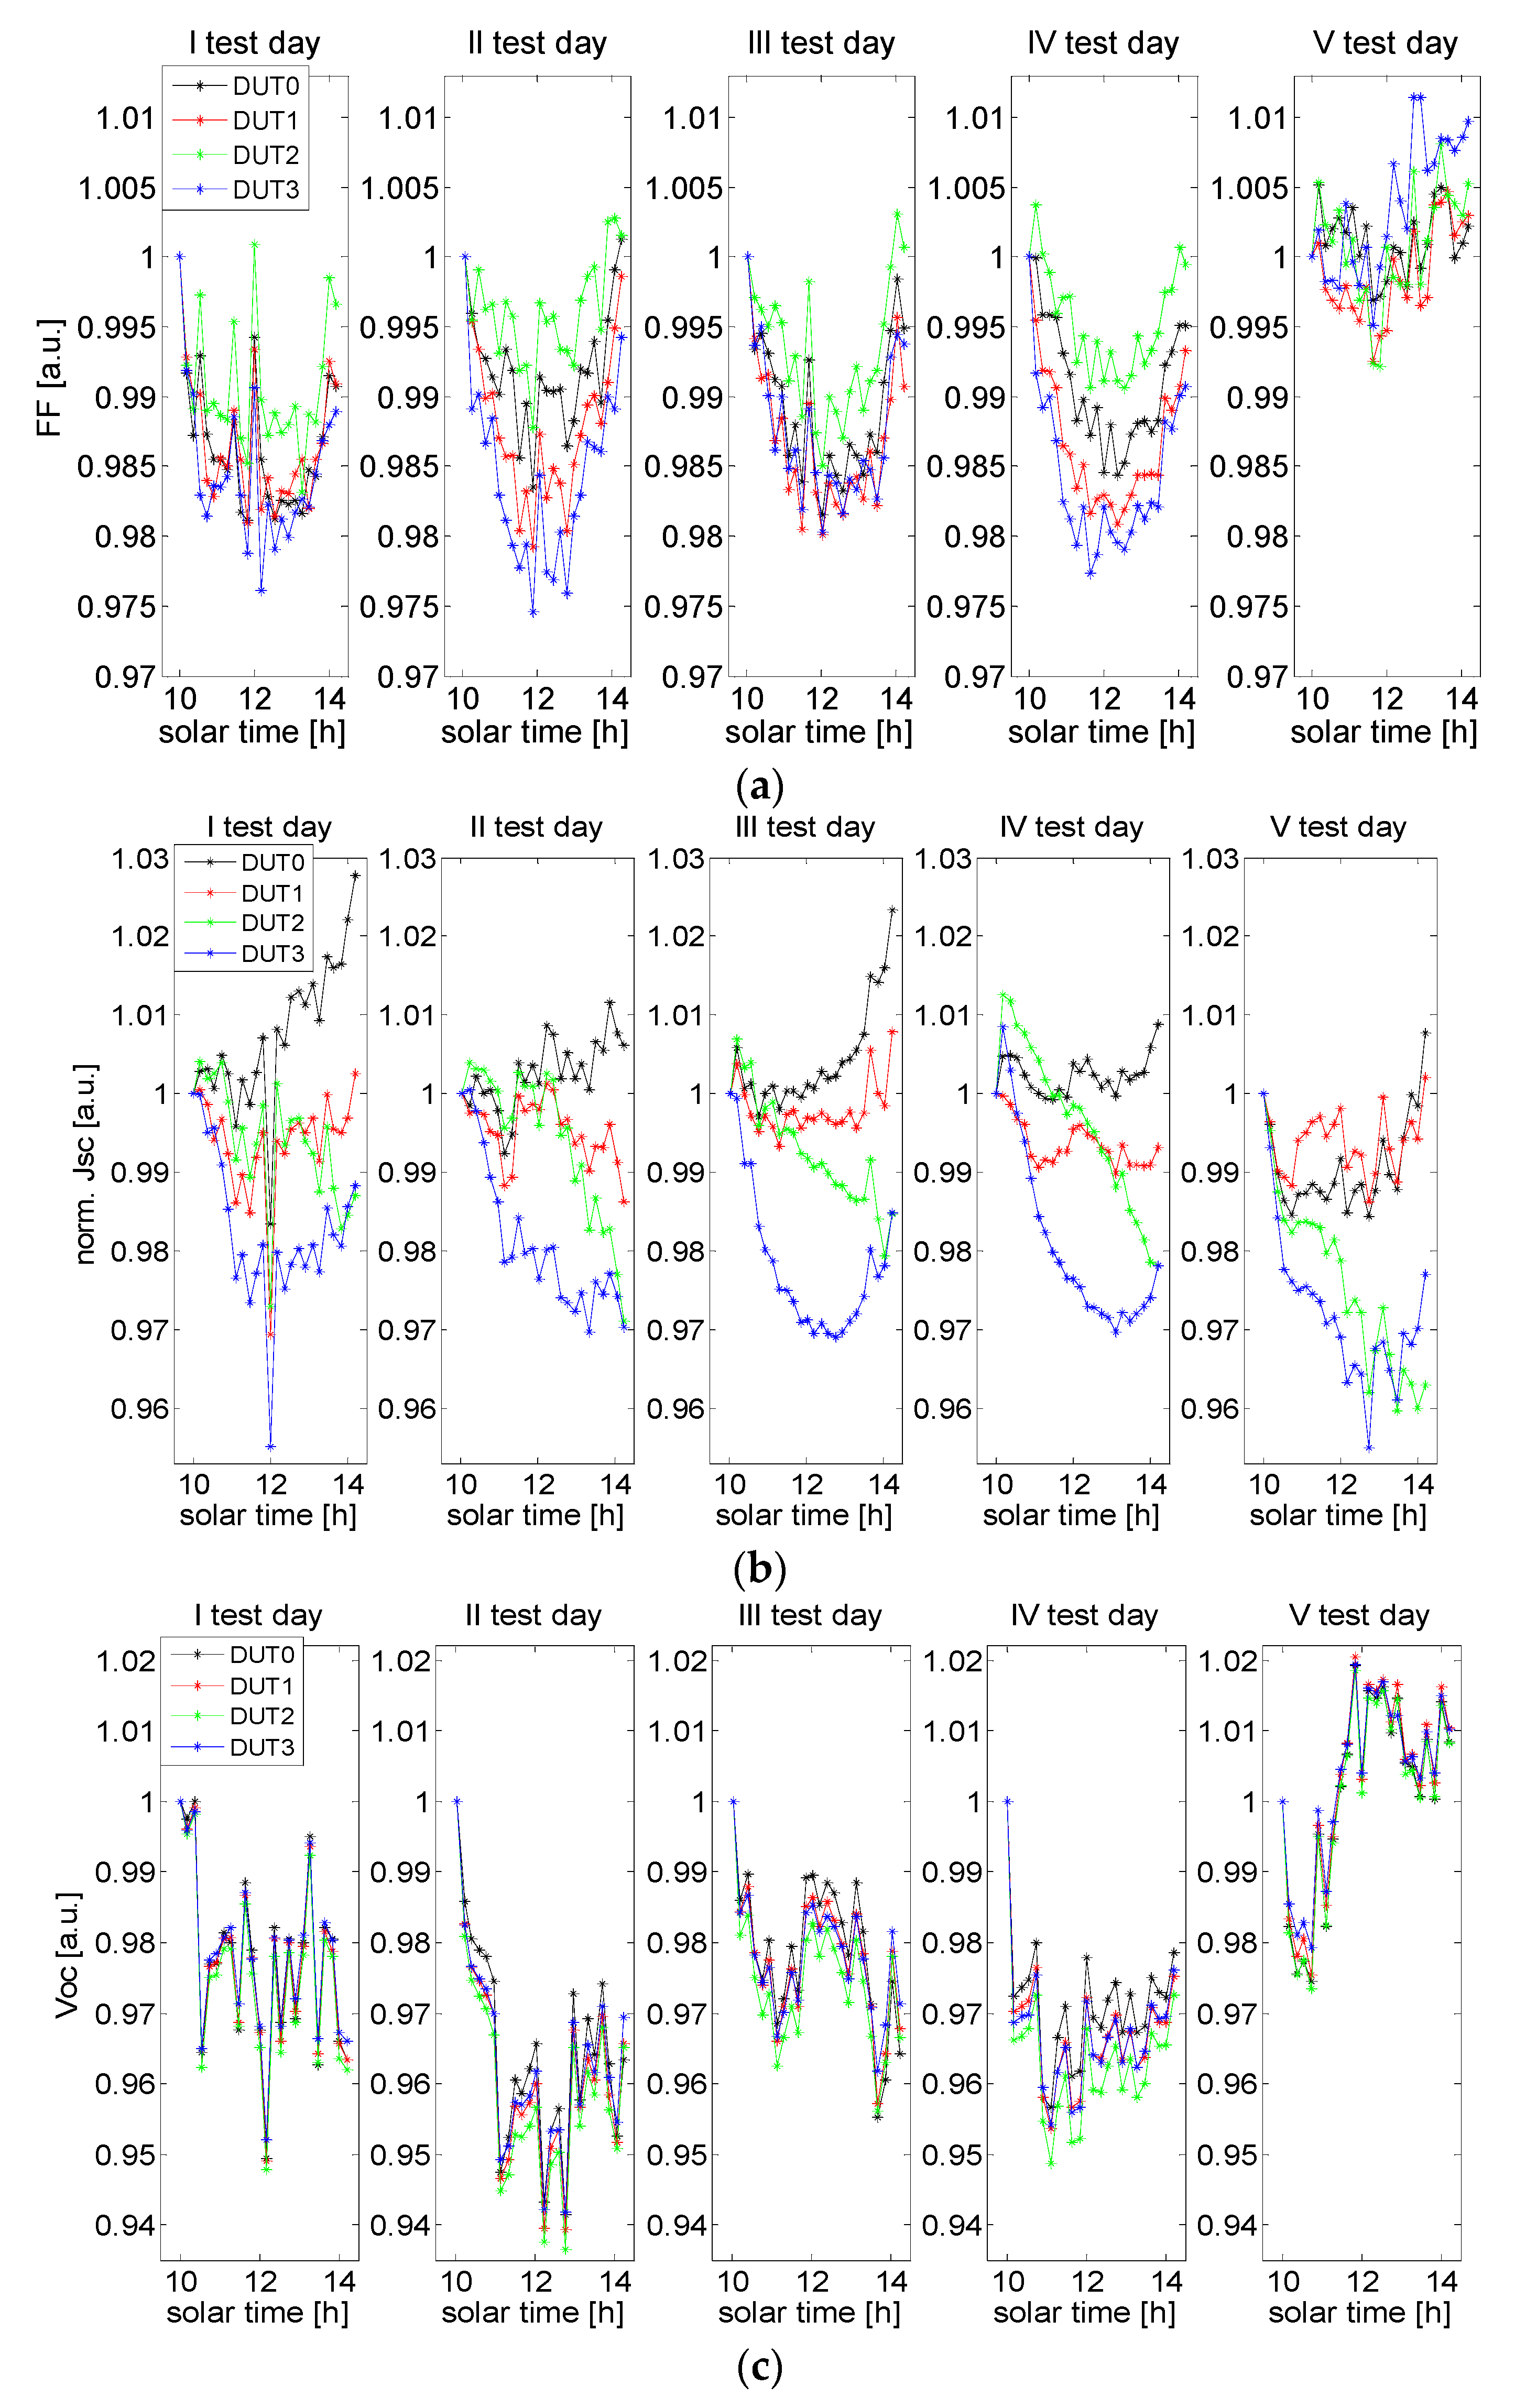
Figure 7 shows the time evolution during the test days of Figure 2, of the fill factor, short circuit current, and open circuit voltage for all the tested mini-modules.
Table 1 and Table 2 report the percentage variations of the electrical parameters of Figure 7. Such variations are calculated for each test going from morning to afternoon, at two different times, with similar levels of solar irradiance, but with different shapes of the solar spectrum.
From such tables we note that the open circuit voltage (Voc) undergoes significant variations, while the normalized short circuit current density (norm. Jsc) and the fill factor (FF) show significantly more limited variations. Despite the significant solar spectrum variations between the times indicated in the table, the Jsc norm. (which in general is the most sensitive parameter to spectral variations) undergoes negligible variations compared to the Voc variations (which is the parameter most influenced by temperature variations of the solar cells). This proves that the significant power conversion efficiency improvements detected are not attributable to the observed changes of the solar spectrum (which actually determine weak variations of Jsc norm.), but rather they are mainly due to a thermal effect concerning the tested samples which essentially involves an Voc increase (and therefore an improvement in the lifetime of charge carriers in the solar cells).
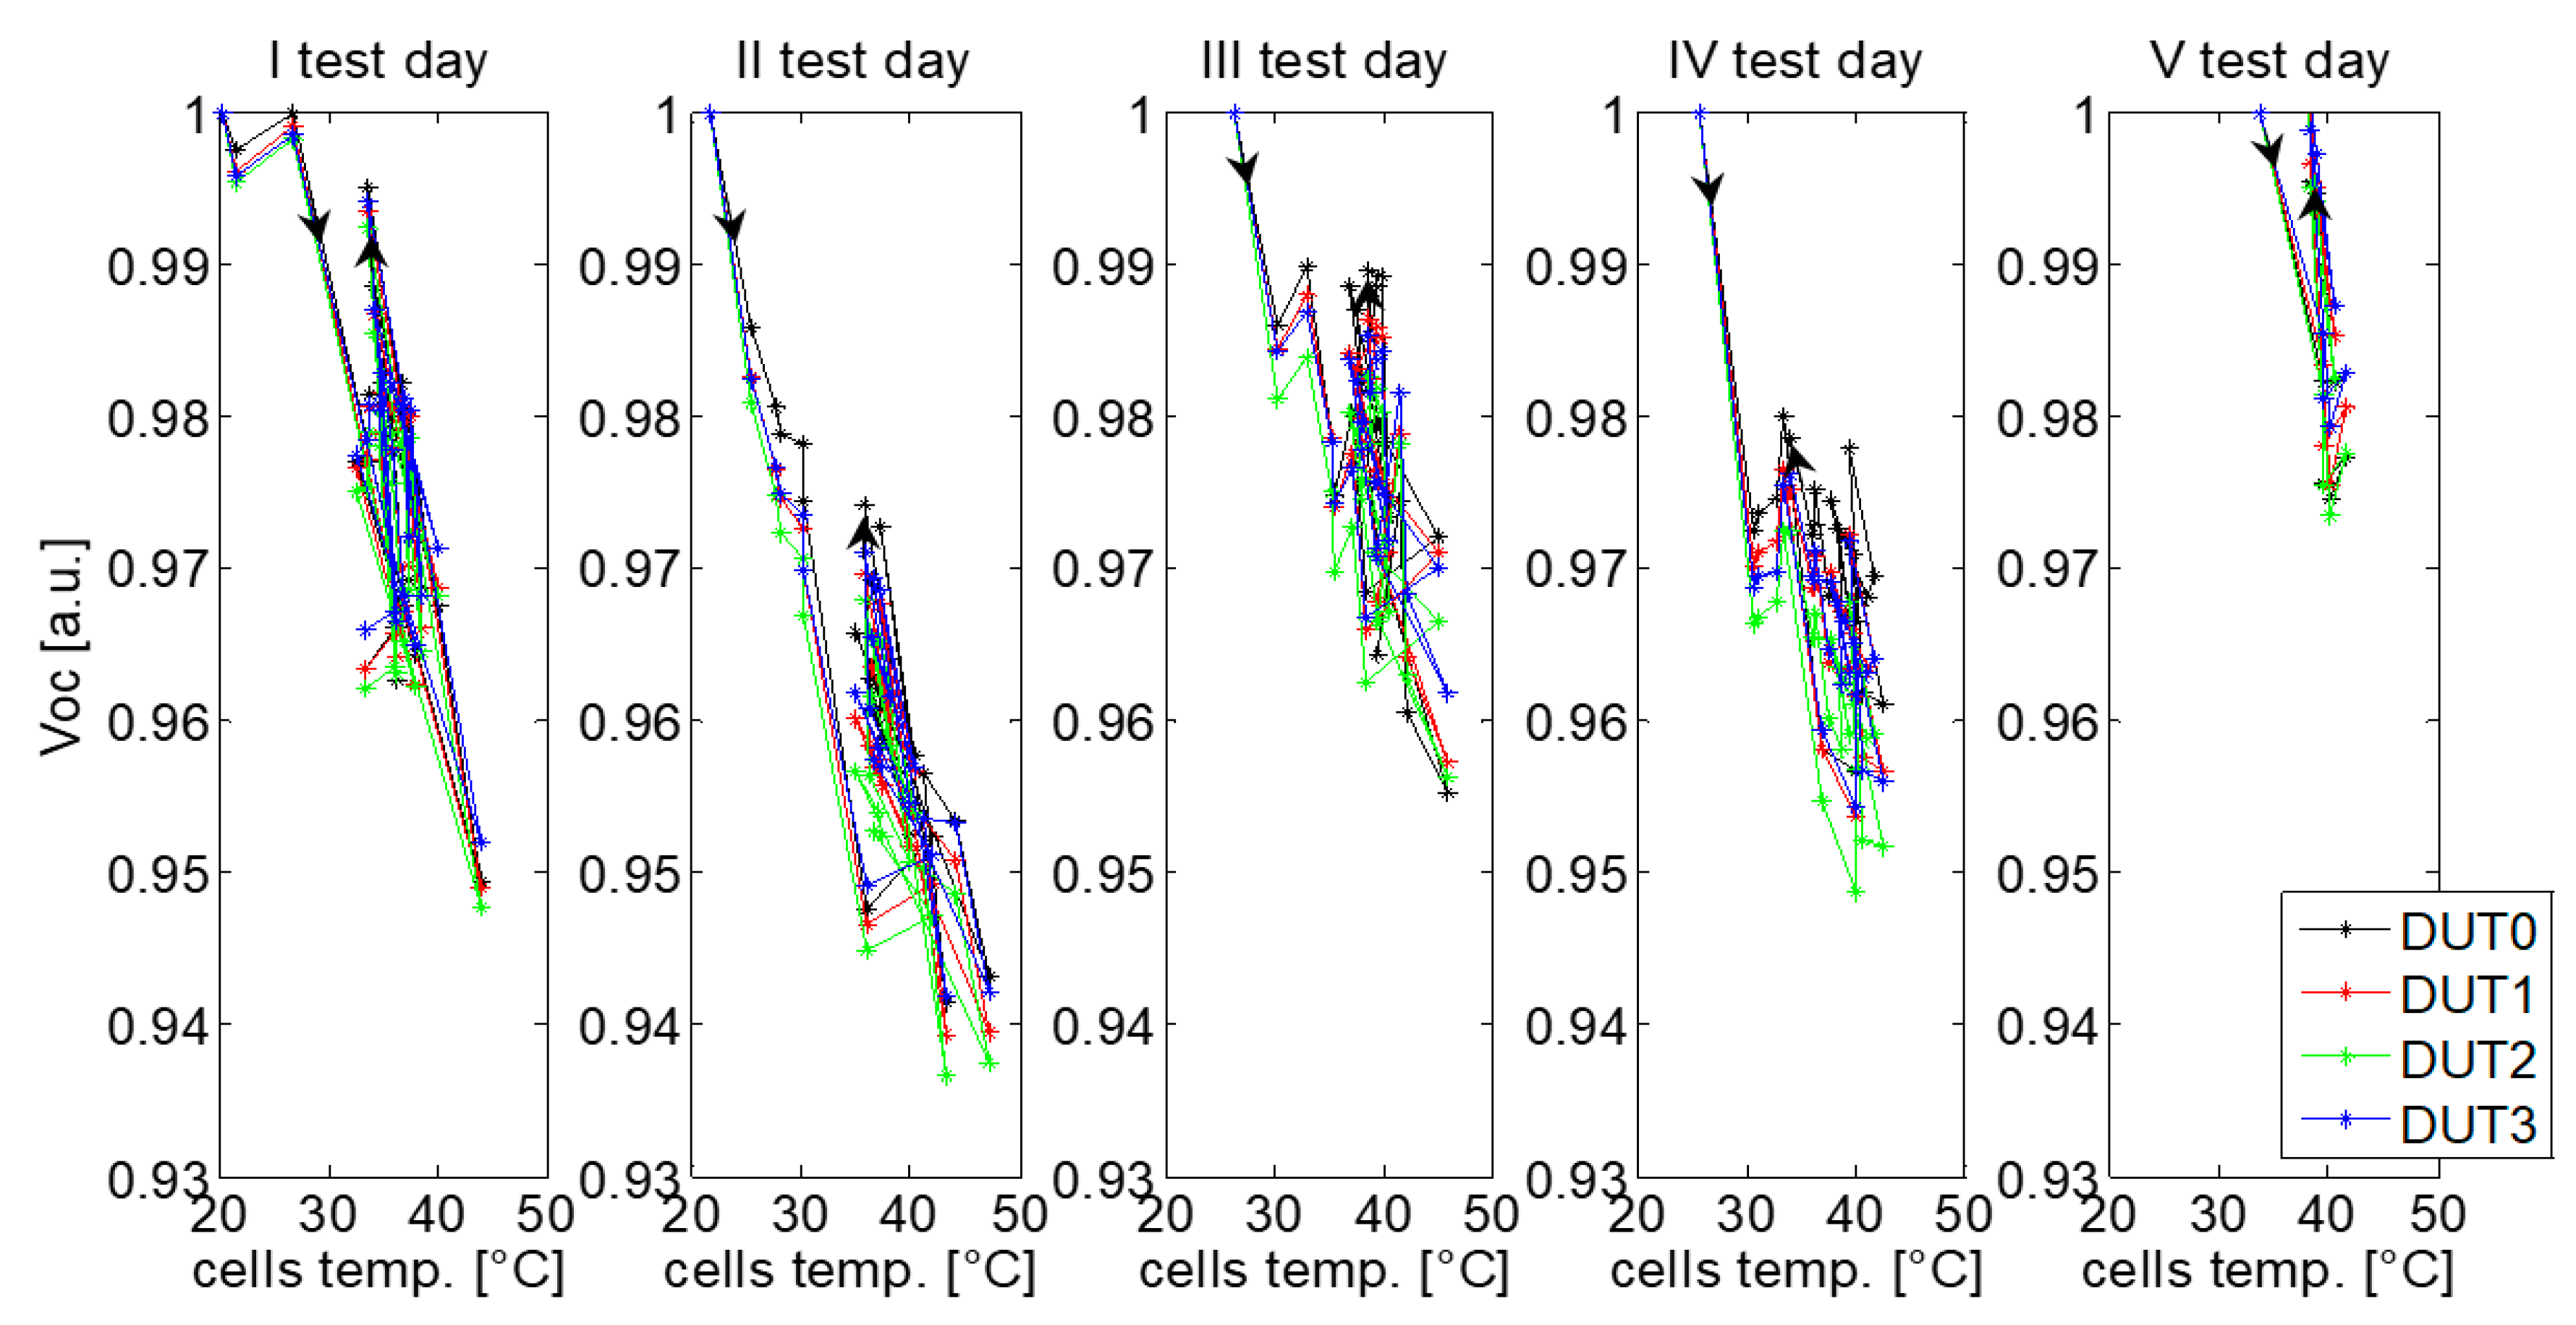
Finally, if we plot the Voc data as a function of the solar cell temperature (graphs reported in Figure 8), we clearly observe that, for a given temperature value of the solar cells, an evident Voc growth occurs for all tests, by passing from the morning to the afternoon, in agreement to the trends observed for the module efficiency of Figure 3. Such Voc growths are therefore mainly the effect of the thermal annealing of defects in the mini-modules reversibly formed during the morning light soaking phase. Therefore, such defect annealing can be considered the main cause of the module efficiency improvements detected on going from the morning to the afternoon.

4. Conclusions

In this work, we have shown and discussed the results of extended outdoor tests on stabilized PV mini-modules of tandem amorphous Si/microcrystalline Si PV cells operating in their MPP. We show reversible effects of power conversion efficiency instability on going from the morning to the afternoon, well repeatable on a daily scale. We have studied the correlation between the mini-module electrical performance, the solar cell temperature, and the solar spectrum variations. High reproducibility of all the parameters is observed for the various mini-modules and test days. The experimental results show the following dynamics: first, in the morning, defects are formed during the light soaking phase. Then, around mid-day, a thermal annealing of the defects formed in the morning takes place. Finally, in the afternoon, thanks to the mid-day defect annealing effect, a module efficiency improvement takes place. The effect is reversible on a daily basis. The cause of the instability is mainly the module temperature rise and fall during its operation, while the change of solar spectrum, though present, plays a minor role.

Author Contributions

Conceptualization, S.L. and F.R.G.; methodology, S.L.; software, S.L.; validation, S.L. and F.R.G.; formal analysis, S.L. and F.R.G.; investigation, F.R.G.; resources, C.G. and A.C.; data curation, F.R.G.; writing—original draft preparation, F.R.G.; writing—review and editing, S.L. and F.R.G.; visualization, F.R.G.; supervision, S.L., please turn to the CRediT taxonomy for the term explanation.

Funding

This research received no external funding and the APC was funded by CNR Istituto per la Microelettronica e Microsistemi (IMM), Ottava Strada n. 5—Z.I., I-95121 Catania, P. IVA 02118311006.

Conflicts of Interest

The authors declare no conflict of interest.

References

  1. Reece, S.Y.; Hamel, J.A.; Sung, K.; Jarvi, T.D.; Esswein, A.J.; Pijpers, J.J.H.; Nocera, D.G. Wireless Solar Water Splitting Using Silicon-Based Semiconductors and Earth-Abundant Catalysts. Science 2011, 334, 645–648. [Google Scholar] [CrossRef] [PubMed] [Green Version]
  2. Staebler, D.L.; Wronski, C.R. Reversible conductivity changes in discharge-produced amorphous Si. Appl. Phys. Lett. 1977, 31, 292–294. [Google Scholar] [CrossRef]
  3. Deng, X.; Schiff, E.A. Amorphous Silicon–based Solar Cells. In Handbook of Photovoltaic Science and Engineering; Luque, A., Hegedus, S., Eds.; Wiley: Chichester, UK, 2003; pp. 505–565. [Google Scholar]
  4. Guha, S. Multijunction Solar Cells and Modules. In Technology and Applications of Amorphous Silicon; Street, R., Ed.; Springer: Berlin/Heidelberg, Germany, 1999; pp. 252–305. [Google Scholar]
  5. Carlson, D.E.; Rajan, K. The reversal of light-induced degradation in amorphous silicon solar cells by an electric field. Appl. Phys. Lett. 1997, 70, 2168–2170. [Google Scholar] [CrossRef]
  6. Scuto, A.; Valenti, L.; Pierro, S.; Foti, M.; Gerardi, C.; Battaglia, A.; Lombardo, S. Role of electric field and electrode material on the improvement of the ageing effects in hydrogenated amorphous silicon solar cells. Sol. Energy Mater. Sol. Cells 2015, 141, 203–209. [Google Scholar] [CrossRef]
  7. Scuto, A.; Foti, M.; Gerardi, C.; Battaglia, A.; Lombardo, S. Improvement of solar cell performance and reversibility of ageing effects in hydrogenated amorphous silicon solar cells under illumination and electric field stress: Role of TCO and substrate. In Proceedings of the 2016 IEEE International Reliability Physics Symposium (IRPS), Pasadena, CA, USA, 17–27 April 2016; pp. 3C-3-1–3C-3-7. [Google Scholar] [CrossRef]
  8. Scuto, A.; Gerardi, C.; Battaglia, A.; Lombardo, S. Effect of illumination and electric field intensity on the efficiency improvement of amorphous silicon tandem solar cells. J. Vac. Sci. Technol. B 2017, 35, 01A106. [Google Scholar] [CrossRef]
  9. Scuto, A.; Gerardi, C.; Battaglia, A.; Canino, A.; Lombardo, S. Effect of field and pump light wavelength during DC stress on the efficiency improvement of amorphous silicon single junction and tandem solar cells. In Proceedings of the 2017 IEEE International Reliability Physics Symposium (IRPS), Monterey, CA, USA, 2–6 April 2017; pp. 2F-3.1–2F-3.6. [Google Scholar] [CrossRef]
  10. Ricco Galluzzo, F.; Scuto, A.; Gerardi, C.; Battaglia, A.; Canino, A.; Lombardo, S. Performance increase of tandem amorphous/microcrystalline Si PV devices under variable illumination and temperature conditions. Microelectron. Reliab. 2018, 88, 1025–1029. [Google Scholar] [CrossRef]
  11. Swartz, G.A. Reverse bias and heat treatment to improve performance of a-Si solar cells. Appl. Phys. Lett. 1984, 44, 697–699. [Google Scholar] [CrossRef]
  12. del Cueto, J.A.; von Roedern, B. Temperature-induced changes in the performance of amorphous silicon multi-junction modules in controlled light-soaking. Prog. Photovolt. Res. Appl. 1999, 7, 101–112. [Google Scholar] [CrossRef]
  13. Carlson, D.; Lin, G.; Ganguly, G. Temperature dependence of amorphous silicon solar cell PV parameters. In Proceedings of the 28th IEEE Photovoltaic Specialists Conference, Anchorage, AK, USA, 15–22 September 2000; pp. 707–712. [Google Scholar] [CrossRef]
  14. Liu, S.H.; Simburger, E.J.; Matsumoto, J.; Garcia, A., III; Ross, J.; Nocerino, J. Evaluation of thin-film solar cell temperature coefficients for space applications. Prog. Photovolt. Res. Appl. 2005, 13, 149–156. [Google Scholar] [CrossRef]
  15. Virtuani, A.; Pavanello, D.; Friesen, G. Overview of Temperature Coefficients of Different Thin Film Photovoltaic Technologies. In Proceedings of the 25th European Photovoltaic Solar Energy Conference and Exhibition/5th World Conference on Photovoltaic Energy Conversion, Valencia, Spain, 6–10 September 2010; pp. 4248–4252. [Google Scholar] [CrossRef]
  16. Rüther, R.; Kleiss, G.; Reiche, K. Spectral effects on amorphous silicon solar module fill factors. Sol. Energy Mater. Sol. Cells 2002, 71, 375–385. [Google Scholar] [CrossRef] [Green Version]
  17. Gottschalg, R.; Infield, D.G.; Kearney, M.J. Experimental study of variations of the solar spectrum of relevance to thin film solar cells. Sol. Energy Mater. Sol. Cells 2003, 79, 527–537. [Google Scholar] [CrossRef]
  18. Kenny, R.P.; Ioannides, A.; Müllejans, H.; Zaaiman, W.; Dunlop, E.D. Performance of thin film PV modules. Thin Solid Film. 2006, 511, 663–672. [Google Scholar] [CrossRef]
  19. Minemoto, T.; Toda, M.; Nagae, S.; Gotoh, M.; Nakajima, A.; Yamamoto, K.; Takakura, H.; Hamakawa, Y. Effect of spectral irradiance distribution on the outdoor performance of amorphous Si//thin-film crystalline Si stacked photovoltaic modules. Sol. Energy Mater. Sol. Cells 2007, 91, 120–122. [Google Scholar] [CrossRef]
  20. Ghitas, A.E. Studying the effect of spectral variations intensity of the incident solar radiation on the Si solar cells performance. NRIAG J. Astron. Geophys. 2012, 1, 165–171. [Google Scholar] [CrossRef] [Green Version]
Figure 1. Schematics of: (a) the experimental set up used for the PV mini-module testing; (b) the measurement system used for the solar spectrum detection. Pictures of the main components of: (c) the experimental set up schematized in (a): the tested mini-modules were installed on an inclined support (tilt angle about 21°) with a ref. mini-module (used for detecting the operating cell temperature) and a c-Si ref. solar cell (used for solar irradiance monitoring); (d) the measurement system schematized in (b).
Energies 12 02876 g001
Figure 2. Trends, as a function of the solar time during the tests performed outdoor, of: (a) mini-module overall power conversion efficiency; (b) solar cell operating temperatures.
Energies 12 02876 g002
Figure 3. Trends, during the tests in Figure 2, of mini-module overall power conversion efficiency, as a function of the solar cell operating temperatures. Note: the arrows on the curves represents the direction of the time evolution.
Energies 12 02876 g003
Figure 4. Schematic representation of a mini-module power conversion efficiency trend, by varying the temperature achieved by its solar cells, as it is deductible from the experimental behavior shown in Figure 3.
Energies 12 02876 g004
Figure 5. Trends, during the test of day 2 in Figure 2 and Figure 3, of the tested mini-module main electrical parameters, as a function of the cell operating temperatures: (a) open circuit voltage, Voc; (b) series resistance, Roc; (c) short circuit current density, Jsc; (d) fill factor, FF. Note: trends in (a) normalized to the initial values of the mini-module Voc (at the beginning of the considered test day). Trends in (bd) normalized to the incident light intensity and to the considered parameters initial values. The arrows on the curves represents the direction of the time evolution.
Energies 12 02876 g005
Figure 6. Solar spectrum evolution, measured in different days in May–June 2019: (a) solar spectra at different solar times during the V test day of Figure 1, (b) solar spectra at different solar times during another test day. Note: each spectrum is normalized to its maximum value. The solar spectra shown are not corrected for the external quantum efficiency (EQE) of the photodetector used.
Energies 12 02876 g006
Figure 7. Normalized trends, during the tests performed outdoor, of (a) fill factor, FF, (b) short circuit current density, norm. Jsc, (c) open circuit voltage, Voc, for the samples tested. Note: FF and Voc trends referred to the initial values at the beginning of each test; Jsc trends normalized to the incident light over the samples surface in each measure cycle and to the initial values at the beginning of each test.
Energies 12 02876 g007
Figure 8. Open circuit voltage (Voc) normalized trends for the samples during the tests performed outdoor on them (in the test days of Figure 2 and Figure 3), as a function of the operating cell temperature. Note: the arrows on the curves represents the direction of the time evolution.
Energies 12 02876 g008
Table 1. Variations of the main el. param. (power conv. eff., FF, Jsc,norm., Voc) of the DUT0, during the tests performed. To calc. such var. for each test, two different solar times are considered, with similar global irradiance levels on the sample surface but different solar spectrum shapes. The variations of irradiance (Δirr.) and solar cell temperature (Δtemp.) between the mentioned times are reported too. Note: a positive var. indicates a param. growth from the morning to the afternoon.
Test N.Solar Times (UTC+1)Δirr. [%]Δtemp. [%]Δeff. [%]ΔFF [%]ΔJsc,norm. [%]ΔVoc [%]
I10:34+0.01−8.15+2.54−0.84+1.50+1.78
13:40
II11:20−0.68−11.00+2.49−0.37+0.71+2.04
12:59
III11:08+0.76+3.95+1.310.00+0.30+0.98
12:58
IV11:06−0.47−3.05+0.97−0.40+0.30+1.06
13:17
V11:06−1.3−3.76+2.900.28+0.04+3.16
12:55
Table 2. Variations of the main el. param. (power conv. eff., FF, Jsc,norm., Voc) of the DUT1, during the tests performed. The variations are calculated as those reported in Table 1. The variations of irradiance (Δirr.) and of solar cell temperature (Δtemp.) between the mentioned times are reported too. Note: a positive var. indicates a param. growth from the morning to the afternoon.
Test N.Solar Times (UTC+1)Δirr. [%]Δtemp. [%]Δeff. [%]ΔFF [%]ΔJsc,norm. [%]ΔVoc [%]
I10:34+0.01−8.15+1.64−0.46+0.12+1.92
13:40
II11:20−0.68−11.00+2.30−0.07+0.42+1.84
12:59
III11:08+0.76+3.95+1.15+0.1+0.06+0.96
12:58
IV11:06−0.47−3.05+1.05−0.14+0.28+0.87
13:17
V11:06−1.3−3.76+2.65+0.01-0.52+3.17
12:55

