Article

Renewable Energy Sources Penetration in Greece: Characteristics and Seasonal Variation of the Electricity Demand Share Covering

Laboratory of Process Analysis and Design, National Technical University of Athens, 15780 Athens, Greece
*
Author to whom correspondence should be addressed.
Energies 2019, 12(12), 2441; https://doi.org/10.3390/en12122441
Submission received: 29 May 2019 / Revised: 17 June 2019 / Accepted: 21 June 2019 / Published: 25 June 2019

Abstract

:
The significant penetration of renewables, in the Hellenic electricity system, during the last 12 years, was based on feed-in tariff-supporting schemes, according to the compliance to European Directives. The characteristics of this penetration are presented and analyzed in this paper based on real data. Photovoltaics, wind parks, hydroelectric plants, biomass-driven plants, and cogeneration systems are examined. The cost of the feed-in tariff incentives is qualified and analyzed. Simple but effective models are proposed to describe renewable seasonal variation: (a) A simple cosine model adequately describes the seasonal performance of various renewable technologies in terms of capacity factor; (b) a smart seasonal model based on the separation between winter and summer consumption activities (both following normal distributions) adequately describes the electricity consumption profile. The predicted values of renewable shares using the proposed models were also validated with historical data. Thus, the applied models can be used to forecast renewable shares under different penetration scenarios.

1. Introduction

Over the last 15 years, a large-scale diffusion in renewables has occurred on a European level, due to the mandatory commitments of the 20-20-20 European Directives. In fact, in 2017, the renewable energy sources (RES) electricity share in Europe reached the percentage of 30.8%, compared to 14.3% in 2004. Countries like Denmark, Latvia, Austria, Portugal, and Sweden produce more than 50% of their electricity from renewables, while Germany, Spain, and Italy follow with percentages higher than 30% [1].
In Greece, the share of RES energy in gross final energy consumption grew from 6.9% in 2004 to 16.3% in 2017, aiming to reach at least 18% in 2020, which is the European target for the country. During this period, RES investments were significantly encouraged from beneficial supporting policies. Feed-in tariffs, provided by a series of relative laws, triggered a rapid deployment of renewables in the country [2,3,4,5].
From an environmental point of view, RES electricity production reduces harmful emissions including greenhouse effect gases that cause climate change and facilitates the implementation of European targets towards this direction. However, besides these benefits, their extensive deployment has posed various challenges in the energy market [6]. Considering the volatility and stochastic nature of renewable technologies operation, the efficient management of power systems, in terms of planning and operation, has been the subject of several publications [7,8,9,10,11,12]. In addition to this, the idea of energy storage has been developed [13], especially for non-interconnected islands [14].
Moreover, the cost of renewables and their impact on electricity prices is a topic of debate in many countries that have experienced large-scale RES development. Representative examples are Germany and Italy, which adopted especially attractive support schemes (feed-in tariffs in Germany, green certificates schemes and feed-in premiums in Italy), and significantly increased their renewable electricity share. Sensfuß et al. and Clò et al. analyzed the RES price effect in the market of these two countries in [15] and [16], respectively. An overview of studies attempting to quantify the RES price impact can be found in [17].
In Greece, a group of researchers developed analytical simulation models to examine the consequences of RES integration in Hellenic energy market and their effect on the (a) the system marginal price (SPM), (b) the payment of the consumers, (c) RES surcharge for the payment of feed-in tariffs, (d) CO2 emissions, and (e) generation costs [9,18,19]. According to the results, the integration of RES in Greece leads to lower values of SMP and CO2 emissions, while the payment of the consumers increases.
The scope of this paper is (a) to present and analyze the evolution of the legislative framework, that triggered the increased share of RES in the Hellenic electricity market, (b) to describe and analyze the characteristics of penetration, and (c) to quantify the cost of incentives and its effect on electricity market. Five RES technologies are examined, namely photovoltaics, wind parks, small hydroelectric plants (namely, installations without a reservoir), biomass-driven plants, and cogeneration systems.
Furthermore, the paper aims to propose the appropriate mathematical models for the description of the renewable seasonal performance, in order to forecast the consequences of more intensive penetration in the future.
The evolution of the legislative framework is presented in Section 2 and its effect on penetration is analyzed in Section 4.1 and Section 4.2. The seasonal variation models are presented in Section 3.2 and Section 4.4, these models are fitted to real data of Section 4.3. The resulting models are used to analyze various future scenarios in Section 4.5 and the results are summarized in Section 5.

2. The Evolution of the Hellenic Legislative Framework

At the national level, the first regulation on the production of electricity from RES is contained in Law 2244/1994, according to which the production of electricity is allowed, among other things, by RES (without, however, being protected in a certain form of differentiated treatment), and the electricity produced could be allocated exclusively to a public power corporation (PPC), which was, respectively, obliged to purchase.
Provisions for RES were also included in Law 2773/1999. This Law introduced the obligation to obtain a license for the production of electricity from renewable energy sources and, for the sake of promoting their production, it was the obligation of the transmission system operator (TSO) to give priority to their dispatch, whereas in the non-interconnected islands, PPC, as the administrator of the distribution network, was also obliged to absorb the electricity produced from RES. To this end, it was stipulated that the holders of an electricity generation license from RES will conclude a relevant contract with the TSO, or in the case of non-interconnected islands, with the distribution network operator (PPC), according to the provisions of the relevant system and distribution network management codes. The price of the absorbed electricity has been provided to the producers themselves by the competent operator and is recovered from them through a special RES Account, the management of which was assigned to the Hellenic transmission system operator (HTSO, DESMIE known in Greek) and its resources were determined by the Law.
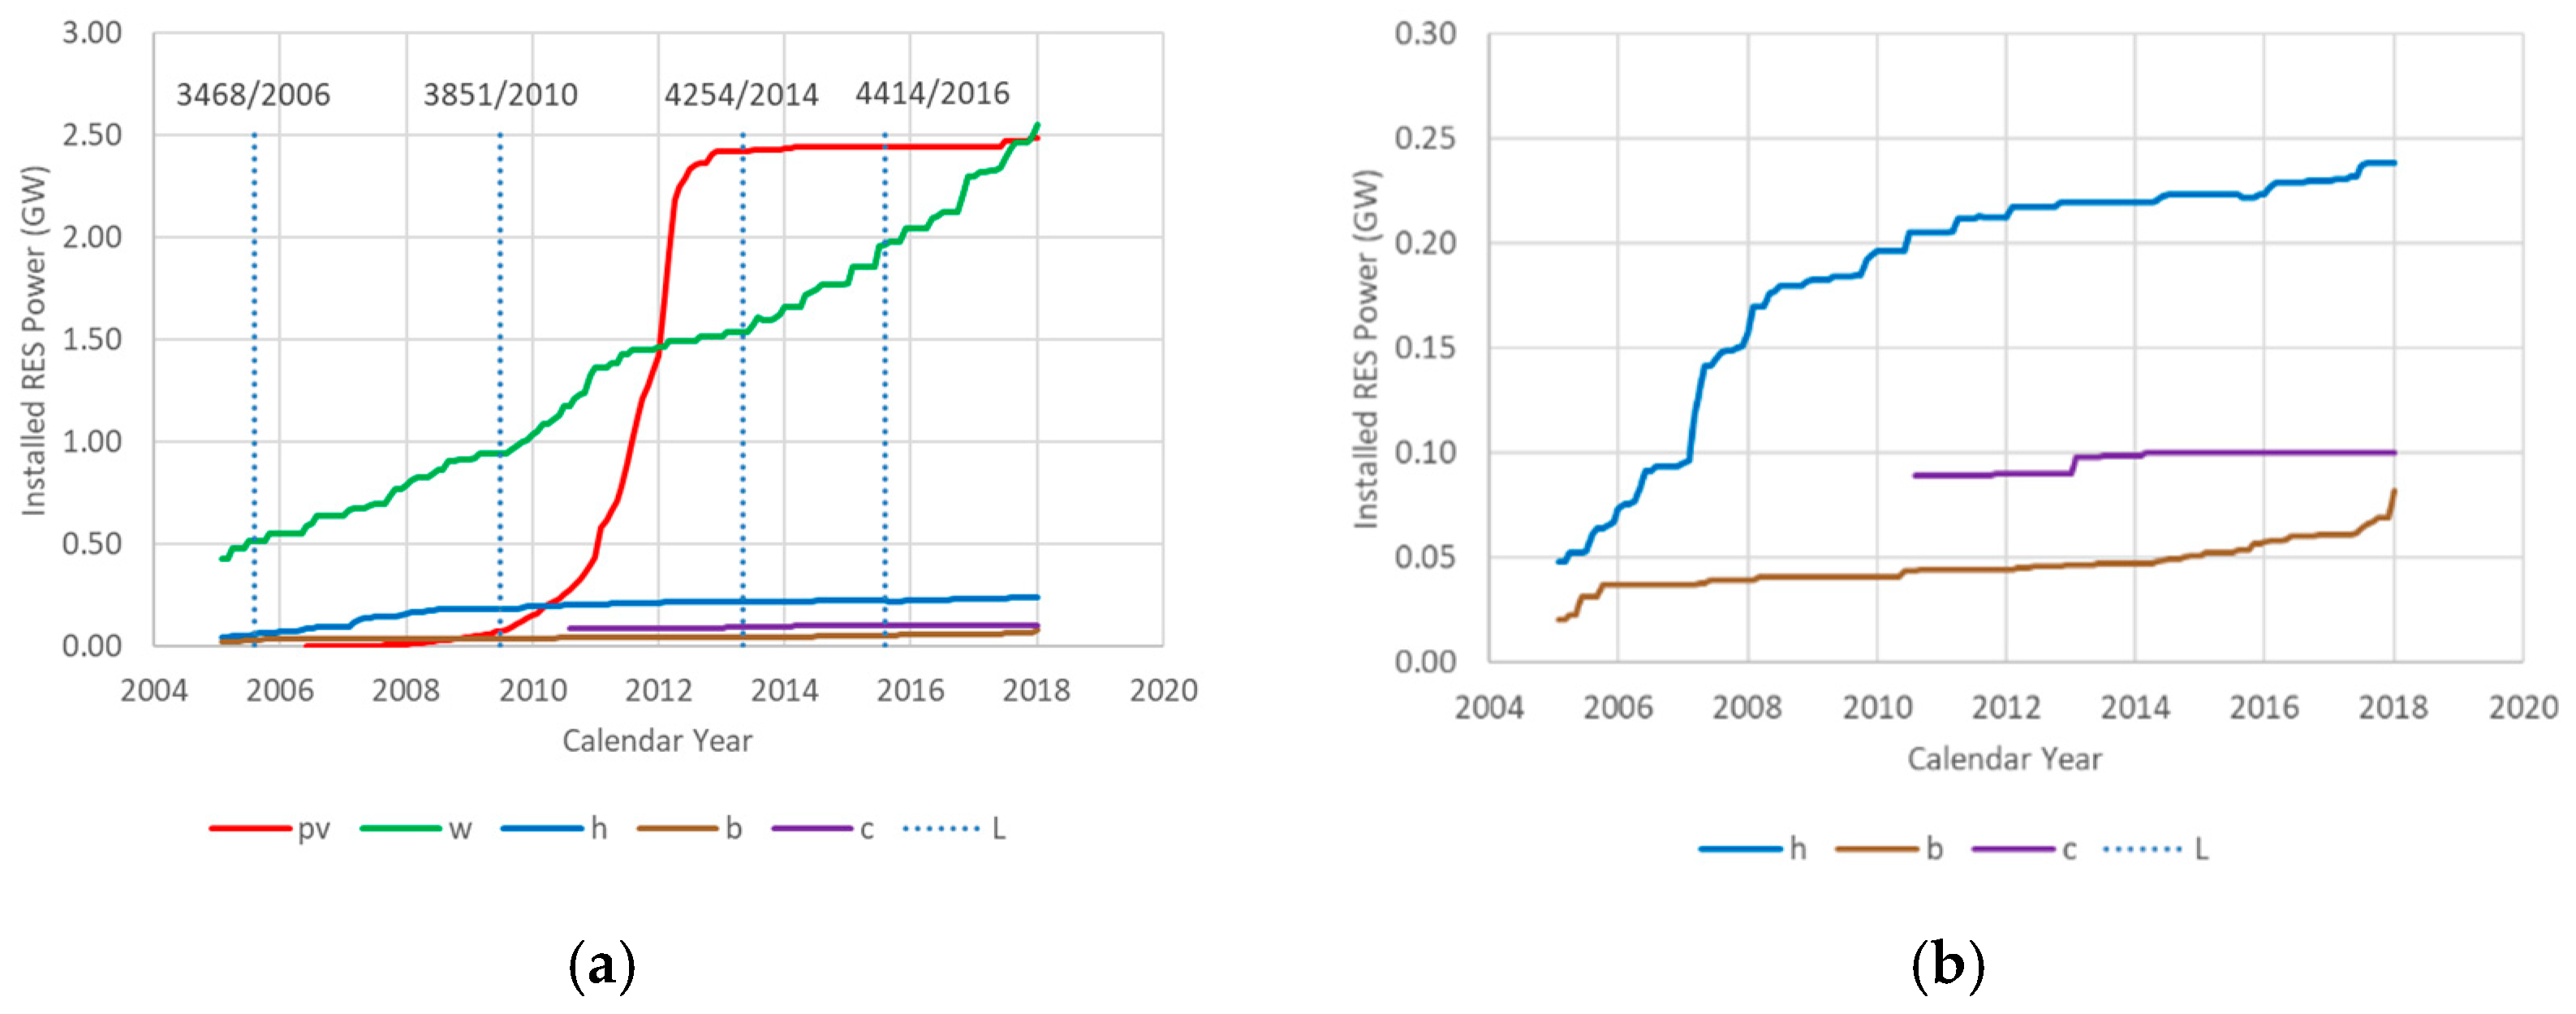
The first specialized national legislation on RES was Law 3468/2006, where among others, the provisions of European Directive 2001/77/EC were transposed and incorporated in the Greek legal order. Through this law, the framework for the production of RES electricity became autonomous from the general framework for electricity. An obligation was imposed on the TSO and the operator of the non-interconnected islands to conclude a contract for the purchase of electricity from renewable energy sources. Furthermore, the issues of pricing for the energy sold under the feed-in tariff (FIT) fixed-price compensation model were introduced. The priority in absorption of the RES-electricity was maintained, aiming to achieve national (and European) RES targets. Under the same Law, Greece self-committed itself for the first time in targeting RES contribution. In detail, the target of RES electricity contribution in total final gross electricity consumption was set at 20.1% by 2010 and 29% by 2020. It was also specifically envisaged to establish a development program to promote the production of electricity especially from PV stations with a capacity of at least 500 MW connected to the interconnected system and at least 200 MW for the non-interconnected islands up to 31 December 2020.
Law 3734/2009 foresaw a progressive decrease of the FIT for each semester and extended the duration of the power purchase agreements (PPAs) from 10 to 20 years. It also stipulated the contracted FIT was to be maintained for a period of 18 months since the signature date of the PPA. Should the activation occur past the 18-month interval, the guaranteed tariff was no longer maintained and was set according to the provisions of the equivalent semester of its activation [20]. Finally, the concept of the floating-rate compensation over the system’s margin price (SMP) for feed-in premium (FIP) for PV plant connections after 1 January 2015 was first introduced.
With Law 3851/2010, the objective of RES participation in total energy consumption according to Directive 2009/28/ EC was verbatim adopted as a “national target” while the provisions of Law 3468/2006 were amended and/or supplemented. Among others, electricity produced from RES was rationalized. Additionally, Law 3851/2010 significantly simplified RES licensing procedure.
By virtue of Law 3468/2006, as amended by Law 3889/2010, the national targets for RES are set by ministerial decision (MD) of the Ministry of Environment, Energy, and Climate Change, setting the limits of installed capacity and its breakdown by RES technology and producer category, as well as the process of any necessary suspension of RES licensing, in case these limits are exceeded. By virtue of the proposed provision, the MD/F1/oik.19598 was issued and officially defined the national targets and the projected proportion of installed capacity per RES technology for the years 2014 and 2020 (year of implementation of the European target) and the possibility of suspending the permitting and/or connection procedure by RES technology and/or by producer category by decision of the Minister of Environment, Energy and Climate Change.
With the Law 4001/2011, the existing regulations were basically maintained and adjusted in the new market structure. Thus, the responsibility of Hellenic electricity market 0perator (HEMO, LAGIE SA known in Greek) and Hellenic electricity distribution network operator (HEDNO, DEDDIE SA known in Greek) to enter into contracts for the sale of electricity of RES producers was foreseen, according to the provisions of Law 3468/2006. Furthermore, the provisions for the recovery from the Special RES Account of the amounts that HEMO and HEDNO pay to the RES producers and the sources of input of the RES account were also refined. Additionally, the authority of determining the numerical values of the rates for specifying the special RES Levy (ETMEAR known in Greek) on consumers’ bills was transferred to the regulatory authority for energy (RAE). Finally, a part of the auctioned amount of unallocated greenhouse gas emission allowances were designated as proceeds of the RES Account.
Through Law 4042/2012, a special fee paid by the lignite electricity producers was added to the resources of the RES Account amounting 2 Euros/MWh for lignite produced electricity. In an effort to address the serious concerns raised about the long-term financial sustainability of the Greek PV market, the MD 2262/2012 during January 2012 imposed an approximate 15% reduction of the tariffs. The reduction rates were normalized to the initial tariffs introduced by the Law 3468/2006, which were maintained for some semesters as stipulated by the Law 3734/2009 and 3851/2010. In accordance with this decision, provisions were also taken for a smooth and reasonable transitional period. In fact, the applications that had already been submitted to the market operator for PPAs since the publication date of this decision but were not finalized until then, preserved the tariffs that were foreseen in Law 3851/2010. Likewise, the MD 2301/16933/2012 during August 2012 envisaged a further 28% reduction of the tariffs. A transitional period similar to the one previously described came into force regarding the tariffs. Essentially, the Law 4093/2012 enacted in November 2012 was the first one to establish emergent measures for rationalizing the funding mechanism for the remuneration of the energy generated from RES and PV stations. More specifically, it foresaw a “solidarity surcharge” (25–30%) for the energy generated during the period from 1 July 2012 to 30 June 2014. Most importantly, it stipulated the guaranteed tariff to be the one in effect during the semester when the PV station was activated. The cases that were excluded from this requirement were those that either had already submitted application for a PPA or had signed the agreement before the publication of Law 4093/2012. Finally, it required PV stations to be activated within four months after the implementation of the law, practically providing a short transitional period until March 2013 [20].
The 30% solidarity surcharge on PVs was subsequently modified by Law 4152/2013, based on their initial nominal FIT and connection date, to 34–42%. Law 4152/2013 also introduced the concept of minimum floor income from the wholesale market for the RES account on the basis of the corresponding weighted average variable cost of conventional thermal units (WAVCCTU) in the interconnected system, for the MWh infused by RES. The aim was that the minimum compensation to the RES account for the production of renewables should at least correspond to the avoided (theoretically) WAVCCTU. It is reported as theoretical, because WAVCCTU is calculated on the basis of the variable costs and infusions of the thermal units that retained their function despite the infusion of the RES, and not those whose operation was actually avoided and that were more expensive according to Merit Order model.
By Law 4254/2014, the tariffs for the sale of the RES projects in operation were unilaterally redefined in spite of the signed contracts in operation, for the purpose of downward harmonization–homogeneity of the economic returns (Project IRR) of the projects of all technologies in a period of 20 years and the stabilization of the RES account through the permanent containment of its outflows. Furthermore, the deletion of a part (€303 million) of its accumulated deficit through a compulsory credit invoice from RES producers was introduced. The imbalance in the economic returns of RES, and in particular of PVs, was created due to the rapid decrease in their installation cost without, however, a corresponding reduction in the offered FITs. As mentioned, prior to Law 4093/2012, the tariff was allowed to be held for 18 to 36 months depending on the capacity of the plant, below or above 10 MW, respectively, from the signing of the PPA with the market operator. In other words, the plants were not connected to the grid with corresponding-contemporary FIT, but with a much older (according to the time of signing the sales contract) corresponding to a significantly higher installation cost. Thus, while the tariffs for the new plants each time theoretically were reduced through MDs, these reductions did not penetrate the market due to the old FIT holding model in place. Finally, PPAs were extended by a period of seven years during which the tariff is defined equal to 90 Euros/MWh for a maximum annual energy of 1500 kWh/kW, or as determined by the market operator during the time of their expiration in the future.
With Law 4414 introduced in August 2016 in compliance with the European Commission’s Guidelines for State Aid, the aim for new renewable projects and their remuneration schemes was to converge and integrate better to electricity market operation at an optimum level of cost for the consumer, which would closely follow the declining cost of each relative renewable technology separately. Towards this direction, the FIT scheme was replaced with a sliding feed-in premium (FIP) model. New reference tariff (RT) prices introduced for each RES technology, while initially for PVs and later-on for wind projects, were provided to participate in competitive procedures for gaining this RT price. The sliding premium, namely the added remuneration on top of the market participation revenue, shall be calculated monthly, as the difference between, on the one hand, the RT applicable for the “contracts of difference” (feed-in premium contracts, FiPC), and on the other hand, the special market price for renewables (SMPRES) for the specific RES technology: FIP = RT − SMPRES. The FiPCs are signed between the producer and the market operator. The SMPRES will be calculated differently for intermittent (i.e., wind power, solar PV, and small hydro power plants) and non-intermittent (i.e., biomass, biogas, geothermal, solar thermal including storage facilities, and highly efficient co-generation of heat and power plants) renewable energy projects [21].
Since Law 4414/2016 for market participation and the competitive procedures introduced for the RT was effective for PV and wind projects above a threshold of installed capacity, the phenomenon of on-purpose division of projects to smaller appeared, since investors were preferring to bypass the new framework and instead continue to receive a regulated FIT for all new projects having in their portfolio. With Law 4602/2016, the State limited the ability of investors to enjoy, both directly and indirectly through affiliated companies, new PV < 500 kW and Wind < 3 MW projects outside competitive processes for the RT, to only two per technology. All the rest should participate in RAE’s auctioning processes to get a RT. The challenge in RAE’s auctions to get a RT for a new licensed PV plant (or wind farm) has to do with the overfill rule applied, initially at 75% and later 40%. This overfill rule means that from whatever licensed projects participate in an auction, only a portion of them will be finally selected and receive a RT. This portion relates to the total MWs participating in the auction divided by the overfill factor of 1.75 initially or 1.40 rule later on. The application of this rule affects the number of projects eligible to succeed in the auction through offering the lowest prices and does not alter the size of the projects eligible or selected.
Beginning 2019, through its new national plan for RES penetration in final gross energy consumption as submitted to EU, Greece set the target at 32% towards 2030. For PVs, this new target results in a final installed capacity of 6.9 GW during 2030. Intermediate targets also set for PVs are 3.3 GW for 2020 and 5.5 GW for 2025.

3. Data and Methods

3.1. Definitions

The renewable penetration is expressed mainly by two magnitudes: (a) The installed power of each renewable source (technology) and (b) the renewable energy (electricity) produced and infused into the grid:
P 
the installed power (MW);
E 
the electricity produced (MWh).
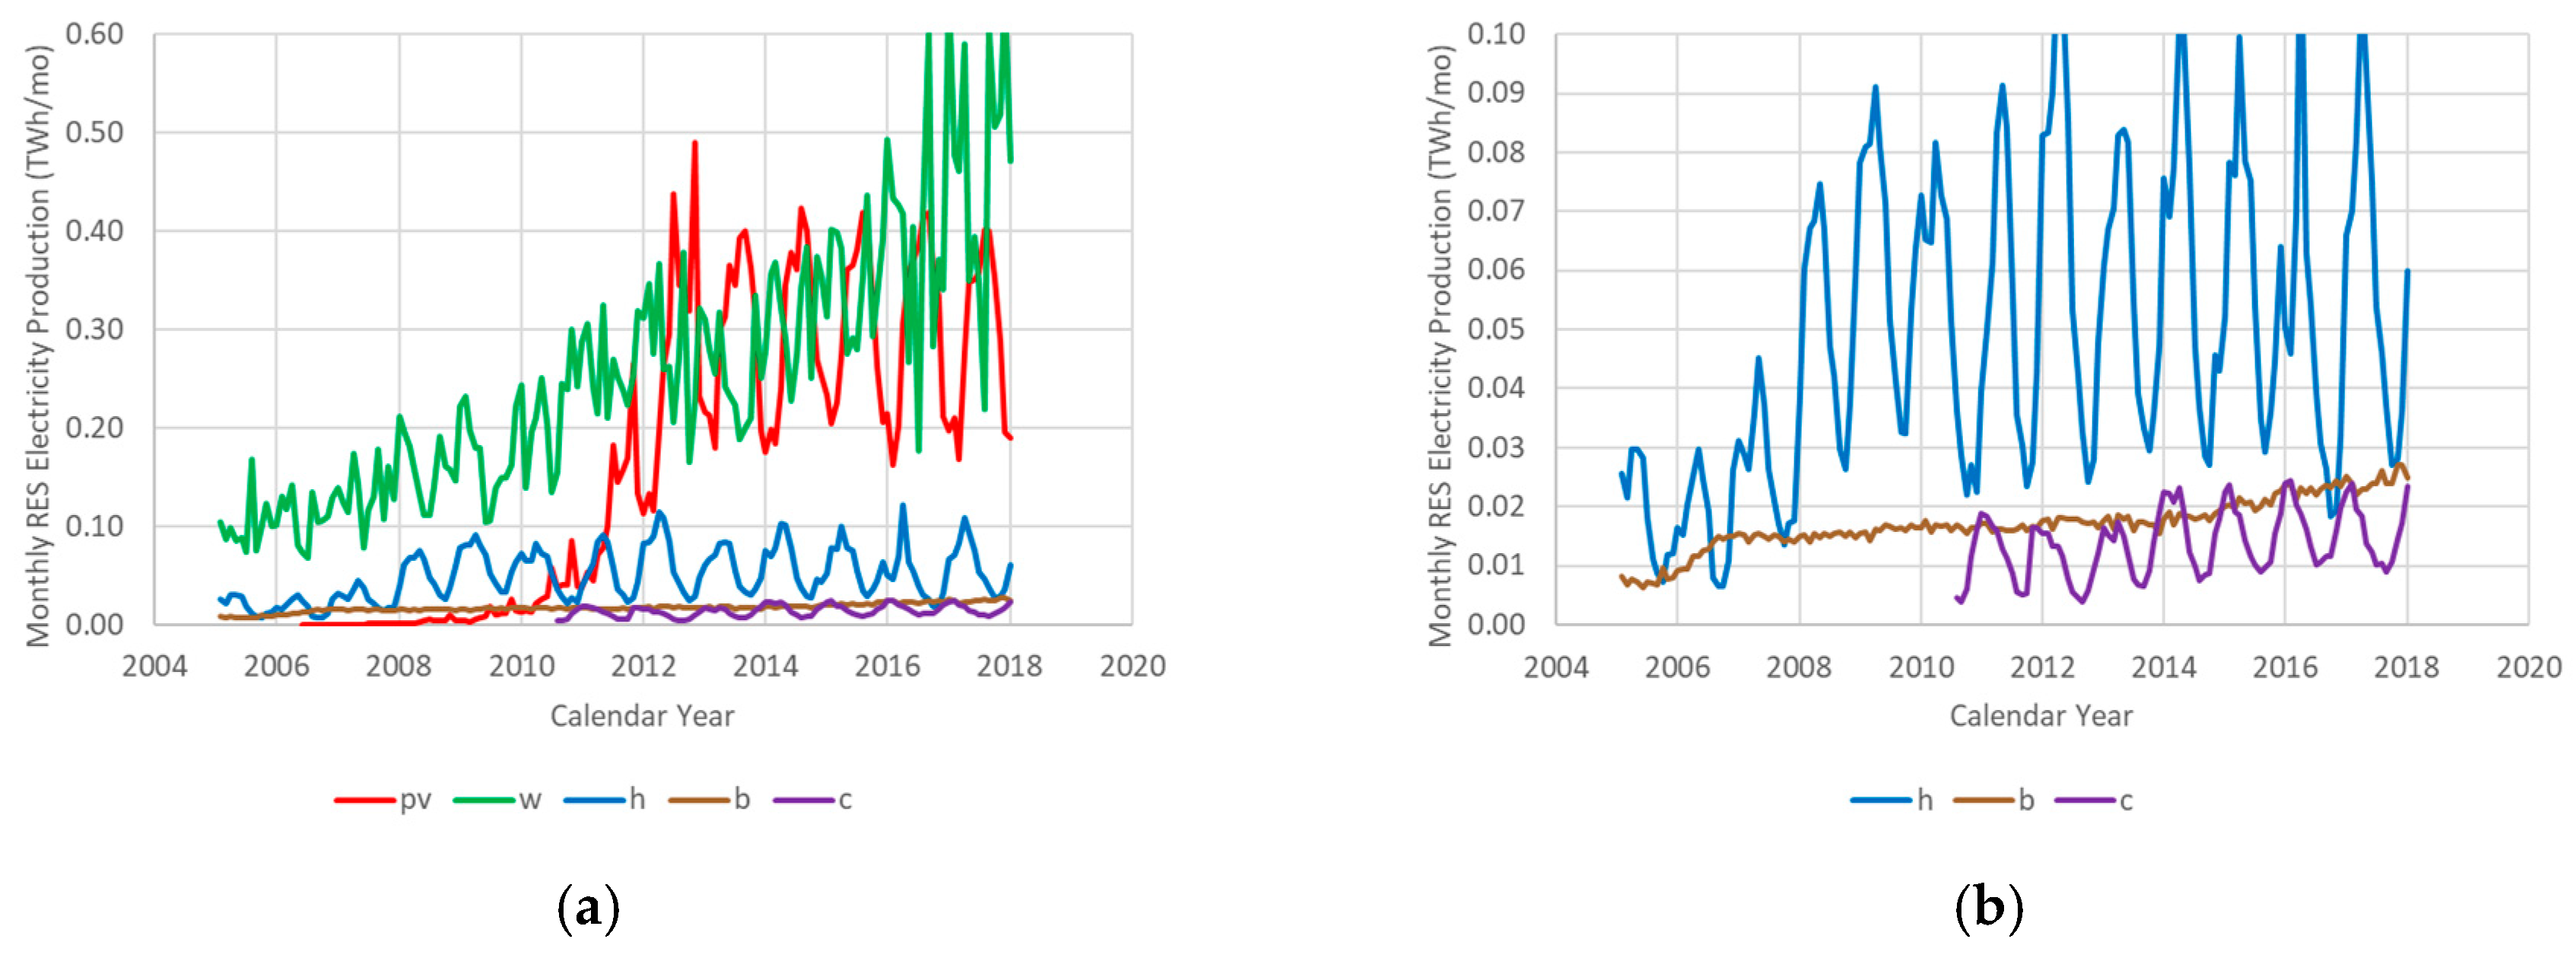
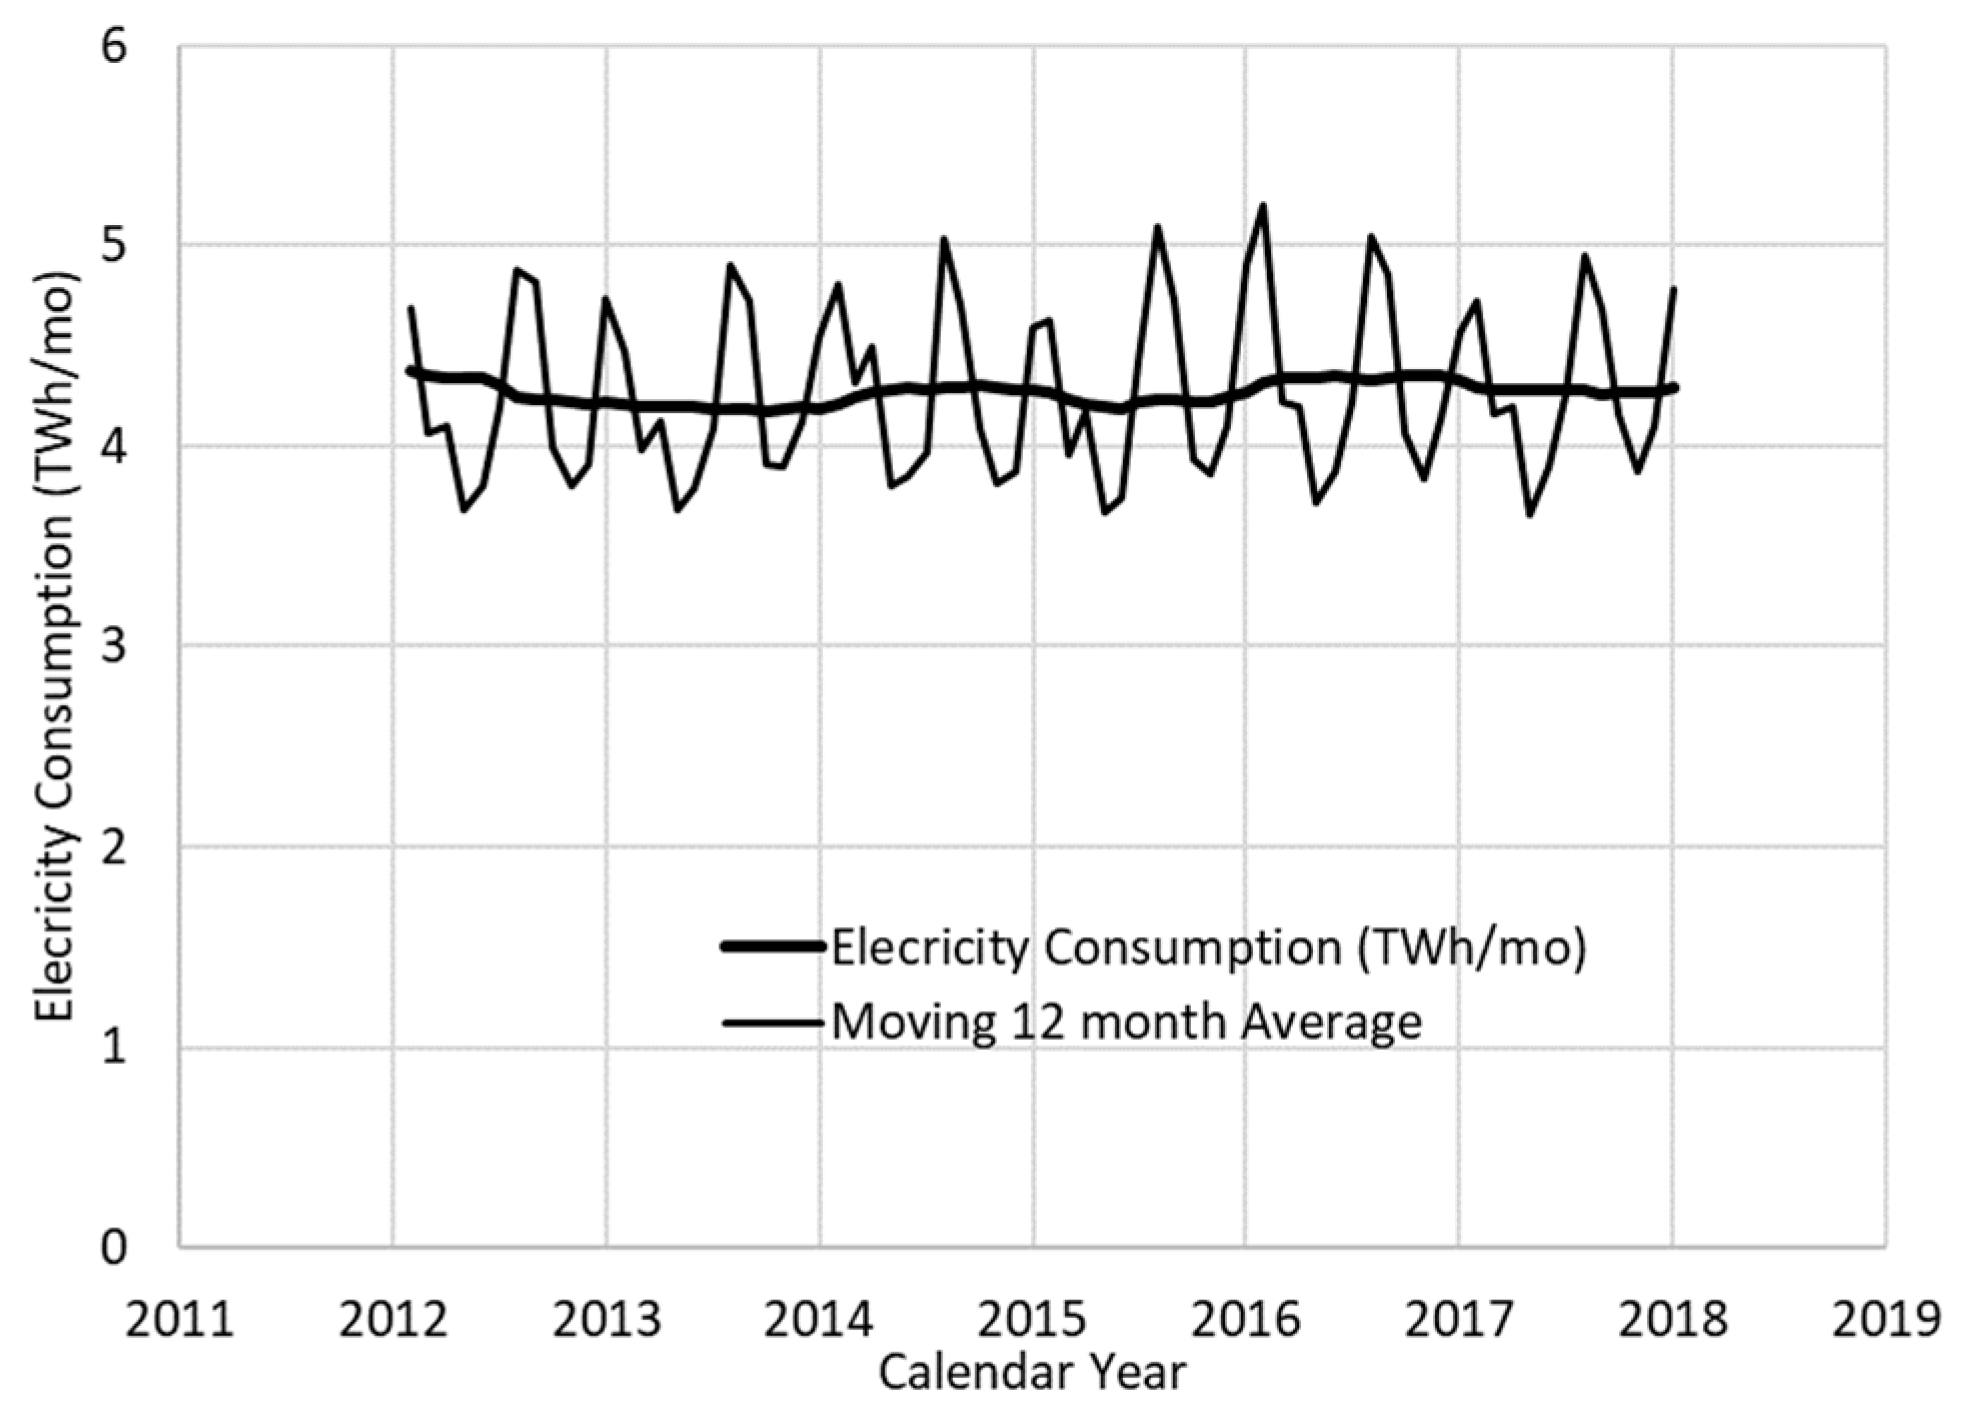
The evolution of the installed power versus time is, generally, a monotonically increasing function, except the case of the disconnection of some installations. The renewable energy is the electricity produced by the installed power over a specific time interval, e.g., a month or a year. Its evolution versus time is analogous to the installed power and follows a seasonal variation depending οn the characteristics of the renewable technology and the weather conditions. Monthly data reveal the seasonal variation while 12-month moving averages reveal the long-term evolution.
The penetration characteristics are usually further expressed by two crucial magnitudes; (a) the capacity factor and (b) the share of renewables in electricity consumption:
c 
the capacity factor (-);
s 
the renewable share in electricity consumption (-).
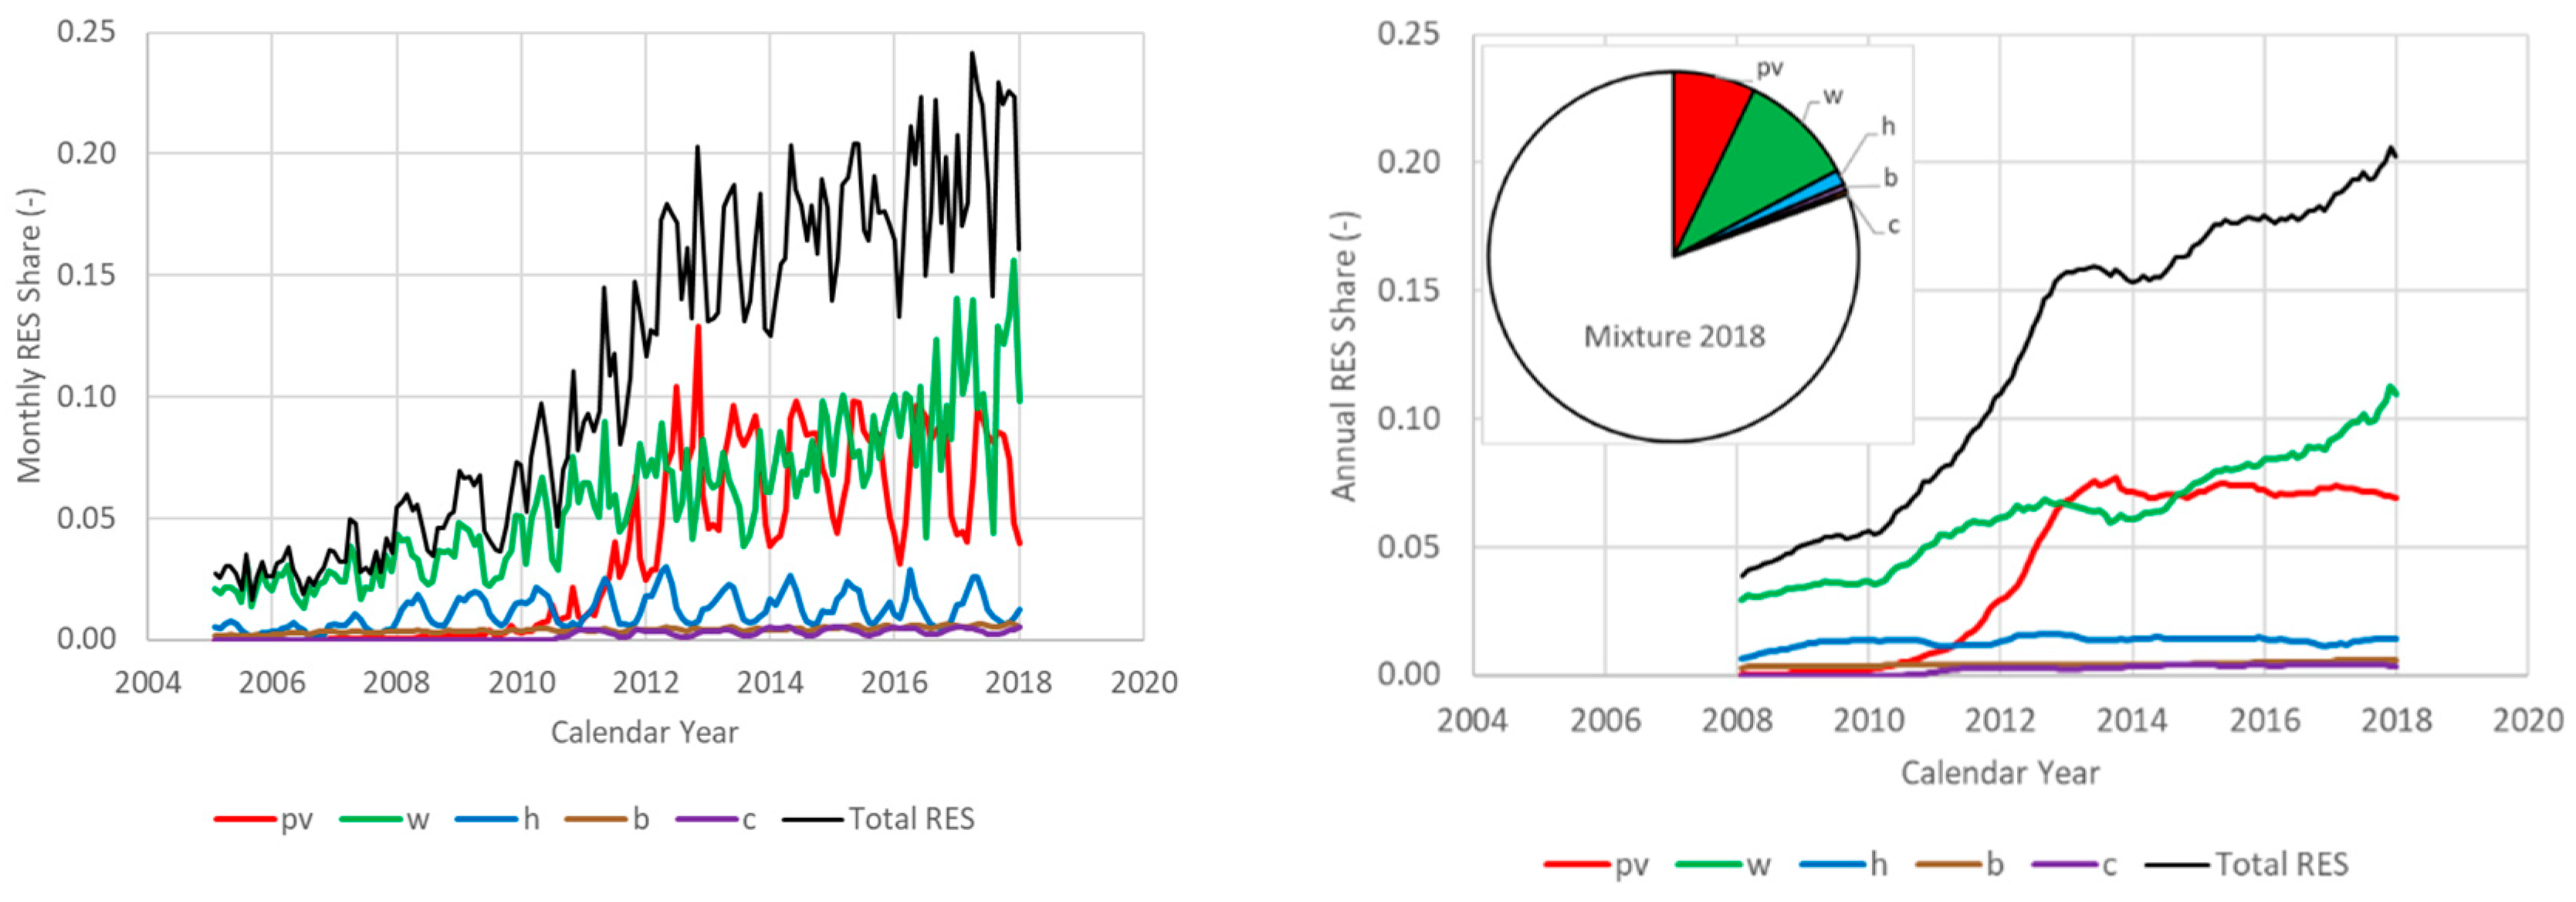
Both the capacity factor and the renewable share refer to a specific time interval and to a specific technology. The renewable share also refers to the total renewables.
The capacity factor of a power plant is the ratio of its actual output over a time period, to its potential output if it were possible for it to operate at full nominal capacity continuously over the same time period:
c = E P   t
where t is the corresponding time interval. The renewable share is defined by the following equation:
s = E D
where, D (MWh) is the electricity consumption.
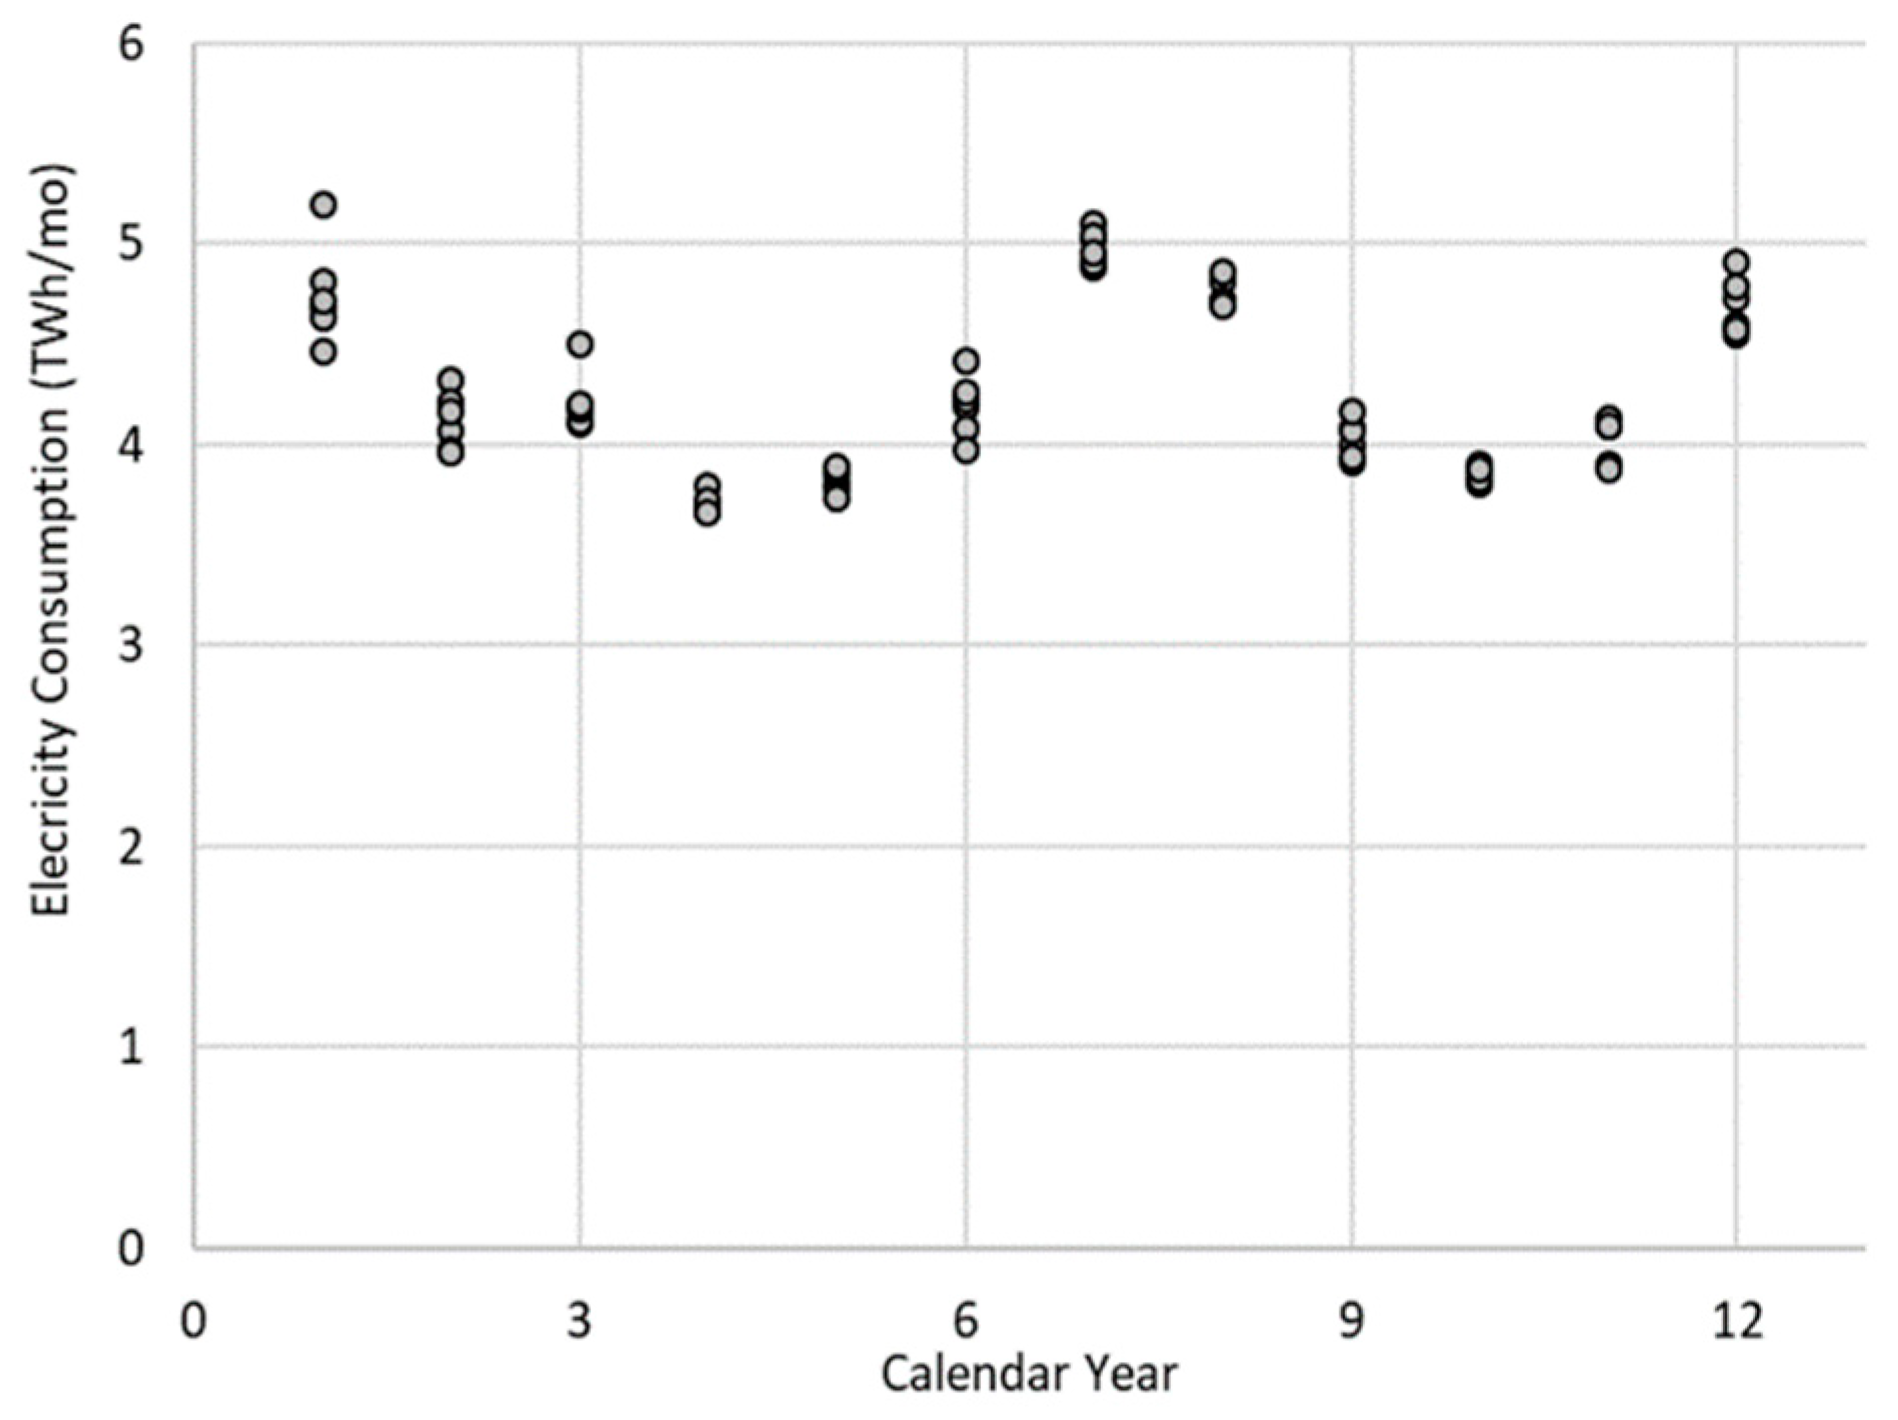
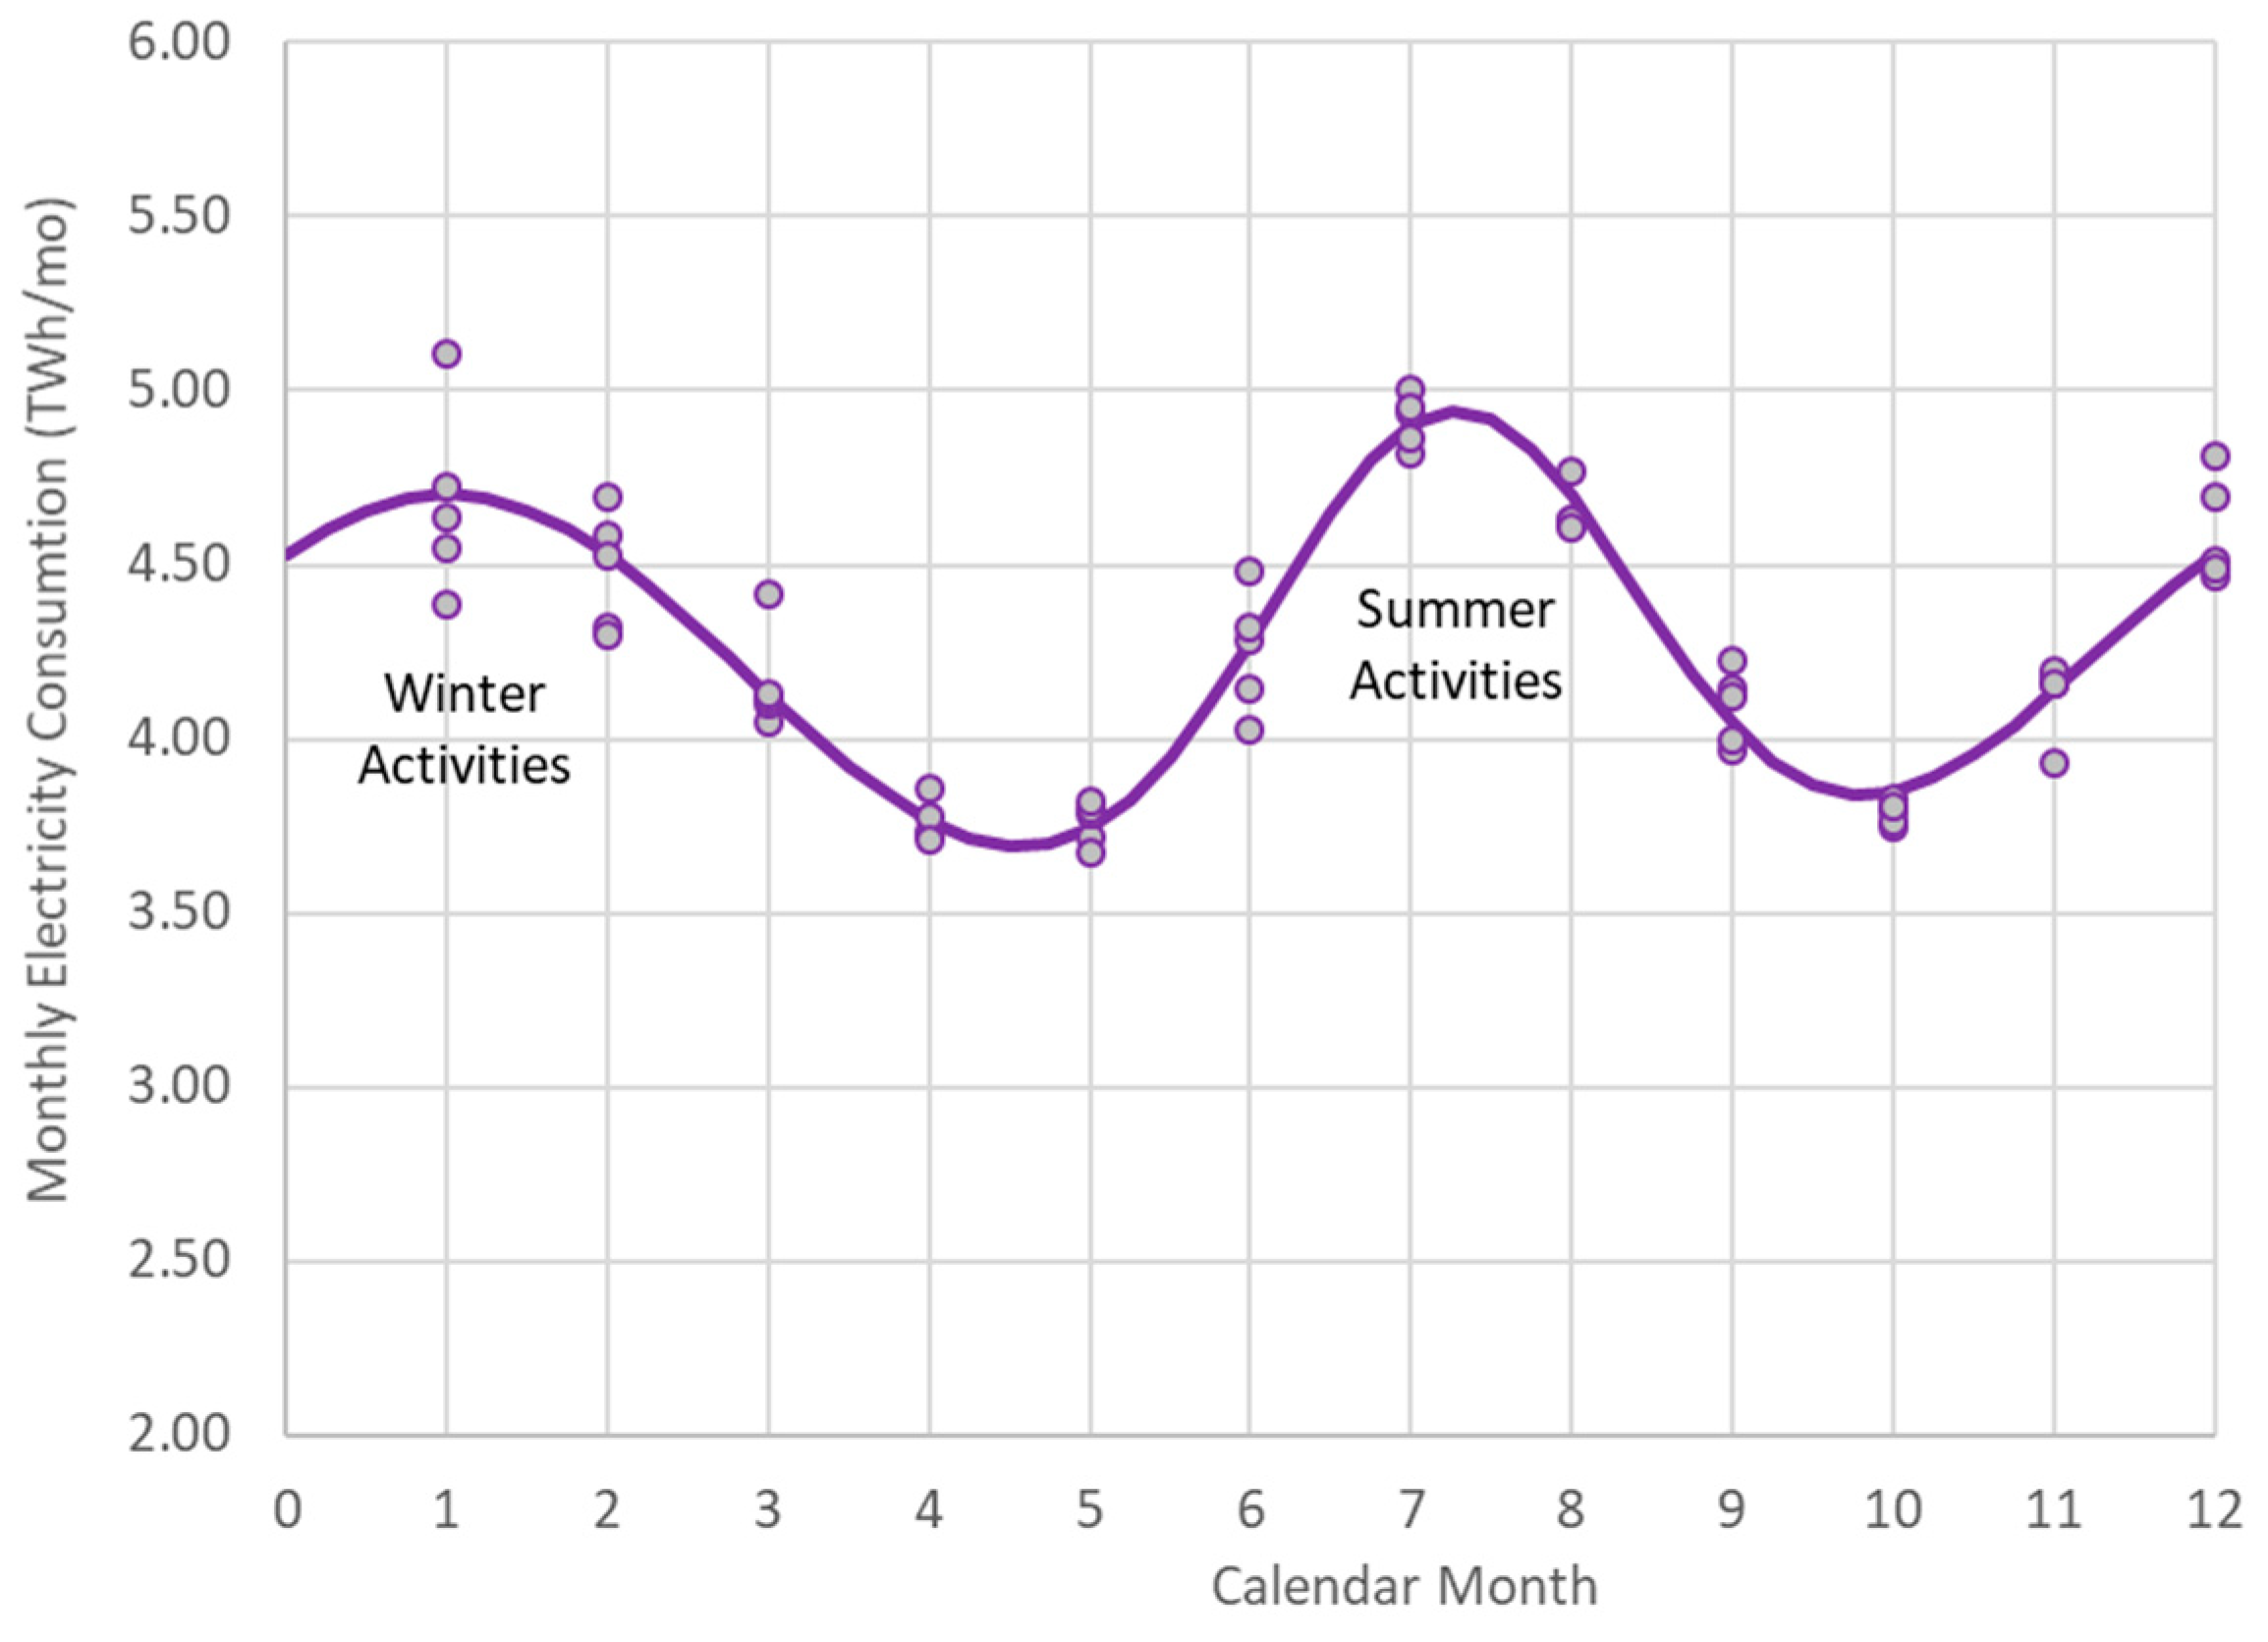
The electricity consumption appears as (a) a long-term evolution depending on the economic growth and (b) a seasonal variation depending on the weather and country activities profile.
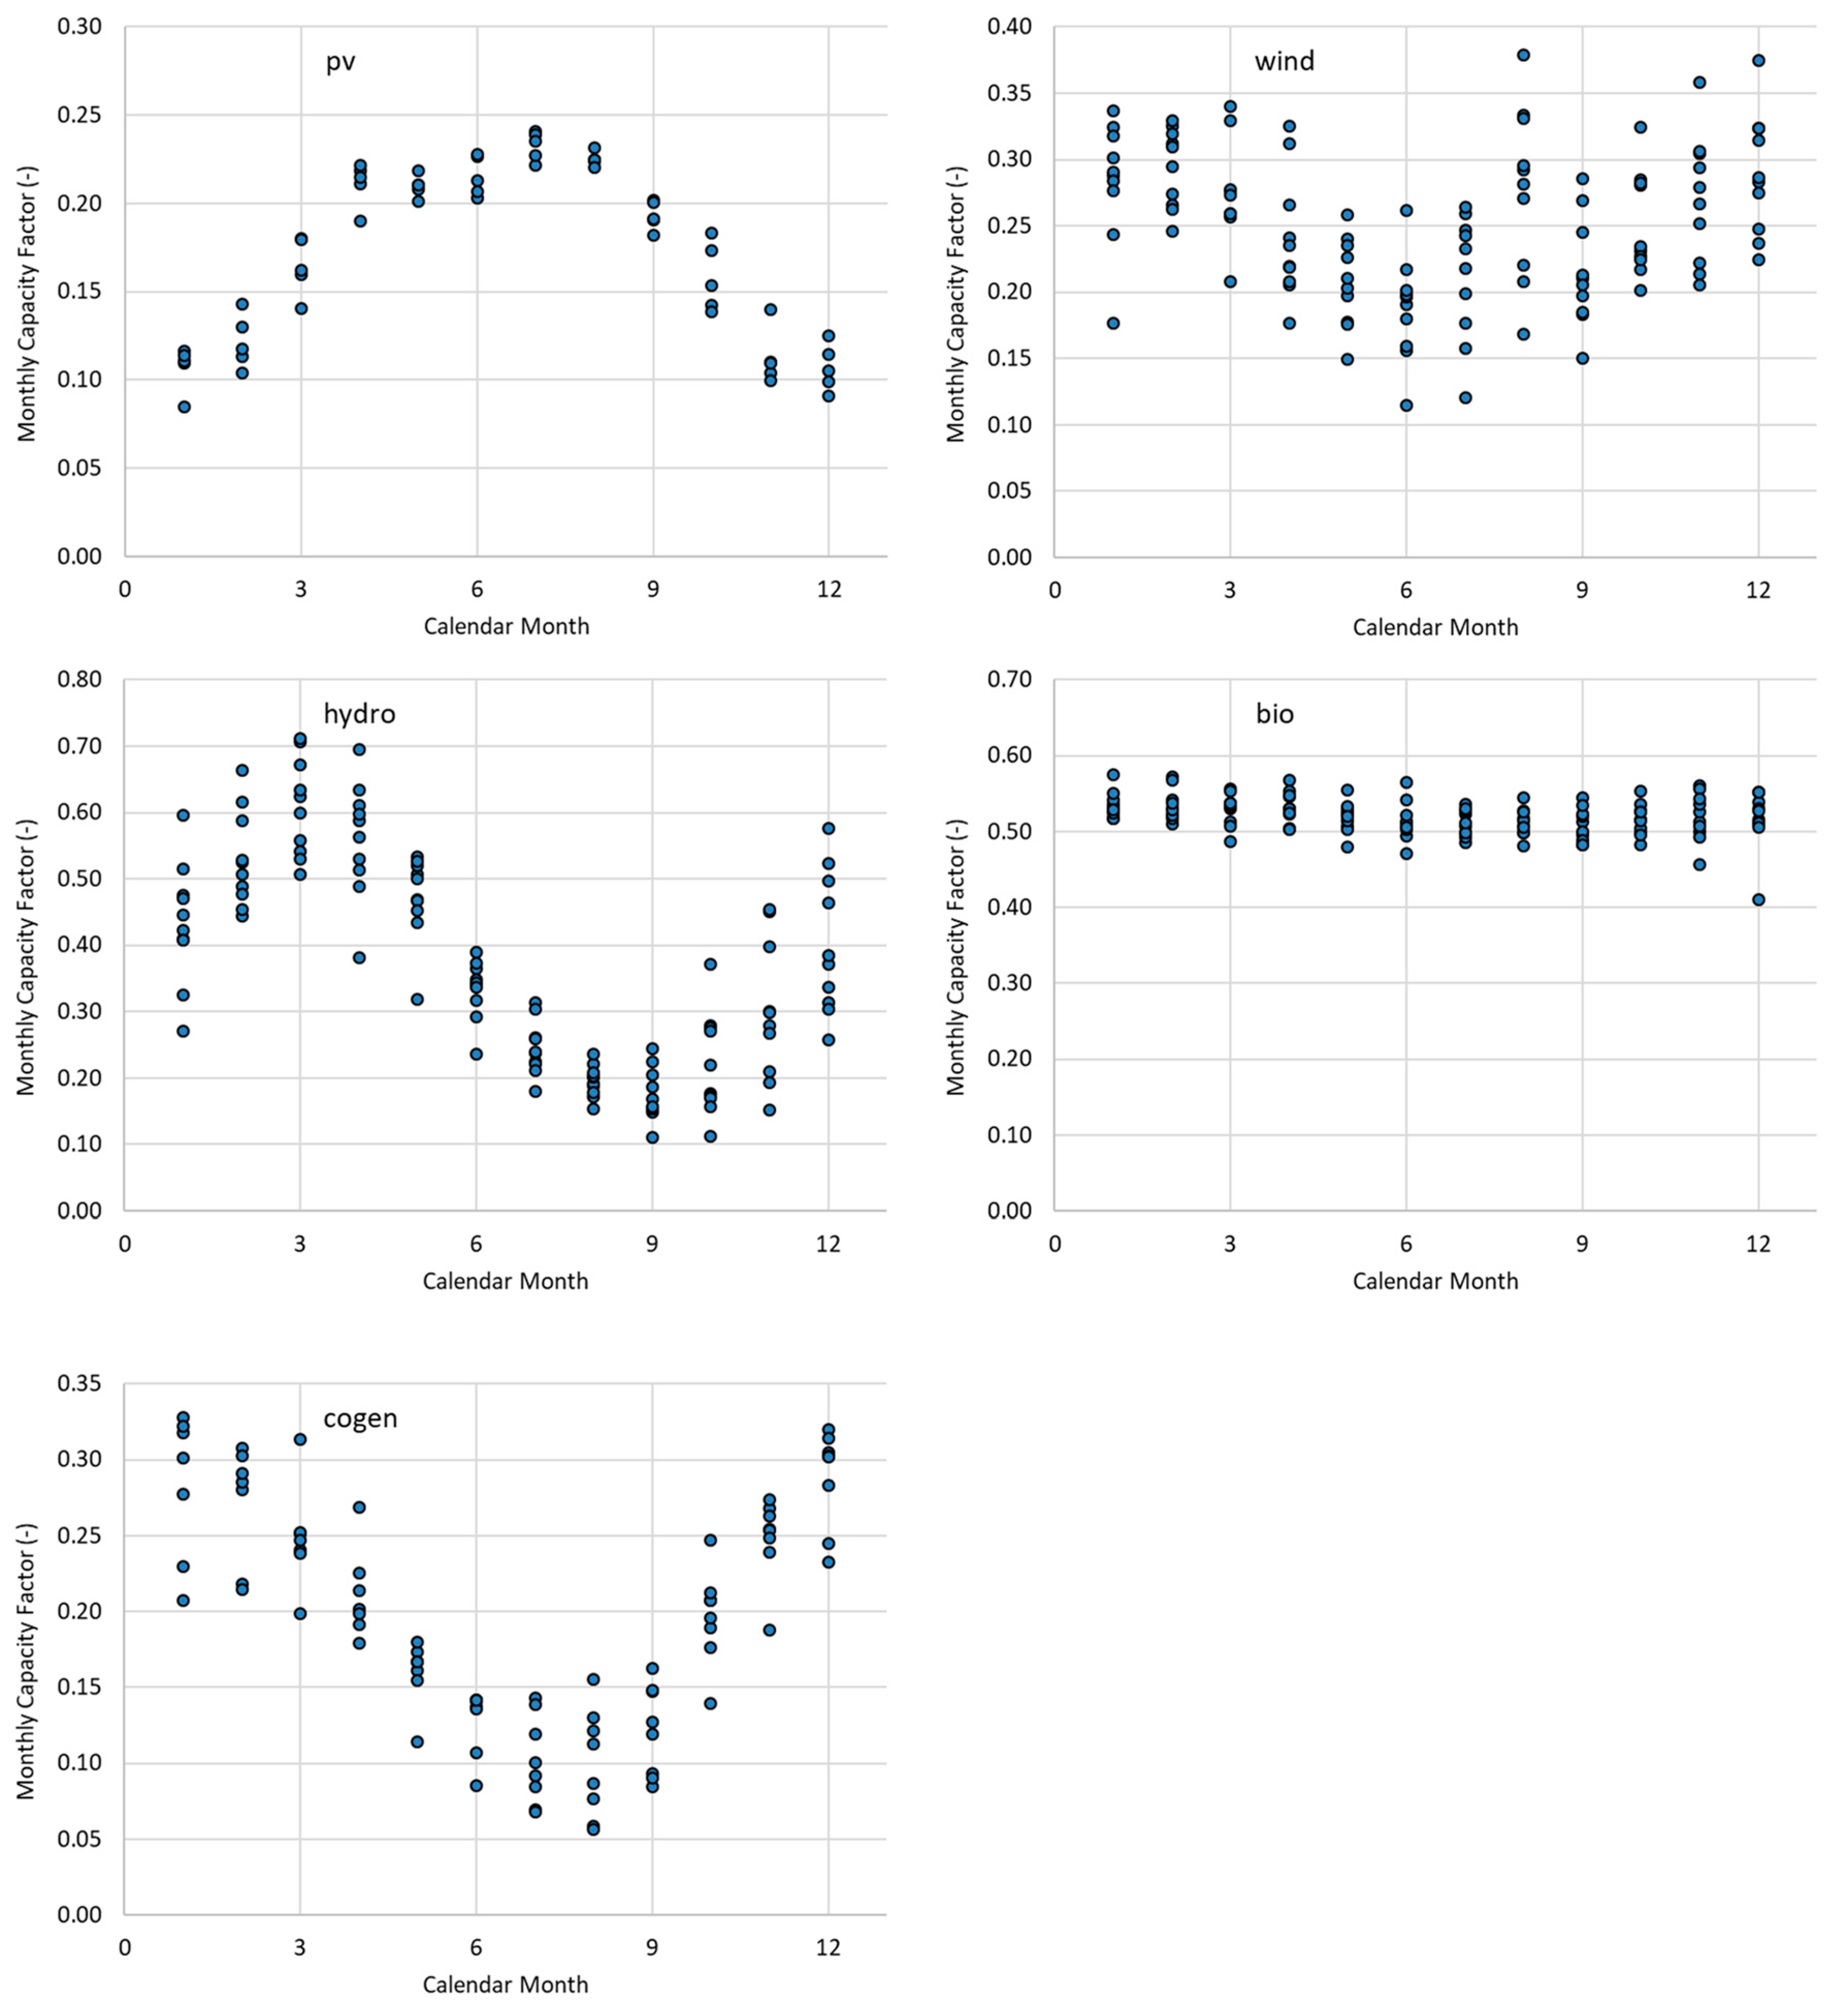
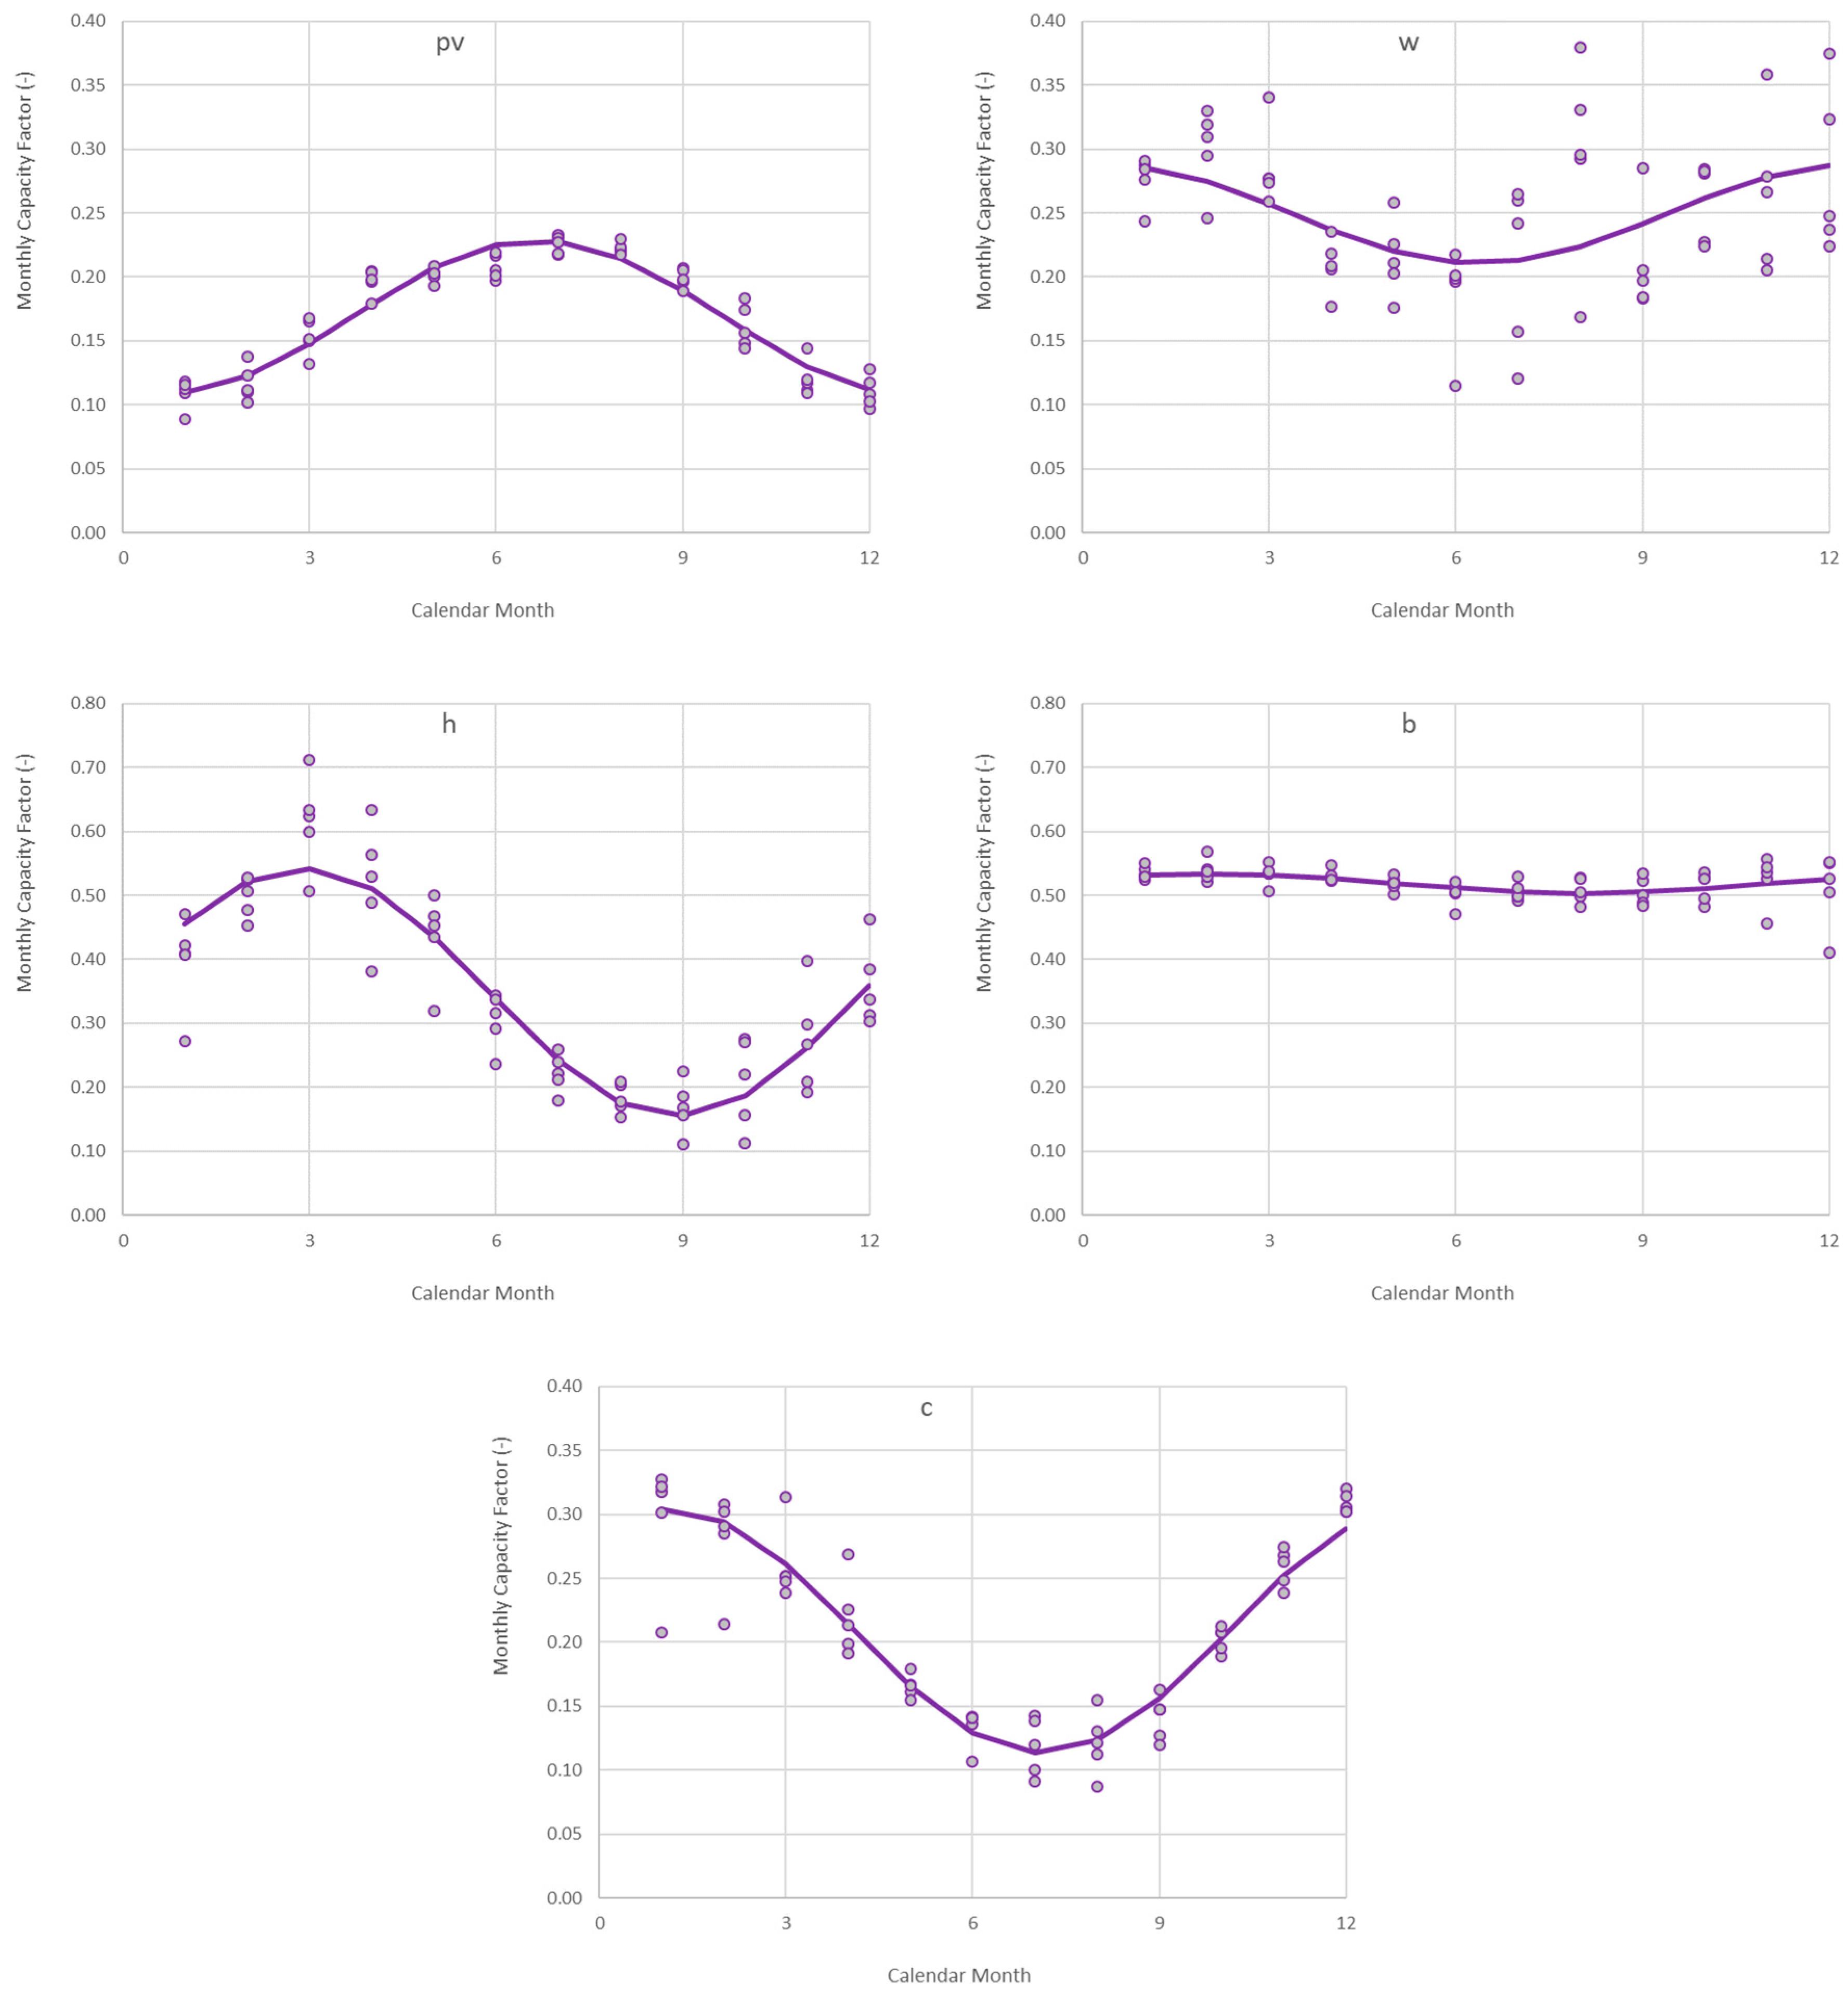
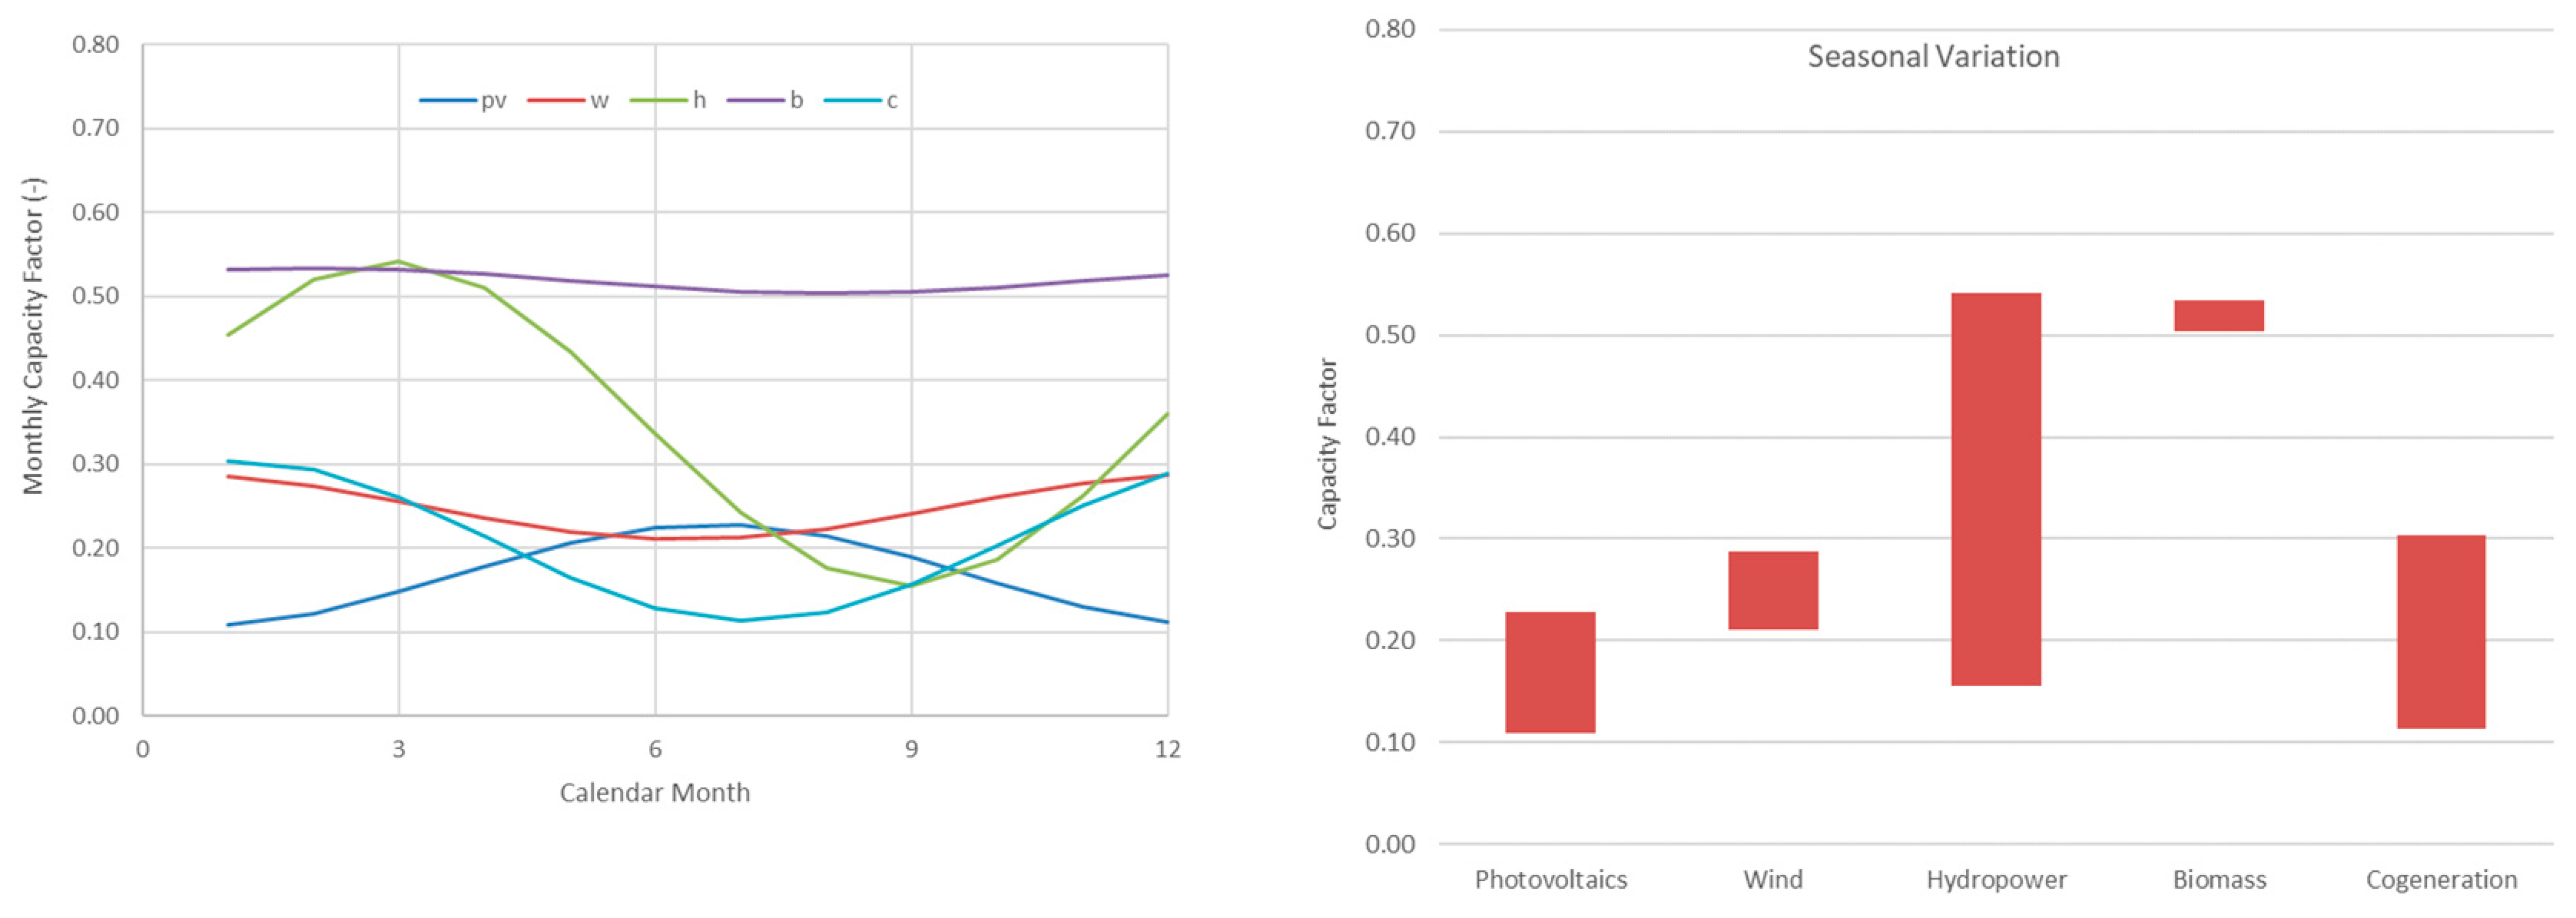
The capacity factor appears as a seasonal variation. It expresses the characteristics of the renewable technology and the weather conditions. Capacity factor remains as a long-term constant regardless of the evolution of the installed power. It could be proved by considering the 12-month moving average.
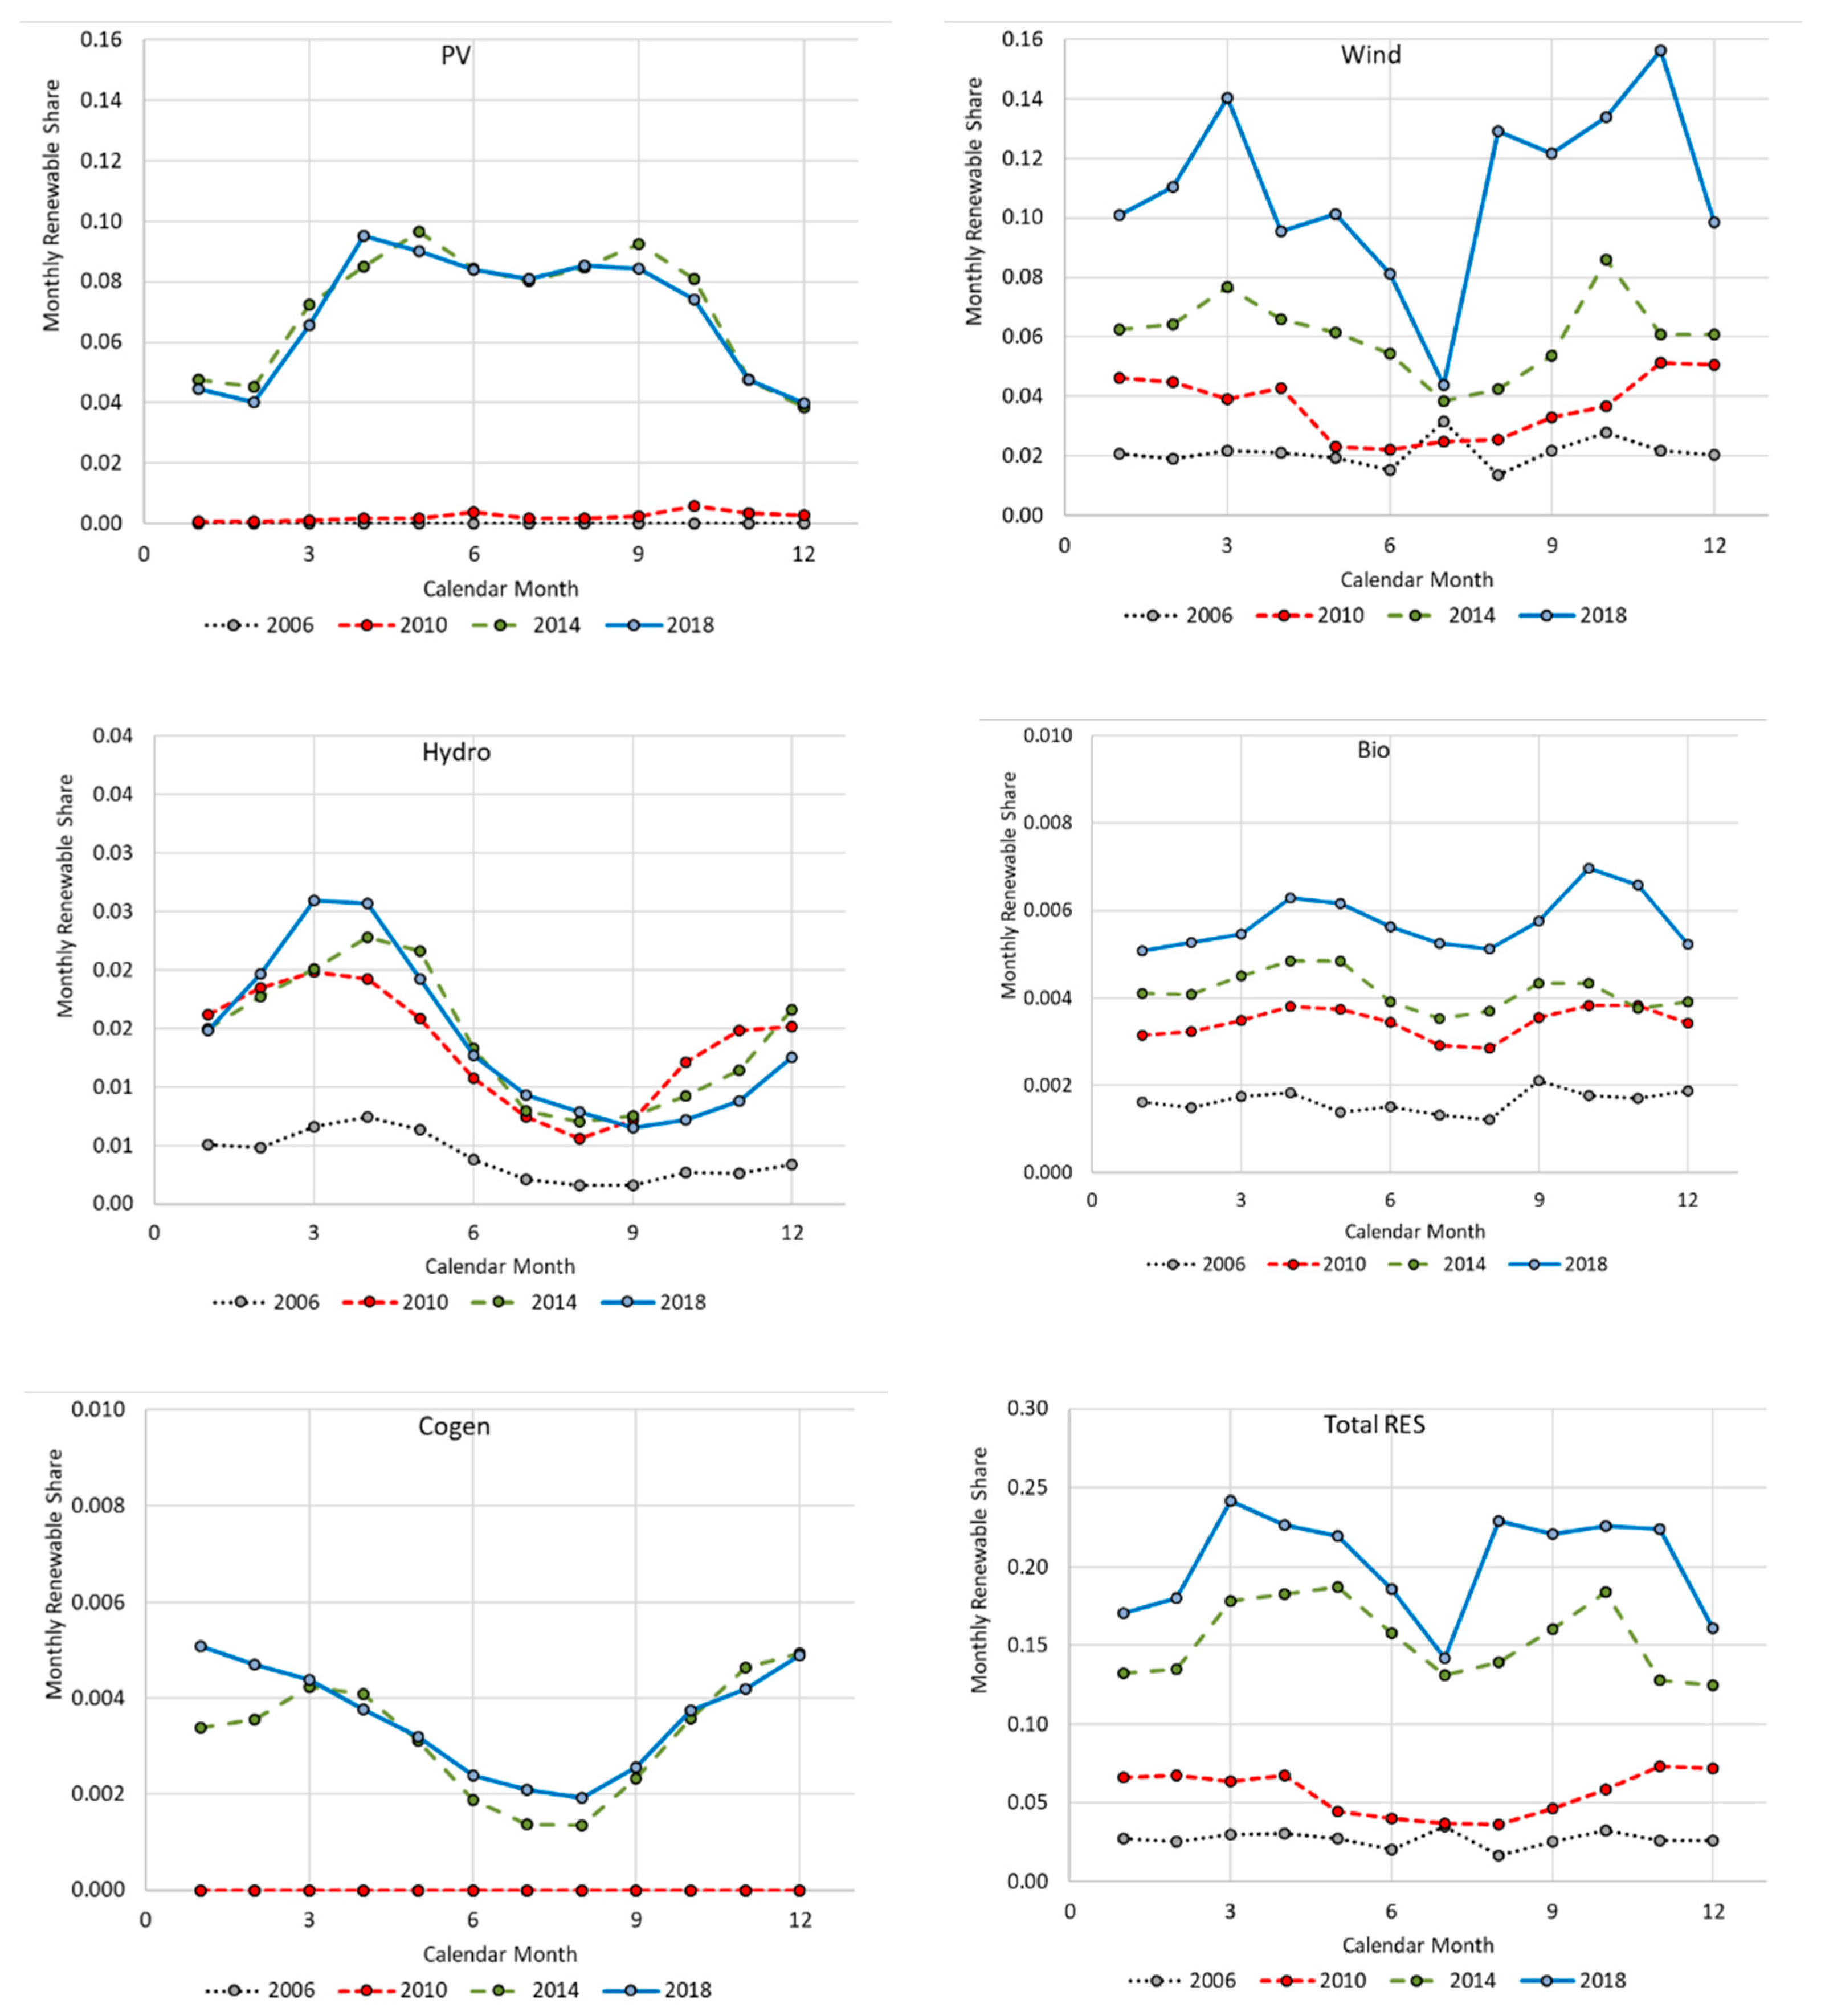
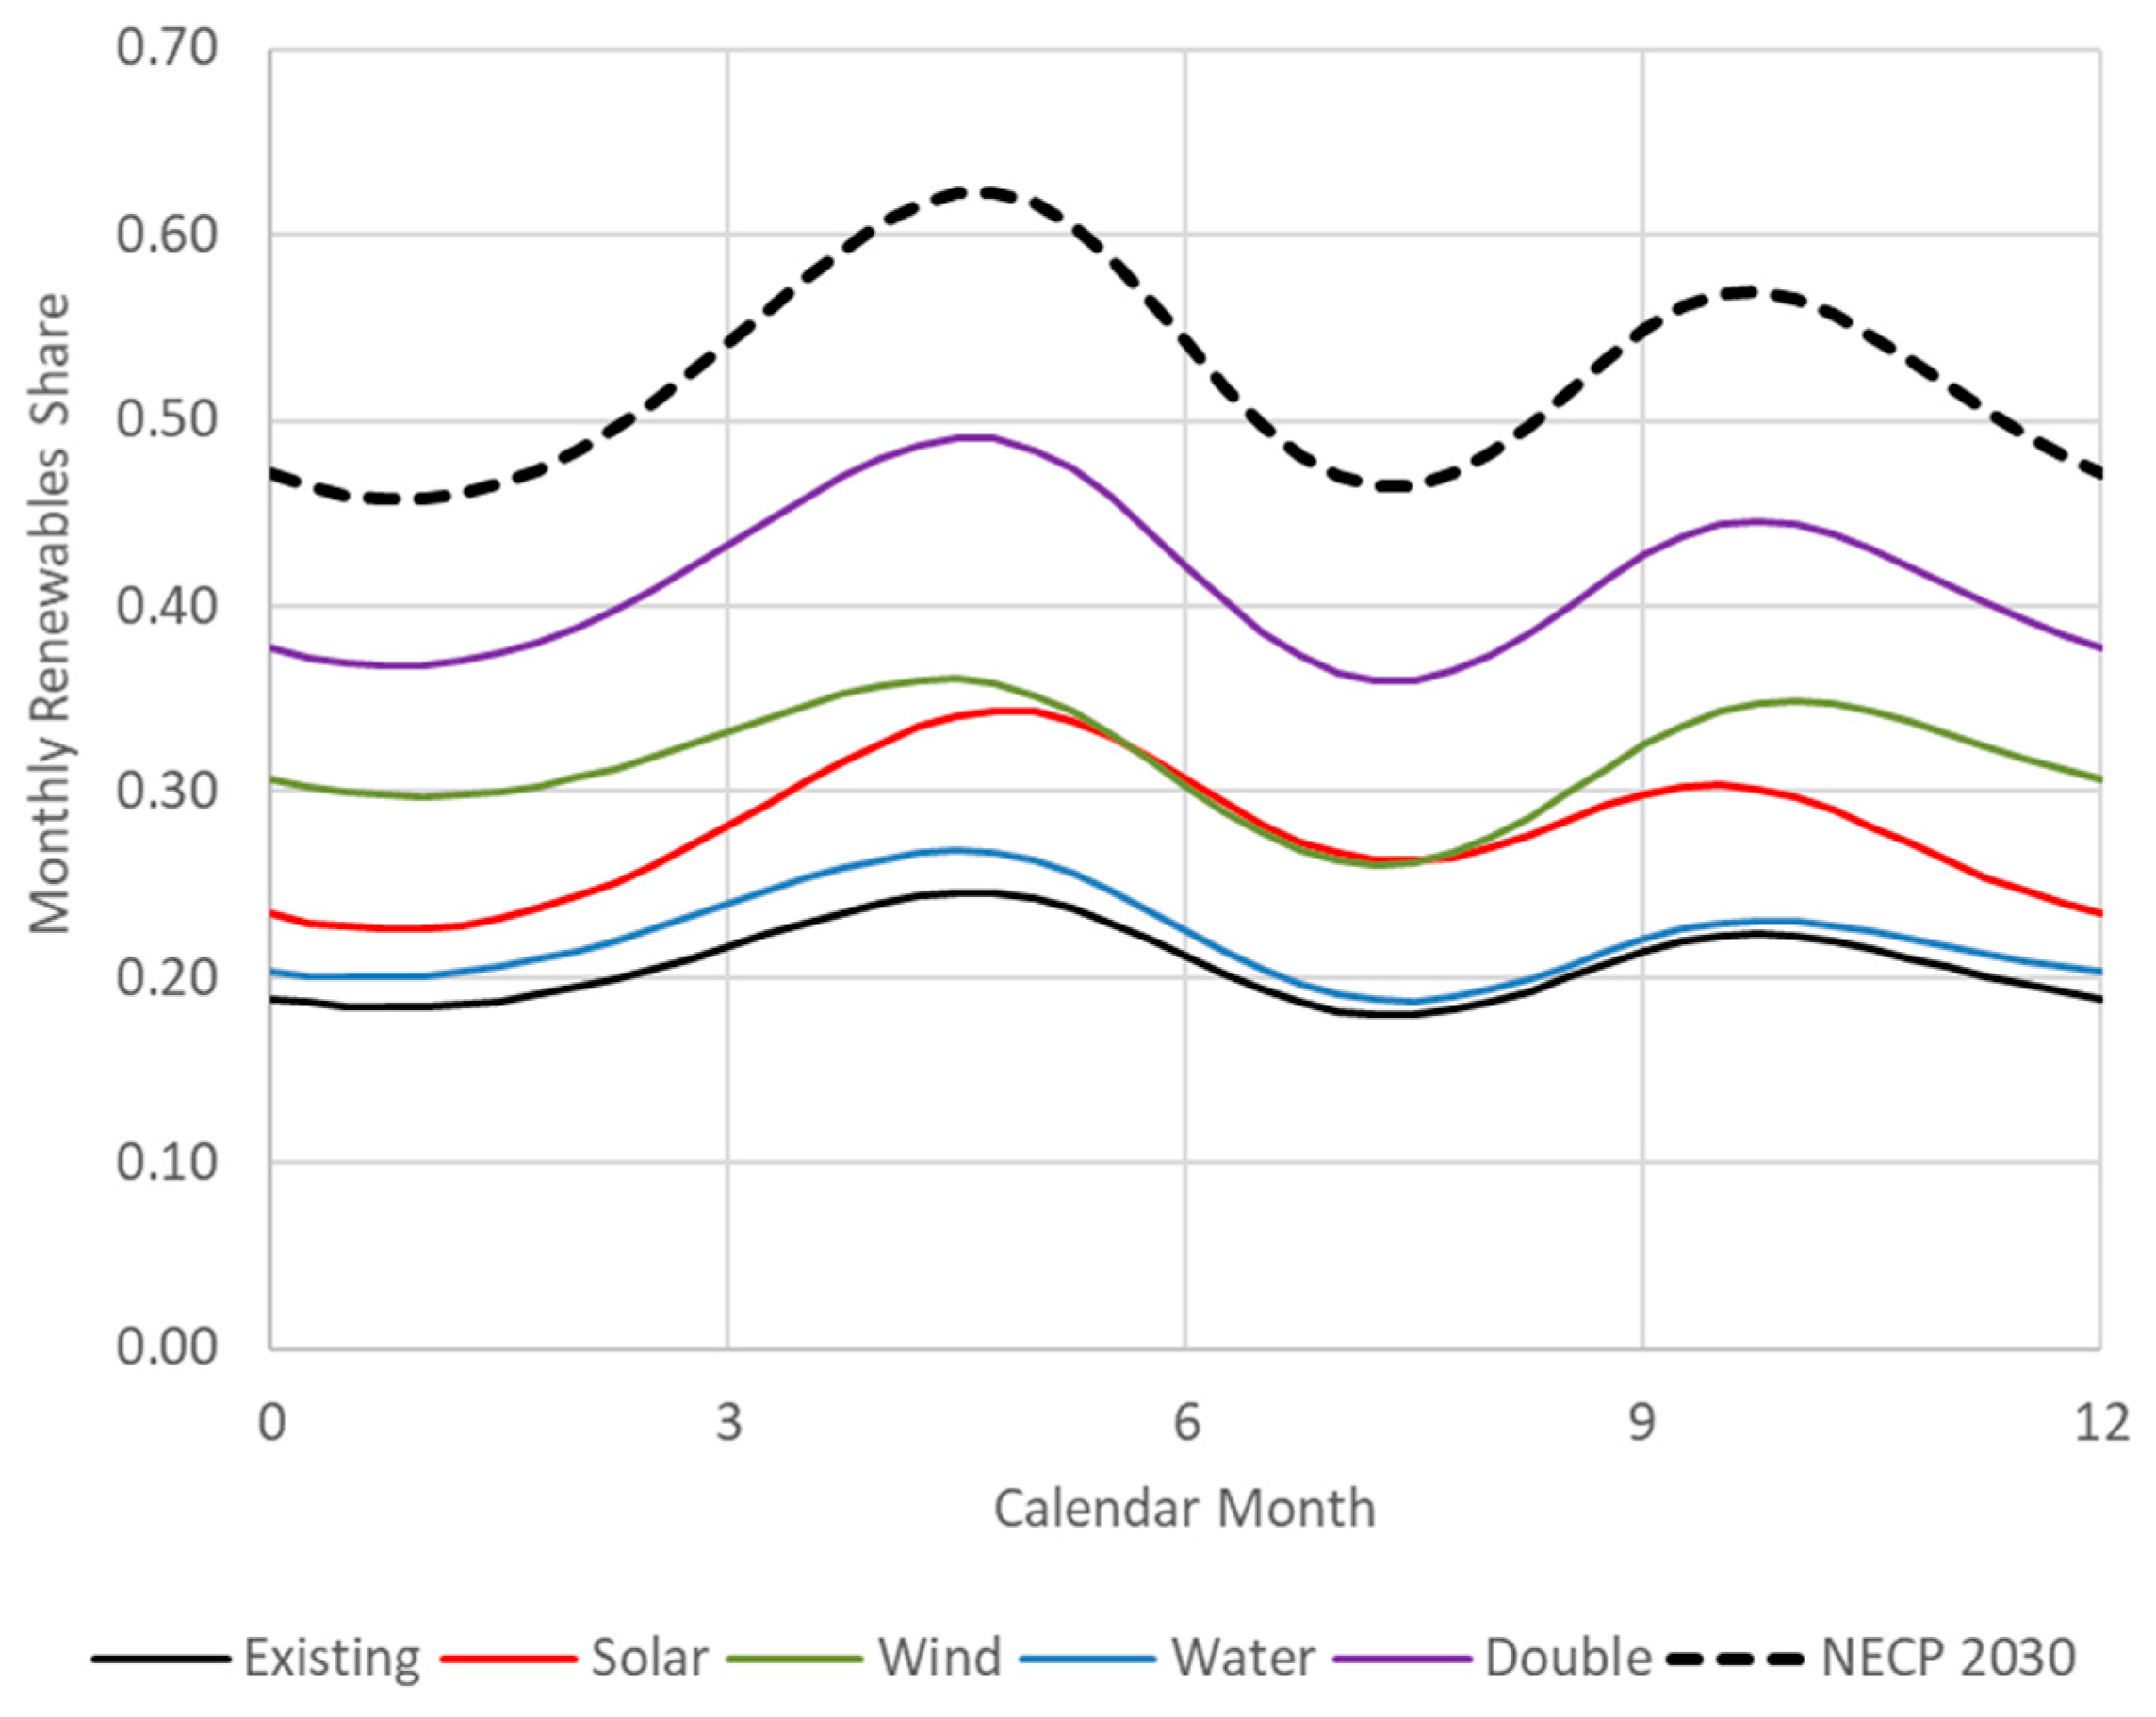
Instead, renewable share appears as both (a) a seasonal variation and (b) a long-term evolution. The seasonal variation follows the capacity factor variation while the long-term evolution follows the installed power evolution. Again, 12-month moving average insolates the seasonal variation and reveals the long-term evolution.
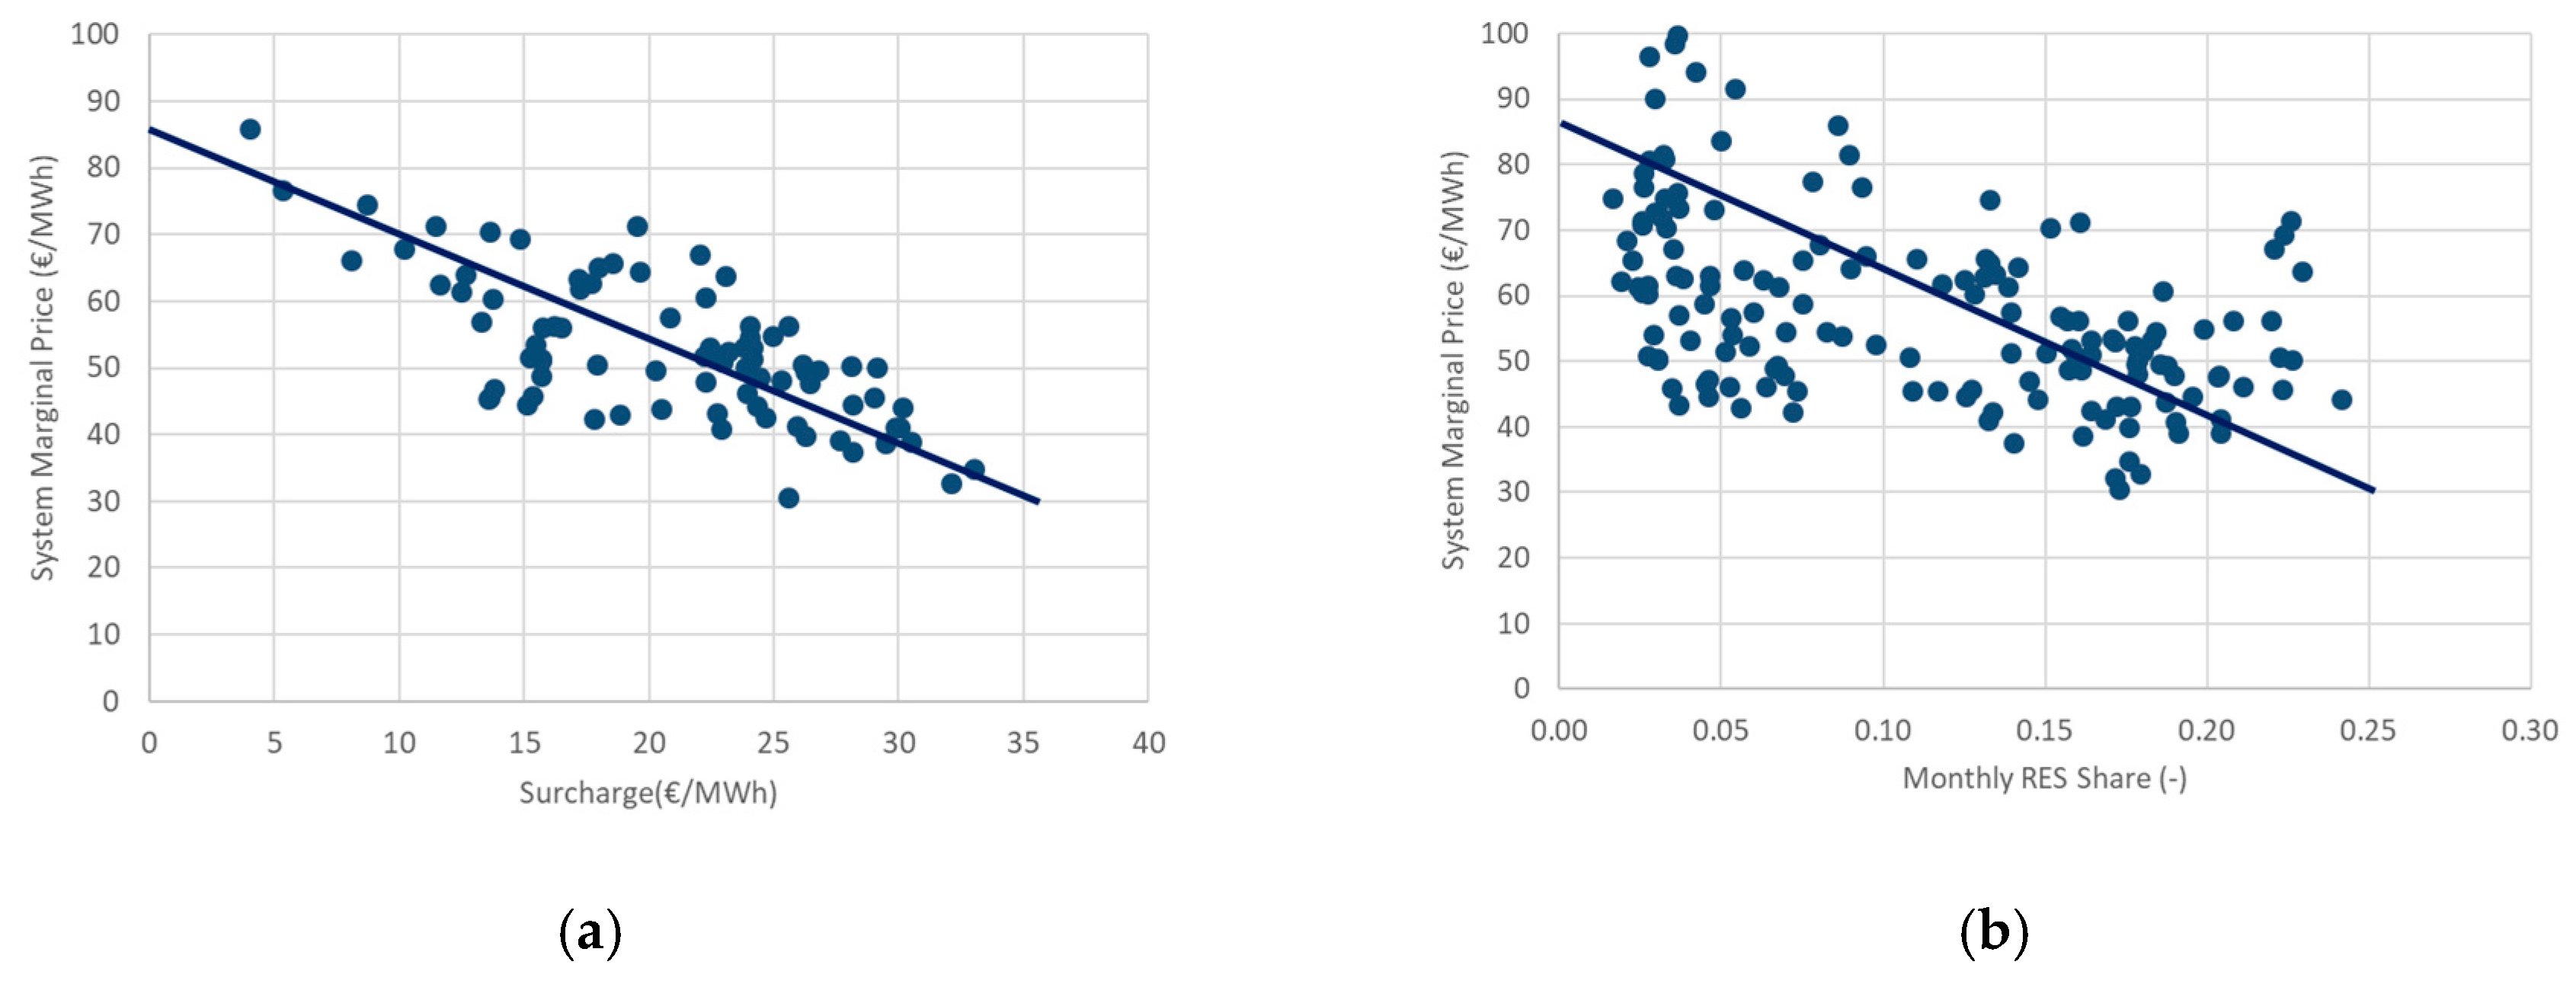
The renewable share expresses the degree of renewable penetration. Τhe penetration targets are usually based on the renewable share. Moreover, the renewable share is a crucial characteristic of the renewable penetration since its seasonal and hourly variation affects the merit order curves and, consequently, it influences the resulting system marginal price. The renewable share depends on the installed power, the capacity factor, and the electricity consumption.
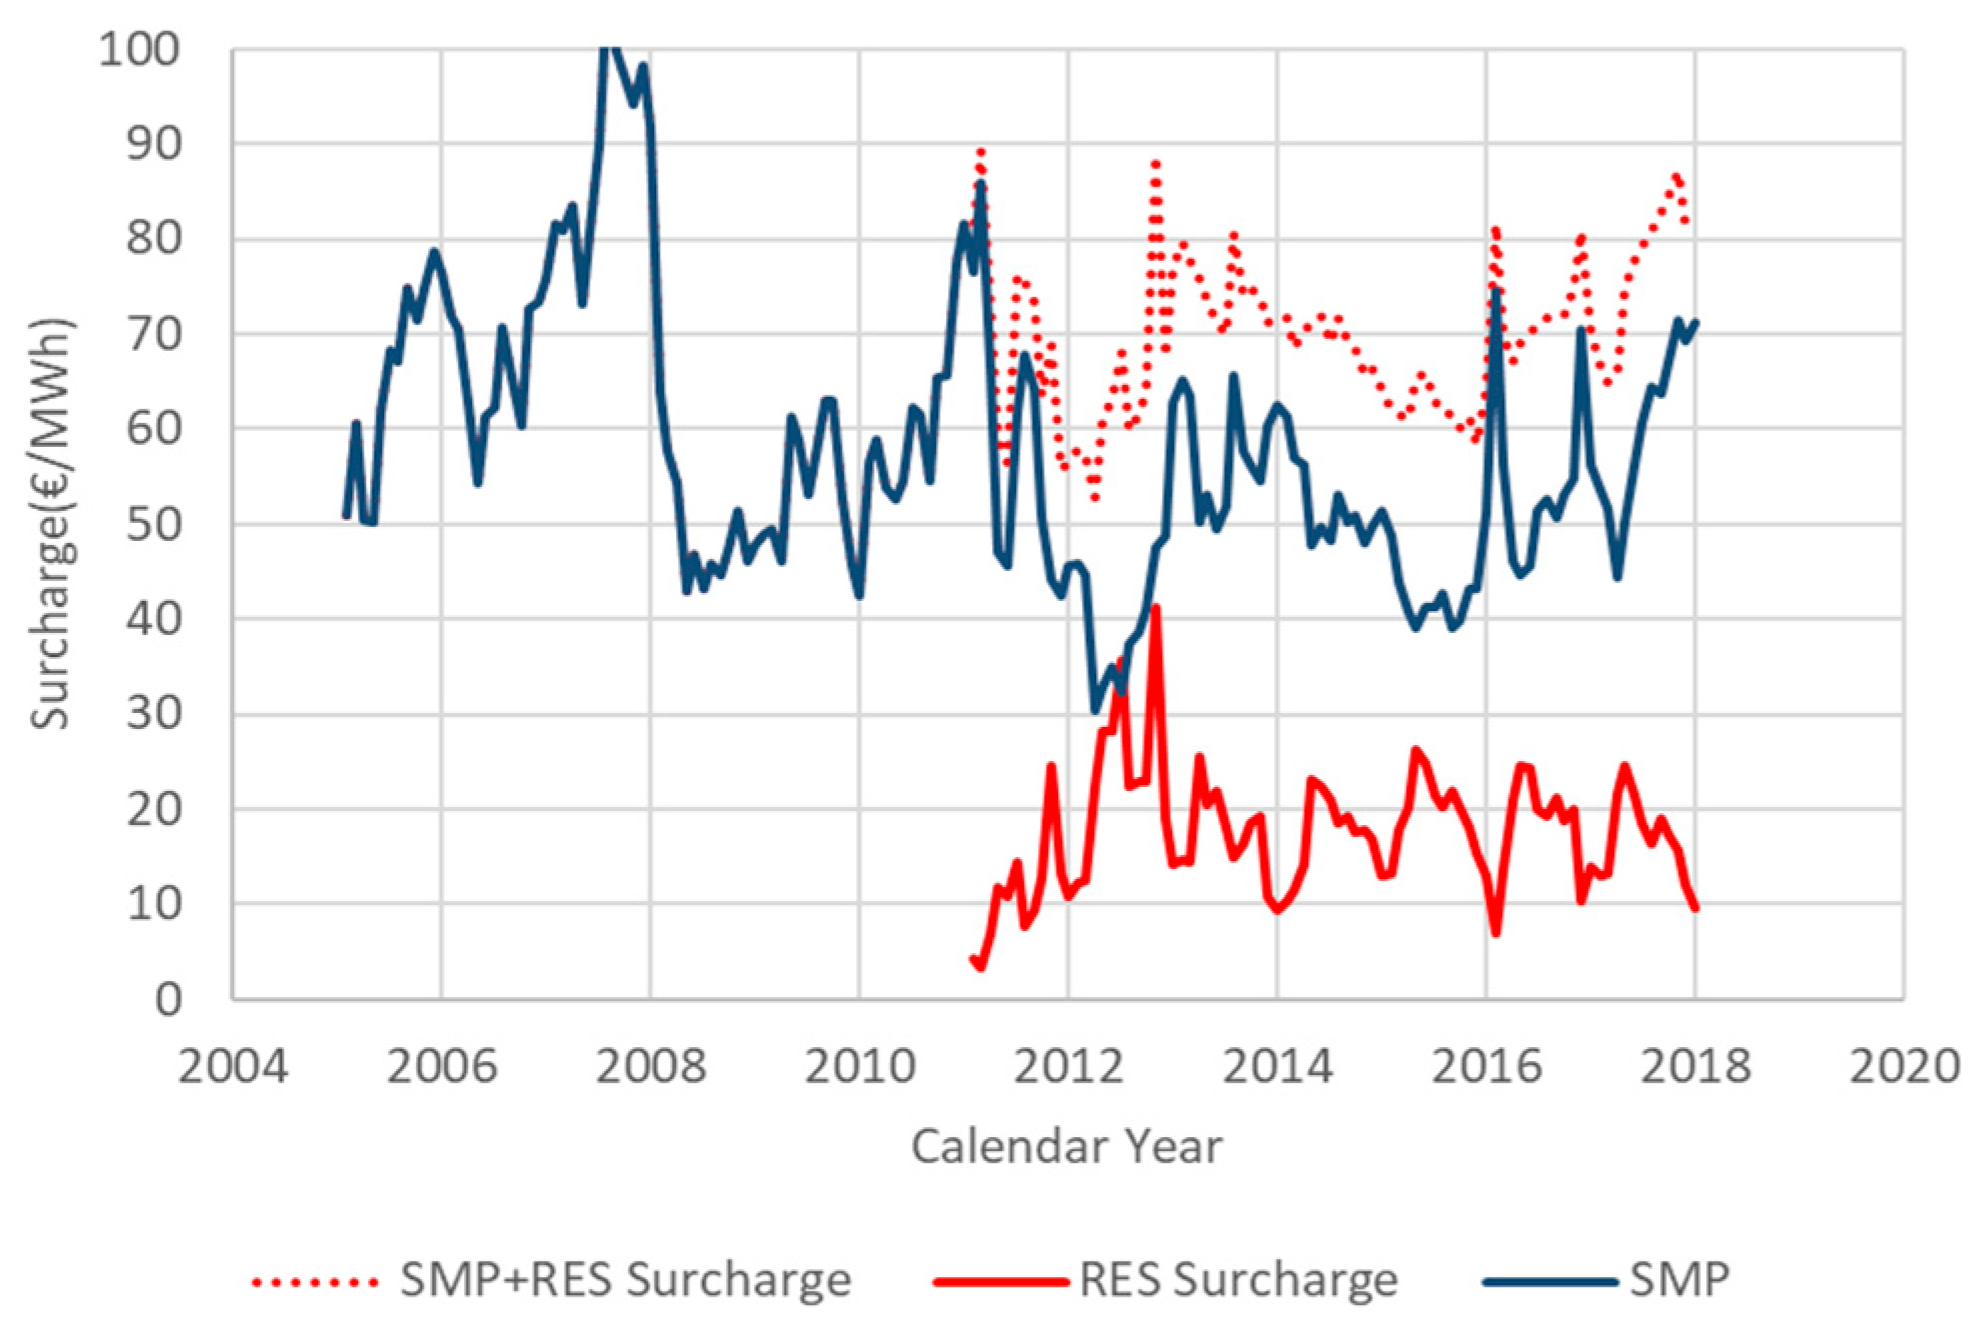
Typically, the cost of the feed-in tariffs incentives supporting penetration is the result of the difference between the prices of (a) the feed-in tariffs (FIT), at which the Hellenic electricity market operator (HEMO) buys electricity from the renewable producers and (b) the system marginal price (SMP), at which the HEMO sells electricity to suppliers. This total cost is divided by the electricity final domestic consumption, since losses or exports do not participate in support, to obtain the renewable surcharge on electricity price (RSC) due to the renewable supporting instruments.
R S C = ( F I T S M P ) · E D = ( F I T S M P ) · s
where RSC (€/MWh) is the renewable surcharge, FIT (€/MWh) is the feed-in tariff, SMP (€/MWh) is the system marginal price, E (MWh/year) is the renewable electricity production, and D (MWh/year) is the total electricity domestic consumption. Renewable surcharge may refer to a separate renewable technology, or to the total renewables.
It should be noted that RSC is an indicator of RES penetration cost, which is a different quantity from renewable levy (ETMEAR, in Greek terms) and is regulated by the regulatory authority for energy (RAE) and applied in consumers’ electricity bills.

3.2. Modelling

A penetration model should be able to forecast long-term evolution and seasonal variation of the penetration. Long-term evolution depends on the legislative framework as analyzed in Section 2 above, and it is very difficult to forecast since laws are changed versus time. Thus, various scenarios should be supposed and used for long-term forecasting. Instead, seasonal variation can be extracted and modelled from historical data.
Concerning the capacity factor, a cosine equation is the simplest function describing the seasonal variation:
c = c a v Δ c · cos ( 2 π t t o 12 )
where c (-) is the capacity factor, t (months) is the time, c a v (-) is the annual average capacity factor, Δ c (-) is the seasonal variation (half range of annual variation of the capacity factor), and t o (months) is the time at minimum capacity factor.
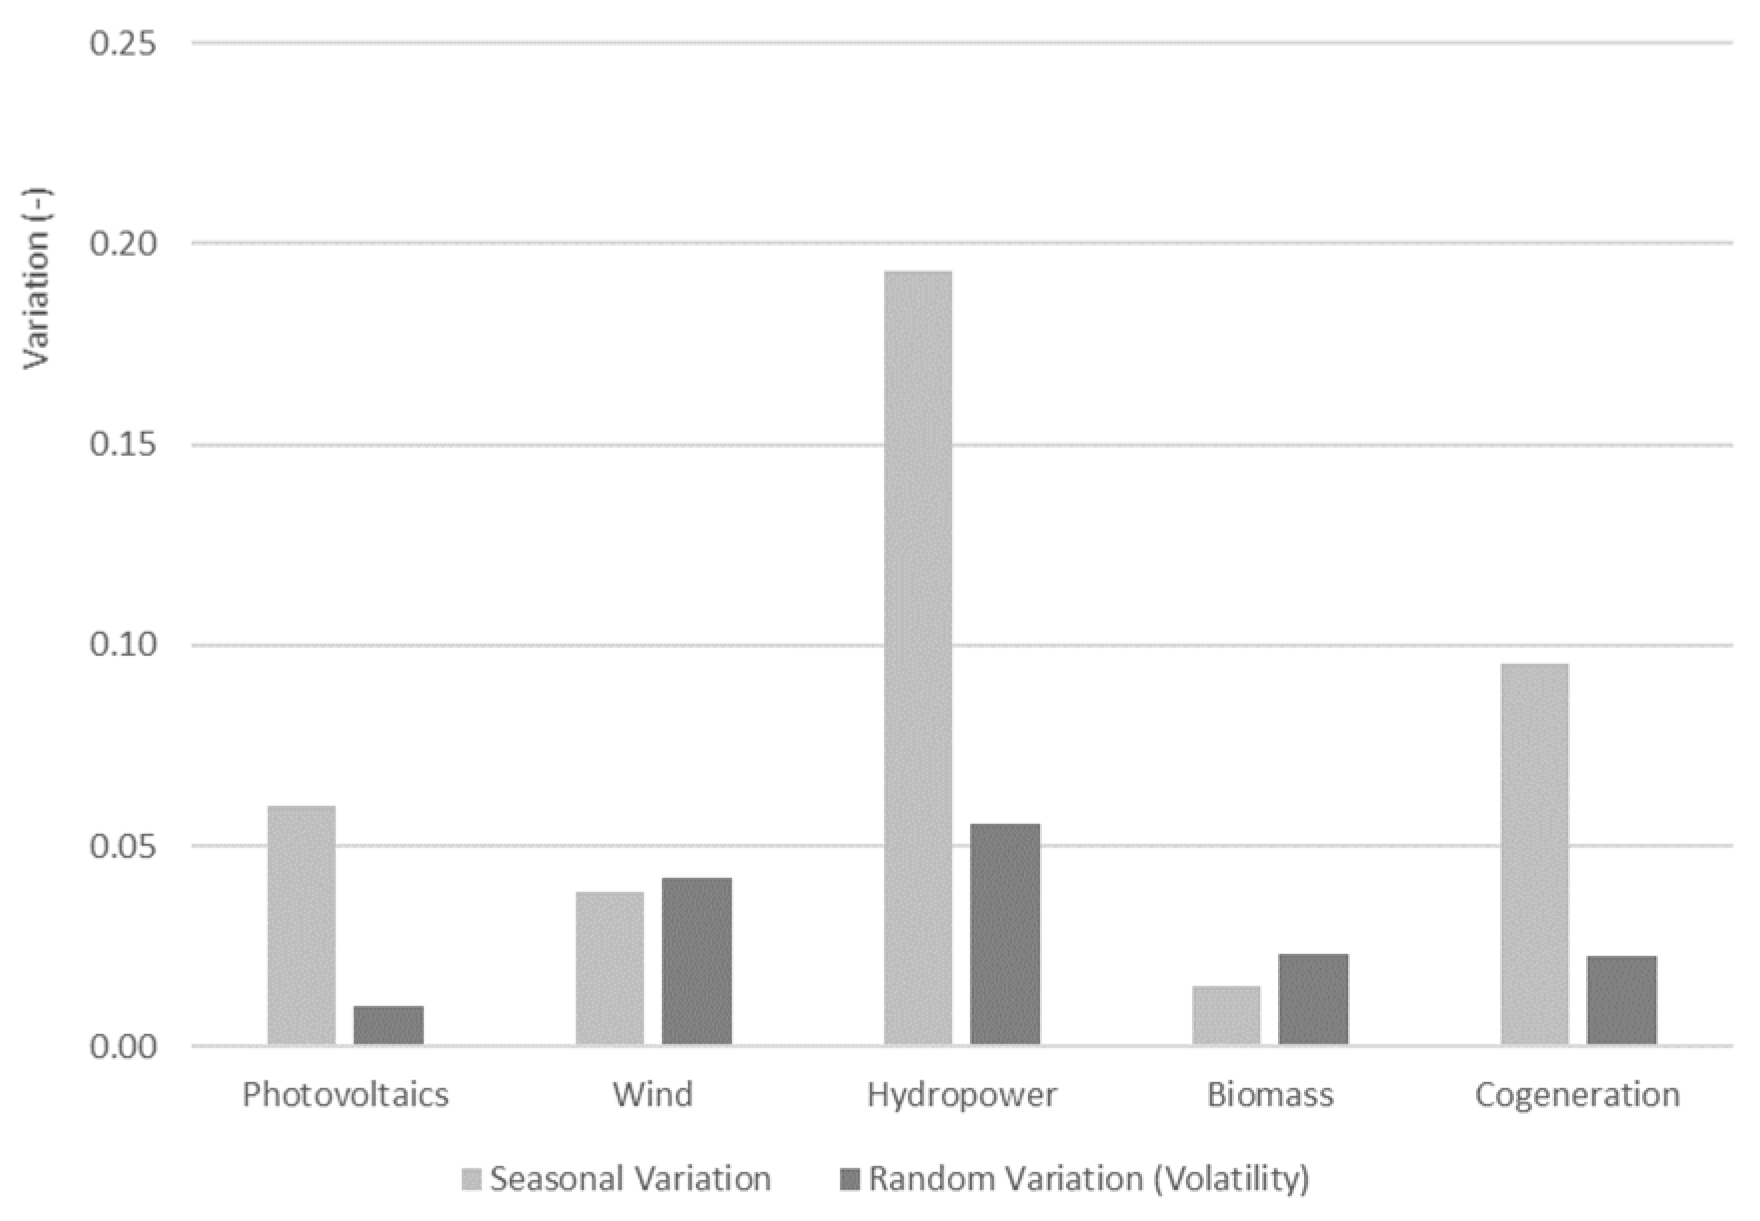
The seasonal variation Δ c and the corresponding relative seasonal variation Δ c / c a v is a crucial characteristic of each different RES. The seasonal variation is different from the random variation (volatility) of the RES. The seasonal variation is predictable while the random variation is statistical.
The random standard variation σ for each RES technology is calculated by the following equations:
σ = j 12 σ j 2 12
σ j = i n ( c i j μ j ) 2 n
μ j = i n c i j n
where σ (-) is the random standard variation, c i j (-) is the capacity factor of the calendar month j (j = 1, 2, …, 12) of the year i (I = 1, 2, …, n), σ j (-) is the standard variation of the calendar month j, and μ j the mean value of the calendar month j.
Concerning the share of renewables, the following equation can be used:
s = E D = P · c · t D
It should be emphasized that P only appears in long-term evolution, c appears only seasonal variation, and both s and D appear both long-term and seasonal variation.
The seasonal variation of the electricity consumption cannot be described by a cosine function since it appears as two peaks, one during winter and one during the summer. Thus, it is proposed to use three additive kinds of consumptions with different variation each: (a) A constant consumption independently of the season, (b) a winter activities consumption, and (c) a summer activities consumption. A normal distribution is proposed to describe both the winter and summer activities with different characteristics. Thus, the proposed model can be described by the equation:
D = D T ( 1 d w d s ) 12 + d w D T · N ( t w o , Δ t w , t ) + d s D T · N ( t s o , Δ t s , t )
where t (months) is the time, D (TWh/month) is the electricity consumption at time t (months), D T (TWh/year) is the total electricity demand during the year, d w (-) is the portion of the total consumption for winter activities, d s (-) is the portion of the total consumption for summer activities, t w o (months) is the time of the peak of winter activities, Δ t w (months) is the typical duration of the winter activities, t s o (months) is the time of the peak of summer activities, and Δ t s (months) is the typical duration of the summer activities.
The normal distribution is expressed by the equation:
N ( μ , σ , t ) = 1 2 π σ 2 e x p ( ( t μ ) 2 2 σ 2 ) .

3.3. Data

The following monthly data for 12 years, 2007–2018, are retrieved from the Hellenic electricity market operator [22,23]. The data refer to photovoltaic parks, wind parks, small hydropower plants, biomass-driven plants, and cogeneration systems.
  • Installed power (P);
  • Injected electrical energy (E);
  • Average feed-In tariffs remuneration for every renewable energy source (FIT);
  • System marginal price (SMP);
  • Total electricity consumption (D).

4. Results and Discussion

4.1. Renewables Penetration

Figure 1 presents the evolution of the renewable installed power for 12 years up to 2018 along with the crucial laws supporting their penetration. Figure 1a presents all renewables, photovoltaics, wind, small hydropower, biomass, and cogeneration, while Figure 1b focuses on low penetration of small hydropower, biomass, and cogeneration. Wind electricity follows an almost linear growth independently on the legislation framework. Instead, photovoltaic penetration appears in a step increment during the years 2012 and 2013, remaining constant for the following years. Hydropower follows linear growth with different rates before and after the year 2010. Both biomass and cogeneration appear to have negligible penetration.
Figure 2 presents the evolution of the corresponding renewable electricity produced. It follows the long-term evolution of the installed power with an additional seasonal variation depending on the type of renewable technology.
For comparison, the total electricity consumption is presented in Figure 3, along with the 12-month moving average to eliminate seasonal variation. It is concluded that the long-term electricity consumption in Greece during the debt crisis remains rather constant.
Based on Figure 2 and Figure 3, Figure 4 further presents the penetration shares of renewables. The main conclusion is that each RES technology has its own growth path that obviously depends upon several factors. In an effort to describe and comment on these factors, it is not only a matter of profitability. The security (predictability) of supply of the primary source of energy, the general stance of local communities against each specific RES technology, the ease of licensing framework and procedures, the need to use public land for the investment instead of private, the proximity, ease and relative cost of getting access to the grid, and finally, the typical magnitude of each RES investment, play significant roles for their development profile. Undoubtably, sun and wind in Greece provide the best prospects of abundance as primary sources of renewable energy. Sun, however, is more easily predictable and this is reflected in PV electricity as will be shown later in this paper. This feeling of easier predictability combined with smaller typical plant investments and rapidly declining installation costs, make PVs attractive to broader investor profiles and groups. Presuming that national targets and system needs offer space for PV growth, this is reflected in their, at times, massive penetration increase. On the other hand, water resources for small hydroelectric plants, namely small rivers that are potentially suitable for electricity generation, are limited in the country. Furthermore, small hydro traditionally face skepticism from local communities that feel as though they are losing a natural resource along the kilometers of the conduit that drains water to the electricity generation plant. Licensing procedures are long and extensive for such kind of investments, and public consultation with local communities is crucial. Finally, biomass and biogas investments depend upon raw materials that moreover should be available near the plant in order to reduce costs and preserve profitability. Between these two, we feel biogas plants offer more potential for future development due to the increasing need to exempt livestock units from organic waste.

4.2. The Cost of Renewables Penetration

As described previously in Section 2, the feed-in tariff tool was selected as the main support scheme for triggering renewable penetration increase in Greece since 2006. Feed-in tariffs (FITs) for new plants change versus time according to the laws applied.
Since feed-in tariffs are greater than the system marginal price (SMP), there is typically an additional cost in overall electricity market. In order to quantify and compare this burden, the additional RES cost is divided by the overall electricity consumption (Equation (3)). This surcharge is expressed in € per MWh, as is presented in Figure 5, and is also compared with the system marginal price (SMP). The total cost of electricity, that is, the system marginal price plus the RES surcharge, is also presented.
It must be noted, however, that increased RES penetration decreases SMP as shown in Figure 6. So, the difference between FIT and SMP is not the true additional cost for RES penetration, since if RES were not present, SMP would be higher. This is the reason why the difference between FIT and SMP was called “typical” additional cost due to RES.
As shown in Figure 6a when RES surcharge is increased, the system marginal cost is decreased. This phenomenon is the consequence of the merit order curve in the day-ahead electricity market, which calculates the system marginal price. This merit order effect will be discussed in a future paper by analyzing hourly data from the day-ahead electricity market but still, based on present monthly data, the above relationship can be discovered. Thus, Figure 6a reveals the relationship between RES surcharge and system marginal price, or equivalently in Figure 6b, the relationship between the RES penetration share and the system marginal price. The population of points in Figure 6a,b is different, due to the fact that the market operator began publishing the weighted average FIT of the renewables per month only after January 2012. On the contrary, RES production on a monthly basis is reported since almost the beginning.

4.3. The Seasonal Variation of Renewables

Figure 7 presents the capacity factor versus the month of the year for 12 years separately for each technology. The results are valuable:
Photovoltaic capacity factor follows the seasonal variation of solar radiation from the minimum, about 10%, in December–January to the maximum 25% in June–August. Wind energy also appears to be a severe seasonal effect from 15% in August to 30% in January. These results refer to mainland parks, which are connected to the national grid, excluding non-interconnected islands. Hydropower follows a significant seasonal variation from a minimum of 20% in September to a maximum of 60% in March following the rainfalls and snow melting process. Cogeneration also appears to have a significant seasonal variation from a minimum of 10% in July to a maximum of 30% in January. Cogeneration is not affected directly from the weather conditions but from the demand of thermal loads (water heating or/and space heating). Instead, biomass operates with the largest capacity factor more than 50% with negligible seasonal variation.
It must be noted that there is not any long-term variation since the evolution of penetration does not affect capacity factors. The variation that appears in Figure 7 is statistical due to weather conditions that differ among years.
Figure 8 presents the seasonal variation of the electricity consumption. Again, long-term variation is not observed since, due to Greek crisis, the energy demand remains constant (see also the 12-month moving average in Figure 3).
Figure 9 presents the real data for renewable shares for four years (2006, 2010, 2014, 2018) separately for each technology and the total RES. The long-term evolution along with the seasonal variation is concluded. The resulting total RES curve depends on the technology mixture.
A general conclusion that can be extracted comparing monthly electricity consumption of Figure 8 with renewable share penetrations of Figure 9 is that demand during summer months is statistically always the highest. This peak summer demand is mainly supported by PVs, since their share is the highest compared to the rest RES technologies and also preserved at these high levels during all these summer months. Furthermore, PV contribution among years with comparable installed capacity leads to stable levels of shares in covering electricity consumption. In other words, their operation, and the energy expectations out of them among different years, seem rather stable at a monthly level. On the contrary, wind penetration comparatively supports winter consumption while their shares in covering electricity demand significantly fluctuate over the years. For instance, with a fairly stable demand between 2014 and 2018, wind farms’ share fluctuation seems about double the variance, which can be attributed to the increase in their total installed capacity. Small hydro contribution peaks during spring months, while electricity consumption is at relatively low levels in the interconnected system. Biomass–biogas technologies in principle are not considered intermittent. Their fluctuation concerns mainly raw material availability in order to preserve a steady level of operation. However, their installed capacity is still very small in Greece, so it is a bit premature to proceed to further conclusions.

4.4. Model Fitting

The cosine Equation (4) is fitted to seasonal capacity factor data for the five recent years (2014–2018) and the results are summarized in Table 1 and Figure 10. Since the standard deviation between actual and calculated values (lack of fit) is about equal to the experimental error (random variation), the goodness of fit can be considered as adequate.
The comparison between experimental and predicted values are shown in Figure 10 where the real data are denoted with dots and the predictions with continues curves. The differences in seasonal variations between technologies are compared in Figure 11.
Figure 12 presents the seasonal and random variation for every RES technology.
The proposed model of Equation (9) is fitted to real consumption data and the results are presented in Table 2 and Figure 13. Since the standard deviation between actual and calculated values (lack of fit) is less than the experimental error (random variation), the goodness of fit is adequate.
The combined validation of models Equations (4) and (9) are further tested on real renewable share data in Figure 14. Figure 14a refers to total RES for five selected years while Figure 14b refers to the year 2018 for three selected technologies.

4.5. Forecasting

The proposed validated models can now be used to forecast the renewable share and its seasonal variation in different renewable penetration scenarios. Some examined scenarios are described in Table 3 including the new national energy and climate plan (NECP) 2030 targets [25]. This plan pursues a radical change of Greece’s energy mix, favoring renewables, up to the 32% of final energy consumption, leading to a reduction of 63% on greenhouse gas emissions. To achieve this goal, the plan foresees a radical transformation of the electricity sector, as renewable energy will substitute fossil fuels with a contribution of approximately 56% on final gross electricity consumption. This RES penetration will be driven by reduced electricity generation costs in the sector, especially PV and wind energy technology, and a withdrawal of old lignite and diesel-fired power stations, whose production costs are expected to increase as a result of higher CO2 emission right costs. For major RES technologies, 2030 targets in GW of capacity are: Wind 6.4, PV 6.9, small and large hydro at 3.9, biomass–biogas at 0.3. Since the national plan does not offer targets for small hydro and cogeneration, their contribution is considered in the relative scenario as double compared to the present in terms of installed capacity. The results of the examined scenarios are presented in Figure 15.
Through the examined scenarios for RES penetration presented in Figure 15, it is obvious that fluctuation of their share in covering electricity demand will continue. However, combining Figure 15 with Figure 13, it becomes fairly clear that this fluctuation is also triggered by the seasonality in demand, namely the summer and winter peaks, and not RES infusions alone.

5. Conclusions

The significant penetration of the renewables in electricity market during the last 12 years in Greece was triggered from feed-in tariff-supporting schemes according to the compliance with European Directives. The related laws were presented and analyzed.
Wind electricity follows a linear penetration with almost constant growth, photovoltaics appeared with a step increment during the years 2012 and 2013 remaining constant afterwards, while the penetration of other renewables remained at low levels.
Generally, the renewable penetration affects the electricity market and especially the system marginal price. In the case of Greece, it was proved that up until now (approximately 21% renewable share excluding large hydro in total electricity consumption of interconnected system), the penetration does decrease the system marginal price and equally increases the renewable surcharge.
Simple but effective models were proposed to describe renewable seasonal variation: (a) A simple cosine model adequately describes the seasonal performance of various renewable technologies in terms of capacity factor, (b) a smart seasonal model based on the separation between winter and summer consumption activities (both following normal distributions) adequately describes the electricity consumption profile. The predicted values of renewable shares using the proposed models were also validated with historical data.
The resulting validated models can be used to forecast renewable shares under various future penetration scenarios when the penetration will be at higher values.

Author Contributions

This paper is a partial fulfillment of S.L. PhD degree supervising by E.G. (post doctor) and Z.M.; S.L. PhD refers to electricity market and especially to renewables’ contribution. E.G.’s post doc research refers to renewables’ penetration. All authors contributed equally according to the classical academic scheme: PhD student, post doctor, supervisor professor.

Funding

This research received no external funding.

Conflicts of Interest

The authors declare no conflict of interest.

Nomenclature

c the capacity factor
c a v the annual average capacity factor
c i j the capacity factor of the calendar month j (j = 1, 2, …, 12) of the calendar year i
D the electricity consumption at time t (TWh/month)
d s the portion of the total consumption for summer activities
D T the total electricity demand during the year (ΤWh/year)
d w the portion of the total consumption for winter activities
E the renewable electricity production (TWh/year)
F I T the feed-in tariff (€/MWh)
P the installed power (GW)
R S C the renewable surcharge (€/MWh)
s the renewable share in electricity consumption
S M P the system marginal price (€/MWh)
tthe time (months)
t o the time at minimum capacity factor (months)
t s o the time of the peak of summer activities (months)
t w o the time of the peak of winter activities (months)
Δ c the half range of annual variation of the capacity factor
Δ t s the typical duration of the summer activities (months)
Δ t w the typical duration of the winter activities (months)
μ j the mean value of the calendar month j
σ the random standard variation
σ j the random standard variation of the calendar month j

Abbreviations

CO2Carbon Dioxide
DEDDIEHellenic Electricity Distribution Network Operator (Greek abbreviation)
DESMIEHellenic Transmission System Operator (Greek abbreviation)
ETMEARSurcharge on Electricity Price (Greek abbreviation)
FIPFeed-in Premium
FIPCFeed-in Premium Contracts
FITFeed-in Tariff
HEDNOHellenic Electricity Distribution Network Operator
HEMOHellenic Electricity Market Operator
HTSOHellenic Transmission System Operator
IRRInternal Rate of Return
LAGIEHellenic Electricity Market Operator (Greek abbreviation)
MDMinisterial Decision
MNGPMean Natural Gas Price
NECPNational Energy and Climate Plan
PPAPower Purchase Agreement
PPCPublic Power Corporation
PVPhotovoltaics
RAERegulatory Authority of Energy
RCSSurcharge on Electricity Price
RESRenewable Energy Sources
RTReference Tariff
SMPRESSpecial Market Price for Renewables
SPMSystem Marginal Price
TSOTransmission System Operator
WAVCCTUWeighted Average Variable Cost of Conventional Thermal Units

References

  1. Eurostat. Sectoral and regional statistics. Energy. In The Average Share of Electricity from Renewable Energy Sources in the EU; European Commission: Brussels, Belgium, 2019. [Google Scholar]
  2. Papadopoulos, A.M.; Karteris, M.M. An assessment of the Greek incentives scheme for photovoltaics. Energy Policy 2009, 37, 1945–1952. [Google Scholar] [CrossRef]
  3. Lazarou, S.; Pyrgioti, E.; Agoris, D. The latest Greek statute laws and its consequences to the Greek renewable energy source market. Energy Policy 2007. [Google Scholar] [CrossRef]
  4. Karteris, M.; Papadopoulos, A.M. Legislative framework for photovoltaics in Greece: A review of the sector’s development. Energy Policy 2013, 55, 296–304. [Google Scholar] [CrossRef]
  5. Giannini, E.; Moropoulou, A.; Maroulis, Z.; Siouti, G. Penetration of Photovoltaics in Greece. Energies 2015, 8, 6497–6508. [Google Scholar] [CrossRef]
  6. Gregor, E. European Parliamentary Research Service. EU policies and Member State approaches. European Parliament. In Promotion of renewable Energy Sources in the EU; Members’ Research Service, Directorate-General for Parliamentary Research Services, European Parliament: Strasbourg, France, June 2016. [Google Scholar] [CrossRef]
  7. Paterakis, N.G.; Sánchez, A.A.; Catalão, J.P.S.; Bakirtzis, A.G.; Ntomaris, A.; Contreras, J. Evaluation of load-following reserves for power systems with significant RES penetration considering risk management. In Proceedings of the IEEE International Conference on Smart Energy Grid Engineering—SEGE’15, Oshawa, ON, Canada, 17–19 August 2015. [Google Scholar]
  8. Habib, A.; Sou, C.; Arshad, A. Evaluation of the effect of high penetration of renewable energy sources (RES) on system frequency regulation using stochastic risk assessment technique (an approach based on improved cumulant). Renew. Energy 2018, 127, 204–212. [Google Scholar] [CrossRef]
  9. Simoglou, C.K.; Biskas, P.N.; Vagropoulos, S.I.; Bakirtzis, A.G. Electricity market models and RES integration: The Greek case. Energy Policy 2014, 67, 531–542. [Google Scholar] [CrossRef]
  10. Psarros, G.N.; Papathanassiou, S.A. Comparative Assessment of Priority Listing and Mixed Integer Linear Programming Unit Commitment Methods for Non-Interconnected Island Systems. Energies 2019, 12, 657. [Google Scholar] [CrossRef]
  11. Psarros, G.N.; Nanou, S.I.; Papaefthymiou, S.V.; Papathanassiou, S.A. Generation scheduling in non-interconnected islands with high RES penetration. Renew. Energy 2018, 115, 338–352. [Google Scholar] [CrossRef]
  12. Simoglou, C.K.; Bakirtzis, E.A.; Biskas, P.N.; Bakirtzis, A.G. Optimal operation of insular electricity grids under high RES penetration. Renew. Energy 2016, 86, 1308–1316. [Google Scholar] [CrossRef]
  13. Kosmadakis, I.E.; Elmasides, C.; Eleftheriou, D.; Tsagarakis, K.P. A Techno-Economic Analysis of a PV-Battery System in Greece. Energies 2019, 12, 1357. [Google Scholar] [CrossRef]
  14. Papaefthymiou, S.V.; Lakiotis, V.G.; Margaris, I.D.; Papathanassiou, S.A. Dynamic analysis of island systems with wind-pumped-storage hybrid power stations. Renew. Energy 2015, 74, 544–554. [Google Scholar] [CrossRef]
  15. Sensfuß, F.; Ragwitz, M.; Genoese, M. The merit-order effect: A detailed analysis of the price effect of renewable electricity generation on spot market prices in Germany. Energy Policy 2008, 36, 3086–3694. [Google Scholar] [CrossRef]
  16. Clò, S.; Cataldi, A.; Zoppoli, P. The merit-order effect in the Italian power market: The impact of solar and wind generation on national wholesale electricity prices. Energy Policy 2015, 77, 79–88. [Google Scholar] [CrossRef]
  17. Würzburg, K.; Labandeira, X.; Linares, P. Renewable generation and electricity prices: Taking stock and new evidence for Germany and Austria. Energy Econ. 2013, 40, S159–S171. [Google Scholar] [CrossRef] [Green Version]
  18. Simoglou, C.K.; Member, S.; Biskas, P.N.; Zoumas, C.E.; Bakirtzis, A.G.; Member, S. Evaluation of the Impact of RES Integration on the Greek Electricity Market by Mid-term Simulation. In Proceedings of the 2011 IEEE Trondheim PowerTech, Trondheim, Norway, 19–23 June 2011; pp. 1–8. [Google Scholar] [CrossRef]
  19. Simoglou, C.K.; Biskas, P.N.; Bakirtzis, A.G. Impact of Increased RES Penetration on the Operation of the Greek Electricity Market. In Proceedings of the 7th Mediterranean Conference and Exhibition on Power Generation, Transmission, Distribution and Energy Conversion, Agia Napa, Cyprus, 7–10 November 2010. [Google Scholar]
  20. Anagnostopoulos, P.; Spyridaki, N.-A.; Flamos, A. A “New-Deal” for the Development of Photovoltaic Investments in Greece? A Parametric Techno-Economic Assessment. Energies 2017, 10, 1173. [Google Scholar] [CrossRef]
  21. Regulatory Authority for Energy. National Report 2018. Regulation and Performance of the Electricity Market and the Natural Gas Market in Greece, in 2017. December 2018. Available online: http://www.rae.gr/site/file/system/docs/ActionReports/national_2018 (accessed on 14 May 2019).
  22. Hellenic Electricity Market Operator. Monthly Statistics of Specific Account for Renewable Energy Sources. Available online: http://www.lagie.gr (accessed on 20 March 2019).
  23. Hellenic Electricity Market Operator. Renewable Energy Sources and CHP Monthly Statistics. Available online: http://www.lagie.gr (accessed on 20 March 2019).
  24. Hellenic Independent Power Transmission Operator. Monthly Energy Balance. Available online: http://www.admie.gr (accessed on 20 March 2019).
  25. Ministry of Environment and Energy. Hellenic National Energy and Climate Plan; Ministry of Environment and Energy: Athens, Greece, January 2019.
Figure 1. Renewables penetration: installed power versus calendar year: (a) pv = photovoltaic parks, w = wind parks, h = small hydroelectric plants, b = biomass driven plants, c = heat and power cogeneration systems, L = law number/validation date, (b) h = small hydroelectric plants, b = biomass driven plants, c = heat and power cogeneration systems. Data from hellenic electricity market operator [22,23].
Energies 12 02441 g001
Figure 2. Renewables penetration: Produced electricity versus calendar year: (a) pv = photovoltaic parks, w = wind parks, h = small hydroelectric plants, b = biomass driven plants, c = heat and power cogeneration systems, (b) h = small hydroelectric plants, b = biomass driven plants, c = heat and power cogeneration systems. Data from Hellenic electricity market operator [22,23].
Energies 12 02441 g002
Figure 3. Electricity consumption: Long-term and seasonal Variation. Data from Hellenic independent power transmission operator [24].
Energies 12 02441 g003
Figure 4. Renewable share evolution: (a) Monthly data, (b) 12-month moving average.
Energies 12 02441 g004
Figure 5. Renewable surcharge for total renewable energy sources (RES) and comparison with system marginal price (SMP). Data from Hellenic electricity market operator [22].
Energies 12 02441 g005
Figure 6. Effect of renewable penetration on the system marginal price: (a) RES surcharge, (b) RES share. Data from Hellenic electricity market operator [22].
Energies 12 02441 g006
Figure 7. Seasonal variation of the capacity factor of renewable technologies: pv = photovoltaic parks, wind = wind parks, hydro = small hydroelectric plants, bio = biomass driven plants, cogen = heat and power cogeneration systems.
Energies 12 02441 g007
Figure 8. Seasonal variation of electricity consumption. Data from Hellenic independent power transmission operator [24].
Energies 12 02441 g008
Figure 9. Seasonal variation of the renewable share separate for each technology and total RES. pv = photovoltaic parks, wind = wind parks, hydro = small hydroelectric plants, bio = biomass driven plants, cogen = heat and power cogeneration systems.
Energies 12 02441 g009
Figure 10. Seasonal variation of the capacity factor of renewable technologies: Comparison between real data and model calculated values.
Energies 12 02441 g010
Figure 11. Seasonal variation of the capacity factor of renewable technologies: Comparison between different technologies.
Energies 12 02441 g011
Figure 12. Seasonal and random variation of the capacity factor of renewable technologies.
Energies 12 02441 g012
Figure 13. Seasonal variation of electricity consumption: Comparison between experimental and model predicted data.
Energies 12 02441 g013
Figure 14. Models validation: Comparison between real and model calculated values for renewable share. (a) Total RES share for four years. (b) RES share for the year 2018 and three technologies.
Energies 12 02441 g014
Figure 15. Total RES share forecast for various penetration scenarios of Table 3.
Energies 12 02441 g015
Table 1. Seasonal variation of capacity factor: Model parameter estimation results (Equation (4)).
Renewable Source PhotovoltaicsWindHydropowerBiomassCogeneration
Annual Averagecav0.1690.2490.3490.5190.209
Seasonal VariationΔc0.0600.0380.1930.0150.096
Month of Maximum Capacity Factorto6.670.382.892.071.11
JulyJanuaryMarchMarchFebruary
Standard Deviation between
Actual and Calculated Values
0.0230.0710.0810.0160.024
Random Variation (Volatility)σ0.0100.0420.0560.0230.023
Table 2. Seasonal variation of electricity consumption: Model parameter estimation results (Equation (9)).
Annual Electricity Consumption (TWh)D51.3TWh
Winter Activities Fractiondw0.131-
Winter Activities Peak Monthtwo1.00mo
Winter Activities Standard PeriodΔtw1.92mo
Summer Activities Fractionds0.094-
Summer Activities Peak Monthtso7.27mo
Summer Activities Standard PeriodΔts1.20mo
Standard Deviation between
Actual and Calculated Values
0.10TWh
Standard Experimental Error 0.13TWh
Table 3. Renewable penetration scenarios in GW of installed power.
ScenarioPhotovoltaicsWindHydropowerBiomassCogeneration
Existing2.492.560.240.080.10
Solar4.982.560.240.080.10
Wind2.145.110.240.080.10
Water2.142.560.480.080.10
Double4.985.110.480.160.20
National Energy and Climate Plan 20306.906.400.480.160.20

