1. Introduction
In order to reduce the tight dependence on fossil fuels used to cover global energy consumption, renewable energy resources are of great importance. In particular, the objectives of the European Union (EU) regarding renewable energy production for 2030 targeted a value of 27% for the renewable energy consumed in the EU in that year [
1]. Thus, it is of prime importance to develop a clear strategy to help achieve this objective, one that fosters the stability required to attract investments and seeks a consensus to promote a higher participation of renewable energies in countries’ electricity mix.
Among the different renewable energy sources, wind power has experienced considerable growth in recent years, reaching a total installed capacity of 539,581 MW in 2017 [
2]. Europe currently has a total installed capacity of 189 GW of wind power, of which 11.7 GW was installed in 2018 [
3]. In particular, Spain is one of the world’s leading countries with 23,484 MW, ranking fifth in the world and covering approximately 19% of the average annual electricity demand during 2018 [
3].
Nevertheless, the unpredictable variability of wind may lead to critical situations during peak demands of energy on the electrical grids, making it necessary for Transmission and Distribution System Operators (TSOs and DSOs, respectively) to plan network operations effectively. Thus, detailed grid operation planning guarantees power supply and forecasts the power compensations that are required from conventional power plants in addition to increasing network reliability and to avoiding voltage and frequency regulation problems.
To deal with this issue, in-depth transient stability analyses of wind turbine (WT) and wind power plant (WPP) models are required. Specifically, the performance of these dynamic simulation models must be assessed against severe grid disturbances such as voltage dips, which may be caused by short circuits or overload periods. In this sense, it is also worth considering the effects of voltage dips on powered systems and industrial equipment, which are discussed in detail in works such as References [
4,
5]. The wide variety of detailed WT simulation models developed by the different WT manufacturers, however, makes it difficult to obtain a generalized and unified response. It was, therefore, necessary to develop generic or standard WT dynamic models able to faithfully represent those actual WT models [
6].
In light of the above, the Western Electricity Coordinating Council (WECC), and the International Electrotechnical Commission (IEC), through the
WECC Second Generation of Wind Turbine Models [
7] and Standard IEC 61400-27-1 [
8], respectively, are the two main entities focused on the development of the four generic types of WT technologies currently available in the market: Type 1, with an asynchronous generator directly connected to the grid; Type 2, with an asynchronous generator equipped with a variable rotor resistance directly connected to the grid; Type 3, with a doubly-fed induction generator (DFIG) connected through a back-to-back power converter; and Type 4, with synchronous or asynchronous generators directly connected to the grid through a full-scale power converter.
The WECC report entitled
WECC Second Generation of Wind Turbine Models [
7], which includes the generic WT simulation models described in the previous paragraph, was published in January 2014. The first edition of this technical report was published four years earlier, in 2010 [
9]. It was mainly based on the contribution of a single WT manufacturer, while the second edition featured contributions from different WT manufacturers, thus obtaining generic WT models able to represent a wider range of actual WTs. It should also be highlighted that, while the IEC is more focused on obtaining an optimized behavior of the WT models and, so, their responses are very similar to field measurements, the WECC opts for developing very technically simplified WT simulation models [
10], reducing the number of parameters required as far as possible. In this sense, the generic WECC WT simulation models are designed to be studied using positive-sequence power flow and integration time steps in the range of 1 to 5 ms, which is a common time step for transient stability analysis. WECC models also assume that wind speed is constant during the simulation. Hence, they are not intended to represent in detail the transient periods that appear during grid disturbances and may produce short voltage spikes when the faults are cleared. These spikes should therefore be ignored, since they do not represent the transient periods of actual machines and result from the simplification process of the models and the way they interface with the external network. However, these publicly available and simplified WECC WT models are able to provide sufficiently accurate responses using a limited number of parameters and can represent any vendor’s WT model, in addition to ensure the same simulation results regardless of the software tool used.
In the specific case of Standard IEC 61400-27-1, the behavior of the WT models may be assessed following the standard’s own validation guidelines [
11]. However, most countries have their own grid interconnection agreements, i.e., they have developed their own grid codes and their own validation guidelines. In the case of Spain, the Spanish Grid Code, through Operation Procedure 12.3 (PO 12.3) for fault ride-through capability, details the behavior that WPPs must have under grid disturbances, namely voltage dips. Thus, to comply with PO 12.3, a specific procedure for verification, validation, and certification (PVVC) [
12] was also developed. The PVVC involves the conduction of certain technical adjustments, such as the implementation of flexible alternating current transmission systems (FACTS), in order for the Spanish WPPs to comply with PO 12.3 [
13]. Moreover, the responses of these actual WPPs must be analyzed quantitatively by calculating the validation errors following the validation criteria established by the PVVC.
Previous works related to the application of the Spanish grid code, such as References [
14,
15], perform the complete process of verification and validation of a particular WPP in Spain following the PVVC guidelines, in addition to applying different voltage dips to the actual WTs and analyzing their response according to PO 12.3. However, the present contribution is aimed at complementing the work previously conducted in Reference [
16], in which a generic IEC-developed Type 3 WT simulation model was submitted to the Spanish PO 12.3. Thus, the present work addresses the submission of the Type 3 WT model defined by the
WECC Second Generation of Wind Turbine Models technical document to the Spanish national grid code requirements. On the one hand, the present work will allow the scope of application of the WECC to be extended. On the other hand, as the
WECC Second Generation has not developed a specific validation procedure, the reliability and good performance of the WT simulation model is assessed, for the first time, based on a national grid code requirement. In addition, the present work also contributes to achieving a more widespread use of the generic WT dynamic models developed by the WECC. Moreover, the responses of the generic WECC model, modeled in MATLAB/Simulink, are compared to the field measurements recorded at an actual Spanish WPP composed of Gamesa G52 WTs, as will be further detailed in
Section 3.2. Both data series are also compared to the responses of the detailed simulation model corresponding to the Gamesa G52 WT, which was modeled in the PSCAD/EMTDC software tool, and the verification of the PVVC validation criteria is carried out when two different measurement points are considered, also described in
Section 3.2.
Furthermore, the present work aims to analyze the modeling limitations of one of the most advanced types of WTs, the Type 3 or DFIG WT, when developed by the WECC. In the cases of non-compliance with PO 12.3, the reasons are thoroughly analyzed, and modeling modifications are proposed.
The paper is structured as follows:
Section 2 presents the WT model studied, the generic Type 3 WT model defined by the WECC.
Section 3 reviews the requirements imposed by the Spanish grid code to comply with PO 12.3, the procedure that must be followed and the calculation of the validation errors, in addition to explaining how the field measurements were performed.
Section 4 describes the results obtained and, finally,
Section 5 summarizes the conclusions of the work.
2. WECC Second Generation of Wind Turbine Models: Type 3
As will be seen in
Section 3, it can be said that most of the works related to the generic WT models have focused on the analysis of their responses under different types of events, mainly voltage dips and reference point changes, and also on the development process followed to obtain them. For instance, works such as References [
17,
18], among others, conducted in-depth analyses addressing the dynamic behavior of the generic Type 3 WT model defined by Standard IEC 61400-27-1 when subjected to voltage dips, while also describing the main control models which are part of this WT. Regarding the WECC guidelines, works such as References [
19,
20,
21] addressed the development process of the second generation WT models, while References [
22] focused on the validation of a generic Type 3 WECC model against different grid events. Finally, references [
23] addressed the validation of wind farm models according to the WECC guidelines. To support this, a more comprehensive literature review of the works addressing the simulation of generic WT simulation models can be found in References [
24,
25].
In view of the above, due to the lack of studies addressing the submission of the generic WT models to national grid code requirements, which typically differ by country [
26] and require validated wind-turbine models to comply with their own interconnection agreements, Reference [
16] submitted, for the first time, the generic IEC model to a national grid code. It is, therefore, necessary to complement the work begun in Reference [
16] and to submit the generic Type 3 WT model defined by the WECC to a specific national grid code, thus expanding the scope of application of this international guideline and the usability of these generic WT models, also analyzing their limitations.
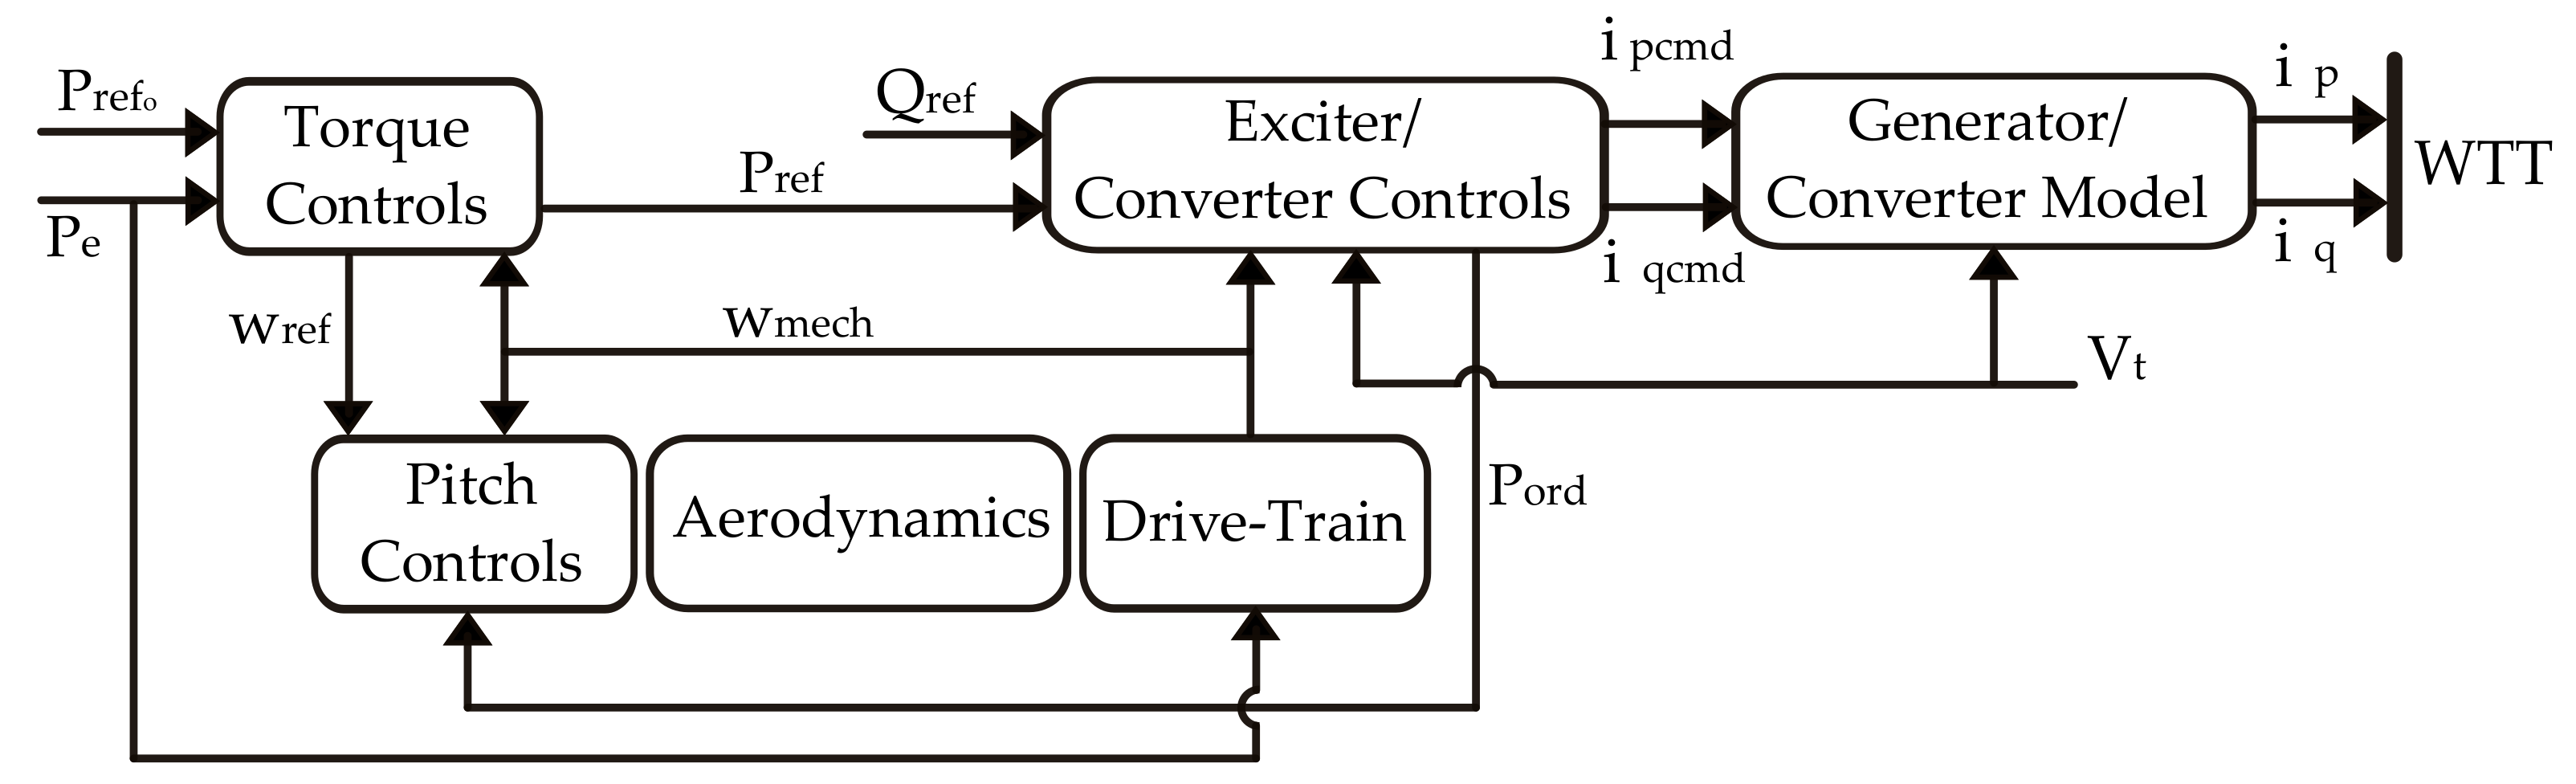
Figure 1 shows the main control models that are part of the generic Type 3 WECC model. The
Generator/Converter Model represents a generator model that neglects all the flux dynamics of the machine. It injects the active and reactive components of current,
and
, into the external grid. The
Exciter/Converter Controls represent the active and reactive power control model in addition to the current limitation system. It provides the active and reactive current commands,
and
, to the
Generator/Converter Model, mainly based on the active and reactive power reference values,
and
. Unlike the generic Type 3 IEC model in which the torque control model is included in the active power control model, the
Torque Controls module is set apart from the
Exciter/Converter Controls, and provides the reference rotational speed,
, i.e., the speed at which the WT should rotate when a certain value of active power is injected, in addition to the active power reference value,
, which is used by the
Exciter/Converter Controls. As in the case of the pitch control model of the generic Type 3 IEC model, the
Pitch Controls defined by the WECC calculate the pitch angle required to obtain the active power reference value, i.e., the position angle of the WT blades. The
Aerodynamics module provides the
Drive-Train model with the mechanical power. Finally, the
Drive-Train model, which is a two-mass model that represents the mechanical phenomena between the WT blades and the electric generator, provides the mechanical rotational speed,
.
4. Results
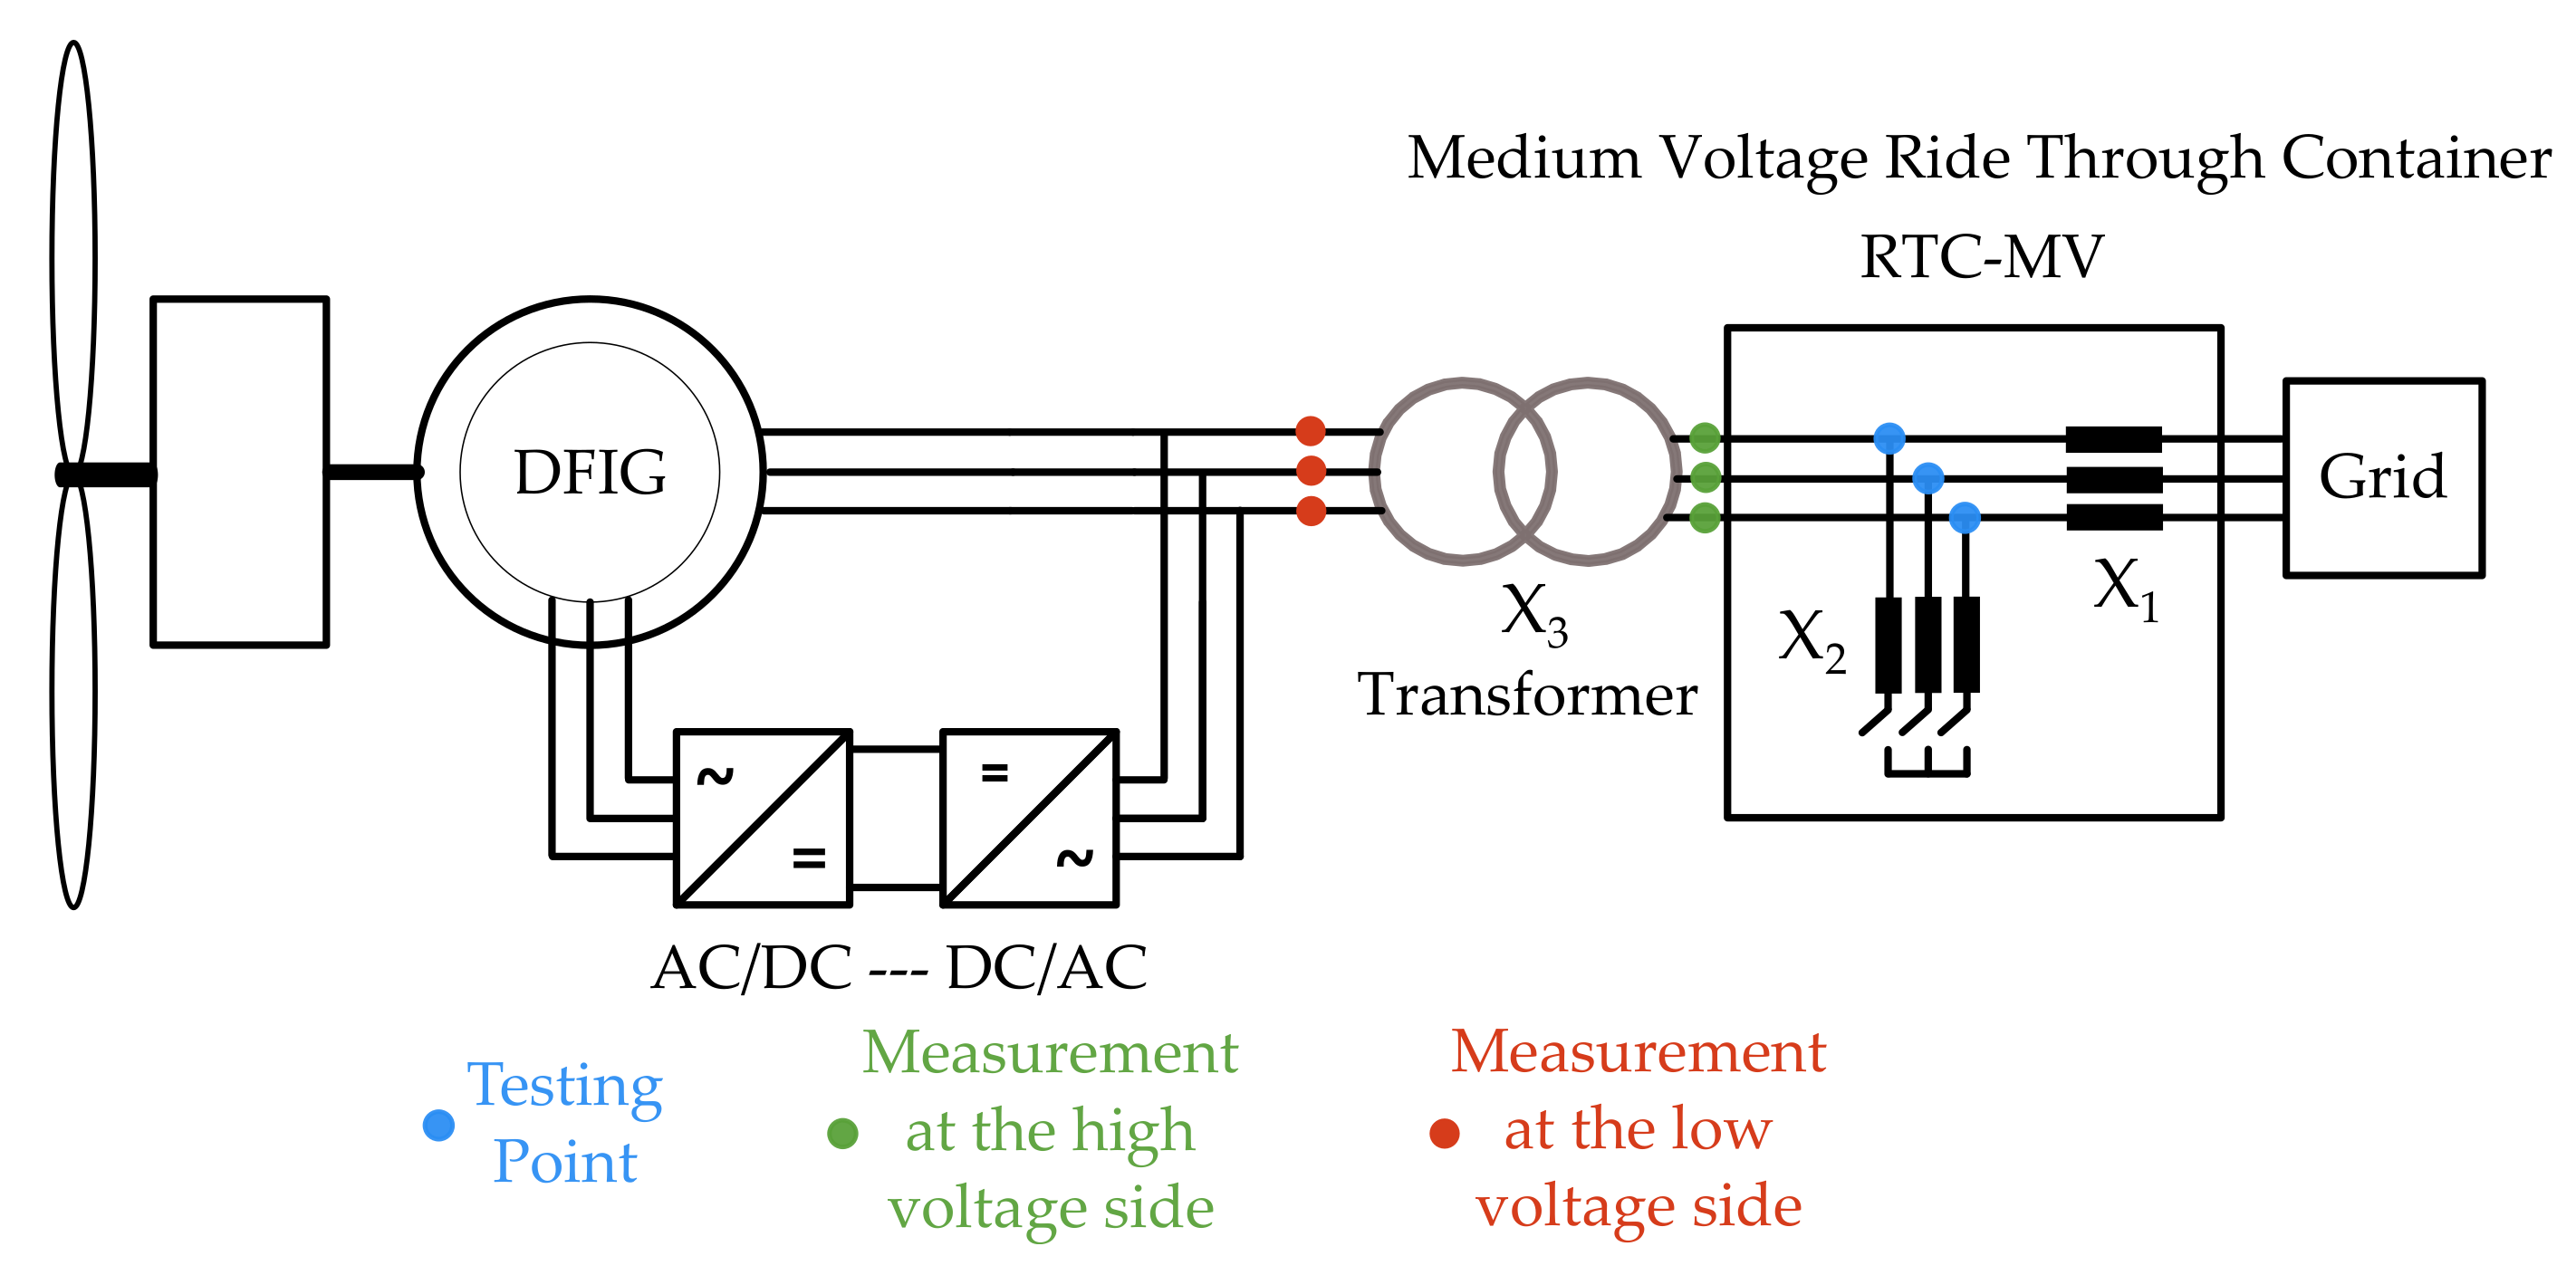
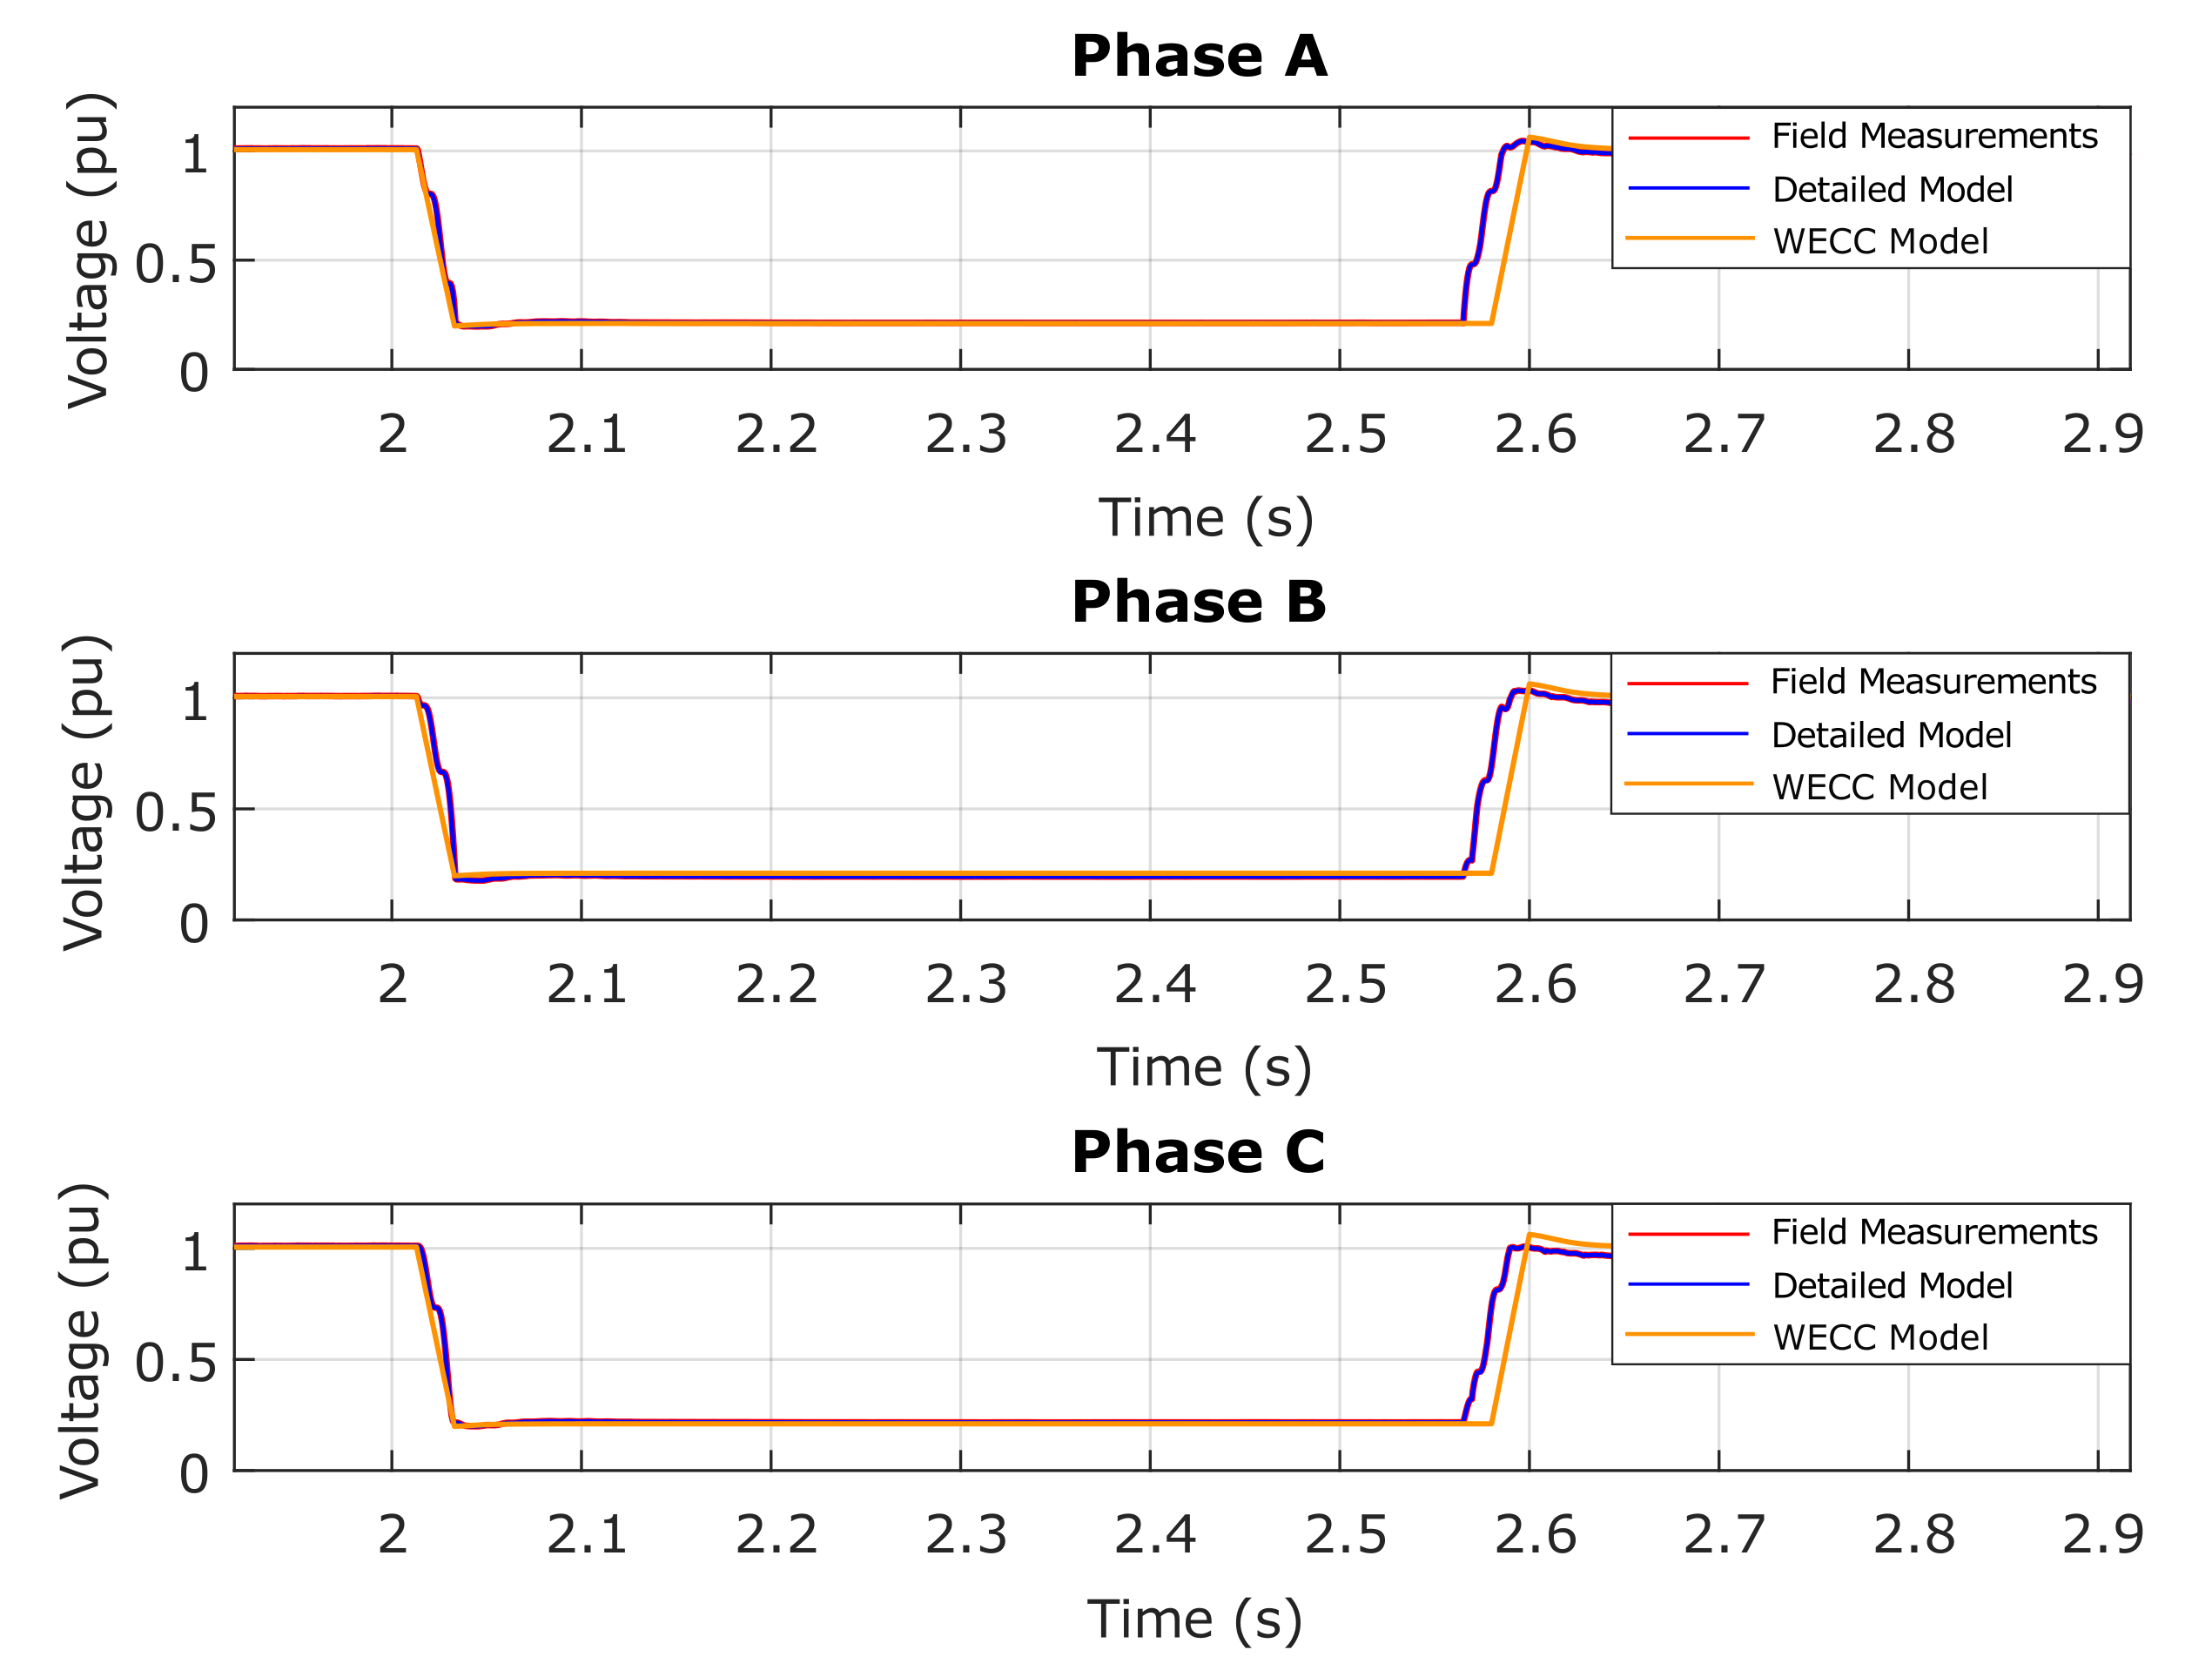
A three-phase voltage dip with a duration of 570.5 ms was applied on the actual WT (Gamesa G52) working at full load conditions of 0.93 pu and partial load conditions of 0.20 pu, following the methodology described in
Section 3.2. The generic WECC model and the detailed WT simulation model were implemented in the software tools MATLAB/Simulink and PSCAD/EMTDC, respectively. The positive-sequence values of the voltage dip measured were then reproduced in both simulation models by using a voltage-dependent source, as mentioned in
Section 3.1. This is known as the play-back validation approach [
29], as it allows the voltage dip to be accurately reproduced.
The residual voltage, shown in
Figure 3, was 19.66% for phase A, 17.75% for phase B, and 19.91% for phase C. In this same figure, the red line represents the voltage dip measured at the actual WT, the blue line represents the voltage dip reproduced by the detailed WT model, and the orange line corresponds to the voltage dip reproduced by the generic WECC WT simulation model. As can be seen, there exists a good correlation between the three signals, so it can be said that the voltage dip measured was accurately reproduced at both WT simulation models.
As explained in
Section 3.2, two different measurement points were considered for the application of the PVVC criteria in both the WECC and the detailed simulation models (see
Figure 2): first, the high-voltage (HV) point (20 kV), i.e., the point that coincides with the testing point, and second, the LV point (690 V), downstream from the transformer.
In order to properly analyze and interpret the results obtained, and based on the information on the PVVC report and the equations shown in
Section 3.1, the rated value to apply the validation criteria was 1 pu. Therefore, for at least 85% of the data series, the maximum deviation allowed (10%) was 0.1 pu, as will be reflected in the results tables included in
Section 4.
4.1. Verification of the PVVC Criteria at the Testing Point: Measurement Point at HV Side
Table 1 shows the results for the application of the PVVC validation criteria at the HV measurement point (coinciding with the testing point, see
Figure 2) in the cases of the WECC model and the detailed model. The validation process therefore affected both the transformer and the WT model. Hence, it was also necessary to implement and simulate the transformer along with the generic and detailed models. In the case of the generic WECC WT, the transformer was simply modeled through an impedance [
14].
Regarding the WECC WT model results depicted in
Table 1, only 81% of the points within the data series analyzed complied with the validation criteria in the case of active power, while an even lower number of points, 59%, complied with the validation criteria in the case of reactive power. The PVVC validation criteria were, therefore, not complied with either of these cases when applied at the testing or HV measurement points, so that the WECC and the transformer models could not be validated.
Concerning the detailed WT simulation model, the results of which are also shown in
Table 1, both the active and the reactive power responses complied with the PVVC, since 91% and 90% of the data series analyzed fulfilled the validation criteria, respectively.
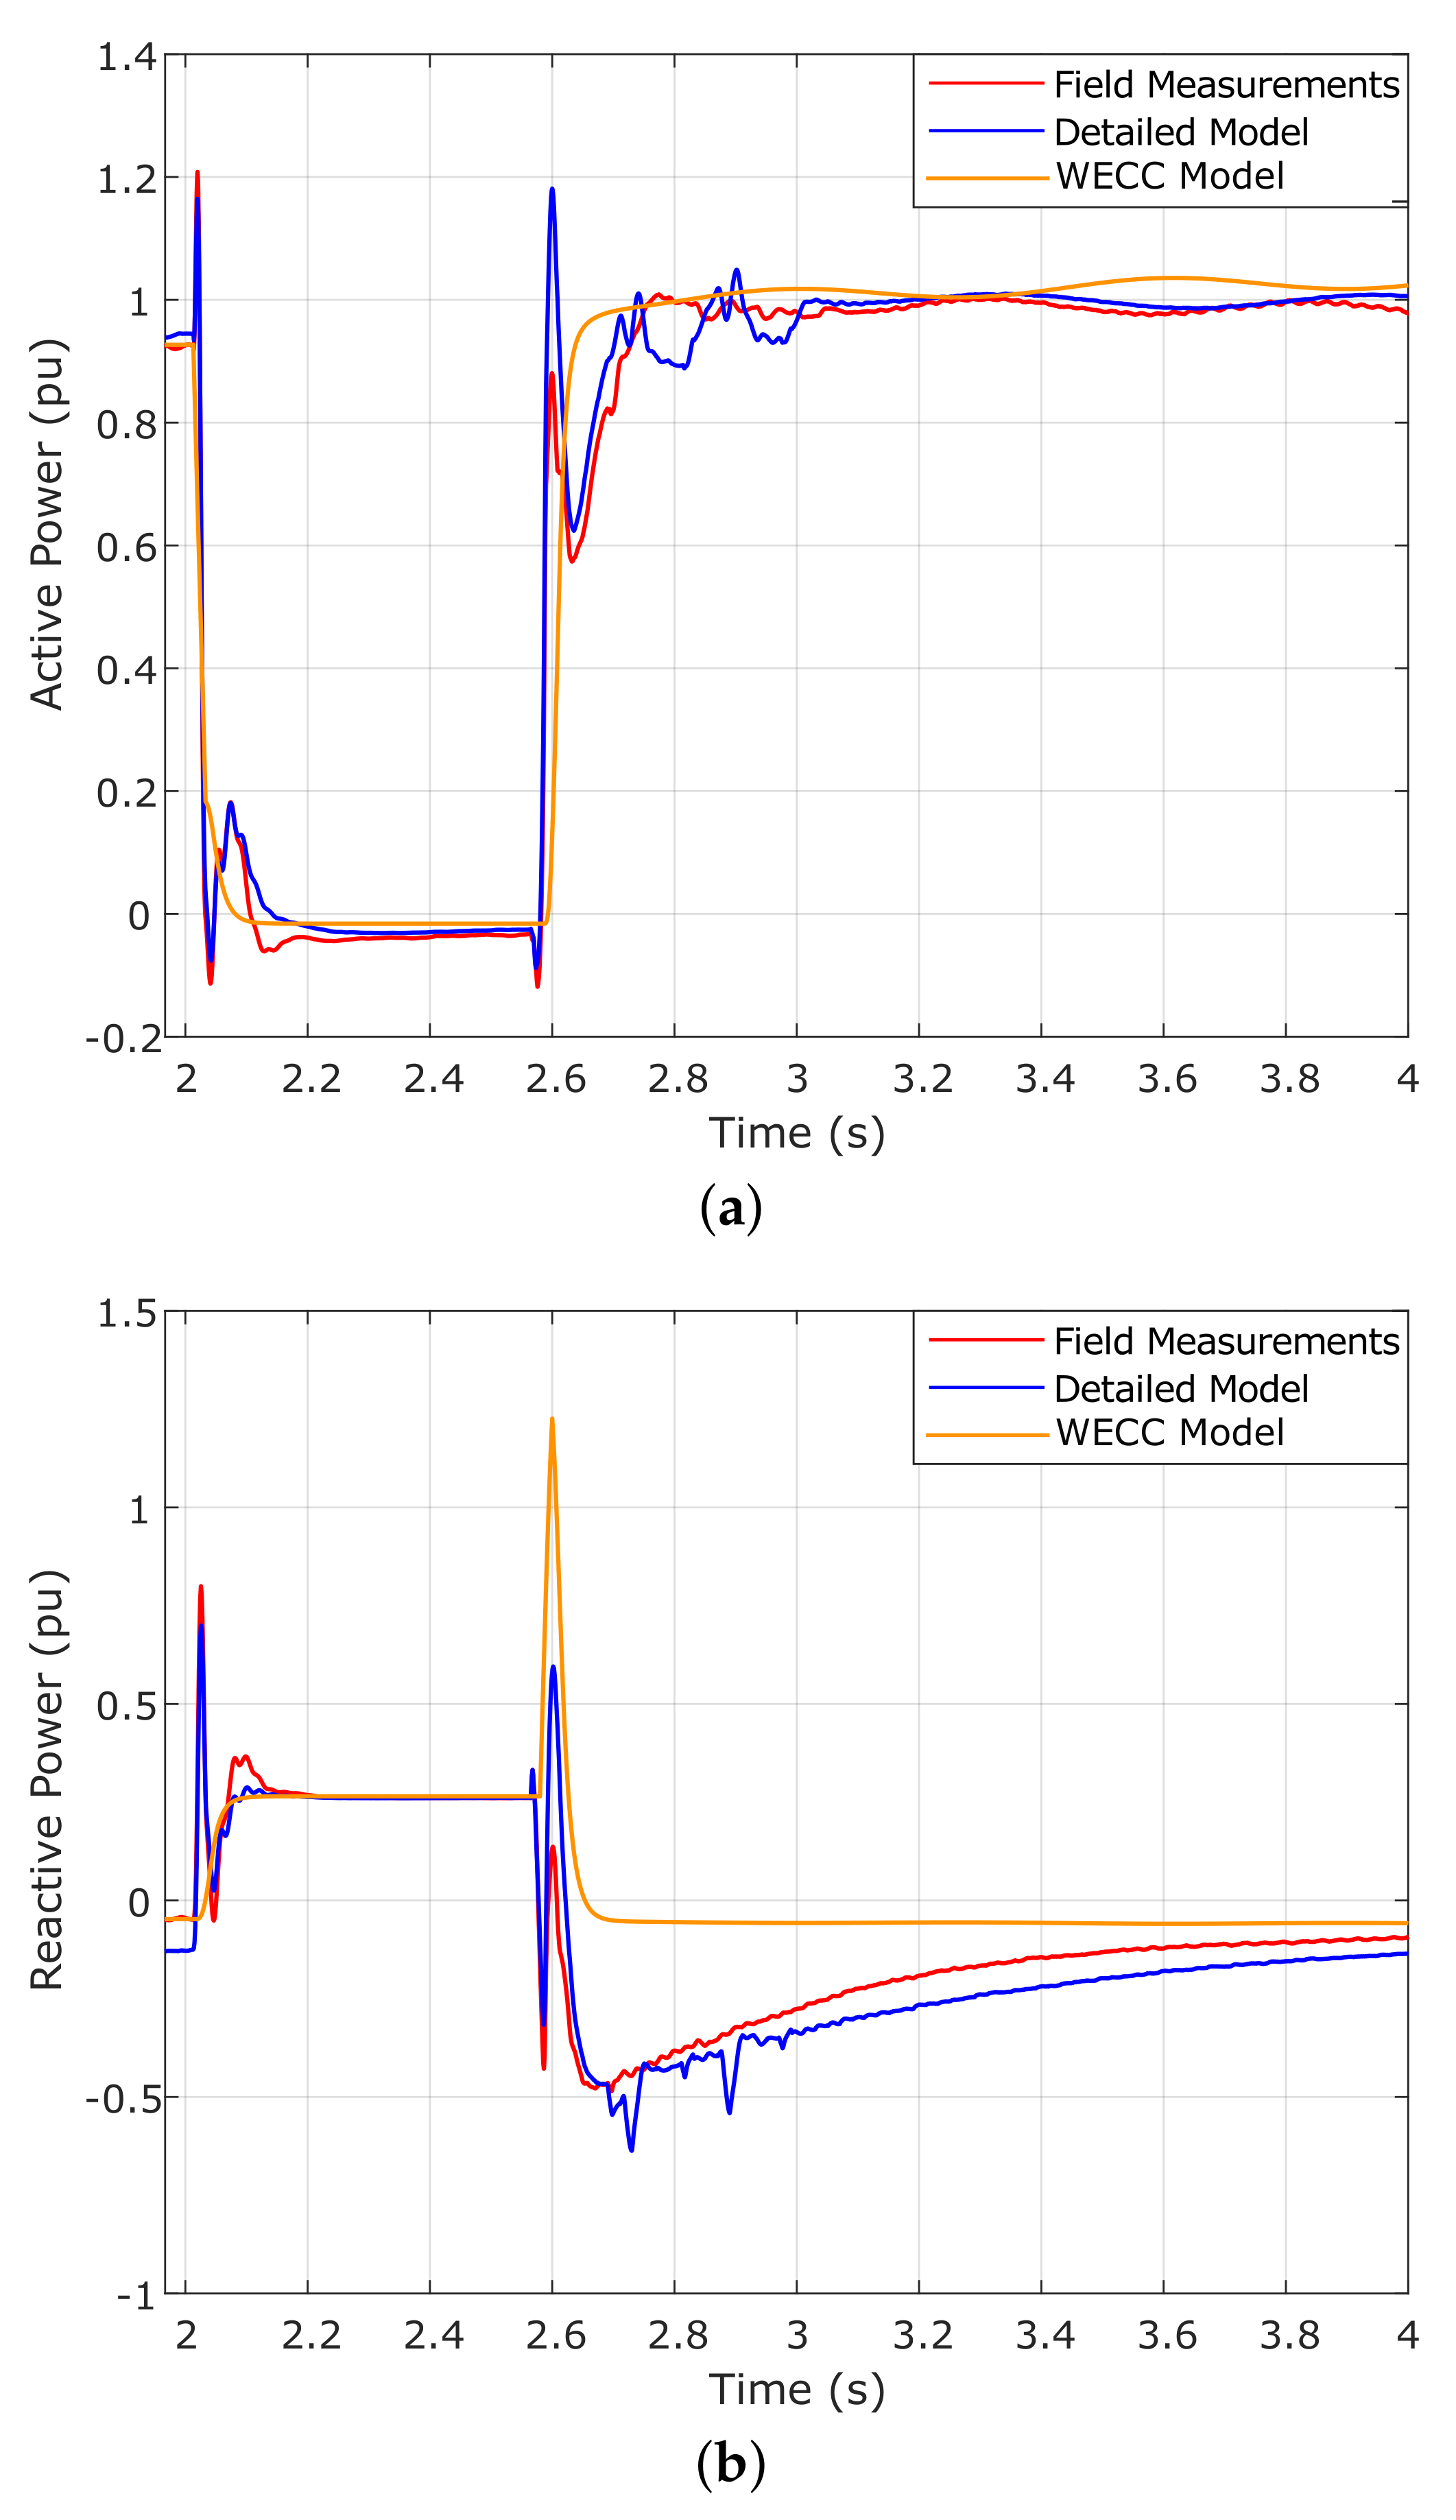
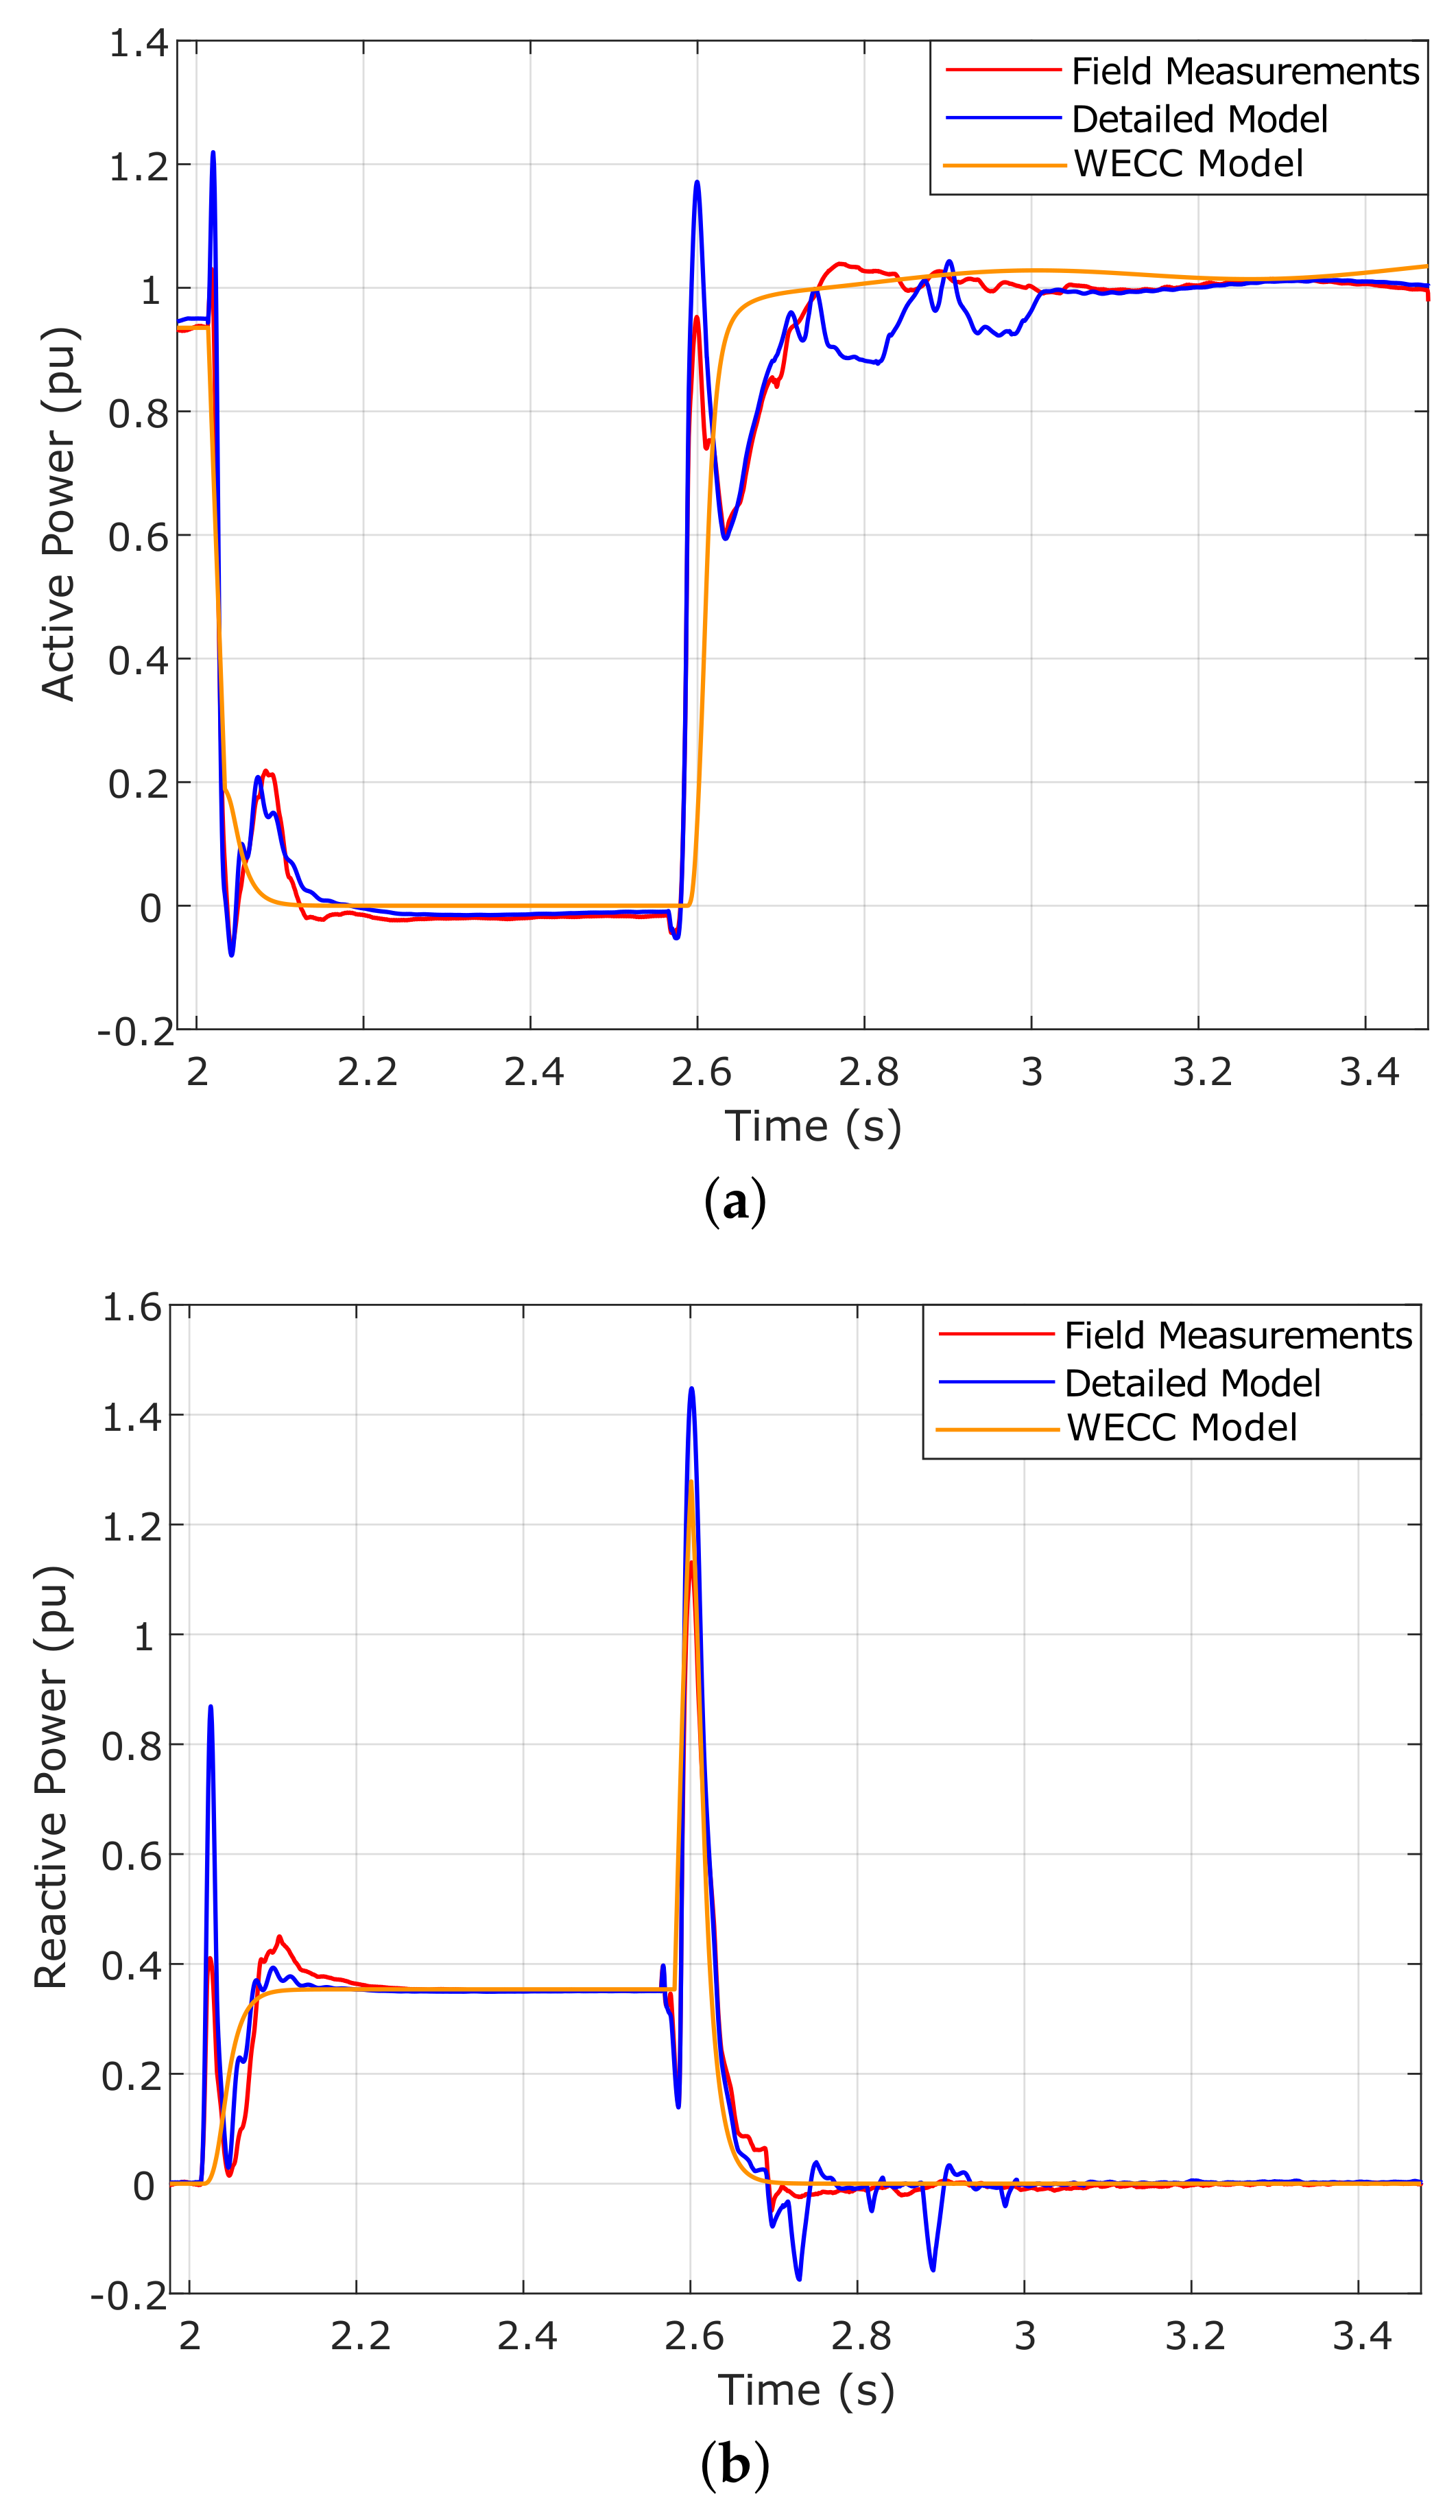
Figure 4 shows the active and reactive power responses of the WECC and detailed WT simulation models when subjected to the measured voltage dip, along with the field tests recorded at the testing point. As observed in
Figure 4a, there exists a good correlation between the active power responses of the WECC model and the field measurements. However, the largest differences were found when the fault was cleared, i.e., during the transient period responses of the generic WT model. This is because the WECC model only used a current versus voltage lookup table and a first-order filter, while the detailed model (or full-order model) included a fifth-order generator model in addition to a full-order converter controller with Proportional Integral (PI) controllers for active and reactive power models that used different parameters for normal and transient operation. Therefore, generic models are not specifically designed to represent the transient periods that appear during the operation of actual WTs. However, to improve the representation of these transient periods by the generic WECC WT while keeping its simplified approach, a modification was proposed within the
Generator/Converter Model, including an electromagnetic transient resistance, Rs, and reactance, Xs, in order to simplify modeling the transients of the actual WT.
Furthermore, those significant differences during the transient responses, also observed in the period from 2.57 s to 3.00 s in
Figure 4a between the detailed and the WECC WT models, were due to the active power control model of the full-order model WT changed from a voltage dip mode to a normal operation mode at 3.00 s. After that, the differences observed were influenced by the active power performance of the WECC WT model up to that point, which caused drive train oscillations of different phase than those observed for the full-order or detailed model and for the field tests. Moreover, there are also large differences in the
Torque Controls model and the generator speed filters between the highly simplified WECC WT model and the full-order WT model, which also contributed to those differences in the active power responses after the fault clearance.
The issues concerning the proper representation of transient periods by generic models also applies to the reactive power response of the WECC WT model. However, this situation was exacerbated by the fact that generic models are also unable to represent the fundamental component of the transformer inrush current, which in this case is reflected in the measurements. The differences in the reactive power responses can be clearly identified in
Figure 4b. Once the fault was cleared at 2.57 s, the actual WT presented a reactive power consumption peak of almost
pu and then gradually recovered, while the WECC model presented a constant consumption of reactive power during the whole post-fault period. The effects of the transformer inrush current are also supported by the graphic results in
Section 4.2, in which the LV measurement point is used to apply the validation criteria and the transformer is no longer considered,
Figure 5b.
Finally, as can also be observed in
Figure 4, both the transformer inrush current and the transient periods were reasonably well represented by the detailed WT simulation model, presenting a more accurate behavior than that of the generic WECC WT model. However, there still exist certain inevitable differences between the detailed model and the field measurements because the comparison was performed between an actual machine and a simulation model. Therefore, the detailed WT and transformer models were validated according to Spanish PO 12.3.
4.2. Verification of the PVVC Criteria at the LV Measurement Point
No additional validation analyses were required in the case of the detailed WT simulation model, since it already complied with the PVVC criteria when applied at the HV measurement—or testing—point. However, taking into account the non-compliance situation of the generic WECC model at this same measurement point,
Table 2 presents the results for the application of the PVVC validation criteria at the LV measurement point (see
Figure 2) applied to the WECC model. It is important to note that, in this case, the transformer was no longer considered in the validation process, since its effects were already reflected in the measurements performed.
Concerning the validation results shown in
Table 2, the non-compliance situation of the generic WECC model with the validation criteria was reversed in the case of reactive power, as was anticipated in
Section 4.1. While only 59% of the data series analyzed complied with the criteria at the testing point, 90% complied with the validation requirements at the LV measurement point. The WECC WT model was therefore considered validated in this case for the reactive power response.
Figure 5 shows the active and reactive power responses of both the WECC and the detailed WT simulation models when subjected to the specified fault, along with the field tests when the measurements were performed at the LV side.
The good performance of the WECC WT simulation model in the case of reactive power when the measurements were performed at the LV side is clearly corroborated by the graphic results shown in
Figure 5b. When the fault was cleared, unlike the previous case, the actual WT model did not consume reactive power (although there were still transient periods) because the effects of the fundamental component of the transformer inrush current were no longer reflected in the measurements. Therefore, the WECC WT model, which is unable to emulate those effects, fitted the field tests much better when the measurements were performed downstream the transformer.
Regarding the active power, still only 81% of the data series analyzed complied with the PVVC requirements (see
Table 2), so the non-compliance situation was not reversed in this case. As occurred when the measurement and testing points coincided, this was due to the inability of the generic WT model to emulate the transient periods of the actual WT,
Figure 5a.
4.3. Verification of the PVVC Criteria at the HV and LV Measurement Points: WT Operating at Partial Load Conditions
Section 4.1 and
Section 4.2 presented the results of the verification of the PVVC validation criteria applied to the WECC generic WT model at both the HV and LV measurement points, respectively, when the WT operates at full load conditions. The results obtained were extensively analyzed, as were the reasons that led to the situations of non-compliance.
However, in order to support the conclusions obtained and enrich the results section, a new case study was added: the verification of the PVVC criteria when the WT operates at partial load conditions of 0.20 pu. As mentioned at the beginning of
Section 4, the same three-phase voltage dip as that shown in
Figure 3 was applied on the WT operating at partial load conditions.
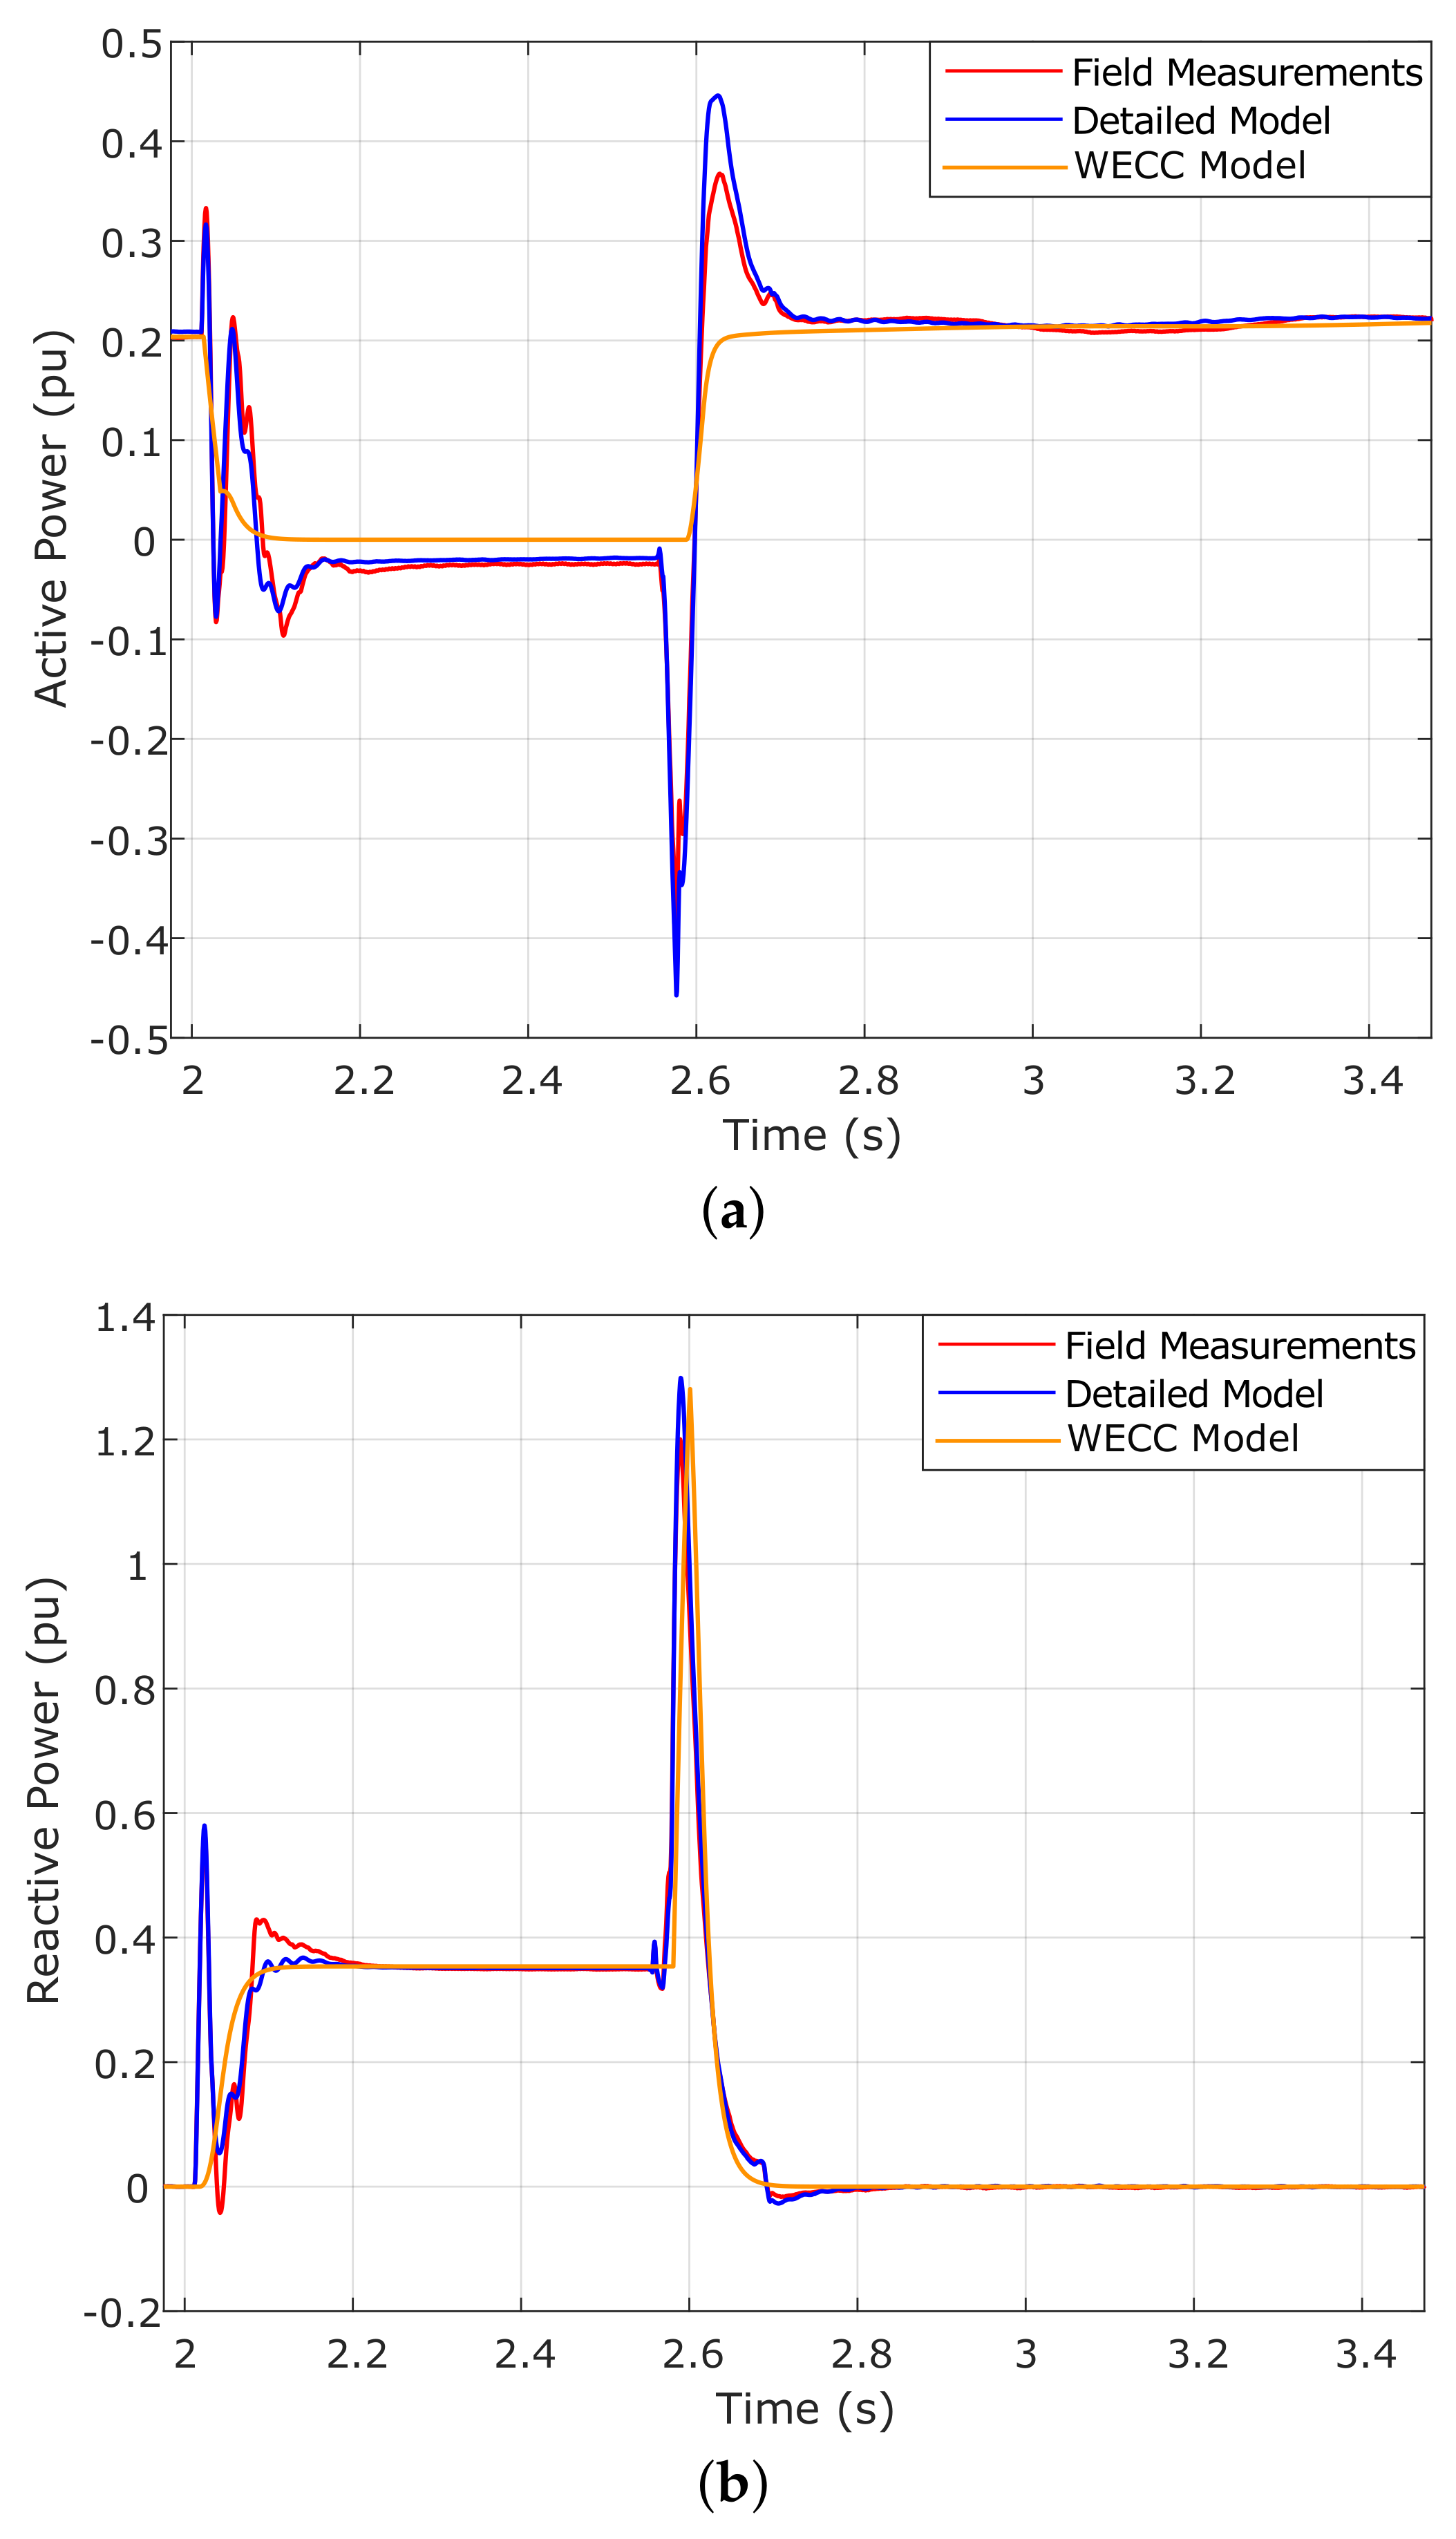
Table 3 shows the percentage of points that were below the maximum deviation allowed when the PVVC criteria was applied at the HV (or testing) point (see
Figure 2). In this case, both case did not comply with the validation criteria, since only 84% and 61% of the points within the data series analyzed present a deviation below 0.1 pu for the active and reactive power responses, respectively.
The numerical results are supported by the graphic results shown in
Figure 6. In the case of active power, as shown in
Figure 6a, the inability of the generic WT (orange line) to represent the transient periods of the actual WT (blue line), especially at the beginning and clearance of the fault, can be clearly observed. As in the case of the WT operating at full load conditions, the representation of these transient periods would improve if the
Generator/Converter Model of the WECC generic model included an electromagnetic transient resistance and reactance, as mentioned in
Section 4.1.
The reactive power response also failed to comply with the PVVC criteria when the WT operated at partial load conditions (
Figure 6b). In addition to the lack of accuracy of the generic WT model in representing the transient periods, the inability of the model to represent the transformer inrush current is also a key factor which explains the low percentage of points that comply with the validation requirements (61%,
Table 3) and the low accuracy in the reactive power response.
The largest differences were found from 2.60 s onward (
Figure 6b), since the fundamental component of the transformer inrush current is reflected in both the detailed WT model and the field measurements during that period and the WECC generic model was unable to represent it, remaining around zero.
Table 4 depicts the numerical results when the PVVC validation criteria was applied at the LV measurement point (see
Figure 2) and the WT operated at partial load conditions. In this case, both the active and the reactive power response complied with PO 12.3, since 88% and 90% of the points analyzed present a deviation below 0.1 pu. The non-compliance situations have thus reversed, and
Figure 7 supports the improved behavior of the generic WT model.
While there were no significant differences in the active power response (
Figure 7a), compared to the previous case (
Figure 6a), a meaningful improvement in the reactive power behavior was observed when the LV measurement point was considered for the application of the validation criteria (see the differences between
Figure 6b and
Figure 7b). As explained in
Section 4.2, the effects of the fundamental component of the transformer inrush current were no longer considered in the measurements and therefore the generic WECC WT model fitted better to the field tests.
5. Conclusions
The present work submitted the Type 3 WT model defined by the WECC to Spanish PO 12.3 by applying the PVVC. The WECC DFIG WT model was implemented in MATLAB/Simulink, being subjected to a three-phase voltage dip first applied and later measured at an actual Gamesa G52 WT operating at both full load and partial load conditions. Applying the validation criteria established by the PVVC, the WECC model was then compared with the measurements of the actual WT and its corresponding detailed simulation model. Furthermore, the verification of the PVVC validation criteria was applied at two different measurement points, the HV measurement point (corresponding to the testing point and considering the power transformer) and the LV measurement point (located downstream the transformer).
The detailed WT simulation model broadly complied with the validation criteria established by the PVVC for the active and the reactive power responses when applied at the HV measurement point. Hence, both the detailed WT and transformer models were considered validated according to Spanish PO 12.3.
Nevertheless, regarding the WECC generic WT model, when the criteria were applied at the HV measurement point, the requirements were not complied with, since only 81% and 59% of the points were below the maximum deviation allowed for the active and the reactive power responses, respectively. The largest differences were found, on the one hand, when the fault was cleared, i.e., during the transient periods; and, on the other hand, during the post-fault period in the reactive power response. This large difference in the reactive power responses between the field measurements and the WECC model was mainly due to the inability of the generic WT models to represent the fundamental component of the transformer inrush current. Thus, neither the generic WECC WT model nor the generic transformer were considered validated when the criteria were applied at the testing point.
On the other hand, when the PVVC validation criteria was applied at the LV measurement point, the reactive power response did comply with PO 12.3. In contrast, the active power still failed to comply with the established requirements. This non-compliance situation was again mainly due to the inaccurate representation of the transient periods. However, the present paper proposed a modeling modification to improve the representation of the transient periods that appear in the actual WT: including an electromagnetic transient resistance and reactance within the generator model of the WECC WT to be able to model the transients in a simplified way.
Finally, it must be noted that, in general terms, the same conclusions drawn from the case study in which the WT operates at full load conditions can be extrapolated to the results obtained when the WT operates at partial load conditions.

 ,
, 


