Article

Development of a Calibrated Simulation Method for Airborne Particles to Optimize Energy Consumption in Operating Rooms

by
Lara Febrero-Garrido
1,*,
José Luis López-González
2,
Pablo Eguía-Oller
3 and
Enrique Granada-Álvarez
3
1
Defense University Center, Spanish Naval Academy, Plaza de España, s/n, 36920 Marín, Spain
2
SERGAS, Xunta de Galicia, Edificio Administrativo San Lázaro, s/n, 15703 Santiago de Compostela, Spain
3
Department of Mechanical Engineering, Heat Engines and Fluid Mechanics, Industrial Engineering School, University of Vigo, 36310 Vigo, Spain
*
Author to whom correspondence should be addressed.
Energies 2019, 12(12), 2433; https://doi.org/10.3390/en12122433
Submission received: 7 June 2019 / Revised: 21 June 2019 / Accepted: 21 June 2019 / Published: 24 June 2019
(This article belongs to the Section G: Energy and Buildings)

Abstract

:
Operating rooms are stringent controlled environments. All influential factors, in particular, airborne particles, must be within the limits established by regulations. Therefore, energy efficiency stays in the background, prioritizing safety and comfort in surgical areas. However, the potential of improvement in energy savings without compromising this safety is broad. This work presents a new procedure, based on calibrated simulations, that allows the identification of potential energy savings in an operating room, complying with current airborne particle standards. Dynamic energy and airborne particle models are developed and then simulated in TRNSYS and calibrated with GenOpt. The methodology is validated through experimental contrast with a real operating room of a hospital in Spain. A calibrated model with around 2% of error is achieved. The procedure determines the variation in particle concentration according to the flow rate of ventilation supplied and the occupancy of the operating room. In conclusion, energy savings up to 51% are possible, reducing ventilation by 50% while complying with airborne particles standards.

1. Introduction

Healthcare buildings are major energy consumers, representing 6% of the total energy consumption in the service sector [1]. These healthcare buildings encompass small clinics, health centers and large hospitals, and they are characterized by a high occupancy, high-energy consumption per area and strict air indoor quality (IAQ) requirements. Heating, ventilation and air conditioning (HVAC) systems are the major contributors [1,2]. In Spain, HVAC systems represent 40% of energy use in hospitals [3]. In addition, hospitals account for 9% of all thermal and electrical consumption of the service sector in Spain [4]. Therefore, the energy saving potential is large. However, this high-energy consumption stays in the background, prioritizing other issues such as safety, IAQ conditions and comfortable environment. The HVAC systems in buildings are designed to maintain adequate thermal comfort conditions and appropriate air quality [5]. These conditions acquire special relevance in the surgical suites of a hospital, especially in operating rooms (ORs). They must be kept within limits that allow minimizing the risks of infections, preventing the growth and spread of bacteria and viruses, and maximizing the comfort of patients and health staff. The environment must remain aseptic, preventing any risk of cross-contamination [6]. The most effective way to control these conditions is the application of ventilation systems [7] that maintain high air changes per hour (ACH), as the adequate distribution of clean air allows the isolation and dilution of infectious particles in ORs [8].
The environmental conditions of temperature, relative humidity, concentration of pathogenic particles and concentration of residual gases, coming from the anesthesia of the patient or other surgical procedures, within an OR are strictly delimited by international and national regulations, in order to guarantee the asepsis and comfort indoors. In particular, in Spain, the UNE 100713: 2005 standard, about air conditioning in hospital, establishes the requirements of HVAC systems in hospitals in relation to ventilation, indicating the minimum ACH [9]. In turn, the international standard, ISO 14644-1: 2015, establishes a classification of cleanrooms according to the type of surgeries carried out, and sets ventilation conditions to guarantee low levels of pathogenic particle concentration [10]. Recommended indoor conditions for ORs are different depending on the country considered. González et al. [11] describe in their work different conditions for several countries. In particular, ORs in Spain must be maintained with ventilation rate of 20 ACH or 2400 m3/h [9]. On the other hand, the standard UNE 171340: 2012 “Validation and evaluation of controlled environment rooms in hospitals” aims to establish some fundamental control principles, criteria and a testing methodology, including its periodicity, with a standardize system, to validate the proper functioning of the controlled environment rooms in health centers [12].
Several authors have studied energy efficiency in hospitals [1,3,13,14,15]. Some practical recommendations for energy savings in hospitals are evaluated in [15]. González-González et al. [3] studied 20 hospitals in Spain to find a correlation between gross domestic product (GDP), number of beds, number of people, hospital surface area, energy use and weather conditions. García-Sanz-Calcedo et al. [13] evaluated 70 health centers in Spain and revealed relationships between morphological and functional parameters with their energy consumption and emissions. A review about HVAC systems in hospitals [1] revealed that variable refrigerant flow (VRF) technology allows higher energy and cost savings compared to conventional HVAC systems. Nevertheless, to determine energy savings in a hospital, first, an accurate calculation of energy consumption has to be made. Congradac et al. [14] created a mathematical tool for the accurate calculation of energy demands in hospitals. Implementing simple energy conservation measures (ECM) in hospitals can save up to 10% of energy consumption [15]. However, there are few studies about energy efficiency focused on surgical suites and ORs even though they are the biggest consumers, and therefore, they have a greater capacity for improvement [5,11,16,17]. In addition, the works carried out are primarily focused on ventilation systems [5,17], as guidelines for ORs require keeping them at overpressure with respect to adjacent rooms, but do not suggest a specific ventilation strategy to address this issue [18]. The standards define limits for temperatures, relative humidity, ACH, types of filters, air pressure in relation to adjacent areas and the cases when the air may be recirculated [19]. Within the IAQ in ORs, the concentration of airborne particles takes on special importance. One of the objectives of this study is the in-depth analysis of the regulations in this regard, the limits established in terms of different scenarios and the latest studies related to particles. Therefore, the state of the art of airborne particles is presented in detail in Section 2.
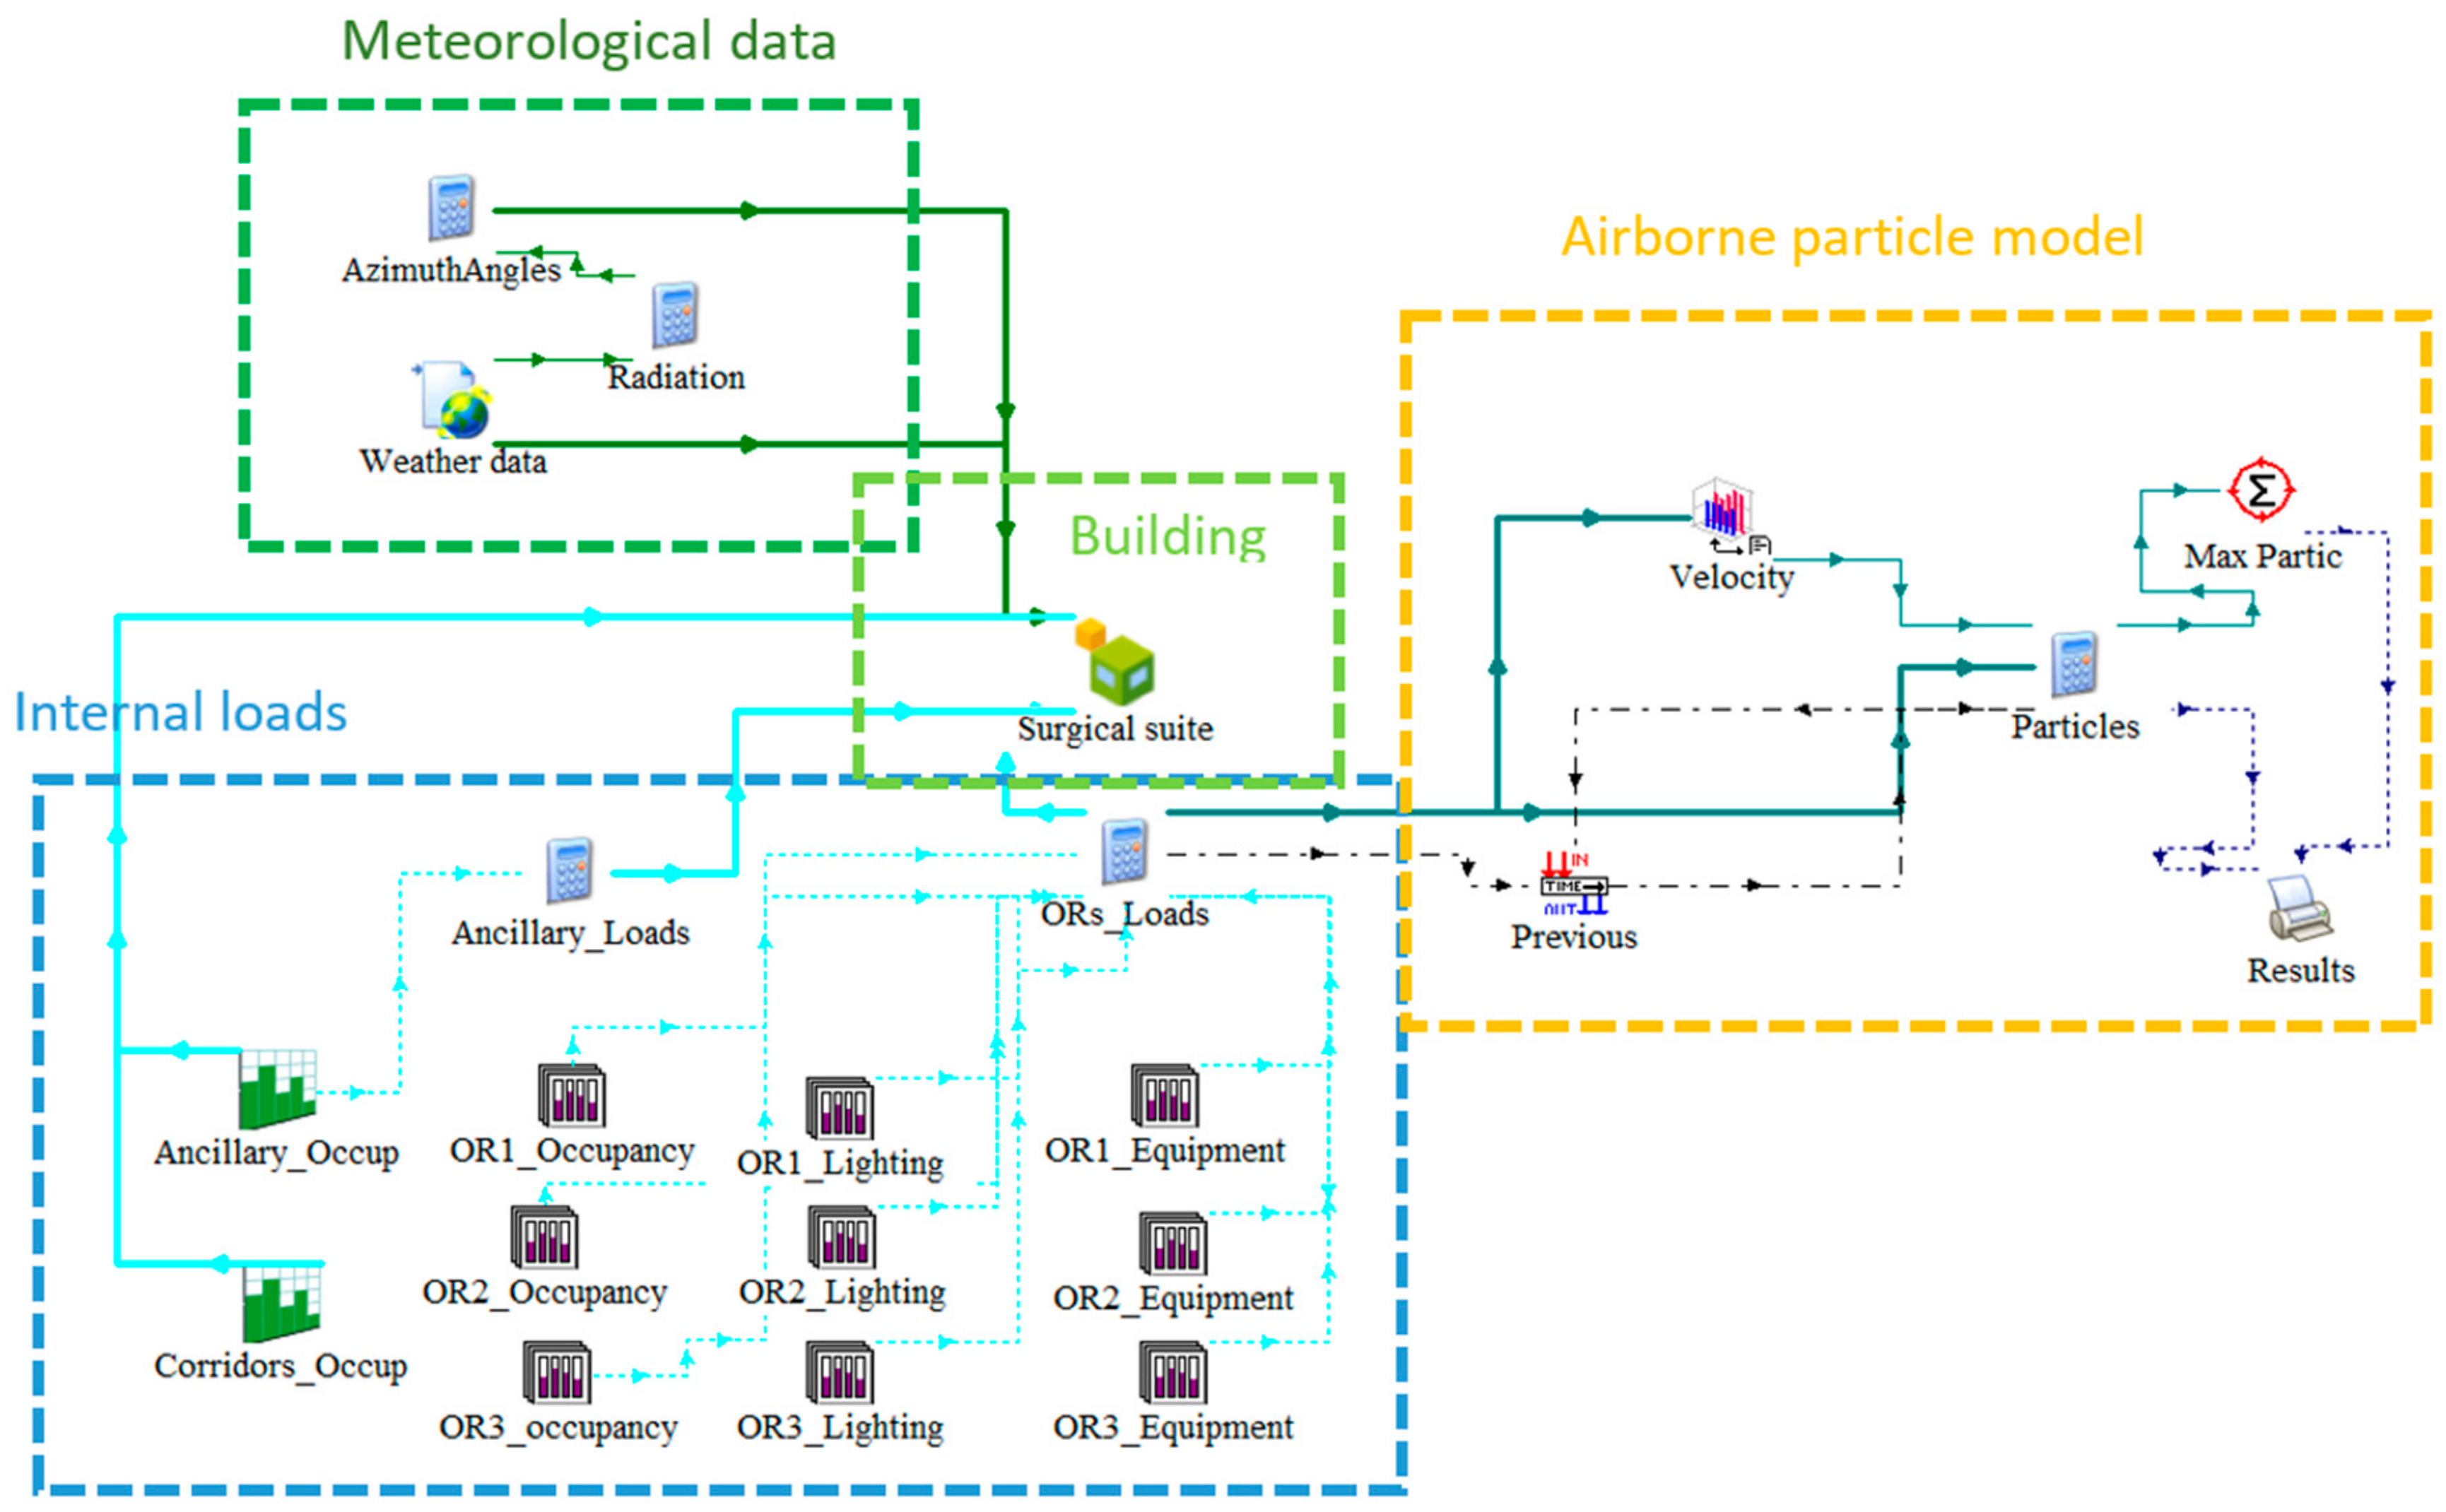
Everything indicates, therefore, that there is considerable scope for improving the energy efficiency in surgical suites by decreasing their ventilation loads, but keeping standards. The main objective of the present work is to propose a methodology to assess conditions and to determine potential energy savings by reducing ventilation flow rates, without compromising patient and health staff safety or IAQ, and complying with national and international standards and codes. A dynamic energy model and a particle model were built and simulated using TRNSYS. Then, models were calibrated with the optimization tool GenOpt. The results were validated by the implementation of a continuous monitoring campaign collecting experimental data. The main novelties of this study are its originality, its multidisciplinary capacity and its accessible, exportable methodology applicable to any other area in the hospital. This would allow a holistic view of potential savings.
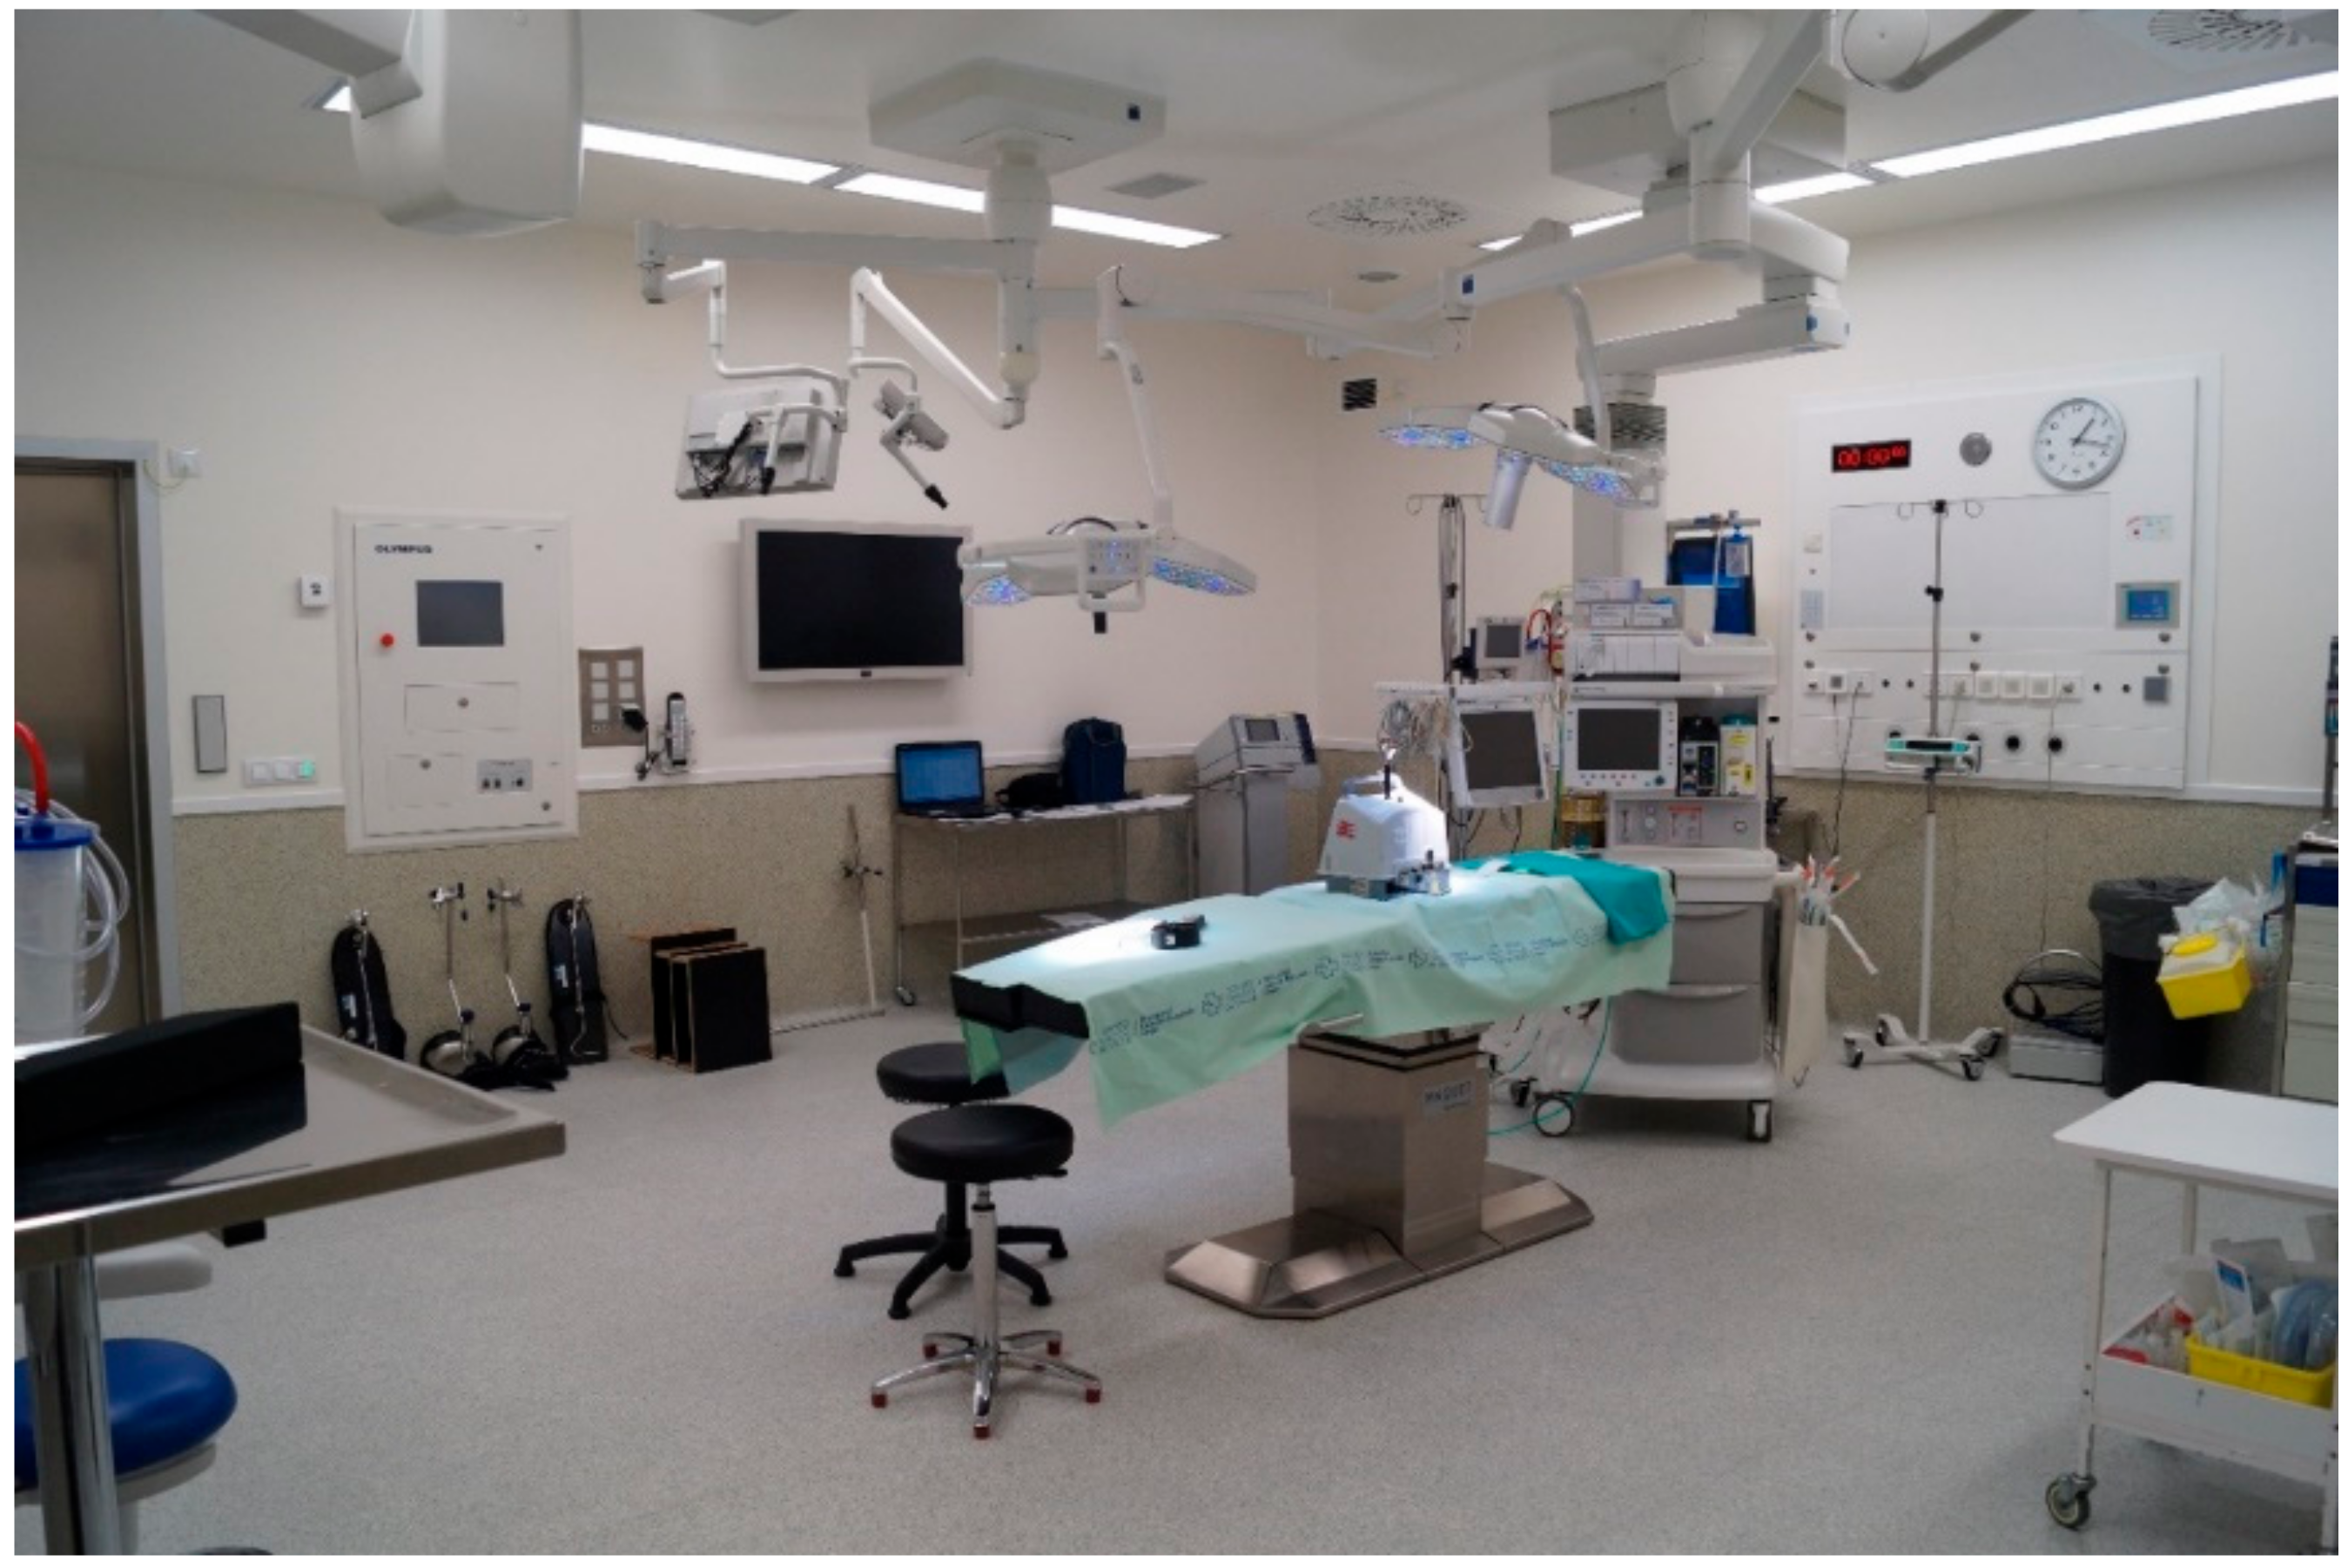
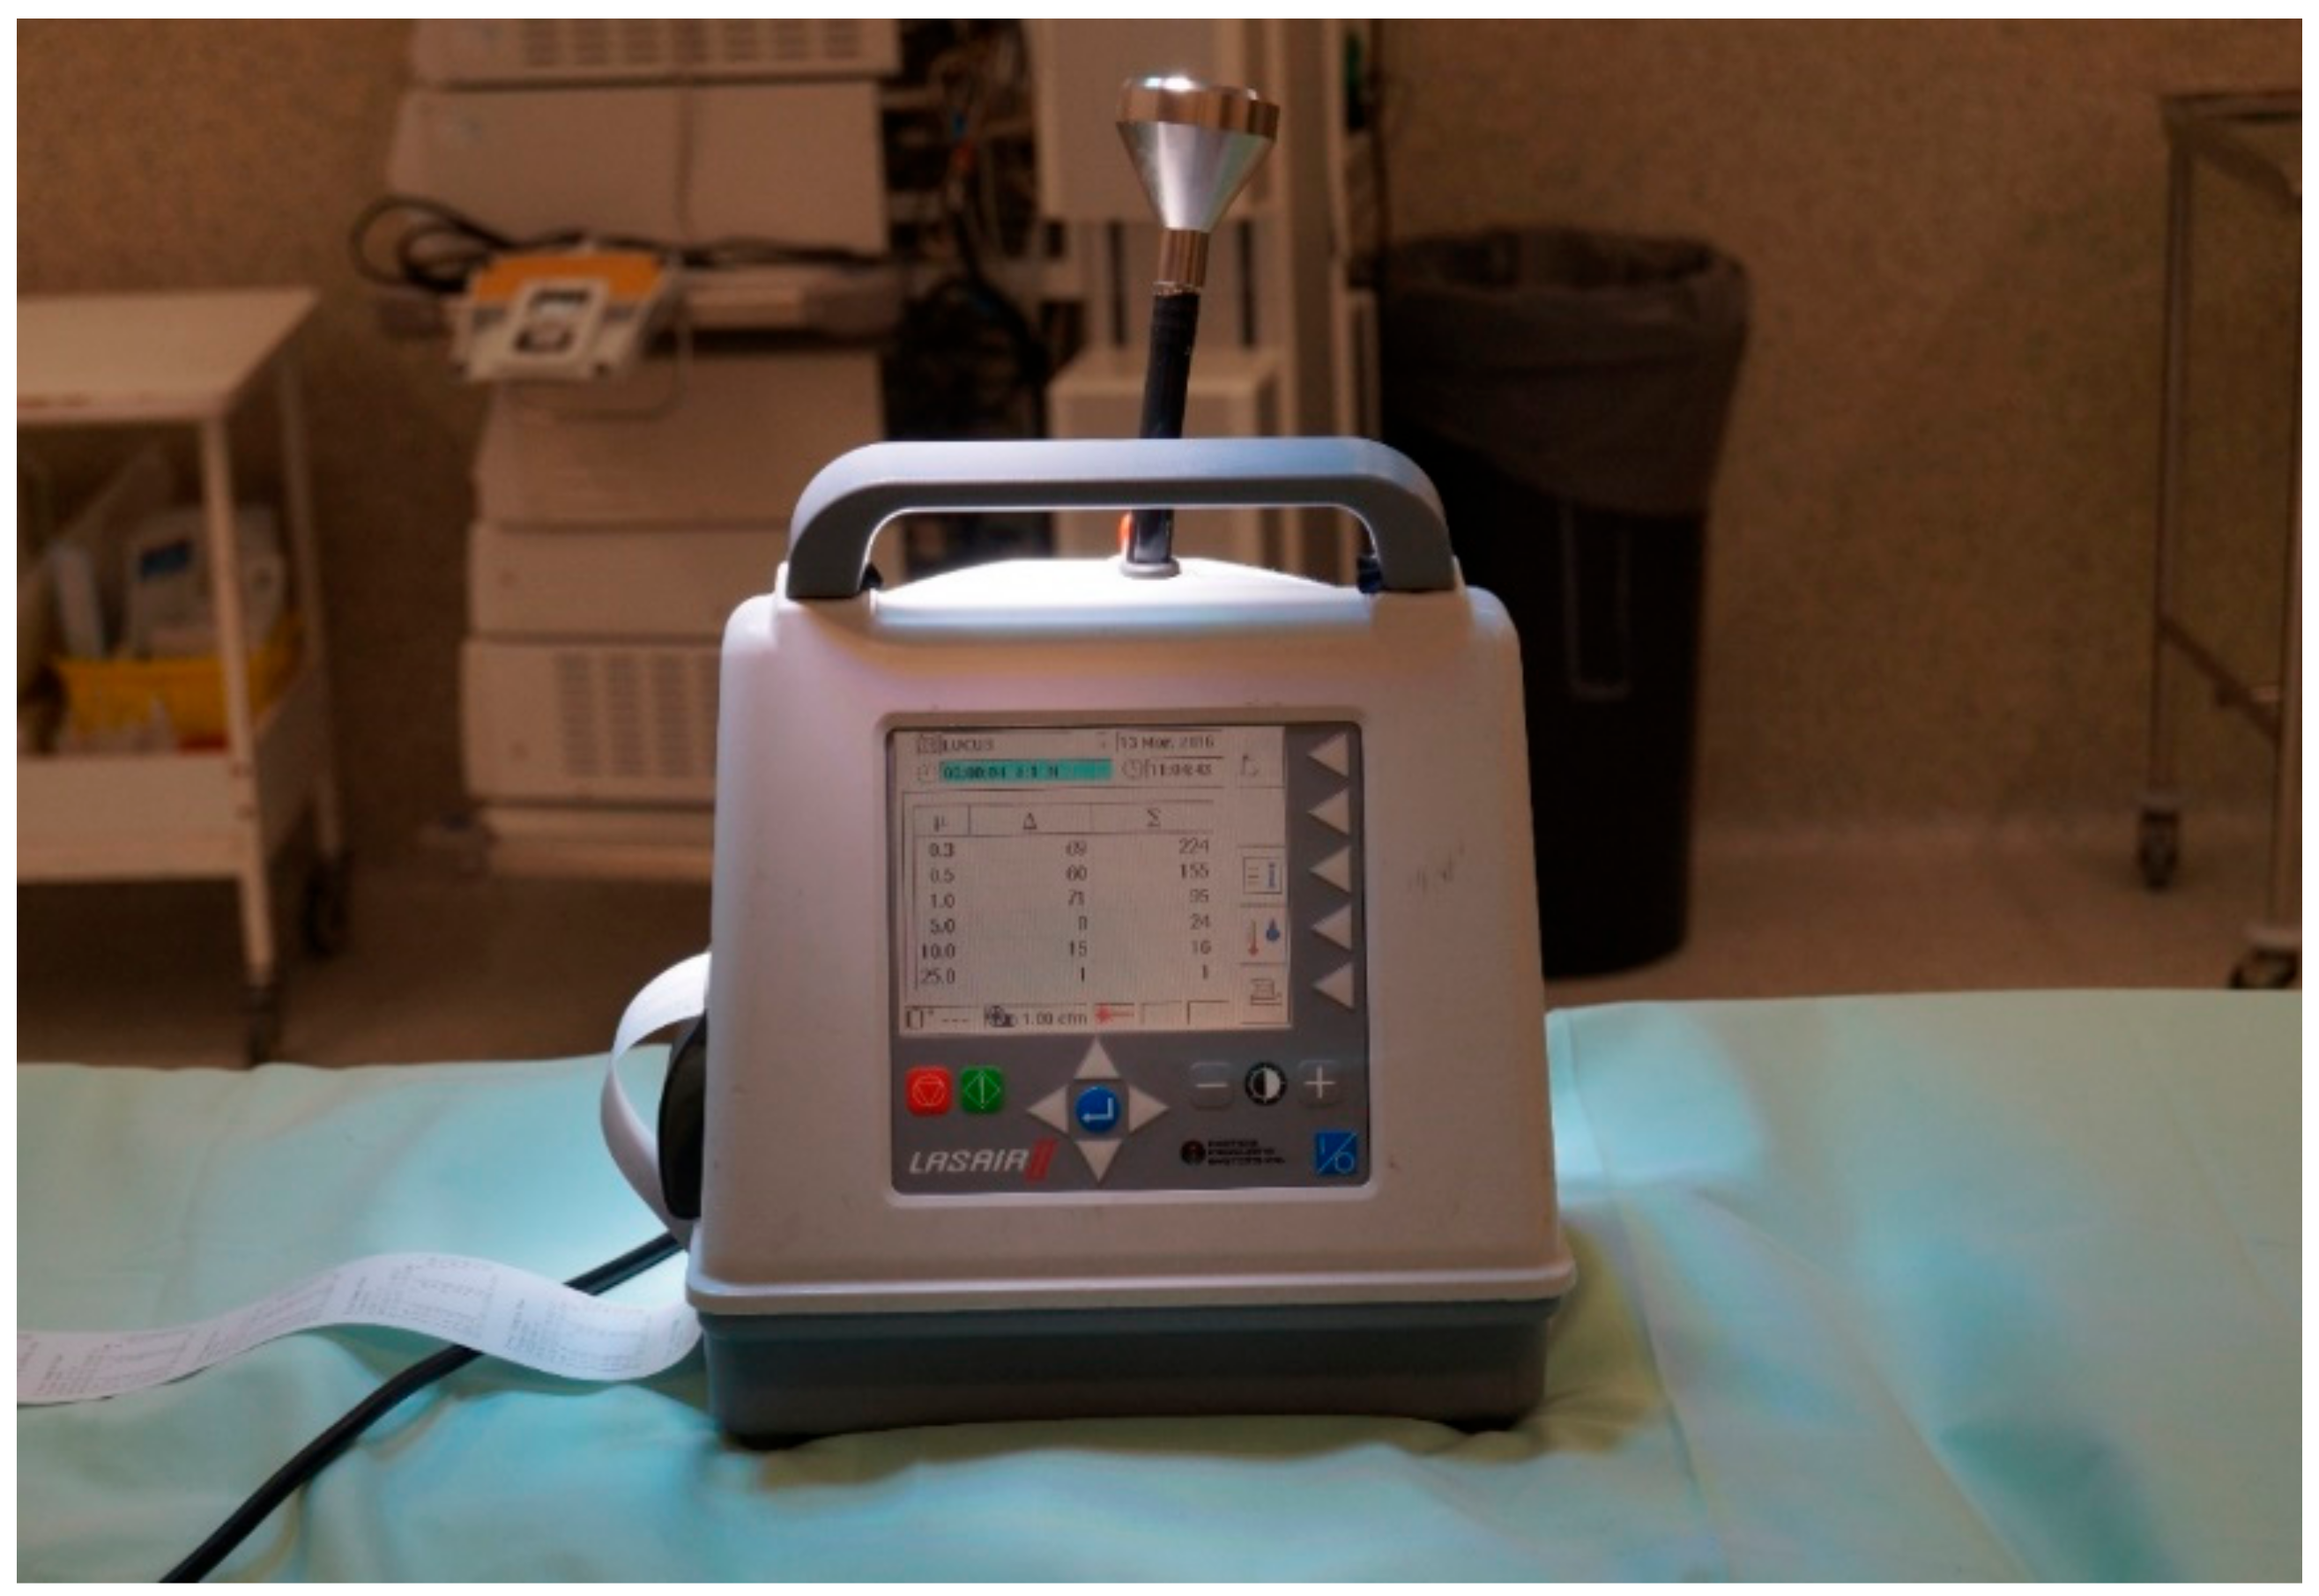
The structure of the paper is the following. The article starts with an introduction to the topic of energy efficiency in hospitals, specifically in ORs. Then, a section about state of the art of airborne particles in ORs is presented, describing details of the Spanish regulation. Next, materials and methods are explained, the description of the surgical area and the OR studied, the experimental setup and the dynamic energy and particle model simulated using TRNSYS and calibrated with GenOpt. Then, experimental and simulated results are discussed. Finally, some conclusions are presented.

2. State of the Art of Airborne Particles in Operating Rooms: The Case in Spain

The final energy consumption in Spain in 2016 was 82,333 ktoe, of which 10,627 ktoe (12.9%) corresponds to consumption in the service sector, where hospitals belong. Assuming that the consumption in these buildings is 1067 ktoe (1.3%), the thermal energy results in 549 ktoe [
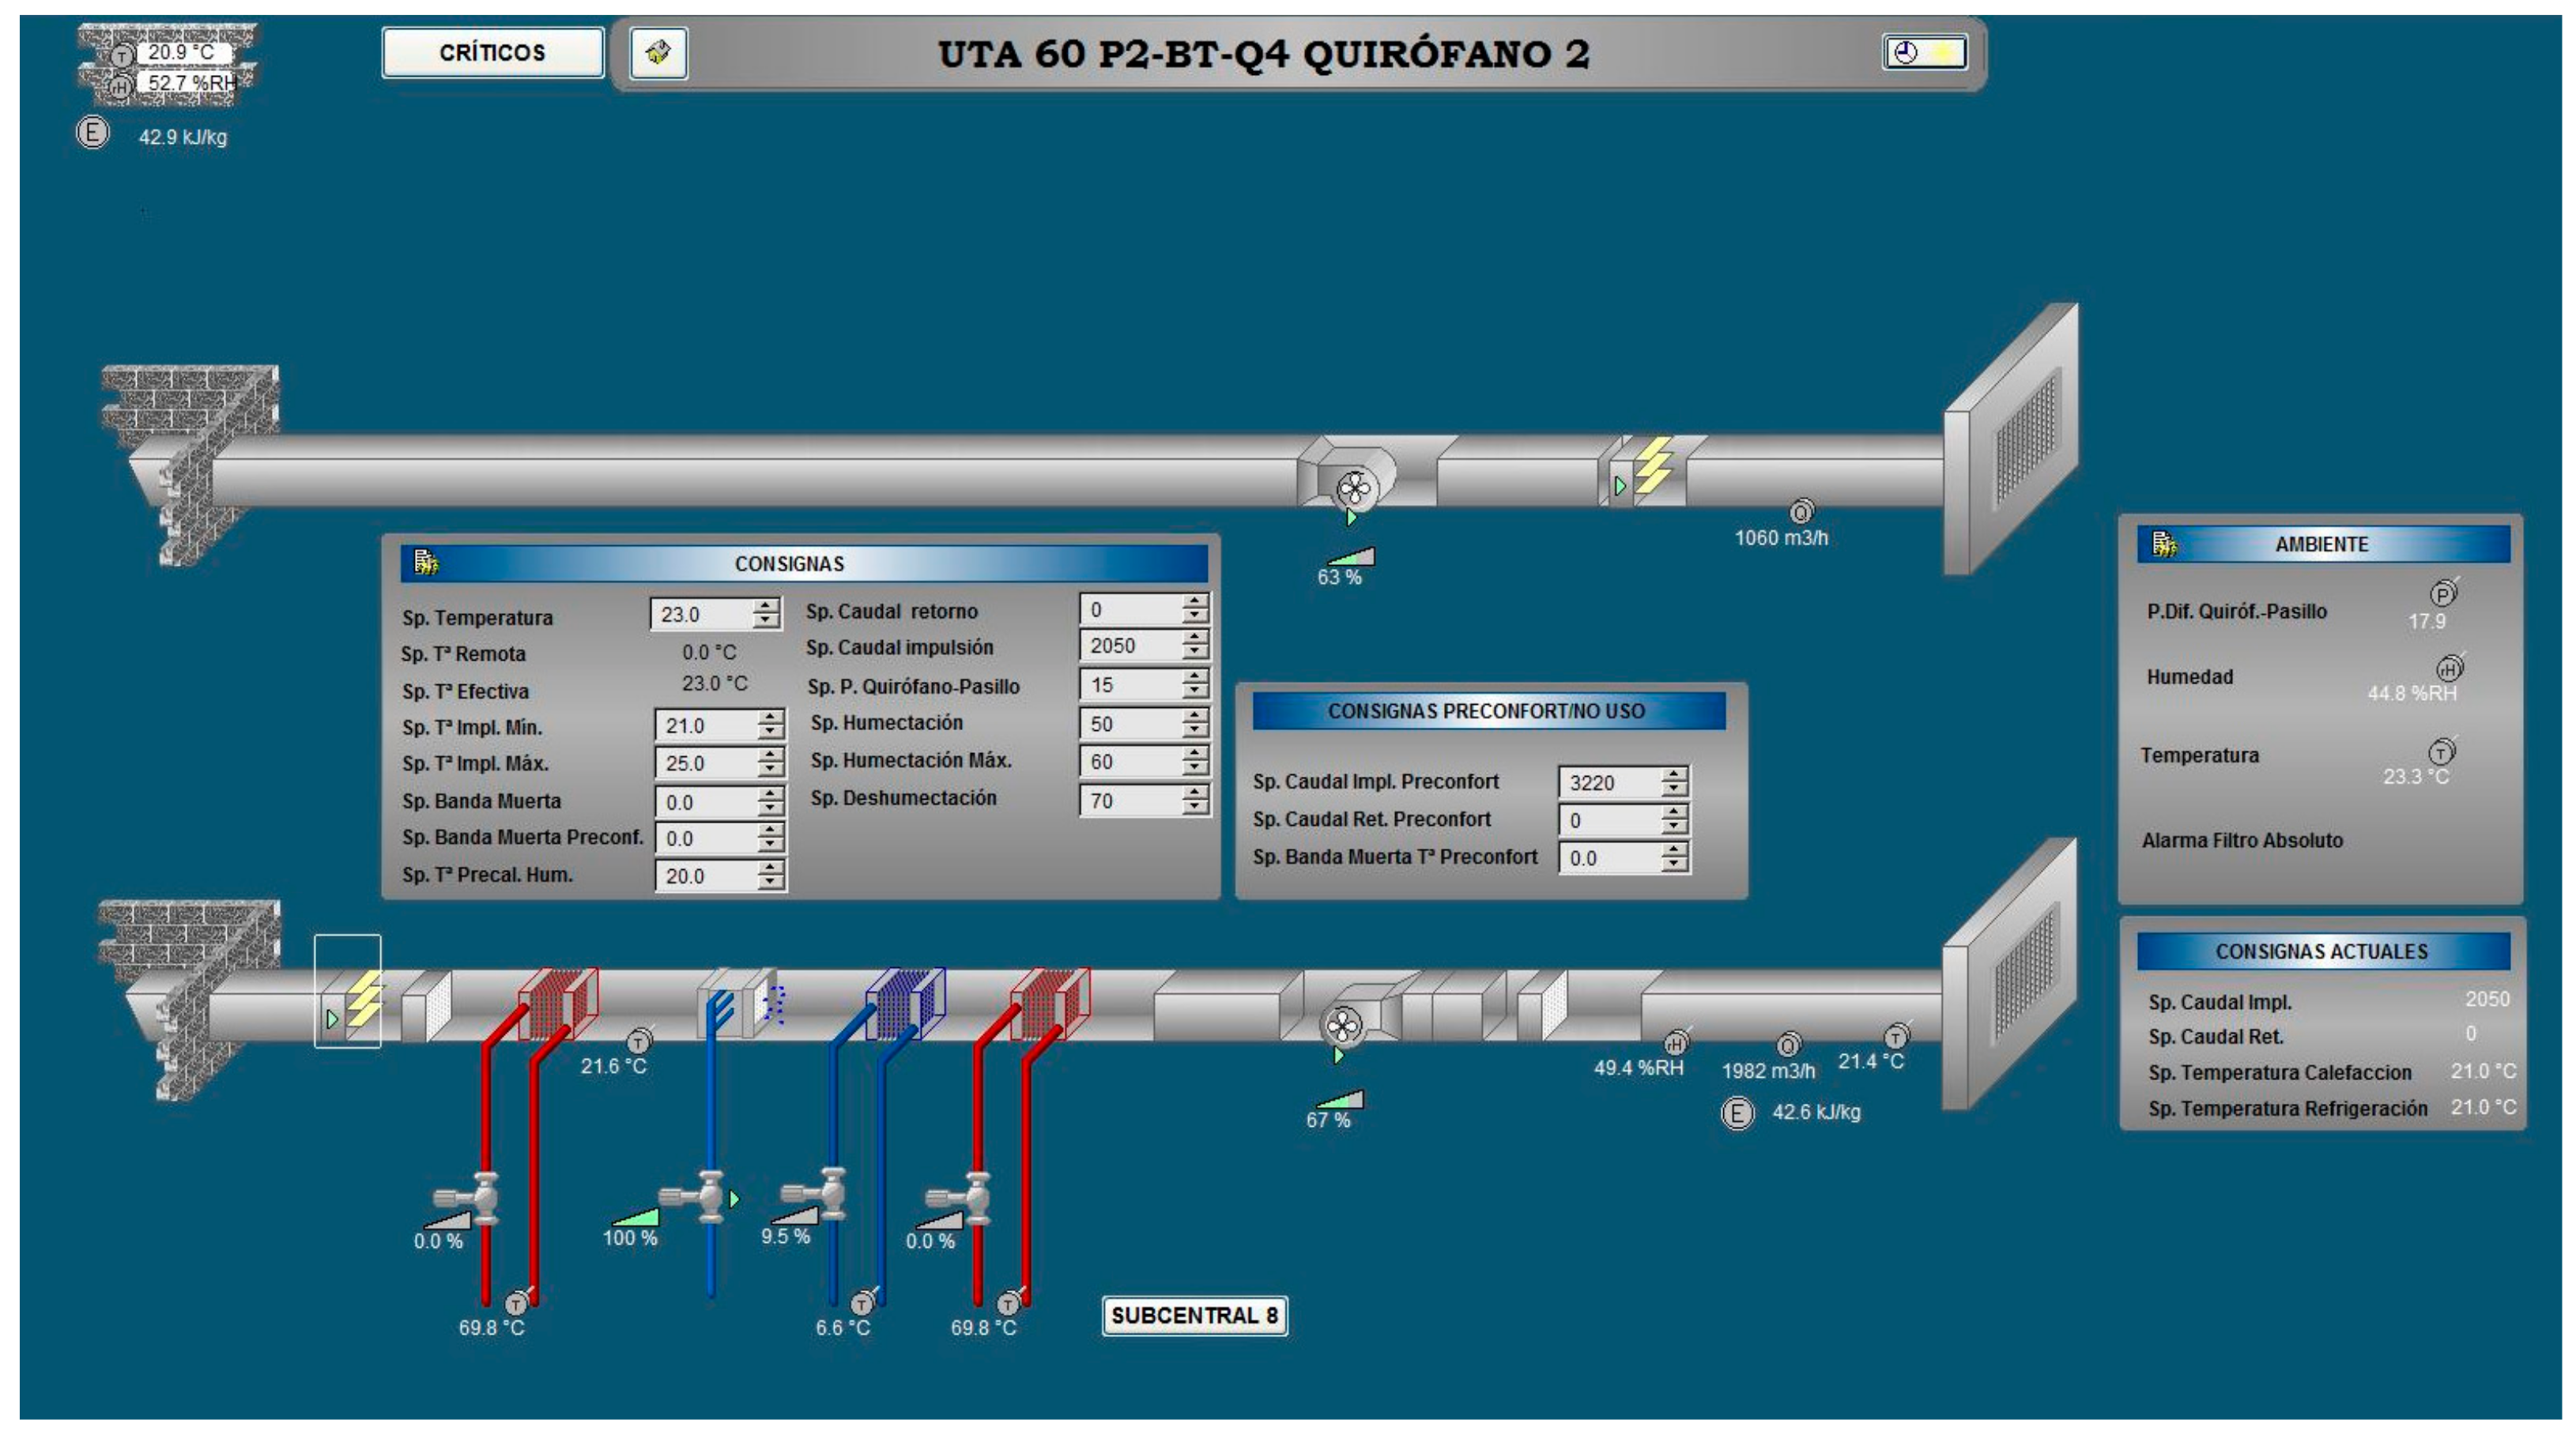
20]. The studied hospital is located in Galicia, a northern area of Spain. In 2016, the energy consumption in the Galician Health Service was 28.09 ktoe, of which the thermal energy consumption was 14.55 ktoe. The thermal energy demand in hospitals occurs mainly in HVAC systems. These facilities of complex design must respond not only to the requirements of the comfort conditions of users and workers, which in the case of Spain are defined in the RITE (Regulation of thermal installations in buildings) [21], but also to environmental safety conditions. The UNE 100713: 2005 standard [9] establishes the specific conditions that must govern air conditioning installations in hospitals in terms of thermal comfort and air quality, defining the requirements in terms of airflow, temperature, humidity and sound pressure in each of the units, and the flow directions in the ORs and filtration levels.
Particle concentration is regulated by national and international standards. The international standard ISO 14644-1: 2015 [10] establishes a classification of clean rooms to control pollution by particles transported by air, based on their size (from 0.1 μm to 5 μm) and their quantification. It is used for the control of industrial processes, pharmacological processes and in health services. This standard establishes the maximum allowable concentrations for particles considering particle sizes and considering “ISO Class number”. The standard UNE 171340: 2012 establishes this classification of spaces [12]. It validates the controlled environment rooms in hospitals, including ORs. It establishes a classification according to their risks, types of ventilation and associated filtration. This classification establishes that the transplant ORs, placement of prostheses, etc. are considered very high-risk areas, and conventional surgery ORs are considered high-risk areas. The validation of the rooms is done by analyzing several environmental parameters such as temperature, relative humidity, microbiology, particles, noise, and other installation parameters such as differential pressure, absolute filter placement, airflow rates, ACH, airflow direction and recovery of the room. The room classification test is especially relevant. It is based on determining the cleanliness of the room by counting airborne particles as indicated in ISO 14644-1: 2015. The classification is the following: ISO 5 - ISO 6 for A-class ORs or high technology and very high risk areas, ISO 7 for B-class ORs and high risk areas, and ISO 8 for C-class ORs and medium risk areas. These established limits can be observed in Table 1.
This set of standards determines the need to control and ensure the environmental and thermal comfort conditions of hospitals but mainly to reduce or minimize the possibility of contracting nosocomial infections in clinical events. To meet these conditions, the requirements of the standards go beyond those required for a conventional building, significantly influencing the increase in energy demand ratios compared to the latter. In the scientific literature it has not been proven that there is a direct relationship between the number of particles present in an OR and the degree of microbial contamination in the OR, although from a statistical point of view the probability of finding microbial agents increases in rooms with a high concentration of particles [22].
Some authors have studied particles in hospitals. Appropriate ventilation is necessary for isolating and decreasing airborne particles in a hospital OR [23]. The ventilation system of an OR is usually placed over the operating table, with downward flow, using high efficiency particulate air (HEPA) filtering and ultra-low particulate air (ULPA) filters to maintain low particle concentrations [24,25]. Regarding particles, in an OR, many variables have to be taken into account. A walking person has an emission ratio of approximately 10,000 particles in a minute, with a size between 2.5 μm and 20 μm; moreover, between 5% and 10% of these particles can transport bacteria [24]. On the other hand, a standing person can release up to 1000 particles in a minute [24]. Other authors have considered that the medical staff emit between 200 and 400 particles carrying bacteria per minute of an average size of 6 μm [7,26]. The patient receives a process of superficial sterilization much more exhaustive than the medical staff, and the patient movement during the operation is minimal, the reason why it is disregarded as a source of particles. In addition, to study particle concentration, obstacles and sources of heat have to be identified, as well as the speed of entry and the percentage of recirculated air. Chow et al. [24] analyzed the airflow inside an OR and reduced the airflow to 50% during the hours of inactivity to increase energy efficiency. Rui et al. [26] analyzed the movement of bacteria carrying particles in two ORs with ISO 5 and ISO 6 classifications using computational fluids dynamics (CFD). Liu et al. [7] simulated airborne particles in an OR with horizontal airflow and concluded that maintaining a low particle concentration around the patient is associated with the distribution of the OR and the position of the source, making sure that this source of particles is in a downstream position of the wound area. CFD was also used to explore the influence of lamps and human body surface temperatures on particle distribution and concentration, simulating the movement of the airborne particle of size 5 μm [23]. Results of CFD simulations demonstrate that when the surgical lamp is 45 °C and staff surface temperatures are 37 °C, more particles appear on the floor of the operating table. On average, the particle concentration in the area of the operating table rises by 16% [23]. CFD can be used to analyze the airborne particle concentration, and Kircher et al. [25] used TRNSYS, achieving less than 8% error in results. They validated the model based on metered steam, chilled water and electricity use.

3. Materials and Methods

3.1. Experimental Description and Procedure

In this section, experimental facilities are described. The hospital, the surgical suit, the OR and their facilities are briefly explained. In addition, the experimental setup, the measurement equipment and the procedure are presented.

3.1.1. Brief Overview of the Surgical Suite

The Lucus Augusti University Hospital (HULA) is a hospital located in Lugo, a small city in the northwest of Spain. Lugo’s climate is categorized as warm and temperate. The rainfall in Lugo is important, with precipitation even during the driest month. The hospital is further described in [11]. The HULA has a gross floor area of 185,000 m2. The hospital has between 2000 and 2500 employees, of which 386 are doctors. It has about 850 beds and supports an average of 13,500 surgical interventions per year, of which three quarters are scheduled. The hospital has an average energy consumption of 300 kWh/m2 in a year, i.e., 22 €/m2. As for energy aspects, HULA has contracted a power of 17 MW, with annual consumption of 22.5 GWh in electricity and 33 GWh of thermal energy, which yields an energy bill of 4.1 M€ per year.
In particular, the surgical area has six surgical suites and four dedicated ORs. Moreover, each surgical suit has three ORs. Therefore, there are 22 ORs. One of the surgical suites is selected to apply a thermal analysis. The surgical suite consists of a sterile entrance corridor, an unsterile exit corridor and a surgical area consisting of three ORs, a pre-anesthesia room, two scrub rooms and a hall. Therefore, the energetic analysis is implemented over the surgical suit, but only one of the ORs is selected for the particle study, specifically, OR number two. A general view of the OR can be observed in Figure 1. The dimensions of the OR are an area of 44.56 m2, and a volume of 135.9 m3. The construction characteristics of the surgical suite can be consulted in [11]. The interior walls are based on conductive polyvinyl chloride (PVC) on the ground and vertical walls up to a height of 1.2 m. The rest of the vertical walls and ceiling are finished with painted plasterboard plates.
• Lighting and electrical equipment
Regarding the lighting, each OR has eight fluorescent lamps of 840 W in total and two LED OR lamps of 100 W and 160 respectively; the auxiliary rooms have 1500 W of lighting and corridors 1000 W of lighting. The electrical equipment and the electric power consumed by the equipment of the OR can be observed in Table 2. Although the total consumption has a considerably high value, it is important to notice that not all the equipment works simultaneously or constantly during a surgical intervention, depending on the type of operation carried out and varying during the course of it.
• HVAC equipment
Most ORs use a downward unidirectional laminar flow in the area of the operating table to protect the patient [23,27]. However, the unidirectional downward airflow can effortlessly be deflected because of the buoyancy force caused by heated surfaces such as people and lamp surfaces [23]. The HVAC system in the analyzed OR works with multidirectional airflow and it is equipped with HEPA filters. The supply air outlets are composed of radial flow diffusers roof-mounted, with HEPA type filters connected before each of the diffusers [23]. The HEPA filters installed are HEPA H14 based on UNE-EN 1822-1:2010 [28] and they are designed to filter 99.995% of particles. The UNE 171340: 2012 [12] standard establishes that very high-risk ORs must have laminar flow, so we must consider the OR 2 as a high-risk OR and therefore we should consider the room as ISO 7. The surgical suite has six air-handling units (AHU), one for each of the OR, one for each corridor and one in the common area.

3.1.2. Experimental Setup and Measurement Procedure

Two main setups are developed. First, the energy measurement of the surgical suite. The experimental setup and measurement procedure are briefly presented in this article and further described in [11]. However, in this work, a new experimental setup and measurement procedure are included: the particle measurement.
• Energy measurement
A five-minute data record of a SCADA system of the HVAC system was made during a period of 12 days, from 5 May 2016 at 00:00 to 18 May 2016 at 23:00. The SCADA system consists of a Siemens PXC64-U automation station and the graphic environment DDESIGO INSIGHT V4.1.1 as observed in Figure 2. The measured variables in the surgical suite were temperature, relative humidity, supply airflow rate and return airflow rate of the AHUs, enthalpy and daily electrical consumption in the ORs. The records have been obtained through the installation of computerized technical control and management materialized by the following equipment and sensors in the AHU showed in Table 3. Likewise, the activity of the ORs was recorded, recording the internal loads (occupation, lighting and equipment) of each one during the operations and with the OR out of use, which occurs in the evenings as well as on weekends and holidays. Further description of the energy measurement is explained in [11].
• Particle measurement
The experimental process to evaluate the thermal, environmental and number of particles, existing in an OR under different conditions and in variable ventilation and occupation conditions, has been developed in the OR 2 of the surgical block described in previous sections and in the absence of real activity, for security reasons. The chosen date was Sunday, 13 March 2016, and the experimental data were obtained and registered from 10:53 to 14:42, with a time-step of 1 min. The variable analyzed in this investigation is the number of airborne particles existing in the OR based on different ventilation rates measured as ACH and the occupancy measured as the number of people. The size of the analyzed particles is 0.5 μm and 5 μm, and their quantity is determined by the particle counter “Particle Measuring Systems”, model Lasair II 310ª, serial number 41670, located at the midpoint of the surgical table (Figure 3).
The measurement of the number of particles is performed for different ventilation rates of the OR (ACH: 25, 18, 12 and 9), keeping the supply and return airflow rates of the OR constant and varying the number of people present in the same (0, 1, 4 and 8 people). The particle measurement is done following the Spanish standard UNE 171340:2012 “Validation and evaluation of controlled environment rooms in hospitals” [12]. It is based also in ISO 14644-1: 1999 “Clean rooms and ancillary rooms. Part 1: Classification of air cleaning” [29] and ISO 14644-2: 2000 “Clean rooms and controlled ancillary rooms. Part 2: Specifications for testing and control to verify continued compliance with ISO 14644-1” [30]. The standard UNE 171340:2012 [12] regulates the classification test of controlled environments by measuring the number of particles from 0.3 μm to 10 μm. The standard ISO 14644-3: 2006 “Cleanrooms and associated controlled environments. Part 3: Test methods” [31] is used as reference document for the realization of the test. Only areas corresponding to class I of standard UNE 100713: 2005 [9] are classified, that is, the ones that have three stages of filtration, the last with an absolute filter or HEPA. The purpose of the test is to classify the rooms by the number and size of particles, in order to determine the cleanliness of the air. A particle counter is used and it registers the number and size of particles, with the ability to differentiate the size of the particles for the class considered and with a suitable system for sampling, which must be calibrated annually. In the preparation of the test, it is ensured that the air conditioning equipment is in operation, the room is clean and in use, confirming that the HEPA filtration system is installed and without leaks. The test is performed by stationary measurement in the room to be studied and the samples are taken at an approximate height of the surgical table. The number of samples in the room must be N = √A, where N stands for the number of samples and A is the surface of the room. The volume of air at each point must be VS (Equation (1)), where VS is the minimum airflow, Cn,m is the class limit and 20 is the number of particles that can be counted with the concentration of the class limit.
V s = 20 C n , m · 1000 · C ,

3.2. Calibrated Simulation: Dynamic Modelling and Calibration Methodology

Two dynamic models are implemented and analyzed together, an energy model of the surgical suite and a particle model of the OR. After that, both models are calibrated in order to assure reliability. Therefore, the virtual procedure is described in this section.

3.2.1. Dynamic Modelling

The thermal model of the surgical suite was developed in a previous article [11] and it is used in this article with a new airborne particle model that is implemented for this study. Both dynamic models are implemented in TRNSYS. Few authors have used TRNSYS to study this kind of issue [11,25], since using CFD is much more usual [17,24,32,33,34,35,36]. The main advantage of the simulation with TRNSYS is the ability to easily obtain results for a full year and its simplicity and speed of calculation. TRNSYS is software created by the University of Wisconsin, Madison, and it is used to simulate the performance of transient systems [37]. The program has a modular structure that solves complex situations by separating the model into graphically interconnected components called types [38]. The energy model of the entire surgical suite was simulated and calibrated in a previous article [11]. This model was taken as a starting point and then expanded and complemented with an airborne particle model. To generate this model of particles in TRNSYS, the data collected experimentally are used. Using a spreadsheet, the data collected in the particle measurement test are used to obtain a model of the behavior of the airborne particles according to the increase and decrease of people present in the room, and which varies according to the flow rate of ventilation in the room at any time. For the OR under study, OR-2, the average values obtained after calculation are observed in Table 4.
Once obtained, those values shown in Table 4 are transferred to the simulation model implemented in TRNSYS. Figure 4 represents the diagram of the simulation performed. On the left, the types that constitute the simulation of the thermal model are shown. Type 56, located in the center of the scheme, represents the building energy model of the surgical suite. The subroutines that define the internal loads are grouped in the lower left corner. They are modelled by means of hourly forcing function schedulers (Types 14 h and 516). The meteorological data are provided by “Weather data” (Type 15-3), which gives the weather data needed by TRNSYS to run the simulations, i.e., air temperature, relative humidity, incident solar radiation, atmospheric pressure and wind velocity. The weather file is a typical meteorological year (TMY) version file. These results are recorded in .csv files using two virtual printers (Type 25f). On the right side of the diagram, the types for the instant calculation of particles are included. The “Velocity” module (Type 581) determines the speed of increase or decrease of particles in each time-step of the simulation according to the ventilation flow rate in that moment in the OR. Then, the ratio of particles in a cubic meter of air is calculated according to the occupancy difference between the current time-step and the previous time-step, which is obtained using the module “Previous” (Type 661) and the equation “Particles”. The remaining inputs to the model, namely, building geometry, constructive information, material properties, HVAC systems, occupancy, lighting, and equipment are described in a previous article [11].

3.2.2. Calibration Procedure

Once both models of the surgical suite and the OR have been obtained, the simulation is performed and then calibrated for a period for which experimental data are available, so that the reliability of the models can be verified. The measurement of the accuracy of a virtual model is an important duty, as with a calibrated model, it is possible to apply this model to different scenarios and different strategies that could lead to a reduction of the energy consumption but still maintain human comfort and patient safety [39]. There are some organizations that have developed procedures and practices to establish a measure of the accuracy of these models, and the most broadly accepted are: ASHRAE Guideline 14-2014, the international performance measurement and verification protocol (IPMVP) and the federal energy management program (FEMP) [39].
The calibration procedure is implemented using the optimization tool GenOpt 3.0.1 [40]. The method applied is a deterministic calibration that involves the consecutive running of simulations where varying the value of different variables until a cost function is minimized. The GPS Hooke-Jeeves algorithm “Hybrid Generalized Pattern Search Algorithm with Particle Swarm Optimization Algorithm” is applied, implementing the variation of calibration parameters within the pre-established limits. The software optimizes the cost function chosen, which in this case is the coefficient of variation of the root mean square error (CV(RMSE)), defined in Equation (2) [11]. During each iteration, GenOpt executes TRNSYS to run the simulation with the established values for each parameter and the objective function is calculated. The CV(RMSE) measures the variability of the errors between measured and simulated values [39]. It gives a suggestion of the model’s capacity to predict the global performance of the model [41].
CV RMSE = i = 1 n X s i m X r e a l 2 / n X r e a l ¯ ,
  • X r e a l ¯ mean of measured values.
  • n number of measured data points.
  • X r e a l measured value.
  • X s i m simulated value.

3.2.3. Simulation Methodology

The model defined is used to evaluate how the particles vary in the OR, under normal conditions of use. The surgical suite is simulated during a whole year (8760 h) with a simulation time-step of 1 min, since it is the required step to correctly simulate the variation of the airborne particles of OR 2, using the meteorological data of the year 2016. This year is the period in which the tests and data monitoring were done. It is analyzed how the variation of the ventilation flow affects the total particle concentration, in order to determine if it is possible to decrease it while complying with standards. The aim is to achieve energy savings in the hospital, without exceeding the maximum allowed particle values, according to the type of cleanroom, as explained in previous sections. To do this analysis, we select as range of variation of the flow rates of ventilation, those established by different regulations. In this way, five cases are evaluated, which are those indicated in Table 5, with their corresponding ventilation flows. The cases to be simulated are chosen following the review of the literature done by González-Gil et al. [11]. First, the minimum air intake in ventilation following Brazilian regulation is at least 30 ACH in ORs [42]. In UK, a ventilation of 25 ACH is recommended following standards [43]. In the case of Spain, as indicated before, the recommended ventilation rate in ORs is a minimum 20 ACH or 2400 m3/h [9]. Taking into account the volume of the studied OR, 2400 m3/h corresponds to 21.5 ACH. In the USA, following guidelines of the ASHRAE, 20 ACH are the minimum ventilation requirements [44]. Lastly, France, with a looser regulation, allows 15 ACH of ventilation in ORs [45]. All cases were simulated with an ideal heating and cooling system and a one-minute time step.

4. Results and Discussion

4.1. Airborne Particle Model Validation

The experimental results are recorded every minute, varying the ACH of the ventilation (25, 18, 12 and 9 ACH) and the occupancy within the OR (0, 1, 4 and 8 people) from 10:53 of 13 March 2016 to 14:42 of 13 March 2016. Particles larger than 0.5 μm per cubic meter of air and particles larger than 5 μm per cubic meter of air are measured. Figure 5 reflects the records made for particles larger than 0.5 μm. As explained before, to comply with ISO 6, the measures must be lower than 35,200 particles and to comply with ISO 7, the measures must be lower than 352,000. The OR under study is ISO 7 class; therefore, particles larger than 0.5 μm should not exceed 352,000. Observing Figure 5 it is evident that, in any case, even with minimum ventilation and maximum occupancy, the regulations would be fully complied with. However, in Figure 5 the limit can be observed in the case of an ISO-6 OR. In this case, it should be taken into account that a low ventilation (9 ACH) can cause a breach of the regulation, although this low ventilation is not allowed in any country with OR indoor conditions regulations. On the other hand, Table 6 shows the mean measured values depending on the occupancy and ventilation (ACH). Evidently, as airflow is increased, the number of particles is reduced since the mobility increases; at the same time as occupancy is increased the number of particles increase too, since people release airborne particles.
It is verified that the particle model approximates the real behavior during the period of the measurements. For each of the two particle sizes (0.5 μm and 5 μm) that need to be controlled, the error made in the simulation is calculated, for which the statistical index CV(RMSE) is determined as defined in Equation (2). Results are shown in Table 7. The errors obtained are quite satisfactory, especially for the sizes of more than 0.5 μm, and taking into account that particles of more than 5 μm are included in these ones, it can be concluded that they are excellent results. In addition, following the calibration criteria of ASHRAE guidelines 14-2014 [46], if an hourly calibration criterion is used, it is considered that the model is calibrated if its CV(RMSE) is lower than 30%, and if a monthly calibration criterion is used, it is considered that the model is calibrated if its CV(RMSE) is lower than 15% [39,47].
Figure 6 and Figure 7 show jointly the recorded data of the test and those obtained by simulation in TRNSYS. In the graphs, the concentration of simulated particles can be observed in red; in green, the concentration of real particles; and in blue, the airflow. As the airflow decreases, i.e., as the ACH decreases, the concentration of particles is increased, but always depends on the occupancy of the OR. Comparing the lines of simulated and measured particle concentration, a satisfactory correlation and correspondence between both is observed, validating the goodness of the model.

4.2. Analysis of the Annual Simulation

Once the model has been calibrated and validated, the five cases presented in Table 5 are simulated. Case 3 represents the case of the hospital studied that establishes ventilations of 21.5 ACH in ORs. Figure 8 shows the results of the case 3 simulation during a period of 24 h. Variation of the particle concentration during the daytime can be observed. The work hours in the ORs are clearly represented; the particles increase from 7 in the morning until 3 in the afternoon. The rest of the day they maintain stable concentrations; around 400 particles larger than 5 μm and around 4000 particles larger than 0.5 μm. It is also reflected that there is higher activity in the morning, starting to decrease after 12 am. Finally, and as expected, the behavior of the particles is independent of their size.
Additionally, combining the particle model and using the dynamic energy model simulated with TRNSYS, the total energy demand is calculated. Figure 9 presents the annual energy demands, both heating and cooling, in the studied conditions of the simulation in case 3. These energy demands were calculated for the entire surgical suite and for OR 2. The total energy demand of the surgical suite is 429.5 MWh, of which 423 MWh are heating demands and 6.5 MWh are cooling demands. Within this total energy, OR 2 consumes a total of 75.4 MWh, of which 74 MWh are heating demands and 1.4 MWh are cooling demands, which represents 17.56% of the total energy of the surgical suite. It can be observed that the cooling demand is practically negligible with respect to the heating demand, which makes sense if we take into account the location of the hospital studied, which is located in the city of Lugo. The climate in this town is classified as Cfa by the Köppen-Geiger classification. The average annual temperature is 13.6 °C in Lugo, with January being the coldest month with an average temperature of 2.9 °C.

4.3. Analysis of Particle Variation and Energy Savings

As indicated in Section 3.2.3 and observed in Table 5, five different strategies are simulated, corresponding to five different regulations on ventilation in the OR at the international level, from the most restrictive with 30 ACH in Brazil to the least restrictive with 15 ACH in France. The objective is to analyze the energy savings and the variation of the particles in the ORs with these five strategies, always keeping the particles below the limits established in the regulations for OR class ISO 7.
Figure 10 shows the results obtained in the five simulated cases, the energy demand of both heating and cooling and the concentration of particles according to their sizes. The first deduction is that cooling is negligible in any of the cases and that heating demand decreases as ventilation decreases. In the surgical suite, heating demand is reduced from 514 MWh with 30 ACH to 354 MWh with 15 ACH, which implies an energy saving of 160 MWh, i.e., a 31.13% of energy saving. On the other hand, in the OR in particular, the heating demand is reduced from 104 MWh with 30 ACH to 51 MWh with 15 ACH, which implies an energy saving of 53 MWh, i.e., a 50.96% of energy saving. In addition, not only energy savings produced by optimizing ventilation have to be taken into account, but also the increase in particles inherent in this reduction in ventilation. Analyzing the particles larger than 0.5 μm, since particles larger than 5 μm are contained in the previous ones, particles increase from 17,772 with 30 ACH to 25,215 with 15 ACH, that is, they increase by 41.88%. Taking into account that the limit of particles for an OR class ISO 6 is 35,200 and for an OR class ISO 7 is 352,000, it is clear that the limit established by the regulations is not exceeded. In summary, simulation results concluded that reducing the ventilation from 30 ACH to 15 ACH in an OR, the energy consumption is reduced by 51% but the particles are increased by 42%, without reaching or exceeding in any case the particle limit established by the regulation.
This methodology, tested and validated for a specific OR, can be applied to any other hospital room or to any other hospital simply by modifying the simulation inputs in TRNSYS. Therefore, it is a transposable and useful procedure to calculate energy savings while maintaining compliance with regulations.

5. Conclusions

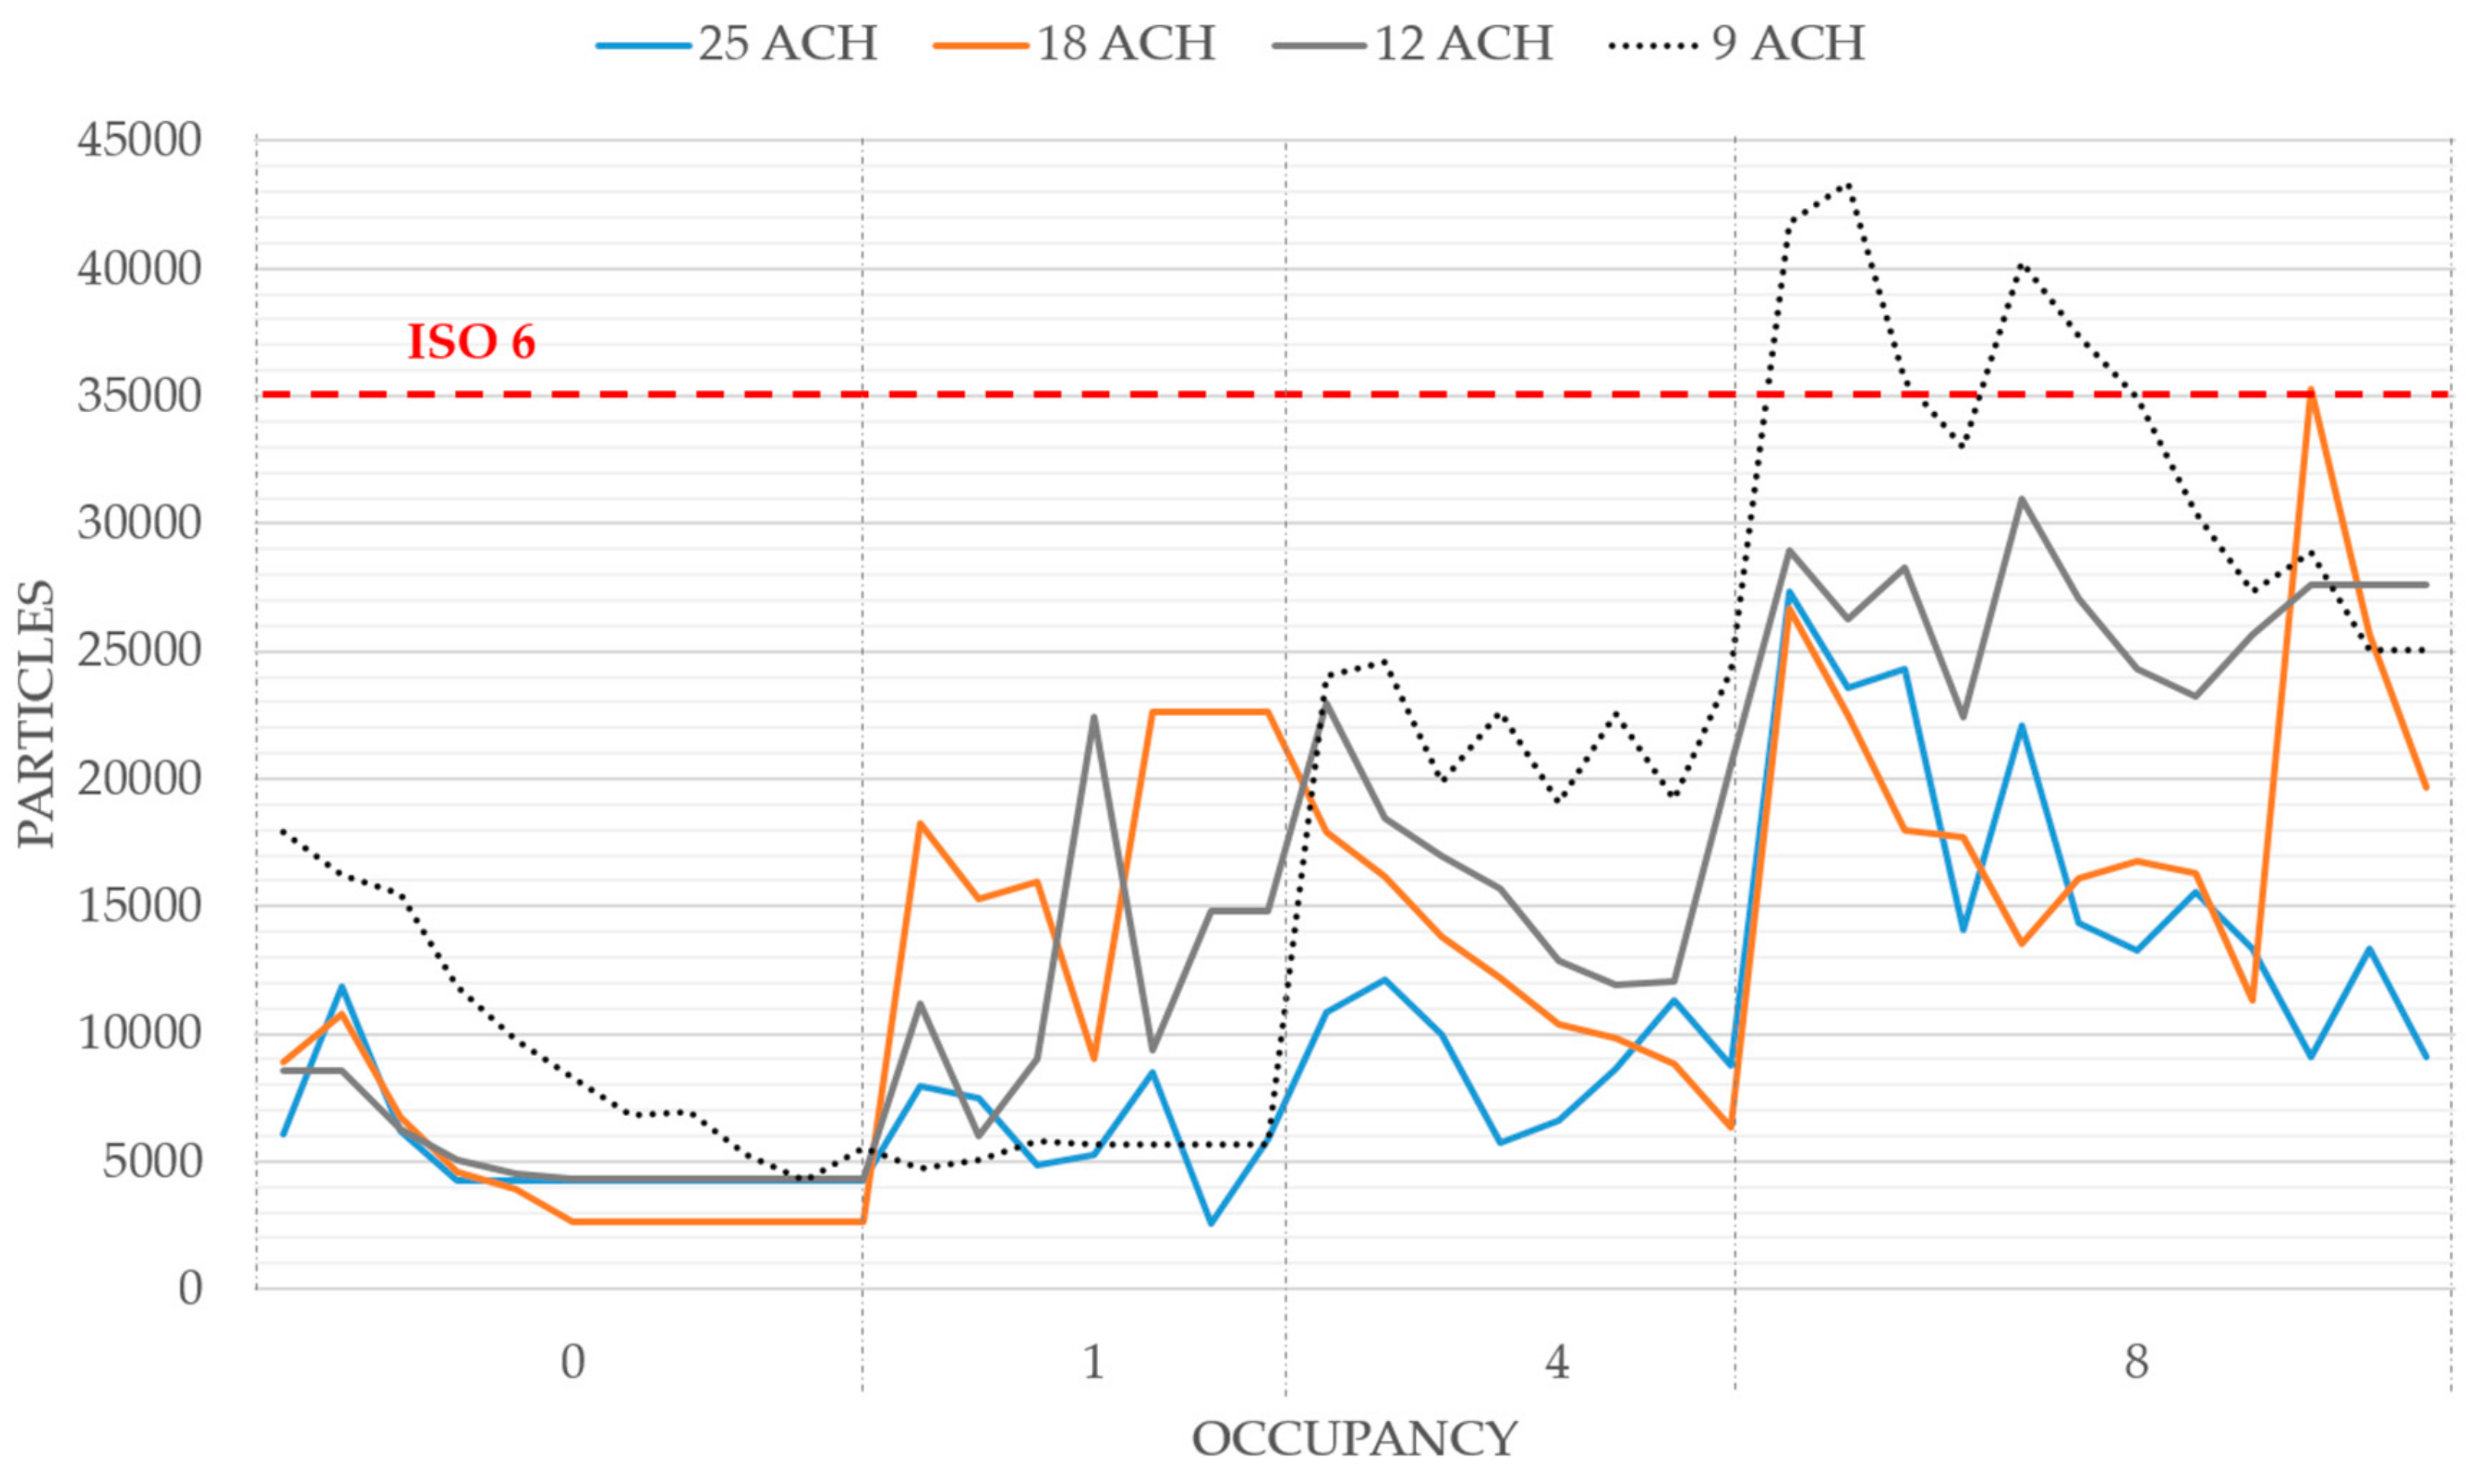
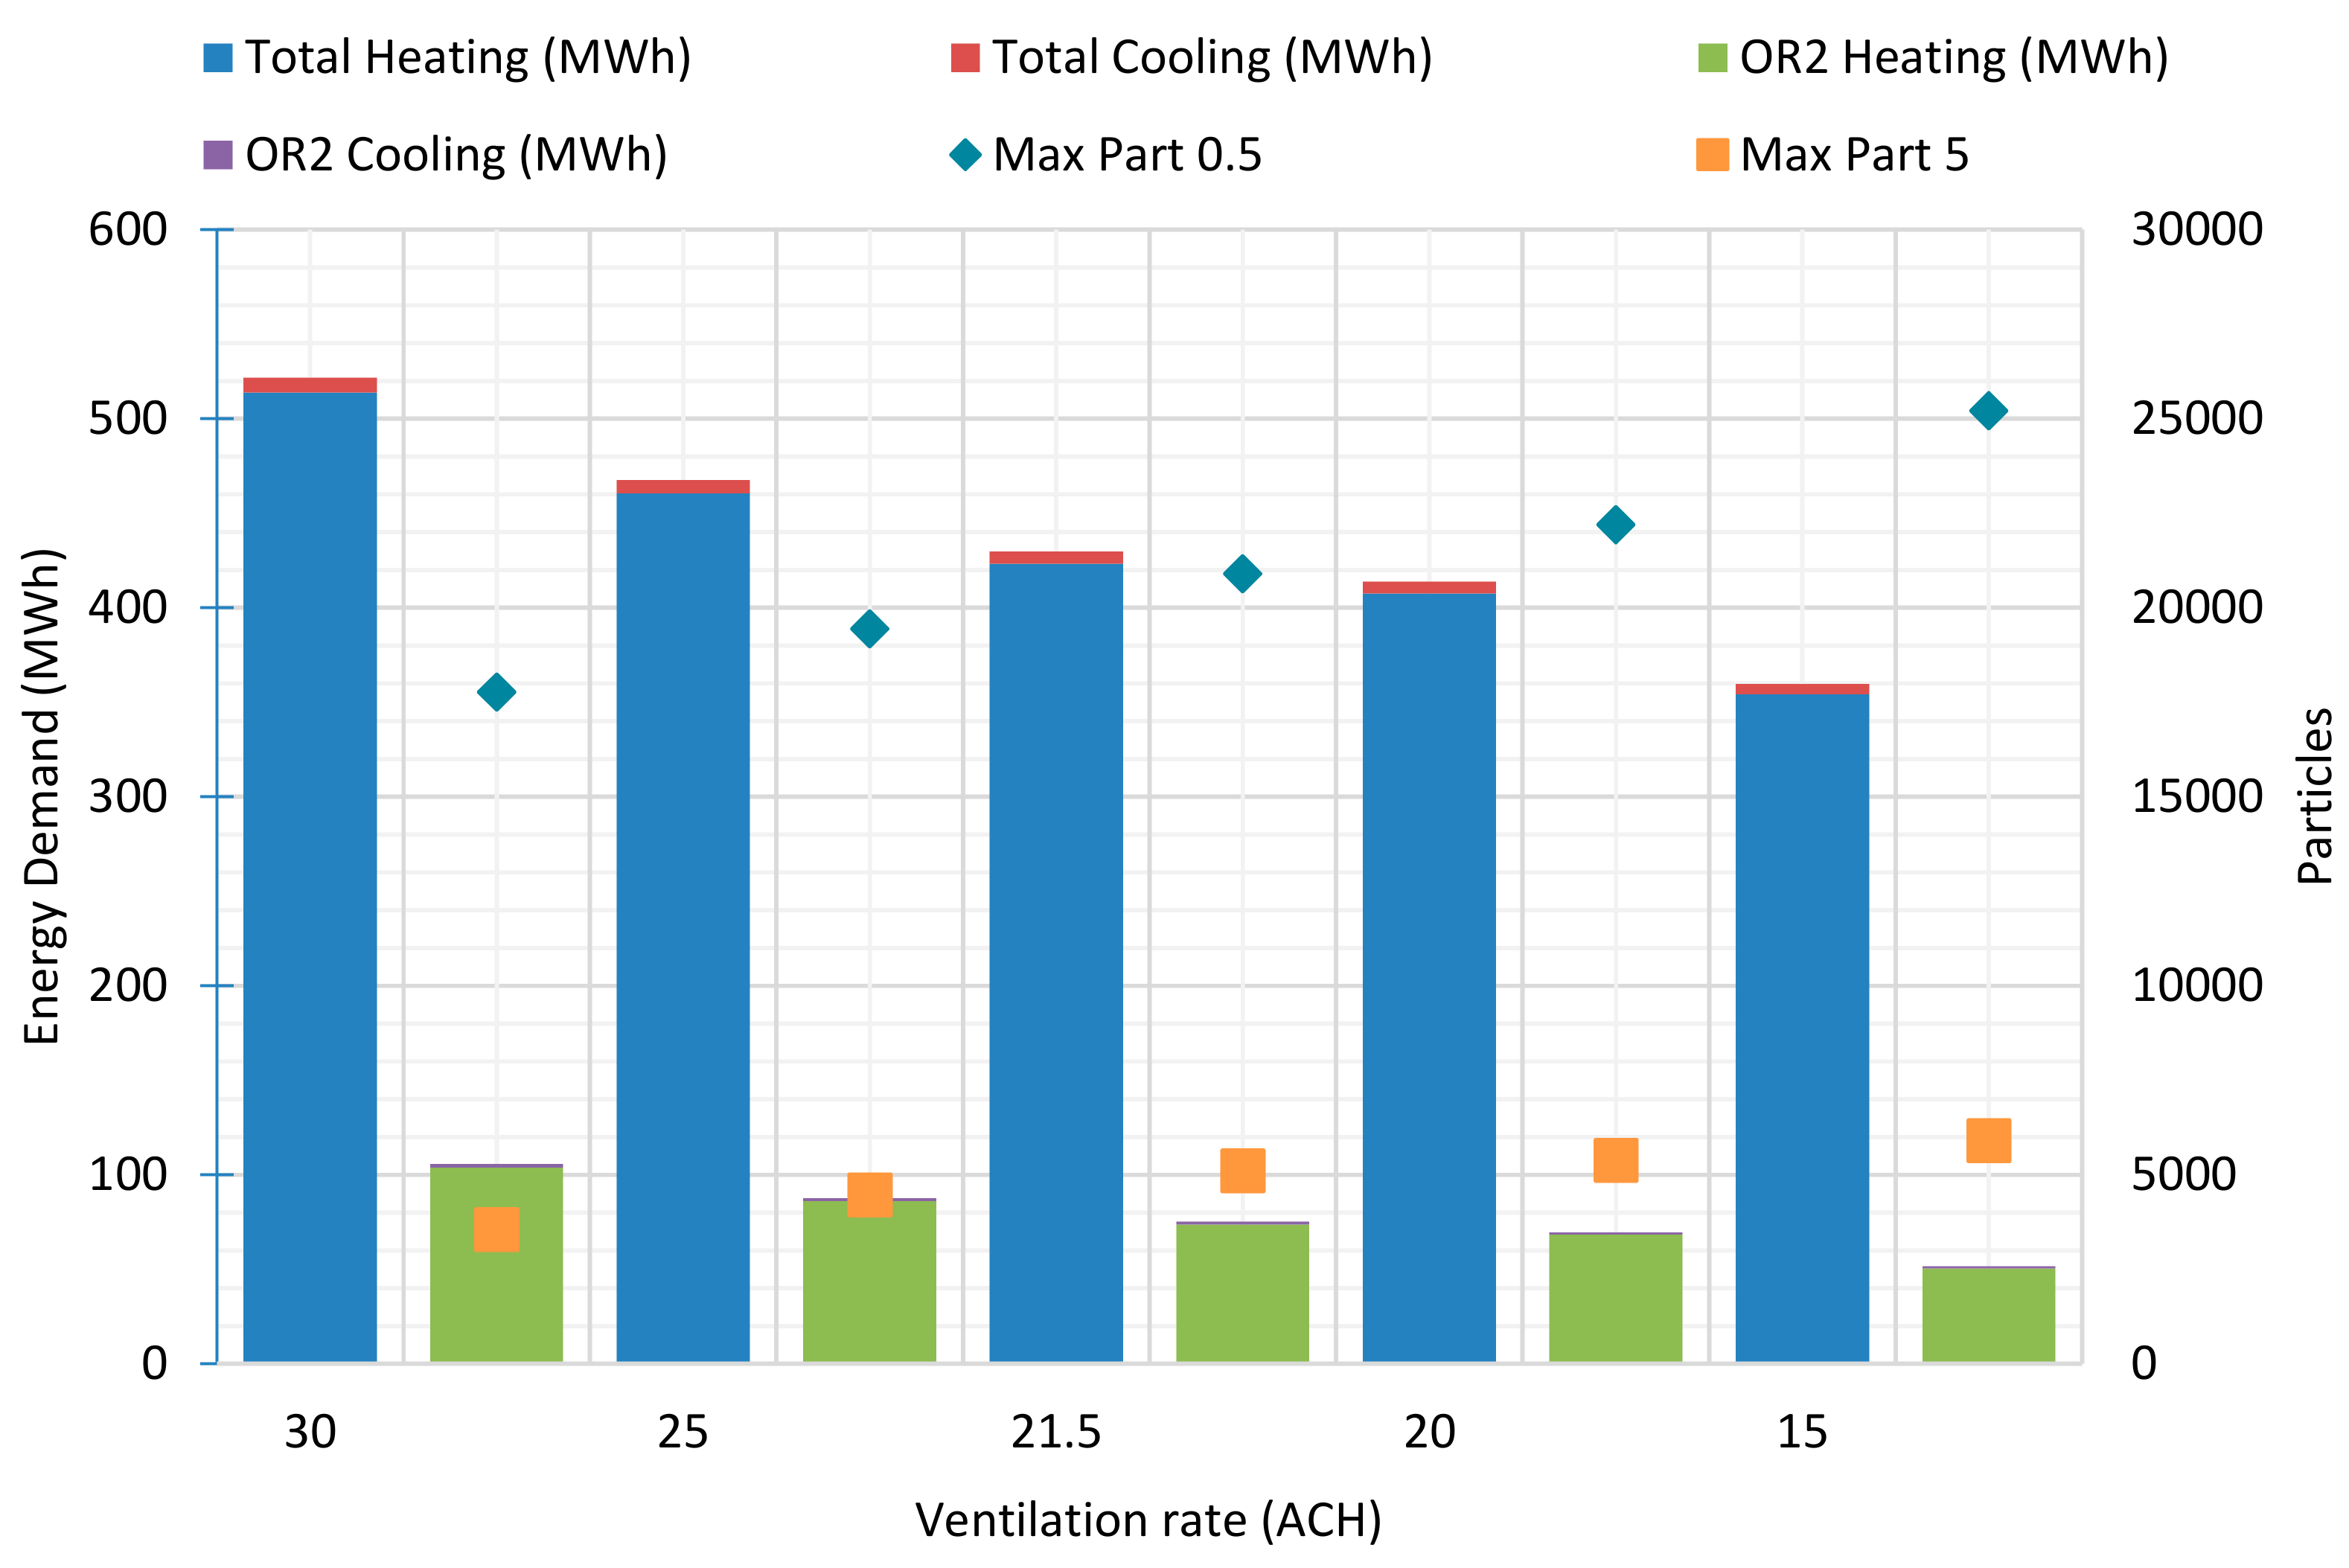
This study presents a simple and original methodology for the energy optimization of an OR while complying with airborne particle regulations. Two TRNSYS models were developed: a dynamic energy model of a surgical suite and an airborne particle model of an OR. Then, experimental measures were used to validate these models. Finally, different approaches to optimize ventilation in order to reduce energy consumption maintaining comfort and safety indoor conditions are identified and assessed. In particular, five different strategies were simulated (15, 20, 21.5, 25 and 30 ACH) and the implementation of these strategies simulations is predicted to save up to 51% of energy consumption annually, in the best of cases, keeping compliance with regulations. In addition, the ventilation requirements of OR can be reduced with respect to normative limits by performing monitoring studies. In the presented case study, even an air renovation rate of 15 ACH will keep the particle concentrations under the normative limits for an OR class ISO 6 or lower requirement. Based on experimental data, if higher than 20 ACH is maintained, even if the occupancy is increased, the regulations on particle matter continue to be fulfilled.
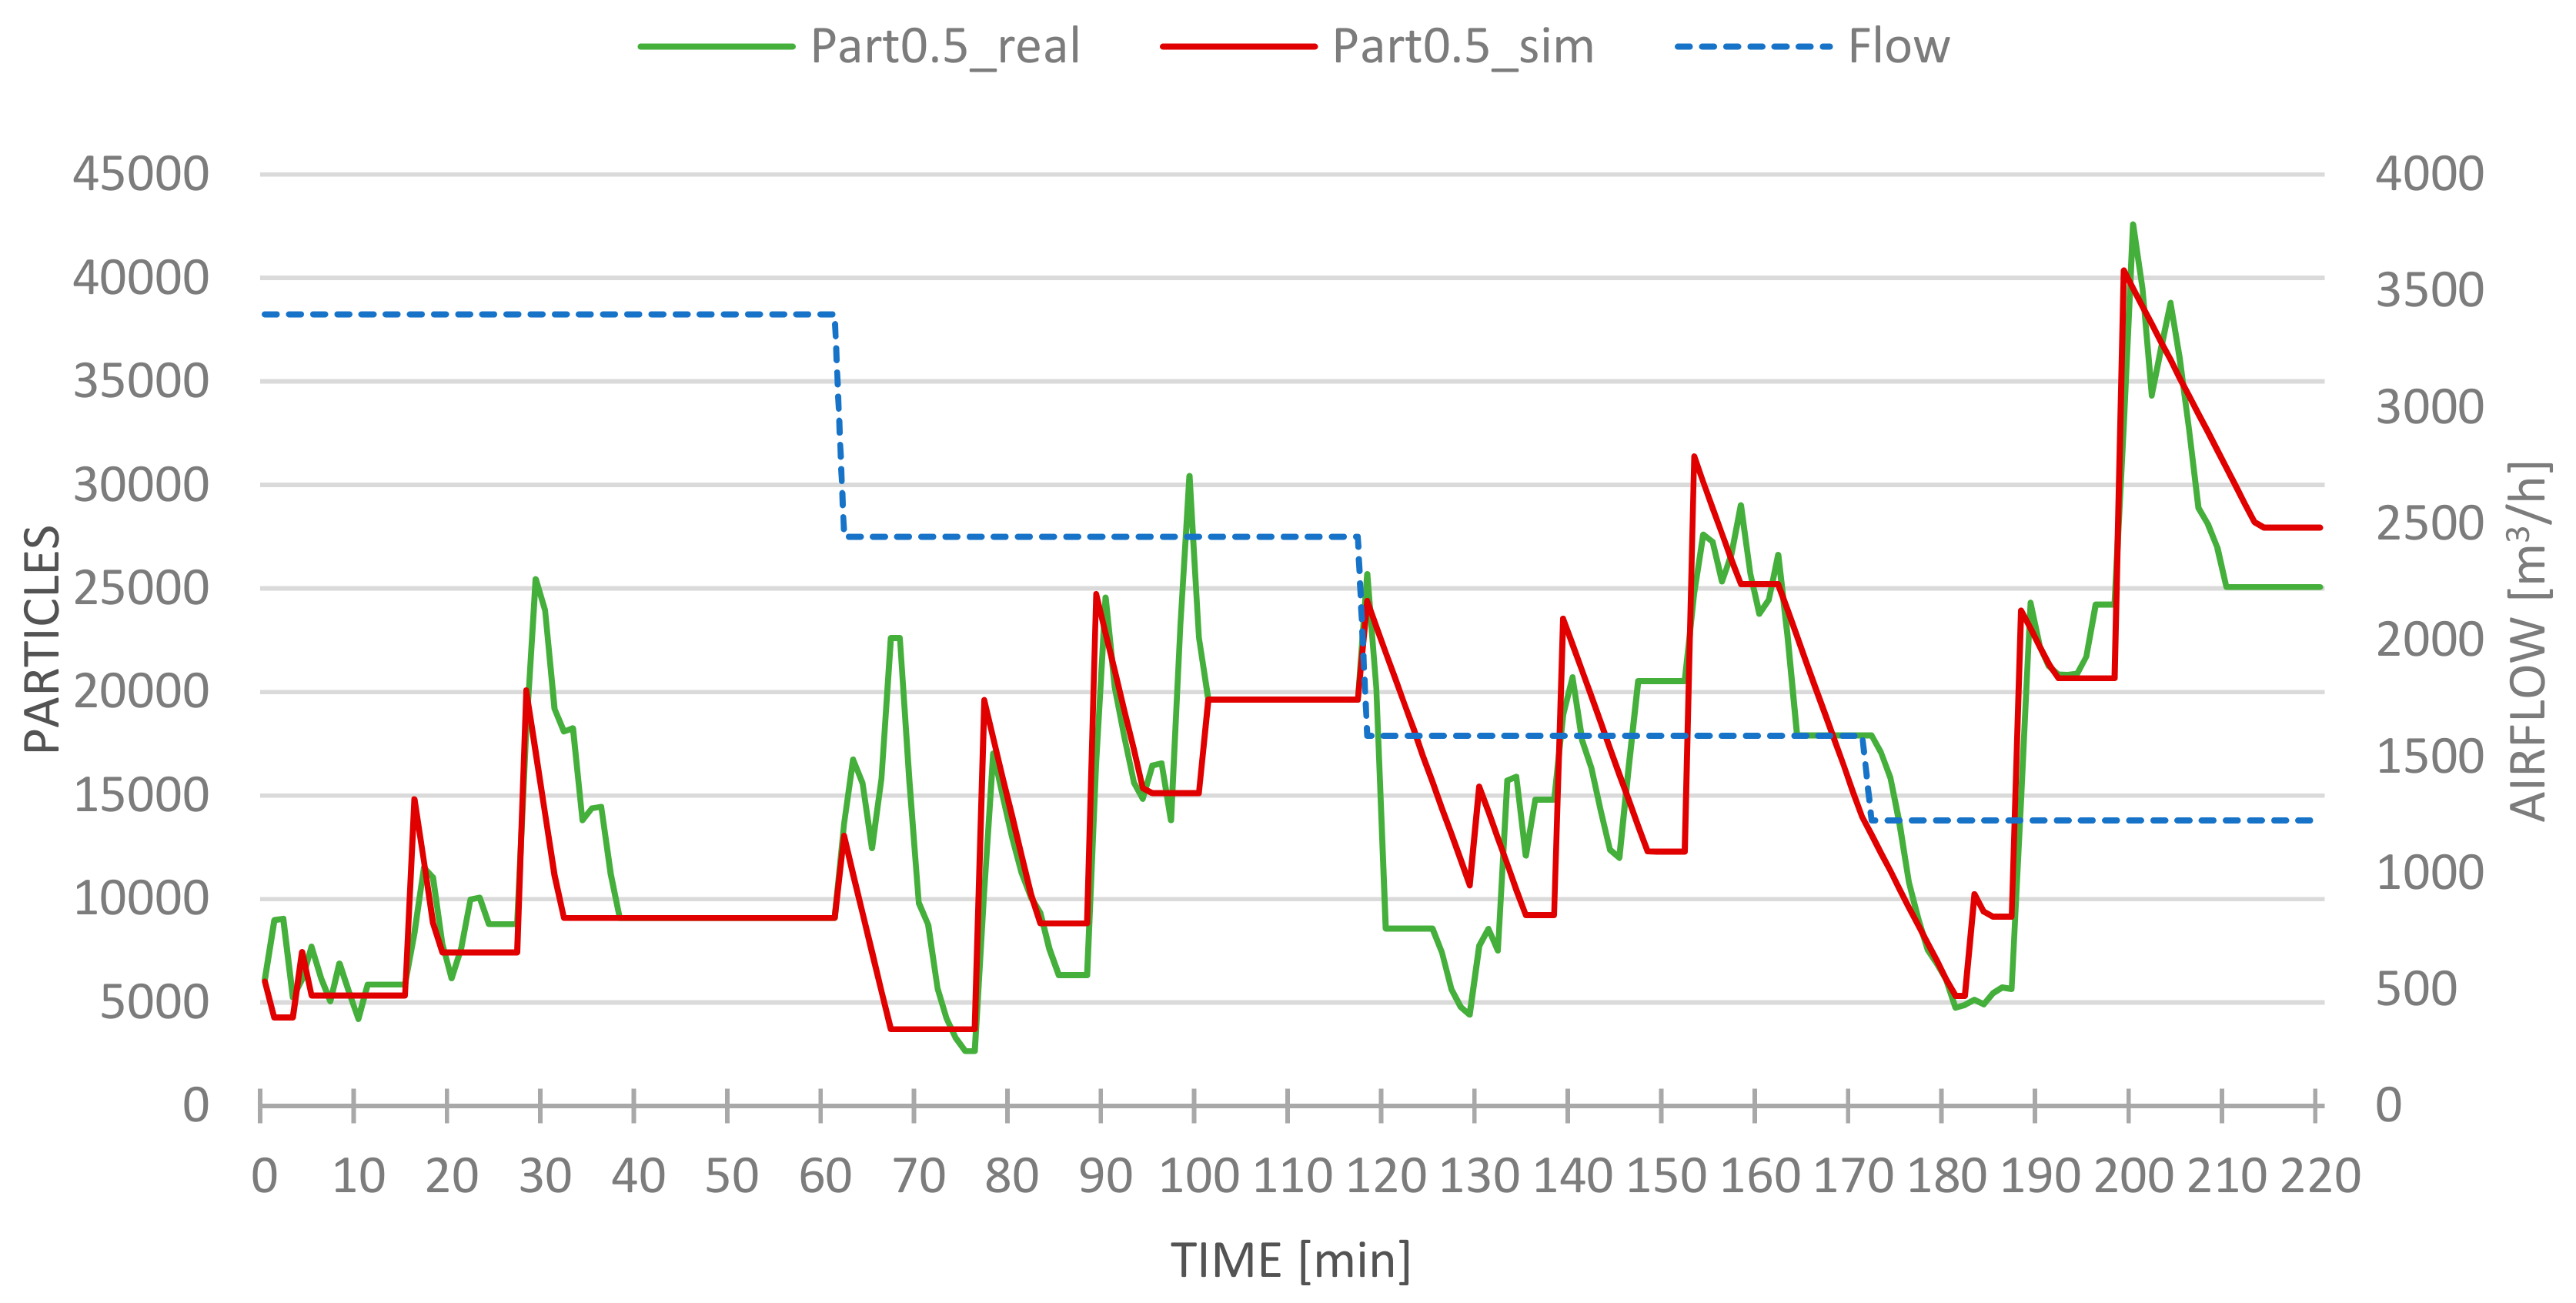
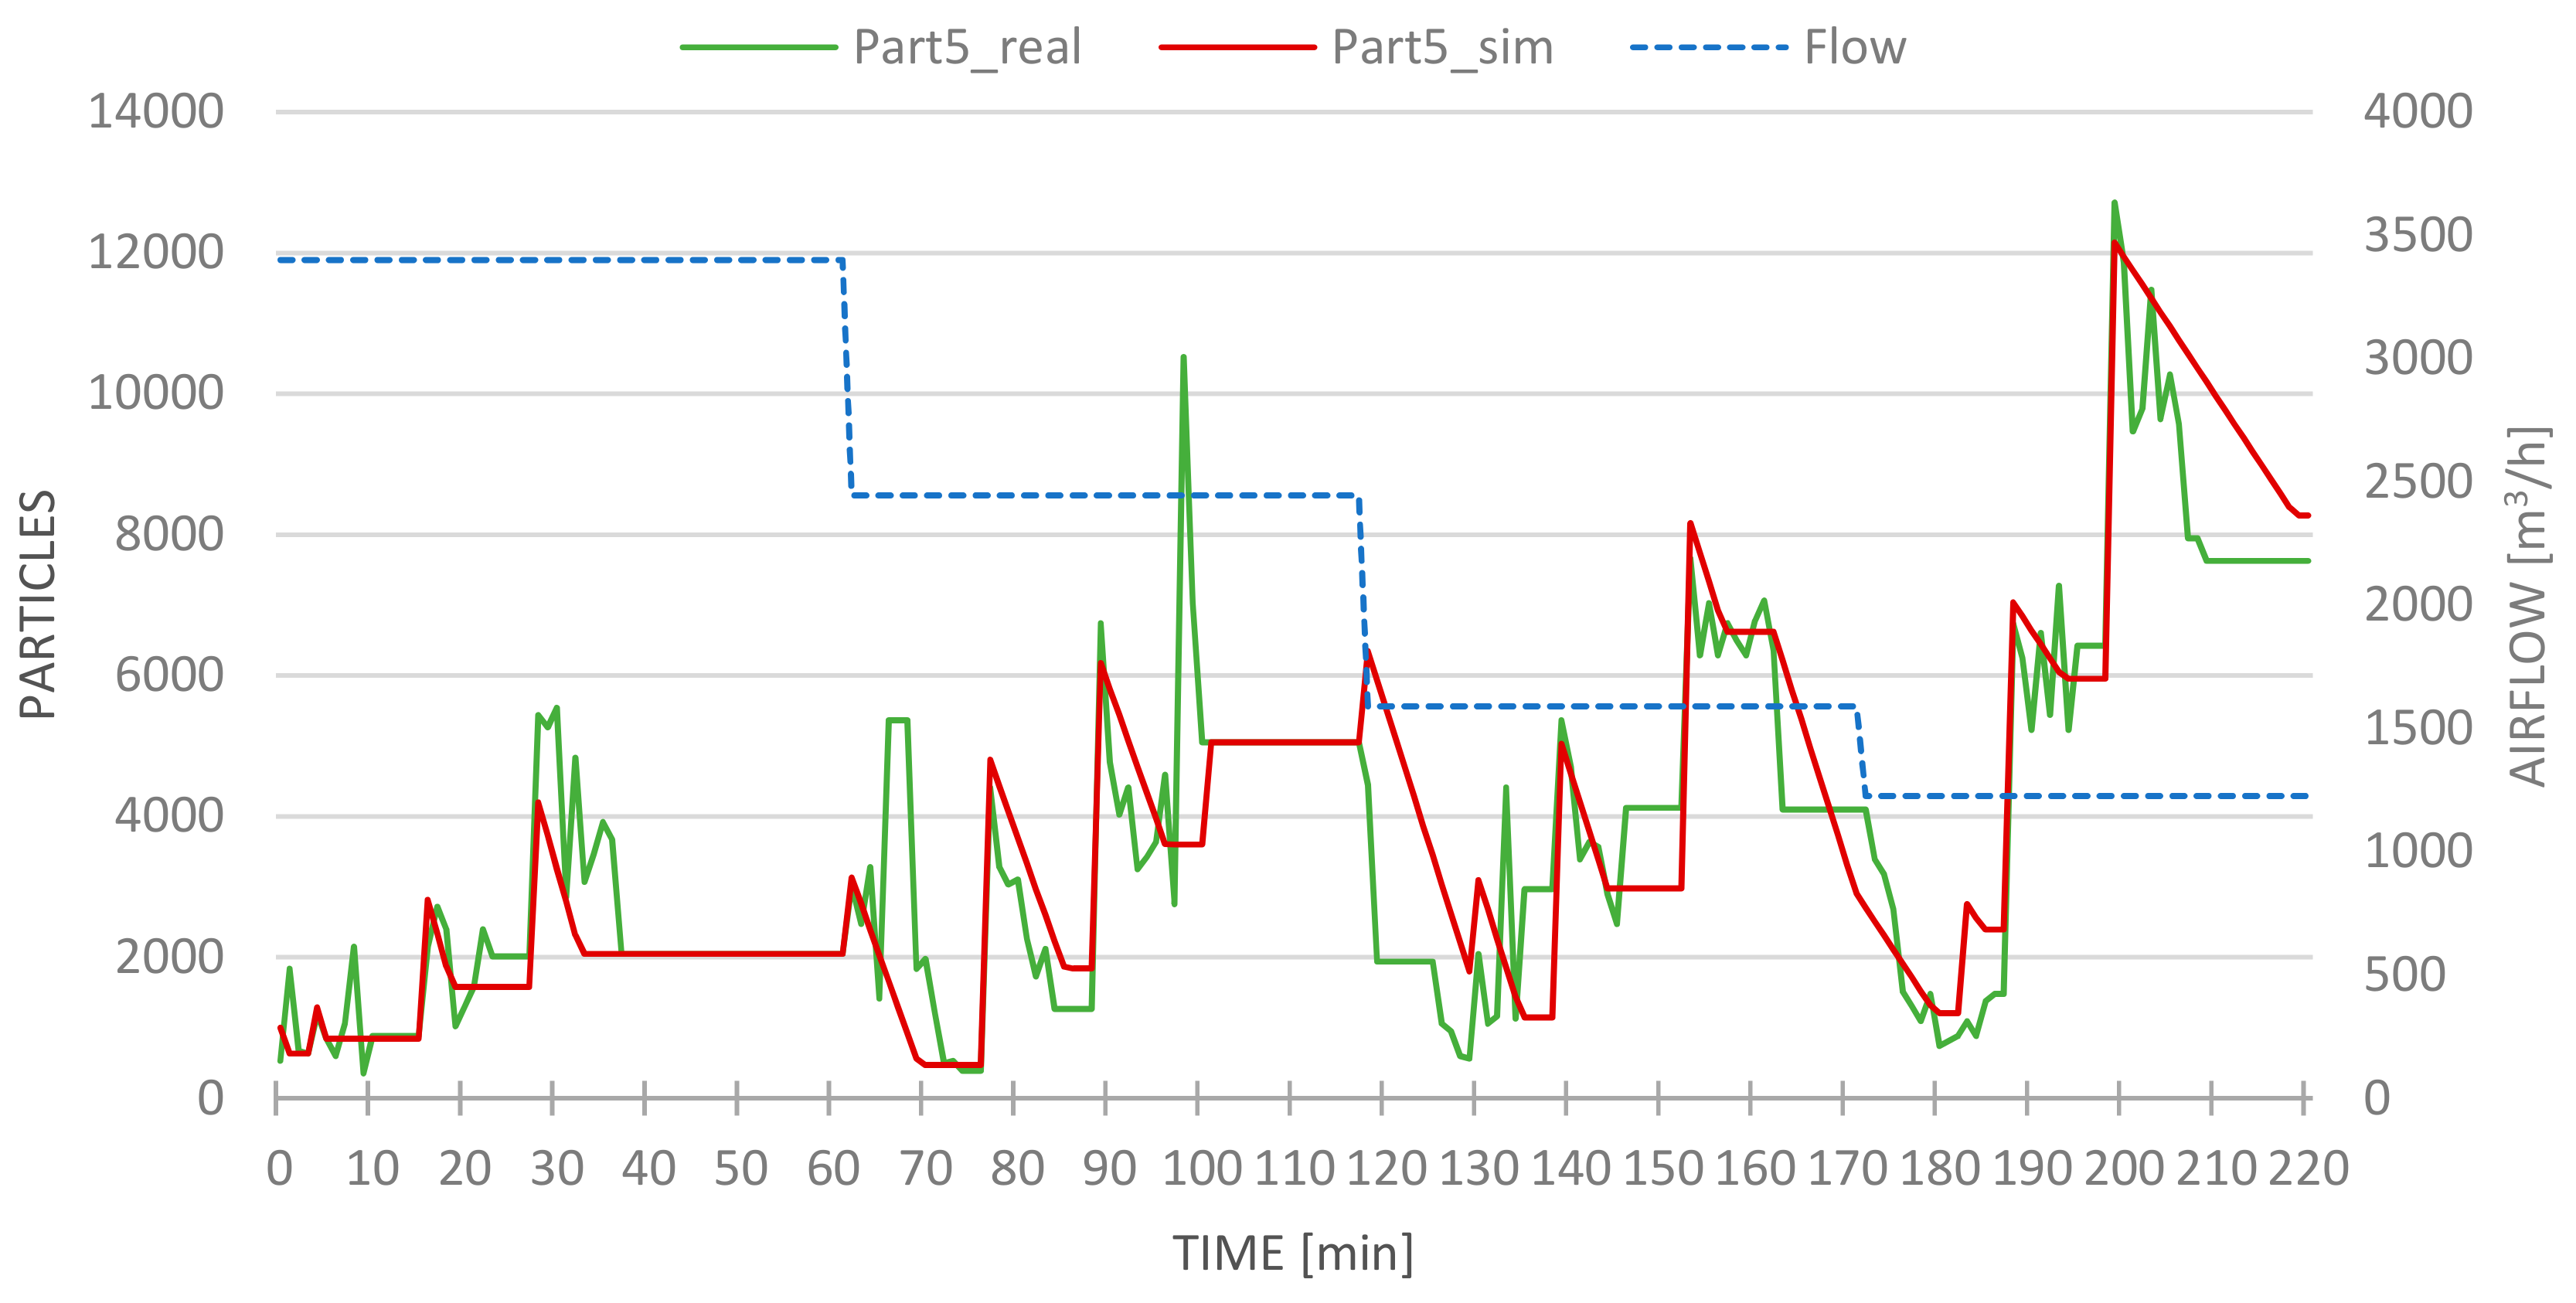
Although the models were quite complex, the simulated data agreed well with the metered data despite the multiple sources of error that can be present in simulations. The airborne particle model revealed a CV(RMSE) lower than 3%. The main limitations of the results are generated by these sources of error: weather data, uncertainty in measurements, non-exact thermophysical properties of constructive materials, and ambiguity in internal loads.
The methodology proposed is fast and useful and its applicability is wide as it can be completely transferred to any other cleanroom in the hospital. Future approaches of the procedure can be applied to a surgical suite, a laboratory or even to an entire hospital, reaching a holistic overview of the energy savings opportunities.

Author Contributions

L.F.-G. processed the experimental data, performed the analysis, analyzed the data and wrote the manuscript. J.L.L.-G. conceived and planned the experiments, carried out the experiment and processed the experimental data. P.E.-O. conceived of the presented idea, developed the models and performed simulations. E.G.-Á. supervised the findings of this work and provided critical feedback.

Funding

This research was funded by the project SMARTHERM “Research for development of characterization tools and the prediction of energy performance of buildings” by the Spanish Government (Science, Innovation and Universities Ministry) and the project INMENA (IN852A 2018/59) “Inspección y monitorización automatizadas para la gestión energética activa según los usos de edificación” funded by the program CONECTA PEME (FEDER-GALICIA 2014/2020).

Acknowledgments

The authors would like to acknowledge the General Manager of the Regional Public Health Care System of Galicia (SERGAS) for authorizing this research and the publication of its results, as well as the staff of the Lucus Augusti University Hospital (HULA) for their willing collaboration in the fieldwork. Likewise, the authors acknowledge financial support from the project SMARTHERM “Research for development of characterization tools and the prediction of energy performance of buildings” by the Spanish Government (Science, Innovation and Universities Ministry) and the project INMENA (IN852A 2018/59) “Inspección y monitorización automatizadas para la gestión energética activa según los usos de edificación” funded by the program CONECTA PEME (FEDER-GALICIA 2014/2020).

Conflicts of Interest

The authors declare no conflict of interest.

Nomenclature

IAQIndoor Air Quality
HVACHeating, Ventilation and Air Conditioning
OROperating Room
ACHAir Changes per Hour
GDPGross Domestic Product
VRFVariable Refrigerant Flow
ECMEnergy Conservation Measure
HEPAHigh Efficiency Particulate Air
ULPAUltra Low Particulate Air
HULALucus Augusti University Hospital
CFDComputational Fluid Dynamics
PVCPolyvinyl Chloride
AHUAir Handling Unit
TMYTypical Meteorological Year
IPMVPInternational Performance Measurement and Verification Protocol
FEMPFederal Energy Management Program
CV(RMSE)Coefficient of Variation of the Root Mean Square Error

References

  1. Teke, A.; Timur, O. Assessing the energy efficiency improvement potentials of HVAC systems considering economic and environmental aspects at the hospitals. Renew. Sustain. Energy Rev. 2014, 33, 224–235. [Google Scholar] [CrossRef]
  2. Pérez-Lombard, L.; Ortiz, J.; Pout, C. A review on buildings energy consumption information. Energy Build. 2008, 40, 394–398. [Google Scholar] [CrossRef]
  3. González González, A.; García-Sanz-Calcedo, J.; Salgado, D.R. A quantitative analysis of final energy consumption in hospitals in Spain. Sustain. Cities Soc. 2018, 36, 169–175. [Google Scholar] [CrossRef]
  4. García-Sanz-Calcedo, J.; González, A.G.; Salgado, D.R. Assessment of Energy Consumption in Spanish Hospitals. In Green Energy and Technology; Springer: Cham, Switzerland, 2018; pp. 781–791. [Google Scholar]
  5. Balaras, C.A.; Dascalaki, E.; Gaglia, A. HVAC and indoor thermal conditions in hospital operating rooms. Energy Build. 2007, 39, 454–470. [Google Scholar] [CrossRef]
  6. Dascalaki, E.G.; Lagoudi, A.; Balaras, C.A.; Gaglia, A.G. Air quality in hospital operating rooms. Build. Environ. 2008, 43, 1945–1952. [Google Scholar] [CrossRef]
  7. Liu, J.; Wang, H.; Wen, W. Numerical simulation on a horizontal airflow for airborne particles control in hospital operating room. Build. Environ. 2009, 44, 2284–2289. [Google Scholar] [CrossRef]
  8. ASHRAE Handbook. Available online: https://www.google.com.tw/url?sa=t&rct=j&q=&esrc=s&source=web&cd=1&cad=rja&uact=8&ved=2ahUKEwjk47O47YHjAhXKA4gKHURcD_EQFjAAegQIBhAB&url=https%3A%2F%2Fwww.ashrae.org%2Ftechnical-resources%2Fashrae-handbook%2Fashrae-handbook-online&usg=AOvVaw20sPPJACuhdMbUcc9g6Bpj (accessed on 6 June 2019).
  9. AENOR UNE 100713:2005 Air Conditioning in Hospitals. Available online: https://www.google.com.tw/url?sa=t&rct=j&q=&esrc=s&source=web&cd=1&cad=rja&uact=8&ved=2ahUKEwjyv4Cd7oHjAhUNA4gKHSkVA08QFjAAegQIAxAB&url=https%3A%2F%2Fwww.en.aenor.com%2Fnormas-y-libros%2Fbuscador-de-normas%2Fune%3Fc%3DN0034264&usg=AOvVaw1YdbonzKd7dLuri1Lxrq7S (accessed on 6 June 2019).
  10. ISO 14644-1:2015 Cleanrooms and Associated Controlled Environments—Part 1: Classification of Air Cleanliness by Particle Concentration. Available online: https://www.google.com.tw/url?sa=t&rct=j&q=&esrc=s&source=web&cd=1&cad=rja&uact=8&ved=2ahUKEwjMp8O77oHjAhVJFogKHZm_B2oQFjAAegQIAxAB&url=https%3A%2F%2Fwww.iso.org%2Fstandard%2F53394.html&usg=AOvVaw1pk7cqyquykY1PvkfCaXpd (accessed on 6 June 2019).
  11. González-Gil, A.; López-González, J.L.; Fernández, M.; Eguía, P.; Erkoreka, A.; Granada, E. Thermal energy demand and potential energy savings in a Spanish surgical suite through calibrated simulations. Energy Build. 2018, 174, 513–526. [Google Scholar] [CrossRef]
  12. AENOR, UNE 171340:2012 Validation and Evaluation of Controlled Environment Rooms in Hospitals. Available online: https://www.google.com.tw/url?sa=t&rct=j&q=&esrc=s&source=web&cd=1&cad=rja&uact=8&ved=2ahUKEwiW0s_l7oHjAhWOad4KHfuIBgYQFjAAegQIAhAB&url=https%3A%2F%2Fwww.en.aenor.com%2Fnormas-y-libros%2Fbuscador-de-normas%2Fune%2F%3Fc%3DN0048723&usg=AOvVaw1KA91dTXHf-776d0rFej0I (accessed on 6 June 2019).
  13. García-Sanz-Calcedo, J.; López-Rodríguez, F.; Cuadros, F. Quantitative analysis on energy efficiency of health centers according to their size. Energy Build. 2014, 73, 7–12. [Google Scholar] [CrossRef]
  14. Čongradac, V.; Prebiračević, B.; Jorgovanović, N.; Stanišić, D. Assessing the energy consumption for heating and cooling in hospitals. Energy Build. 2012, 48, 146–154. [Google Scholar] [CrossRef]
  15. Kolokotsa, D.; Tsoutsos, T.; Papantoniou, S. Energy conservation techniques for hospital buildings. Adv. Build. Energy Res. 2012, 6, 159–172. [Google Scholar] [CrossRef]
  16. Ahmed, T.M.F.; Rajagopalan, P.; Fuller, R. Experimental validation of an energy model of a day surgery/procedure centre in Victoria. J. Build. Eng. 2017, 10, 1–12. [Google Scholar] [CrossRef]
  17. Ho, S.H.; Rosario, L.; Rahman, M.M. Three-dimensional analysis for hospital operating room thermal comfort and contaminant removal. Appl. Thermal Eng. 2009, 29, 2080–2092. [Google Scholar] [CrossRef]
  18. Kim, S.H.; Augenbroe, G. Decision support for choosing ventilation operation strategy in hospital isolation rooms: A multi-criterion assessment under uncertainty. Build. Environ. 2013, 60, 305–318. [Google Scholar] [CrossRef]
  19. Review of Operating Room Ventilation Standards. Available online: https://pure.tue.nl/ws/files/1859249/2350261679753.pdf (accessed on 6 June 2019).
  20. IDAE: Instituto para la Diversificación y Ahorro de la Energía. Ministerio para la Transición Ecológica. Available online: https://www.google.com.tw/url?sa=t&rct=j&q=&esrc=s&source=web&cd=1&cad=rja&uact=8&ved=2ahUKEwjo15T074HjAhXTdXAKHexBDsMQFjAAegQIBxAC&url=https%3A%2F%2Fwww.miteco.gob.es%2Fes%2F&usg=AOvVaw3OfPXk08aCuL109TnfBaIZ (accessed on 6 June 2019).
  21. RD 1027/2007 RITE Reglamento de Instalaciones Térmicas en los Edificios. Available online: https://www.google.com.tw/url?sa=t&rct=j&q=&esrc=s&source=web&cd=5&cad=rja&uact=8&ved=2ahUKEwjKydqH8IHjAhWTZt4KHcaHDncQFjAEegQIBBAC&url=http%3A%2F%2Fwww.solerpalau.mx%2Fpdf%2FRITE_Cuestiones_sobre_la_aplicacion_del_RITE.PDF&usg=AOvVaw0-OSNLEivHxwHX8oblUEF- (accessed on 6 June 2019).
  22. Pastor-Pérez, P. Climatización de Hospitales. Available online: https://www.google.com.tw/url?sa=t&rct=j&q=&esrc=s&source=web&cd=7&cad=rja&uact=8&ved=2ahUKEwjMtr-D8oHjAhWi3mEKHQkYDgIQFjAGegQIARAC&url=https%3A%2F%2Fwww.isover.es%2Fsites%2Fisover.es%2Ffiles%2Fassets%2Fdocuments%2Fclimaver_hospitales_2015.pdf&usg=AOvVaw1K8vBx6tvH5v1LAp71XGkF (accessed on 6 June 2019).
  23. Kamsah, N.; Mohamed Kamar, H.; Alhamid, M.; Wong, K.Y.; Akademia Baru, P. Impacts of Temperature on Airborne Particles in A Hospital Operating Room. Available online: http://www.akademiabaru.com/doc/ARFMTSV44_N1_P12_23.pdf (accessed on 6 June 2019).
  24. Chow, T.-T.; Yang, X.-Y. Performance of ventilation system in a non-standard operating room. Build. Environ. 2003, 38, 1401–1411. [Google Scholar] [CrossRef]
  25. Kircher, K.; Shi, X.; Patil, S.; Zhang, K.M. Cleanroom energy efficiency strategies: Modeling and simulation. Energy Build. 2010, 42, 282–289. [Google Scholar] [CrossRef]
  26. Rui, Z.; Guangbei, T.; Jihong, L. Study on biological contaminant control strategies under different ventilation models in hospital operating room. Build. Environ. 2008, 43, 793–803. [Google Scholar] [CrossRef]
  27. Humphreys, H. Infection control and the design of a new operating theatre suite. J. Hosp. Infect. 1993, 23, 61–70. [Google Scholar] [CrossRef]
  28. AENOR, UNE-EN 1822-1:2010 High Efficiency Air Filters (EPA; HEPA and ULPA)—Part 1: Classification, Performance, Testing, Marking. Available online: https://www.google.com.tw/url?sa=t&rct=j&q=&esrc=s&source=web&cd=1&cad=rja&uact=8&ved=2ahUKEwiZsIXi8oHjAhVBUd4KHerKDlIQFjAAegQIAxAB&url=https%3A%2F%2Fwww.en.une.org%2Fencuentra-tu-norma%2Fbusca-tu-norma%2Fnorma%2F%3Fc%3DN0045515&usg=AOvVaw2siJ0AF7c5GuU-FmHRhnMB (accessed on 6 June 2019).
  29. ISO 14644-1:1999 Clean Rooms and Ancillary Rooms. Part 1: Classification of Air Cleaning. Available online: https://www.google.com.tw/url?sa=t&rct=j&q=&esrc=s&source=web&cd=1&cad=rja&uact=8&ved=2ahUKEwj_kO_18oHjAhVDQN4KHfx8DOYQFjAAegQIARAC&url=https%3A%2F%2Fwww.sis.se%2Fapi%2Fdocument%2Fpreview%2F615067%2F&usg=AOvVaw2reebbZ5YyFqcgI0qUbC_T (accessed on 6 June 2019).
  30. ISO 14644-2: 2000 Clean Rooms and Controlled Ancillary Rooms. Part 2: Specifications for Testing and Control. Available online: https://www.google.com.tw/url?sa=t&rct=j&q=&esrc=s&source=web&cd=1&cad=rja&uact=8&ved=2ahUKEwjBm4GP84HjAhVQE4gKHaSiCwwQFjAAegQIBhAB&url=https%3A%2F%2Fwww.iso.org%2Fstandard%2F25008.html&usg=AOvVaw0PEsj0F47-TQkxBk9ib6Zv (accessed on 6 June 2019).
  31. ISO 14644-3: 2005 Cleanrooms and Associated Controlled Environments. Part 3: Test Methods. Available online: https://www.google.com.tw/url?sa=t&rct=j&q=&esrc=s&source=web&cd=1&cad=rja&uact=8&ved=2ahUKEwibtNyi84HjAhWX-2EKHW1pD0cQFjAAegQIARAB&url=https%3A%2F%2Fwww.iso.org%2Fobp%2Fui%2F%23!iso%3Astd%3A37261%3Aen&usg=AOvVaw1PGF-1BgNumOeW0r9dC3MO (accessed on 6 June 2019).
  32. Buratti, C.; Palladino, D.; Moretti, E. Prediction of Indoor Conditions and Thermal Comfort Using CFD Simulations: A Case Study Based on Experimental Data. Energy Procedia 2017, 126, 115–122. [Google Scholar] [CrossRef]
  33. Colquhoun, J.; Partridge, L. Computational Fluid Dynamics Applications in Hospital Ventilation Design. Indoor Built Environ. 2003, 12, 81–88. [Google Scholar] [CrossRef]
  34. Chau, K.Y.O.; Liu, C.-H.; Leung, M.K.H. CFD Analysis of the Performance of a Local Exhaust Ventilation System in a Hospital Ward. Indoor Built Environ. 2006, 15, 257–271. [Google Scholar] [CrossRef]
  35. Chow, T.T.; Yang, X.Y. Ventilation performance in the operating theatre against airborne infection: Numerical study on an ultra-clean system. J. Hosp. Infec. 2005, 59, 138–147. [Google Scholar] [CrossRef] [PubMed]
  36. Liu, C.; Zhou, G.; Li, H. Analysis of Thermal Environment in a Hospital Operating Room. Procedia Eng. 2015, 121, 735–742. [Google Scholar] [CrossRef] [Green Version]
  37. TRNSYS 17, A Transient System Simulation Program User Manual. Available online: https://www.google.com.tw/url?sa=t&rct=j&q=&esrc=s&source=web&cd=3&cad=rja&uact=8&ved=2ahUKEwjw-brt84HjAhVMeXAKHfmeCS4QFjACegQIAxAC&url=https%3A%2F%2Fwww.qcd.co.jp%2Fdown%2FSHEET%2FT17Updates.pdf&usg=AOvVaw2BTmaKzGe2o8rE_Ont2Jrg (accessed on 6 June 2019).
  38. TESS Components Libraries. Available online: https://www.google.com.tw/url?sa=t&rct=j&q=&esrc=s&source=web&cd=1&cad=rja&uact=8&ved=2ahUKEwjr4tCL9IHjAhVNQN4KHfaTCHoQFjAAegQIBBAC&url=http%3A%2F%2Fwww.trnsys.com%2Ftess-libraries%2FTESSLibs17_General_Descriptions.pdf&usg=AOvVaw22wnMe2D-bwJHSAaSAhagk (accessed on 6 June 2019).
  39. Ruiz, G.R.; Bandera, C.F. Validation of Calibrated Energy Models: Common Errors. Energies 2017, 10, 1587. [Google Scholar] [CrossRef]
  40. Laboratory, L.B.N. GenOpt Generic Optimization Program. Available online: https://www.google.com.tw/url?sa=t&rct=j&q=&esrc=s&source=web&cd=2&cad=rja&uact=8&ved=2ahUKEwjpm7af9IHjAhVDEnAKHajMCUEQFjABegQIBRAB&url=https%3A%2F%2Fwem.lbl.gov%2Fpublications%2Fgenopt-generic-optimization-program&usg=AOvVaw21cdA2l1FUdVdvwXxxNdT3 (accessed on 6 June 2019).
  41. Touzani, S.; Granderson, J.; Custodio, C.; Sohn, M.; Fernandes, S. Assessment of Automated Measurement and Verification (M&V) Methods. Available online: https://cloudfront.escholarship.org/dist/prd/content/qt636424jc/qt636424jc.pdf (accessed on 6 June 2019).
  42. ABNT NBR 7256:2005 Tratamento de ar em estabelecimentos assistenciais de saúde (EAS)—Requisitos para projeto e execução das instalações. Available online: https://www.google.com.tw/url?sa=t&rct=j&q=&esrc=s&source=web&cd=2&cad=rja&uact=8&ved=2ahUKEwimxObP9IHjAhXQfXAKHZ5_Bo0QFjABegQIABAC&url=http%3A%2F%2Fwww.crea-rs.org.br%2Fsite%2Fdocumentos%2Flinks3%2FApresentacao_9_11_12_revA.ppt&usg=AOvVaw2OMG2iWWm0o9jU692UMvTk (accessed on 6 June 2019).
  43. Health Technical Memorandum (HTM) 03-01: Specialised ventilation for healthcare premises. Part A—Design and Validation. Available online: https://www.google.com.tw/url?sa=t&rct=j&q=&esrc=s&source=web&cd=1&cad=rja&uact=8&ved=2ahUKEwisibDl9IHjAhXSP3AKHXqLCz0QFjAAegQIBBAB&url=https%3A%2F%2Fwww.gov.uk%2Fgovernment%2Fpublications%2Fguidance-on-specialised-ventilation-for-healthcare-premises-parts-a-and-b&usg=AOvVaw2Qh8OZrHMnhMvrmXc8uj2M (accessed on 6 June 2019).
  44. ASHRAE, ANSI/ASHRAE/ASHE Standard 170-2017 Ventilation of Health Care Facilities. Available online: https://www.google.com.tw/url?sa=t&rct=j&q=&esrc=s&source=web&cd=3&cad=rja&uact=8&ved=2ahUKEwjUk9S49YHjAhUF7WEKHZauBTwQFjACegQIAhAB&url=https%3A%2F%2Fblog.ansi.org%2F2017%2F12%2Fansiashraeashe-standard-170-2017%2F&usg=AOvVaw3e5l0-u45UpQiQUdJSAY7v (accessed on 6 June 2019).
  45. AFNOR, NF903 S–S51 Établissements de santé—Zones àenvironnement maîtrisé- Exigences relatives àla maîtrise de la contamination aéroportée. Available online: https://www.google.com.tw/url?sa=t&rct=j&q=&esrc=s&source=web&cd=1&cad=rja&uact=8&ved=2ahUKEwi_1MCh9oHjAhXQFIgKHZwlAQQQFjAAegQIAxAB&url=https%3A%2F%2Fwww.boutique.afnor.org%2Fnorme%2Fnf-s90-351%2Fetablissements-de-sante-zones-a-environnement-maitrise-exigences-relatives-a-la-maitrise-de-la-contamination-aeroportee%2Farticle%2F809391%2Ffa168416&usg=AOvVaw3Ls1hN-uk10JEMgAYYDby3 (accessed on 6 June 2019).
  46. American Society of Heating, Ventilating, and Air Conditioning Engineers (ASHRAE). Guideline 14-2014, Measurement of Energy and Demand Savings; Technical Report; American Society of Heating, Ventilating, and Air Conditioning Engineers (ASHRAE): Atlanta, GA, USA, 2014. [Google Scholar]
  47. Agami Reddy, T. Literature Review on Calibration of Building Energy Simulation Programs: Uses, Problems, Procedure, Uncertainty, and Tools, ASHRAE Transactions. Available online: https://www.google.com.tw/url?sa=t&rct=j&q=&esrc=s&source=web&cd=1&cad=rja&uact=8&ved=2ahUKEwiKm6D19YHjAhXNdHAKHeCoAB4QFjAAegQIAhAC&url=http%3A%2F%2Fauroenergy.com%2Fwp-content%2Fuploads%2F2016%2F05%2F2006_Reddy_ASHRAE-Trans_Literature-Review-on-Calibration.pdf&usg=AOvVaw0tAtLFVia3ct_rI3UsGOEx (accessed on 6 June 2019).
Figure 1. General view of operating room number 2.
Energies 12 02433 g001
Figure 2. Interface of the SIEMENS’ SCADA showing the main parameters of AHU function.
Energies 12 02433 g002
Figure 3. Particle measurement system.
Energies 12 02433 g003
Figure 4. Simulation diagram implemented in TRNSYS.
Energies 12 02433 g004
Figure 5. Particle measured values (0.5 μm).
Energies 12 02433 g005
Figure 6. Simulated particles. Size: 0.5 μm. Red line: simulated particles. Green line: real particles. Blue line: airflow.
Energies 12 02433 g006
Figure 7. Simulated particles Size: 5 μm. Red line: simulated particles. Green line: real particles. Blue line: airflow.
Energies 12 02433 g007
Figure 8. Simulation results during 24 h (Case 3).
Energies 12 02433 g008
Figure 9. Annual energy demand in the surgical suite and operating room 2 (Case 3).
Energies 12 02433 g009
Figure 10. Energy demand and particles simulated in the five different cases.
Energies 12 02433 g010
Table 1. ISO Classes of air cleanliness by particle size (ISO 14644-1:2015) [10].
ISO Class Number (N)Maximum Allowable Concentrations (Particles/m3) for Particles Equal to and Greater than the Considered Sizes, Shown below a
0.1 μm0.2 μm0.3 μm0.5 μm1 μm5 μm
5100,00023,70010,200352083229
61,000,000237,000102,00035,2008320293
7bbb352,00083,2002930
8bbb35,200,0008,320,000293,000
a All concentrations in the table are cumulative. b Concentration limits are not applicable in this region of the table due to very high particle concentration.
Table 2. Power consumption in the operating room.
EquipmentPower [W]EquipmentPower [W]
Batteries of the operation table800 (1)Electrosurgical unit1150 (6)
PC175 (2)Insufflator (laparoscopy tower)220
Anesthesia table and monitor276Video (laparoscopy tower)150
Monitor (wall)202Xenon light (laparoscopy tower)92/130/280/300 (7)
Monitor (arms) (x3)84Electrosurgical unit (lap. tower)1150 (8)
Small monitor (arm)30Laser2800 (9)
Mattress heater1035 (3)Ultrasound machine580/700 (9)
Blood heater1150 (4)Extra laparoscopy tower- (10)
Volumetric pump- (5)
(1) Charged in periods of inactivity (2) Always ON (3) Used in long operations (4) Intermittent electrical resistance (5) Negligible consumption (6) Maximum value (7) Stand-by/Low use/High use/Maximum (8) Very rare use (9) Nominal value (10) Same consumption as the main tower.
Table 3. Equipment in AHUs.
Quantitative Variable in AHUSensor ModelUncertainty
Preheating valveSSA61
Cold valveSSC61
Heat valveSSA61
Temperature and humidity probe pipeQFM2160
Temperature probe preheatingQAM2120.040
Differential pressure probeQBM66.202
Engine operation pressure switchQBM81-5
Engine gate / valveGEB131.1E
Contaminated filter pressure switchQBM81-5
Temperature and humidity probeQFA2060
Supply airflow rateQBM66.201 ±3 % at 0.200 Pa
Return airflow rateQBM66.201±3 % at 0.200 Pa
Table 4. Parameters calculated using experimental data.
Ventilation FlowParticles 0.5 μm/m3Particles 5 μm/m3
[ACH]Increase [part/pers]Rate of Descent [part/min]Increase [part/pers]Rate of Descent [part/min]
2530772978656471
18397718741083367
12477512501296413
949278081548198
Table 5. Ventilation flows of the studied cases.
VentilationCase 1 (Brazil)Case 2 (UK)Case 3 (HULA)Case 4 (USA)Case 5 (France)
ACH302521.52015
Table 6. Mean measured values during the test.
Ventilation FlowParticle Size 0.5 μmParticle Size 5 μm
ACHOccupancyOccupancy
01480148
2571076064925717,699918101419514012
18625116,20211,92319,9501071311526535018
12574214,93816,43526,4761024246237696699
99843531522,02334,3711926121061499846
Table 7. Simulation error during the tests.
ErrorParticles 0.5 µmParticles 5 µm
CV(RMSE)2.07%2.55%

