Article

Carbon Capture for CO2 Emission Reduction in the Cement Industry in Germany

1
Institute of Energy and Climate Research, Electrochemical Process Engineering (IEK-3), Forschungszentrum Jülich, D-52425 Jülich, Germany
2
Institute of Solar Research, Deutsches Zentrum für Luft- und Raumfahrt/German Aerospace Center (DLR), Linder Höhe, D-51147 Köln, Germany
3
Chair for Fuel Cells, RWTH Aachen University, D-52056 Aachen, Germany
*
Author to whom correspondence should be addressed.
Energies 2019, 12(12), 2432; https://doi.org/10.3390/en12122432
Submission received: 8 May 2019 / Revised: 11 June 2019 / Accepted: 16 June 2019 / Published: 24 June 2019
(This article belongs to the Section B: Energy and Environment)

Abstract

:
The share of global CO2 emissions deriving from the cement industry is about 5%. More than 50% of these are process-related and cannot be avoided. This paper addresses the application of CO2 capture technology to the cement industry. Analyses focusing on post-combustion technology for cement plants are carried out on the basis of detailed model calculations. Different heat supply variants for the regeneration of loaded wash solution were investigated. CO2 avoidance costs are in a range of 77 to 115 EUR/tCO2. The achievable CO2 avoidance rate for the investigated cases was determined to be 70% to 90%. CO2 reduction potentials were identified using CCS technology, focusing on the German cement industry as a case study. The results show that adopting carbon capture technology could lead to a significant reduction in CO2 emissions.

1. Introduction

Combatting climate change and mitigating its effects are on the agendas of governments worldwide. As part of the German Climate Action Plan 2050 [1] (“Klimaschutzplan 2050”), the government has set the goal of reducing greenhouse gas (GHG) emissions by at least 55% by 2030 and by 80–95% through 2050 against 1990 emission levels. Such a substantial GHG emissions reduction cannot be achieved through the Energiewende (energy transition) in the energy sector alone. In fact, all sectors, i.e., energy, industry, transport, agriculture, and households will need to correspondingly and radically cut their GHG emissions in order to achieve the German government’s ambitious goals.
Whereas the transport, household, and industry sectors, in many cases, can reduce their GHG emissions with the so-called “sector coupling” approach [2], in other areas, in which process-related CO2 emissions occur, this approach would not work for all emissions. Hence, other options, for example in steel production with the use of hydrogen, have to be investigated [3]. Another area in which these process-related CO2 emissions occur is the cement industry. In total, 4% of global anthropogenic CO2 emissions are contributed by the cement industry [4,5]. The CO2 emissions of the German cement industry in 2017 amounted to approximately 20.5 Mt, which is 2.5% of total national CO2 emissions [6]. Since the 1950s, the German cement industry has already halved its power consumption (to 2800 kJth/kg cement today) through a variety of different technological approaches and measures (e.g., the substitution of fossil fuels by waste and alternative fuels, increased energy efficiency, etc.) [7]. In order to further reduce GHG emissions, the substitution of fossil fuels by renewable energy sources is a promising pathway to further cut the industry’s CO2 emissions. However, only about 40% of a cement plant’s overall CO2 emissions are produced through the burning of fossil fuels. The remaining 60% of all carbon dioxide emissions in a cement plant stem from the calcination reaction, in which clinker, the main component of cement, is formed [8,9]. Hence, process enhancements and the substitution of fossil fuels by renewable energy sources alone only show limited potential for further cutting GHG emissions in the future.
In some CO2 reduction scenarios for Germany [10,11,12], carbon capture technology in the cement industry is seen as an important measure to achieve the ambitious CO2 reduction goals by 2050. Compared with other CO2 mitigation measures, Pfluger et al. [12] conclude that carbon capture in the cement industry is a cost-effective option as part of an overall mitigation strategy. Furthermore, the captured CO2 may play an important role as a feedstock for other applications (power to chem, power to liquid, methanation) [13,14,15]. However, the use of carbon capture technology will depend significantly on cost effectiveness.
Carbon capture, utilization, and storage (CCUS) technologies have been proposed in the literature as a viable technological pathway to radically cut CO2 emissions in the cement industry by separating CO2 from flue gas. In this paper, a system analysis to explore the feasibility of the monoethanolamin (MEA)-based chemical absorption technology is carried out. The potential for energetically and economically reducing the cement industry’s CO2 emissions is examined. The analysis focuses on the cement industry in Germany. CO2 emission projections for clinker production and emission reduction potentials are also investigated.
The structure and content of the paper are briefly summarized as follows: State-of-the-art cement production processes and a literature review regarding post-combustion CO2 capture technology are outlined in Section 2; modeling of CO2 capture using MEA absorption can be found in Section 3; four capture cases for using CO2 capture in cement plants are investigated in Section 4. The energetic and economic analyses for these scenarios and sensitivity analysis are then carried out. The simulation results are compared to the literature data. Furthermore, the potential for reducing CO2 emissions in Germany using chemical absorption technologies is explored.

2. CO2 Capture in Cement Production

In this section, the fundamentals for the subsequent analysis are laid out and the relevant literature is assessed. Section 2.1 introduces the cement production process. A brief overview of the status quo of the German cement industry is then given. Section 2.2 focuses on post-combustion amine scrubbing technologies. Relevant literature is reviewed and discussed.

2.1. State of the Art Cement Plant

Today, all newly built plants are dry process plants with cyclone preheaters and precalciners and are considered state-of-the-art [16]. Cyclone preheaters are arranged in towers of one to six preheaters that reach heights of up to 120 m. The raw meal passes the preheaters from the top to the bottom while the (hot) flue gas stream from the kiln passes the preheaters in the counter flow. Hence, the raw material is heated and the remaining water vaporized [17].
The raw meal then enters the precalciner, where it reaches the temperature necessary to drive the calcination reaction of around 900 °C. In the precalciner, the raw material reaches levels of 90% calcination. In order to ensure sufficient thermal energy input, fuel is consumed in the precalciner and makes up to 60–70% of the overall fuel consumption [18]. A so-called tertiary air duct provides the precalciner with combustion air from the clinker cooler. Typically, the material is fed into the precalciner from the second lowest preheater column and the calcined material is collected in the lowest preheating column before being released into the rotary kiln [19]. The material coming from the second lowest preheater is entrained by the combustion gases and lifted to the bottom preheater in the co-current flow [20].
After sintering, the clinker is cooled down and stored in silos. The clinker produced is ground alone or together with additives to form fine ground cement. Additives or other cement constituents (such as quartz sand, gypsum, etc.) are separately milled and ground and then mixed into the clinker. Different kinds of cement (with different chemical and mechanical properties) are produced by adjusting the blending steps. After blending, the product is stored and shipped [17]. The clinker and cement mass produced are linked by the clinker-to-cement ratio, which equaled 0.72 in Germany in 2016, i.e., 720 kg clinker is used to produce 1 ton of cement [21].
The Verein Deutscher Zementwerke (VDZ, German Cement Association) lists 22 companies that operate 53 cement plants in Germany [21]. Thirty-nine dry process cyclone preheater plants with a capacity of 0.1 Mt/d, as well as 6.7 kt/d of shaft kilns and grate preheater plants are in operation. Plants without clinker production are supplied with clinker and produce cement by means of clinker milling and blending with other raw materials. In Germany, 36% of the total clinker volume produced in 2014 was produced in a dry process with preheater and precalciner, 58% were produced in a dry process with preheater but without precalciner, and 7% were produced in a mixed process (dry/wet) [22].

2.2. Literature Review about CO2 Capture for Cement Plants

Post-combustion, oxyfuel and calcium looping carbon capture technologies have been proposed to effectively reduce CO2 emissions in the cement industry [19,20,23,24,25,26]. However, due to the advancements and existing process knowledge of post-combustion (in the power sector), amine scrubbing, in particular, is generally regarded as being the technologically most mature option [27]. In addition, the post-combustion process offers the possibility of retrofitting. Hence, the focus of this paper is post-combustion amine-scrubbing.
In the literature, the utilization of CO2 capture for cement production, as well as its costs and CO2 reduction potential, has been widely investigated. The following section provides an overview of the existing literature, approaches, and the results of investigating post-combustion for cement production. The technical and economic parameters used in different studies are listed in Table A1 (Appendix A).
For the European Union’s “CO2 capture from cement production (CEMCAP)” project, the Norwegian research organization, SINTEF, simulated an MEA-based capture process for a cement plant based on data provided by a VDZ process model and evaluated different scenarios for steam production [23,28]. The reference cement plant used for the calculations is based on VDZ’s best available technology (BAT) (dry process, a five-stage cyclone preheater and precalciner, clinker output: 1 Mt/a). The results show that compared to a 33% decrease in the CO2 capture rate in the scenarios, the costs for the cement product are only reduced by 14%, from 80.6 EUR/tcement to 70.5 EUR/tcement (90% and 60% CO2 capture rates, respectively). The investigated steam supply scenarios show that a rising rate of waste heat recovery, low cost heat from a nearby steam supplier (e.g., a power plant), or an in-house combined heat and power (CHP) plant (provided that high electricity prices are achieved) can significantly reduce the costs of CO2 capture.
Hassan [29] conducted a study estimating the costs of MEA scrubbing for a reference cement plant (clinker production capacity: 2400 t/d) in Canada. Additional necessary flue gas treatment was not considered in the simulation. However, for the economic assessment, the author used literature values to estimate the costs of the bag filters and flue gas desulphurization (FGD). The costs per ton of CO2 captured are estimated to vary between 49 and 54 USD. The author shows that the biggest cost factor is steam, representing roughly 40% of the overall CO2 capture costs, followed by variable operating and maintenance (O&M) costs (~18%), fixed O&M (~8%), and annual capital costs (~5%).
Barker et al. [18,30] evaluated the costs of cement production with and without CO2 capture for different scenarios. As a base case for the analysis, a dry feed plant with a capacity of 910,000 tclinker/a in the UK is assessed. In a sensitivity case, the performance of a 3 Mtcement/a plant in Asia was considered. Post-combustion and oxyfuel combustion processes were also assessed and analyzed. The major cost drivers for post-combustion capture process are the flue gas desulphurization (FGD) unit, as well as the steam supply for the stripper. Therefore, in the case of co-location with a power plant supplying steam at low cost and allowing the flue gas to pass, the power plant’s FGD equipment would have avoidance costs of 55 EUR/tCO2, as is shown in the study.
Kuramochi et al. [31] conducted a techno-economic analysis and compared the costs and suitability of CO2 capture for consistent boundary conditions in the industrial sectors of cement, iron, and steel, as well as petrochemicals and petroleum refineries. By using standardized assumptions and framework conditions for assessing the application potential of CO2 capture for the different industry sectors, the authors aimed to conduct a transparent comparison of the different sectors. For a short-term (10 to 15 years) assessment, the MEA technology with steam import from a power plant or boiler and onsite combined heat and power (CHP) and CO2 capture, as well as KS-1 capture process, are assessed. For the long term (more than 20 years), post-combustion with an advanced solvent, oxyfuel combustion, and calcium looping (CaL) were assessed. The results indicate that technologies available in the long term might prove considerably more cost effective, ranging from avoidance costs of 37 EUR/tCO2 for advanced solvent post-combustion capture (PCC) (steam imported from a power plant), to 52 EUR (steam imported from a boiler). The expected CO2 avoidance lies between 0.5–0.7 tCO2/tclinker (short term) and 0.4–0.7 tCO2/tclinker (long term).
Jakobsen et al. [32] calculated the costs of a demonstration CO2 capture plant for an existing coastal cement plant in Norway. In contrast to many other studies, they included detailed scenarios of CO2 transportation and storage costs. The CCUS options assessed were: MEA-based, advanced solvent-based, and membrane capture processes combined with CO2 pipeline transport or shipping to a storage location. Different storage scenarios were assessed, such as storage in depleted oil and gas fields, saline aquifers, and CO2 utilization for enhanced oil recovery. The scenarios show CO2 avoidance costs of 100 EUR/tCO2 to 150 EUR/tCO2. Due to the relatively low carbon capture rate and the detailed investigation of the storage scenarios, these costs are higher compared to other values in the literature.
Zhou et al. [33] investigated different carbon dioxide emission reduction scenarios by applying CCUS to China’s cement industry. The plant size was assumed to be 5000 tclinker/d and three cases (i.e., MEA system with imported steam, onsite CHP, and precalciner oxyfuel CCUS) were investigated and compared to a CO2 capture plant for a 600 MWel coal power plant. The data input for the cost estimations were derived from the literature and no plant simulation was conducted. In terms of flue gas treatment, the authors assumed that in future, more stringent future regulations will lead to a general installation of advanced DeNOx and FGD equipment in the cement industry. According to this report, the CO2 avoidance cost is 45 €/t CO2, which is lower than the values reported by other literature. The reasons for this might include that the flue gas treatment costs were not taken into account and that the costs of deploying CCUS plants to the Chinese market were assumed to be lower than the literature values for Europe and the US. Defining different emission scenarios, the authors show that CO2 capture has the potential to reduce the Chinese cement sector’s CO2 emissions by up to 57% by 2030.
Ho et al. [34] estimated the costs of MEA chemical CO2 absorption for different industrial sectors in Australia. Specifically, the authors focused on the estimation of the capture costs, while transport and storage were neglected. The flue gas parameters were drawn from Hassan [29]. A techno-economic model developed at the University of New South Wales was used to assess the different technologies. The necessary steam is supplied from a natural gas CHP plant and the costs are assumed to be those of “lost electricity production” with 100 USD/MWel. Consistent with other research, the results show that the gas pre-treatment, such as FGD, SCR (selective catalytic reduction), and flue gas cooling, and the MEA plant itself, together amount to 70% of the total equipment costs (6% to 15% of the total capture costs in all sectors). The operating costs are dominated by the energy costs (35% to 70%, depending on the sector investigated). Interestingly, the cement-specific avoidance costs are, at 68 USD/tCO2, of the same size and even slightly cheaper than the costs of the coal power plant investigated, with 70 USD/tCO2.
Summers et al. [35] conducted an analysis for various industry sectors regarding their costs of CO2 capture and CO2 avoidance potential. The authors used the cement flue gas specifications as given in Hassan’s work to study the potential of applying MDEA scrubbing to an average US cement plant. Flue gas treatment was only considered in the sensitivity analysis. For the base case, it was assumed that the flue gas already reached adequate pollutant levels. The authors calculated the total costs for a greenfield, namely a newly built cement plant, and retrofit case, assuming that the retrofit costs are 5% higher than those of the greenfield case. The estimated costs of CO2 capture are estimated to be 96 USD. By multiplying the CO2 emission factor per ton of cement (1.2 tCO2/tcement) with overall cement production in the US, they estimate the CO2 available for CO2 capture in the US cement industry to be 79.8 Mt.

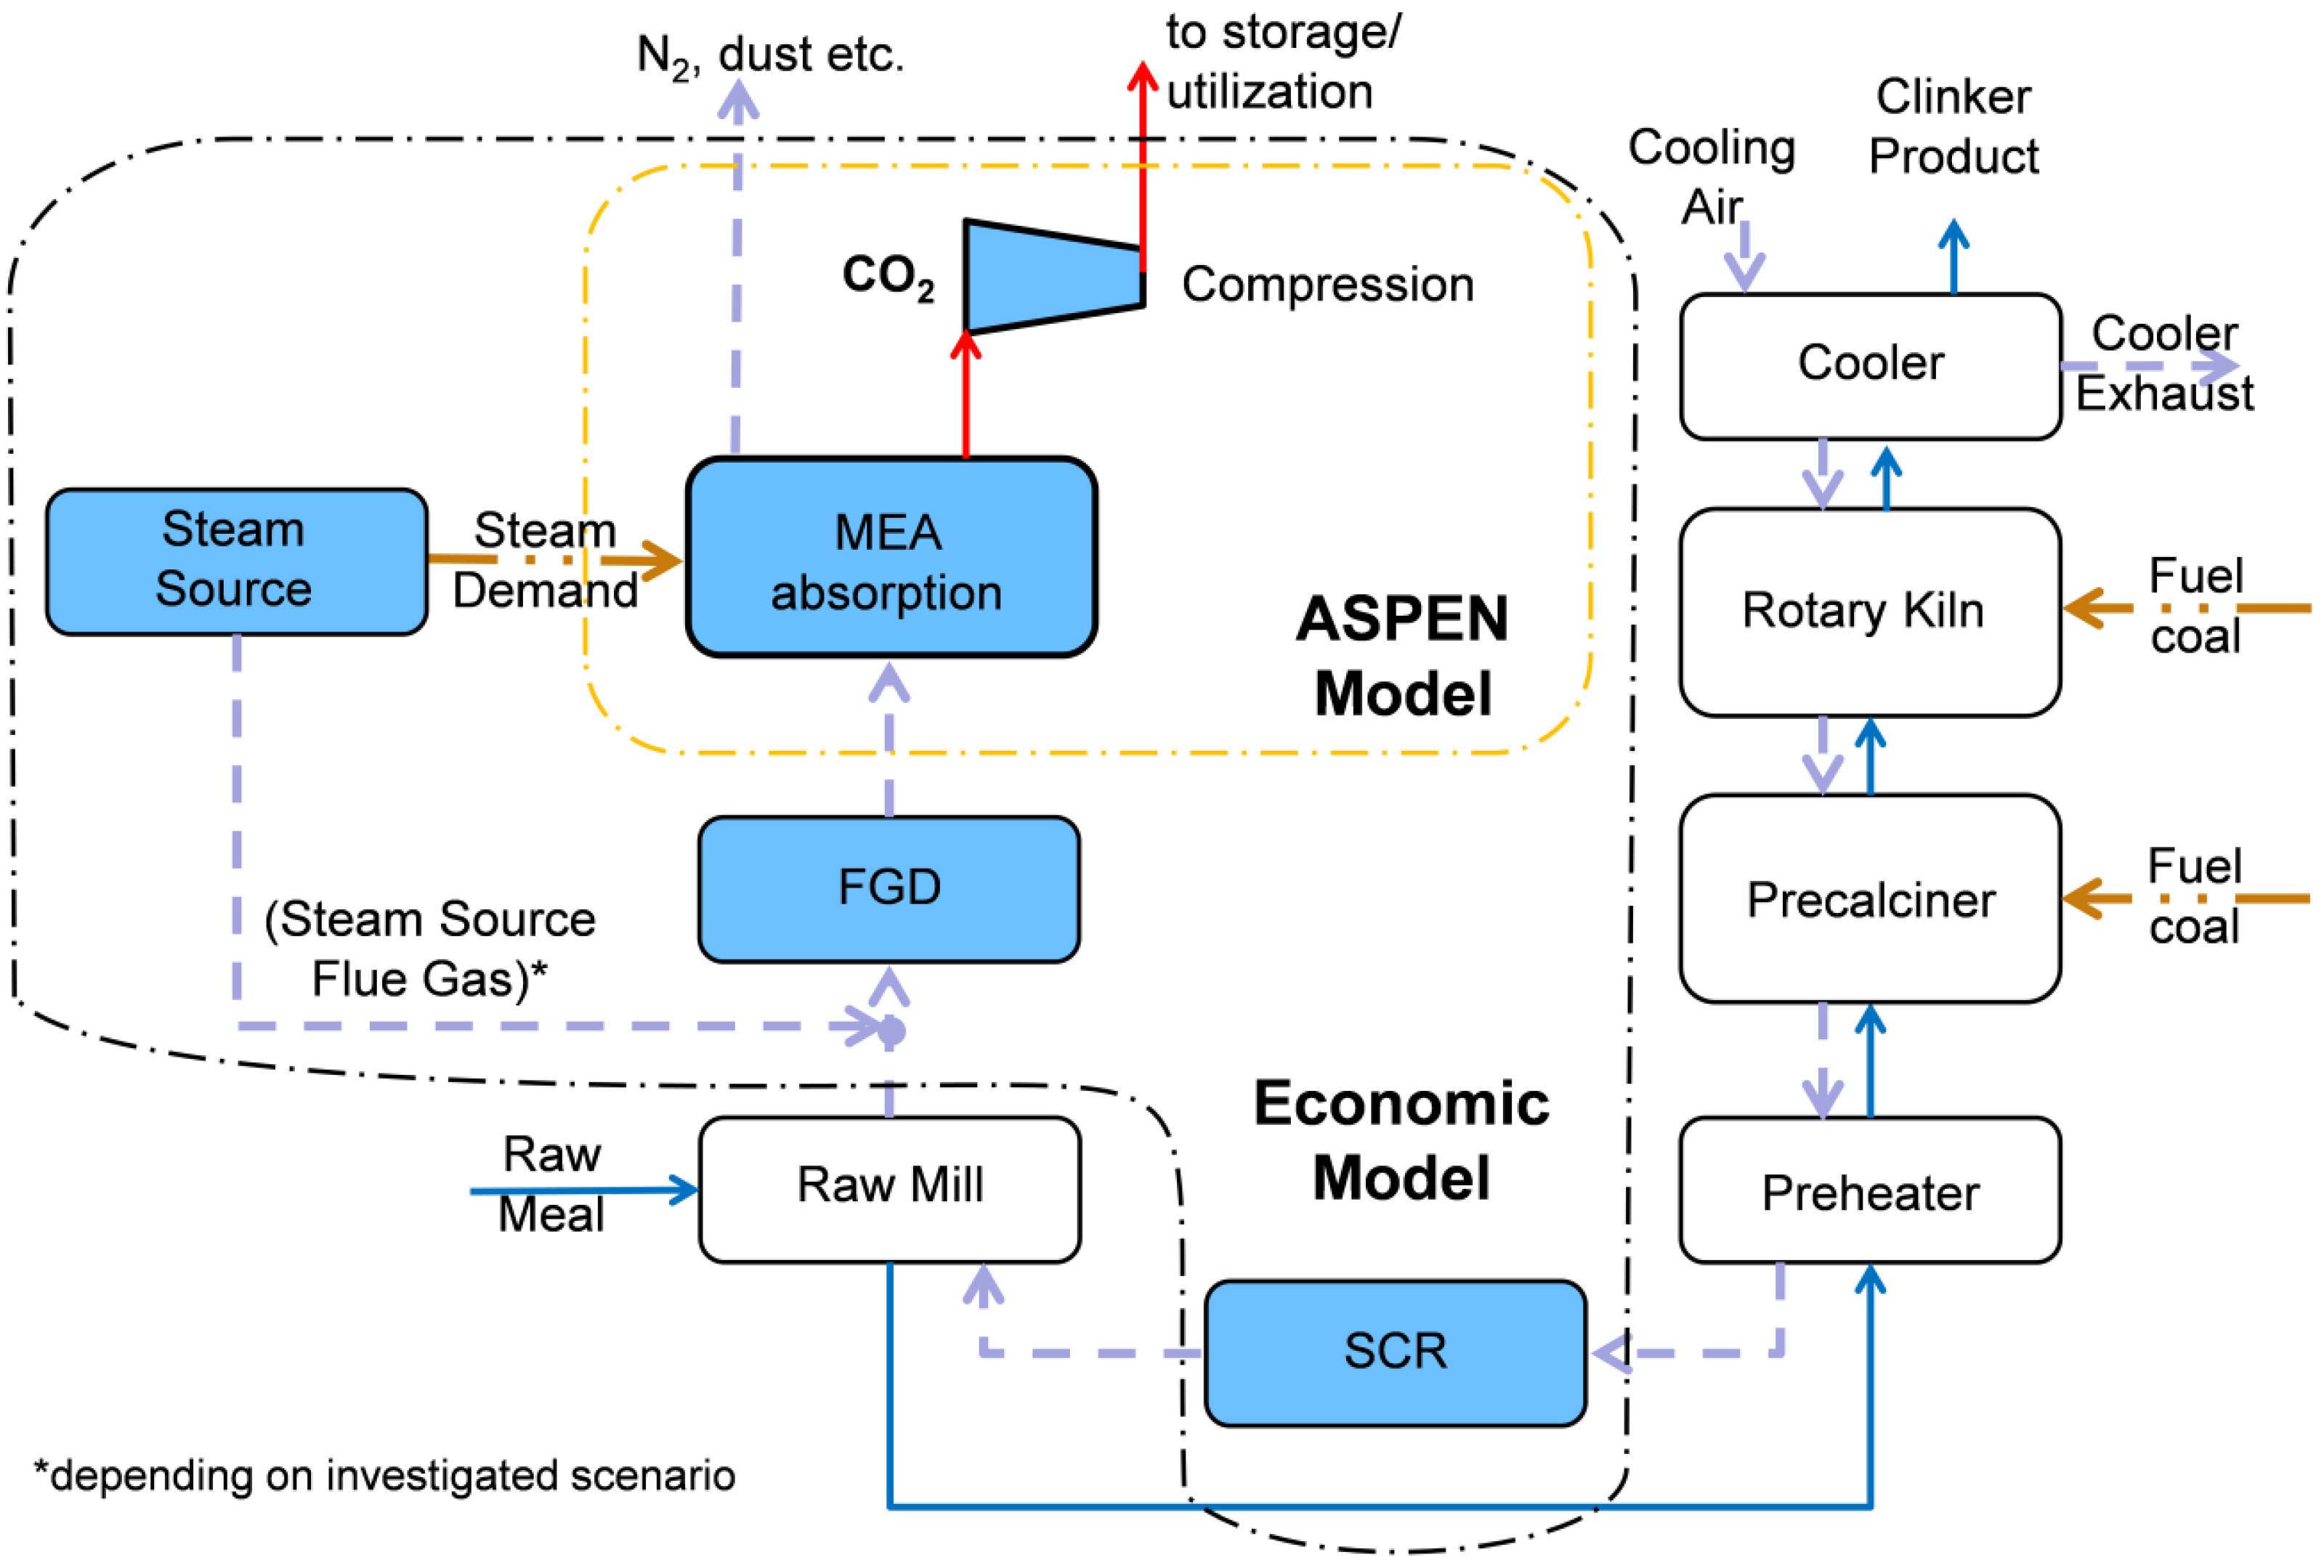
3. Modeling of the CO2 Capture

Cement plant specifications are derived from the literature, real cement plant data, and simulation data [16,18,23,24,29,36,37,38,39]. It is impossible to obtain specific plant data from the German cement industry, as precise flue gas data are classified as ‘competition data’ and, hence, is not publicly available.
The plant investigated here is a dry process plant with a five-stage cyclone preheater, a precalciner with a tertiary air duct, rotary kiln, and grate cooler. The production capacity is 3000 tclinker/d and 1 Mtclinker and 1.36 Mtcement per year (clinker to cement ratio of 0.74), corresponding to a run time of around 330 d (~8000 h). Specific CO2 emissions account for 850 kgCO2/tclinker. The reference cement kiln is based on the best available technology (BAT) document by the European Union [16] and describes state-of-the-art cement plants in Europe. For a more detailed account, see the literature [20,23,24].
Air leaks affect the flue gas volume flow and the CO2 content. The lower the leakage, the higher the CO2 content. It is assumed that during the yearly general inspection of the plant, all air sealings in the raw mill are checked and, if necessary, renewed. Hence, in the first months after the revision, the low air leak mode applies, while during the latter half of the operational year, the medium air leak case is reached as air sealings become degraded during operation. In a conservative approach, similar to the work done in CEMCAP [20], in this paper, the medium air leak is regarded as the base case. Table 1 compares the flue gas conditions at the stack for the operational modes described in the literature [20].

3.1. Energy Modeling

A process (Figure 1) for using MEA to capture CO2 from a cement plant is proposed, similar to the study of IEAGHG [18]. The flue gas from the preheater enters an SCR in which NOx emissions are reduced to an acceptable limit. After the raw mill, SO2 emissions are reduced to an acceptable limit in the FGD unit. The flue gas is led to the chemical absorption plant, where CO2 is separated from the flue gas, compressed, and utilized or stored. The CO2-free flue gas (contains ~2 mol% CO2) is emitted to the atmosphere.
An Aspen Plus model used for the energetic analysis only includes the MEA absorption and CO2 compression. The FGD unit and SCR unit are only considered in the economic model and their respective CO2 emissions and electric work consumption are included in the energy analysis.
In order to assess the energy performance of the CCUS plant in comparison to that in other studies, indicators are calculated. These are the specific thermal energy requirement and cooling duty in [MJth/kgCO2] and the specific compression work and electricity consumption in [MJel/kgCO2]. The equations for their calculation are given in Table 2, below. m C O 2 , c a p is the annual mass of CO2 captured and the simulation results.
An Aspen Plus model of a chemical CO2 capture plant has been developed and is adopted for the present analysis and shown in Appendix B.

3.2. Economic Modeling

The Aspen Plus simulation results are used to derive the carbon capture plant’s cost and economic performance indicators. The capture plant costs are estimated by first determining the costs of equipment purchased and then calculating the CAPEX (CAPital EXpenditure) and OPEX (OPerational EXpenditure) of the plant. Abu-Zhara et al. [40] present a methodology for estimating the economics of CCUS in coal power plants. Their methodology is applied here. The estimation methodology is based on the calculation of the purchased equipment costs (PEC) and is expected to achieve an accuracy of ±20% to 30% compared to the real project costs [41]. The PECs are the costs of all the equipment as shipped by the supplier. All of these were converted to EUR2016 using the chemical engineering plant cost index (CEPCI) obtained from the literature [42,43]. For converting USD to EUR, an exchange rate of 1.11 USD/EUR2016 is used.
The annual costs for carbon capture are, therefore, calculated by the summation of OPEX and the annual CAPEX depreciation: Annual CAPEX depreciation is calculated as the product of CAPEX and annuity. CO2 capture costs, avoidance costs, and clinker costs are determined by the division of the annual costs by the mass of CO2 captured m C O 2 , c a p , avoided and clinker produced, respectively. The equations are given in Table 3. The calculation boundary conditions and data for CAPEX and OPEX can be found in Appendix C and Appendix D.
It is important to distinguish the CO2 capture cost from the CO2 avoidance cost. The distinction is caused by the difference between the amounts of CO2 captured and avoided. The amount of CO2 captured refers to the absolute amount of CO2 captured by the capture system. The amount of CO2 avoided, however, equals the amount of CO2 captured minus the additional CO2 ( m C O 2 , a d d i t i o n a l ) generated because of using the capture system. Therefore, it is normally smaller than the amount of CO2 captured. In this study, the additional emissions stem from emissions associated with the steam production, m C O 2 , s t e a m , and indirect CO2 emissions from electricity consumption, m C O 2 , e l .

3.3. Analyzed Cases for CO2 Capture

Four cases are distinguished in the following (Table 4). In the base case as well as in case 2, imported steam is used to meet the reboiler heat demand. Between both cases, the amount of false air in the flue gas varies. Case 3 assesses the utilization of a coal boiler to generate steam onsite, while in case 4, a coal CHP is used for this purpose. The case definitions and assumptions are summarized in Table 4. What should be noted here is that, as discussed above, more frequent renewal of the sealings would lead to less CO2 leakage. Nonetheless, this is not considered as a CO2 abatement strategy in the present paper because this paper is focused on examining the feasibility of the MEA technology in capturing CO2 from a cement plant. Therefore, any changes that would interfere with the original operation of the cement plant is not in the scope of the research.
• Base case
In the base case, the cement plant is operated in a medium air leak interconnected mode (see Table 1). The CO2 content in the flue gas is 18 mol%. It is assumed that the steam suitable for the reboiler duty is imported from a nearby coal power plant at 8 EUR/t associated with CO2 emissions at the steam generator of 152 kgCO2/MWhth (the steam emission data were interpolated from the CEMCAP study for steam from a coal CHP at 131 °C). Electricity is bought from the grid at the given costs and associated with 516 kgCO2/MWhel emissions.
• Case 2: Low Air Leak
In case 2, the cement plant is operated in low air leak interconnected mode. The CO2 content in the flue gas of 22 mol% is 4 mol% higher than that in the base case. The same assumptions for the steam and electricity import as for the base case apply.
• Case 3: Coal Boiler
In case 3, the cement plant is operated in medium air leak interconnected mode, as in the base case. However, steam is not imported but produced onsite in a coal boiler. The CO2 from the coal boiler is also captured in the CCUS plant. Electricity is imported under the same conditions as above.
• Case 4: Coal-fired CHP
In case 4, steam is supplied by a coal CHP and the electricity can be produced in parallel for the carbon capture plant and cement plant. The cement plant’s flue gas is that of medium air leak operation. The CO2 from the CHP is captured in the CCUS plant. The CHP provides electricity for both the CCUS plant and cement plant. Providing electricity to the cement plant not only leads to cost savings, but also avoids CO2 emissions associated with the cement plant’s electricity consumption.

4. Results and Analyses

4.1. Energetic and Economic Performance

A comparison of all cases in terms of their energetic performance is given in Table 5. The heat demand in the base case is equal to 92 MWth. In case 2, with a 4 mol% higher CO2 content in the flue gas and a smaller overall flue gas rate, the heat demand drops by 3 to 89 MWth. In cases 3 and 4, the heat demand increases as a result of two reasons: (1) A lower CO2 content in the flue gas; and (2) a 60% and 95% higher total flue gas mass flow as the CO2 from the boiler and CHP are also captured, respectively. Hence, in case 4, the flue gas from the CHP nearly equals the cement plant flue gas flow.
The specific thermal energy requirement reflects this. While from the base case to case 2, the thermal energy demand per captured ton of CO2 decreases, it increases in case 3 and case 4. A similar tendency fits for the cooling duty. Total work consumption and compression work stay approximately constant across all cases.
The purchased equipment costs (PEC) are depicted in Figure 2. In the base case, the absorber costs are the major cost factor, followed by the compressor costs, heat exchangers, and pre-scrubber costs. The base case PEC totals 23.8 MEUR.
In case 2, with a smaller flow gas rate, the single equipment costs are reduced, while in cases 3 and 4 the equipment costs rise due to the larger flue gas flow. It is striking that the absorber costs remain constant in all cases. This originates from the simulation set-up in Aspen. Aspen neither calculates nor optimizes the stage number, diameter, or height of the vessel. Hence, in all cases, the geometric parameters were assumed to be identical.
The equipment costs showing the largest sensitivity to the flue gas conditions are those for the pre-scrubber. This is due to the large dependence of the pre-scrubber costs on the flue gas flow rate. As the flue gas flow rate nearly doubles from the base case to case 4, the pre-scrubber costs more than double. In case 4, the pre-scrubber costs surpass the absorber costs, which are then followed by the absorber and multi-compressor stage costs.
The simulation results for CAPEX and OPEX can be found in Appendix E and Appendix F, respectively.
Table 6 and Figure 3 summarize and depict the CO2 capture, avoidance, and clinker costs, as well as the CO2 avoidance rate and associated values.
To calculate the CO2 avoided and captured, as well as the clinker costs, the total annual costs are now allocated to the annual mass of CO2 avoided and captured and clinker. While the CO2 capture rate was defined as 90% in all cases, the CO2 emissions avoided are lower.
In the base case and case 2, CO2 avoidance amounts to 70% and 71%, respectively, due to additional emissions associated with the steam and electricity imported. In case 3, the CO2 avoidance is 74%. The difference stems from the electricity only, as steam is produced in the boiler and the related emissions are captured. In case 4, however, the CO2 avoidance rate equals 90%. This result is achieved because grid electricity for the cement plant is substituted by “CO2-free” electricity from the CHP with capture.
The costs of captured and avoided CO2 are 64 and 82 EUR/t in the base case, 61 and 77 EUR/t in case 2, 61 and 115 EUR/t in case 3, and 54 and 102 EUR/t in case 4, respectively. While the costs of CO2 captured remain close to 60 EUR/t in all cases, the avoidance costs increase in cases 3 and 4. The reason for this behavior is that in cases 3 and 4, the mass of CO2 avoided per year is significantly less than the mass of CO2 captured. Hence, the specific costs of CO2 avoided are higher than the specific costs for capture.
Clinker production costs increase from 108 and 105 EUR/t in the base case and case 2 to 131 and 136 EUR/t in cases 3 and 4. The reason for this is that the costs (CAPEX and OPEX) are broken down into the clinker costs. As these are higher in cases 3 and 4, the specific clinker costs are also higher.

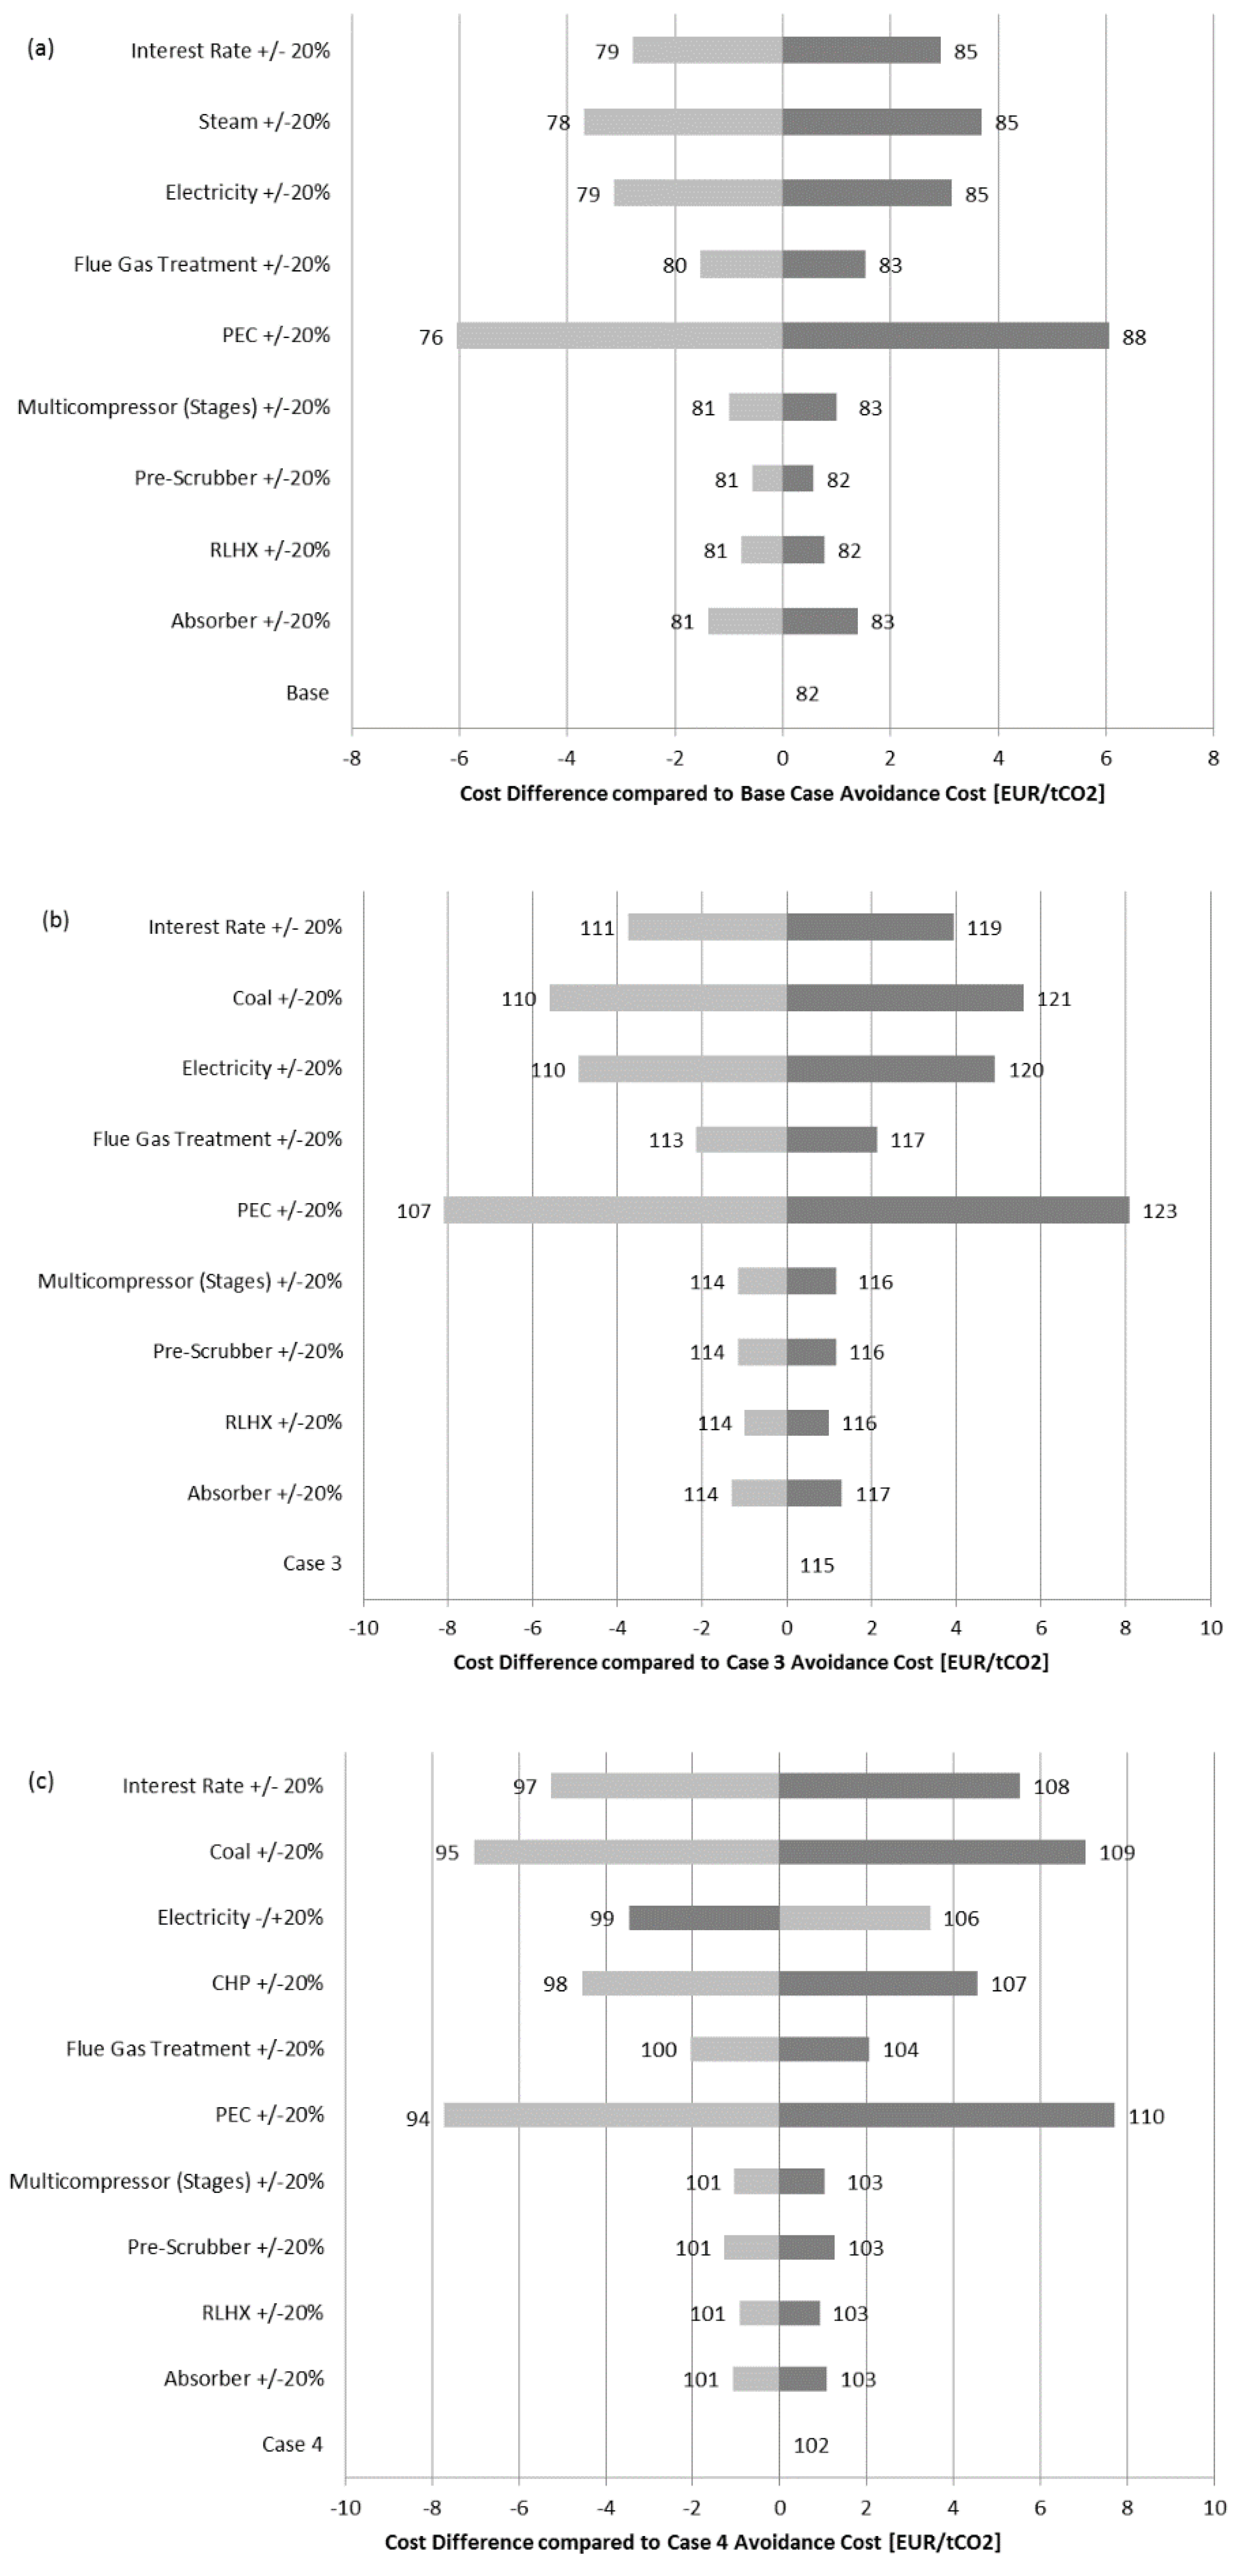
4.2. Sensitivity Analysis

In order to assess the sensitivity of the costs calculated to variations of the input parameters, a sensitivity analysis is conducted for the CO2 avoidance costs for the base case, case 3, and case 4. A sensitivity analysis for case 2 is not conducted, as the results show only a marginal difference compared to the base case. In the analysis, the assumptions or results obtained in the above calculations are varied by +/−20%. Due to the large number of parameters in the analysis of carbon capture for cement plants, the parameters to be varied are chosen on the basis of their relative weighting in the PEC, CAPEX, or OPEX calculation. Figure 4 depicts the results for the base case, case 3, and case 4.
Across all the analyzed cases, the single purchased equipment costs show only a small influence on the CO2 avoidance costs. However, changing the weighting of the PEC in the CAPEX calculation shows the strongest impact on the overall costs. This is not surprising as the CAPEX is a function of the PEC. The second and third largest influencing factors on the avoidance costs are the steam and electricity costs in the base case. In case 3 and case 4, these costs are substituted by the coal and CHP costs, which show a similarly strong influence. In case 4, the electricity costs variations only apply to the cost savings associated with the substitution of electricity from the grid with electricity generated at the CHP. Hence, a higher grid electricity price results in larger cost savings and, hence, smaller avoidance costs and vice versa. The fourth largest sensitivity in the base case and case 3 is the interest rate. In case 4, the interest rate is in third place in terms of impact. This reflects the considerably larger CAPEX in case 4.
The analysis indicates that in all cases, the costs are relatively stable as a variation of ± 20% only has a limited impact of less than 10% on the CO2 avoidance costs for all the parameters investigated.

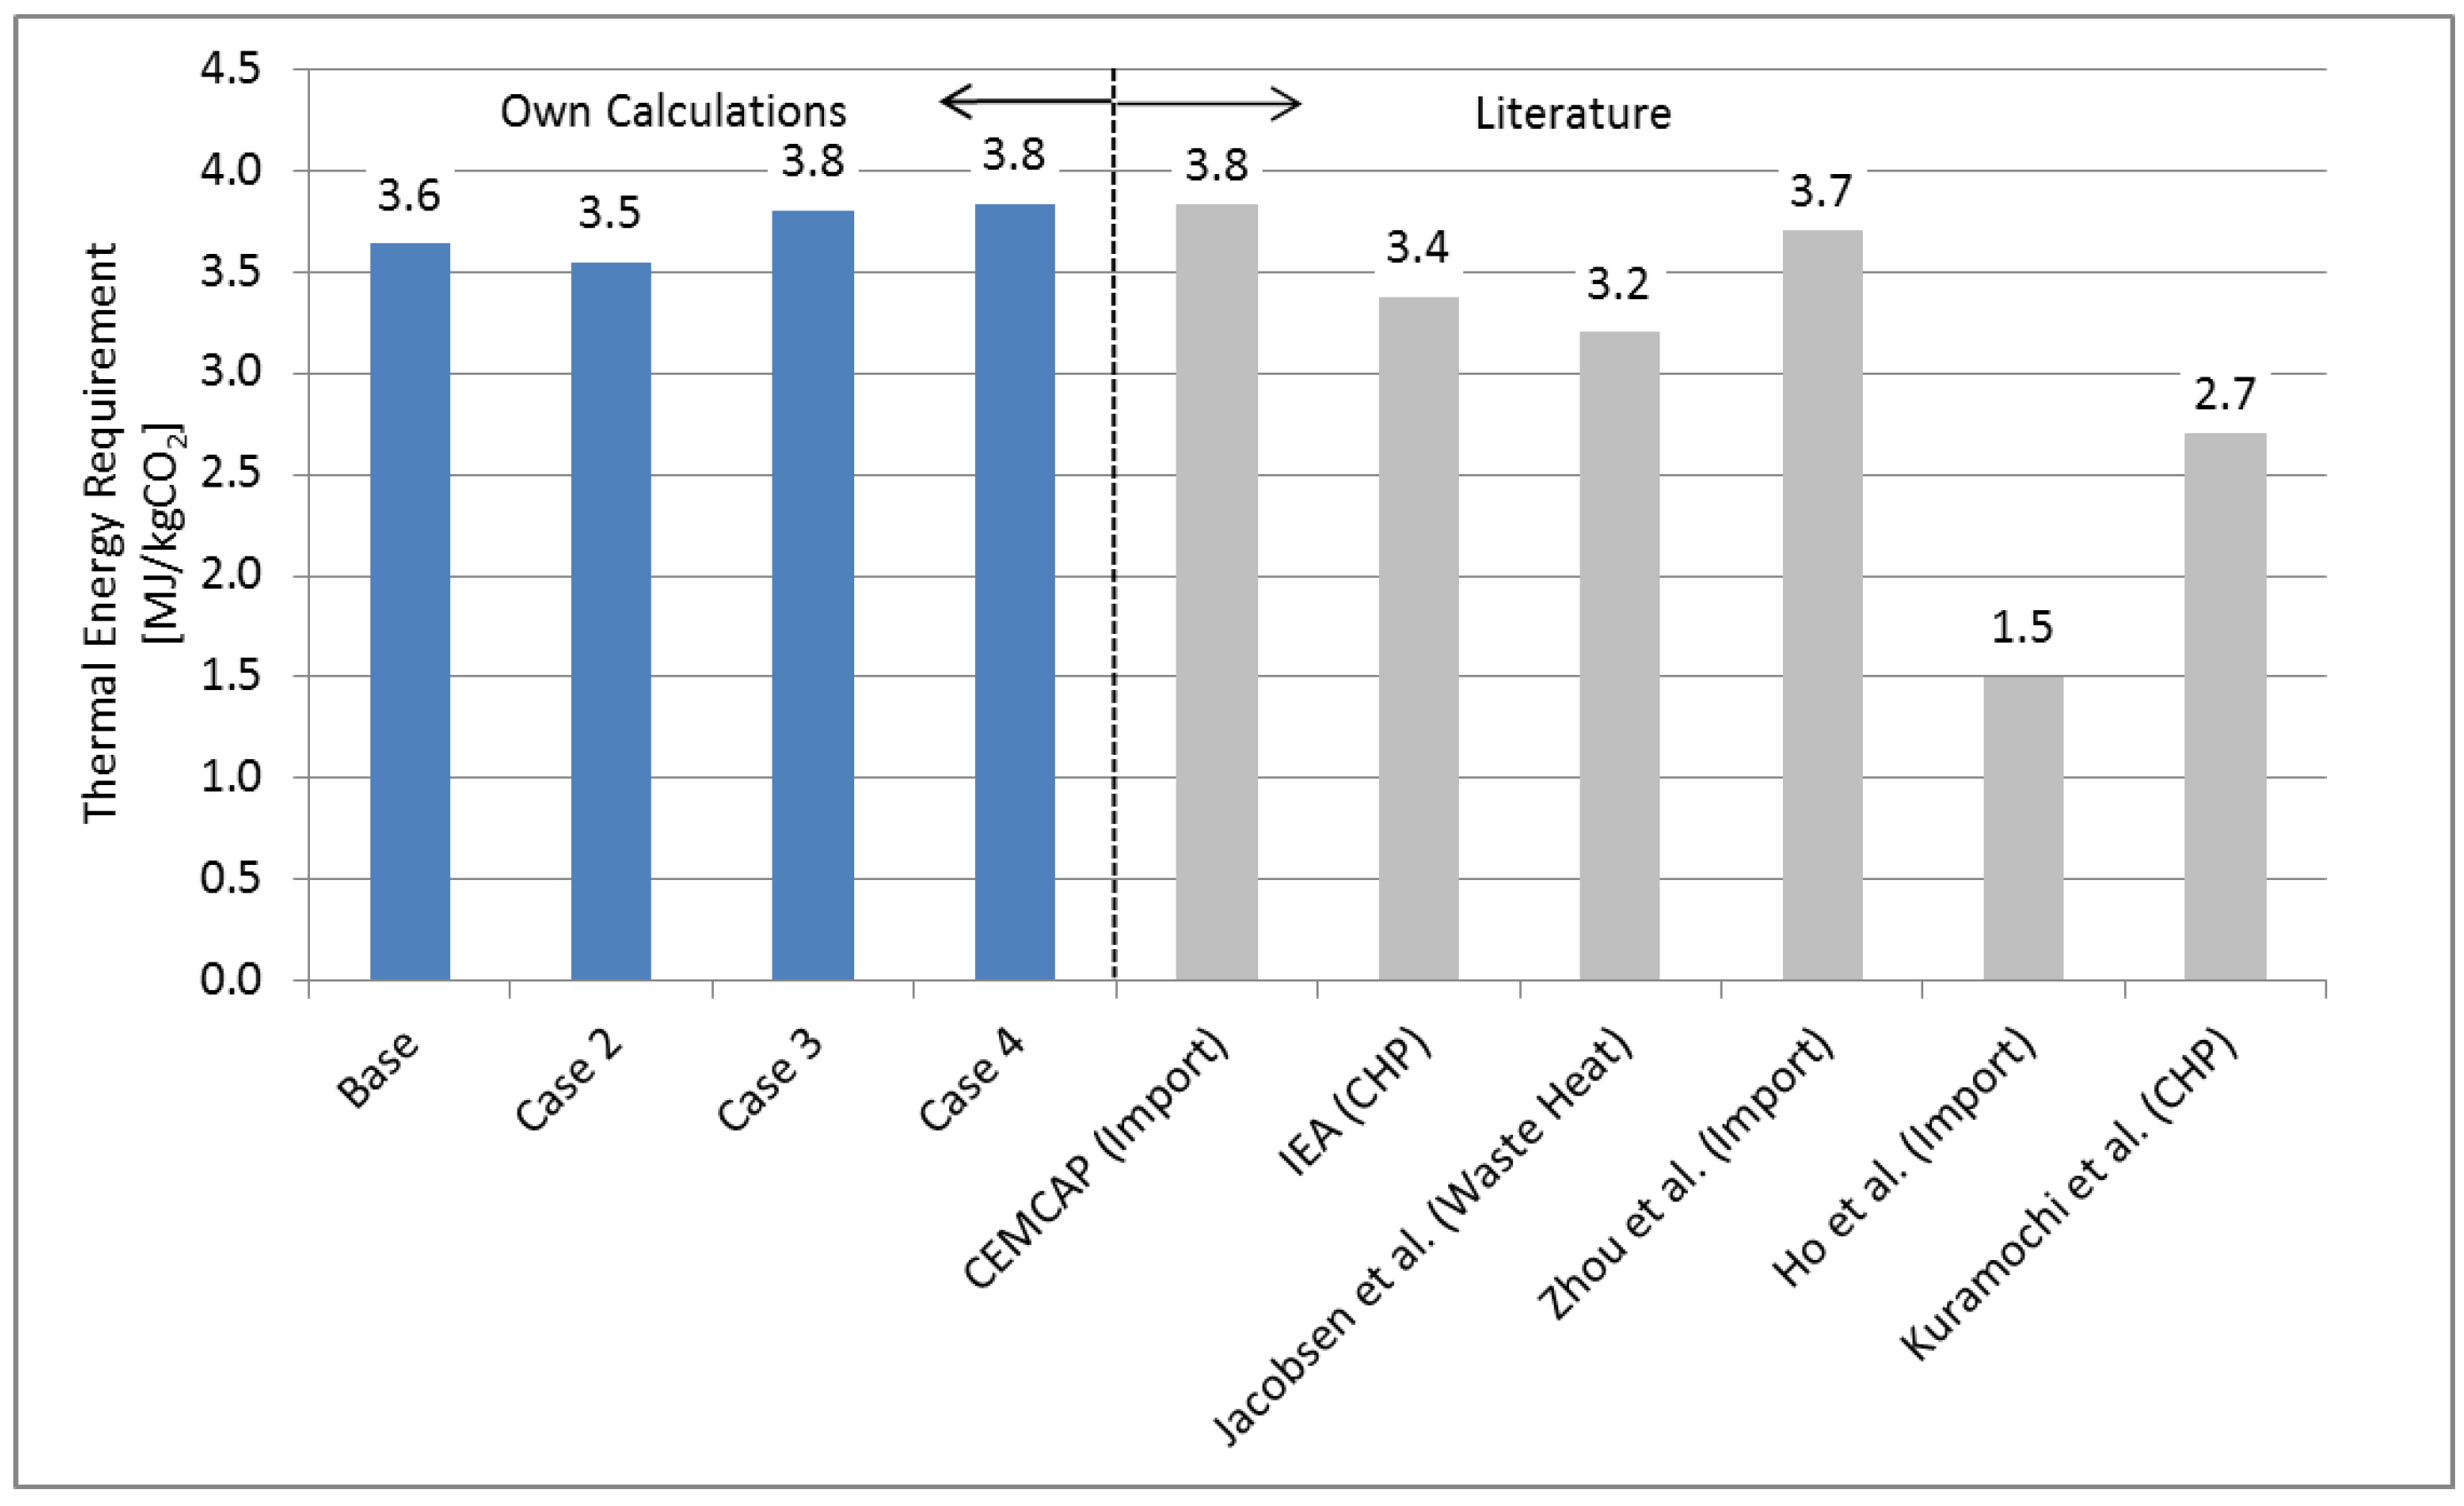
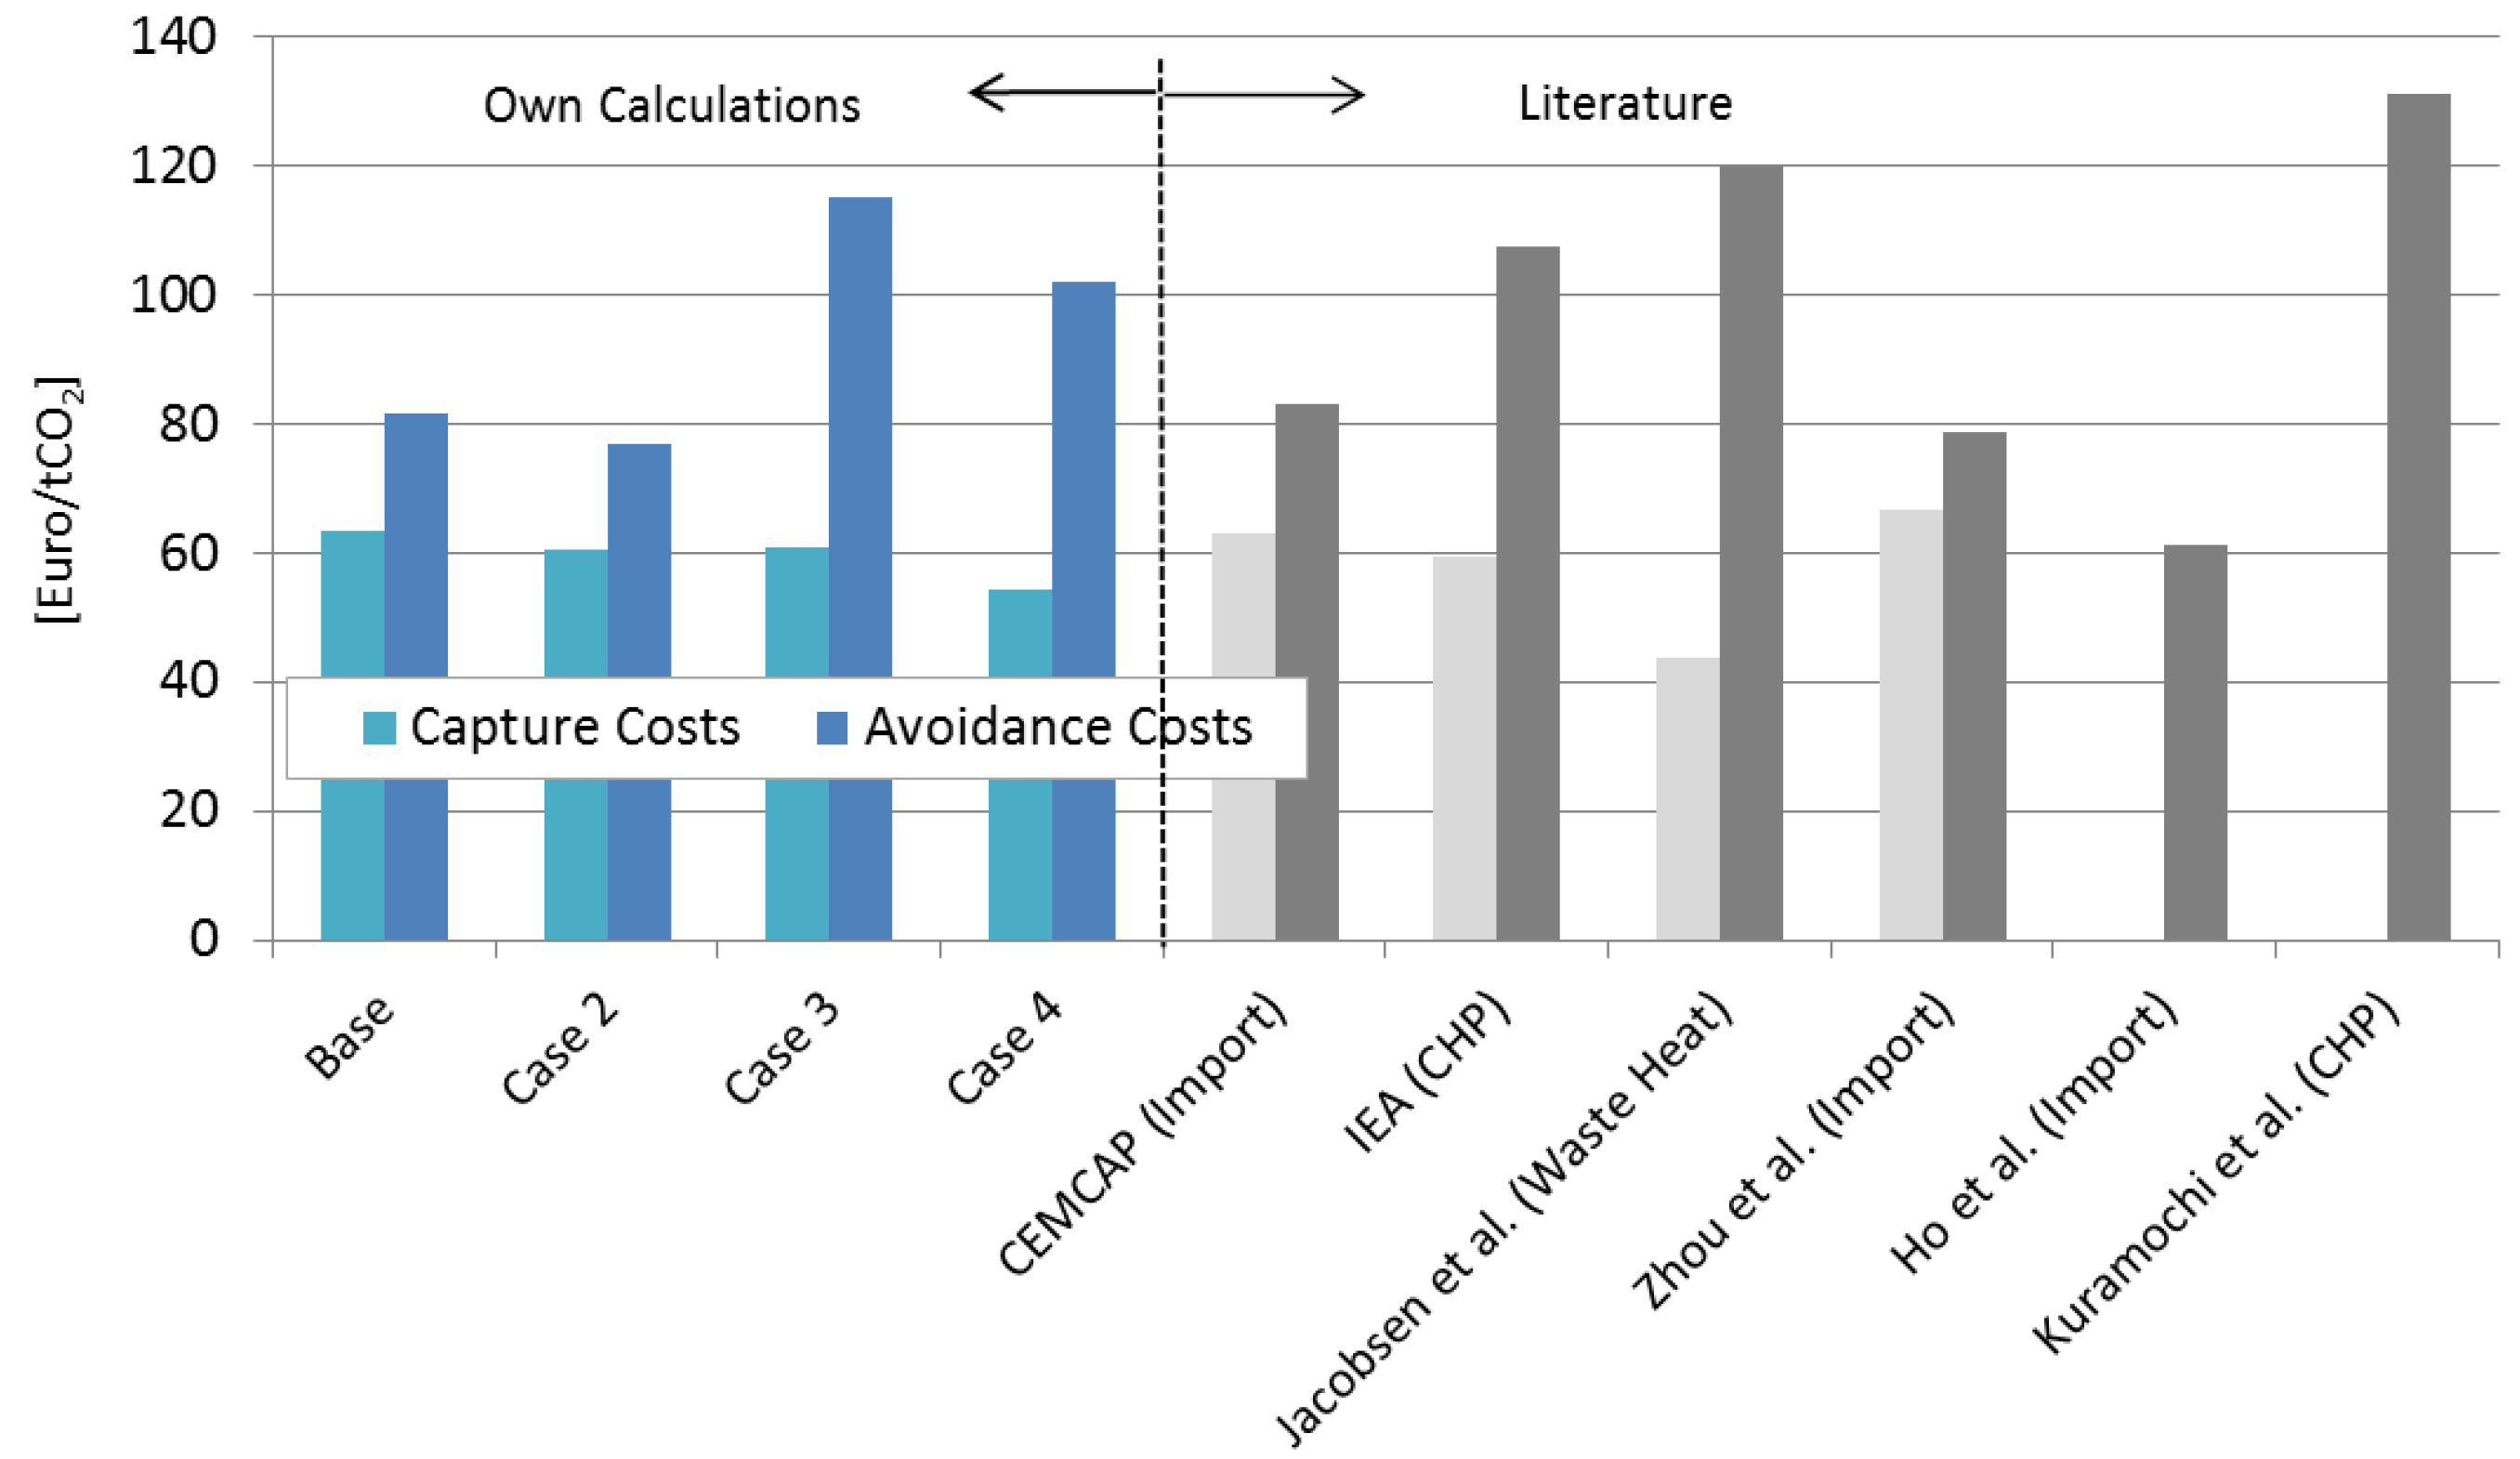
4.3. Comparison with Literature

Figure 5 and Figure 6 show the comparison of this study’s results with the literature for the thermal energy requirement, as well as the CO2 capture and avoidance costs, respectively.
The thermal energy requirement for all cases lies well in the existing literature’s scope. Only the values obtained by Ho et al. [34] are considerably lower; however, the methodology of Ho et al.’s analysis is not explained in detail in their paper and, hence, no reason for their low value can be given.
The CO2 avoidance and capture costs also match the existing literature well. Again, only Ho et al. achieved considerably lower carbon capture costs. Figure 6 indicates which steam sources were used in the respective literature to obtain these results. The comparison shows, once again, that the carbon capture and avoidance costs obtained compare well to the existing data in the literature. The nearly doubled avoidance costs compared to the capture costs in case 3 and case 4 match the results for the CHP steam supply cases in the literature.
Our calculated avoidance costs range from 82 to 115 €/tCO2. The concept of social cost of carbon tries to evaluate the climate impacts, like human health, property damages, etc. Some policymakers use the concept of social costs to set a carbon price. Under the Obama administration, the social cost of carbon was set for the United States at $45 per ton of carbon dioxide [44], which is below our avoidance costs. It is important to keep in mind that measuring the social cost of carbon is very complex [45,46]. Furthermore the concept of social cost of carbon is very contentious and values above 100 $/tCO2 are not uncommon [47].
Another definition of carbon price more recently used in the policy debate around climate change is to define ideal carbon prices based not on the concept of social cost of carbon, but on the level that is required to achieve a given goal. The high-level commission on carbon prices provides guidelines on the range of carbon prices necessary to achieve the Paris Agreement’s goal of keeping temperature increase within 2 °C above pre-industrial levels, and ideally within 1.5 °C [48]. According to these guidelines, our calculated avoidance costs are in the recommended range of values of the guidelines. Carattini et al. [49] propose a global carbon price of 40–80 $/t assuming a system of harmonized carbon taxes. Against this background, CCS technology in cement industry is an interesting option.

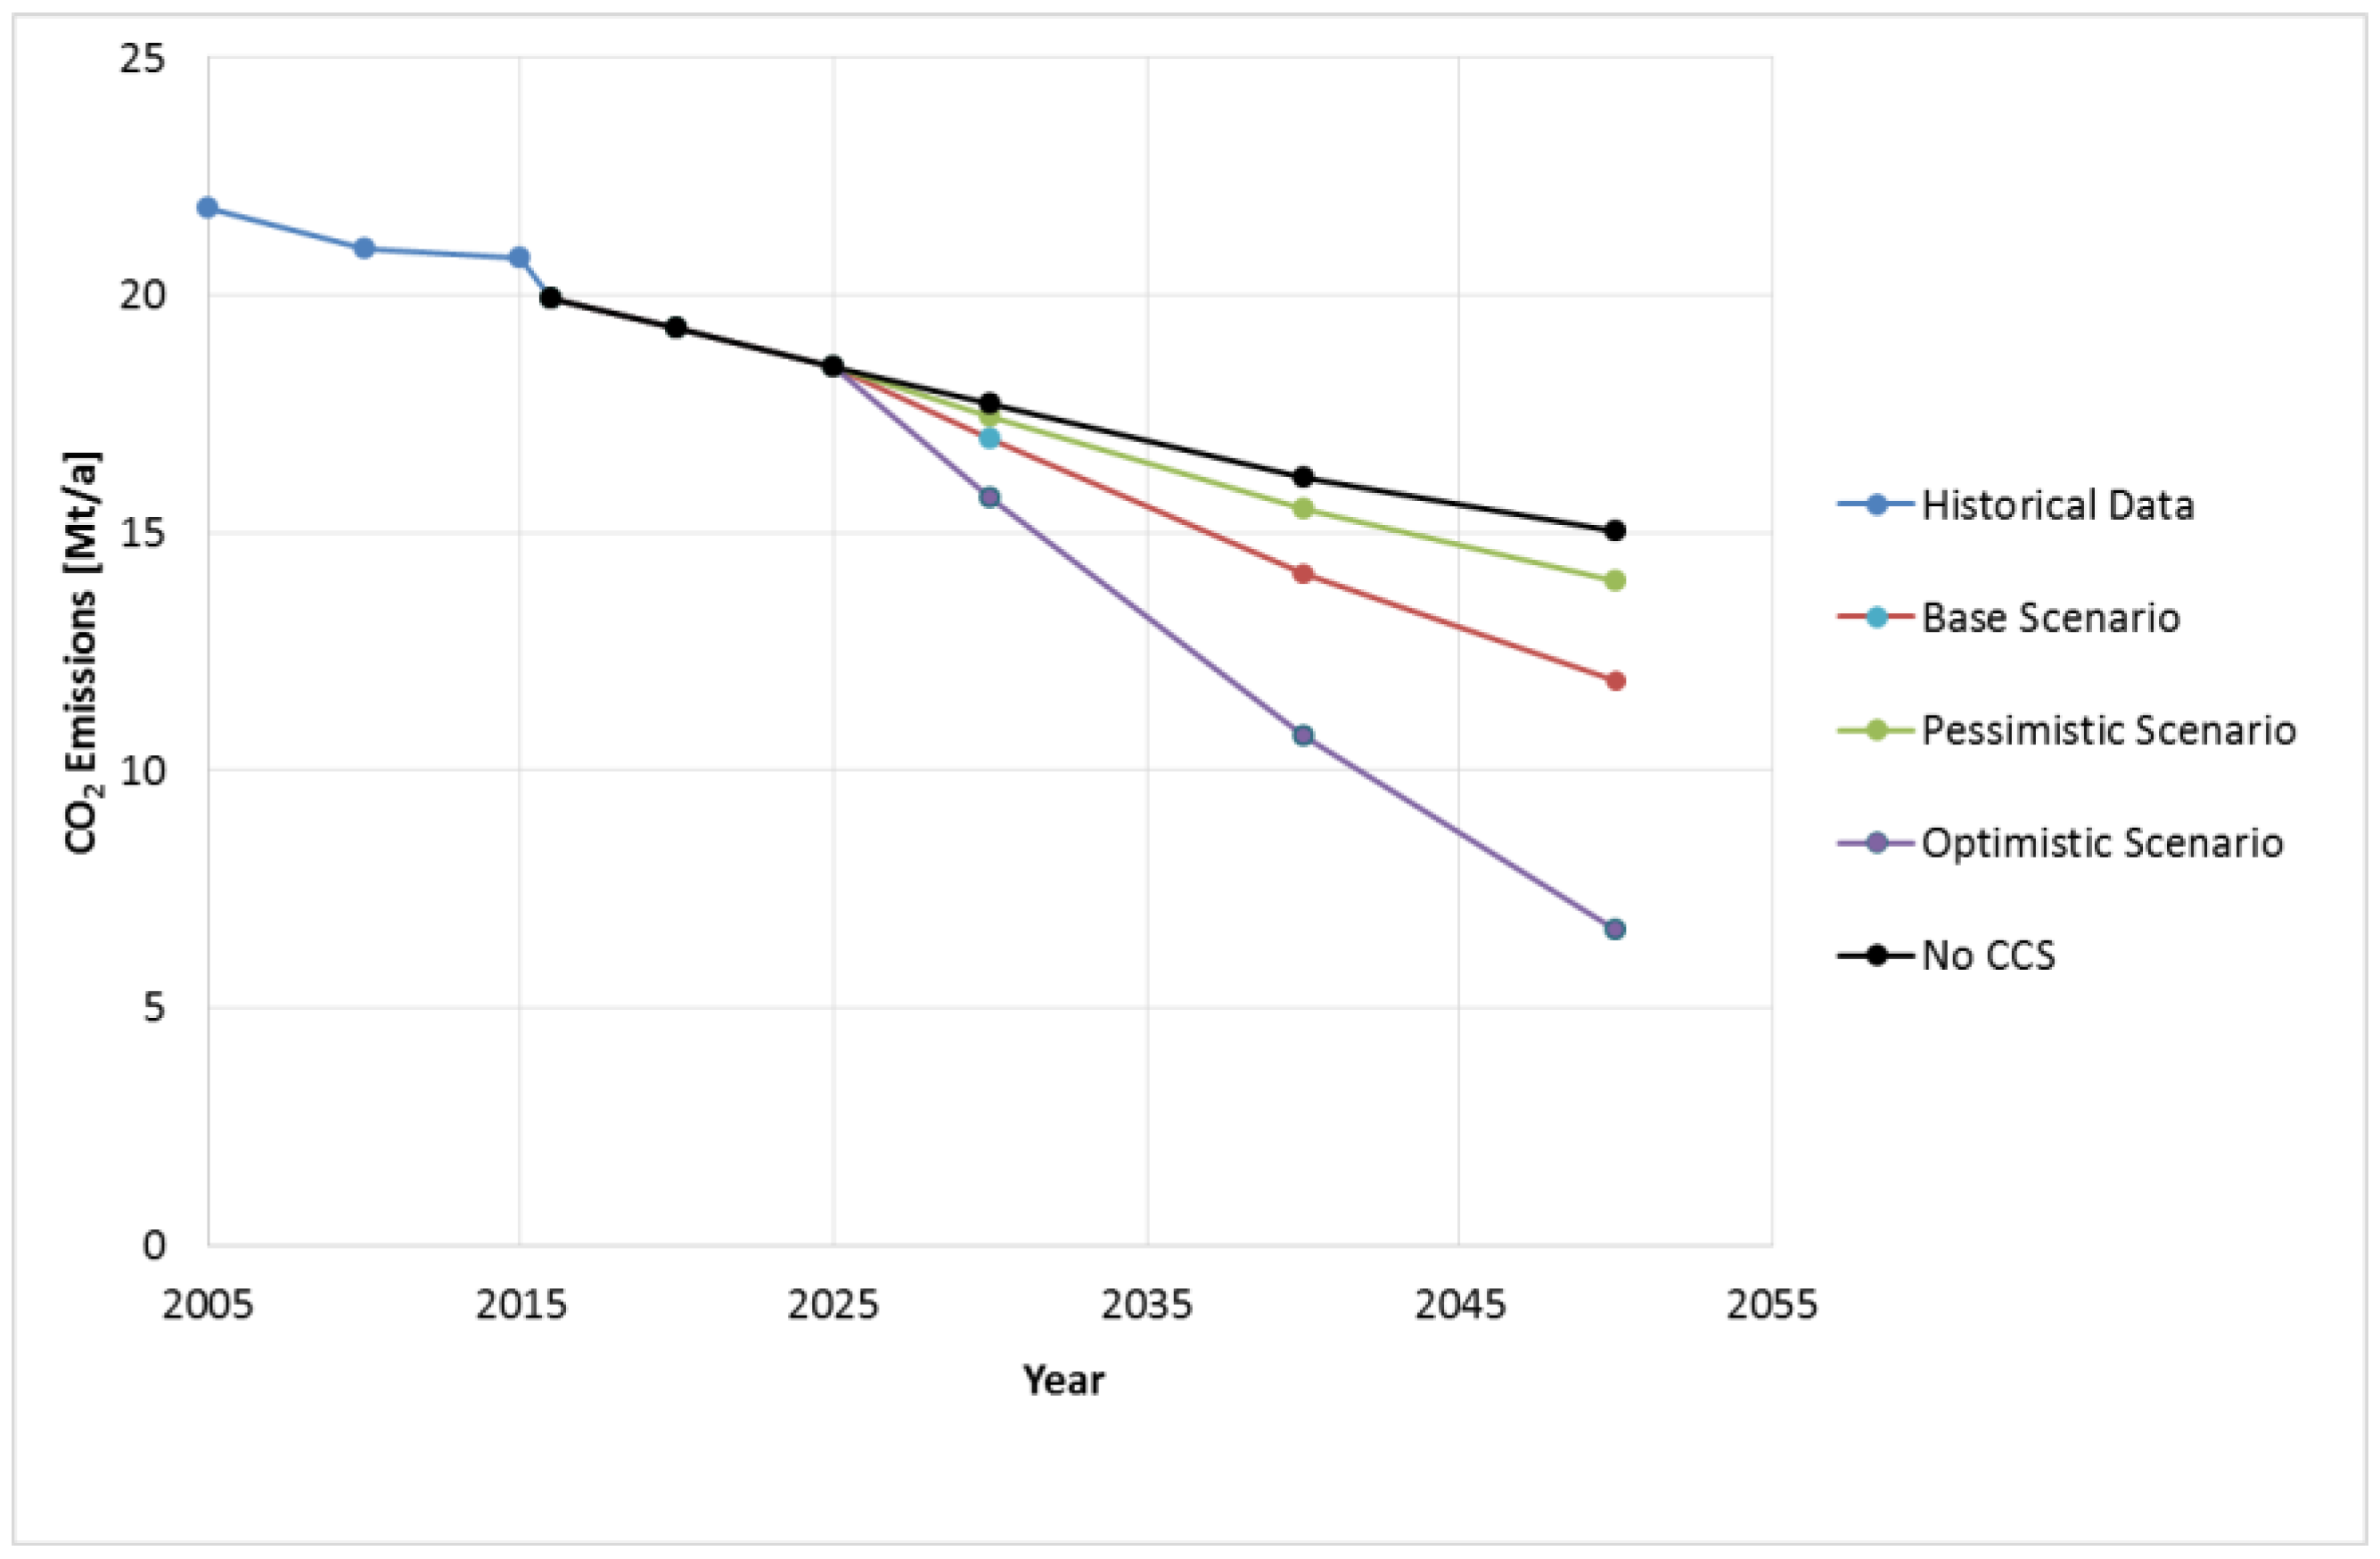
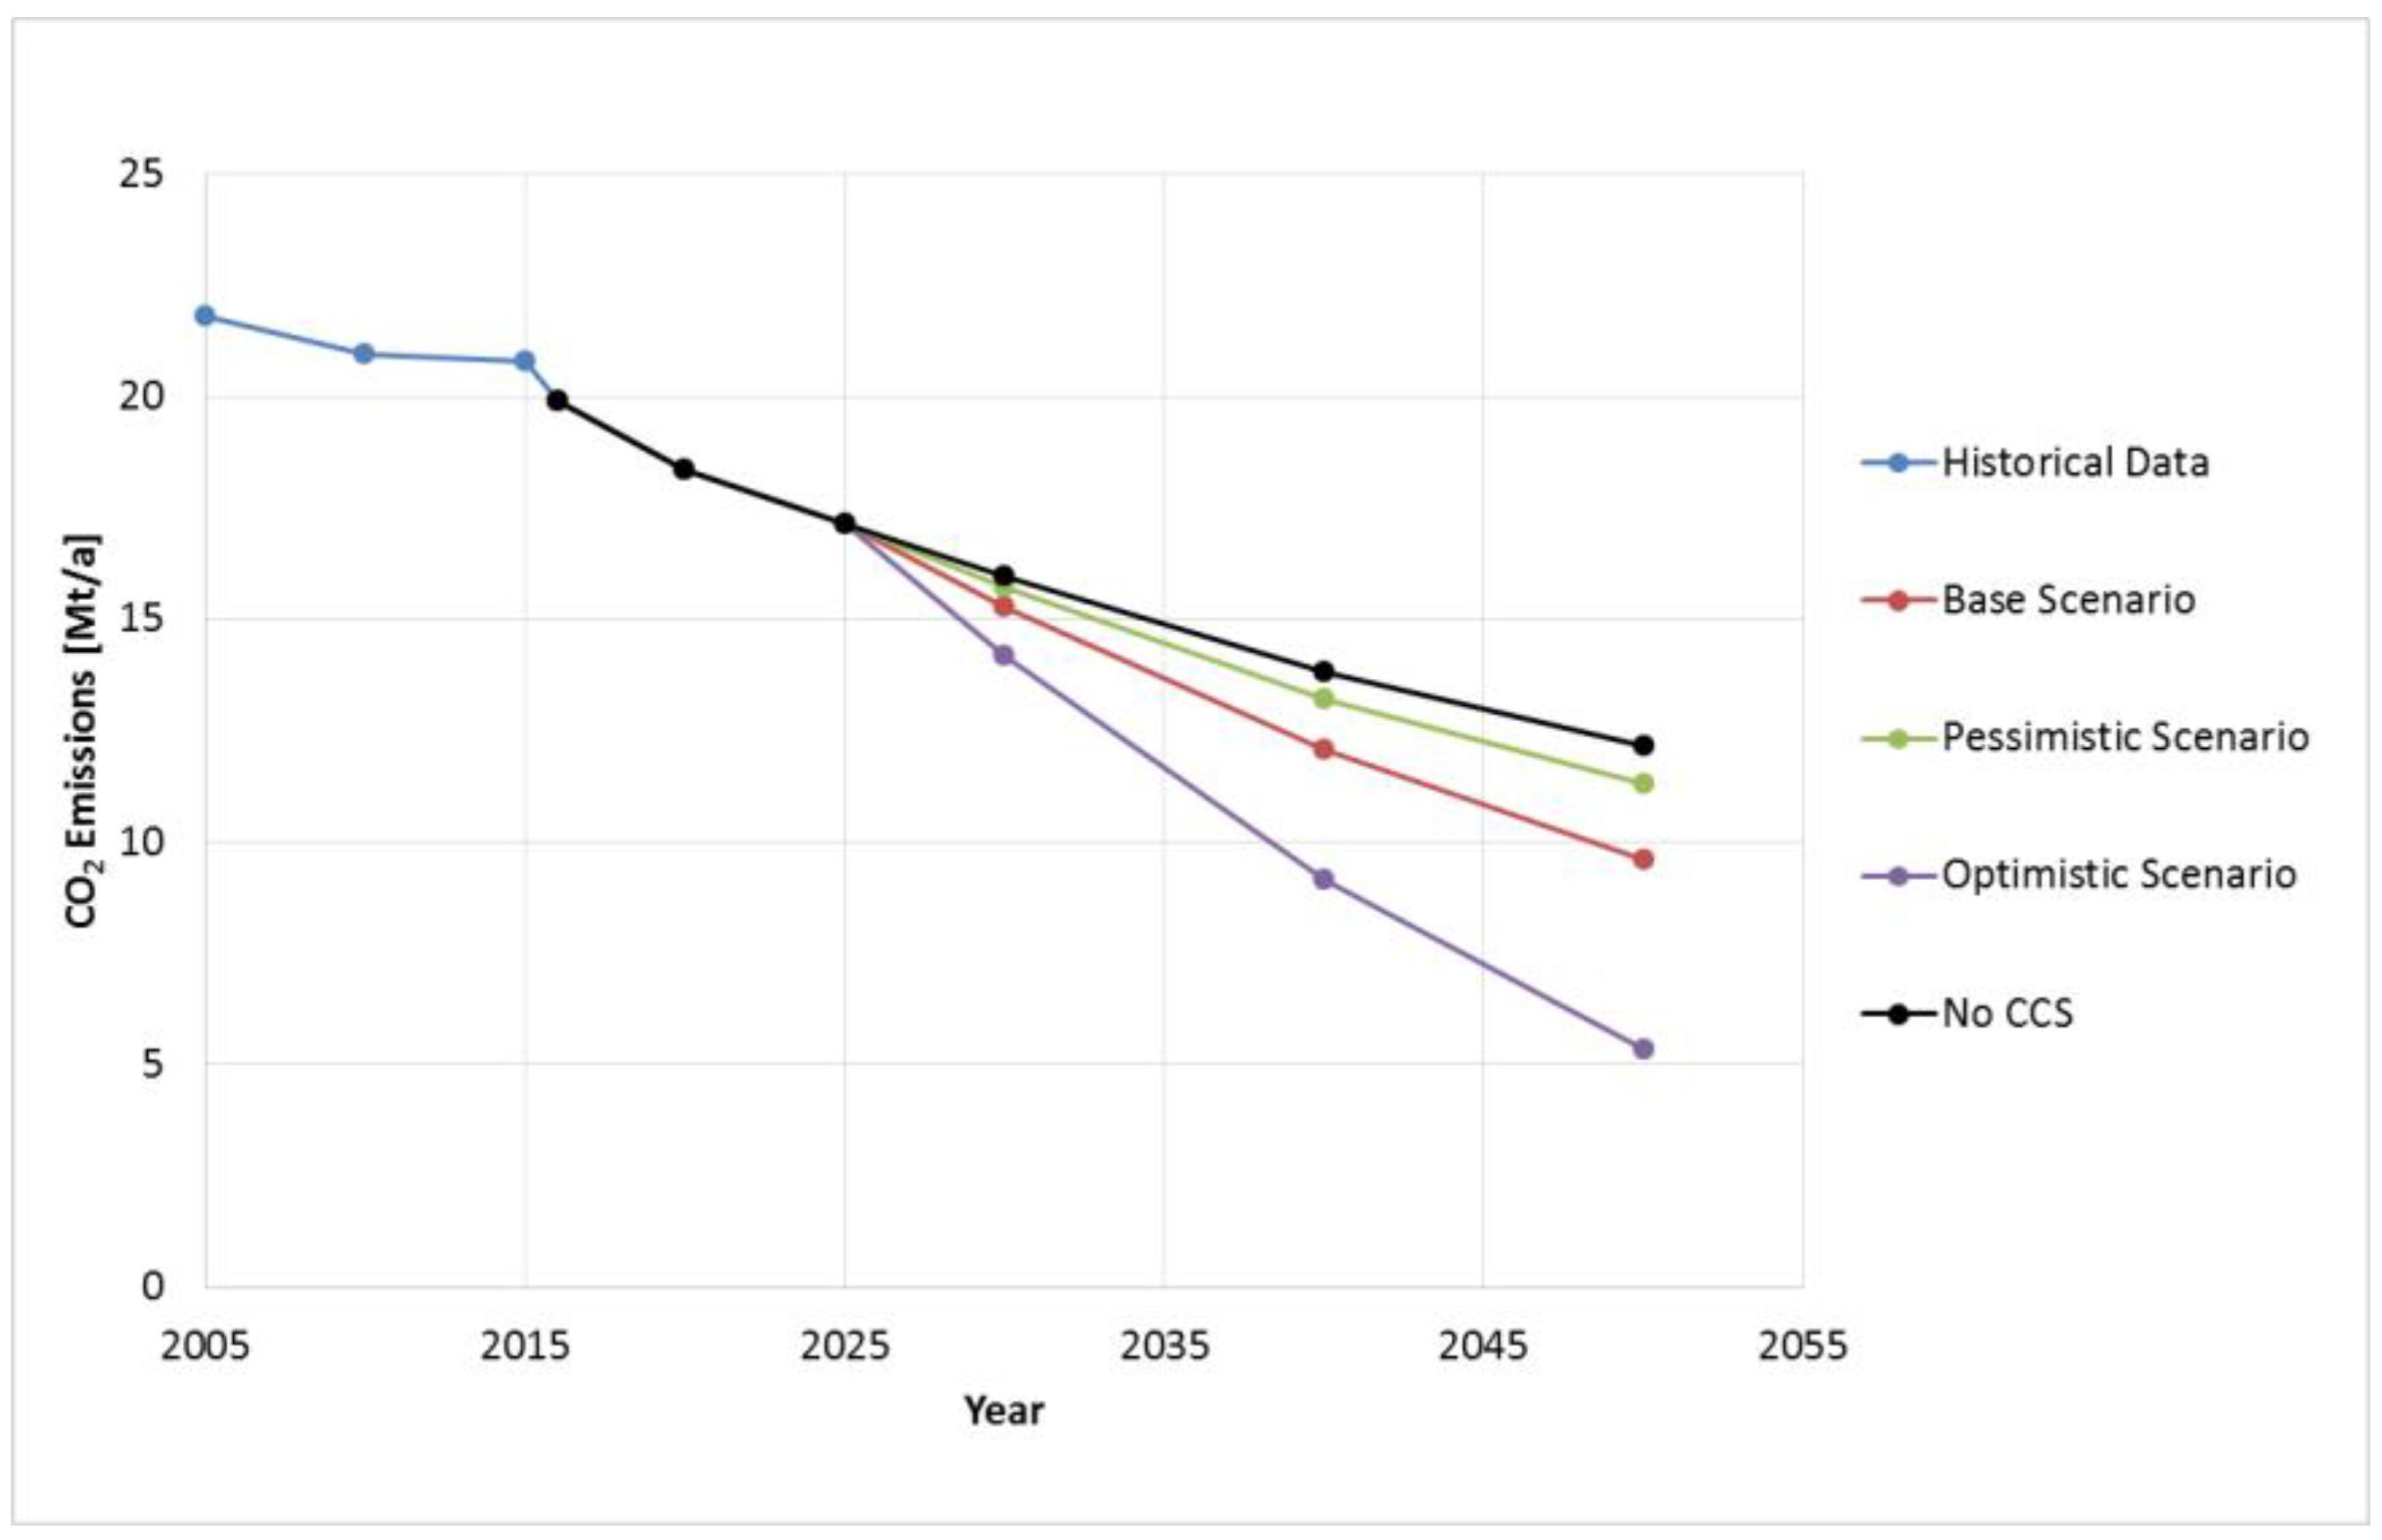
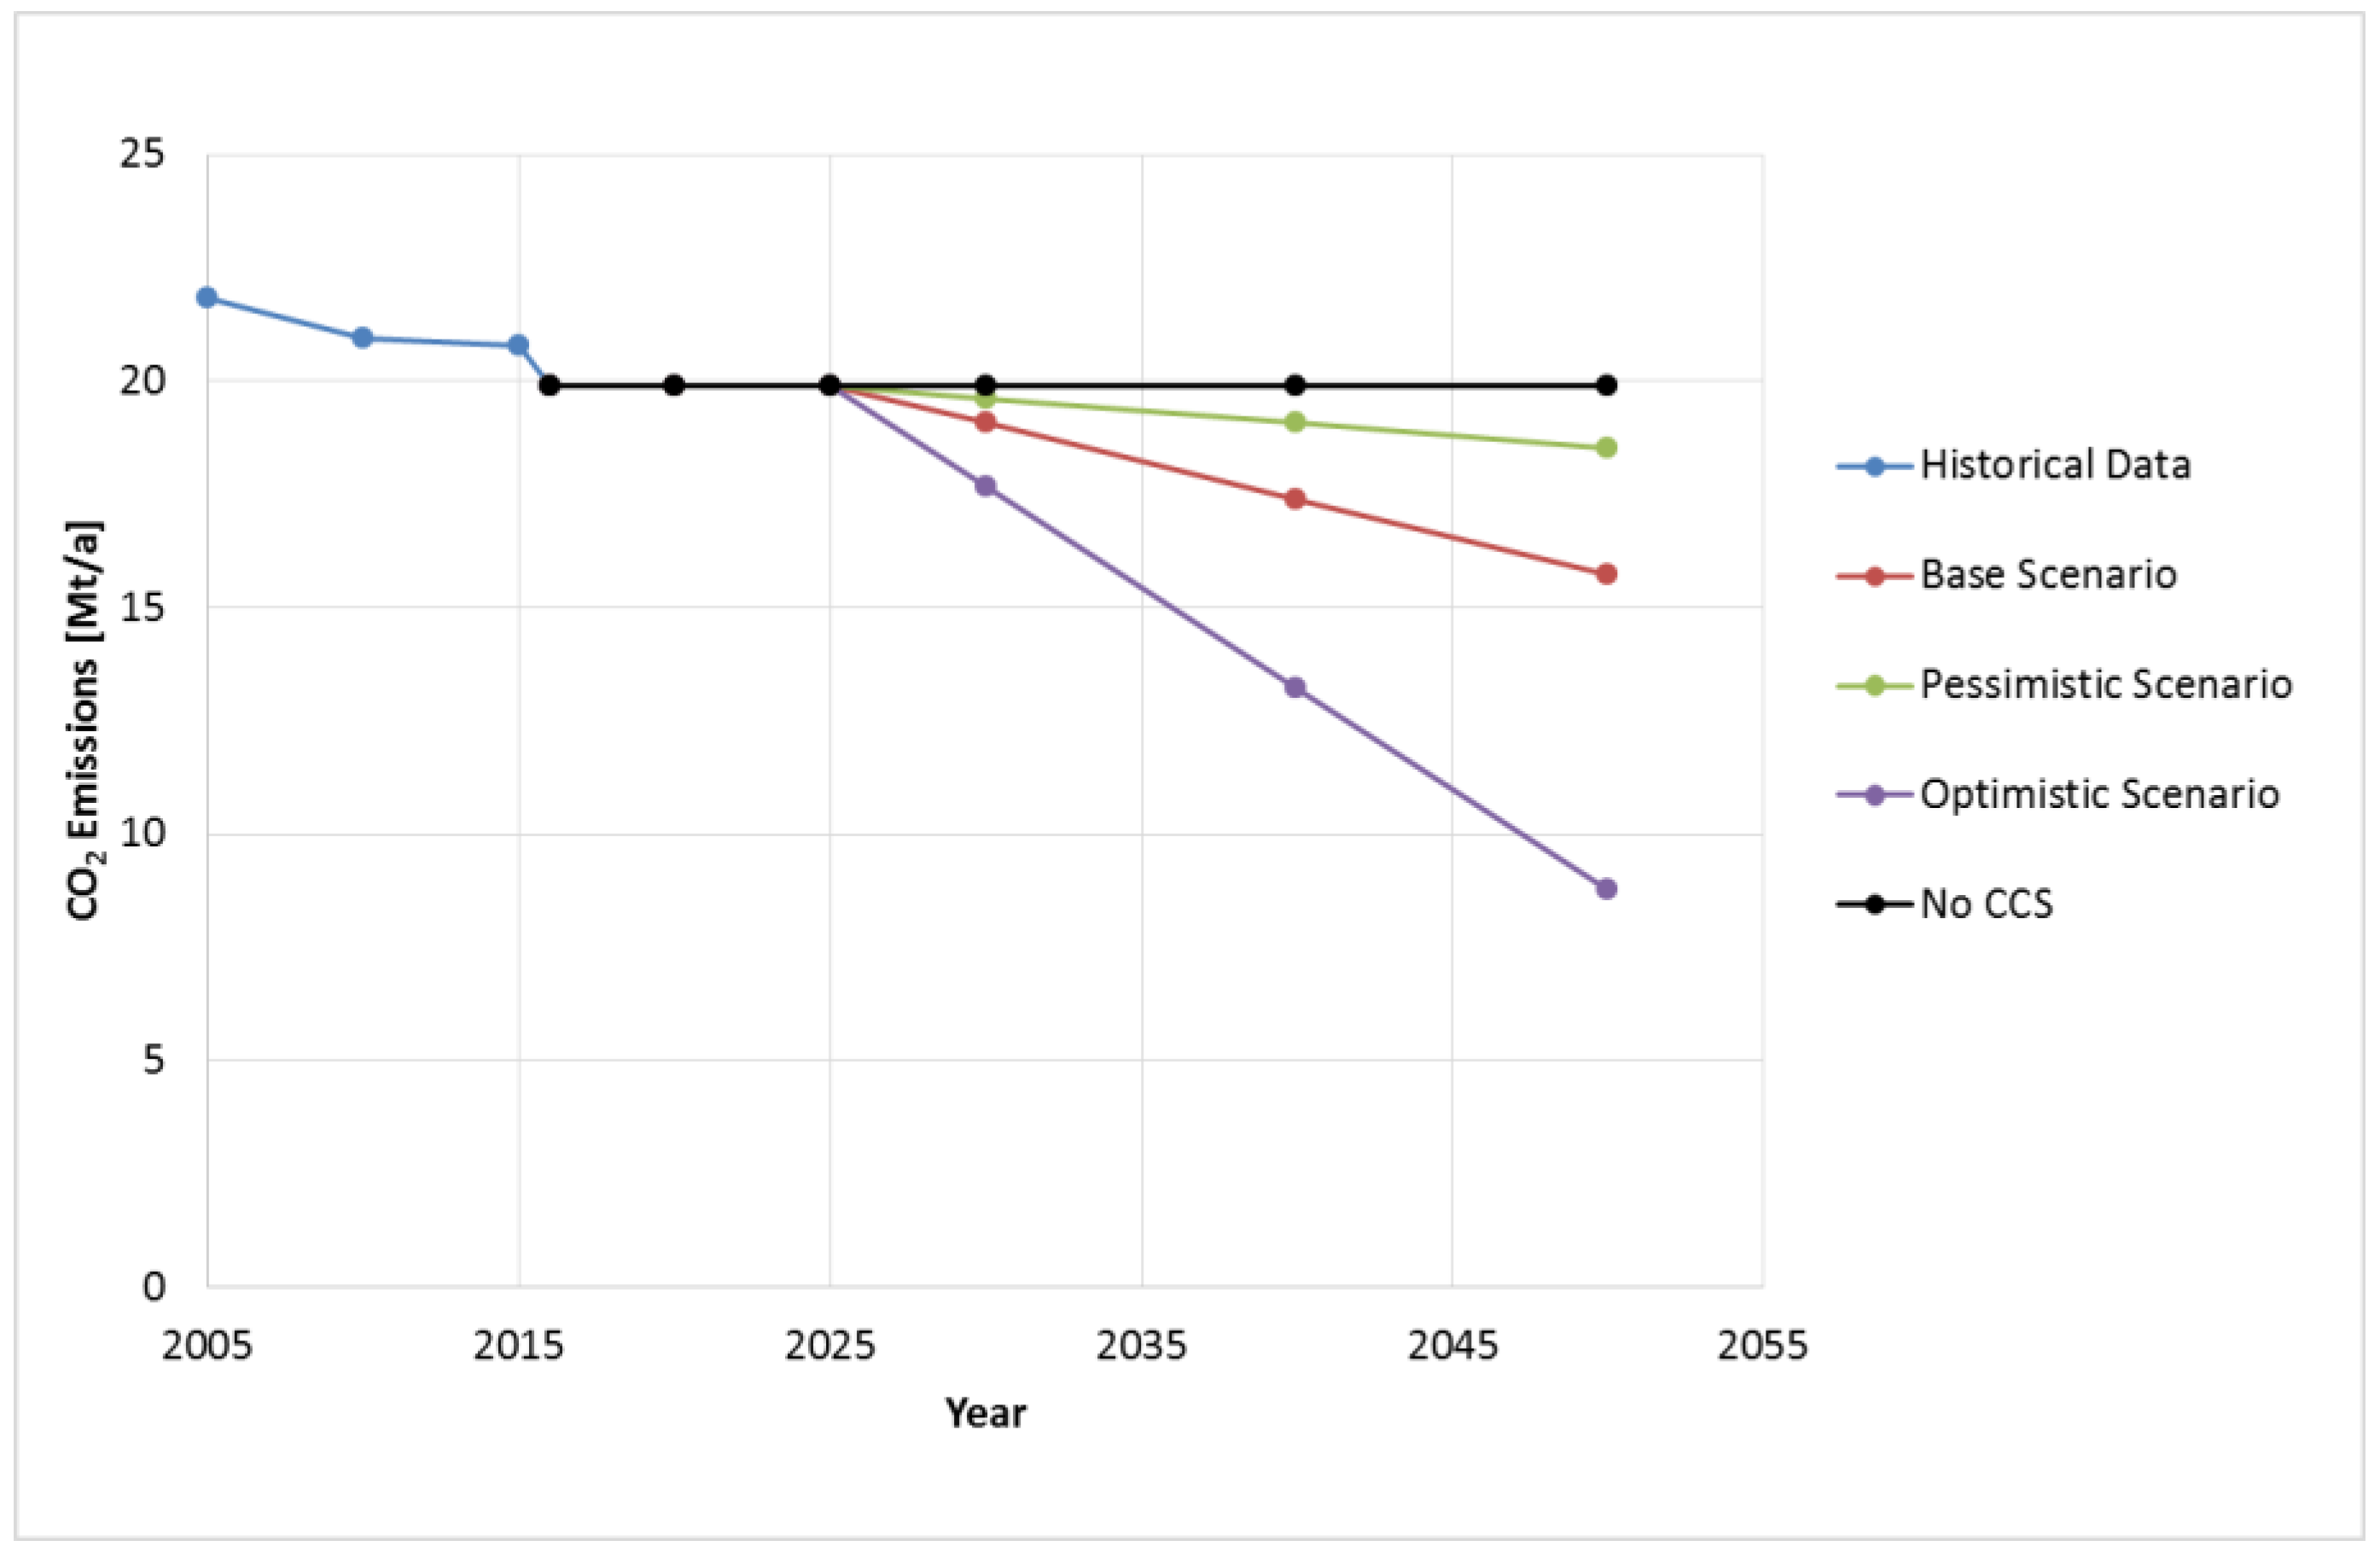
4.4. CO2 Emissions Reduction Potential in Germany

Cement clinker production projections for Germany through 2050 are available in a study conducted by Fraunhofer ISI and the Öko-Institut [50]. They develop two climate protection scenarios for a period up to the year 2050. Both scenarios estimate a decrease in clinker production. Here, the lower scenario will serve as the scenario for low clinker production and the higher scenario as the base scenario in this paper. For the high clinker production scenario, it is assumed that clinker production stagnates at today’s levels until 2050. Figure 7 depicts the three clinker production scenarios.
To derive the CO2 emissions scenarios, the specific CO2 emissions per ton of clinker produced must be determined for all years. In 2010, specific CO2 emissions from primary fuels, secondary fuels, and process emissions together were 890 kg/tclinker [51]. It is assumed that due to process enhancements in the last years, 850 kg/tclinker—as assumed for the BAT reference cement plant—is a realistic value today. Using these specific CO2 emissions, the clinker-related emissions can be derived from the clinker production scenarios. It is assumed that no other CO2 emission reductions from other technologies apply.
In order to assess the impact of applying CCUS to the German cement industry, three CCUS adaptation scenarios are outlined. It is assumed that every CCUS plant could avoid 70% of CO2 as determined in the above base case. It is assumed that CCUS for cement plants becomes ready for commercial utilization by 2025:
  • Base Scenario: CCUS is applied to 30% of German clinker production capacities.
  • Pessimistic Scenario: CCUS is applied to 10% of German clinker production capacities.
  • Optimistic Scenario: CCUS is applied to 80% of German clinker production capacities.
It is assumed that CCUS is applied linearly between 2025 and 2050. Hence, the average specific emissions over all cement plants can be determined. The emission scenarios show that by 2050, 21%, 7%, and 56% of emissions could be avoided in the base, pessimistic, and optimistic scenario, respectively.
The emission scenarios, together with the clinker production projections, now allow for the deriving of CO2 emission (reduction) scenarios for the German cement industry. Figure 8, Figure 9 and Figure 10 show that the CO2 emission projections for all emission scenarios for the clinker production base, low, and high case, respectively. Emissions derived under the assumption that today’s specific emission factor applies unchanged in the future are labeled ‘No CCS’.
In the pessimistic emissions scenario, the total emissions reduction would amount to 0.9 to 1.4 Mt per year by 2050. In the base emissions scenario, between 2.6 to 4.2 Mt are avoided in 2050. Pfluger et al. [12] calculate a comparable reduction potential of 3.3 Mt by the year 2050 for the German cement industry. In the case of the optimistic emission scenario, between 6.8 and 11 Mt are avoided in 2050.
Specific CO2 emissions used today were set at 850 kgCO2/tclinker. However, in 2016, the German Cement Association (VDZ) noted emissions of only 560 kgCO2/tclinker. The difference stems from the burning of alternative fuels, which are not counted towards the plant CO2 emissions. Hence, reductions of 290 kgCO2/tclinker (34%) are already avoided today through the utilization of alternative fuels. This implies that in the optimistic emission scenario, only 84 kgCO2/tclinker would be emitted by 2050. A larger avoidance rate or CO2 utilization in Germany connotes zero or negative emissions.

5. Summary and Conclusions

In this paper, a system analysis to explore post-combustion MEA absorption CCUS in the cement industry was carried out. The potential for reducing the industry’s CO2 emissions was energetically and economically quantified. Furthermore, CO2 emission projections for the clinker-producing industry and emission reduction potentials were derived for Germany.
For CO2 capture, steam supply plays a key role; four cases are assessed in the scenario analysis. In the base case and case 2, steam for supplying the reboiler heat demand is imported, and the associated emissions not captured. In case 3, steam is produced in an onsite coal boiler, and in case 4, steam and electricity are produced in a coal CHP. The boiler and CHP-associated emissions are captured in the post-combustion capture plant, too. The results show that the specific thermal energy requirement (3.5–3.8 MJth/kgCO2), specific cooling demand (4.3–4.5 MJth/kgCO2), specific compressor work (0.3 MJel/kgCO2), and specific total work consumption (0.4 MJel/kgCO2) only vary slightly across all cases. The same holds for the carbon capture costs, which amount to 63.6 EUR/t in the base case and 60.5, 60.9, and 54.4 EUR/t in cases 2, 3, and 4, respectively. For the CO2 avoidance costs, however, the investigated cases show a significant difference. While in the base case and case 2, CO2 avoidance costs are determined at 81.7 and 77.7 EUR/t, in case 3 and case 4, avoidance costs rise sharply to 115 and 107 EUR/t. This is also reflected in the clinker costs. For the base case, case 2, case 3, and case 4, clinker costs are 108, 105, 131, and 136 EUR/t, respectively. The cost difference stems from the much higher flue gas streams and lower CO2 contents in the flue gas for cases 3 and 4. The CO2 avoidance rate is most favorable in case 4, with 90%, while in the base case, case 2, and 3, the avoidance rates were at 70%, 71%, and 74%, respectively. The importance of the steam and electricity supply was underlined in the sensitivity analysis, which showed that these factors, together with the purchased equipment costs and interest rate, have the highest influence on the CO2 avoidance costs. The obtained results fit well with the existing literature on CO2 capture for cement plants.
For CO2 emission reduction analysis, base, pessimistic, and optimistic adaptations are assumed, resulting in base, pessimistic, and optimistic emission scenarios. In Germany, between 2.6 and 4.2 Mt/a could be avoided in the base emission cases (30% of German cement plants adopt CCUS with a 70% avoidance rate), amounting to a 21% emissions reduction by 2050 per year. In the optimistic case (80% of plants adopt CCUS) and pessimistic case (10% of plants adopt CCUS), 56% and 7% of the cement industry’s emissions, respectively, could be avoided by 2050.
The calculated CO2 reduction potential is based on the simplifying assumption that the cement production plants are each greenfield plants. In fact, there is an existing stock of cement plants that have an age structure that is not known. It is likely that this will be continuously renewed over the next few decades. All in all, it can be concluded that the calculated CO2 reduction potentials for Germany must be understood as the upper limit. In addition, the option of retrofitting would need to be taken up in a follow-up analysis.

Author Contributions

P.M. and L.Z. proposed the research topic and methodology. They also wrote some parts of the paper. M.R. (Maximillian Ryssel) performed the calculations and wrote the original draft preparation. M.R. (Martin Robinius) and G.M. took part in discussing the results, valuable input, and validated data. Y.W. did the Aspen modeling of the MEA process. C.S. and D.S. also validated the idea and reviewed the final paper.

Funding

This work was supported by the Helmholtz Association under the Joint Initiative “EnergySystem 2050—A Contribution of the Research Field Energy”.

Conflicts of Interest

The authors declare no conflict of interest.

Nomenclature

SymbolSI-UnitName
a Annuity
c p J/KSpecific heat
C O 2 R %Overall CO2 reduction rate
I EURInvestment costs
k EUR/unitSpecific costs per unit
K EUR/aAnnual costs
m ˙ kg/sMass Flow
SymbolName
anAnnual
BATBest available technology
BECCSBioenergy with carbon capture and storage
CaLCalcium looping
CAPEXCapital expenditure
CCUSCarbon capture, utilization and storage
CEMCAPCO2 capture from cement production
CEPCIChemical engineering plant cost index
CHPCombined heat and power
CO2,avCO2 avoided
CO2,capCO2 captured
elElectric
FGDFlue gas desulphurization
GHGGreenhouse gas
IEAInternational energy agency
MDEAMethyldiethanolamin
MEAMonoethanolamin
NGNatural gas
NGCCNatural gas combined cycle
OPEXOperational expenditure
PCCPost combustion capture
PECPurchased equipment costs
RLHXRich lean heat exchangers
SCRSelective catalytic reduction
USDUS dollar
VDZVerein Deutscher Zementwerke

Appendix A. Literature Review

Table A1. Technical and economic overview of chemical absorption for PCC.
CEMCAP [20,23]Jakobsen et al. [32]Zhou et al. [33]Summers et al. [35]Ho et al. [34]Kuramochi et al. [31]Barker et al. [30]Hassan [29]
Cement capacity1.36 Mt/a1.2 Mt/a/1 Mt/a1 Mt/a/1 Mt/a0.68 Mt/a
Clinker capacity3000 t/d;/5000 t/d////2400 t/d
1 Mt/a//1 Mt/a/0.91 Mt/a/
Process type5-stage preheater with precalciner////Dry process with precalciner5-stage preheater with precalciner/
Solvent typeMEAMEA/advanced solventMEAMDEAMEAAdv. Solv./KS1/MEAMEAMEA
Flue gas treatmentFGD, SCR//FGD, SCRFGD, SCR/FGD, SCRFGD, bag filters
CO2 lean loading molCO2/mol MEA0.27/////0.220.3
CO2 rich loading molCO2/molMEA0.49/////0.45/
Steam sourceNG boiler; NG CHP; waste heat recovery; external coal power plantWaste heat (31 MW) and NG boilerSteam import; CHPNG boilerExternal NGCCSteam import (Coal plant, boiler); Onsite CHPCHP plant; import from power plant; NG boilerSteam (imported)
ScenariosCapture rates of 0.9 and 0.6; 7 steam source scenariosDifferent transport and storage scenariosDifferent steam scenariosRetrofit and greenfield plantDifferent prices and fuels for external steam supplyShort-mid-term (ST/MT) and long term (LT) technologies3 million ton cement plantDifferent operational cases
Thermal Energy requirement [MJ/kgCO2]3.833.2 (MEA)/2.1 (advanced solvent)3.7/1.52.7 (ST/MT, MEA; 3.7 (LT, Adv. Solvent)3.38/
CO2 capture rate90% (base case), 60%42% (base case); max. 85%85% 62%95%90%/85%85%
Economic lifetime25 a25 a25 a30 a25 a20 a25 a20 a
Interest rate8%8%10%8%7%10%10%7%
Investment costs for CCUS plant79.3 MEUR (90% capture) and 62.2 MEUR (60% capture) in comp. to cement plant/110 MUSD145 MUSD91 MUSD/295 MEUR298 MUSD (average load)
Operating costs for CCUS plant26.7 EUR/tcement (90% capt.); 18.6 EUR/tcement (60% capt.)/7.9 MUSD60 MUSD43 MUSD/30.4 MEUR25.1 MUSD (average load)
Costs of CO2 captured63.2 EUR/t (base case); 41-65 €/tCO2 in alternative scenarios/74.1/t USD (imp. steam); 72.3/t USD (CHP)///59.6/t EUR/t51 USD/t (average load)
Costs of CO2 avoided83.2 EUR/t (base case); 54-86 €/tCO2 in alternative scenarios40-70 EUR/t (capture + conditioning)87.6 USD/t (imp. steam); 100 USD/t (CHP)96/121 USD/t (greenfield excl./incl. FGD, SCR)68 USD/t37 EUR/t (Adv. solvent, steam import) to 131 EUR/t (MEA, onsite CHP)107.4 EUR/t/

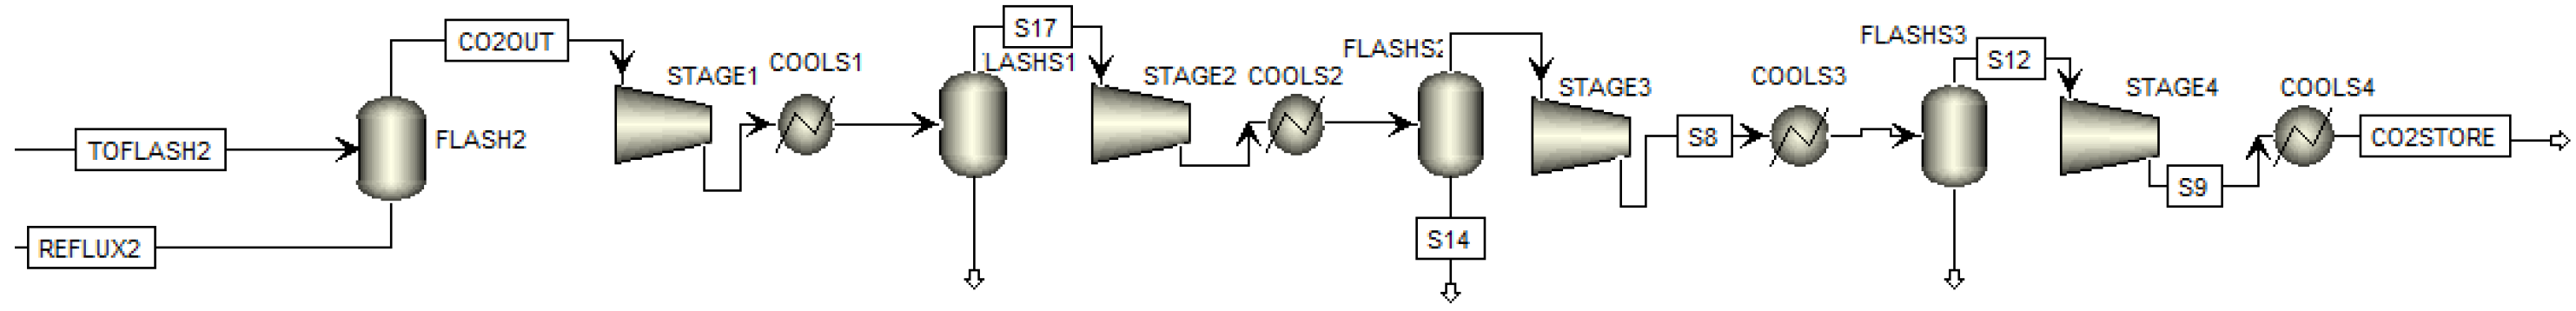
Appendix B. Post-Combustion Model

The model is extended to include a CO2 compression system, as well as a cooling water pump. Figure A1 and Figure A2 show the flowsheet of the CO2 capture plant. Table A2 lists all blocks within the ASPEN simulation, their names, equipment type, and how they are considered in the economic analysis.
Figure A1. Flowsheet of the CO2 capture plant model in Aspen Plus (I/II): Main capture plant.
Energies 12 02432 g0a1
Figure A2. Flowsheet of the CO2 capture plant model in Aspen Plus (II/II): CO2 compression for transport and storage.
Energies 12 02432 g0a2
Table A2. Aspen blocks, equipment type, and considerations in the economic analysis.
BlockTypeEconomic Analysis
BLOWERCompressorYes
GASMIXMixerNo
PRECOOLScrubberYes, as single equipment
PRESCRUB
ABSORBERAbsorberYes
COOLER1ScrubberYes, as single equipment
FLASH1
RICHPUMPPumpYes
RLHXHeat ExchangerYes
STRIPPERStripperYes
COOLER2Condenser/CoolerYes
FLASH2Knockout DrumNo
STAGE1/STAGE2/STAGE3/STAGE4CompressorYes
COOLS1/COOLS2/COOLS3/COOLS4CoolerYes
FLASHS1/FLASHS2/FLASHS3Knockout DrumYes
LEANPUMPPumpYes
HEATER2CoolerYes
MIXERMixerNo
SPLITSeparatorNo
WATPUMPPumpYes

Appendix C. CAPEX Data

Table A3. CAPEX calculation and cost factors from the literature [40].
FactorUsed percentage
Percentage of PEC
Direct cost
Inside Battery Limits (ISBL)
Purchased Equipment Cost (PEC)100
Purchased Equipment Installation53
Instrumentation and Control20
Piping40
Electrical11
Outside Battery Limits (OSBL)
Building and Building Services10
Yard Improvements10
Service Facilities20
Land5
Flue Gas Treatment
FGD Unitscaled and adopted from [18]
SCR Unitscaled and adopted from [18]
Indirect cost
Engineering10
Construction Expenses10
Contractor’s Fee0.5
Contingency17
CHP/Steam Source Costs (CHPC)scaled and adopted from [18]
Fixed Capital Investment (FCI) = Indirect cost + Direct cost + CHPC
Percentage of FCI
Fixed Capital Investment (FCI)100
Working Investment (WI)25
Percentage of CAPEX
Start-up Cost and Initial MEA Cost (SUC)10
CAPEX = FCI + WI + SUC
Table A4. Parameters for different types of equipment according to Smith [41].
EquipmentCapacity Measure [Unit]Base Size QBBase Costs CB [EUR2016]Size RangeExponent M
Shall-and-Tube Heat ExchangerArea [m2]804.06 × 10480–40000.68
Compressor, incl. motorPower [kW]2501.22 × 104250–10,0000.46
(Large) Centrifugal Pump, incl. motorPower [kW]41.22 × 1034–7000.55
Table A5. Parameters for equipment according to Turton [52].
EquipmentCapacity Measure [Unit]K1K2K3Size Range
Process vessel (vertical)Volume [m3]3.49740.44850.10740.3–520
Packing (for towers)Volume [m3]2.44930.97440.00550.03–628
Table A6. Parameters description FGD [18].
ParameterValue
Flue gas stream, wet [kg/s]162.5
Electricity demand [kW]1790
Limestone consumption [t/a]12,830
Capital costs [MEUR2016]21.2
Table A7. Parameters description SCR [18].
ParameterValue
Flue gas stream, wet [kg/s]65.5
Electricity demand [kW]300
Limestone consumption [t/a]1855
Capital costs [MEUR2016]4.3

Appendix D. OPEX Data

Table A8. OPEX calculation and cost factors from the literature [40].
FactorCalculation Method
Fixed Charge
Local taxes2% of FCI
Insurance1% of FCI
Direct Production Cost
Resource Consumption
Cooling WaterCooling water make up [m3/GJ] × Cooling Duty [GJ] × Cooling water costs
CoalFuel Costs [EUR/t] × Consumption
SteamSteam costs [EUR/t] × Consumption
ElectricityElectricity costs [EUR/MWh] × Consumption
MEA Make UpMEA cost x MEA degradation
Limestoneadopted from [18]
Ammoniaadopted from [18]
SCR Catalystadopted from [18]
Activated CarbonActivated Carbon Cost × Consumption
Maintenance, Labor, Supplies, Laboratory
Maintenance (MA)4% of FCI
Operating Labor (OL)No. of Shifts × Labor Cost [EUR/h]
Supervision and Support Labor (SL)30% of OL
Operating Supplies15% of MA
Laboratory Charges10% of OL
Plant Overhead Cost
Plant Overhead Cost60% of (MA + OL + SL)
General Expenses
Administrative Cost15% of OL
Distribution and Marketing0.5% of OPEX
R&D Cost5% of OPEX
OPEX = General Expenses + Plant Overhead Cost + Direct Production Cost + Fixed Charge

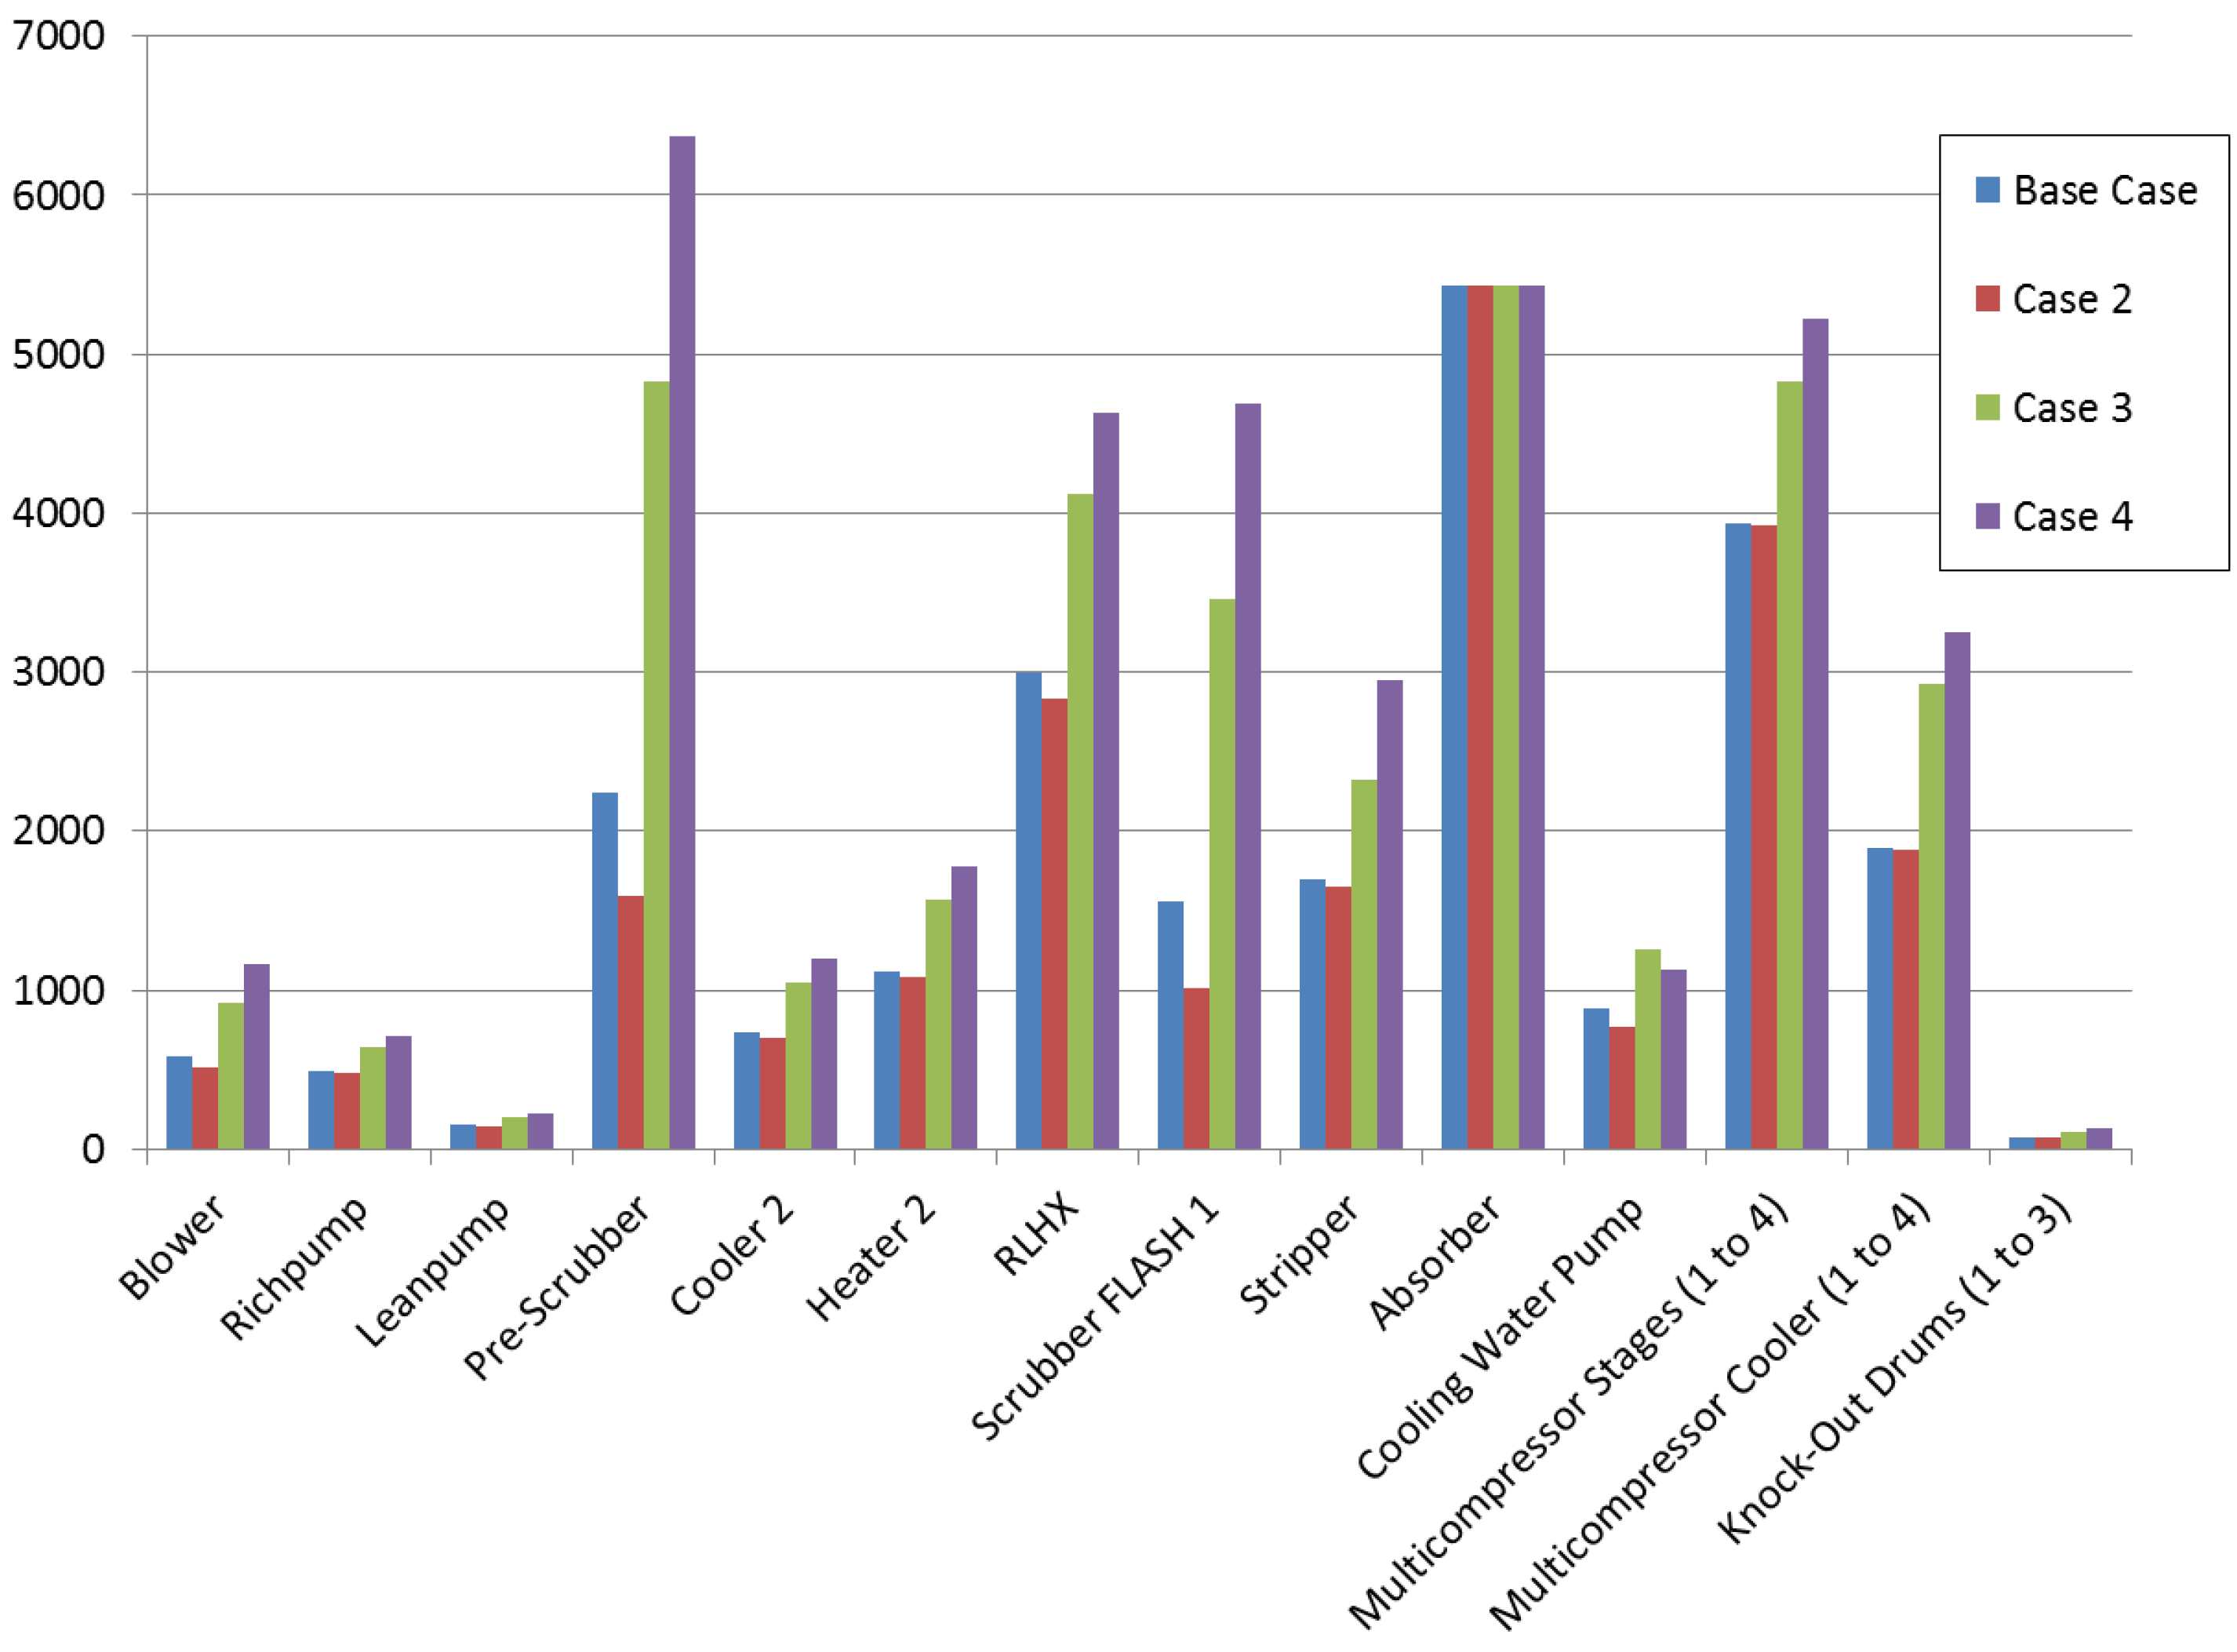
Appendix E. CAPEX Results

Table A9 and Figure A3 summarize several of the smaller cost factors to provide greater clarity. Next to the PEC, large cost factors are the working investment and start-up costs, followed by ISBL and flue gas treatment, OSBL, and indirect costs.
In cases 2 and 3, the ratios between the single cost factors remain approximately constant in comparison to the base case, as the CAPEX is a function of the PEC only.
While in case 3, the capital costs for the coal boiler are neglected, the capital costs for the CHP are included in case 4. Hence, case 4 CAPEX is significantly higher than all other cases due to the 70.1 MEUR costs for the CHP plant.
Figure A3. CAPEX for carbon capture in cement plants.
Energies 12 02432 g0a3
Table A9. CAPEX results for carbon capture in cement plants in [MEUR].
BaseCase 2Case 3Case 4
Direct cost82.275.2117.6136.3
Inside Battery Limits (ISBL)53.249.475.387.0
Purchased Equipment Cost (PEC)23.822.133.638.9
Purchased Equipment Installation12.511.717.820.5
Instrumentation and Control4.84.46.77.8
Piping9.58.813.515.5
Electrical2.62.43.74.3
Outside Battery Limits (OSBL)10.79.915.117.5
Building and Building Services2.42.23.43.9
Yard Improvements2.42.23.43.9
Service Facilities4.84.46.77.8
Land1.21.11.71.9
Flue Gas Treatment18.415.927.231.8
FGD Unit14.111.522.927.4
SCR Unit4.34.34.34.3
Indirect cost8.98.312.614.6
Engineering2.42.23.43.9
Construction Expenses2.42.23.43.9
Contractor’s Fee0.10.10.20.2
Contingency4.03.85.76.6
CHP/Steam Source Costs (CHPC)///70.1
Fixed Capital Investment (FCI)91.183.5130.2220.9
Working Investment (WI)22.820.932.555.2
Start-up Cost and Initial MEA Cost (SUC)12.711.618.130.7
CAPEX126.6115.9180.8306.8

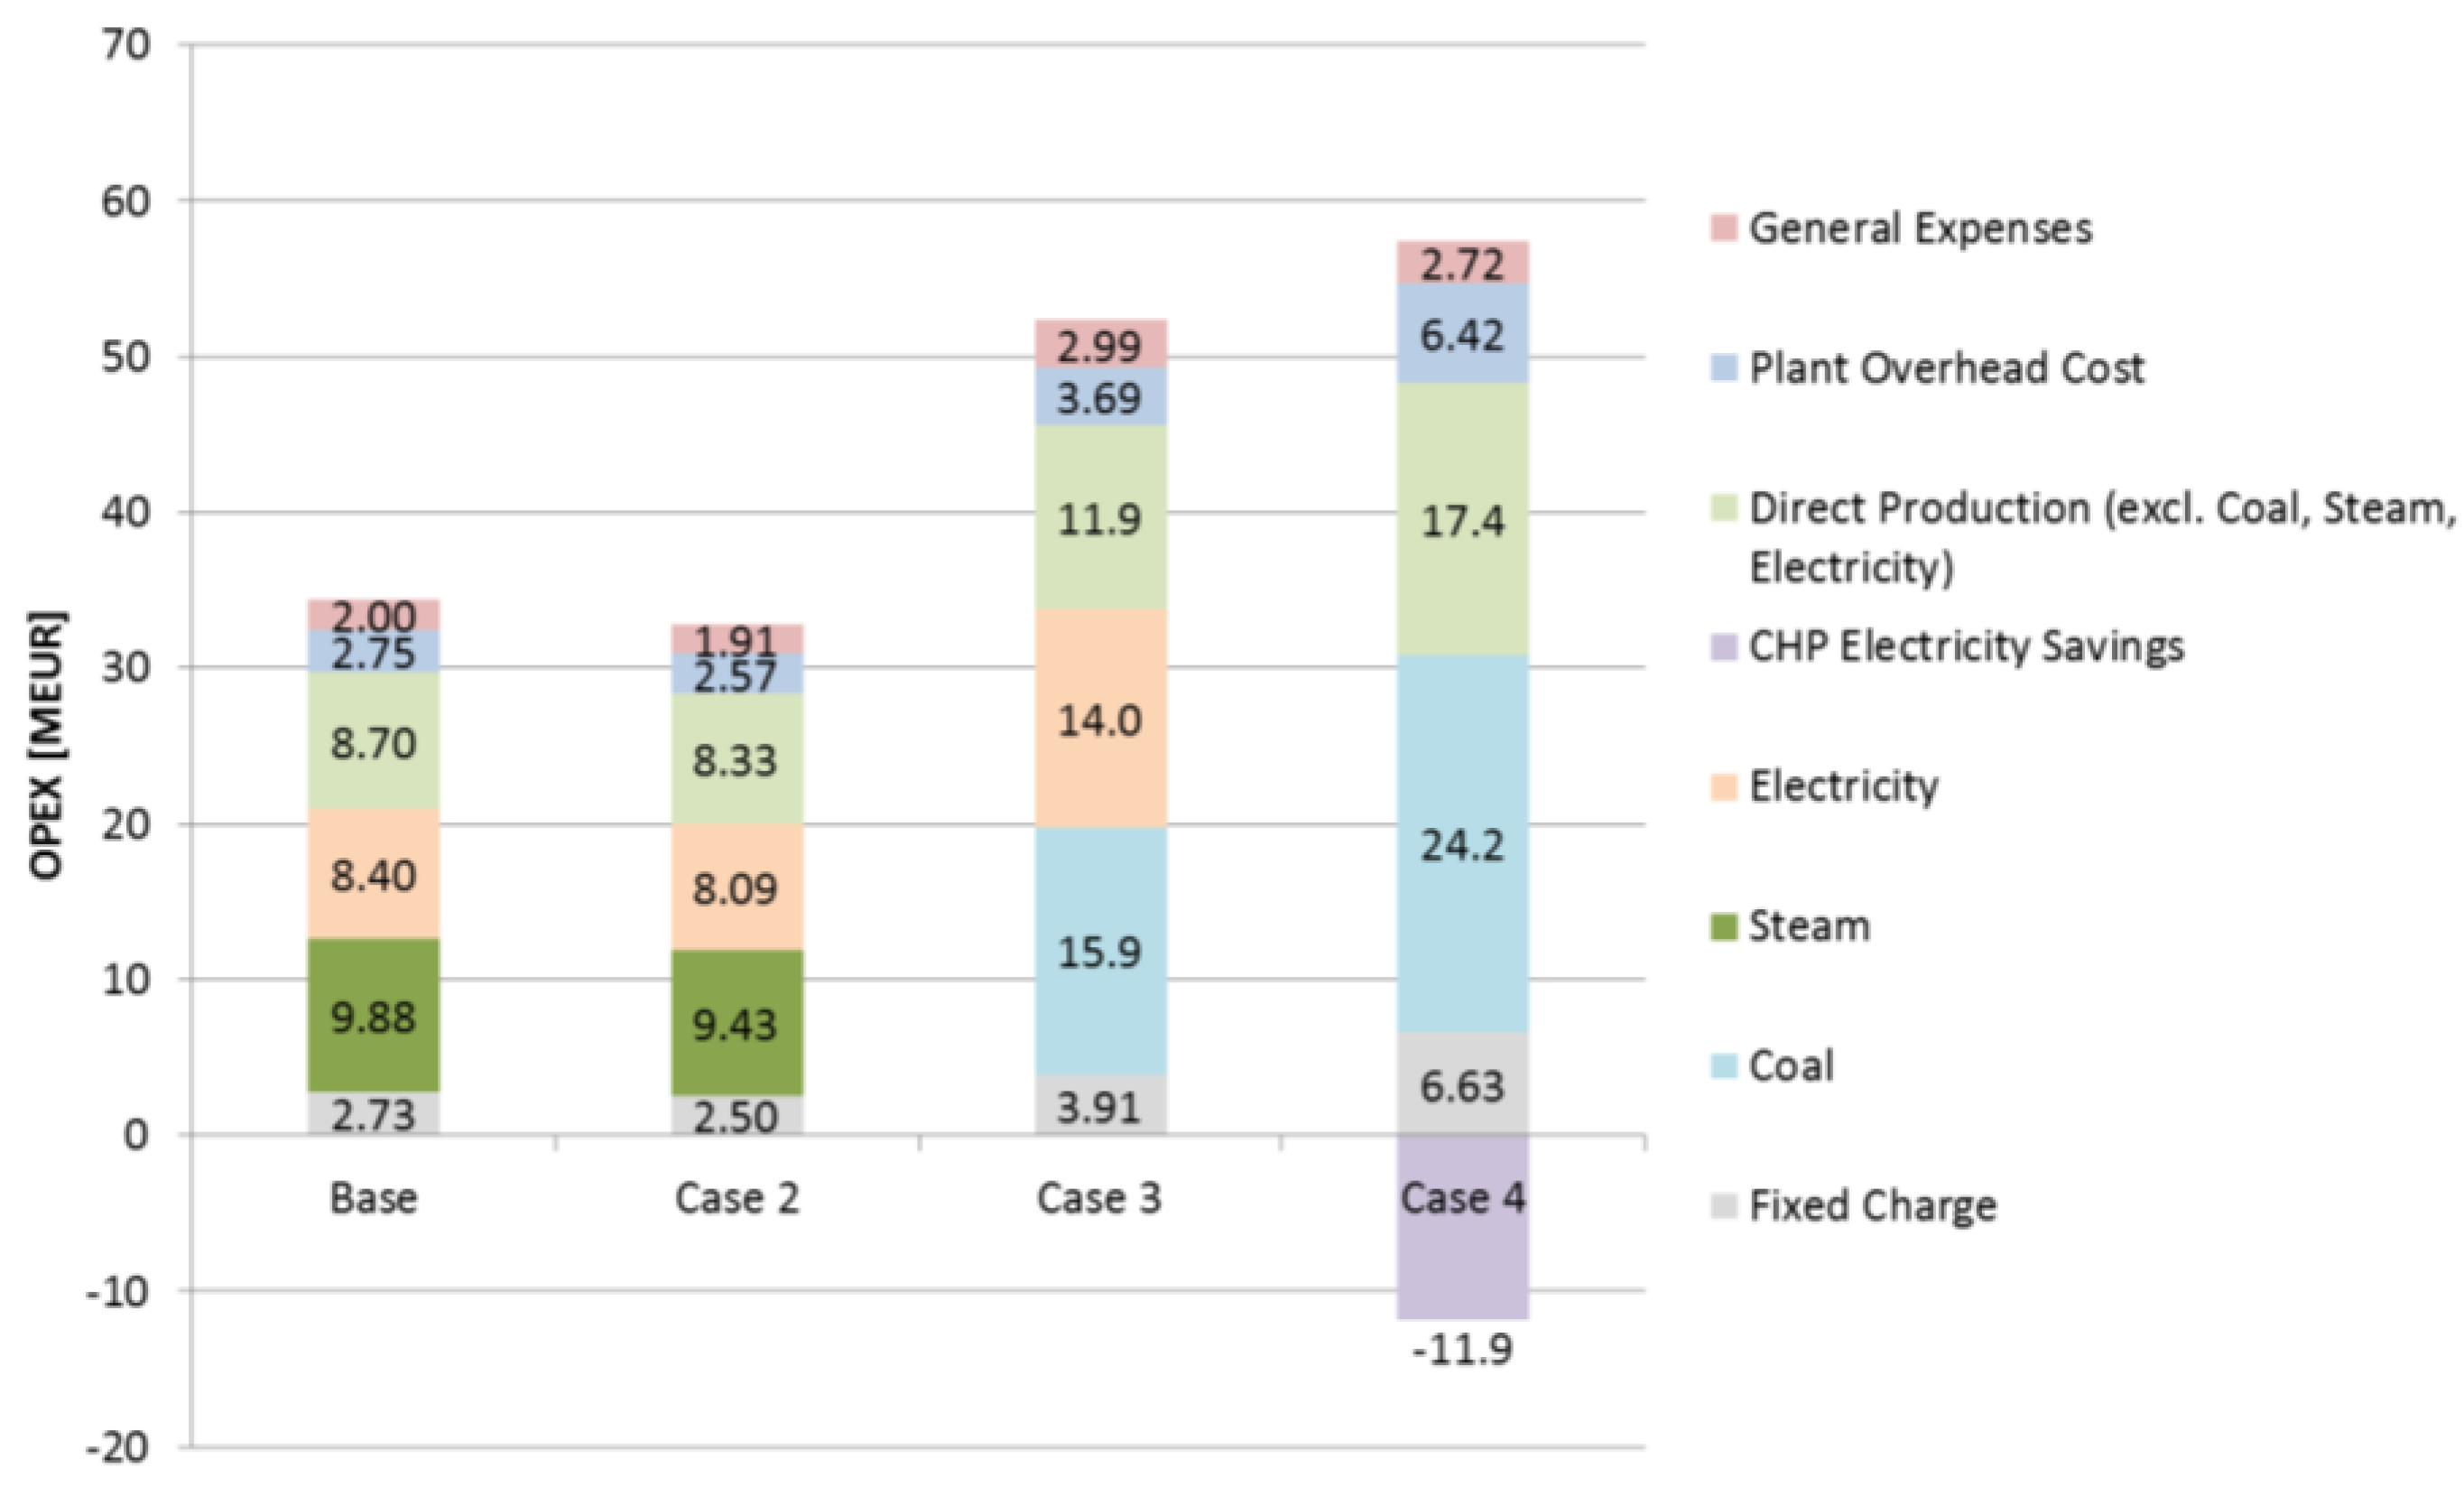
Appendix F. OPEX Results

OPEX is given in Figure A4 and Table A10. With annual costs of 9.9 MEUR, the steam costs account for 29% of the total 34.5 MEUR OPEX in the base case. The second largest single cost factor is electricity, with another 24%. Hence, energy costs account for more than 50% of the overall OPEX in the base case. Case 2 OPEX is slightly lower (9.4 MEUR), with the energy costs again equaling 50% of the overall costs.
In the case of a coal boiler steam generator onsite, the steam costs are substituted by coal costs. Annual coal costs account for 16 MEUR (39%) of the total 52.3 MEUR OPEX. The second largest single cost factor is electricity with 14 MEUR and 27%. In comparison to the base case, the energy costs are, hence, up by 12 MEUR or 64%. This is because in the base case the steam was generated offsite and hence the associated CO2 not captured. As the coal boiler CO2 is captured in this case, the steam demand for capturing the increasing mass of CO2 from the flue gas increases.
The case 4 OPEX accumulates to 57.4 MEUR, when the electricity savings for the cement plant are not considered. The electricity savings (pink in the diagram) stem from ‘selling’ electricity to the cement plant. Coal costs account for 42%, 24.2 MEUR, of the overall OPEX. As the CHP provides electricity and heat, these costs must be compared to the electricity and steam costs in the previous cases. In comparison, the relative costs are therefore lower than the electricity and steam costs together in the base case, case 2, and 3. A reason for this might be the effects of scale.
When taking into consideration that part of the electricity meets the cement plant demand, savings of 11.9 MEUR reduce the annual OPEX to 45.5 MEUR, which is lower than in case 3. However, part of the energy costs of case 4 are allocated in the CHP capital costs in the CAPEX (Table A9).
Table A10. Results for carbon capture in cement plants in MEUR.
BaseCase 2Case 3Case 4
Fixed Charge2.732.503.916.63
Local taxes1.821.672.604.42
Insurance0.910.831.302.21
Direct Production Cost27.025.841.729.7
Cooling Water0.630.621.021.24
Coal0.000.0015.9124.20
Steam9.889.430.000.00
Electricity8.408.0913.97−11.90 *
MEA Make Up1.091.081.902.05
Limestone0.030.020.040.05
Ammonia0.370.370.370.37
SCR Catalyst1.191.191.191.19
Activated Carbon0.190.190.330.36
Maintenance (M)3.653.345.218.84
Operating Labor (OL)0.720.720.721.44
Supervision and Support Labor0.220.220.220.43
Operating Supplies0.550.500.781.33
Laboratory Charges0.070.070.070.14
Plant Overhead Cost2.752.573.696.42
General Expenses2.001.912.992.72
Administrative Cost0.110.110.110.22
Distribution and Marketing0.170.160.260.23
R&D Cost1.721.642.622.27
OPEX34.4632.8352.3145.50
* Electricity produced by the CHP satisfies the cement plant’s electricity demand. Savings equaling the electricity costs of the conventional cement plant are achieved.
Figure A4. OPEX for carbon capture in cement plants.
Energies 12 02432 g0a4

References

  1. Federal Ministry for the Environment, Nature Conservation, Building and Nuclear Safety (BMUB). Climate Action Plan 2050—Principles and Goal of the German Government’s Policy. 2016. Available online: https://www.bmu.de/fileadmin/Daten_BMU/Pools/Broschueren/klimaschutzplan_2050_en_bf.pdf (accessed on 18 April 2019).
  2. Robinius, M.; Otto, A.; Heuser, P.; Welder, L.; Syranidis, K.; Ryberg, D.; Grube, T.; Markewitz, P.; Peters, R. Linking the Power and Transport Sectors—Part 1: The Principle of Sector Coupling. Energies 2017, 10, 957. [Google Scholar] [CrossRef]
  3. Otto, A.; Robinius, M.; Grube, T.; Schiebahn, S.; Praktiknjo, A.; Stolten, D. Power-to-Steel: Reducing CO2 through the Integration of Renewable Energy and Hydrogen into the German Steel Industry. Energies 2017, 10, 451. [Google Scholar] [CrossRef]
  4. Andrew, R.M. Global CO2 emissions from cement production. Earth Syst. Sci. Data 2018, 10, 195–217. [Google Scholar] [CrossRef]
  5. Le Quere, C.; Andrew, R.M.; Friedlingstein, P.; Sitch, S.; Hauck, J.; Pongratz, J.; Pickers, P.; Korsbakken, J.I.; Peters, G.P.; Canadell, J.G.; et al. Global Carbon Budget 2018. Earth Syst. Sci. Data 2018, 10, 2141–2194. [Google Scholar] [CrossRef] [Green Version]
  6. Deutsche Emissionshandelsstelle (DEHSt). Treibhausgasemissionen 2017—Emissionshandelspflichtige Stationäre Anlagen und Luftverkehr in Deutschland (VET-Bericht 2017). 2018. Available online: https://www.dehst.de/SharedDocs/downloads/DE/publikationen/VET-Bericht-2017.pdf?__blob=publicationFile&v=5 (accessed on 5 August 2018).
  7. Verein Deutscher Zementwerke (VDZ). Zementindustrie im Überblick 2017/2018. Berlin, 2017. Available online: https://www.vdz-online.de/fileadmin/gruppen/vdz/3LiteraturRecherche/Zementindustie_im_Ueberblick/VDZ_Zementindustrie_im_Ueberblick_2017_2018.pdf (accessed on 17 April 2019).
  8. Ishak, S.A.; Hashim, H. Low carbon measures for cement plant—A review. J. Clean. Prod. 2015, 103, 260–274. [Google Scholar] [CrossRef]
  9. Verband Deutscher Zementindustrie (VDZ). Environmental Data of the German Cement Industry 2016; VDZ: Düsseldorf, Germany, 2017; Available online: https://www.vdz-online.de/en/latest-news/press-releases-detail/news/environmental-data-of-the-german-cement-industry-2016-high-investments-in-environmental-protection/cobj/20680/ (accessed on 23 April 2019).
  10. BDI. Klimapfade für Deutschland. BDI, 2018. Available online: https://bdi.eu/media/publikationen/?publicationtype=Studien#/publikation/news/klimapfade-fuer-deutschland/ (accessed on 29 April 2019).
  11. dena. dena-Leitstudie—Integrierte Energiewende. Deutsche Energieagentur(dena), 2018. Available online: https://www.dena.de/newsroom/publikationsdetailansicht/pub/dena-leitstudie-integrierte-energiewende-ergebnisbericht/ (accessed on 28 April 2019).
  12. Pfluger, B.; Tersteegen, B.; Franke, B. Langfristszenarien für die Transformation des Energiesystems in Deutschland—Modul 3: Referenzszenario und Basisszenario, Studie im Auftrag des Bundesministeriums für Wirtschaft und Energie. September 2017. Available online: https://www.bmwi.de/Redaktion/DE/Downloads/B/berichtsmodul-3-referenzszenario-und-basisszenario.pdf?_blob=publicationFile&v=4 (accessed on 27 April 2019).
  13. Billig, E.; Decker, M.; Benzinger, W.; Ketelsen, F.; Pfeifer, P.; Peters, R.; Stolten, D.; Thrän, D. Non-fossil CO2 recycling—The technical potential for the present and future utilization for fuels in Germany. J. CO2 Utilizat. 2019, 30, 130–141. [Google Scholar] [CrossRef]
  14. Otto, A.; Grube, T.; Schiebahn, S.; Stolten, D. Closing the loop: Captured CO2 as a feedstock in the chemical industry. Energy Environ. Sci. 2015, 8, 3283–3297. [Google Scholar] [CrossRef]
  15. Naims, H. Economics of carbon dioxide capture and utilization-a supply and demand perspective. Environ. Sci. Pollut. Res. Int. 2016, 23, 22226–22241. [Google Scholar] [CrossRef]
  16. Schorcht, F.; Kourti, I.; Scalet, B.M.; Roudier, S.; Sancho, L.G. Best Available Techniques (BAT) Reference Document for the Production of Cement, Lime and Magnesium Oxide—Industrial Emissions Directive 2010/75/EU. 2013. Available online: http://eippcb.jrc.ec.europa.eu/reference/BREF/CLM_Published_def.pdf (accessed on 28 April 2019). [CrossRef]
  17. VDZ. Zement-Taschenbuch 2002; Verlag Bau+Technik: Düsseldorf, Germany, 2002. [Google Scholar]
  18. IEAGHG. CO2 Capture in the Cement Industry—Technical Study Report Number: 2008/3. IEA Greenhouse Gas R&D Programme (IEAGHG), 2008. Available online: https://ieaghg.org/docs/General_Docs/Reports/2008-3.pdf (accessed on 17 April 2019).
  19. CEMCAP. CO2 Capture from Cement Production. D 8.1 Status Report on Calciner Technology Revision 2. 2016. Available online: https://www.sintef.no/globalassets/sintef-energi/cemcap/d8.1-cemcap-deliverable-8_1_rev2.pdf (accessed on 18 April 2019).
  20. CEMCAP. CO2 Capture from Cement Production. D3.2 CEMCAP Framework for Comparative Techno-Economic Analysis of CO2 Capture from Cement Plants. 2017. Available online: https://www.sintef.no/globalassets/sintef-energi/cemcap/d3.2-cemcap-framework-for-comparative-techno-economic-analysis-of-co2-capture-from-cement-plants_.pdf (accessed on 17 April 2019).
  21. Verband der Deutschen Zementindustrie (VDZ). Wichtige Daten auf einen Blick. Available online: https://www.vdz-online.de/publikationen/zahlen-und-daten/a-wichtige-daten-auf-einen-blick/ (accessed on 28 April 2019).
  22. Cement Sustainibility Initiative (CSI). Getting the Numbers Right GNR-Project. 2019. Available online: https://www.wbcsdcement.org/GNR-2016/ (accessed on 17 April 2019).
  23. CEMCAP. CO2 Capture from Cement Production. D4.2 Design and Performance of CEMCAP Cement Plant with MEA Post Combustion Capture. 2016. Available online: https://www.sintef.no/globalassets/sintef-energi/cemcap/d4.2-design-and-performance-of-cemcap-cement-plant-with-mea-post-combustion-capture_rev1~1.pdf (accessed on 17 April 2019).
  24. CEMCAP. CO2 Capture from Cement Production. Design and Performance of CEMCAP Cement Plant without CO2 Capture. 2016. Available online: https://www.sintef.no/globalassets/sintef-energi/cemcap/d4.1-cemcap-cement-plant-without-co2-capture_rev2.pdf (accessed on 18 April 2019).
  25. CEMCAP. CEMCAP Framework for Comparative Techno-Economic Analysis of CO2 Capture from Plants. 2018. Available online: https://www.zenodo.org/record/1257112#.XOvdev7grRa (accessed on 28 May 2019).
  26. Hilz, J.; Haaf, M.; Helbig, M.; Ströhle, B.; Epple, B. Calcium carbonate Looping: CO2 capture by using limestone in the cement industry. Cement Int. 2017, 15, 52–63. [Google Scholar]
  27. Puxty, G.; Maeder, M. The fundamentals of post-combustion capture. In Absorption-Based Post-Combustion Capture of Carbon Dioxide; Feron, P.H.M., Ed.; Elsevier Woodhead Publishing: Heidelberg, Germany, 2016; pp. 13–33. [Google Scholar]
  28. Roussanaly, S.; Fu, C.; Voldsund, M.; Anantharaman, R.; Spinelli, M.; Romano, M. Techno-economic Analysis of MEA CO2 Capture from a Cement Kiln—Impact of Steam Supply Scenario. Energy Procedia 2017, 114, 6229–6239. [Google Scholar] [CrossRef]
  29. Hassan, S.M.N. Techno-Economic Study of CO2 Capture Process for Cement Plants; University of Waterloo: Waterloo, ON, Canada, 2005; Available online: http://hdl.handle.net/10012/925 (accessed on 18 April 2019).
  30. Barker, D.J.; Turner, S.A.; Napier-Moore, P.A.; Clark, M.; Davison, J.E. CO2 Capture in the Cement Industry. Energy Procedia 2009, 1, 87–94. [Google Scholar] [CrossRef]
  31. Kuramochi, T.; Ramírez, A.; Turkenburg, W.; Faaij, A. Comparative assessment of CO2 capture technologies for carbon-intensive industrial processes. Prog. Energy Combust. Sci. 2012, 38, 87–112. [Google Scholar] [CrossRef]
  32. Jakobsen, J.; Roussanaly, S.; Anantharaman, R. A techno-economic case study of CO2 capture, transport and storage chain from a cement plant in Norway. J.Clean. Prod. 2017, 144, 523–539. [Google Scholar] [CrossRef]
  33. Zhou, W.; Jiang, D.; Chen, D.; Griffy-Brown, C.; Jin, Y.; Zhu, B. Capturing CO2 from cement plants: A priority for reducing CO2 emissions in China. Energy 2016, 106, 464–474. [Google Scholar] [CrossRef]
  34. Ho, M.T.; Allinson, G.W.; Wiley, D.E. Comparison of MEA capture cost for low CO2 emissions sources in Australia. Int. J. Greenh. Gas Control 2011, 5, 49–60. [Google Scholar] [CrossRef]
  35. Summers, W.M.; Herron, S.E.; Zoelle, A. Cost of Capturing CO2 from Industrial Sources; NETL: Albany, OR, USA, 2014.
  36. Atsonios, K.; Grammelis, P.; Antiohos, S.K.; Nikolopoulos, N.; Kakaras, E. Integration of calcium looping technology in existing cement plant for CO2 capture: Process modeling and technical considerations. Fuel 2015, 153, 210–223. [Google Scholar] [CrossRef]
  37. Bosoaga, A.; Masek, O.; Oakey, J.E. CO2 Capture Technologies for Cement Industry. Energy Procedia 2009, 1, 133–140. [Google Scholar] [CrossRef]
  38. IEAGHG. Deployment of CCS in the Cement Industry-Report 2013/19. 2013. Available online: https://ieaghg.org/docs/General_Docs/Reports/2013-19.pdf (accessed on 28 April 2019).
  39. Knudsen, J.N.; Bade, O.M.; Askestad, I.; Gorset, O.; Mejdell, T. Pilot Plant Demonstration of CO2 Capture from Cement Plant with Advanced Amine Technology. Energy Procedia 2014, 63, 6464–6475. [Google Scholar] [CrossRef]
  40. Abu-Zahra, M.R.M.; Niederer, J.P.M.; Feron, P.H.M.; Versteeg, G.F. CO2 capture from power plants. Int. J. Greenh. Gas Control 2007, 1, 135–142. [Google Scholar] [CrossRef]
  41. Smith, R. Chemical Process Design and Integration, 2nd ed.; Wiley: Chichester, UK, 2016; p. XXIII. 896p. [Google Scholar]
  42. Economic Indicators. Chemical Engineering Plant Cost Index (CEPCI); ChemEngOnline, 2017; p. 80. Available online: https://de.scribd.com/document/352561651/CEPCI-June-2017-Issue (accessed on 18 April 2019).
  43. Peters, M.S.; Timmerhaus, K.D.; West, R.E. Plant Design and Economics for Chemical Engineers, 5th ed.; McGraw-Hill: Boston, MA, USA, 2004; p. XVII. 988p. [Google Scholar]
  44. EPA. The Social Cost of Carbon. EPA, 2017. Available online: https://19january2017snapshot.epa.gov/climatechange/social-cost-carbon_.html, (accessed on 15 May 2019).
  45. Pezzey, J.C.V. Why the social cost of carbon will always be disputed. Wiley Interdiscip. Rev. Clim. Chang. 2019, 10, e558. [Google Scholar] [CrossRef]
  46. Pindyck, R.S. Climate Change Policy: What Do the Models Tell Us? J. Econ. Lit. 2013, 51, 860–872. [Google Scholar] [CrossRef]
  47. Howarth, R.B.; Gerst, M.D.; Borsuk, M.E. Risk mitigation and the social cost of carbon. Glob. Environ. Chang. 2014, 24, 123–131. [Google Scholar] [CrossRef]
  48. Stilglitz, J.E.; Stern, N.; Duan, M.; Edenhofer, O.; Giraud, G.; Heal, G.; la Rovere, E.; Moris, A.; Moyer, E.; Pangestu, M.; et al. Report on the High-Level Comission on Carbon Prices. 2017. Available online: https://www.carbonpricingleadership.org/report-of-the-highlevel-commission-on-carbon-prices (accessed on 20 May 2019).
  49. Carattini, S.; Kallbekken, S.; Orlov, A. How to win public support for a global tax. Nature 2019, 565, 289–291. [Google Scholar] [CrossRef]
  50. Öko-Institut; Fraunhofer-ISI. Klimaschutzszenario 2050. 2. Endbericht. Studie im Auftrag des Bundesministeriums für Umwelt, Naturschutz, Bau und Reaktorsicherheit. 2015. Available online: https://www.oeko.de/oekodoc/2451/2015-608-de.pdf (accessed on 20 May 2019).
  51. UBA. Treibhausgasneutrales Deutschland im Jahr 2050; UBA: Dessau-Roßlau, Germany, 2014; Available online: http://www.umweltbundesamt.de/publikationen/treibhausgasneutrales-deutschland-im-jahr-2050-0 (accessed on 20 May 2019).
  52. Turton, R. Analysis, Synthesis, and Design of Chemical Processes [E-Book], 3rd ed.; Prentice Hall: Upper Saddle River, NJ, USA, 2009. [Google Scholar]
Figure 1. Monoethanolamin (MEA) absorption for cement plant process design, including the boundaries for the economic and energy analyses conducted in Aspen.
Energies 12 02432 g001
Figure 2. Purchased equipment costs for carbon capture in cement plants.
Energies 12 02432 g002
Figure 3. Capture, avoidance, and clinker costs and CO2 avoidance [%] for carbon capture in cement plants; investigated cases.
Energies 12 02432 g003
Figure 4. Sensitivity analysis of CO2 avoidance costs for base case (a), case 3 (b), and case 4 (c).
Energies 12 02432 g004
Figure 5. Thermal energy requirement for the present study and the literature (steam sources indicated in brackets).
Energies 12 02432 g005
Figure 6. CO2 capture and avoidance costs for the present study and the literature (steam sources indicated in brackets); values in USD were converted to EUR with USD/EUR = 1.11.
Energies 12 02432 g006
Figure 7. German clinker production projections, base, and low scenarios taken from Fraunhofer ISI and Öko-Institut [50] (historical data from German Cement Association (VDZ) [7]).
Energies 12 02432 g007
Figure 8. CCUS Germany: CO2 emission projections for base clinker production (historical data from UBA/VDZ [21,51]).
Energies 12 02432 g008
Figure 9. CCUS Germany: CO2 emission projections for low clinker production. (historical data from UBA/VDZ [21,51]).
Energies 12 02432 g009
Figure 10. CCUS Germany: CO2 emission projections for high clinker production (historical data from UBA/VDZ [21,51]).
Energies 12 02432 g010
Table 1. Gas parameters at the stack [20].
Air Leak in Raw MillMediumLow
Air leak in raw mill, flow rate [kg/h]139,80669,903
Total flow rate [kg/h]388,098318,192
Temperature [°C]110130
Gas composition, wet basis [mol%]
CO21822
N26360
O2107
H2O911
Table 2. Energy analysis: Performance indicators for carbon capture, utilization, and storage (CCUS).
Equation
Specific Thermal Energy Requirement = T h e r m a l   E n e r g y   R e q u i r e m e n t m C O 2 , c a p
Specific Cooling Duty = C o o l i n g   D u t y m C O 2 , c a p
Specific Compression Work = C o m p r e s s i o n   W o r k m C O 2 , c a p
Specific Electricity Consumption = E l e c t r i c i t y   C o n s u m p t i o n m C O 2 , c a p
Table 3. Annual costs, CO2 avoidance, CO2 avoidance costs, clinker costs.
SymbolEquation
Total Annual Costs K a n , t o t = K O P E X + I C A P E X * a
CO2 Avoidance m C O 2 , a v = m C O 2 , c a p m C O 2 , a d d i t i o n a l
Additional CO2 Emissions m C O 2 , a d d i t i o n a l = m C O 2 , s t e a m + m C O 2 , e l
CO2 Avoidance Costs k C O 2 , a v = K a n , t o t m C O 2 , a v
CO2 Capture Costs k C O 2 , c a p = K a n , t o t m C O 2 , c a p
Clinker Costs k c l i n k e r = k c l i n k e r , b a s e + K a n , t o t m c l i n k e r , a n
Table 4. Definitions and parameters.
ParameterBaseCase 2Case 3Case 4
Flue Gas Air LeakMediumLowMediumMedium
Electricity SourceImportImportImportGeneration in CHP
Steam SourceImportImportGeneration in BoilerGeneration in CHP
Table 5. Analysis of carbon capture for cement plants.
ParameterUnitBaseCase 2Case 3Case 4
Heat Demand (Reboiler)MWth9289150181
Electricity Demand CCUS PlantMWel11.911.519.823.7
Flue Gas Flow Cementkg/h388,098318,192388,098388,098
Flue Gas Flow Boiler/CHPkg/h//243,360369,878
CO2 Content Boiler/CHP Flue Gasmol%//15.715.7
CO2 Content in the Flue Gas (Cement + Boiler/CHP)mol%18221717
CO2 Capture Rate%90909090
CO2 Captured m C O 2 , c a p kt/a72872211371364
Specific Thermal Energy RequirementMJth/kgCO23.63.53.83.8
Specific Cooling DutyMJth/kgCO24.34.34.54.5
Specific Compression WorkMJel/kgCO20.300.300.300.29
Specific Electricity ConsumptionMJel/kgCO20.410.410.440.44
Table 6. Annual costs, CO2 captured, and avoidance mass and costs, clinker costs for carbon capture in cement plants.
ParameterUnitw/o CCSBaseCase 2Case 3Case 4
Total Annual CostsMEUR/a/46.343.769.374.2
CO2 Avoidance Rate%/70717490
CO2 Avoidancekt/a/567567601727
CO2 Capture CostsEUR/t/63.660.560.954.4
CO2 Avoidance CostsEUR/t/81.777.1115102
Clinker CostsEUR/t61.7108105131136
Cement CostsEUR/t45.377.875.694.397.9

