1. Introduction
As an important part of modern service industry, the transportation industry is a high energy consumption industry and a large carbon emitter in the national economic system. According to the international standard industry classification (ISIC Rev 4.0), the transportation industry is divided into road transportation, railway transportation, navigation transportation, aviation transportation, and pipeline transportation, and the transportation industry studied in this paper is specified as follows: road transportation, railway transportation, domestic aviation transportation, pipeline transport, and domestic navigation transportation. According to the “carbon dioxide emissions from fuel combustion” report released by the International Energy Agency (IEA) in 2017, the world’s transportation industry accounted for the second largest share of global carbon emissions in 2017, accounting for 23.96% of the total [
1]. Therefore, the development of low-carbon transportation is not only the requirement of the transportation industry to save energy and to reduce emissions and the impact on the environment, but also the requirement of the era for a low-carbon economy. It is the most effective direction of transportation development to deal with the serious energy consumption in society and prevent global warming.
The phrase the “Belt and Road Initiative”(BRI), which stands for the “silk road economic belt” and “marine silk road in the 21st century”, was successively put forward by Chinese President Xi Jinping during his visit to Central Asia and Southeast Asian countries in September and October 2013. Then China’s national development and reform commission, ministries of foreign affairs, and commerce jointly issued the report called “the vision and action of pushing to build the silk road economic belt and the maritime silk road into the 21st century”. BRI involves 66 countries in Asia, Europe, and Africa. An in-depth study of the factors affecting the carbon emissions of the transport industry for these countries will help formulate relevant policies to control their carbon emissions of the transport industry and make contributions to the control of global warming.
At present, research on the carbon emission of the transportation industry in the BRI countries mainly focuses on the factors influencing the carbon emission and the low-carbon transportation development measures of specific countries and regions.
Regarding the research on influencing factors, Danish et al. studied the relationship between transport energy consumption, economic growth, foreign direct investment, and carbon dioxide emissions in urban transport sector in Pakistan [
2]. Liang et al. analyzed the influence of energy structure, energy efficiency, transportation mode, transportation development, economic development, and population size on the CO
2 emissions of China’s transportation sector from 2001 to 2014 [
3]. Xu et al. analyzed the driving force of carbon dioxide emissions in China’s transportation industry by vector autoregressive model and found that energy efficiency plays a leading role in reducing carbon dioxide emissions [
4]. Song et al. built super-efficiency non-expected models, made evaluation analysis on transportation energy efficiency among 30 provinces of the China’s eastern, central, and western parts, and found that the Chinese transportation industry’s overall energy efficiency presents the anti-N type market decline, and the large discreteness maintains in the eastern and western provinces, and the strong consistency while the overall level is low in the northeast provinces [
5]. Li et al. discussed the influencing factors of CO
2 emissions from road freight in China from 1985 to 2007, and concluded that economic growth is the most important factor for the increase of CO
2 emissions, while industrial added value and market concentration levels have a significant impact on the reduction of CO
2 emissions [
6]. Wang et al. analyzed the driving factors of carbon emissions in China’s transportation industry from 2000 to 2015 by using the generalized partition index method, and found that the added value, energy consumption and per capita carbon emissions of the transportation industry were the main factors leading to the increase of carbon emissions, and energy carbon emission intensity was the key factor to reduce carbon emissions [
7]. Lin et al. used quantile analysis to investigate the impact of China’s GDP, energy intensity, carbon intensity and urbanization on the carbon emissions of the transportation industry from 1980 to 2010, and found that GDP, energy intensity and carbon intensity had a greater impact on carbon emissions than urbanization [
8]. Liu et al. investigated the impact of urbanization on road traffic energy use by using the data of 386 cities in Norway from 2006 to 2009, and found that the urban density level had a significant negative impact on per capita road energy use [
9]. Fameli et al., after calculating the traffic carbon emissions in Attica, Greece, concluded that vehicle composition, popularity of diesel cars, urban speed, and vehicle renewal are the most effective parameters for formulating carbon emissions reduction policies [
10]. Hassan et al. empirically analyzed the influence of aircraft technology, operational improvement, and sustainable biofuels on future carbon dioxide emissions from the perspective of aviation transportation industry [
11]. Wu et al. used data from the years from 1949 to 2012, and applied vector autoregressive model to discuss the dynamic relationship among the interaction among China’s transportation, economic growth and carbon emissions [
12]. Xiao et al. introduced factors such as the proportion of added value of transportation industry, energy structure, and development level of transportation to analyze the direct and indirect impacts of various factors on carbon emissions of the transportation industry [
13]. Lu et al. calculated the regional differences in CO
2 emissions of the transportation industry in nine provinces and two cities in the Yangtze river economic belt from three aspects: per capita carbon emissions, carbon emissions per unit of added value, and carbon emissions per unit of converted turnover [
14]. Du et al., based on the panel data of carbon emissions of China’s transportation industry in the past 20 years, concluded that economic level, transportation intensity, and energy intensity are the main factors affecting carbon emissions of the transportation industry [
15]. Ou et al. analyzed the impact path of transportation technology progress on carbon dioxide emissions based on the multiple equilibrium theory and Stochastic Impacts by Regression on Population, Affluence, and Technology model [
16]. Li et al. selected carbon emissions, per capita carbon emissions, and carbon intensity indexes from the spatial–temporal perspective to analyze the spatial agglomeration characteristics of carbon emission of China’s transportation industry and the convergence characteristics with the change of time axis [
17].
Regarding low-carbon transport development measures, Bakker et al. made a comparative analysis of the approaches and status quo of sustainable and low-carbon transport policies in Association of Southeast Asian Nations (ASEAN) countries based on the strategy component developed by Howlett and Cashore [
18]. Selvakkumaran et al. adopted a recursive dynamic optimization model based on bottom-up modeling principle to analyze the energy utilization potential and emission reduction potential of Thailand’s transportation sector under two scenarios of low-carbon social measures and emission tax clusters [
19]. Fungtammasan et al. found that Thailand could achieve the national autonomous contribution (INDC) target by improving energy efficiency (especially in the transportation sector) and deploying the renewable energy and de-carbonization of power sectors [
20]. Lah et al. believe that in order to minimize the rebound effect, a balanced and integrated policy approach is needed to significantly curb greenhouse gas emissions from the transportation industry by combining vehicle efficiency standards, fuel tax and differentiated vehicle tax with mode selection and compact urban design [
21]. Shukla et al. showed that carbon dioxide emission reduction in transportation system can be achieved more effectively by combining emission reduction policies with measures to change traffic structure [
22]. Rashidi et al. selected three low-carbon investment cases of environmental protection departments and transportation departments in Nairobi (Kenya), Balikpapan (Indonesia), and Colombo (Sri Lanka) to illustrate how to promote low-carbon investment in transportation and waste treatment in developing countries [
23]. Lu et al. analyzed and calculated the total factor productivity and carbon emission efficiency of the transportation industry in Eastern China, and believed that the transportation industry in most provinces and cities still has a large space for energy conservation and emission reduction [
24]. Wang et al. discussed the carbon emission characteristics of Beijing’s commuting from different perspectives (macro and micro) and believed that reducing carbon dioxide emissions related to transfer is of great significance and necessity for the low-carbon emission of China’s urban transportation development. In order to avoid the increasing carbon dioxide emissions related to commuting, the use of cars should be restricted and public transportation is a priority [
25]. Dong et al. adopted life cycle assessment method to quantitatively analyze the environmental impact of Shenzhen urban public transport system (including buses and subways) from 2005 to 2015, in order to realize the low-carbon transformation of Shenzhen’s urban transportation sector [
26]. Gambhir et al. found that passenger cars and heavy trucks would constitute the majority of the carbon dioxide emission saving potential between 2010 and 2050 [
27]. Diaz-ruiz-Navamuel et al. empirically analyzed the values of the reduction in emissions obtained and the advantages of installing Automatic Mooring Systems and operating RoRo/Pax terminals in commercial ports [
28]. Wu et al. compared the environmental impact of the use of electric vehicles in developing and developed countries by taking Bric countries as an example and found that the electric car’s impact on the environment is closely related to the power structure and transmission efficiency in the involved countries and regions because of the high proportion of thermal power in developing countries. Therefore, considered that in a sense, the development of the electric car industry in developing countries is transferring environmental pollutant emissions from vehicles to process of electricity production [
29]. Shi et al. analyzed the emission reduction factors affecting electric vehicles, and also believed that the power generation energy structure and the power supply route of coal power technology play a decisive role in the carbon emission reduction space of the fuel life cycle of electric vehicles [
30].
As for the research on country’s development and carbon emissions of BRI, scholars outside China pay little attention to it, while Chinese scholars have conducted research from the fields of economy and culture. Lei et al. believed that in order to avoid repeating the mistake of sharp growth of carbon emissions after China’s accession to the WTO, China must balance the relationship between economic growth and carbon emission reduction. Therefore, the relationship between China’s economic growth and carbon emission reduction was studied from the perspective of synergy [
31]. Xu et al. empirically investigated the influence of cultural dimensions on carbon emissions of 42 sample countries in the BRI from 2000 to 2013 under the framework of environmental Kuznets curve [
32]. In the context of BRI, Zhang et al. studied the threshold effect of economic growth on carbon emissions by using panel data of 30 provinces (regions) in China from 2006 to 2015 and non-dynamic threshold panel estimation method [
33]. Chen et al. discussed how the trade opening, green investment and energy cooperation under BRI would contribute to the low-carbon development of the countries in the BRI based on the current reality and the academic research results [
34]. Xiao et al. selected the inter-provincial panel data of China from 2004 to 2015, and investigated the influence of the carbon emissions on provinces in the BRI by constructing the simultaneous equation model [
35].
A comprehensive review of the existing studies shows that countries in the BRI pay great attention to low-carbon development, and study the relationship between relevant factors and carbon emissions from different time spans, regional scope, and professional fields, providing many references and ideas for the realization of global carbon emission reduction. However, most scholars study carbon emission from one country or region. Since BRI was proposed by the Chinese government, Chinese scholars pay more attention to BRI. However, Chinese scholars mainly study national economic pattern and strategic development issues from the perspective of theoretical framework and strategy, lacking quantitative research. A small number of studies are conducted from the economic and cultural fields. With the advance of the BRI construction, the carbon emission in the field of transportation will grow rapidly, and how to realize the carbon emission reduction in the field of transportation is extremely urgent. This paper intends to use the transnational panel data to calculate the carbon emissions of the transportation industry of the countries in the BRI, and use the econometric model to analyze the influencing factors of the carbon emissions of the countries in the BRI, and finally put forward suggestions to control the carbon emissions of the transportation industry.
3. Model specification
Introduce the following notations, CE represents carbon emissions, PGDP represents per capita GDP, UL represents urbanization level, HE represents technical level, ECS represents energy consumption structure, TO represents trade openness.
3.1. Descriptive Statistics
Based on the statistics, we list the descriptive statistics of variables in
Table 3.
3.2. Panel Data Unit Root Test Results
In order to ensure the effectiveness of parameter estimation and avoid the occurrence of “pseudo-regression”, the stationarity of data should be tested before establishing the model. In order to ensure the reliability of the test results, this paper applies the Levin–Lin–Chu (LLC) in the same root case and the Fisher-ADF and Fisher-PP methods in the different root cases to conduct the unit root test. The co-integration test can only be carried out when the variables are single integrals of the same order.
Multiple test results show that the horizontal value of 6 variables cannot reject the null hypothesis, that is, the horizontal value of variables has unit root and is a non-stationary sequence. However, the first-order difference of the six variables all rejected the null hypothesis at the significance level of 1%. Therefore, the variables were all first-order single integral sequences, and the co-integration analysis could be continued.
3.3. Co-Integration Test Results of Panel Data
In order to test whether there is a long-term stable relationship between variables and carbon emissions, the co-integration test of panel data is required. Using Kao test [
36], the null hypothesis is that there is no co-integration relationship. The results are shown in
Table 4. The test results reject the null hypothesis at the significance level of 5%, and there is a long-term stable relationship between carbon emission and all variables.
3.4. Panel Model Setting
Because of the panel data’s dimensionality, if the model set is not correct, and the resulting parameter estimation method is undeserved. This article examines the types of models in two steps. Firstly, we carried out a Redundant test of Fixed Effect-likelihood ratio [
37], which is also called Fixed effect redundancy test (constraint test), to determine whether there is an effect and the number of effects. The test results are shown in
Table 5:
From the test results, the p value of time fixed effects regression model test was >0.05, therefore, we accept the null hypothesis—there was no fixed effect at the time point. The individual test p < 0.05, so, reject the null hypothesis that the individual has a fixed effect; therefore, the model exists an individual single factor effect.
According to the different ways of the individual influence, models can be divided into two kinds: fixed effect model and random effect model. This paper uses the Hausman test method [
38] to determine the model affect the form, and the null hypothesis of the model is that a random effect model should be established.
Table 6 indicates the result the
p value is less than 0.01, therefore, reject the null hypothesis and adopted fixed effect model.
Based on the comprehensive analysis, the regression model of fixed individual (i.e., variable intercept) should be established between the explanatory variable and the explained variable of the BRI national transportation industry carbon emission from 2005 to 2015. In addition, from the perspective of actual research needs, the research object is the transportation carbon emissions and other variables of 57 countries, and there is no problem with random sampling from the population. Therefore, compared with the random effect model, it is appropriate to establish the individual fixed effect model too.
3.5. Panel Model Regression Result
According to the test results above, the individual fixed effect model should be established in this paper. The model and parameter estimation results are as
Table 7:
The regression result shows that what the adjusted R2 very close to 1 indicates a good regression fitting effect. F value is greater than the critical value of 5% significance level, indicating that the linear relationship of the model is significant. T value of each parameter was greater than the critical value at significance level = 0.05, indicating that each explanatory variable had significant influence on the equation.
4. Empirical Analysis
According to the regression results, every 1% is increased in per capita GDP, the carbon emissions of the transportation industry increased by 0.0011%. For every 1% increase in urbanization level, the carbon emission of the transportation industry will rise by 7.7284%. For every 1% increase in the proportion of fossil energy consumption in the transportation industry, the carbon emissions of the transportation industry will grow by 1.1901%. For every 1% increase in technology level, carbon emissions of the transportation industry will be reduced by 0.2182%. Trade openness was increased by 1%, and carbon emissions from transportation industry were reduced by 0.0481%.
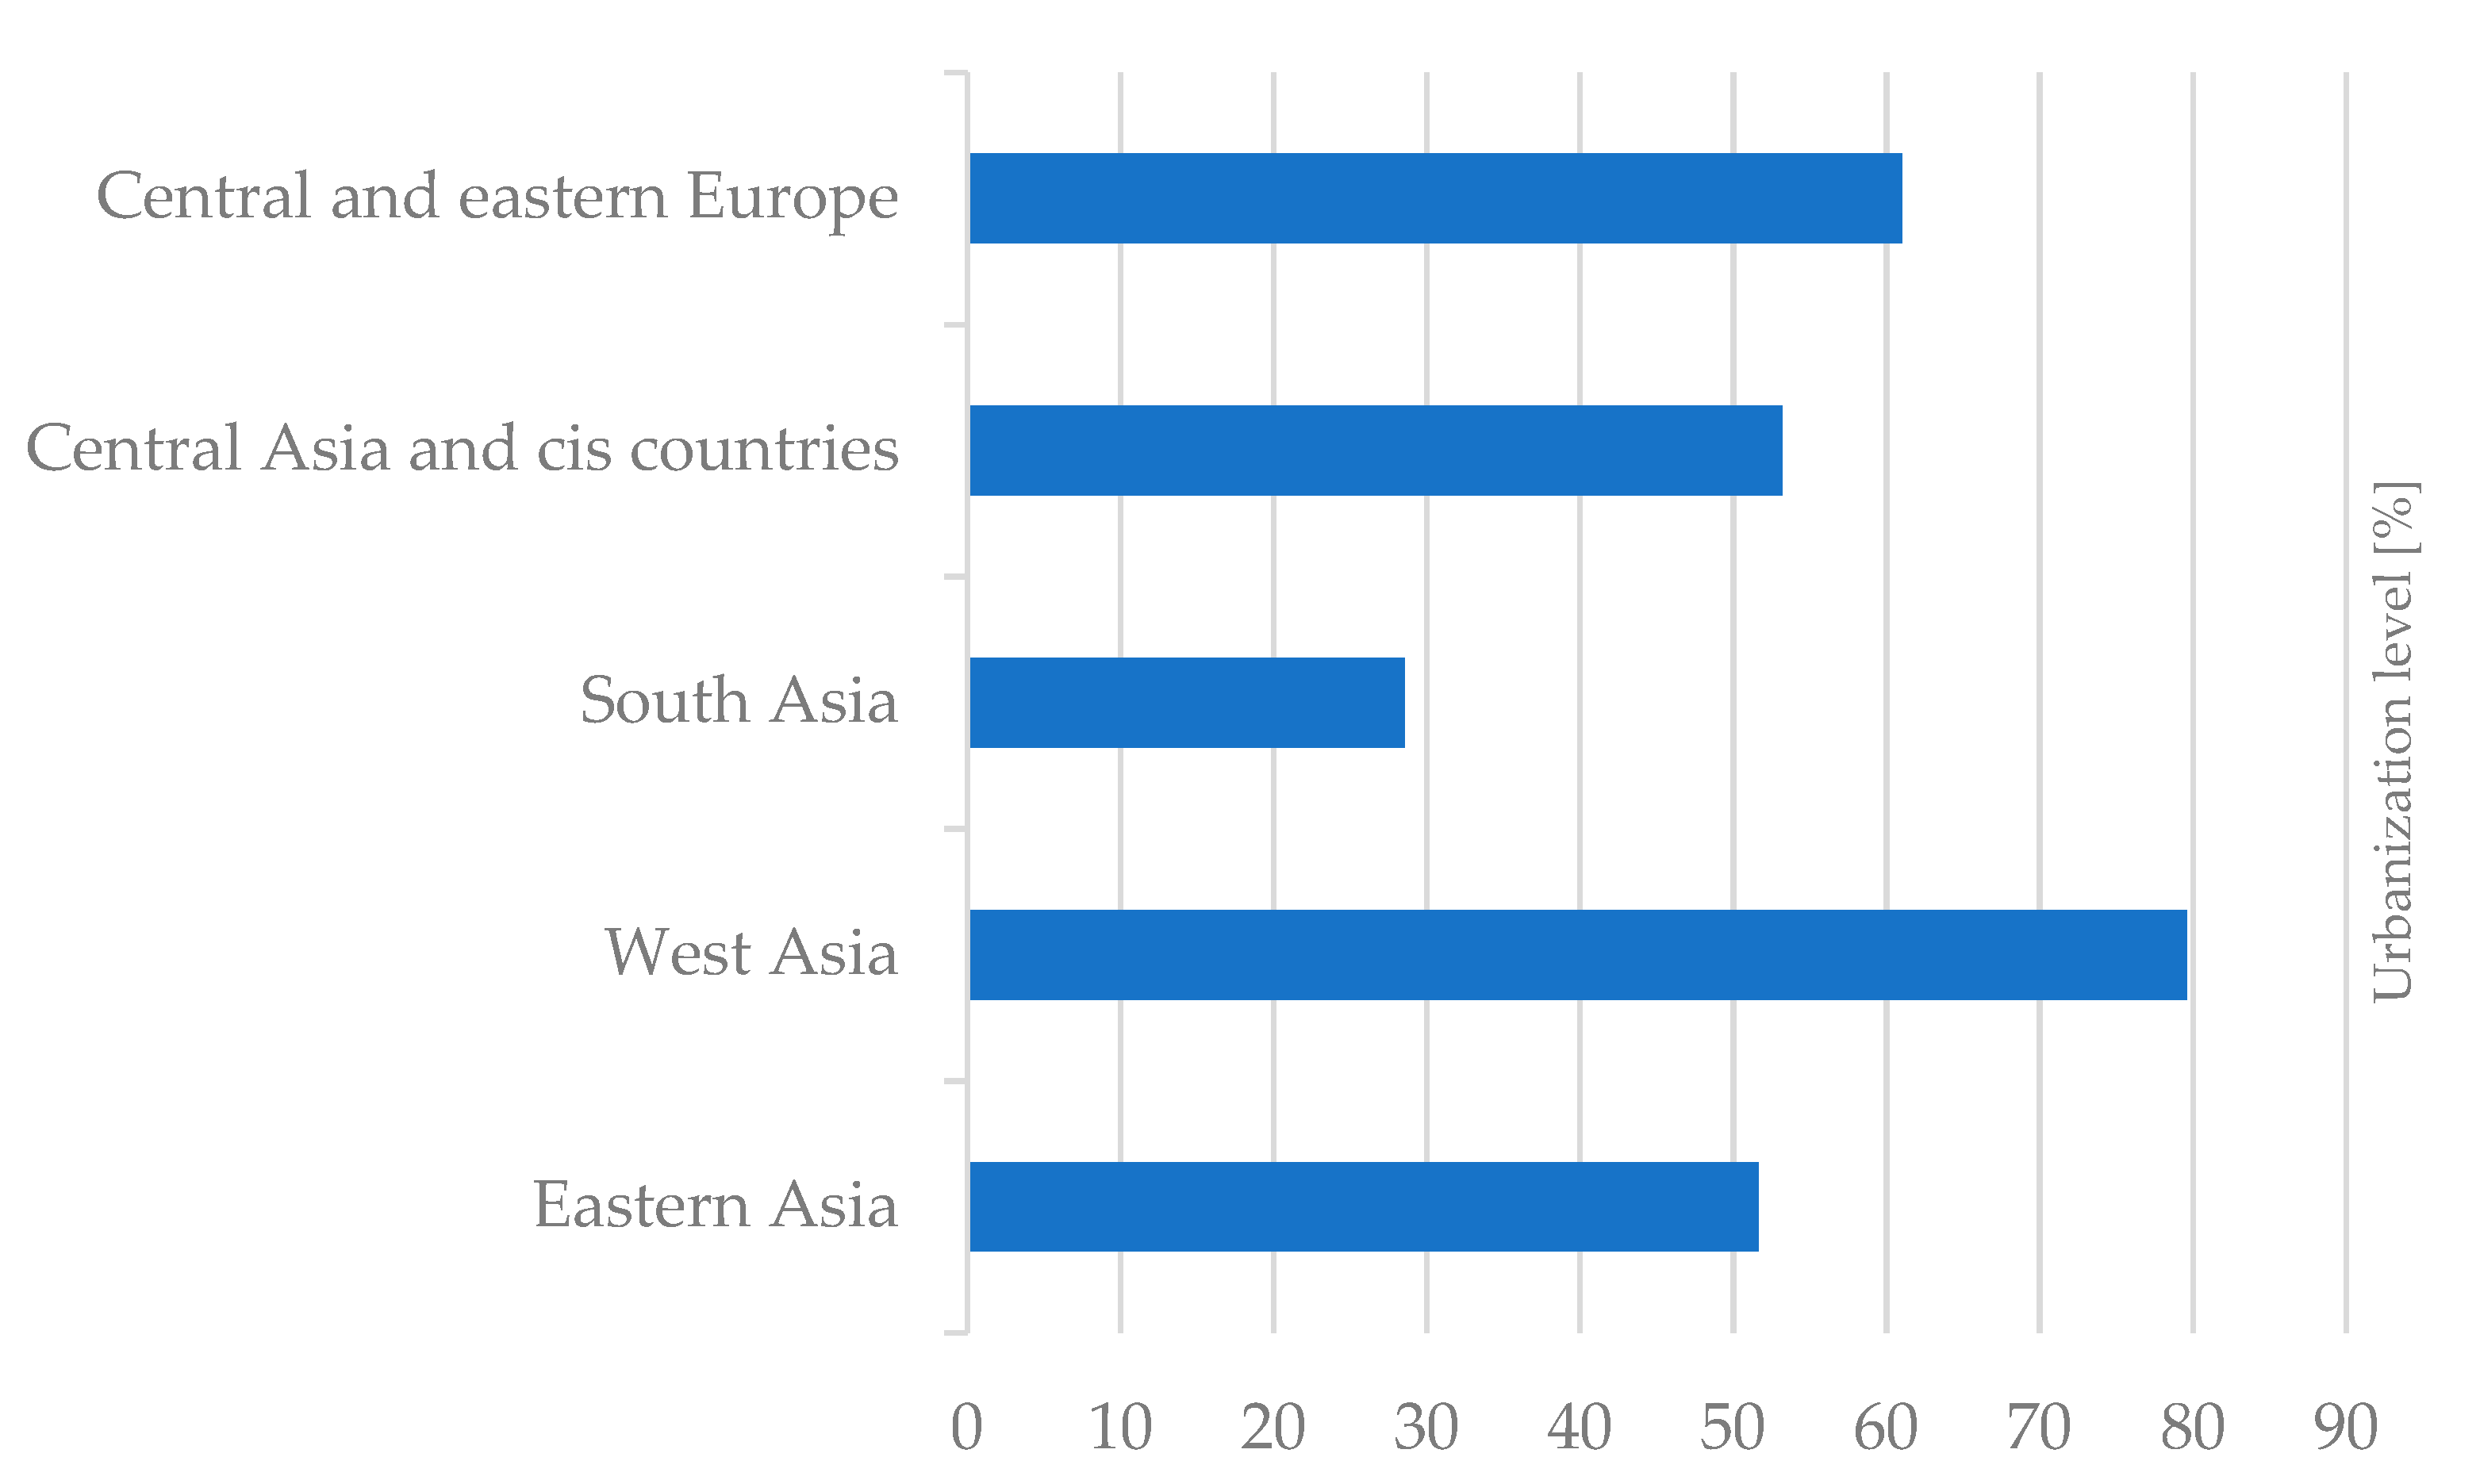
The change of urbanization level has a great influence on the carbon emissions of the transportation industry in the countries in the BRI. According to the analysis results in
Figure 4, by 2015, the average urbanization rate of the countries in the BRI is 59.13%, among which half of the countries are lower than 50%, and one-third of the countries are lower than 35%, while in the same period, the urbanization level of major developed countries has reached over 80%. Most of the BRI countries are at the initial stage of urbanization, and the urbanization level will continue to increase, which will lead to the continuous increase of carbon emissions of the transportation industry in these countries.
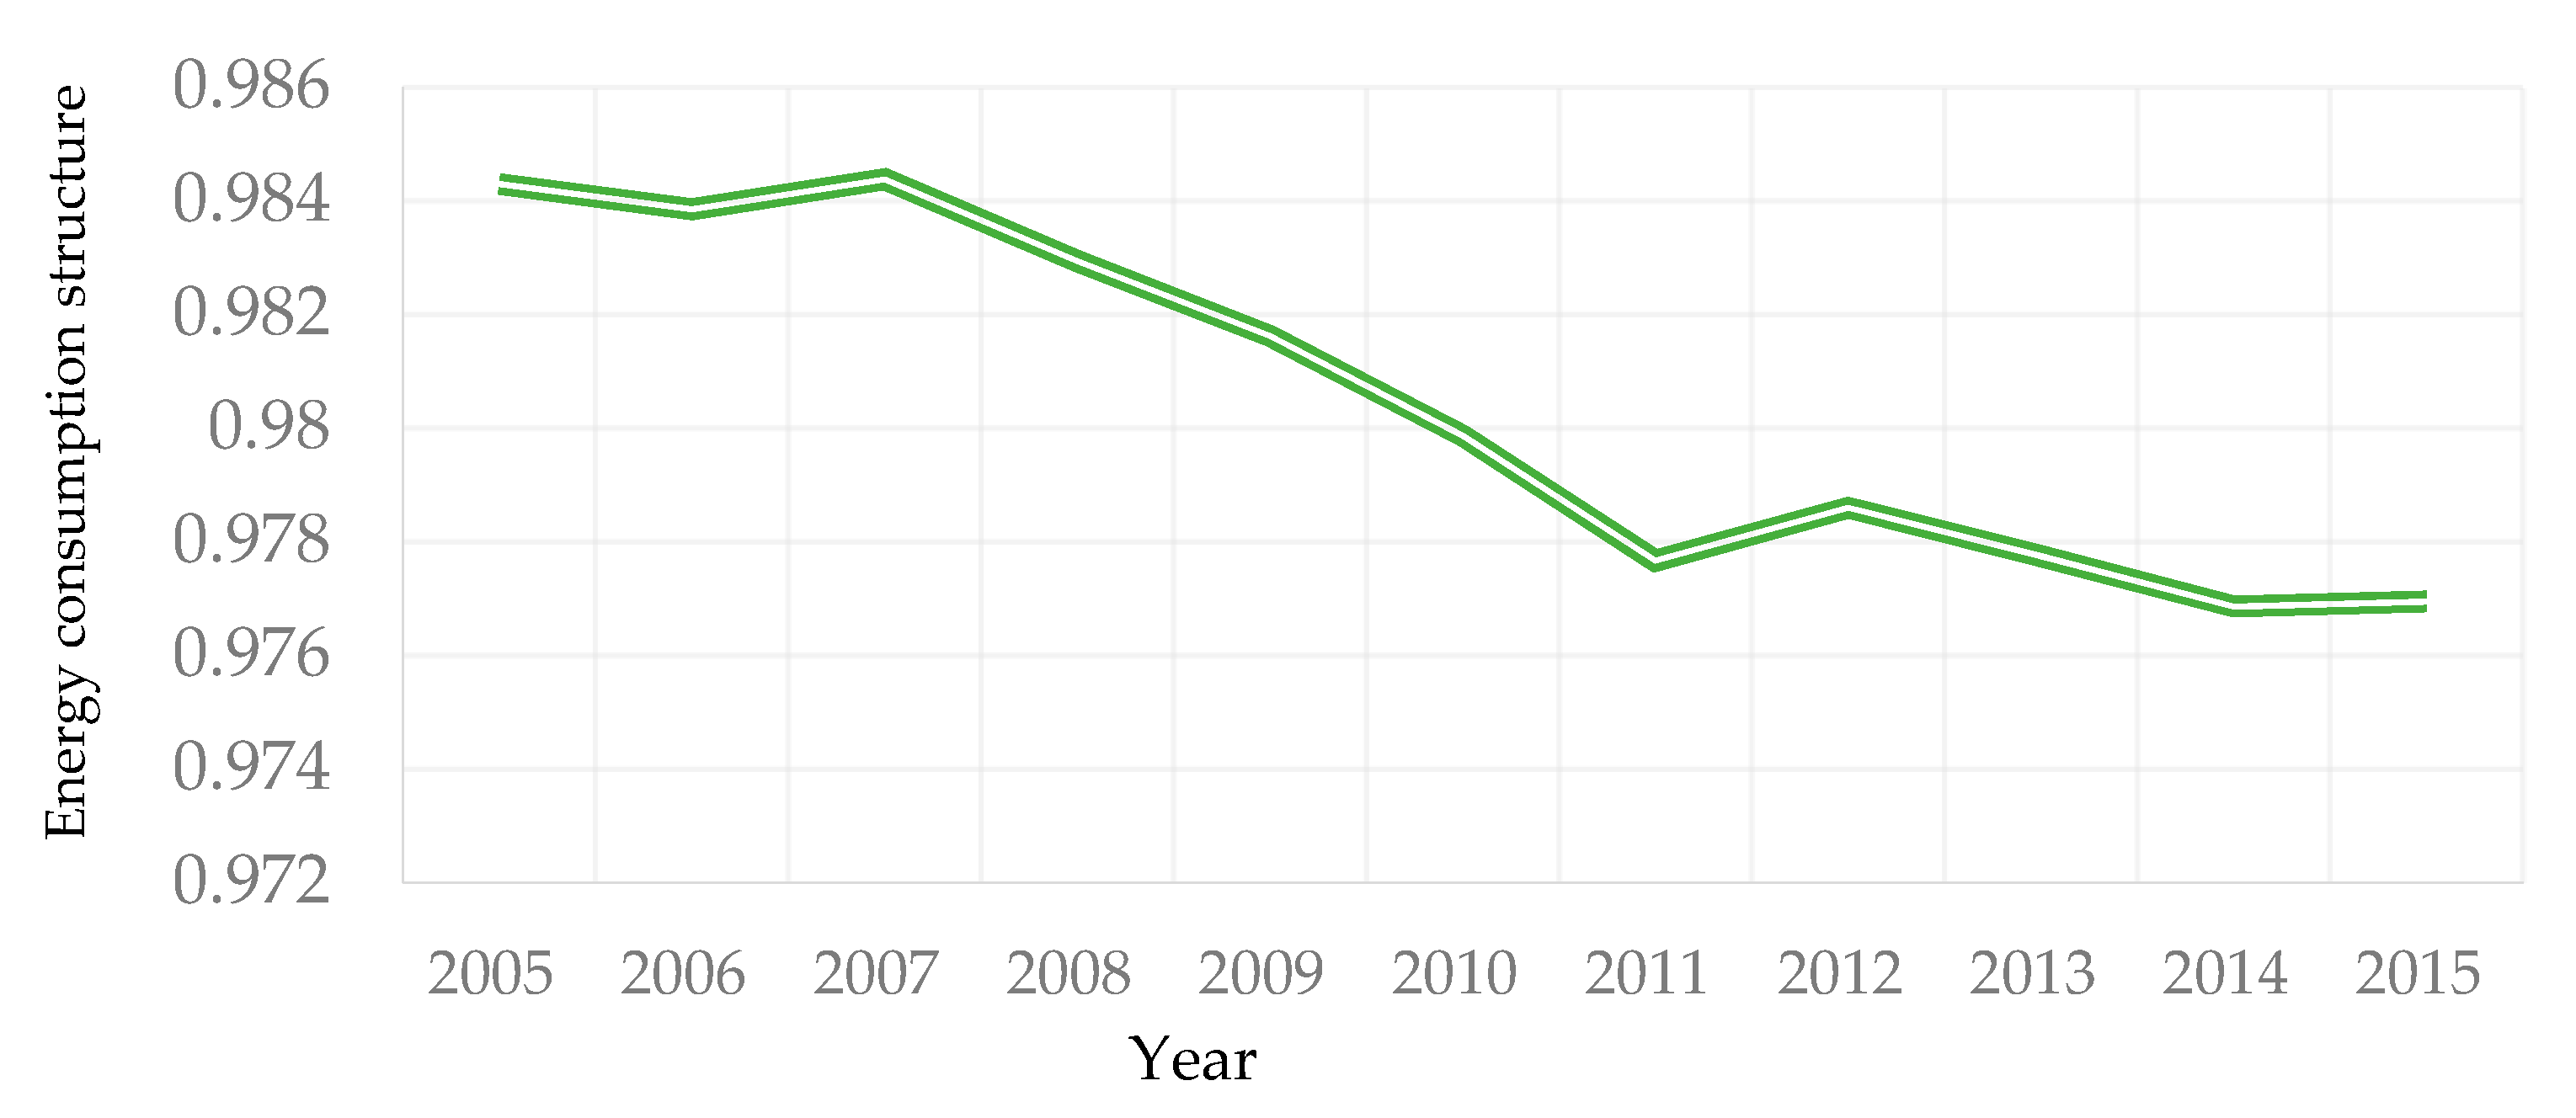
The energy consumption structure of the transportation industry is an important driving factor of transportation carbon emission in countries in the BRI. According to the analysis results in
Figure 6, by 2015, the fossil energy consumption of the transportation industry in countries in the BRI was as high as 97.69%, and the use of clean energy was very low. In some major developed countries, for example, in 2015 the United States, 93.98% of the total energy consumption is from the transportation industry, Germany (93.53%), and France (91.59%), so there still exists a large space for optimizing transportation energy consumption structure in the BRI countries, which makes the energy structure optimization of the transportation industry become an important driving factor of reducing carbon emissions.
It cannot be underestimated that per capita GDP holds a lot of weight for carbon emissions of the transportation industry in the BRI countries. BRI countries account for 62.2% of the world’s population and 30.9% of the world’s GDP. Per capita GDP is 1/2 of the world average and about 1/3 of that of the European Union. In recent years, per capita GDP of 47 countries in the BRI has shown an upward trend, and the growth of per capita GDP has become an important factor driving the growth of carbon emissions.
Improving the technical level has an obviously inhibitory effect on the carbon emissions of the transportation industry in the BRI countries. From the development trend in recent years, only individual countries such as Vietnam, Israel, and Kazakhstan, with high-tech exports accounting for the obvious rising trend in the proportion of manufactured goods exported, while most countries witnessed a volatile downward trend. Therefore, the BRI countries should increase the R&D of high-tech products, promoting the industry from low-end to high-end. Impulse optimization and upgrading of industrial structure transformation will make it become a significant driving factor of reducing carbon emissions.
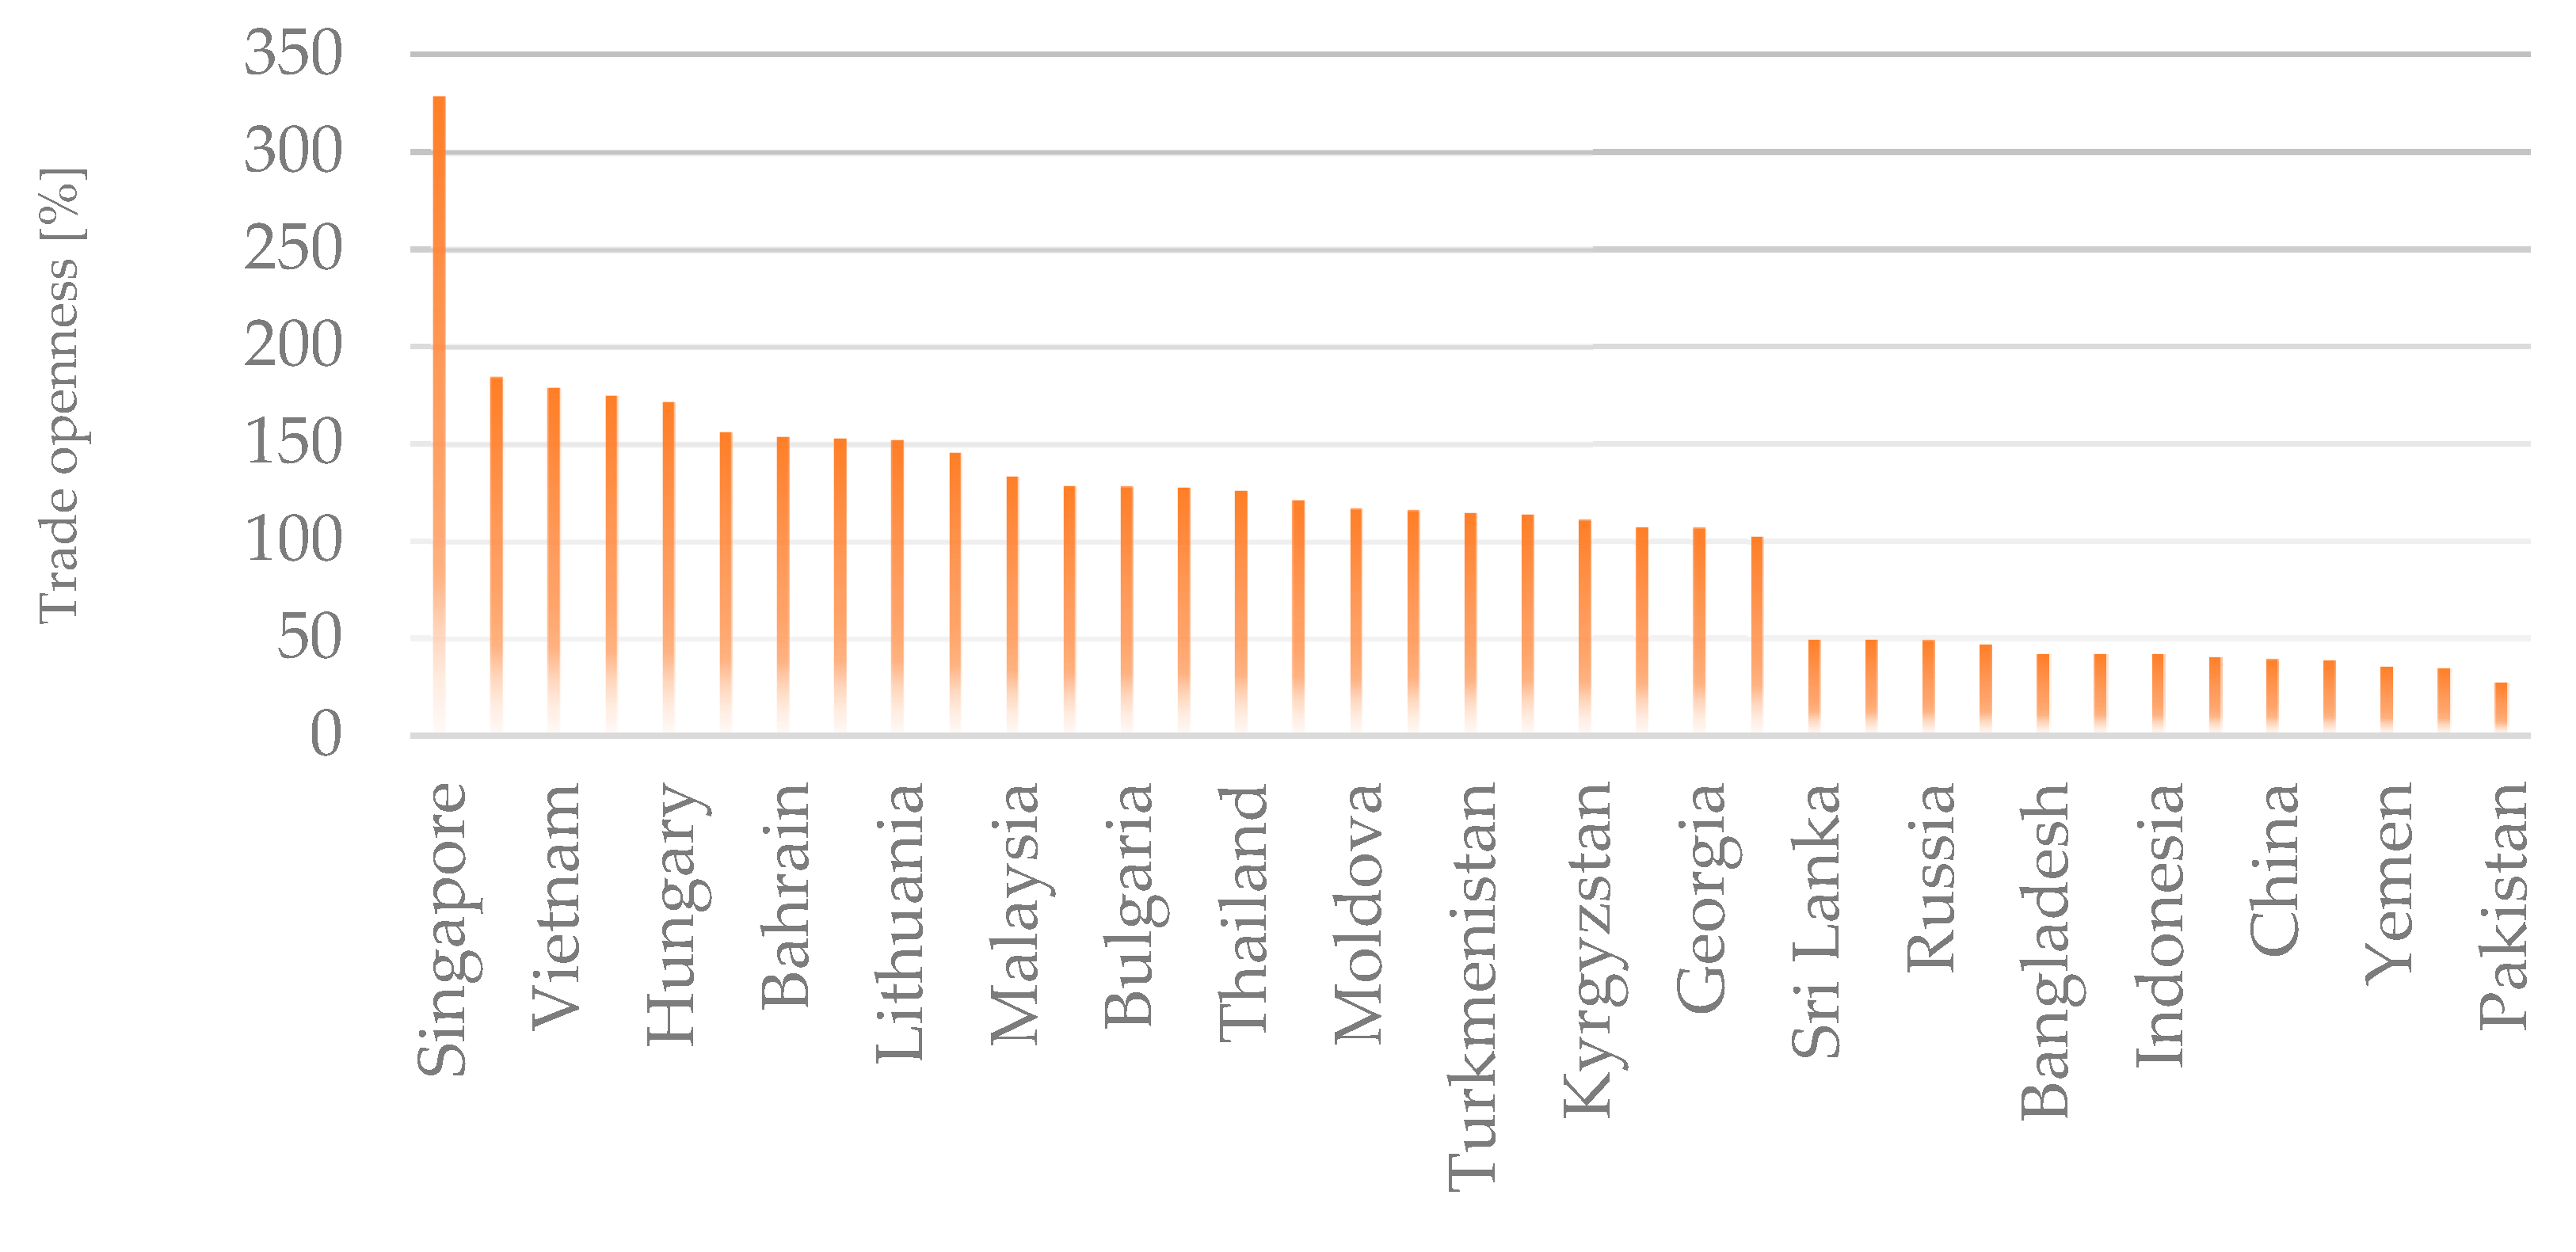
The improvement of trade openness has an inhibitory effect on the carbon emissions of the transportation industry in the BRI countries. According to the data collected, the overall level of trade openness of the BRI countries is greatly affected by the world political and economic situation. In 2008, with the acceleration of the globalization of the world economy, the trade openness level of the BRI countries witnessed a steady rise, however, because of the influence of the U.S. financial crisis, their trade openness plunged by 13.28% in 2009. From 2009 to 2012, the world economic situation improved, and trade openness level increased year by year, while from 2013 to 2015, trade openness level showed a downward trend again for the rise of trade protectionism, but the globalization trend is irreversible, and improving trade openness will still be an important factor to curb carbon emissions.
The individual effects intercept items of the model are shown in
Table 8. The meaning of the term “intercept” is the level of carbon emission when all explanatory variables are equal to zero.
This reflects the influence of the neglected variables representing the difference of cross section in the model. According to the cross-sectional data in
Table 8, the value of 29 countries including China, India, Nepal, Bangladesh, Indonesia, Thailand, and Vietnam, is positive: it indicates that the neglected variables in the model have a greater impact on the carbon emission of the transportation industry in these countries. While 28 countries, including Singapore, Israel, Turkey, and Brunei, have negative values, it indicates that the neglected variables in the model have little impact on the carbon emission of the transportation industry in these countries.
5. Conclusions and Suggestions
5.1. Conclusions
Based on the 2005–2015 data of 57 BRI countries, this paper, using panel data model, coming to the following main conclusions: there exists a long-term and stable relationship among transport carbon emissions, the level of urbanization, transportation energy consumption structure, per capita GDP, technical level, and trade openness in the BRI countries. For every 1% increase in per capita GDP, 0.0011% of the transportation industry carbon emissions are added. For every 1% increase in urbanization level, the carbon emissions of the transportation industry will increase by 7.728%. For every 1% increase in the proportion of fossil energy consumption in the transportation industry, the carbon emissions of which will increase by 1.1901%. For every 1% increase in technology level, carbon emissions of the transportation industry will be reduced by 0.2182%. Trade openness was increased by 1%, and carbon emissions from transportation industry were reduced by 0.0481%.
Therefore, for West Asia and Eastern Europe with their high urbanization level and per capita GDP, the main way to reduce the carbon emissions of the transportation industry is to enrich the energy consumption structure, such as the use of biomass energy, natural gas, solar energy, and other clean energy, and gradually reduce the proportion of fossil energy in the energy consumption of the transportation industry. For South Asia, with its low urbanization level, special attention should be paid to the negative impact of urban development on traffic carbon emissions in the process of urbanization; not only should the energy consumption structure be optimized, but also the excessive growth of carbon emissions be reasonably controlled, which is caused by fossil energy consumption in the process of urbanization. East Asia and Southeast Asia, which have developed rapidly, should further promote the reduction of carbon emissions by improving the level of foreign trade. On the whole, countries in the BRI are different in resource endowment, economic, and technological level. In the process of BRI development, increasing the proportion of clean energy consumption, expanding trade openness, and improving the level of science and technology will curb the carbon emissions of the BRI transportation industry.
5.2. Policy Suggestions
First, traffic carbon emissions caused by urbanization should be properly controlled. From the research conclusion, urbanization has a great impact on carbon emissions. For countries in the BRI, urbanization is an irreversible process, so reasonable measures should be taken to control the increase of carbon emissions caused by the increase of urbanization level. The strategies include vigorously developing public transport, establishing a low-carbon transport mode dominated by public transport, and building a comprehensive public transport system with rail transit as the skeleton, conventional transport as the meridian, taxi as the supplement, and slow traffic as the extension, guiding citizens to choose “walk + public transport” and “bike + public transport” travel modes, reducing the use frequency of cars.
Second, the share of fossil energy consumption in the transportation industry should be reduced. At present, the average proportion of fossil energy consumption in the transportation industry of the BRI countries is about 97%. In the past 10 years, the proportion of fossil energy in the transportation industry has not decreased much, the transportation industry need optimizing energy consumption structure, reducing carbon emissions. Therefore, BRI countries need to promote new energy vehicles such as hybrid, pure electric, and fuel cells, to improve the electrification rate of railway construction, to encourage the use of green ships based on new technologies and new energy sources, to actively promote the use of aviation biofuels.
Third, trade openness should be increased. Trade protectionism is on the rise in the modern international community. From the perspective of reducing carbon emissions of the transportation industry, trade openness needs to be enhanced. Countries in the BRI should further reduce tariffs and non-tariff barriers through bilateral or multilateral economic cooperation mechanisms, and reduce market access barriers to commodity flows, carry out cooperation in customs clearance, and actively promote the integration of regions and customs clearance. Making full use of modern information, network, and communication technologies should improve the efficiency of customs clearance from the perspectives of optimizing the process of customs clearance and improving the efficiency of key links.
Fourth, the technical level of the BRI countries should be improved. In today’s world, a new round of scientific and technological revolution and industrial transformation is looming, becoming a new driving force for world economic growth. Driving the optimization and upgrading of industrial structure with high-tech industry as the driving force and modern service industry and modern manufacturing industry should be the direction of development.


