Comparative Porosity and Pore Structure Assessment in Shales: Measurement Techniques, Influencing Factors and Implications for Reservoir Characterization


Abstract
1. Introduction
2. Materials and Methods
2.1. Shale Samples
2.2. Nuclear Magnetic Resonance (NMR)
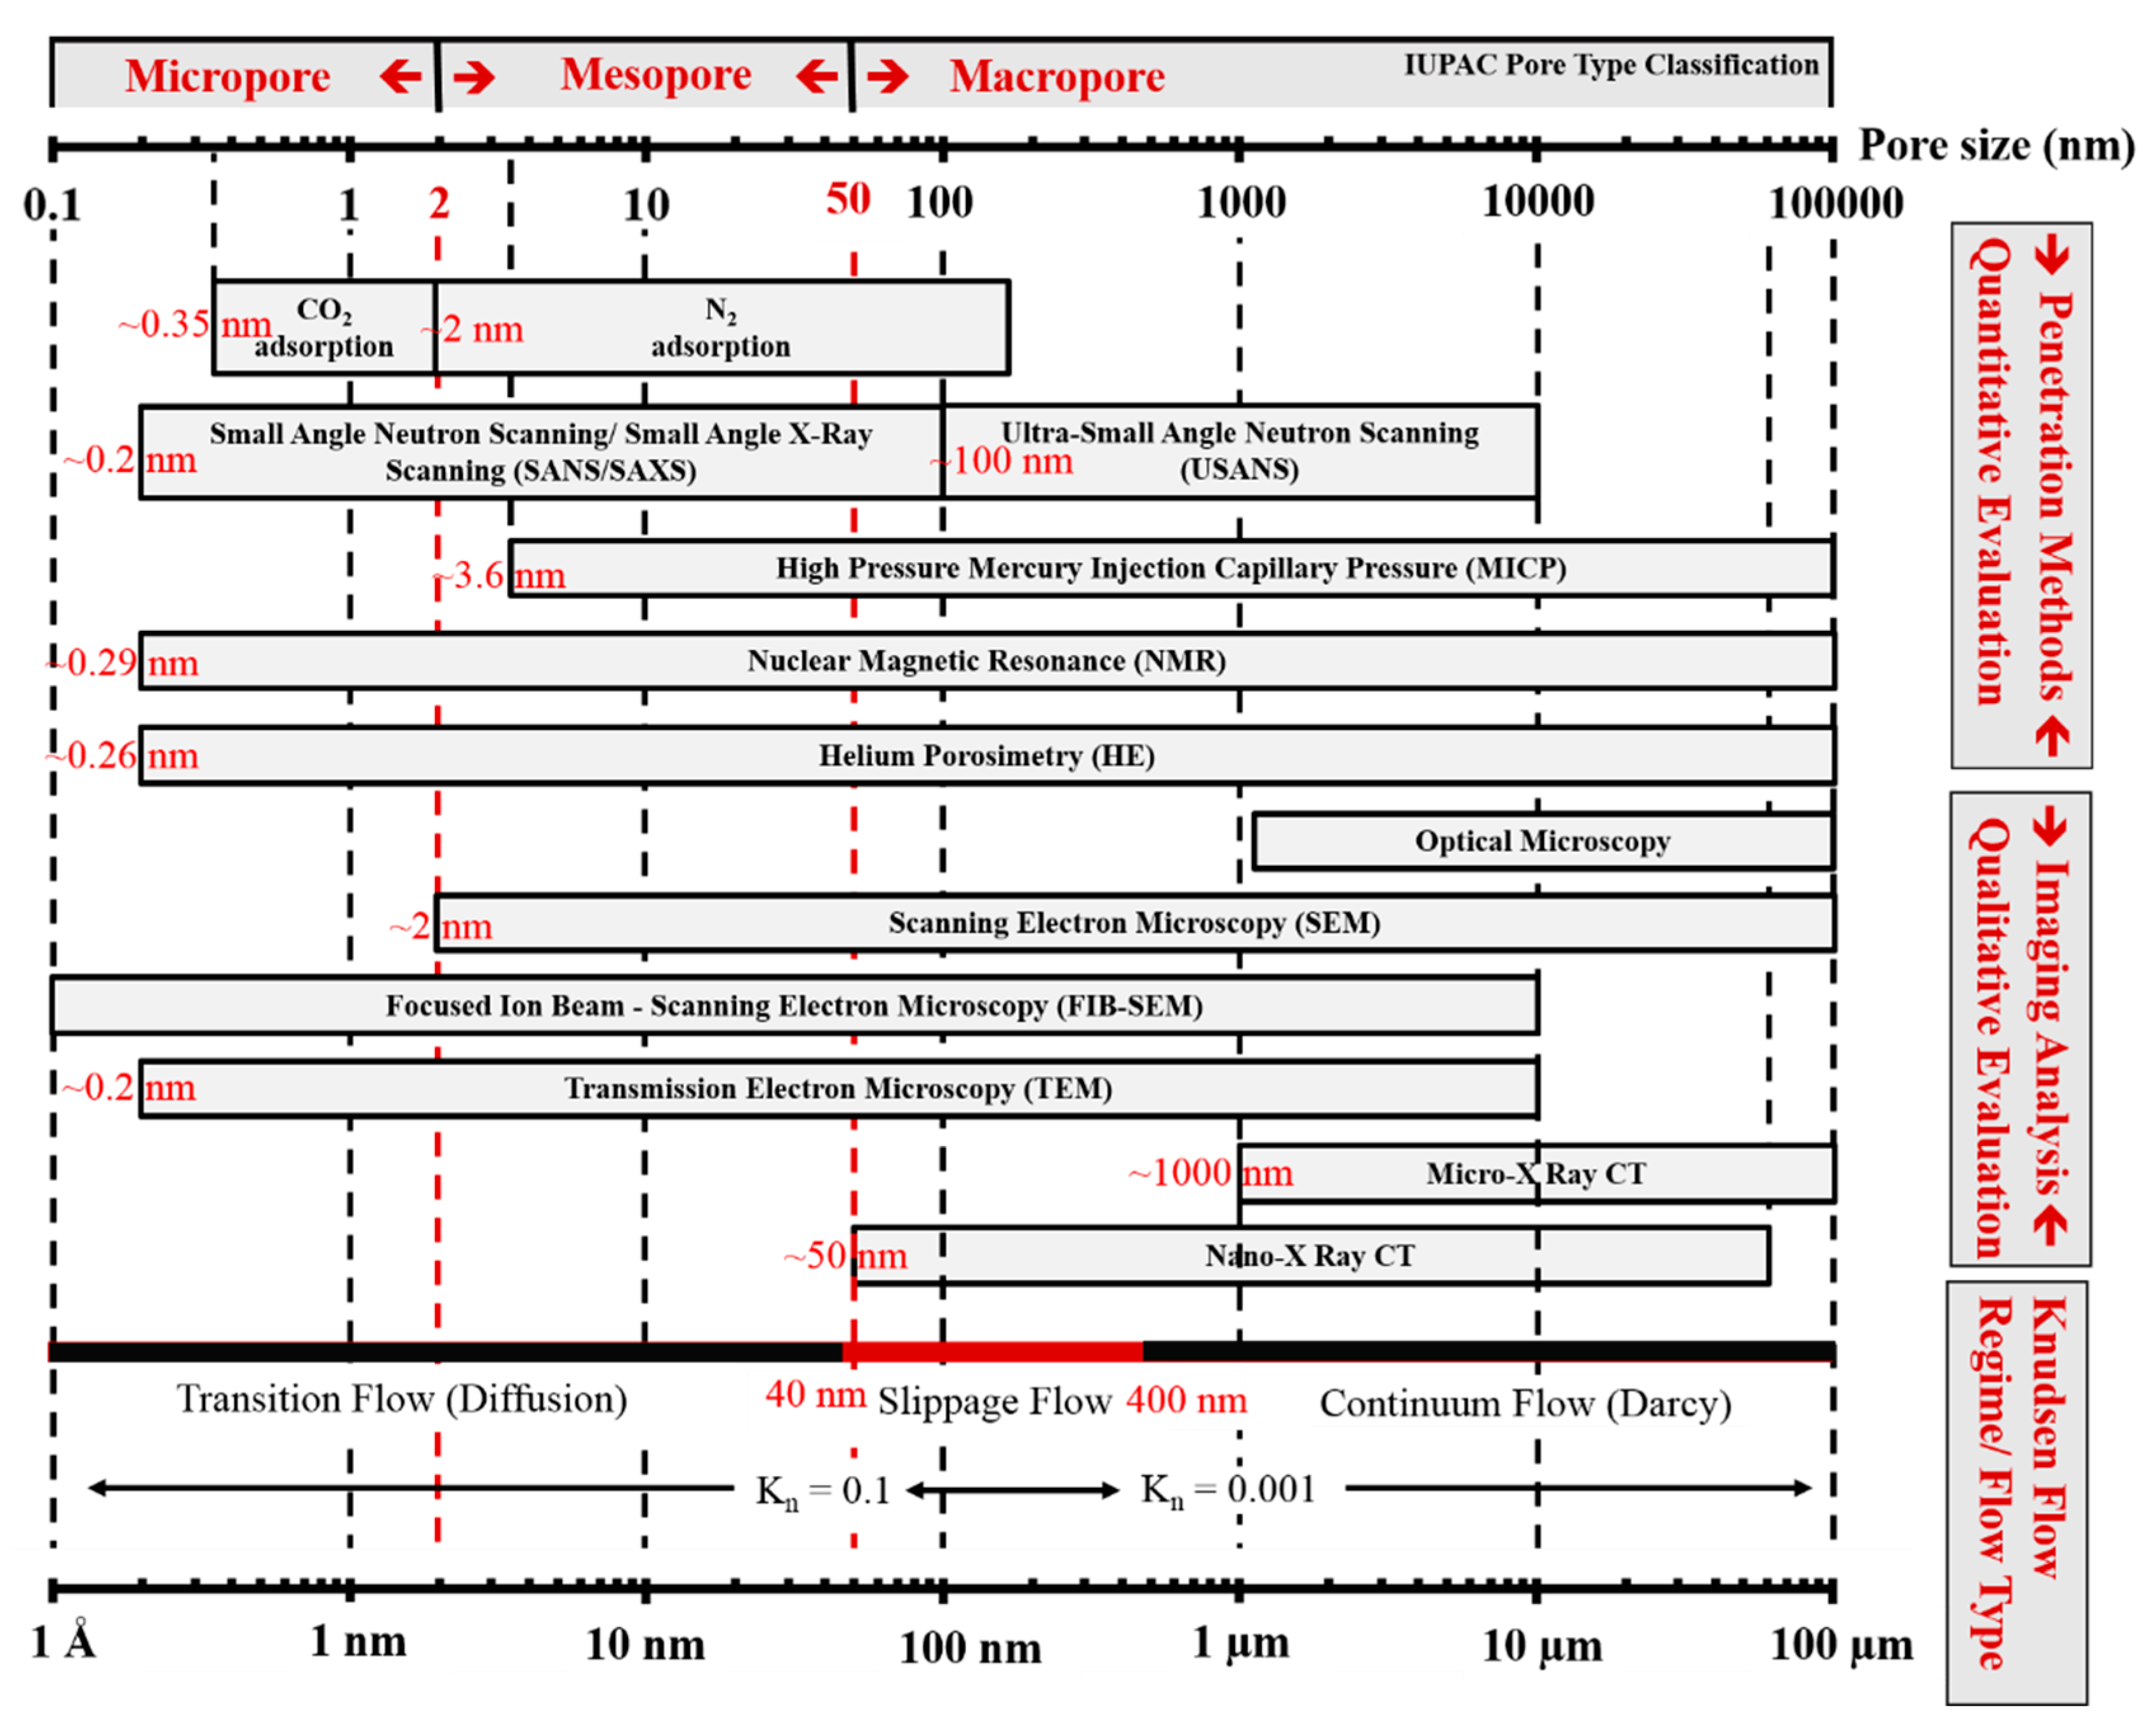
2.3. Low-Pressure Gas Adsorption (LP-GA)
2.4. Mercury Injection Capillary Pressure (MICP)
3. Results
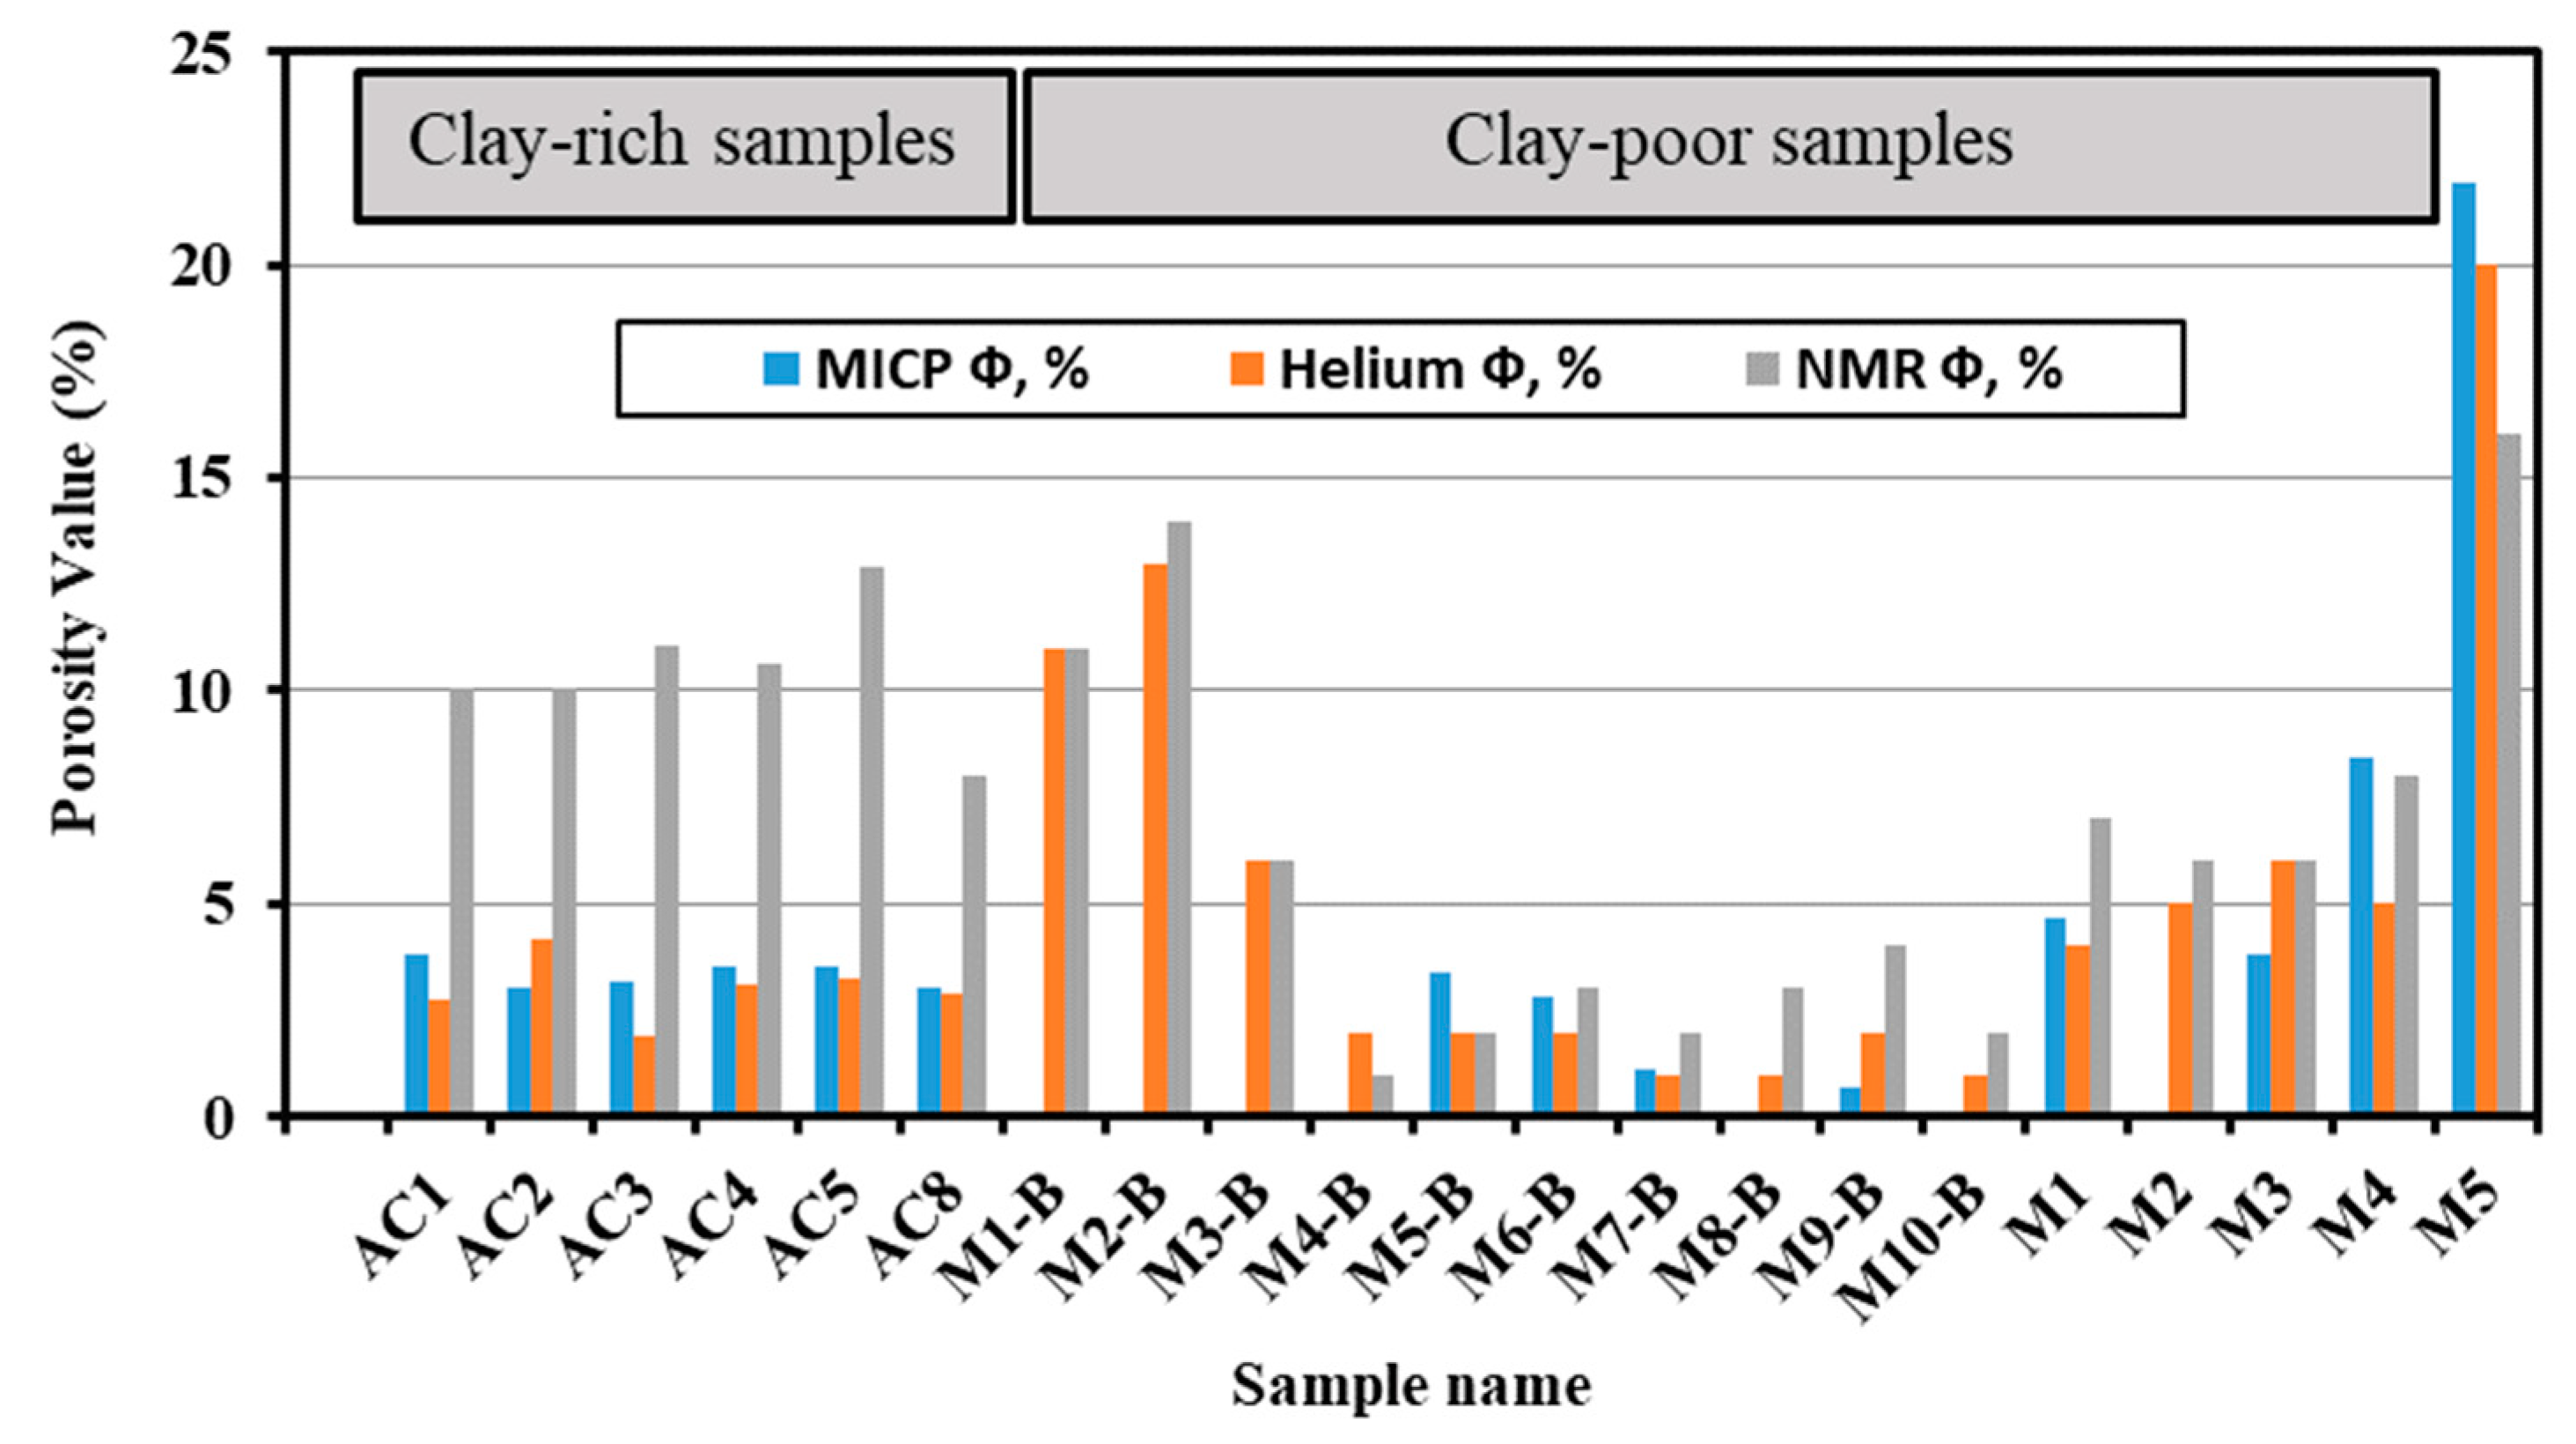
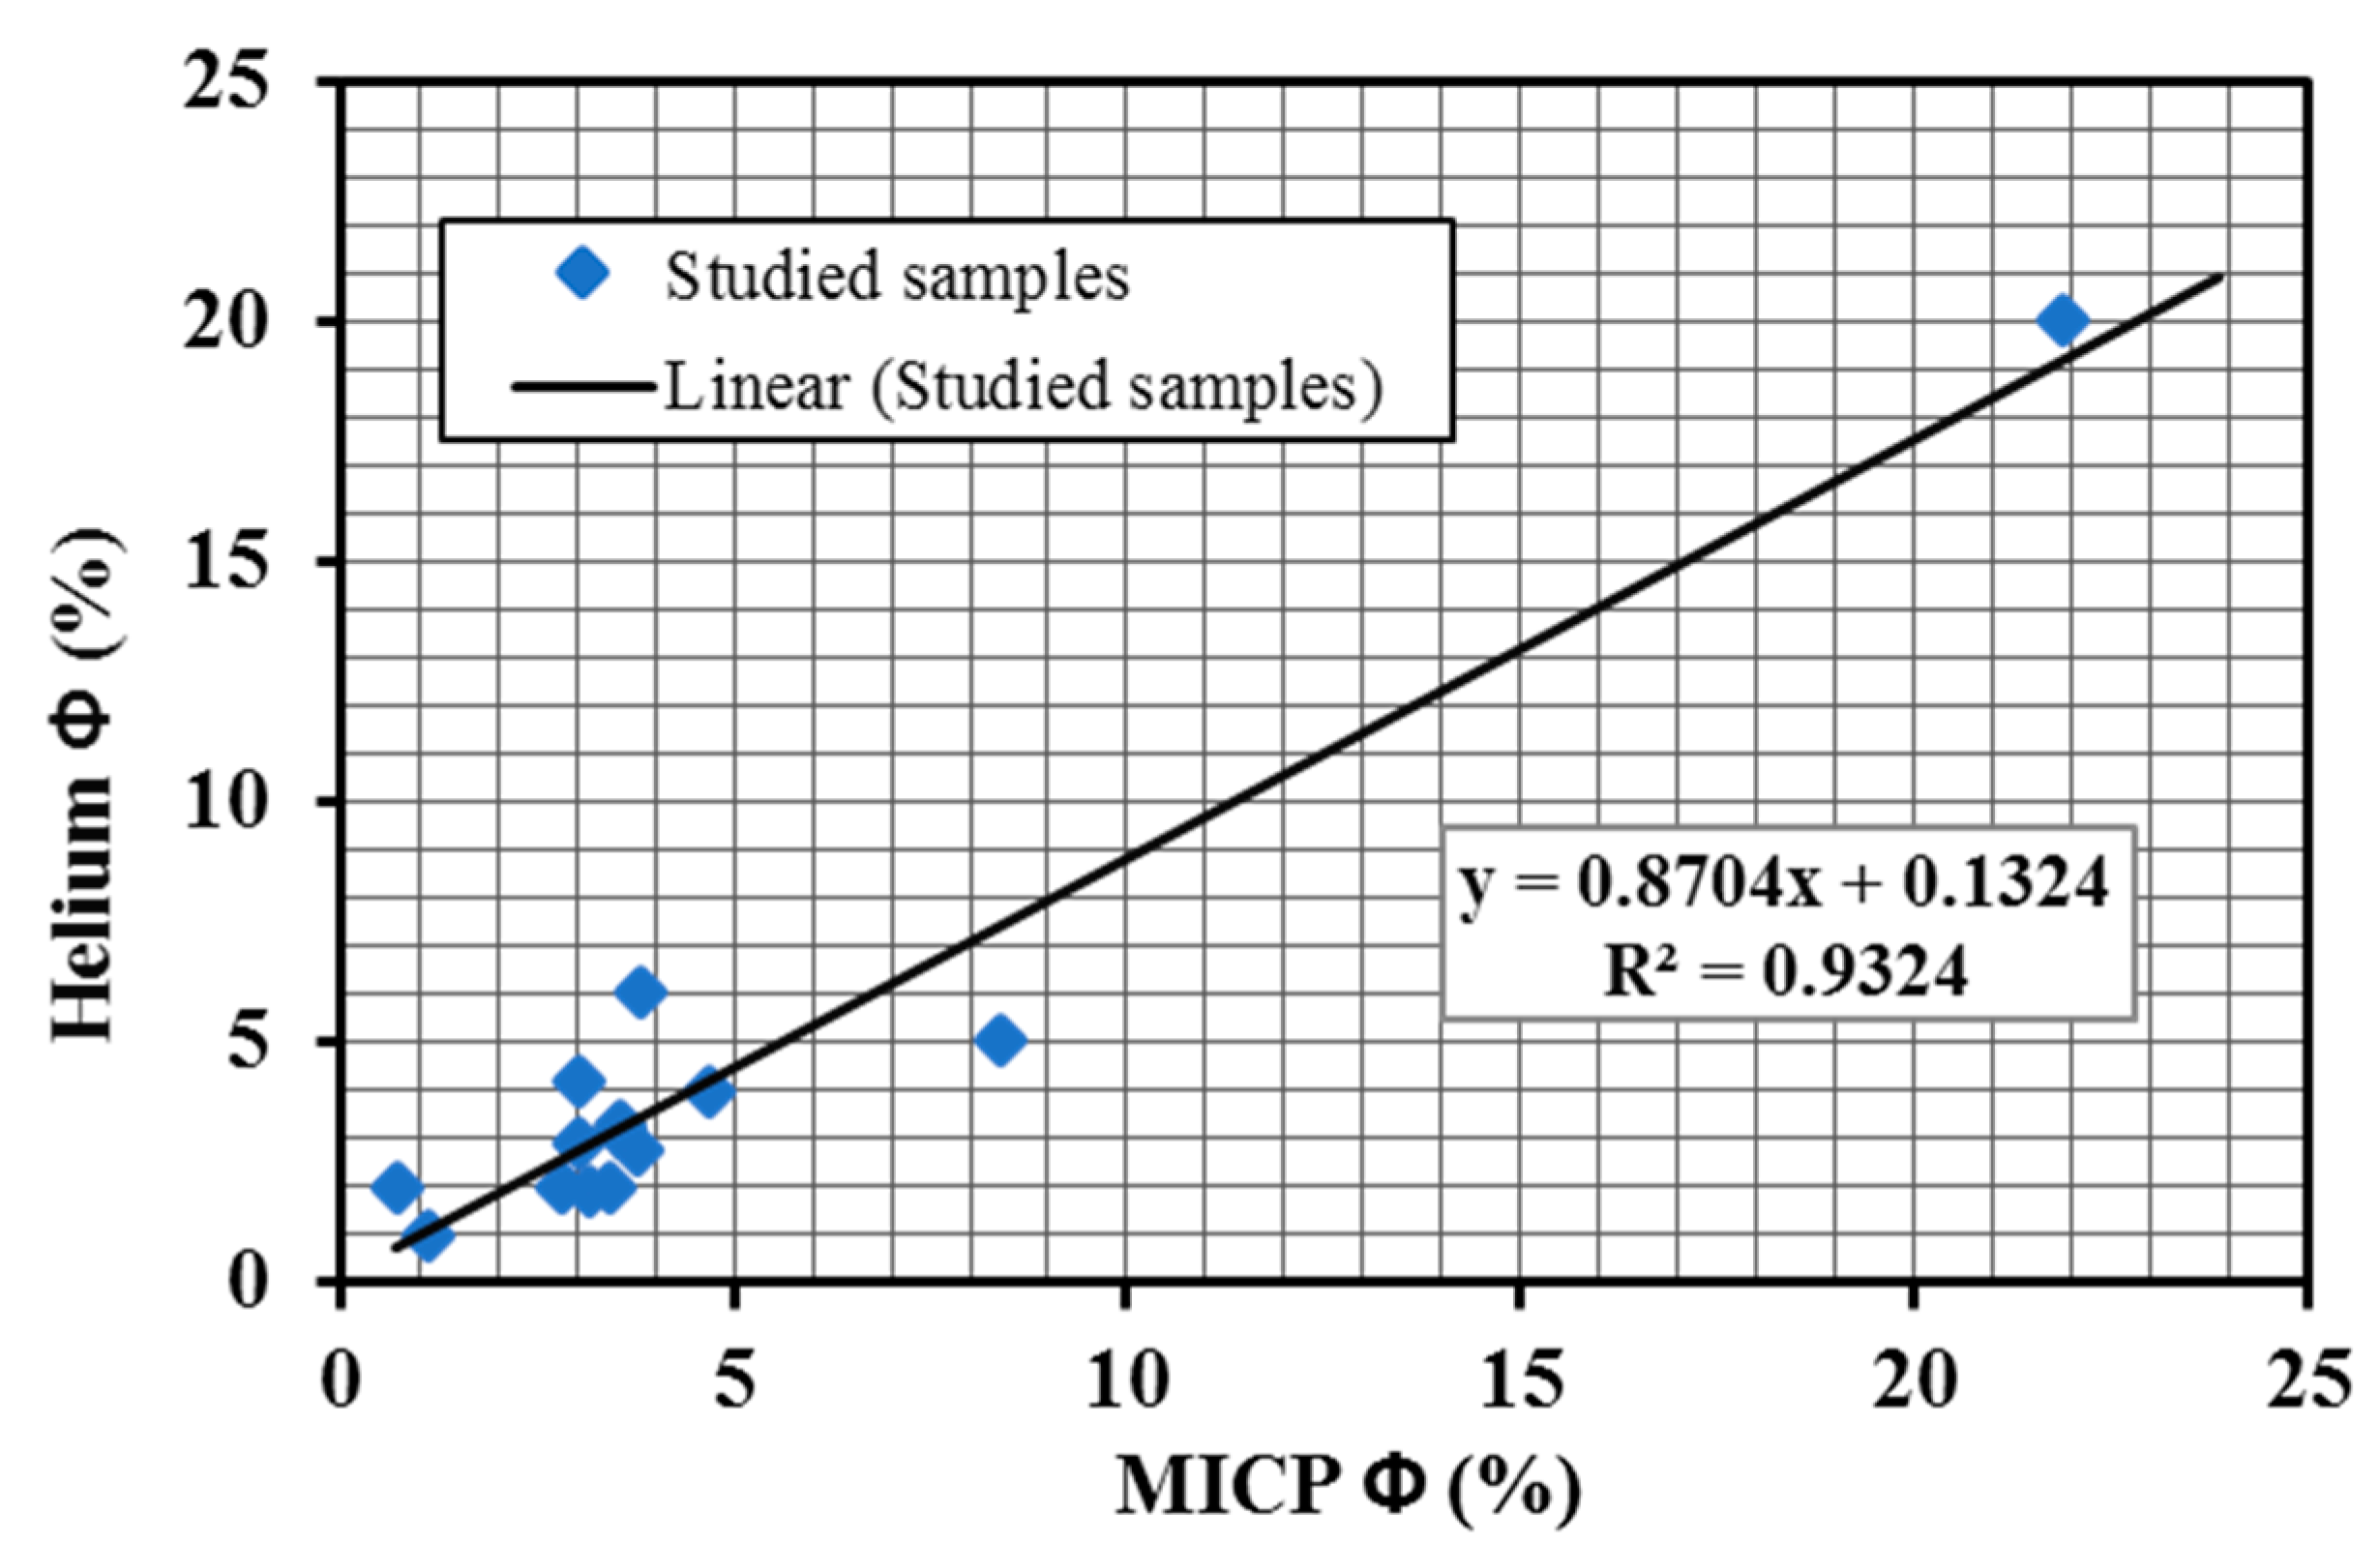
3.1. Porosity
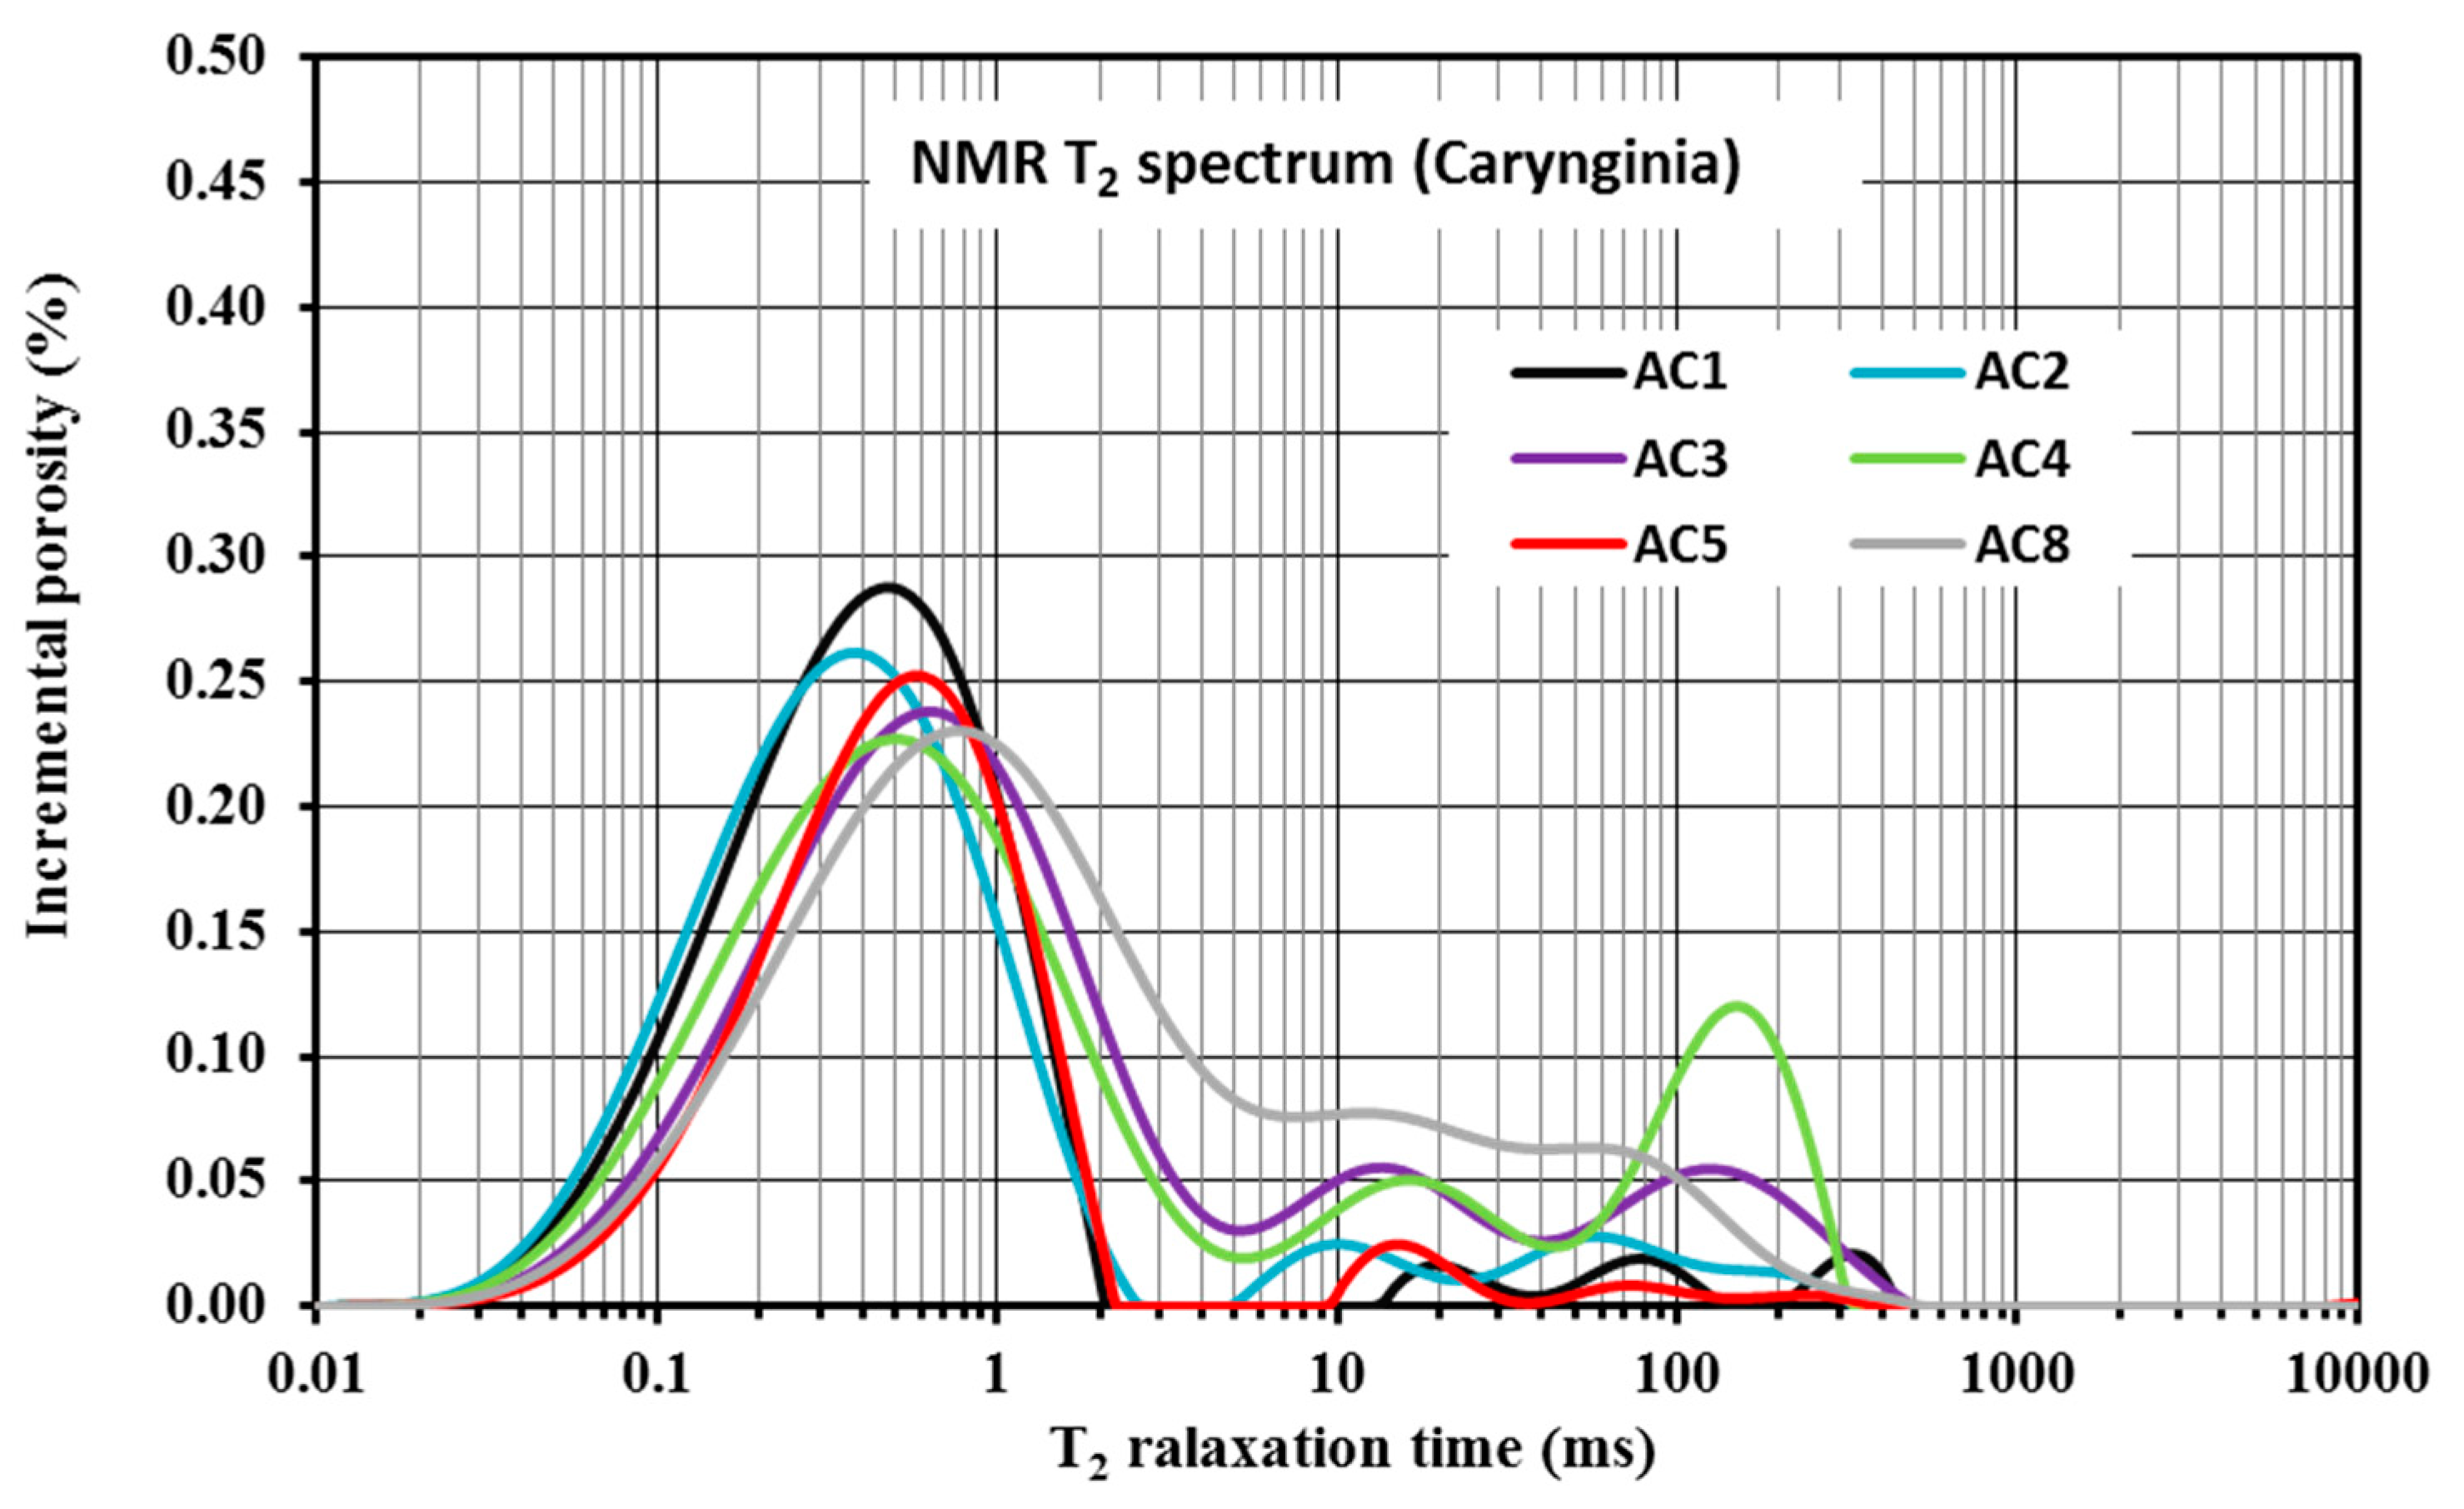
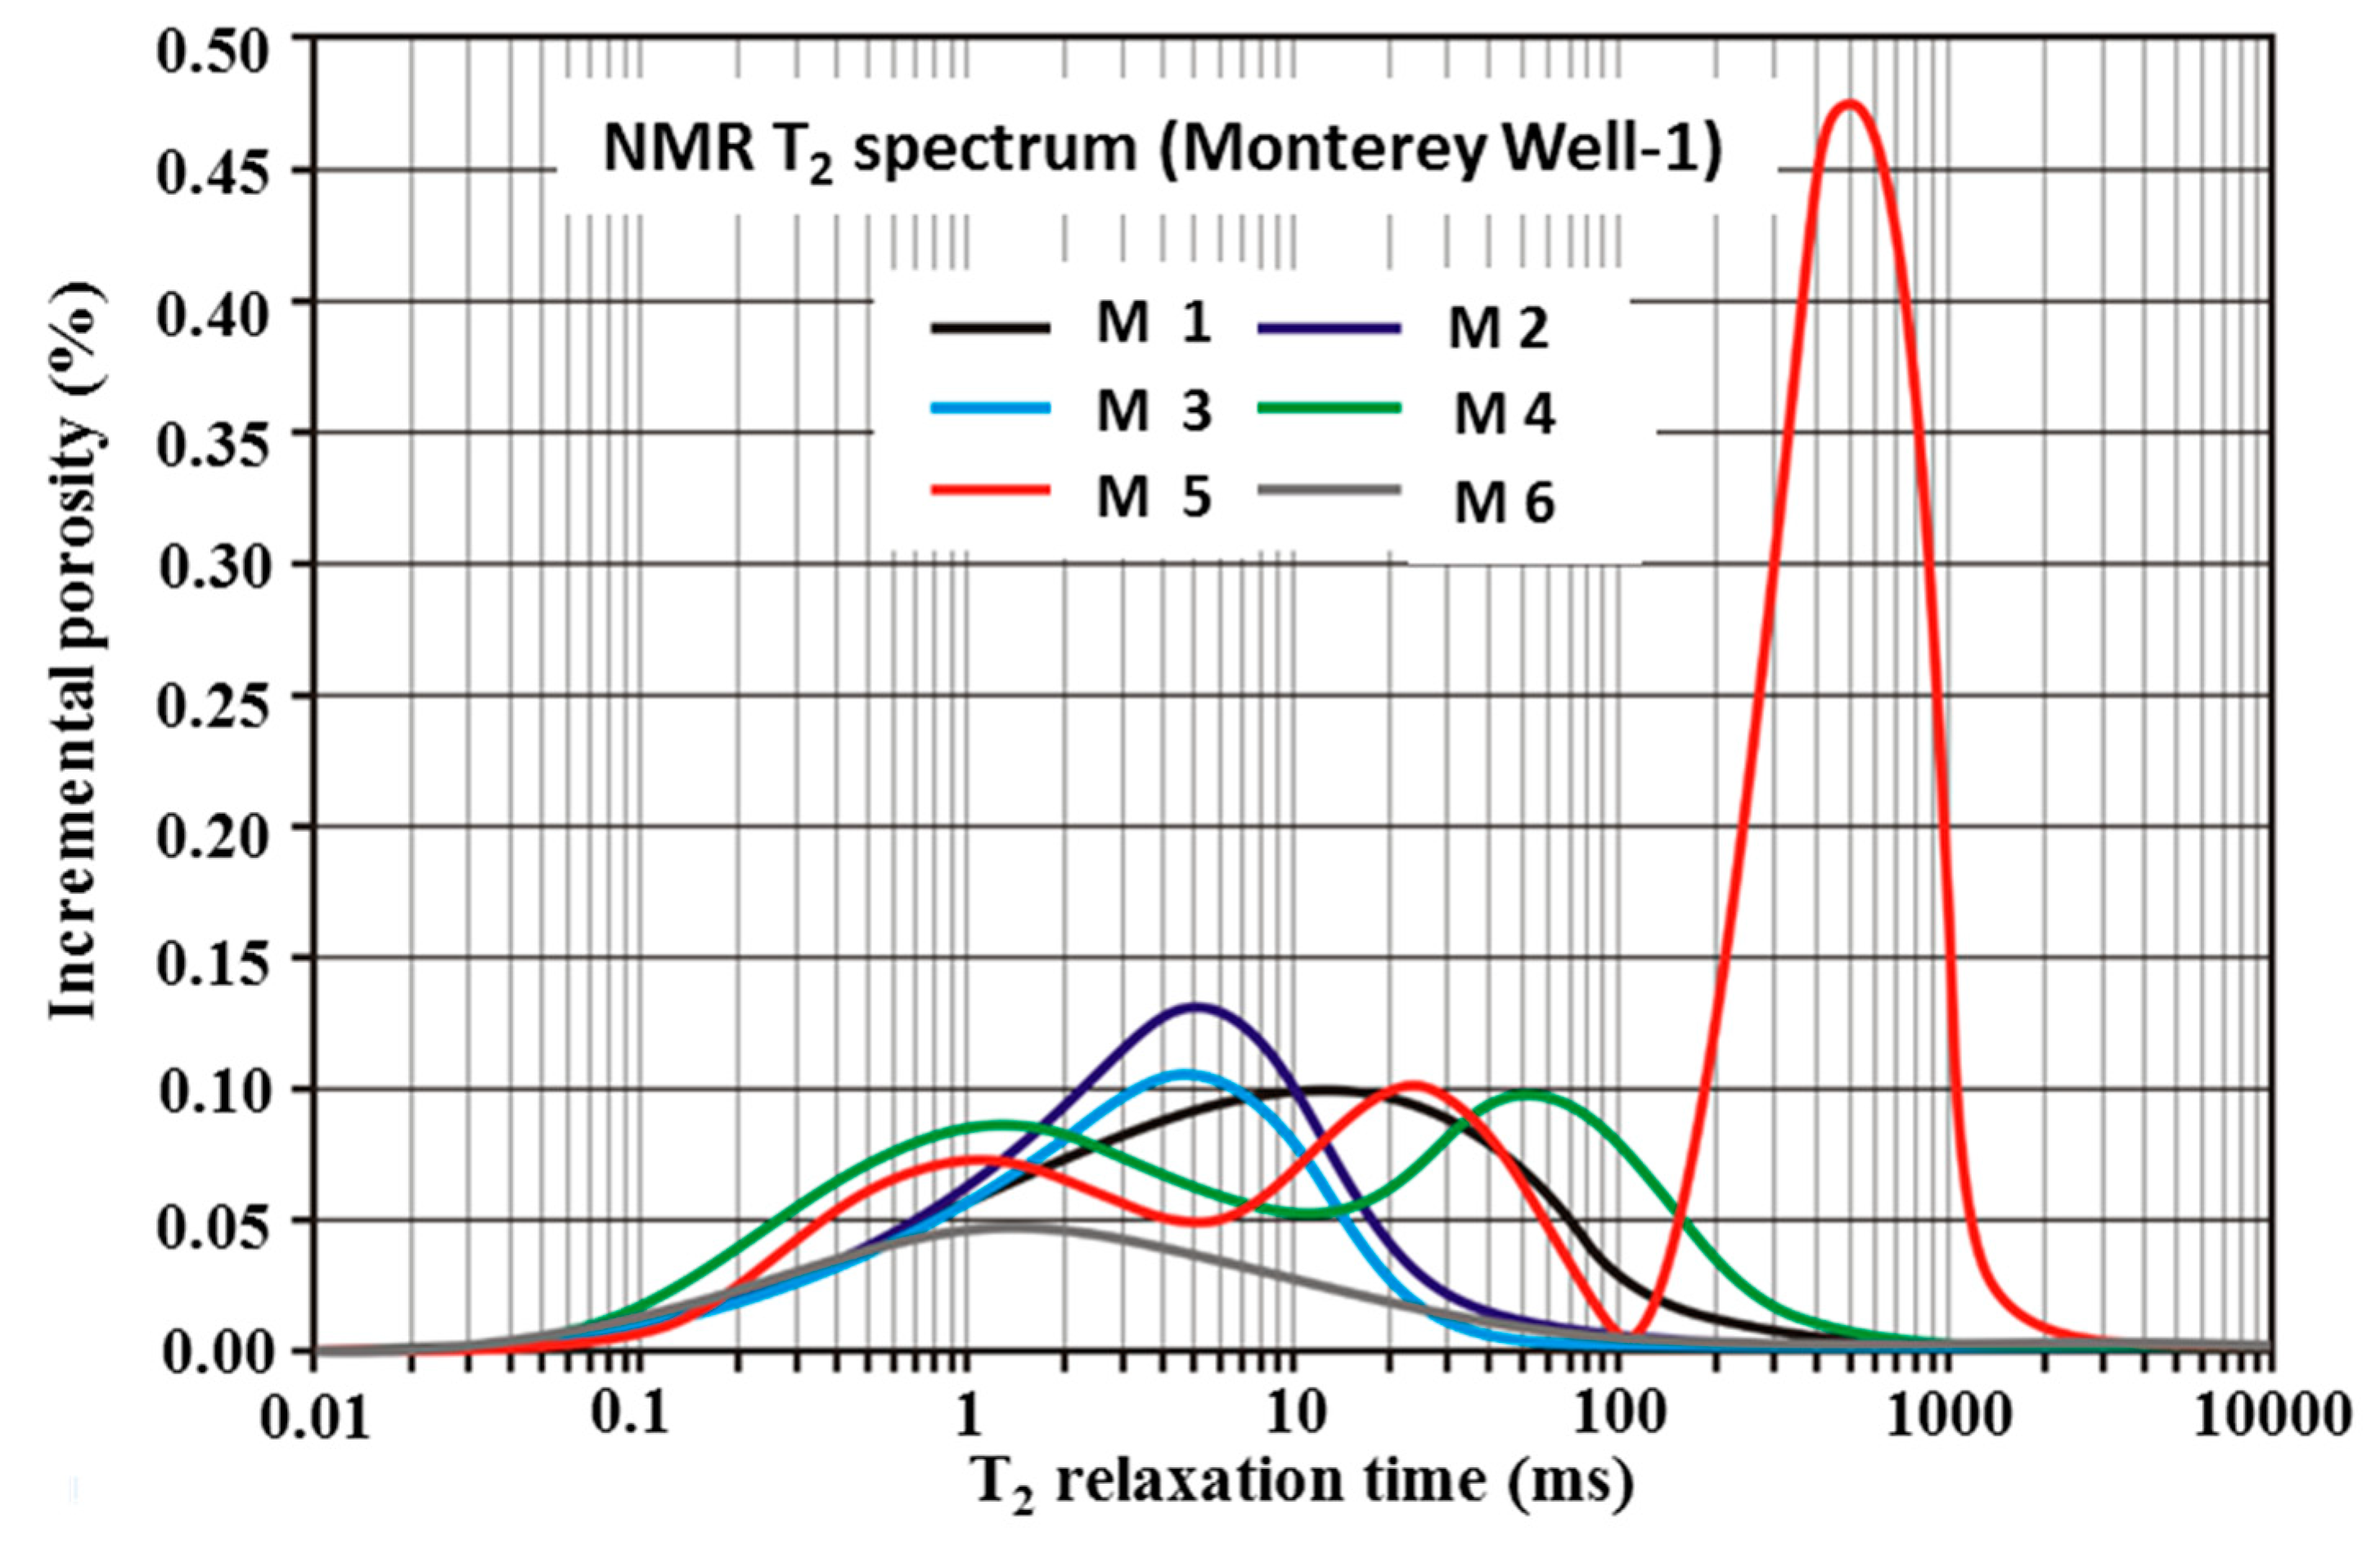
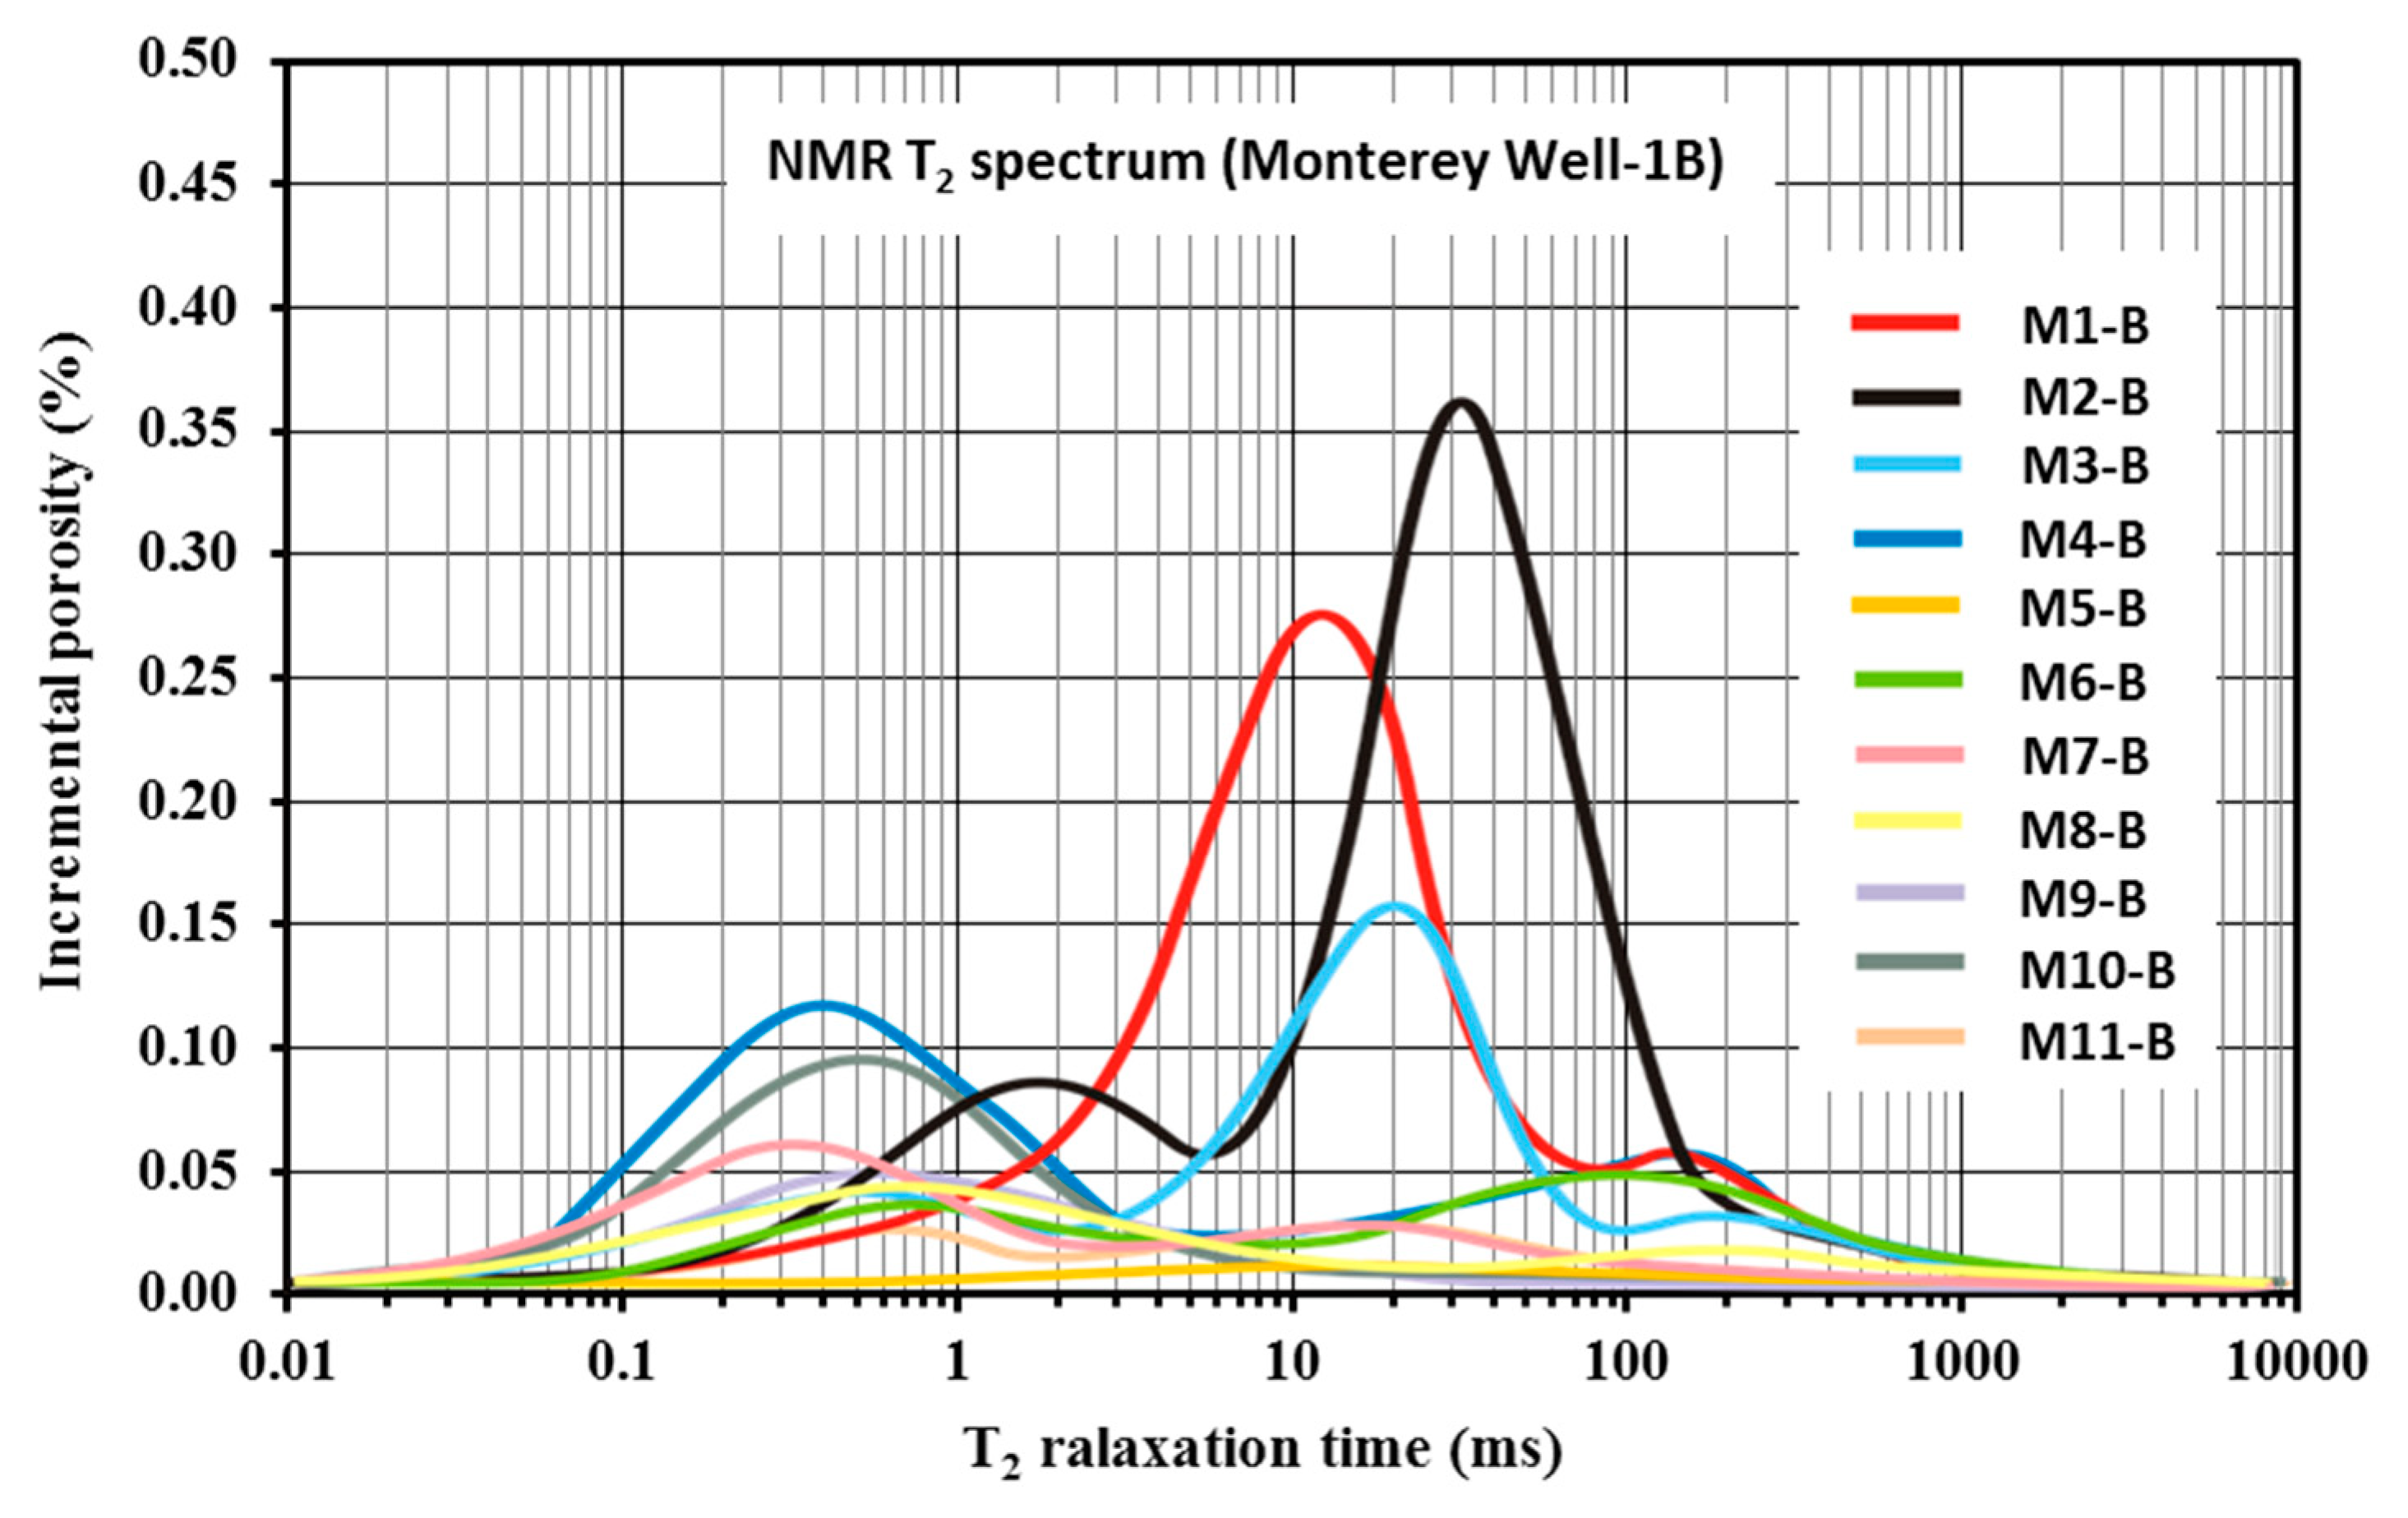
3.2. The Pore Size Distribution from NMR
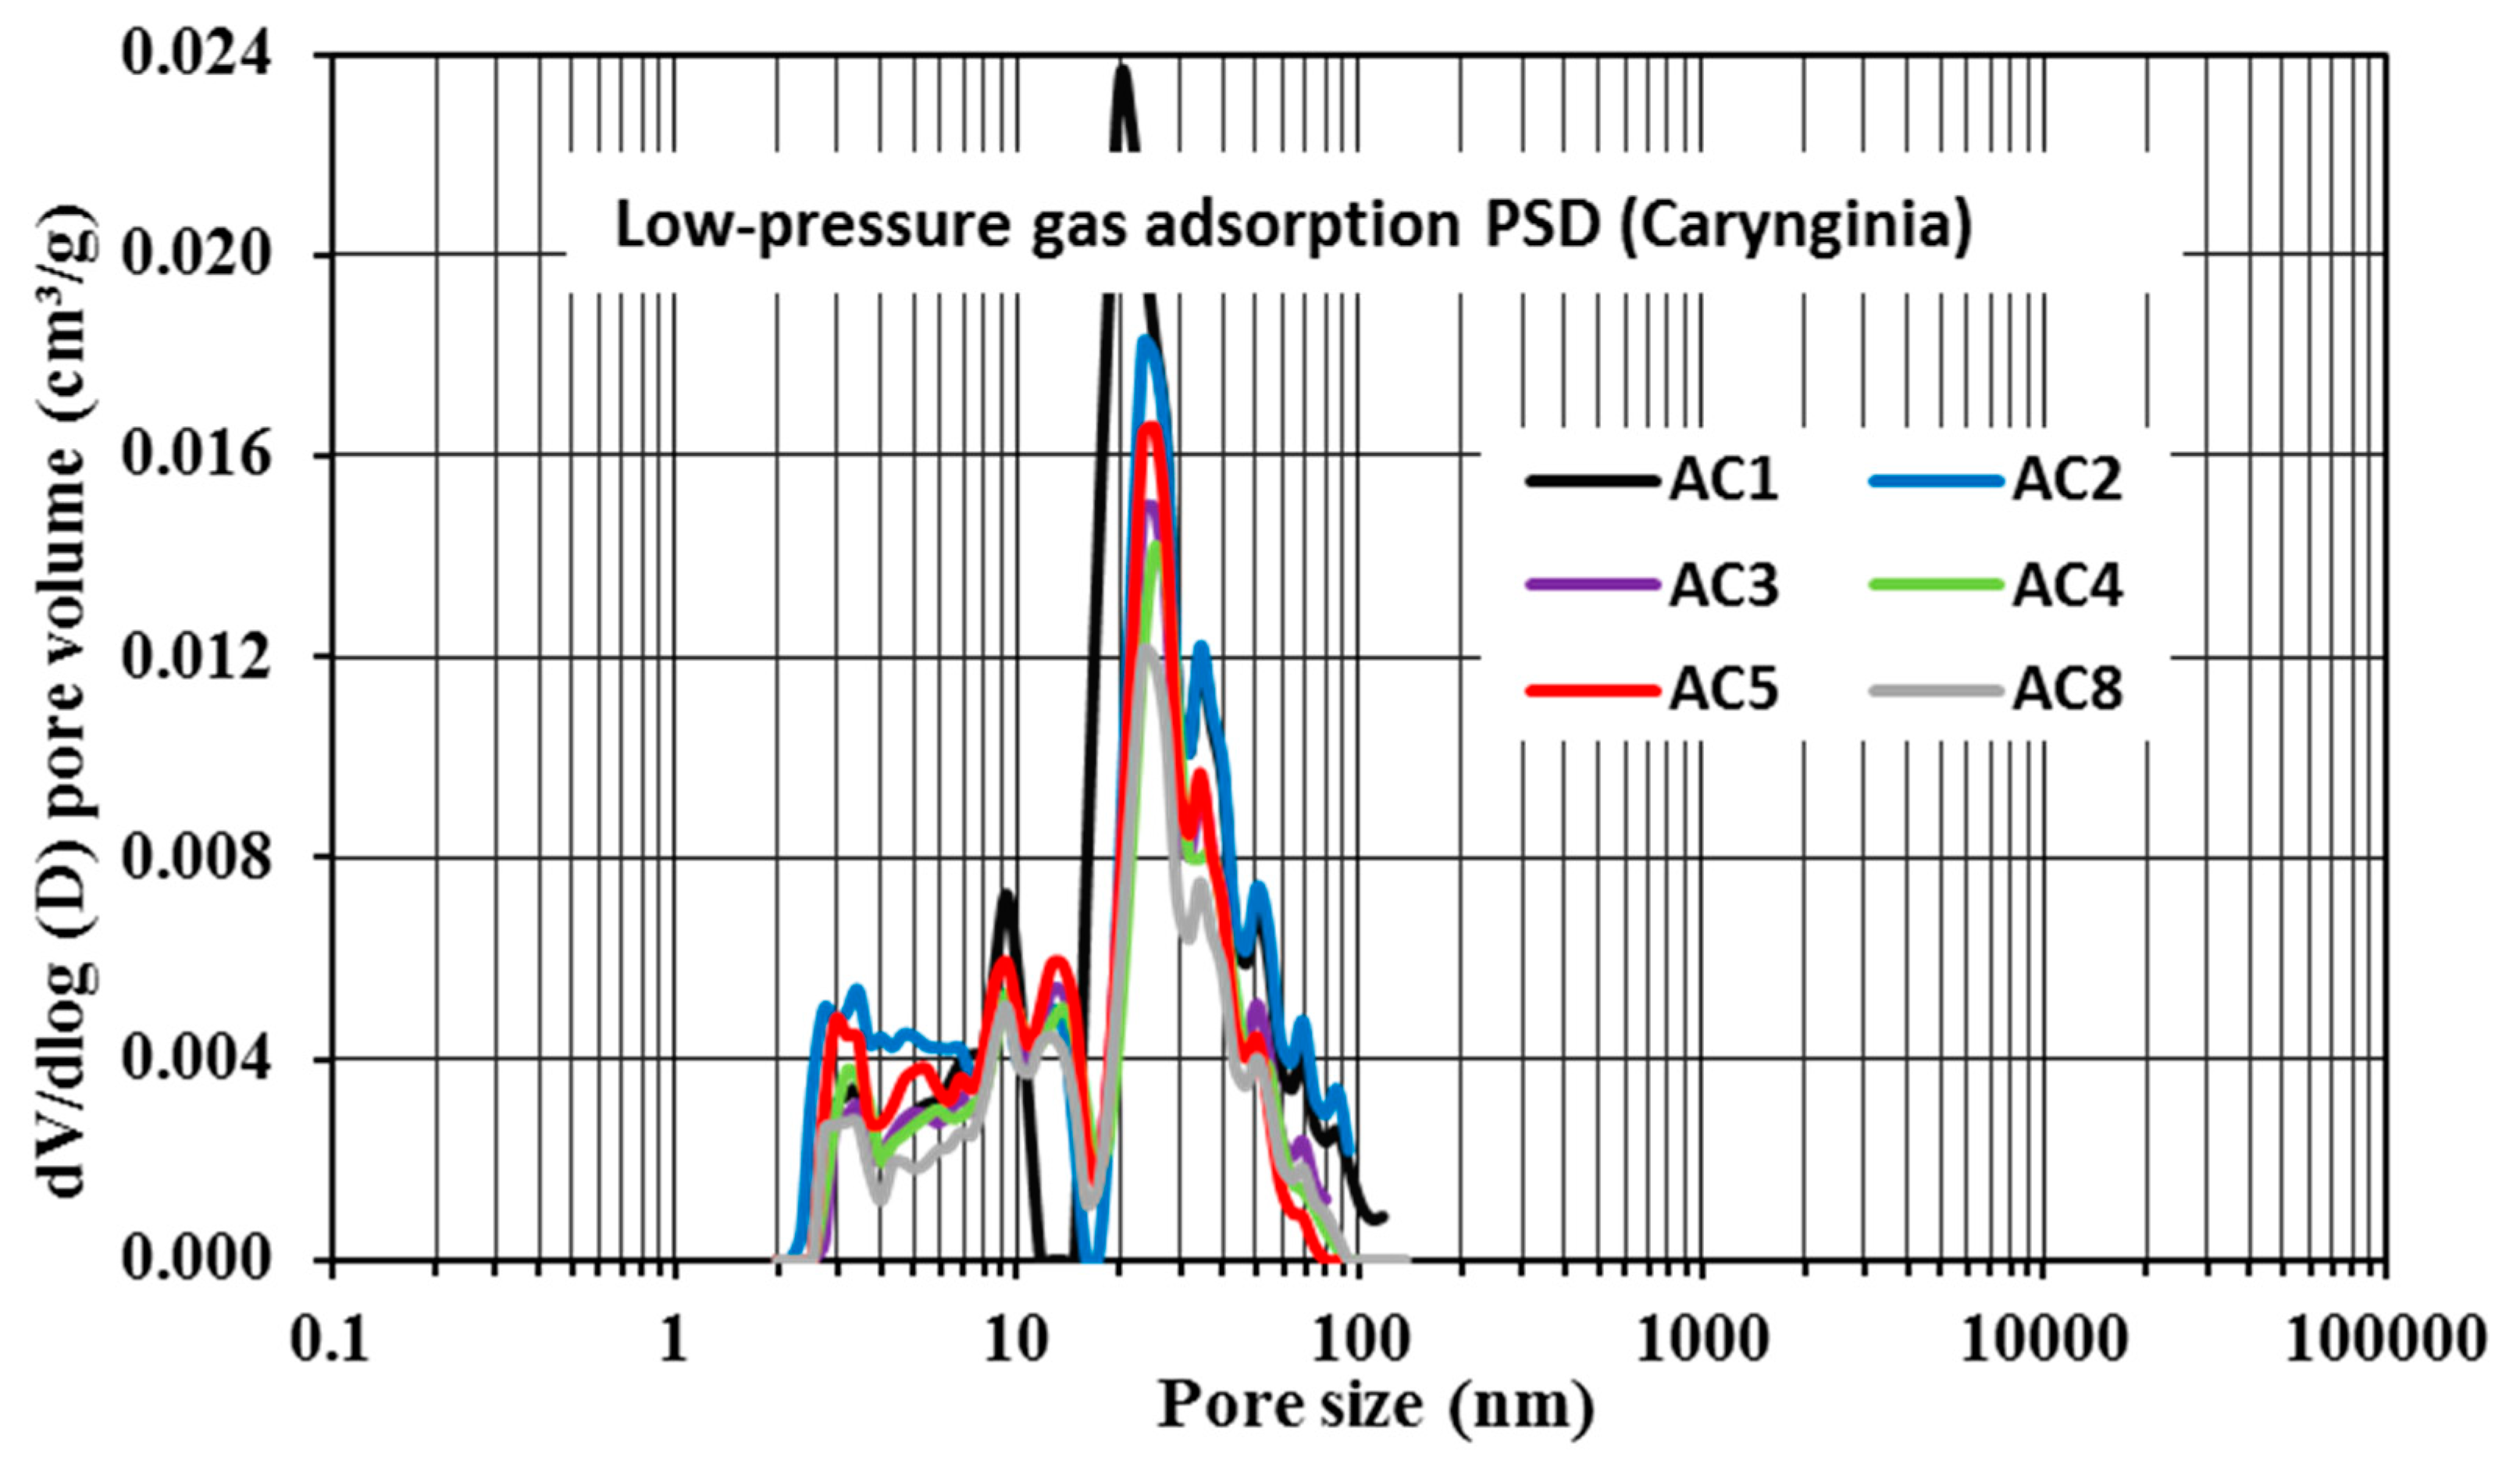
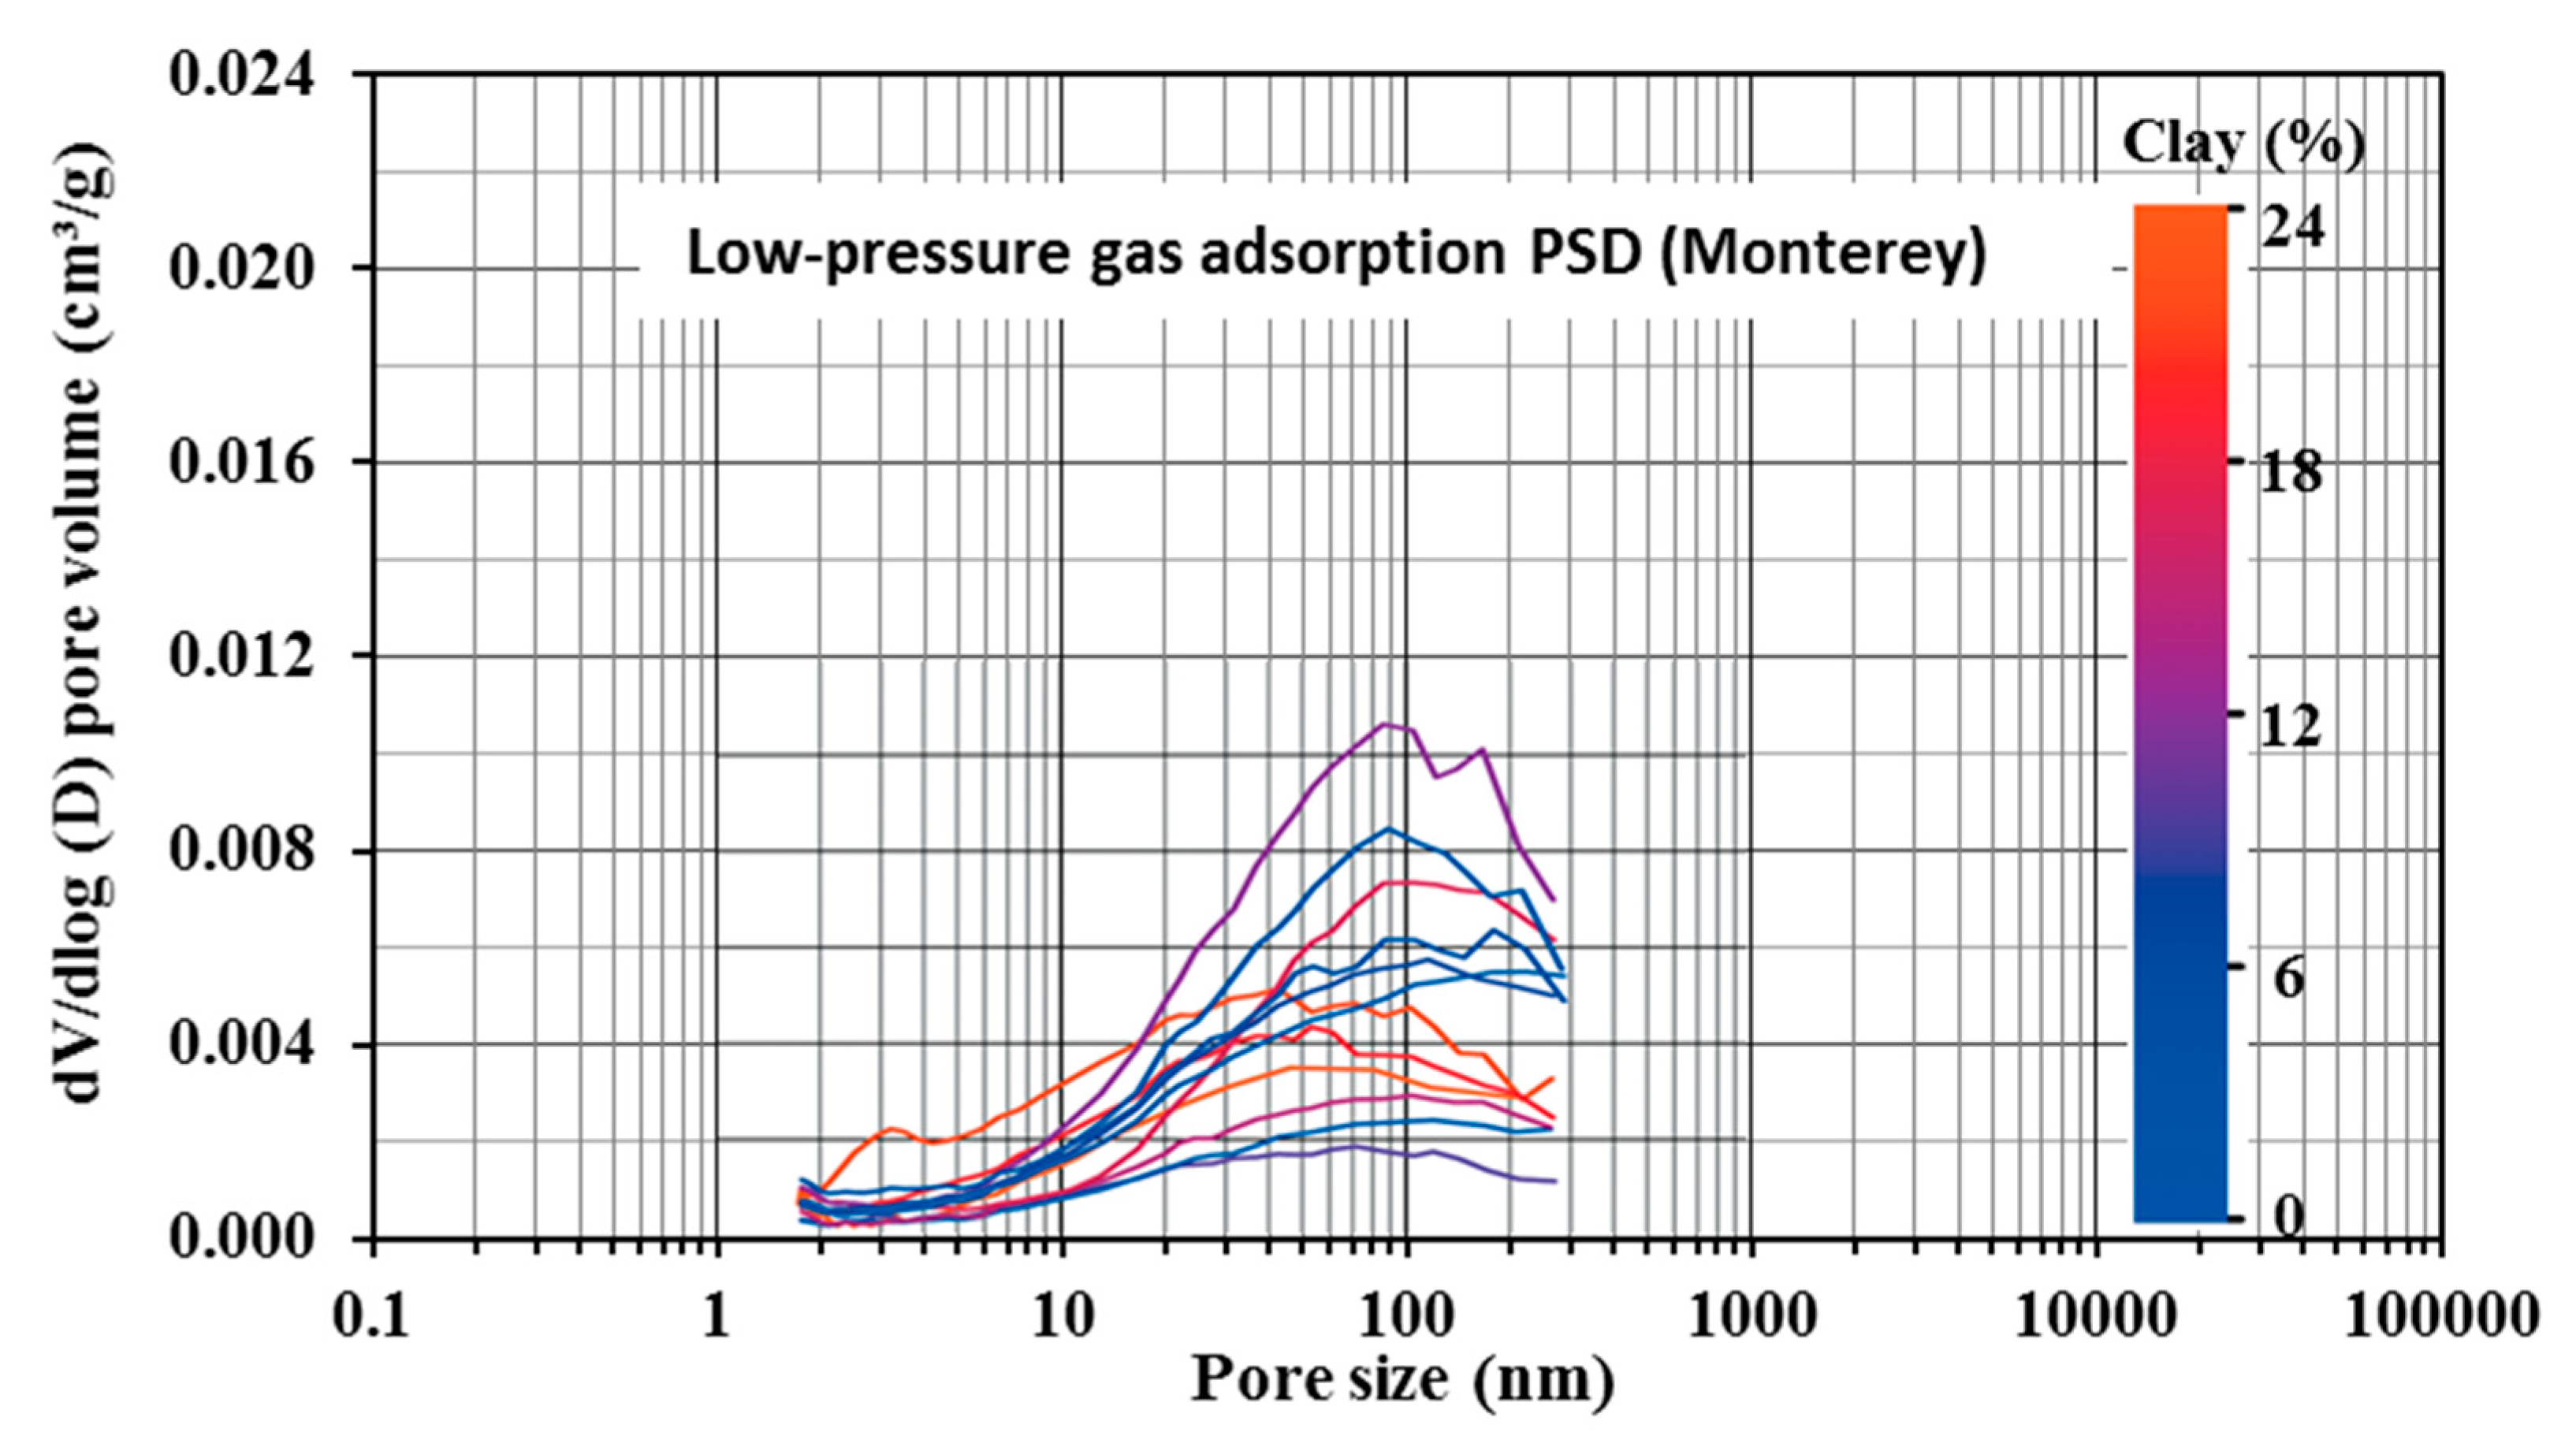
3.3. The Pore Size Distribution from Gas Adsorption
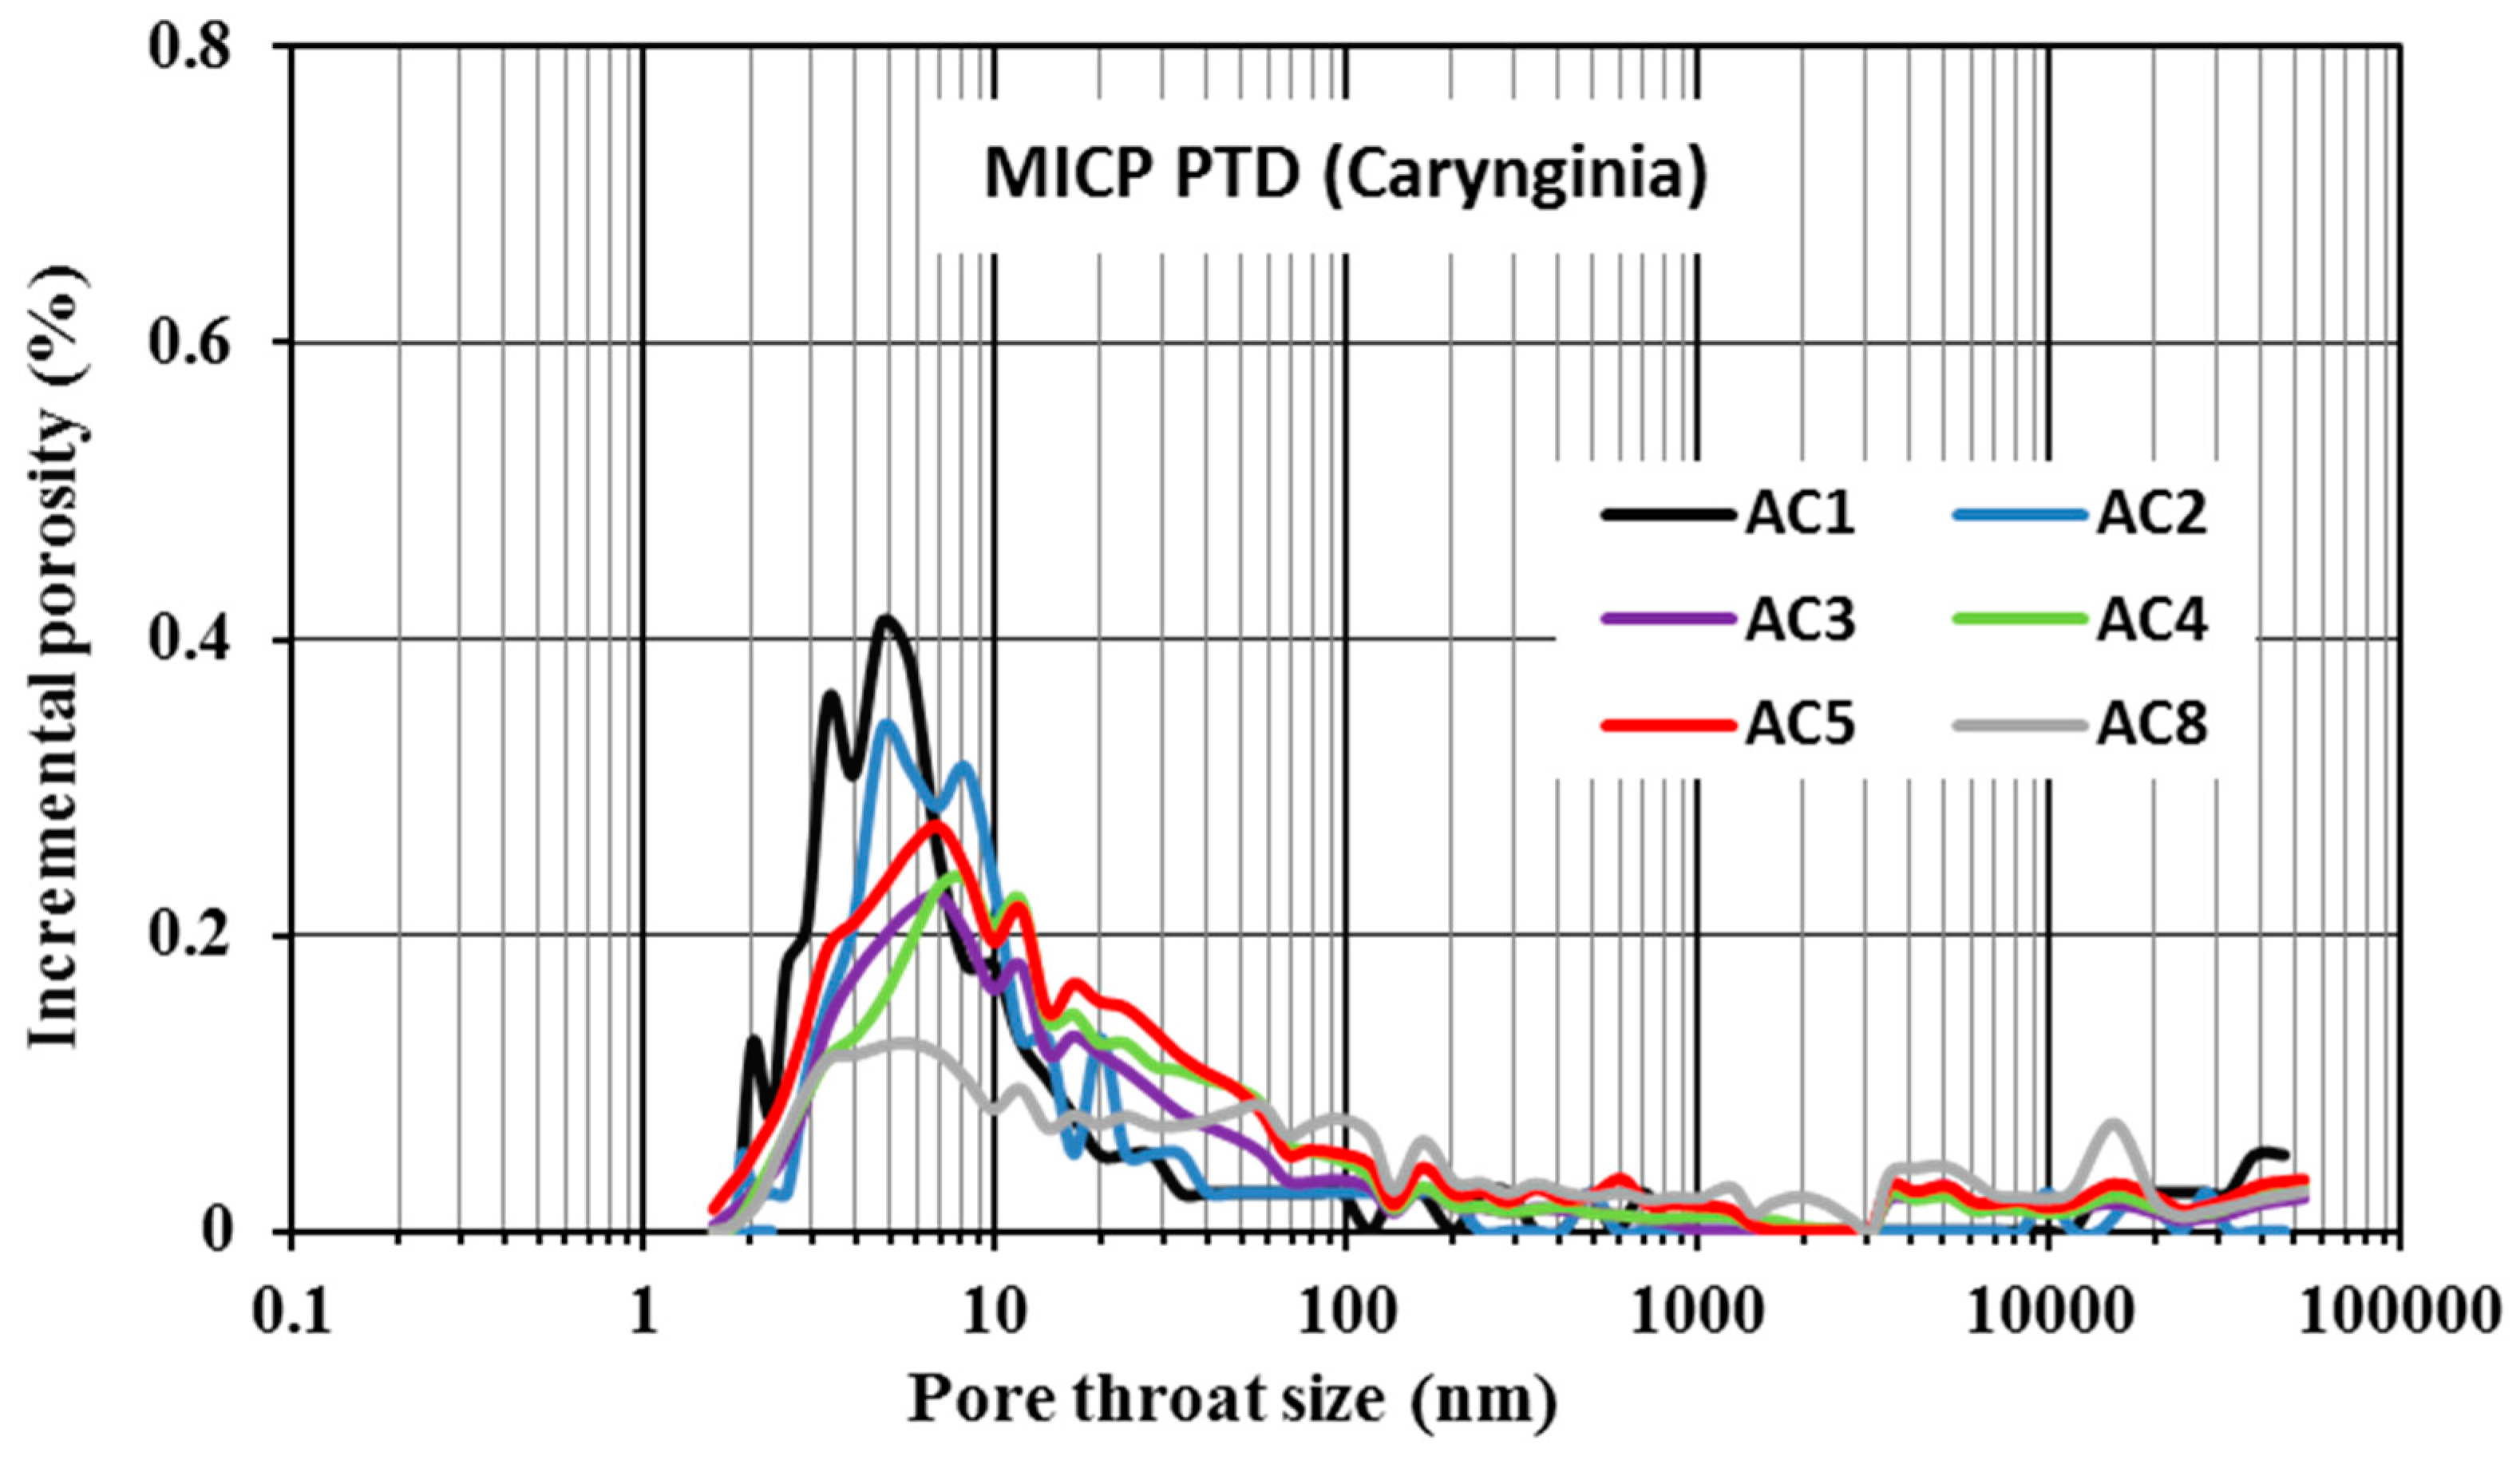
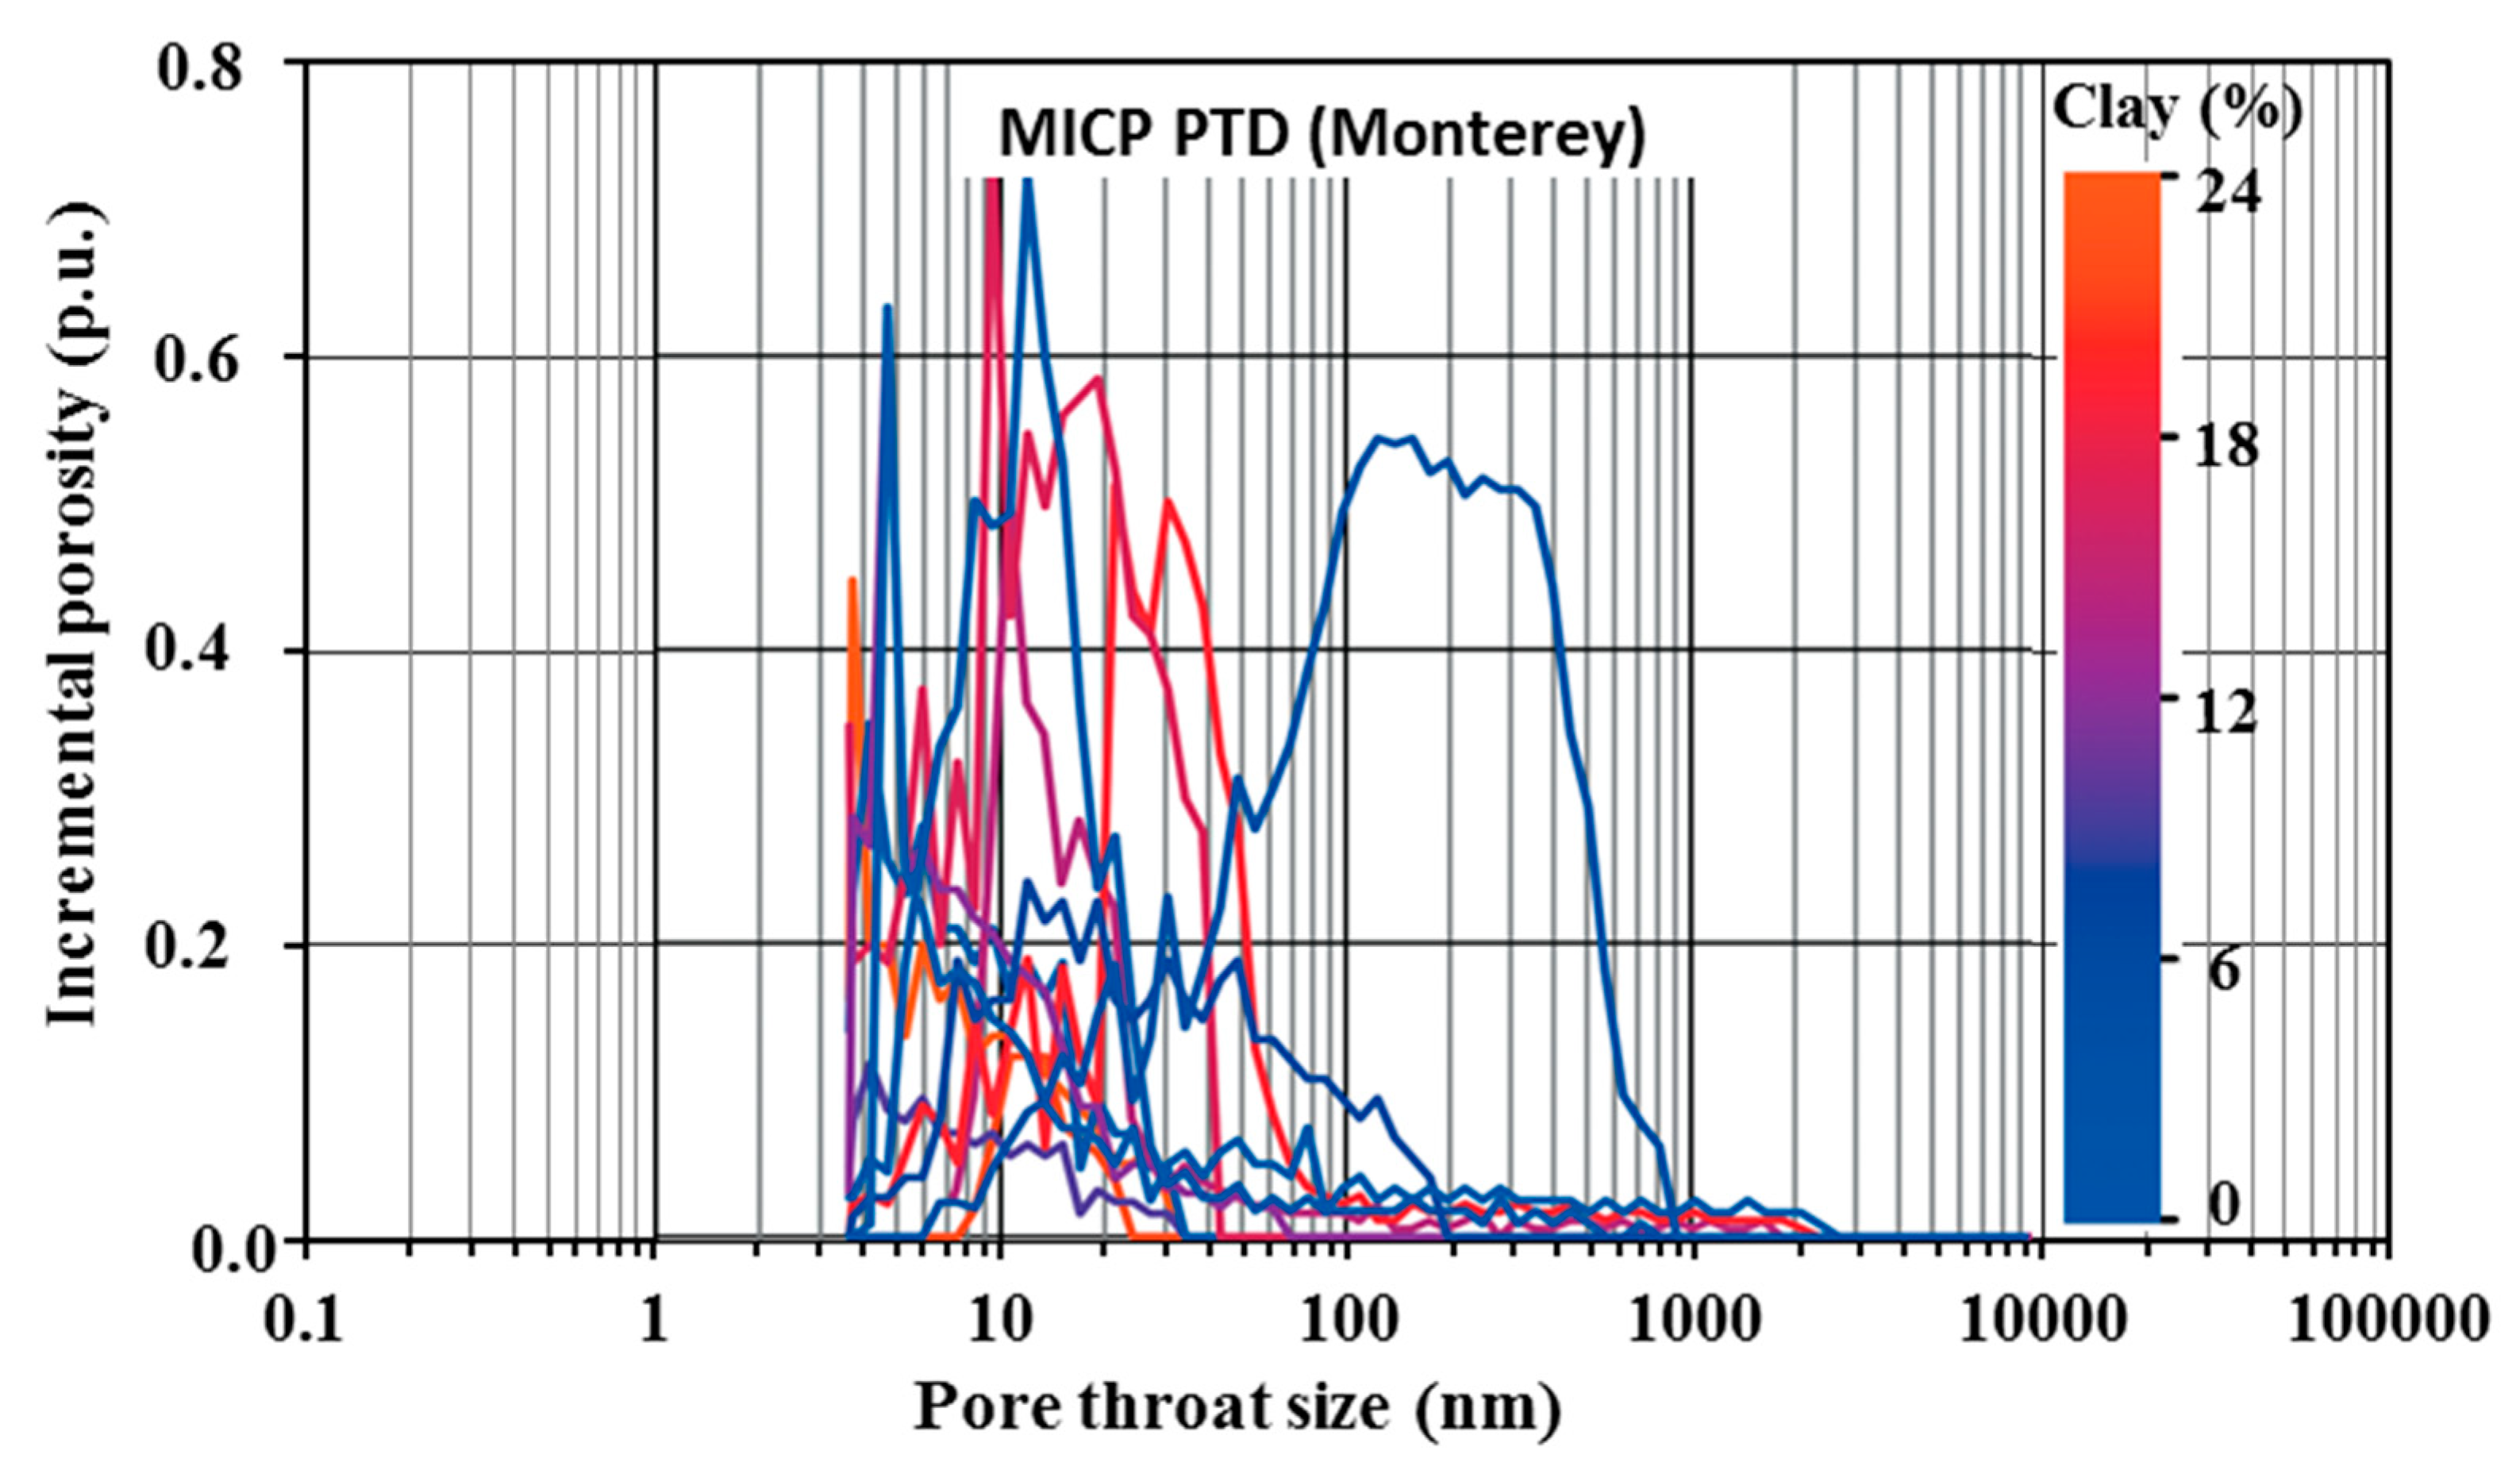
3.4. The Pore Throat Size Distribution from MICP
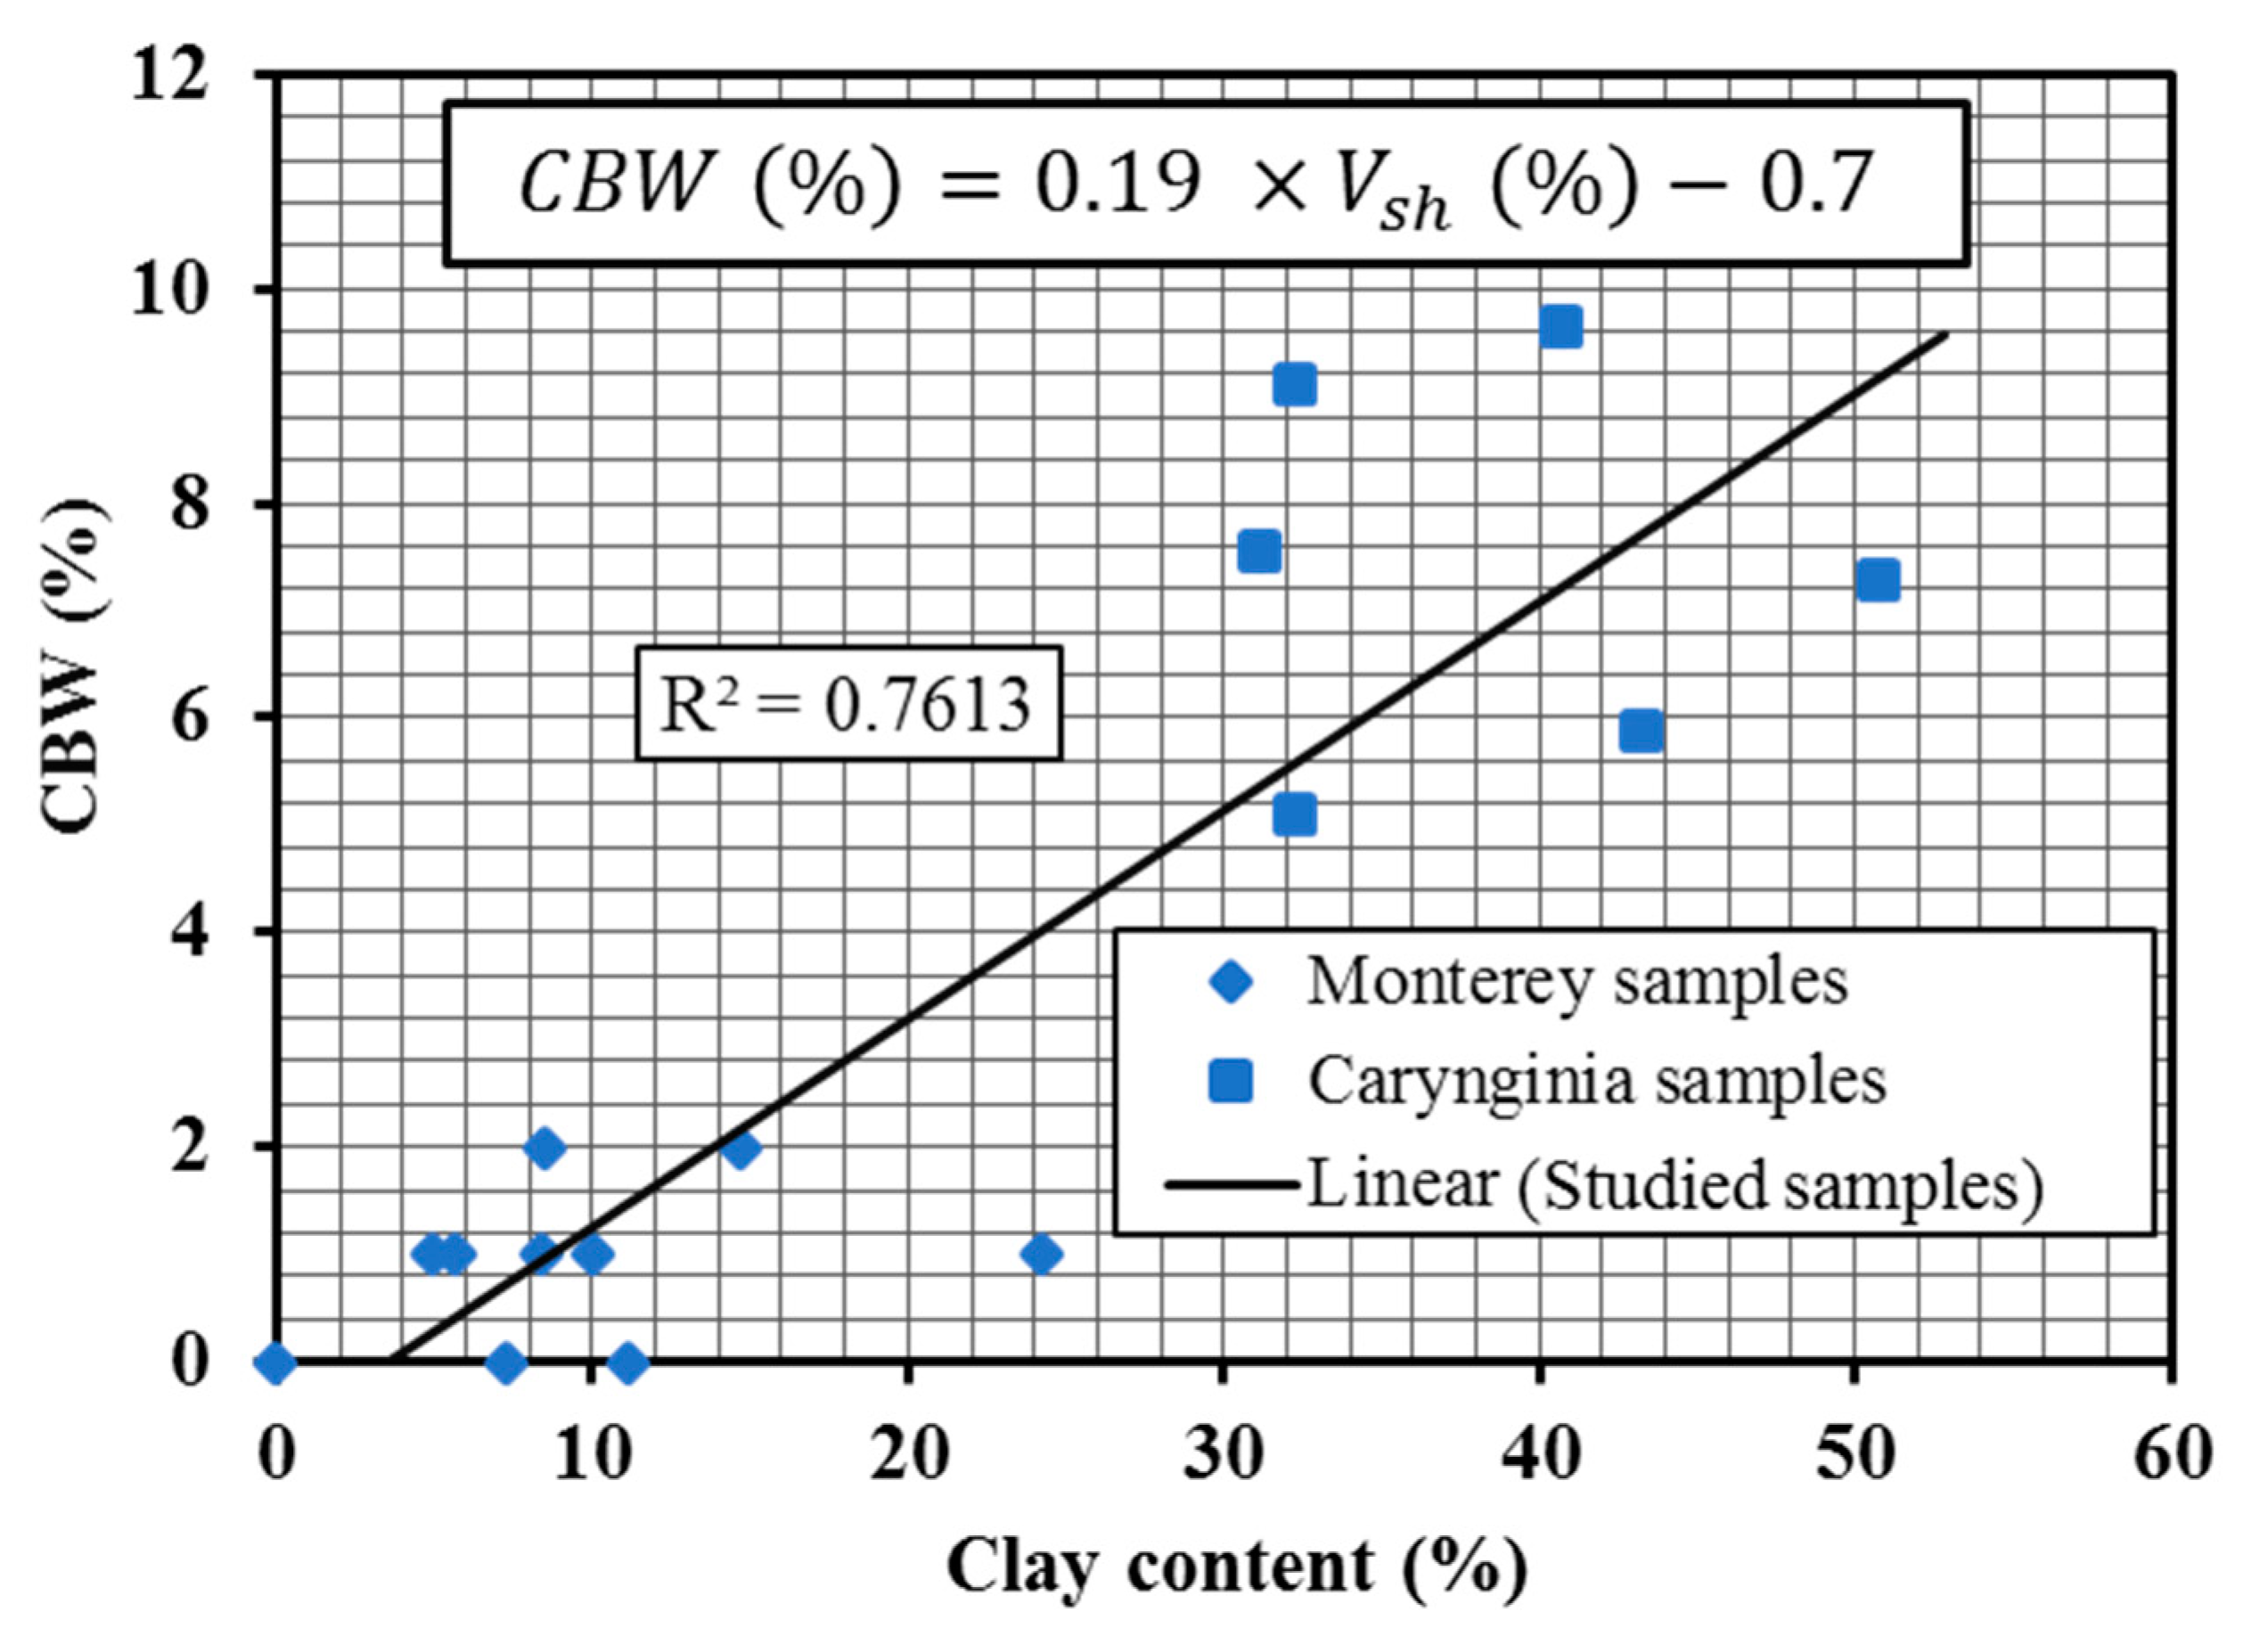
4. Discussion
5. Conclusions
Author Contributions
Funding
Acknowledgments
Conflicts of Interest
Appendix A

| Name | Formation | Depth (m) | MICP Φ, % | Helium Φ, % | NMR Φ, % |
|---|---|---|---|---|---|
| AC1 | Carynginia | 2780.2 | 3.78 | 2.78 | 10.06 |
| AC2 | Carynginia | 2781.7 | 3.05 | 4.15 | 10.04 |
| AC3 | Carynginia | 2789.9 | 3.17 | 1.93 | 11.05 |
| AC4 | Carynginia | 2794.4 | 3.54 | 3.11 | 10.66 |
| AC5 | Carynginia | 2806.4 | 3.56 | 3.22 | 12.87 |
| AC8 | Carynginia | 2825.3 | 3.03 | 2.92 | 8.02 |
| M1-B | Monterey | 1633.7 | N/A | 11.0 | 11.0 |
| M2-B | Monterey | 1658.1 | N/A | 13.0 | 14.0 |
| M3-B | Monterey | 2409.7 | N/A | 6.0 | 6.0 |
| M4-B | Monterey | 2539.9 | N/A | 2.0 | 1.0 |
| M5-B | Monterey | 2602.7 | 3.4 | 2.0 | 2.0 |
| M6-B | Monterey | 2631.0 | 2.8 | 2.0 | 3.0 |
| M7-B | Monterey | 2723.4 | 1.1 | 1.0 | 2.0 |
| M8-B | Monterey | 2772.8 | N/A | 1.0 | 3.0 |
| M9-B | Monterey | 2802.0 | 0.7 | 2.0 | 4.0 |
| M10-B | Monterey | 2879.4 | N/A | 1.0 | 2.0 |
| M1 | Monterey | 1669.5 | 4.7 | 4.0 | 7.0 |
| M2 | Monterey | 2200.9 | N/A | 5.0 | 6.0 |
| M3 | Monterey | 2203.2 | 3.8 | 6.0 | 6.0 |
| M4 | Monterey | 2362.4 | 8.4 | 5.0 | 8.0 |
| M5 | Monterey | 2362.7 | 21.9 | 20.0 | 16.0 |
References
- Curtis, J.B. Fractured shale-gas systems. AAPG Bull. 2002, 86, 1921–1938. [Google Scholar]
- Clarkson, C.R.; Solano, N.; Bustin, R.M.; Bustin, A.M.M.; Chalmers, G.R.L.; He, L.; Melnichenko, Y.B.; Radlińskiet, A.P.; Blach, T.P. Pore structure characterization of North American shale gas reservoirs using USANS/SANS, gas adsorption, and mercury intrusion. Fuel 2013, 103, 606–616. [Google Scholar] [CrossRef]
- Chalmers, G.R.; Bustin, R.M.; Power, I.M. Characterization of gas shale pore systems by porosimetry, pycnometry, surface area, and field emission scanning electron microscopy/transmission electron microscopy image analyses: Examples from the Barnett, Woodford, Haynesville, Marcellus, and Doig units. AAPG Bull. 2012, 96, 1099–1119. [Google Scholar]
- Rezaee, R. Fundamentals of Gas Shale Reservoirs; John Wiley & Sons: Hoboken, NJ, USA, 2015. [Google Scholar]
- Folk, R.L. Petrology of Sedimentary Rocks; Hemphill Publishing Company: Cedar Hill, TX, USA, 1980. [Google Scholar]
- Javadpour, F. Nanopores and apparent permeability of gas flow in mudrocks (shales and siltstone). J. Can. Pet. Technol. 2009, 48, 16–21. [Google Scholar] [CrossRef]
- Labani, M.M.; Rezaee, R.; Saeedi, A.; Hinai, A.A. Evaluation of pore size spectrum of gas shale reservoirs using low pressure nitrogen adsorption, gas expansion and mercury porosimetry: A case study from the Perth and Canning Basins, Western Australia. J. Pet. Sci. Eng. 2013, 112, 7–16. [Google Scholar] [CrossRef]
- Topór, T.; Derkowski, A.; Kuila, U.; Fischer, T.B.; McCarty, D.K. Dual liquid porosimetry: A porosity measurement technique for oil-and gas-bearing shales. Fuel 2016, 183, 537–549. [Google Scholar] [CrossRef]
- Jia, B.; Tsau, J.-S.; Barati, R. Different flow behaviors of low-pressure and high-pressure carbon dioxide in shales. SPE J. 2018, 23, 1452–1468. [Google Scholar] [CrossRef]
- Sondergeld, C.H.; Ambrose, R.J.; Rai, C.S.; Moncrieff, J. Micro-structural studies of gas shales. In Proceedings of the SPE Unconventional Gas Conference, Pittsburgh, PA, USA, 23–25 February 2010. [Google Scholar]
- Mastalerz, M.; Ambroseet, R.J.; Rai, C.S.; Moncrieff, J. Porosity of Devonian and Mississippian New Albany Shale across a maturation gradient: Insights from organic petrology, gas adsorption, and mercury intrusion. AAPG Bull. 2013, 97, 1621–1643. [Google Scholar] [CrossRef]
- Furmann, A.; Mastalerz, M.; Bish, D.; Schimmelmann, A.; Pedersen, P.K. Porosity and pore size distribution in mudrocks from the Belle Fourche and Second White Specks Formations in Alberta, Canada. AAPG Bull. 2016, 100, 1265–1288. [Google Scholar]
- Loucks, R.G.; Reed, R.M.; Ruppel, S.C.; Jarvie, D.M. Morphology, genesis, and distribution of nanometer-scale pores in siliceous mudstones of the Mississippian Barnett Shale. J. Sediment. Res. 2009, 79, 848–861. [Google Scholar] [CrossRef]
- Curtis, M.E.; Cardott, B.J.; Sondergeld, C.H.; Rai, C.S. Development of organic porosity in the Woodford Shale with increasing thermal maturity. Int. J. Coal Geol. 2012, 103, 26–31. [Google Scholar] [CrossRef]
- Rouquerol, J.; Avnir, D.; Fairbridge, C.W.; Everett, D.H.; Haynes, J.M.; Pernicone, N.; Ramsay, J.D.F.; Sing, K.S.W.; Unger, K.K. Recommendations for the characterization of porous solids (Technical Report). Pure Appl. Chem. 1994, 66, 1739–1758. [Google Scholar] [CrossRef]
- Sigal, R.F. Pore-size distributions for organic-shale-reservoir rocks from nuclear-magnetic-resonance spectra combined with adsorption measurements. SPE J. 2015, 20, 824–830. [Google Scholar] [CrossRef]
- Clarkson, C.; Freeman, M.; He, L.; Agamalian, M.; Melnichenko, Y.; Mastalerz, M.; Bustin, R.; Radlinski, A.; Blach, T. Characterization of tight gas reservoir pore structure using USANS/SANS and gas adsorption analysis. Fuel 2012, 95, 371–385. [Google Scholar] [CrossRef]
- Radlinski, A.; Mastalerz, M.; Hinde, A.; Hainbuchner, M.; Rauch, H.; Baron, M.; Lin, J.; Fan, L.; Thiyagarajan, P. Application of SAXS and SANS in evaluation of porosity, pore size distribution and surface area of coal. Int. J. Coal Geol. 2004, 59, 245–271. [Google Scholar] [CrossRef]
- Melnichenko, Y.; Radlinski, A.; Mastalerz, M.; Cheng, G.; Rupp, J. Characterization of the CO2 fluid adsorption in coal as a function of pressure using neutron scattering techniques (SANS and USANS). Int. J. Coal Geol. 2009, 77, 69–79. [Google Scholar] [CrossRef]
- Radlinski, A.P. Small-angle neutron scattering and the microstructure of rocks. Rev. Mineral. Geochem. 2006, 63, 363–397. [Google Scholar] [CrossRef]
- Bahadur, J.; Melnichenko, Y.B.; Radlinski, A.P.; Mastalerz, M.; Schimmelmann, A. Hierarchical pore morphology of cretaceous shale: A small-angle neutron scattering and ultrasmall-angle neutron scattering study. Energy Fuels 2014, 28, 6336–6344. [Google Scholar] [CrossRef]
- Bahadur, J.; Melnichenko, Y.B.; Radlinski, A.P.; Mastalerz, M.; Schimmelmann, A. Small-angle and ultrasmall-angle neutron scattering (SANS/USANS) study of New Albany shale: A treatise on microporosity. Energy Fuels 2015, 29, 567–576. [Google Scholar] [CrossRef]
- Knapp, L.J.; Nanjo, T.; Uchida, S.; Haeri-Ardakani, O.; Sanei, H. Investigating Influences on Organic Matter Porosity and Pore Morphology in Duvernay Formation Organic-Rich Mudstones. In Proceedings of the 24th Formation Evaluation Symposium of Japan, Chiba, Japan, 11–12 October 2018. [Google Scholar]
- Kuila, U. Measurement and Interpretation of Porosity and Pore-Size Distribution in Mudrocks: The Hole Story of Shales; Colorado School of Mines, Arthur Lakes Library: Golden, CO, USA, 2013. [Google Scholar]
- Rezaee, R.; Saeedi, A.; Clennell, B. Tight gas sands permeability estimation from mercury injection capillary pressure and nuclear magnetic resonance data. J. Pet. Sci. Eng. 2012, 88, 92–99. [Google Scholar] [CrossRef]
- Al Hinai, A.; Rezaee, R.; Esteban, L.; Labani, M. Comparisons of pore size distribution: A case from the Western Australian gas shale formations. J. Unconv. Oil Gas Resour. 2014, 8, 1–13. [Google Scholar] [CrossRef]
- Yuan, Y.; Rezaee, R.; Verrall, M.; Hu, S.-Y.; Zou, J.; Testmanti, N. Pore characterization and clay bound water assessment in shale with a combination of NMR and low-pressure nitrogen gas adsorption. Int. J. Coal Geol. 2018, 194, 11–21. [Google Scholar] [CrossRef]
- Ross, D.J.; Bustin, R.M. The importance of shale composition and pore structure upon gas storage potential of shale gas reservoirs. Mar. Pet. Geol. 2009, 26, 916–927. [Google Scholar] [CrossRef]
- Saidian, M.; Godinez, L.J.; Rivera, S.; Prasad, M. Porosity and pore size distribution in mudrocks: A comparative study for Haynesville, Niobrara, monterey, and Eastern European Silurian formations. In Proceedings of the Unconventional Resources Technology Conference, Denver, CO, USA, 25–27 August 2014. [Google Scholar]
- Josh, M.; Esteban, L.; Piane, C.D.; Sarout, J.; Dewhurst, D.; Clennell, M. Laboratory characterisation of shale properties. J. Pet Sci. Eng. 2012, 88–89, 107–124. [Google Scholar] [CrossRef]
- Wang, F.; Guo, S. Influential factors and model of shale pore evolution: A case study of a continental shale from the Ordos Basin. Mar. Pet. Geol. 2019, 102, 271–282. [Google Scholar] [CrossRef]
- Sondergeld, C.H.; Newsham, K.E.; Comisky, J.T.; Rice, M.C.; Rai, C.S. Petrophysical Considerations in Evaluating and Producing Shale Gas Resources. In Proceedings of the SPE Unconventional Gas Conference, Pittsburgh, PA, USA, 23–25 February 2010. [Google Scholar]
- Nelson, P.H. Pore-throat sizes in sandstones, tight sandstones, and shales. AAPG Bull. 2009, 93, 329–340. [Google Scholar] [CrossRef]
- Caineng, Z.; Songqi, P.; Senhu, L.; Jinliang, H.; Songtao, W.; Dazhong, D.; Shasha, S.; Zhi, Y.; Yanyan, C.; Shufang, W.; et al. Shale Gas Formation and Occurrence in China: An Overview of the Current Status and Future Potential. Acta Geol. Sin. Engl. Ed. 2016, 90, 1249–1283. [Google Scholar] [CrossRef]
- Barrett, E.P.; Joyner, L.G.; Halenda, P.P. The Determination of Pore Volume and Area Distributions in Porous Substances. I. Computations from Nitrogen Isotherms. J. Am. Chem. Soc. 1951, 73, 373–380. [Google Scholar] [CrossRef]
- Holmes, R.; Rupp, E.C.; Vishal, V.; Wilcox, J. Selection of Shale Preparation Protocol and Outgas Procedures for Applications in Low-Pressure Analysis. Energy Fuels 2017, 31, 9043–9051. [Google Scholar] [CrossRef]
- Figini-Albisetti, A.; Velasco, L.F.; Parra, J.B.; Ania, C.O. Effect of outgassing temperature on the performance of porous materials. Appl. Surf. Sci. 2010, 256, 5182–5186. [Google Scholar] [CrossRef]
- Wang, G.; Ju, Y. Organic shale micropore and mesopore structure characterization by ultra-low pressure N 2 physisorption: Experimental procedure and interpretation model. J. Nat. Gas Sci. Eng. 2015, 27, 452–465. [Google Scholar] [CrossRef]
- Coates, G.R.; Xiao, L.; Prammer, M.G. NMR Logging: Principles and Applications; Gulf Professional Publishing: Houston, TX, USA, 1999. [Google Scholar]
- Morriss, C.; Rossini, D.; Straley, C.; Tutunjian, P.; Vinegar, H. Core analysis by low-field NMR. In The Log Analyst; Society of Petrophysicists and Well-Log Analysts: London, UK, 1997; Volume 38. [Google Scholar]
- Schön, J.H. Physical Properties of Rocks: Fundamentals and Principles of Petrophysics; Elsevier: Amsterdam, The Netherlands, 2015; Volume 65. [Google Scholar]
- Hossain, Z.; Grattoni, C.A.; Solymar, M.; Fabricius, I.L. Petrophysical properties of greensand as predicted from NMR measurements. Pet. Geosci. 2011, 17, 111–125. [Google Scholar] [CrossRef]
- Sigal, R.F. Mercury Capillary Pressure Measurements on Barnett Core. SPE Reserv. Eval. Eng. 2013, 16, 432–442. [Google Scholar] [CrossRef]
- Saidian, M.; Kuila, U.; Prasad, M.; Lopez, L.A. A Comparison of Measurement Techniques for Porosity and Pore Size Distribution in Shales (Mudrocks): A Case Study of Haynesville, Eastern European Silurian, Niobrara, and Monterey Formations. In AAPG Memoir 110: Imaging Unconventional Reservoir Pore Systems; AAPG: Tulsa, OK, USA, 2016. [Google Scholar]
- Katsube, T.J.; Scromeda, N.; Williamson, M. Effective Porosity of Tight Shales from the Venture Gas Field, Offshore Nova Scotia; Geological Survey of Canada: Ottawa, ON, Canada, 1992; pp. 111–119.
- Rivera, S. Ultrasonic and Low Field Nuclear Magnetic Resonance Study of Lower Monterey Formation: San Joaquin Basin; Colorado School of Mines, Arthur Lakes Library: Golden, CO, USA, 2014. [Google Scholar]
- Rivera, S.; Prasad, M. Effect of Mineralogy on NMR, Sonic, and Resitivity: A Case Study of the Monterey Formation. In Proceedings of the Unconventional Resources Technology Conference, Denver, CO, USA, 25–27 August 2014. [Google Scholar]
- Carr, H.Y.; Purcell, E.M. Effects of Diffusion on Free Precession in Nuclear Magnetic Resonance Experiments. Phys. Rev. 1954, 94, 630–638. [Google Scholar] [CrossRef]
- Kenyon, B.; Kleinberg, R.; Straley, C.; Gubelin, G.; Morriss, C. Nuclear magnetic resonance imaging—Technology for the 21st century. Oilfield Rev. 1995, 7, 19–33. [Google Scholar]
- Meiboom, S.; Gill, D. Modified Spin-Echo Method for Measuring Nuclear Relaxation Times. Sci. Instrum. 1958, 29, 688. [Google Scholar] [CrossRef]
- Washburn, E.W. Note on a Method of Determining the Distribution of Pore Sizes in a Porous Material. Proc. Natl. Acad. Sci. USA 1921, 7, 115–116. [Google Scholar] [CrossRef]
- Prammer, M.; Drack, E.; Bouton, J.; Gardner, J.; Coates, G.; Chandler, R.; Miller, M. Measurements of Clay-Bound Water and Total Porosity by Magnetic Resonance Logging. SPE 1996, 37. [Google Scholar] [CrossRef]
- Coates, G.R.; Galford, J.; Mardon, D.; Marschall, D. A new characterization of bulk-volume irreducible using magnetic resonance. Log Anal. 1998, 39, 1. [Google Scholar]
- Clavier, C.; Coates, G.; Dumanoir, J. Theoretical and Experimental Bases for the Dual-Water Model for Interpretation of Shaly Sands. Soc. Pet. Eng. J. 1984, 24, 153–168. [Google Scholar] [CrossRef]
- Yuan, Y.; Rezaee, R. Fractal analysis of the pore structure for clay bound water and potential gas storage in shales based on NMR and N2 gas adsorption. J. Pet. Sci. Eng. 2019, 177, 756–765. [Google Scholar] [CrossRef]
- Tan, M.; Mao, K.; Song, X.; Yang, X.; Xu, J. NMR petrophysical interpretation method of gas shale based on core NMR experiment. J. Pet. Sci. Eng. 2015, 136, 100–111. [Google Scholar] [CrossRef]
- Yuan, Y.; Rezaee, R.; Tongcheng, H.; Verrall, M.; Si-Yu, H.; Jie, Z. Pore Characterization and Fluid Distribution Assessment of Gas Shale. In Proceedings of the 80th EAGE Conference and Exhibition 2018, Unconventional Resources I (EAGE-SPE), Copenhagen, Denmark, 11 June 2018. [Google Scholar]
- Bustin, R.M.; Bustin, A.M.; Cui, A.; Ross, D.; Pathi, V.M. Impact of shale properties on pore structure and storage characteristics. In Proceedings of the SPE Shale Gas Production Conference, Fort Worth, TX, USA, 16–18 November 2008. [Google Scholar]
- Busch, A.; Schweinar, K.; Kampman, N.; Coorn, A.; Pipich, V.; Feoktystov, A.; Leu, L.; Amann-Hildenbrand, A.; Bertier, P. Shale Porosity—What Can We Learn from Different Methods. In Fifth EAGE Shale Workshop; EAGE: Catania, Italy, 2016. [Google Scholar]
- Yuan, Y.; Rezaee, R. Impact of Paramagnetic Minerals on NMR-Converted Pore Size Distributions in Permian Carynginia Shales. Energy Fuels 2019, 33, 2880–2887. [Google Scholar] [CrossRef]
- Suuberg, E.M.; Deevi, S.C.; Yun, Y. Elastic behaviour of coals studied by mercury porosimetry. Fuel 1995, 74, 1522–1530. [Google Scholar] [CrossRef]
- Yao, Y.; Liu, D. Comparison of low-field NMR and mercury intrusion porosimetry in characterizing pore size distributions of coals. Fuel 2012, 95, 152–158. [Google Scholar] [CrossRef]
- Melnichenko, Y.B.; Rupp, J.A.; Mastalerz, M.; He, L. Porosity of Coal and Shale: Insights from Gas Adsorption and SANS/USANS Techniques. Energy Fuels 2012, 26, 5109–5120. [Google Scholar]
- Mastalerz, M.; Wei, L.; Drobniak, A.; Schimmelmann, A.; Schieber, J. Responses of specific surface area and micro- and mesopore characteristics of shale and coal to heating at elevated hydrostatic and lithostatic pressures. Int. J. Coal Geol. 2018, 197, 20–30. [Google Scholar] [CrossRef]


| Name | Formation | Depth (m) | Total Clay (wt %) | Quartz (wt %) | K-Feldspar (wt %) | Plagioclase (wt %) | Other Minerals (wt %) |
|---|---|---|---|---|---|---|---|
| AC1 | Carynginia | 2780.2 | 50.8 | 35.6 | 2.6 | 5.0 | 6.0 |
| AC2 | Carynginia | 2781.7 | 43.2 | 40.3 | 3.6 | 7.6 | 5.3 |
| AC3 | Carynginia | 2789.9 | 32.3 | 47.6 | 5.4 | 9.4 | 5.3 |
| AC4 | Carynginia | 2794.4 | 31.1 | 53.0 | 3.3 | 8.1 | 4.5 |
| AC5 | Carynginia | 2806.4 | 40.7 | 41.3 | 3.6 | 7.6 | 6.8 |
| AC8 | Carynginia | 2825.3 | 32.3 | 53.2 | 1.4 | 10.6 | 2.5 |
| M1-B [47] | Monterey | 1633.7 | 7.3 | 83.6 | 1.6 | 0.7 | 6.8 |
| M2-B [47] | Monterey | 1658.1 | 4.9 | 55.2 | 0.0 | 0.5 | 39.4 |
| M3-B [47] | Monterey | 2409.7 | 11.1 | 59.2 | 4.1 | 1.8 | 23.8 |
| M4-B [47] | Monterey | 2539.9 | 6.8 | 77.5 | 2.2 | 1.3 | 12.2 |
| M5-B [47] | Monterey | 2602.7 | N/A | N/A | N/A | N/A | N/A |
| M6-B [47] | Monterey | 2631.0 | 24.2 | 50.4 | 3.3 | 5.2 | 16.9 |
| M7-B [47] | Monterey | 2723.4 | 8.4 | 77.0 | 2.5 | 1.8 | 10.3 |
| M8-B [47] | Monterey | 2772.8 | 8.5 | 71.0 | 1.4 | 3.3 | 15.8 |
| M9-B [47] | Monterey | 2802.0 | 14.7 | 72.6 | 2.2 | 3.6 | 6.9 |
| M10-B [47] | Monterey | 2879.4 | 5.6 | 10.6 | 0.0 | 0.0 | 83.8 |
| M1 [47] | Monterey | 1669.5 | N/A | N/A | N/A | N/A | N/A |
| M2 [47] | Monterey | 2200.9 | 10.0 | 69.0 | 4.0 | 6.0 | 11.0 |
| M3 [47] | Monterey | 2203.2 | N/A | N/A | N/A | N/A | N/A |
| M4 [47] | Monterey | 2362.4 | N/A | N/A | N/A | N/A | N/A |
| M5 [47] | Monterey | 2362.7 | N/A | N/A | N/A | N/A | N/A |
| M6 [47] | Monterey | 2485.3 | 7.0 | 68.0 | 5.0 | 6.0 | 14.0 |
© 2019 by the authors. Licensee MDPI, Basel, Switzerland. This article is an open access article distributed under the terms and conditions of the Creative Commons Attribution (CC BY) license (http://creativecommons.org/licenses/by/4.0/).
Share and Cite
Yuan, Y.; Rezaee, R. Comparative Porosity and Pore Structure Assessment in Shales: Measurement Techniques, Influencing Factors and Implications for Reservoir Characterization. Energies 2019, 12, 2094. https://doi.org/10.3390/en12112094
Yuan Y, Rezaee R. Comparative Porosity and Pore Structure Assessment in Shales: Measurement Techniques, Influencing Factors and Implications for Reservoir Characterization. Energies. 2019; 12(11):2094. https://doi.org/10.3390/en12112094
Chicago/Turabian StyleYuan, Yujie, and Reza Rezaee. 2019. "Comparative Porosity and Pore Structure Assessment in Shales: Measurement Techniques, Influencing Factors and Implications for Reservoir Characterization" Energies 12, no. 11: 2094. https://doi.org/10.3390/en12112094
APA StyleYuan, Y., & Rezaee, R. (2019). Comparative Porosity and Pore Structure Assessment in Shales: Measurement Techniques, Influencing Factors and Implications for Reservoir Characterization. Energies, 12(11), 2094. https://doi.org/10.3390/en12112094