Article

Applicability Analysis of Klinkenberg Slip Theory in the Measurement of Tight Core Permeability

1
State Key Laboratory of Petroleum Resources and Prospecting, China University of Petroleum (Beijing), Beijing 102249, China
2
Key Laboratory of Petroleum Engineering Ministry of Education, China University of Petroleum (Beijing), Beijing 102249, China
3
School of Geoscience, University of Aberdeen, Aberdeen AB24 3FX, UK
*
Author to whom correspondence should be addressed.
Energies 2019, 12(12), 2351; https://doi.org/10.3390/en12122351
Submission received: 20 May 2019 / Revised: 13 June 2019 / Accepted: 17 June 2019 / Published: 19 June 2019
(This article belongs to the Special Issue Development of Unconventional Reservoirs)

Abstract

:
The Klinkenberg slippage theory has widely been used to obtain gas permeability in low-permeability porous media. However, recent research shows that there is a deviation from the Klinkenberg slippage theory for tight reservoir cores under low-pressure conditions. In this research, a new experimental device was designed to carry out the steady-state gas permeability test with high pressure and low flowrate. The results show that, unlike regular low-permeability cores, the permeability of tight cores is not a constant value, but a variate related to a fluid-dynamic parameter (flowrate). Under high-pressure conditions, the relationship between flowrate and apparent permeability of cores with low permeability is consistent with Klinkenberg slippage theory, while the relationship between flowrate and apparent permeability of tight cores is contrary to Klinkenberg slip theory. The apparent permeability of tight core increases with increasing flowrate under high-pressure conditions, and it is significantly lower than the Klinkenberg permeability predicted by Klinkenberg slippage theory. The difference gets larger when the flowrate becomes lower (back pressure increases and pressure difference decreases). Therefore, the Klinkenberg permeability which is obtained by the Klinkenberg slippage theory by using low-pressure experimental data will cause significant overestimation of the actual gas seepage capacity in the tight reservoir. In order to evaluate the gas seepage capacity in a tight reservoir precisely, it is necessary to test the permeability of the tight cores directly at high pressure and low flowrate.

1. Introduction

With the continuous depletion of conventional oil and gas reserves, unconventional oil and gas resources play an increasingly important role. Tight sandstone oil and gas, with its huge resources, has become a hotspot in the unconventionals sector [1,2,3,4,5]. In recent years, many scholars have conducted research on enhanced oil recovery in tight sandstone reservoirs [6,7,8,9]. The permeability of tight reservoir permeability is one of the most important reservoir physical parameters in the gas reservoir development process [10,11]. The matrix of a tight sandstone reservoir has very low permeability and ultra-small pore structure [12,13,14,15]. Gas slip [16] is a phenomenon that occurs when gas flows through low-permeability porous medium. During this process, the velocity of the gas layer near the solid wall of the porous medium is not zero, resulting in a large gas flowrate in the porous medium. Because the effect of gas slip plays an important role in low-permeability core, the acquisition of core permeability in tight reservoirs is more complicated [17,18,19]. The Knudsen number [20] is a dimensionless parameter that determines whether there is a slippage effect of the gas flow at different scale flow channels. Moreover, it represents the relationship between the mean free path of the molecule and the pore size. It is an important parameter when identifying different gas flow states [21,22]. The mathematical expression of the Knudsen number is:
K n = λ r
where, λ represents the mean free path of the gas and r is the average pore radius. K n varies with permeability and pressure under isothermal conditions. At large Knudsen values ( K n   > 0.001), the slip effect becomes significant as the mean free path is close to the average pore throat [23].
In 1941, Klinkenberg [24] believed that permeability is a property of porous media and is a constant, and he obtained the mathematical relationship between apparent permeability ( K a ) and absolute permeability ( K ) using first-order slip boundary conditions [25]:
K a = K ( 1 + b K p ¯ )
where K a is the apparent gas permeability observed at the mean pressure; K is Klinkenberg permeability; p ¯ is the average pressure at the inlet and outlet of the core; b K is the slip factor, b K   can be calculated by:
b K = 4 c λ p ¯ r
where c is the proportionality factor. It can be seen from the Equation (3) that for a particular gas and average pressure, the slip factor b K increases as the r increases. The pore radius r of a conventional reservoir core is large enough and b K approaches zero, so that the gas slippage effect is negligible. While the pore radius r of a tight reservoir core is small, the slippage effect has important influence on the gas flow.
It is known from the derivation of the Klinkenberg formula that the nature of the Klinkenberg effect is the gas slippage in the pore throat. The theoretical basis for the Klinkenberg equation deduction is the slip theory of Kundt and Warburg [25], which is only applicable when K n < 0.1. The first-order slip boundary theory is proposed based on the ideal gas state equation, which is used in the Klinkenberg equation deduction process; the calculation of the mean free path of gas molecules is based on the ideal gas assumption. It can be seen that when the pressure increases to a certain extent and the gas must be treated as a real gas, whether the Klinkenberg formula is applicable to the permeability measurement of tight cores is worthy of discussion.
Numerical simulations and experimental studies are two common methods of studying gas flow in micro/nanoscale [26]. Gas flow in micro/nanoscale pores can be described by the molecular modeling (MD) or Lattice–Boltzmann (LB) methods. However, the MD or LB method requires a large amount of computational resources and time, limiting its practical application in shale gas transmission simulation. In recent years, Mohammad et al. [27] solved the Boltzmann equation by reducing its order while using the regularized 13 moment method to ensure its accuracy. An analytical R13-AP model for predicting apparent permeability of shale was established. Density functional theory [28,29] is a theoretical method based on statistical mechanics. It has higher computational efficiency than molecular simulation under the same computational accuracy. Density functional theory [28] is used to simulate ionic fluids in slit-like nanoholes in double-layer capacitors. Therefore, it can be used to simulate gas flow in micron/nanometer porous media. Another way to simulate gas flow in micro/nanopores is to include sliding boundary conditions in the continuum model. Javadpour [30] simply linearly superposes the two transport mechanisms of Knudsen diffusion and slip flow to obtain the apparent permeability. Apparent permeability is a function of pressure, temperature, and gas properties. The results showed that the apparent permeability was much higher than the Darcy permeability in the nanoscale mudstone system. Singh et al. [31] proposed a new LSP permeability model based on Langmuir sliding conditions. The model overcomes the shortcomings of Maxwell’s sliding conditions and uses Langmuir adsorption data to determine the slip coefficient of the gas flow. The experimental results showed that the permeability calculated by the LSP permeability model was greater than the permeability calculated by the Klinkenberg model. Based on the analytical model of rare gas flow, Singh et al. [32] proposed an apparent permeability model with no empirical coefficients. The model is based on convective mass transfer and Fick diffusion, and is obtained by simple linear superposition. Their results indicate that the contribution of Knudsen’s diffusion to total flow is important in shale and it must be included in the gas flow model. Wang et al. [33] proposed a unified shale matrix apparent permeability model that combines the effects of non-Darcy flow/gas slip, geomechanics (ground compaction), and adsorbed gas layer release into one coherent equation. Cai et al. [34] established an ideal gas fractal transport model based on fractal tortuous capillary bundles in three-dimensional space while considering viscous flow, molecular diffusion, and gas adsorption. The apparent permeability model of three-dimensional fractal shale media was obtained by adding fluxes caused by three flow mechanisms (viscous flow, molecular diffusion, and surface diffusion). Singh and Cai et al. [35,36] proposed a new approach of predicting shale permeability by discretizing fractured shale at the scale of interest into its permeable features, including inorganic matter, organic matter, and fractures. Singh and Cai et al. [36] implemented this approach to predict field-scale permeability of shale by history-matching the production data. Lopez et al. [37] developed a numerical method for calculating the shale adsorption-related permeability. Calculations include Darcy flow and diffusion flow, as well as changes of organic pore radius caused by solid kerogen adsorption/desorption and diffusion. The results show that ignoring viscous flow, Knudsen diffusion and pore radius changes lead to erroneous permeability. Gas diffusion in solid kerogen plays an important role in shale gas reservoirs and should be considered. Chen et al. [38] determined the apparent permeability based on the dust-containing gas model (DGM) while regarding the total flow as a combined result of viscous flow and Knudsen diffusion. This study is the first numerical study of the effective Knudsen diffusivity and apparent permeability based on the actual pore structure of shale. Civan et al. [39] proposed a gas flow model in a tight porous medium, which uses a simplified second-order sliding model combined with several empirical parameters to calculate the sliding flow. Civan et al. [40] used the Knudsen number criterion to determine the slip coefficient and derived an apparent permeability expression in the form of the Knudsen number. Based on the Javadpour model, Darabi et al. [23] considered the effect of nanopore wall surface roughness on Knudsen diffusion. Darabi results show that Knudsen diffusion contributes up to 20% of cumulative shale gas production. Therefore, in addition to slippage flow, the shale gas also includes Knudsen diffusion. In addition to extensive theoretical research, many researchers have also conducted experiments on permeability of compact cores. In recent years, many scholars acquired a non-linear relationship between tight core permeability and the reciprocal of the average pressure from the experiments with back pressure at the end, instead of a linear one described by Klinkenberg. Jones and Owens [41] conducted a series of experiments on low-permeability cores. Although they obtained a reasonable straight line, they noted that the overestimation of absolute permeability could be as high as 25%. Rushing et al. [42] found the apparent permeability follows the Klinkenberg linear theory under low back pressure; however, the value of apparent permeability becomes smaller than the value predicted by Klinkenberg slip theory when the average pressure increases to a certain degree. Besides, the difference was getting larger with the increasing back pressure. Zhu et al. [43] believed that the permeability of the low-permeability core and the reciprocal of the mean pressure did not conform to the first-order Klinkenberg slippage theory equation. The higher-order equations and experimental data under low pressure are recommended to predict the absolute permeability of tight cores based on their research.
Li et al. [44] carried out a single-phase gas flow experiment in tight cores. The experimental results showed that as the average pressure approached infinity, the apparent permeability deviated completely from the linear relationship of the classical Klinkenberg slip theory. They believed this is because the gas slip coefficient is not a fixed value but a variable one, and they found that for extremely low permeability cores, the absolute permeability obtained using the Klinkenberg formula correlation may still include slip effects under low back pressure conditions. Dong et al. [45] measured the permeability of tight cores using C2H6. Their experimental results showed that the measured gas permeability (0.026 mD) was slightly smaller than the absolute permeability (0.032 mD) predicted by Klinkenberg slip theory.
Fathi et al. [46] used the Lattice–Boltzmann method to simulate the motion of gases in nanotubes. They found that the permeability predicted by Klinkenberg slip theory was less than the apparent permeability of gas in nanotubes. They explained the deviation from the straight line based on the Lattice–Boltzmann gas dynamics simulation, and an empirical quadratic equation was proposed to fit their experimental results. Moreover, a study conducted by You et al. [47] also indicated that the apparent permeability decreased with the increase of back pressure; they found that when the pressure was 1.42 MPa, the Klinkenberg permeability was 1.23 times of the apparent permeability. Similar conclusions were obtained by Tanikawa [48] and Dion Salam [49]. Additionally, Yue et al. [50] measured the permeability of tight cores under the average pressure of 0–1 MPa, and they found that the measured apparent permeability was bigger than the value predicted by Klinkenberg slip theory, unlike other scholars. Liu et al. [51] carried out gas–water two-phase seepage experiments on compact cores. They believe that the relative permeability of gas phase may be overestimated if slippage effect is not dealt with in the process of determining effective gas permeability.
However, the end pressure of all the experiments above did not exceed 10 MPa, which is rather smaller than the high pore pressure in tight reservoirs. Alireza et al. [52] proposed new theories based on these experimental results to predict and explain the gas slip effect and extended the Klinkenberg slip theory to make it suitable for tight porous media. Its expression is as follows:
K a p p a r e n t = K a b s o l u t e ( 1 + b P ¯ a P ¯ 2 )
The same second-order equation was also proposed by Tang et al. [53] and the slip-off quadratic term of the equation could explain why the curve deviated from the straight line. However, whether the model based on slippage theory can predict the gas flow in a tight core at high pressure and low flowrate is still doubtful.
The study of gas permeability under high pressure in reservoirs is done in order to analyze the flow characteristics of gas in the core at very low flowrate and high average pressures. However, the backpressure regulator method is not suitable for the permeability experiment of tight cores at high pressure due to the working principle of the backpressure regulator [54].
In recent years, some scholars have studied the flow pattern in tight cores under high pressure by changing the methods of adding back pressure. Sinha et al. [55] used a pump to add back pressure to measure the gas permeability in tight cores at different pore pressures (0–5000 psi). The experimental results showed that the measured gas permeability at high pore pressure obviously deviates from the classical Klinkenberg slippage theory, which is much smaller than the predicted value. Due to the low gas flowrate through the tight core, the authors’ group [54,56] used a cylinder to pressurize the back pressure and measured the permeability of these tight cores under the high back pressure. They found that the permeability under high backpressure was lower than the Klinkenberg permeability and the non-Klinkenberg flow pattern under high pressure.
Since the steady flow in tight core samples requires a long time and accurate measurement of very low flow rates, most laboratories use unsteady state techniques to measure the permeability of tight cores. In the unsteady state method, the pulse attenuation method is the most commonly used. It is a transient technique that generates a pressure pulse through the core [57]. The permeability of the core is then indirectly derived from changes in pressure over time. Pulse attenuation techniques require accurate pore volume and pore compressibility measurements as well as adsorption correction [58]. Deriving permeability from transient pressure responses requires further assumptions and parameters that add uncertainty when dealing with tight sandstones. In tight sandstones, due to the insufficient understanding of the flow laws, the number of hypotheses should be minimized. A study by Rushing et al. [42] showed that the steady-state method can accurately determine the permeability of tight cores. The permeability obtained by an unsteady-state method is larger than that obtained by the steady-state method. The difference is not caused by a simple random measurement error, but by a system phenomenon caused by the fundamental problem of the non-steady-state method. Additionally, in the pulse-decay method, the pressure across the sample changes with time. This causes the flow rate through the sample to change, and therefore, the potential rate dependency of permeability is not captured. The steady-state method is measured when gas flows through the core at a constant pressure differential. When equilibrium is reached, the apparent permeability is calculated by the Darcy equation from the differential pressure and flow rate of the sample. Fundamentally, permeability refers to the steady flow through a porous medium. Therefore, the results of the steady-state method come directly from the definition and do not require assumptions about the flow state [58]. Experiments can be performed at different average pore pressures, confining stresses, and flow rates. Compared to other test techniques, the steady-state method takes a longer time to measure permeability of tight sandstone, but it provides greater flexibility and more fundamentally accurate results.
The permeability of tight reservoir cores has always been measured under low back pressure due to the inaccurate measurement of micro differential pressure and micro flowrate under high pressure. Thus, studies on the permeability of tight cores at high pore pressure and low flowrate were rare. In order to overcome the shortcomings of the original experimental device, a differential pressure meter, a flow meter, and a back pressure regulating device was developed to measure the micro pressure drop and flowrate under high-pressure conditions. This newly designed experimental device was used to study the steady-state [57] gas flow in a tight core under different pore pressures (0–30 MPa) and different differential pressures (0.1–1 MPa). By using this device in experiments, we obtained a relationship between the flowrate and the apparent permeability of low-permeability cores and tight cores, respectively; we then applied both the comparison method and analysis method to clarify the difference between the apparent permeability and predicted permeability by classical Klinkenberg slippage theory at different flowrate. The theoretical velocity and the measured velocity under different backpressure and differential pressure were compared. The result indicated that absolute permeability obtained by the Klinkenberg slippage theory will significantly overestimate the gas seepage capacity in a tight reservoir. This study can provide a theoretical basis and an experimental dataset for the establishment of a tight core permeability test model.

2. Experiments

2.1. Gas Permeability Calculation

The calculation formula [47] of gas permeability is:
K g = 200 Q 1 P 1 μ L A ( P 1 2 P 2 2 )
where, A is the area of core end (cm2); μ is the gas viscosity (mPa·s); L is the core length (cm); P 1 , P 2 is the absolute pressure at the inlet and outlet, respectively (MPa). Q 1 is the gas flow at the outlet end (mL/s); the PVT simulator CMG WinProp (CMG, 2003) was used to obtain the gas viscosity in this study. Previous studies have shown that the calculation error was less than 1.5% [59,60]. The relationship between pressure and viscosity of nitrogen at 60 °C is shown in Figure 1.

2.2. Experimental Apparatus

Figure 2 is the schematic diagram of the experimental device, which mainly includes an oven, ISCO pump, a constant pressure pump, a core holder, two high-pressure resistant intermediate containers, a high-pressure micro differential pressure gauge, a high-pressure micro flowmeter, and a back-pressure regulator. The ISCO pump was linked to a high-pressure resistant intermediate container to provide a stable gas source. The constant pressure pump was connected to the core holder to provide a constant confining pressure. The back-pressure regulator was used to control the outlet pressure. The inlet and outlet pressures were measured using the high-pressure micro differential pressure gauge. The high-pressure micro flowmeter was used to measure gas volume velocity. The high-pressure micro flowmeter (Chinese Invention Patent No: 201510164634.5), high-pressure micro differential pressure gauge (China Invention Patent No: CN104748908A), and back-pressure regulator (China Invention Patent No: CN106647842A) were all novel experimental equipment developed by authors’ group.
The HPMR flowmeter can measure extremely low flow (4 nL/min–1 mL/min) at high pressure (0.1 MPa–50 MPa) with high accuracy (error < 1%) [56]. Generally, the working principle of the device is based on the displacement method, which can be used to measure the speed of fluid displacement in a pressure-resistant capillary tube. Prior to this study, the authors’ group demonstrated that the effect of high pressure on the diameter of glass tube is negligible [56].
Under high pressure, the high-pressure micro differential pressure gauge can continuously record the dynamic pressure difference from 10−6 MPa up to 80 MPa with the error controlled within 0.1% [56,61]. The operating principle rests on the micro differential pressure measurement under a high-pressure system through digitized reading of the fluid level in a pressure resistant U-shaped tube (pressure resistant manometer).
Our group [54,56] found that the traditional back-pressure regulator is not suitable for measuring the extremely low flowrate at high pressure due to its working principle. In this experiment, the self-designed back-pressure regulator was used to limit the pressure fluctuation of the whole experimental facility below 0.002 MPa under the pressure of 40 MPa for 120 min. The working principle of the back-pressure regulator was to stabilize the pressure by using gas–energy storage and adjust the pressure with microtubule and pump assistance.

2.3. Core Samples

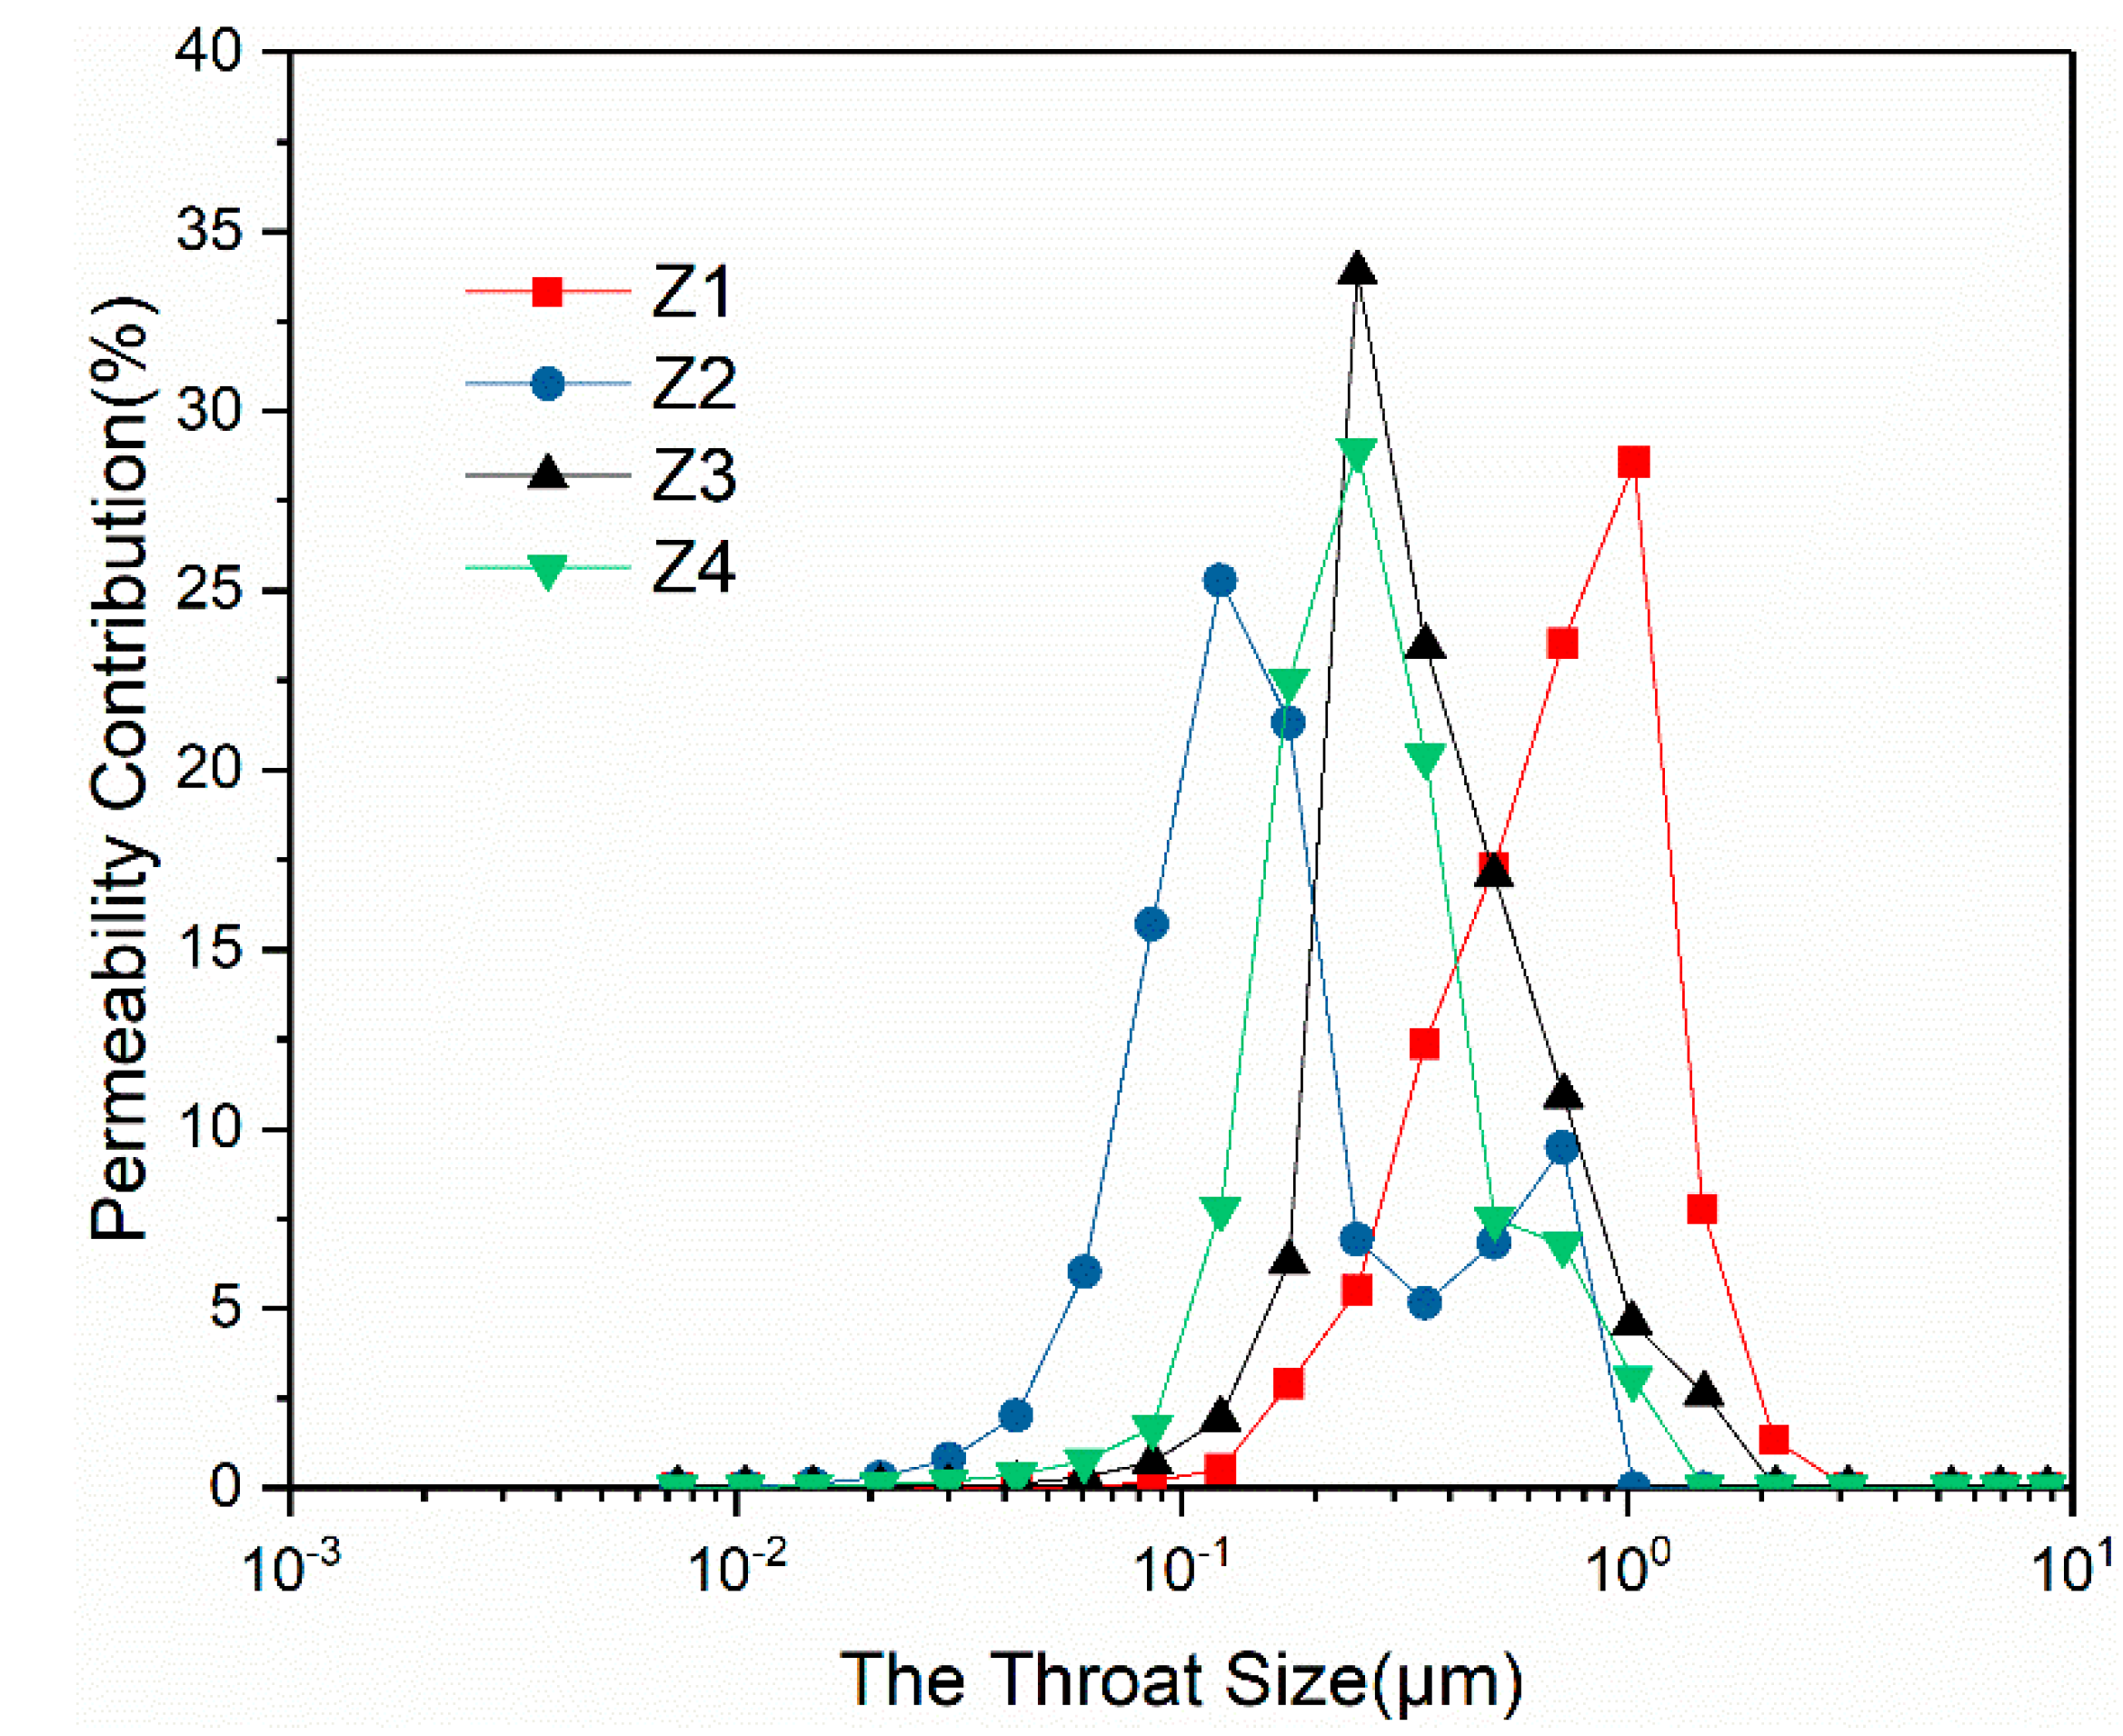
The experiment used four natural sandstone cores from a certain area of Shanxi Province, China. The lithology of these cores was sandstone. The cores porosities were measured by a KXD-II porosity tester. The particle volume method was used to measure the porosity of the core. Core analysis method SY/T 5336-2006 was used as the analysis basis. The pore throat size distribution curve was obtained from high-pressure mercury injection experiments. The SY/T 5346-2005 rock capillary pressure curve method was used as the basis for analysis. The dominated throat radius ranging from 0.1224 μm to 1.0382 μm, with the porosity distribution ranging from 9.8% to 20.57%. The distribution of their pore throats is shown in Figure 3, and the base data of experiment cores are shown in Table 1. The core plugs were cleaned with toluene to remove hydrocarbons and dried in an oven at 95 °C for a period of 48 h before the measurements. Nitrogen was regarded as displacing medium.

2.4. Experimental Procedure

Before the experiment, we adjusted the temperature of the incubator to 60 °C and then placed the experimental core into a core holder to test the sealing of the holder with nitrogen at a pressure of 35 MPa. After the requirement of airtightness was achieved, we modified the inlet and outlet pressure and confining pressure of the intermediate vessel to reach the pre-setting pressure. Core samples were maintained at constant differential pressure for at least 3 h to achieve flow and stress equilibrium. When the pressure and flow state reached the equilibrium, the inlet pressure and the pressure difference (between inlet and outlet) were recorded. The criterion for gas reaching a steady flow was that the flow rate remained constant for a period of time when all other conditions remained the same (effective stress, upstream pressure, downstream pressure, temperature). If the gas flow did not reached a stable state, it would be judged after a period of time until it reached a stable state. The specific steps are to measure the flow rate firs and then measure the flow rate again after 1 h under the same conditions. If the flow rate is the same, it is considered to have reached a steady flow. Additionally, to make the result more accurate, we measured the flow three times and used the average number. The measurement interval was 30 min to detect the gas flow state and air tightness of the experimental system. After the measurement was completed, the inlet and outlet pressure were adjusted for the next measurement and the above steps were repeated. By changing the input cases (differential pressure varied from 0.1 to 1 MPa, the back pressure varied from 0 to 30 MPa and the net confining pressure was kept as 4 MPa), different sets of results can be acquired.

3. Results and Discussion

3.1. Relationships between Permeability and Flowrate

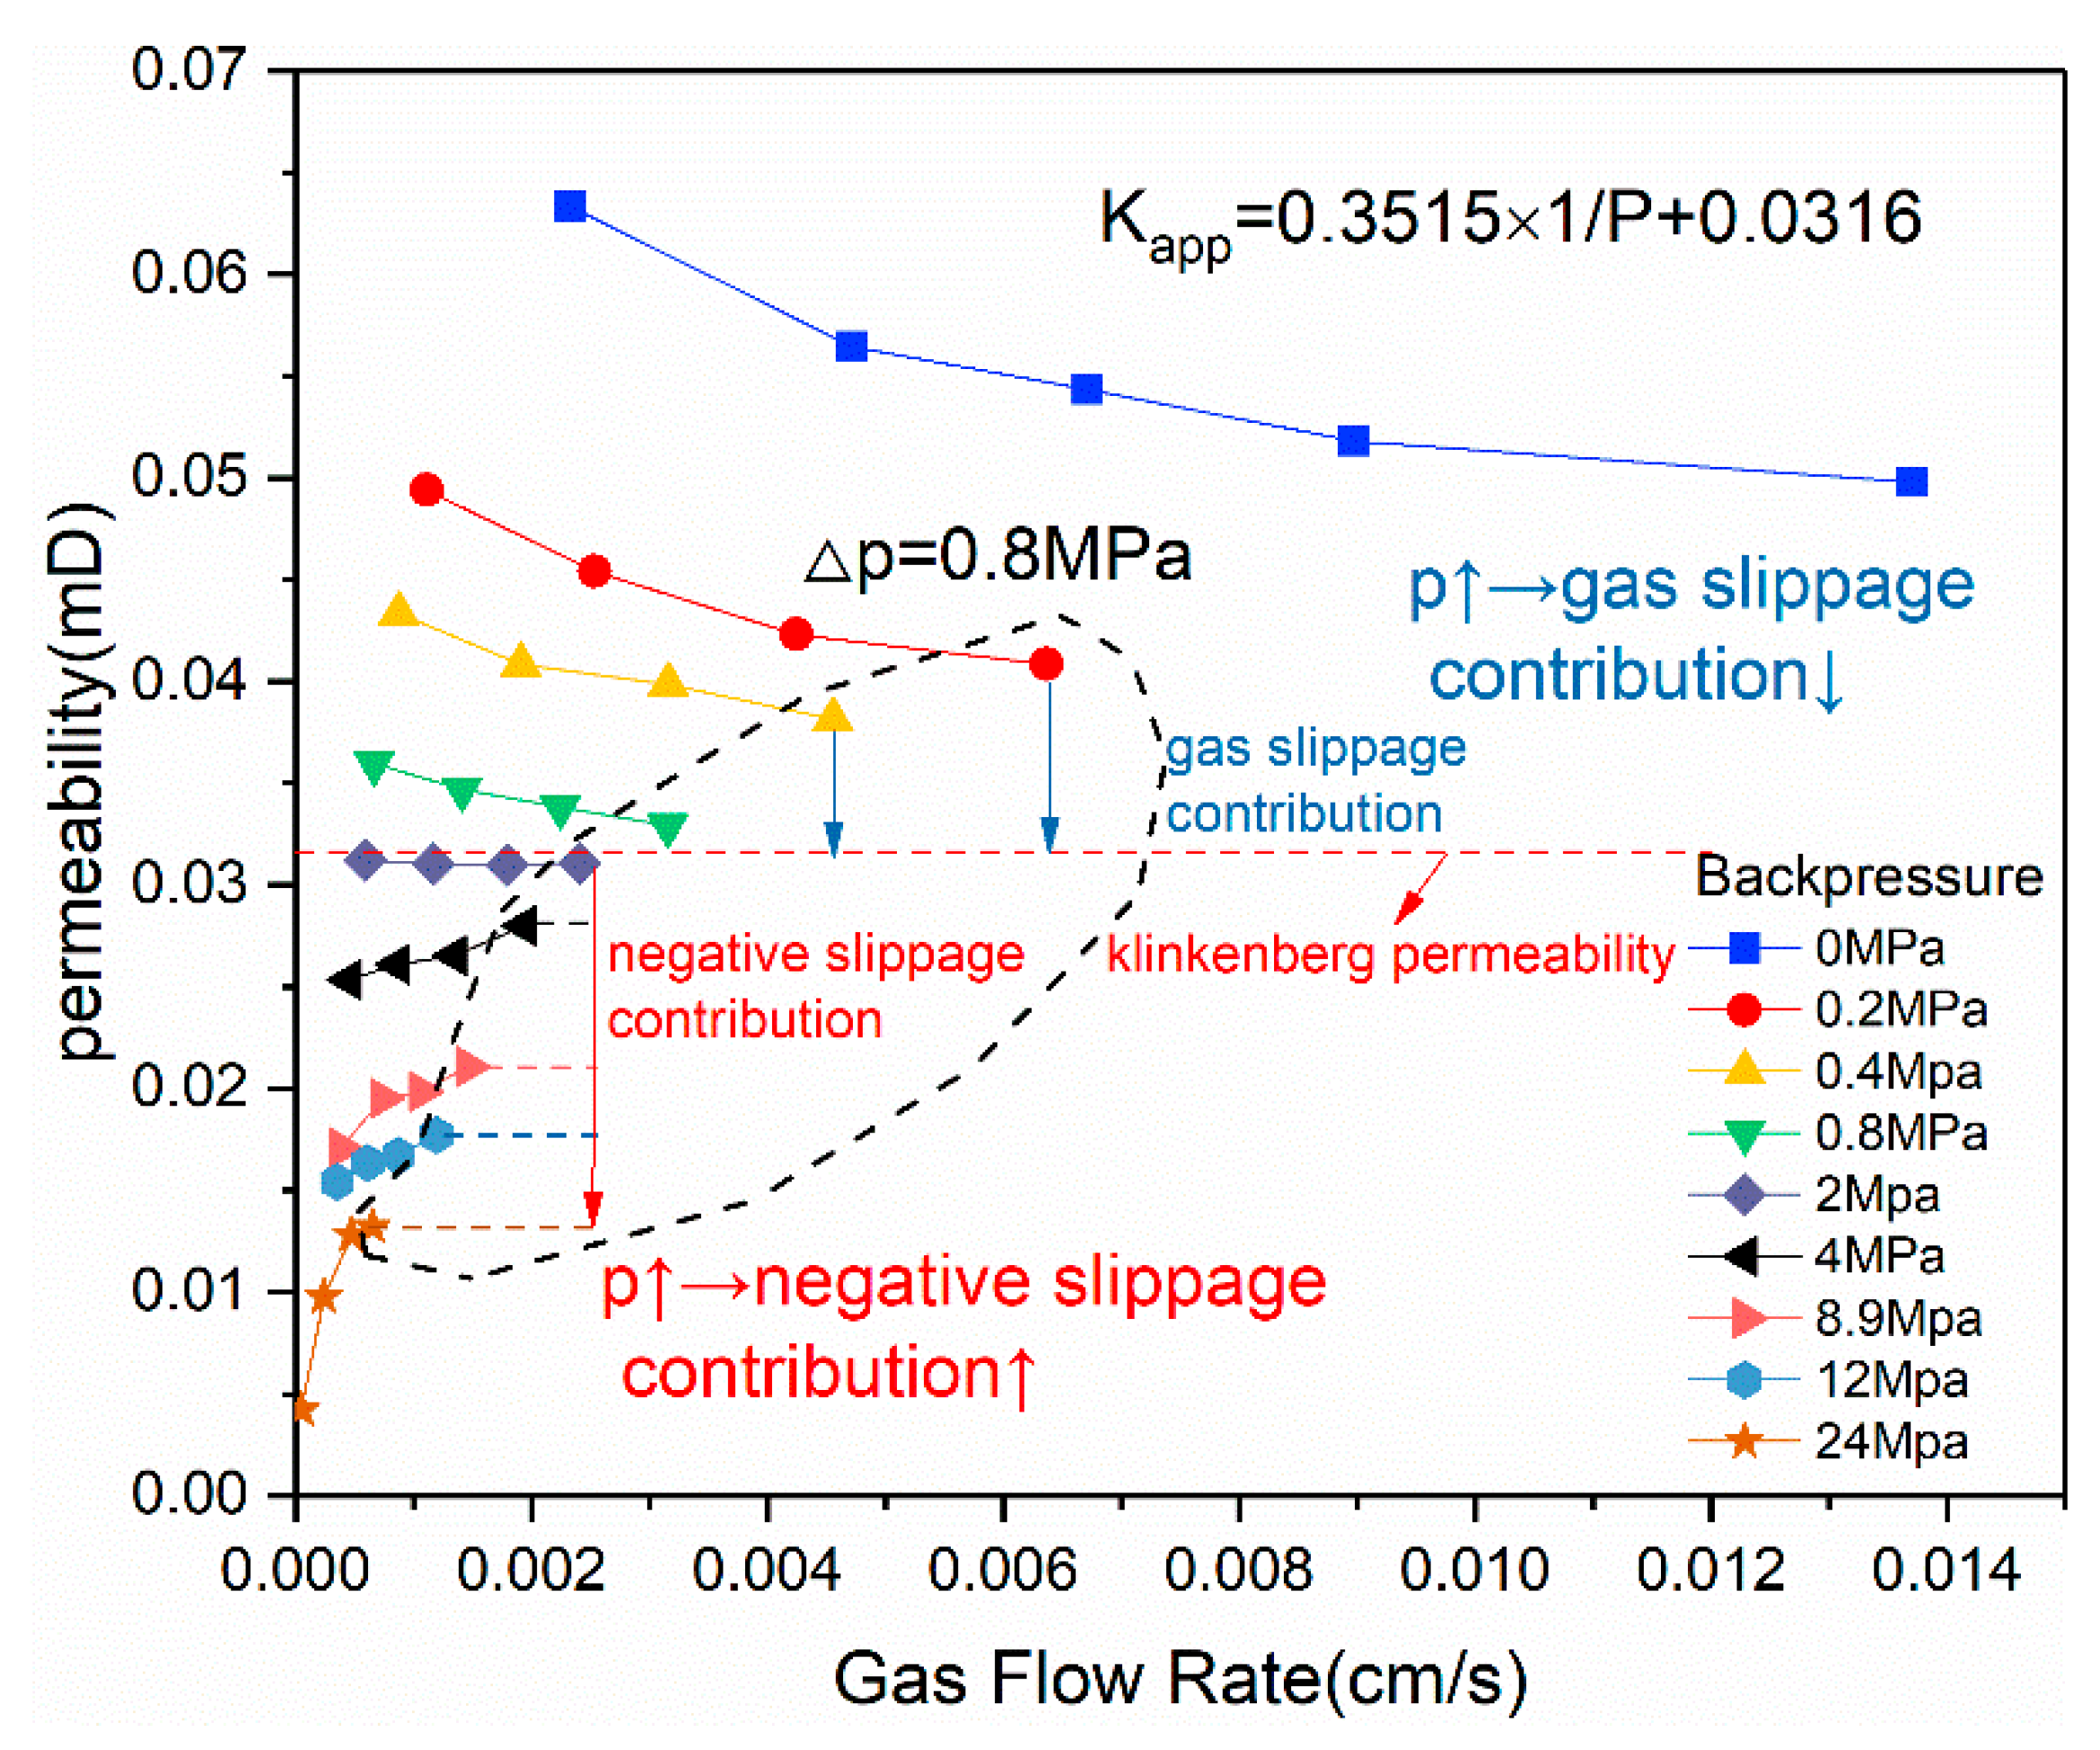
According to the Klinkenberg slippage theory, the permeability decreases with the increase of the average pressure. With a fixed back pressure, the average pressure increases as the flowrate increases. So regardless of the value of back pressure, the permeability predicted by Klinkenberg slippage theory always decreases with increasing flowrate and becomes closer to Klinkenberg permeability. Figure 4, Figure 5, Figure 6 and Figure 7 shows the permeability versus flowrate at different back pressures by the lines with different colors. The blue line with square markers shows the flowrate–permeability relationship, which is described by classical slippage theory: when the back pressure equals the atmospheric pressure, the apparent permeability decreases as the flowrate increases. The red, dashed line is the Klinkenberg permeability calculated by Klinkenberg slippage theory, which does not change with the flowrate.
It can be seen from Figure 4 that the apparent permeability of the core dropped as the flowrate increased under different back pressures (0.2 MPa, 0.6 MPa, 2 MPa, 8 MPa, 16 MPa, 24 MPa). Moreover, the apparent permeability approached the Klinkenberg permeability when the flowrate became larger. The following experimental data can be used as the proof of this finding: when the back pressure was 0.2 MPa, the apparent permeability at the flowrate of 3.77 × 10⁻³ cm/s was 1.27 times larger than the Klinkenberg permeability and 0.145 times more than that at the flowrate of 3.37 × 10⁻² cm/s; when the back pressure increased to 16 MPa, the apparent permeability at the flowrate of 2.24 × 10⁻³ cm/s was 1.01 times larger than the Klinkenberg permeability and 0.01 times greater than that at the flowrate of 1.34 × 10⁻² cm/s.
As shown in the black oval dotted curve in Figure 4, under the same differential pressure (0.6 MPa), the apparent permeability decreased monotonously and approached the Klinkenberg permeability with the increase of the back pressure (the decrease of flowrate). In addition, as the back pressure increased, the contribution of the slippage effect to the apparent permeability decreased: the greater the back pressure and the corresponding apparent permeability got closer to the Klinkenberg permeability. By analyzing the data above, it can be found that the relationship between the flowrate and apparent permeability of the low-permeability core is in accordance with Klinkenberg slippage theory.
The permeability curves of tight core Z2 (Figure 5) to Z4 (Figure 7) have similar characteristics. The results for core Z2 (Figure 5) were used as an example to analyze the change in gas permeability. It can be seen from Figure 5 that under low back pressure (see the results at backpressures of 0.2 MPa, 0.4 MPa, 1 M Pa, 2 MPa), the apparent permeability of the core decreased with the increase of the flowrate, approaching the Klinkenberg permeability predicted by Klinkenberg slippage theory. The pattern shows that the apparent permeability became closer to the Klinkenberg permeability as the flowrate increased, which follows the Klinkenberg slippage theory. When the back pressure was relatively high (referring to the experimental results of 11 MPa, 16 MPa, 24 MPa), the apparent permeability increased with the increase of the flowrate and presented the “negative slippage” law, which is opposite to the Klinkenberg slippage theory. It can also be seen from Figure 5 that the lower the flowrate (the larger the back pressure, the lower the pressure difference), the greater the apparent permeability deviated from Klinkenberg permeability predicted by the Klinkenberg slippage theory. The data from Figure 5 shows that when the back pressure was 0.4 MPa, the apparent permeability decreased with an increasing flowrate. As the flowrate equaled 1.72 × 10⁻⁴ cm/s, the apparent permeability was 1.25 times larger than the apparent permeability at the flowrate of 1.18 × 10⁻³ cm/s. When the back pressure was 24 MPa, the apparent permeability increased with the increase of the flowrate. At the flowrate of 9.28 × 10⁻⁶ cm/s, the apparent permeability was 0.312 times larger than the apparent permeability at the flowrate of 2.38 × 10⁻⁴ cm/s.
As shown in the black, oval, dotted curve in Figure 5, when the differential pressure was the same and the back pressure was relatively low (0.2 MPa, 0.4 MPa, 1 MPa, 2 MPa), the slippage effect contribution and the apparent permeability decreased as the flowrate decreased (back pressure increased), and the permeability value approached the Klinkenberg value gradually. This regular pattern is in line with the Klinkenberg slippage theory. However, under high back pressure (4 MPa, 11 MPa, 16 MPa, 24 MPa), the relationship between apparent permeability and the flowrate was not consist with the low back pressure. Instead, as the back pressure increased, the flowrate declined, the permeability decreased rapidly, and the phenomenon of “negative slippage” occurred: the apparent permeability was much smaller than the Klinkenberg permeability. Moreover, the deviation degree became greater as the flowrate got lower (the back pressure increased), and the negative slippage contribution increased with the increase of back pressure. Moghadam [58] also drew the conclusion that the apparent permeability increased with the increase of flowrate and reached a stable value at last, which is consistent with our results.
Under low pressure, the permeability gradually decreased with the increase of back pressure and the increase of flow rate to approach the Klinkenberg permeability. This is because at low pressure, the slippage effect will enhance the gas migration capacity in the core [24]. The increase in back pressure and the increase in flow rate can both increase the average pressure in the core. When the average pressure increases, the mean free path of the molecule is reduced and the slippage effect is reduced, so the permeability decreases with increasing back pressure and flow rate. Therefore, increasing test pressure is the most straightforward method to reduce the effect of gas slip, which is the underlying principle of Klinkenberg correlation.
At high pressure, the permeability decreased with increasing back pressure and decreasing flow rate and was much smaller than the Klinkenberg permeability. This is because under high pressure, the mean free path of the gas is significantly smaller, much smaller than the radius of the average pore throat. Thus, the slippage effect can be neglected [44,47] and the micro-scale flow effect of high-pressure gas appears in the tight core [61]. The interaction of high-pressure and microscale effects will result in changes in the physical properties of the gas. As the outlet pressure increases, the gas gradually changes from lean gas to dense gas and further approaches the liquid state. At higher outlet pressures, the smaller the pressure difference, the greater the flow resistance, and the gas flow under different pressure differences in the microtubes exhibits non-linear characteristics. With the increase of outlet pressure and the decrease of tube diameter, the micro-scale flow effect of high-pressure gas becomes more obvious [61]. Therefore, the permeability decreases as the back pressure increases and the flow rate decreases.
Recall from the findings in Section 3.1. that the relationship between the flowrate and the apparent permeability of the low-permeability core is consistent with the Klinkenberg slippage theory. However, the apparent permeability of high-pressure gas in tight cores is not as predicted by Klinkenberg slippage theory; it gets closer to the Klinkenberg permeability as the flowrate decreases (average pressure increases), but is significantly lower than the Klinkenberg permeability. In addition, the apparent permeability increases with the increasing flowrate under high back-pressure condition.

3.2. Measured Flowrate versus Theoretical Flowrate

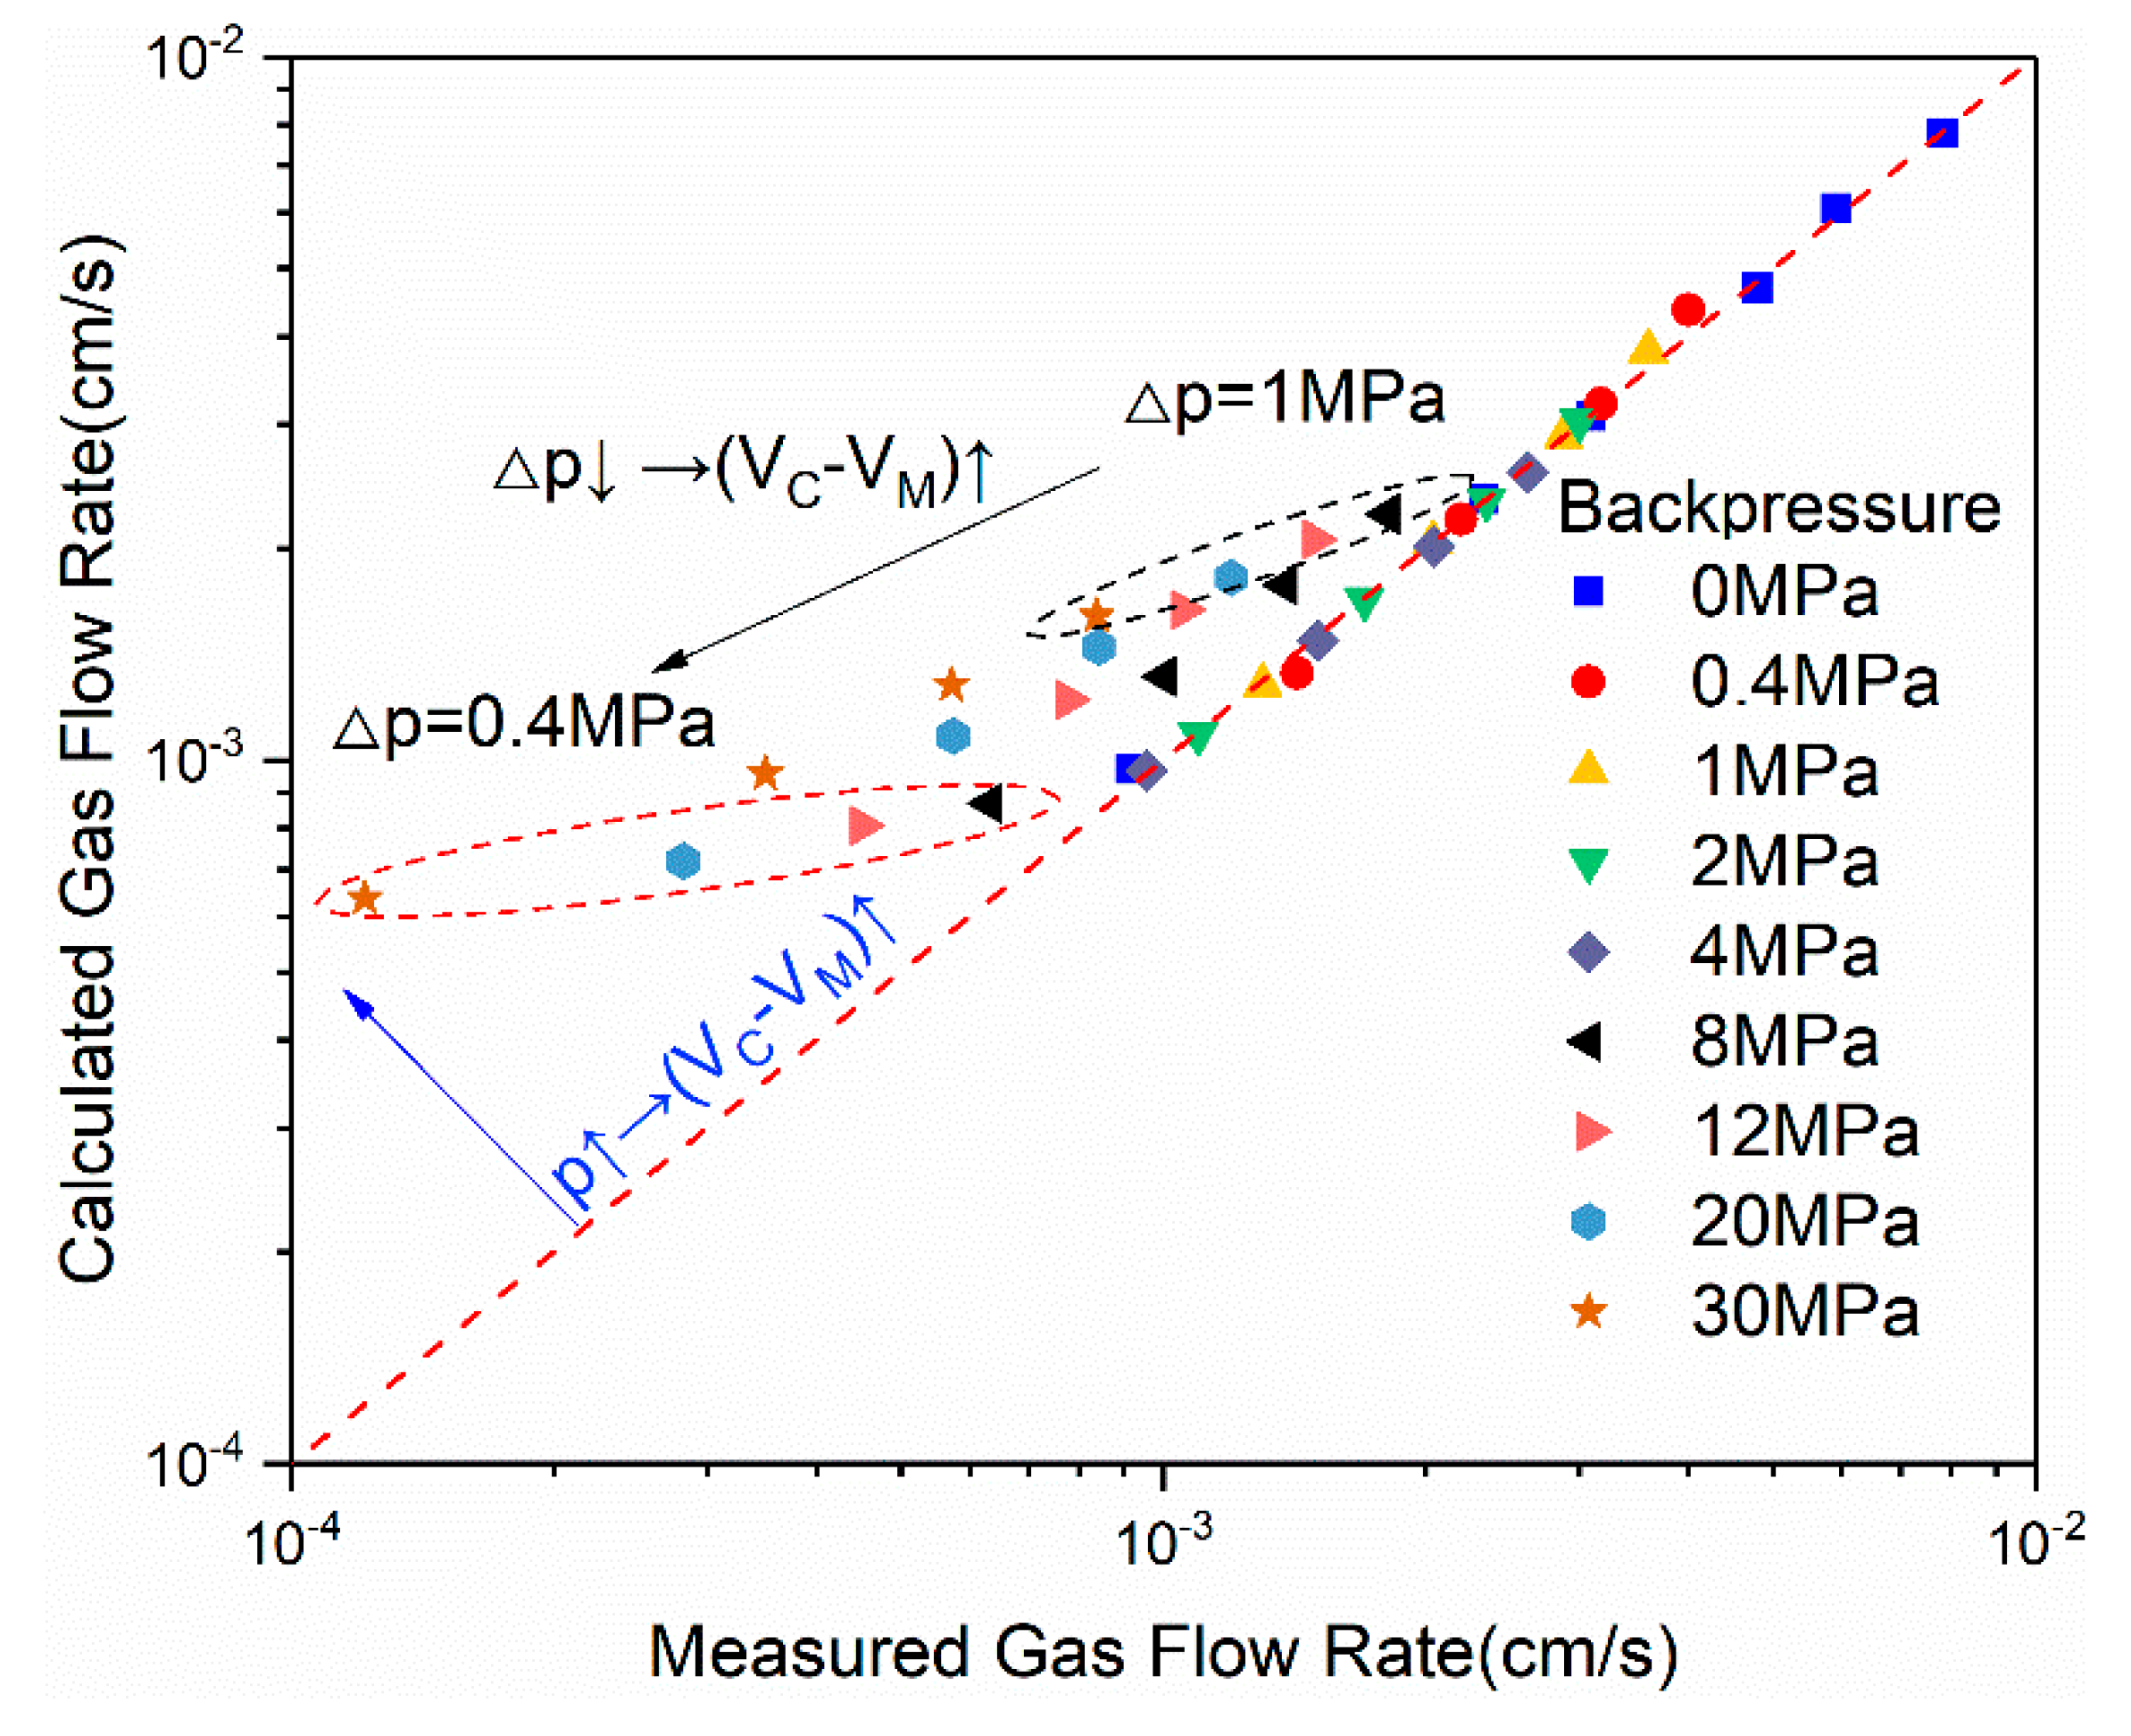
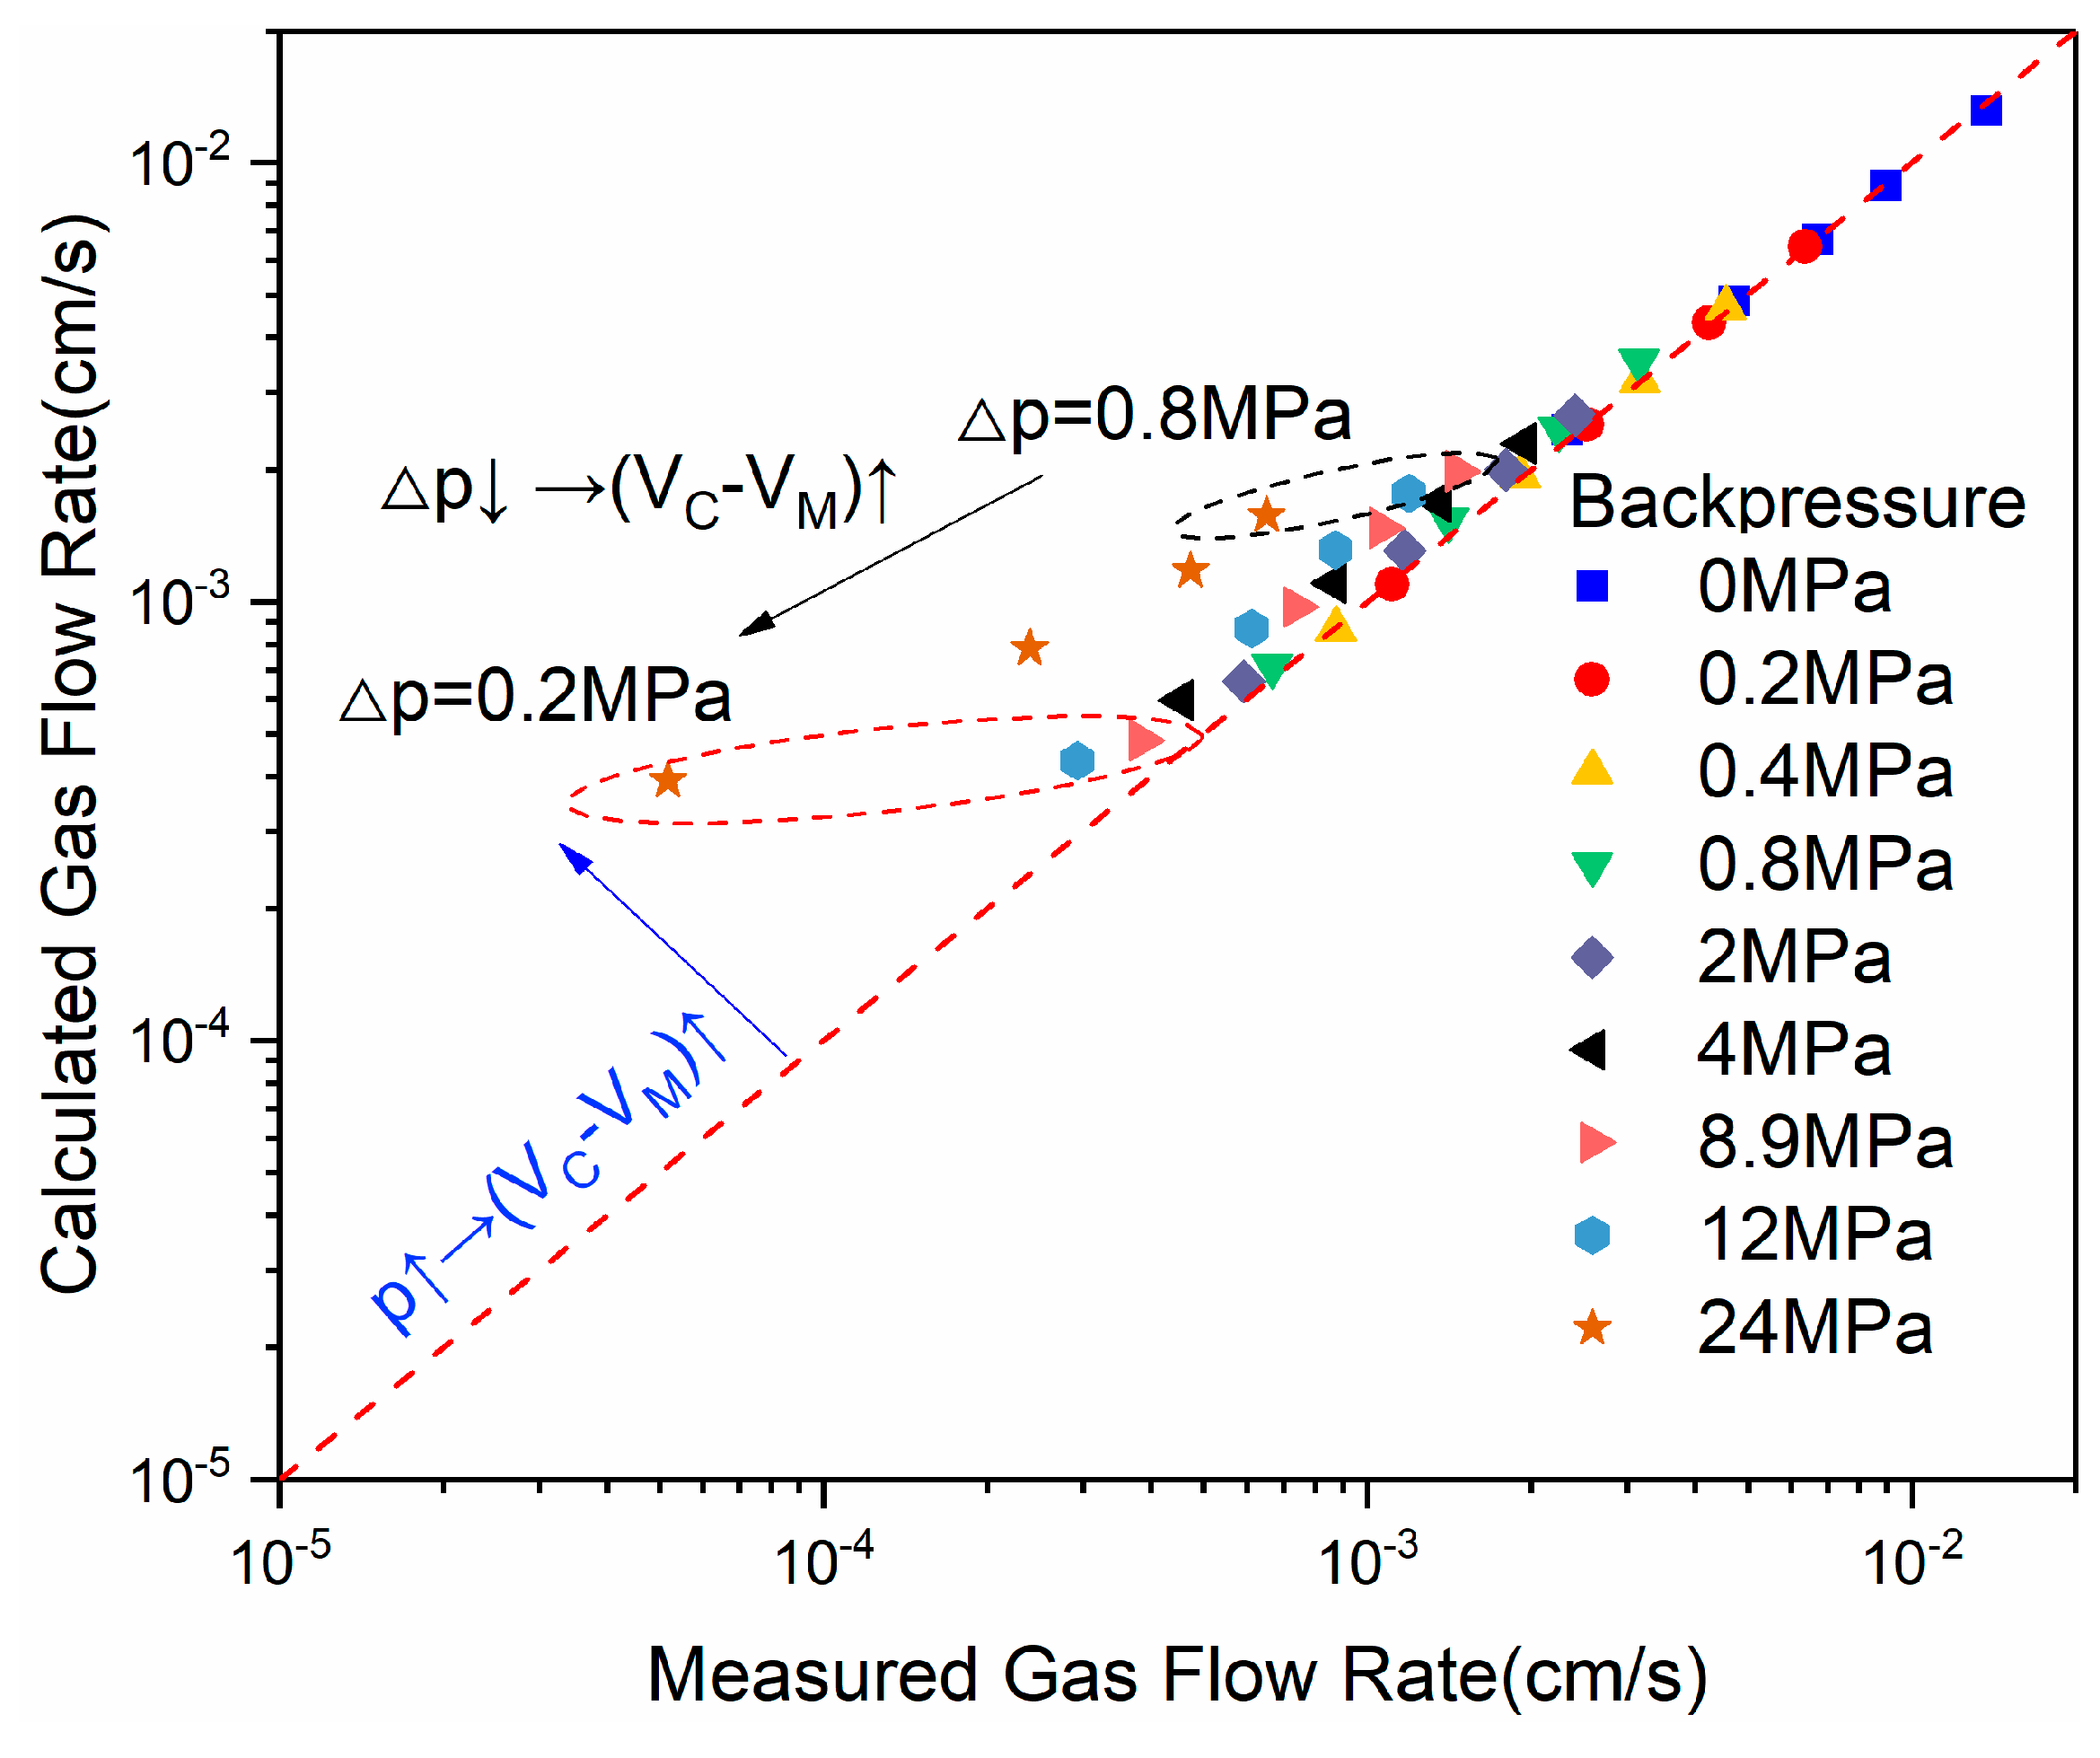
Figure 8, Figure 9, Figure 10 and Figure 11 present the measured flowrate versus theoretical flowrate at different back pressures with cores Z1–Z4, respectively. As can be seen from these figures, the points of different colors represent the relationship between the theoretical flowrate and the measured one under different back pressures, and the red, dashed line represents the case where the measured flowrate was the same as the theoretical flowrate. In Figure 8, the flowrate of the core with a mainstream pore radius of 1.0382 μm calculated by the Klinkenberg slippage theory was equal to the measured one (referring to the experimental results of the back pressure from 0 to 24 MPa), which showed that the Klinkenberg slippage theory is capable of properly estimating the flow capacity of a low-permeability core under both high and low pressure.
As can be seen from Figure 9, Figure 10 and Figure 11, the flowrate calculated by Klinkenberg slippage theory is the same as the measured one under low pressure (see the results in Figure 6 and Figure 7 under back pressure from 0 to 4 MPa and Figure 8 under back pressure from 0 to 1.98 MPa). However, with the increasing back pressure (flowrate declines), the predicted value gradually becomes larger than the actual measured value, and the deviation increases (referring to the results of Figure 6 under back pressure from 11 to 24 MPa, Figure 7 under back pressure from 8 to 30 MPa, and Figure 8 under back pressure from 4 to 24 MPa). The differential pressure within the red, dotted circle is larger than in the black, dotted circle, which indicates that when the back pressure remains same, the smaller the differential pressure (the smaller the flowrate), the larger difference between theory value and actual measured value. It shows that the actual seepage capacity of tight cores under high pressure and low velocity, represented by permeability obtained by Klinkenberg slippage theory, is overestimated. Thus, it is inappropriate to evaluate the actual flow capacity of gas in a tight reservoir using the Klinkenberg permeability, which is calculated by the Klinkenberg equation with low-pressure experimental data.

4. Conclusions and Suggestions

In this study, new high-pressure gas permeability measuring equipment was applied to measure the nitrogen apparent permeability of a low-permeability core and three tight cores under large back-pressure range (0.1–30 MPa) and low differential pressure (0.1–1 MPa).
Unlike the low-permeability core, the permeability of a tight core is not a constant but a function related to the flowrate. The relationship between flowrate and apparent permeability of low-permeability cores is consistent with Klinkenberg slippage theory, nevertheless, the actual gas seepage law in tight cores under high-pressure conflicts with Klinkenberg slippage theory. At high back pressure, the gas flow in the tight core exhibits a “negative slippage” phenomenon. In terms of the apparent permeability, it is falling away from the Klinkenberg permeability significantly in the real situation, instead of getting closer to the Klinkenberg permeability with declining flowrate (increasing back pressure). Besides, the difference becomes larger when the flowrate gets lower (the back pressure gets larger).
Due to the negative slippage of nitrogen in the tight core under high pressure, the apparent permeability of the tight core at high back pressure and low flowrate is much lower than the Klinkenberg permeability obtained by Klinkenberg slippage theory. Therefore, Klinkenberg slippage theory is only applicable to evaluate the seepage capacity within low-permeability reservoirs or tight reservoirs under low pressure. Which means, it is not suitable to use the Klinkenberg permeability obtained by Klinkenberg slippage theory to evaluate the actual seepage capacity of high-pressure gas in tight reservoirs. Hence, in order to accurately evaluate the actual seepage capacity of the gas in a tight reservoir, it is necessary to directly test the permeability of the tight core at a high back pressure and low flowrate.

Author Contributions

Conceptualization, J.Z. and X.Y.; methodology, J.Z.; validation, W.A.; formal analysis, J.Z.; investigation, J.G. and L.W.; writing—original draft preparation, J.Z.; writing—review and editing, X.Y., L.W. and J.G.; project administration, X.Y.; funding acquisition, X.Y.

Funding

This research was funded by the National Natural Science Foundation of China (51334007), the National Science and Technology Major Projects (2017ZX05009-004), and National Science and Technology Major Projects (2016ZX05050012).

Conflicts of Interest

The authors declare no conflict of interest.

References

  1. Yuko, K.; Kazuo, F. Some Predictions of Possible Unconventional Hydrocarbons Availability Until 2100. In Proceedings of the SPE Asia Pacific Oil and Gas Conference and Exhibition, Jakarta, Indonesia, 17–19 April 2001; pp. 1–10. [Google Scholar] [CrossRef]
  2. Jia, C.Z.; Zou, C.N.; Li, J.Z.; Li, D.H.; Zheng, M. China’s tight oil evaluation criteria, main types, basic characteristics and resource prospects. J. Pet. 2012, 33, 343–350. [Google Scholar]
  3. Wang, L.; Tian, Y.; Yu, X.Y.; Wang, C.; Yao, B.W.; Wang, S.H.; Winterfeld, P.H.; Wang, X.; Yang, Z.Z.; Wang, Y.H.; et al. Advances in improved/enhanced oil recovery technologies for tight and shale reservoirs. Fuel 2017, 210, 425–445. [Google Scholar] [CrossRef]
  4. Velasco, R.; Panja, P.; Pathak, M.; Deo, M. Analysis of North-American Tight oil production. AICHE J. 2018, 64, 1479–1484. [Google Scholar] [CrossRef]
  5. Hu, S.Y.; Zhu, R.K.; Wu, S.T.; Bai, B.; Yang, Z.; Cui, J.W. Exploration and development of the benefits of China’s terrestrial tight oil under the background of low oil prices. Exp. Dev. 2018, 45, 1–12. [Google Scholar] [CrossRef]
  6. Yu, W.; Lashgari, H.R.; Wu, K.; Sepehrnoori, K. CO2 injection for enhanced oil recovery in bakken tight oil reservoirs. Fuel 2015, 159, 354–363. [Google Scholar] [CrossRef]
  7. Wang, X.Z.; Peng, X.L.; Zhang, S.J.; Du, Z.W.; Zeng, F.H. Characteristics of oil distributions in forced and spontaneous imbibition of tight oil reservoir. Fuel 2018, 224, 280–288. [Google Scholar] [CrossRef]
  8. Kathel, P.; Mohanty, K.K. Wettability Alteration in a Tight Oil Reservoir. Energy Fuels 2013, 27, 6460–6468. [Google Scholar] [CrossRef]
  9. Huang, S.; Yao, Y.D.; Zhang, S.; Ji, J.H.; Ma, R.Y. A Fractal Model for Oil Transport in Tight Porous Media. Transp. Porous Med. 2018, 121, 725–739. [Google Scholar] [CrossRef]
  10. Wan, T.; Yang, S.L.; Wang, L.; Sun, L.T. Experimental investigation of two-phase relative permeability of gas and water for tight gas carbonate under different test conditions. Oil Gas Sci. Technol. 2019, 74, 1–9. [Google Scholar] [CrossRef]
  11. Ghanbarian, B.; Torres-Verdín, C.W.; Lake, L.; Marder, M. Gas permeability in unconventional tight sandstones: Scaling up from pore to core. J. Pet. Sci. Eng. 2018, 173, 1163–1172. [Google Scholar] [CrossRef] [Green Version]
  12. Nelson, P. Pore-throat sizes in sandstones, tight sandstones, and shales. AAPG 2009, 93, 329–340. [Google Scholar] [CrossRef]
  13. Liu, Y.M.; Shen, B.; Yang, Z.Q.; Zhao, P.Q. Pore Structure Characterization and the Controlling Factors of the Bakken Formation. Energies 2018, 11, 2879. [Google Scholar] [CrossRef]
  14. Yao, J.L.; Deng, X.Q.; Zhao, Y.D.; Han, T.Y.; Chu, M.J.; Pang, J.L. Characteristics of tight oil in the Yanchang Formation of the Ordos Basin. Pet. Explor. Dev. 2013, 40, 150–158. [Google Scholar] [CrossRef]
  15. Gao, H.; Li, H.A. Pore structure characterization, permeability evaluation and enhanced gas recovery techniques of tight gas sandstones. J. Nat. Gas Sci. Eng. 2016, 28, 536–547. [Google Scholar] [CrossRef]
  16. Maxwell, J.C. On Stresses in Rarified Gases Arising from Inequalities of Temperature. Philos. Trans. R. Soc. Lond. 1879, 170, 231–256. [Google Scholar] [CrossRef]
  17. Nazari Moghaddam, R.; Jamiolahmady, M. Slip flow in porous media. Fuel 2016, 173, 298–310. [Google Scholar] [CrossRef]
  18. Wang, H.L.; Xu, W.Y.; Cai, M.; Zuo, J. An Experimental Study on the Slippage Effect of Gas Flow in a Compact Rock. Transp. Porous Med. 2016, 112, 117–137. [Google Scholar] [CrossRef]
  19. Rubin, C.; Zamirian, M.; Takbiri-Borujeni, A.; Gu, M. Investigation of gas slippage effect and matrix compaction effect on shale gas production evaluation and hydraulic fracturing design based on experiment and reservoir simulation. Fuel 2019, 241, 12–24. [Google Scholar] [CrossRef]
  20. Ziarani, A.S.; Aguilera, R. Knudsen’s Permeability Correction for Tight Porous Media. Transp. Porous Med. 2012, 91, 239–260. [Google Scholar] [CrossRef]
  21. Zhang, W.M.; Meng, G.; Wei, X.Y. A review on slip models for gas microflows. Microfluid Nanofluid 2012, 13, 845–882. [Google Scholar] [CrossRef]
  22. Sun, F.R.; Yao, Y.D.; Li, G.Z.; Dong, M.D. Transport behaviors of real gas mixture through nanopores of shale reservoir. J. Pet. Sci. Eng. 2019, 177, 1134–1141. [Google Scholar] [CrossRef]
  23. Darabi, H.; Ettehad, A.; Javadpour, F.; Sepehrnoori, K. Gas flow in ultra-tight shale strata. J. Fluid Mech. 2012, 710, 641–658. [Google Scholar] [CrossRef]
  24. Klinkenberg, L.J. The permeability of porous media to liquids and gases. Am. Pet. Inst. 1941, 2, 200–213. [Google Scholar] [CrossRef]
  25. Kundt, A.; Warburg, E. Poggendorfs. Annu. Rev. Plant Physiol. Plant Mol. 1875, 155, 337–525. [Google Scholar]
  26. Roy, S.; Raju, R.; Chuang, H.F.; Cruden, B.A.; Meyyappan, M. Modeling gas flow through microchannels and nanopores. J. Appl. Phys. 2003, 93, 4870–4879. [Google Scholar] [CrossRef]
  27. Kazemi, M.; Takbiri-Borujeni, A. An analytical model for shale gas permeability. Int. J. Coal Geol. 2015, 146, 188–197. [Google Scholar] [CrossRef]
  28. Pizio, O.; Sokołowski, S.; Sokołowska, Z. Electric double layer capacitance of restricted primitive model for an ionic fluid in slit-like nanopores: A density functional approach. J. Chem. Phys. 2012, 137, 175002–175124. [Google Scholar] [CrossRef]
  29. Manby, F.R.; Stella, M.; Goodpaster, J.D.; Miller, T.F. A Simple, Exact Density-Functional-Theory Embedding Scheme. J. Chem. Theory Comput. 2012, 8, 2564–2568. [Google Scholar] [CrossRef] [Green Version]
  30. Javadpour, F. Nanopores and Apparent Permeability of Gas Flow in Mudrocks (Shales and Siltstone). J. Can. Pet. Technol. 2009, 48, 16–21. [Google Scholar] [CrossRef]
  31. Javadpour, F.; Singh, H. Langmuir slip-Langmuir sorption permeability model of shale. Fuel 2016, 164, 28–37. [Google Scholar] [CrossRef]
  32. Singh, H.; Javadpour, F. Nonempirical Apparent Permeability of Shale. In Proceedings of the Unconventional Resources Technology Conference, Denver, CO, USA, 12–14 August 2013. [Google Scholar]
  33. Wang, H.Y.; Matteo, M.P. A Unified Model of Matrix Permeability in Shale Gas Formations. In Proceedings of the SPE Reservoir Simulation Symposium, Houston, TX, USA, 23–25 February 2015. [Google Scholar]
  34. Cai, J.; Lin, D.; Singh, H.; Wei, W.; Zhou, S. Shale gas transport model in 3D fractal porous media with variable pore sizes. Mar. Pet. Geol. 2018, 98, 437–447. [Google Scholar] [CrossRef]
  35. Singh, H.; Cai, J. A feature-based stochastic permeability of shale: Part 1—Validation and two-phase permeability in a utica shale sample. Transp. Porous Med. 2018, 126, 527–560. [Google Scholar] [CrossRef]
  36. Singh, H.; Cai, J. A feature-based stochastic permeability of shale: Part 2—Predicting Field-Scale Permeability. Transp. Porous Med. 2019, 126, 561–578. [Google Scholar] [CrossRef]
  37. Lopez, B.; Aguilera, R. Sorption-Dependent Permeability of Shales. In Proceedings of the SPE/C SUR Unconventional Resources Conference, Calgary, AB, Canada, 20–22 October 2015. [Google Scholar]
  38. Chen, L.; Zhang, L.; Kang, Q.; Viswanathan, H.S.; Yao, J.; Tao, W. Nanoscale simulation of shale transport properties using the lattice Boltzmann method: Permeability and diffusivity. Sci. Rep. 2015, 5, 8089. [Google Scholar] [CrossRef]
  39. Civan, F. Effective Correlation of Apparent Gas Permeability in Tight Porous Media. Transp. Porous Med. 2010, 82, 375–384. [Google Scholar] [CrossRef]
  40. Civan, F.; Rai, C.; Sondergeld, C. Shale-Gas Permeability and Diffusivity Inferred by Improved Formulation of Relevant Retention and Transport Mechanisms. Transp. Porous Med. 2011, 86, 925–944. [Google Scholar] [CrossRef]
  41. Jones, F.O.; Owens, W.W. A Laboratory Study of Low-Permeability Gas Sands. Soc. Pet. Eng. 1980, 32, 1631–1640. [Google Scholar] [CrossRef]
  42. Rushing, J.A.; Newsham, K.E.; Lasswell, P.M.; Cox, J.C.; Balsingame, T.A. Klinkenberg-Corrected Permeability Measurements in Tight Gas Sands: Steady-State versus Unsteady-State Techniques. In Proceedings of the SPE Annual Technical Conference and Exhibition, Houston, TX, USA, 26–29 September 2004. [Google Scholar] [CrossRef]
  43. Zhu, G.Y.; Liu, L.; Yang, Z.M.; Liu, X.G.; Guo, Y.G.; Cui, Y.T. Experiment and Mathematical Model of Gas Flow in Low Permeability Porous Media. In Proceedings of the Fifth International Conference on Fluid Mechanics, Shanghai, China, 15–19 August 2007; pp. 534–537. [Google Scholar]
  44. Li, S.; Dong, M.; Li, Z. Measurement and revised interpretation of gas flow behavior in tight reservoir cores. J. Pet. Sci. Eng. 2009, 65, 81–88. [Google Scholar] [CrossRef]
  45. Dong, M.Z.; Li, Z.W.; Li, S.L.; Yao, J. Permeabilities of tight reservoir cores determined for gaseous and liquid CO2 and C2H6 using minimum backpressure method. J. Nat. Gas Sci. Eng. 2012, 5, 1–5. [Google Scholar] [CrossRef]
  46. Fathi, E.; Tinni, A.; Akkutlu, I.Y. Correction to Klinkenberg slip theory for gas flow in nano-capillaries. Int. J. Coal Geol. 2012, 103, 51–59. [Google Scholar] [CrossRef]
  47. You, L.J.; Xue, K.L.; Kang, Y.L.; Liao, Y.; Kong, L. Pore Structure and Limit Pressure of Gas Slippage Effect in Tight Sandstone. Sci. World J. 2013, 2013, 1–7. [Google Scholar] [CrossRef] [Green Version]
  48. Tanikawa, W.; Shimamoto, T. Comparison of Klinkenberg-corrected gas permeability and water permeability in sedimentary rocks. Int. J. Rock Mech. Min. Sci. 2009, 46, 229–238. [Google Scholar] [CrossRef]
  49. Salam, D.D. Novel Analysis to Determine Gas Permeability. In Proceedings of the SPE Annual Technical Conference and Exhibition, Houston, TX, USA, 28–30 September 2015. [Google Scholar] [CrossRef]
  50. Yue, X.A.; Wei, H.G.; Zhang, L.J.; Zhao, R.B.; Zhao, Y.P. Low Pressure Gas Percolation Characteristic in Ultra-low Permeability Porous Media. Transp. Porous Med. 2010, 85, 333–345. [Google Scholar] [CrossRef]
  51. Liu, G.F.; Fan, Z.Q.; Lu, Y.; Li, S.Y.; Feng, B.; Xia, Y.; Zhao, Q.M. Experimental Determination of Gas Relative Permeability Considering Slippage Effect in a Tight Formation. Energies 2018, 11, 467. [Google Scholar] [CrossRef]
  52. Moghadam, A.A.; Chalaturnyk, R. Expansion of the Klinkenberg’s slippage equation to low permeability porous media. Int. J. Coal Geol. 2014, 123, 2–9. [Google Scholar] [CrossRef]
  53. Tang, G.H.; Tao, W.Q.; He, Y.L. Gas slippage effect on microscale porous flow using the lattice Boltzmann method. Phys. Rev. E Stat. Nonlin. Soft Matter. Phys. 2005, 72, 56301. [Google Scholar] [CrossRef]
  54. An, W.Q.; Yue, X.A.; Feng, X.G.; Fang, X. The deviation of gas permeability and classical theory in tight reservoir cores with high pressure. J. Nat. Gas Sci. Eng. 2016, 30, 331–337. [Google Scholar] [CrossRef]
  55. Sinha, S.; Braun, E.M.; Determan, M.D.; Passey, Q.R.; Leonardi, S.A.; Boros, J.A.; Wood, A.C.; Zirkle, T.; Kudva, R.A. Steady-State Permeability Measurements on Intact Shale Samples at Reservoir Conditions—Effect of Stress, Temperature, Pressure, and Type of Gas. In Proceedings of the SPE Middle East Oil and Gas Show and Conference, Manama, Bahrain, 10–13 March 2013. [Google Scholar] [CrossRef]
  56. An, W.Q.; Yue, X.A.; Feng, X.G.; Fu, J.; Fang, X.; Zou, J.R.; Fang, W. Non-Klinkenberg slippage phenomenon at high pressure for tight core floods using a novel high pressure gas permeability measurement system. J. Pet. Sci. Eng. 2017, 156, 62–66. [Google Scholar] [CrossRef]
  57. Sander, R.; Pan, Z.; Connell, L.D. Laboratory measurement of low permeability unconventional gas reservoir rocks: A review of experimental methods. J. Nat. Gas Sci. Eng. 2017, 37, 248–279. [Google Scholar] [CrossRef]
  58. Moghadam, A.A.; Chalaturnyk, R. Rate dependency of permeability in tight rocks. J. Nat. Gas Sci. Eng. 2017, 40, 208–225. [Google Scholar] [CrossRef]
  59. Cole, W.A.; Wakeham, W.A. The Viscosity of Nitrogen, Oxygen, and Their Binary Mixtures in the Limit of Zero Density. J. Phys. Chem. Ref. Data 1985, 14, 209–226. [Google Scholar] [CrossRef]
  60. Latto, B.; Saunders, M.W. Viscosity of Nitrogen Gas at Low Temperatures Up to High Pressures: A New Appraisal. Can. Ioicrnal Chem. Eng. 1972, 50, 765–770. [Google Scholar] [CrossRef]
  61. Fang, X.; Yue, X.A.; An, W.Q.; Feng, X.G. Experimental study of gas flow characteristics in micro-/nano-pores in tight and shale reservoirs using microtubes under high pressure and low pressure gradients. Microfluid Nanofluid 2019, 23, 5. [Google Scholar] [CrossRef]
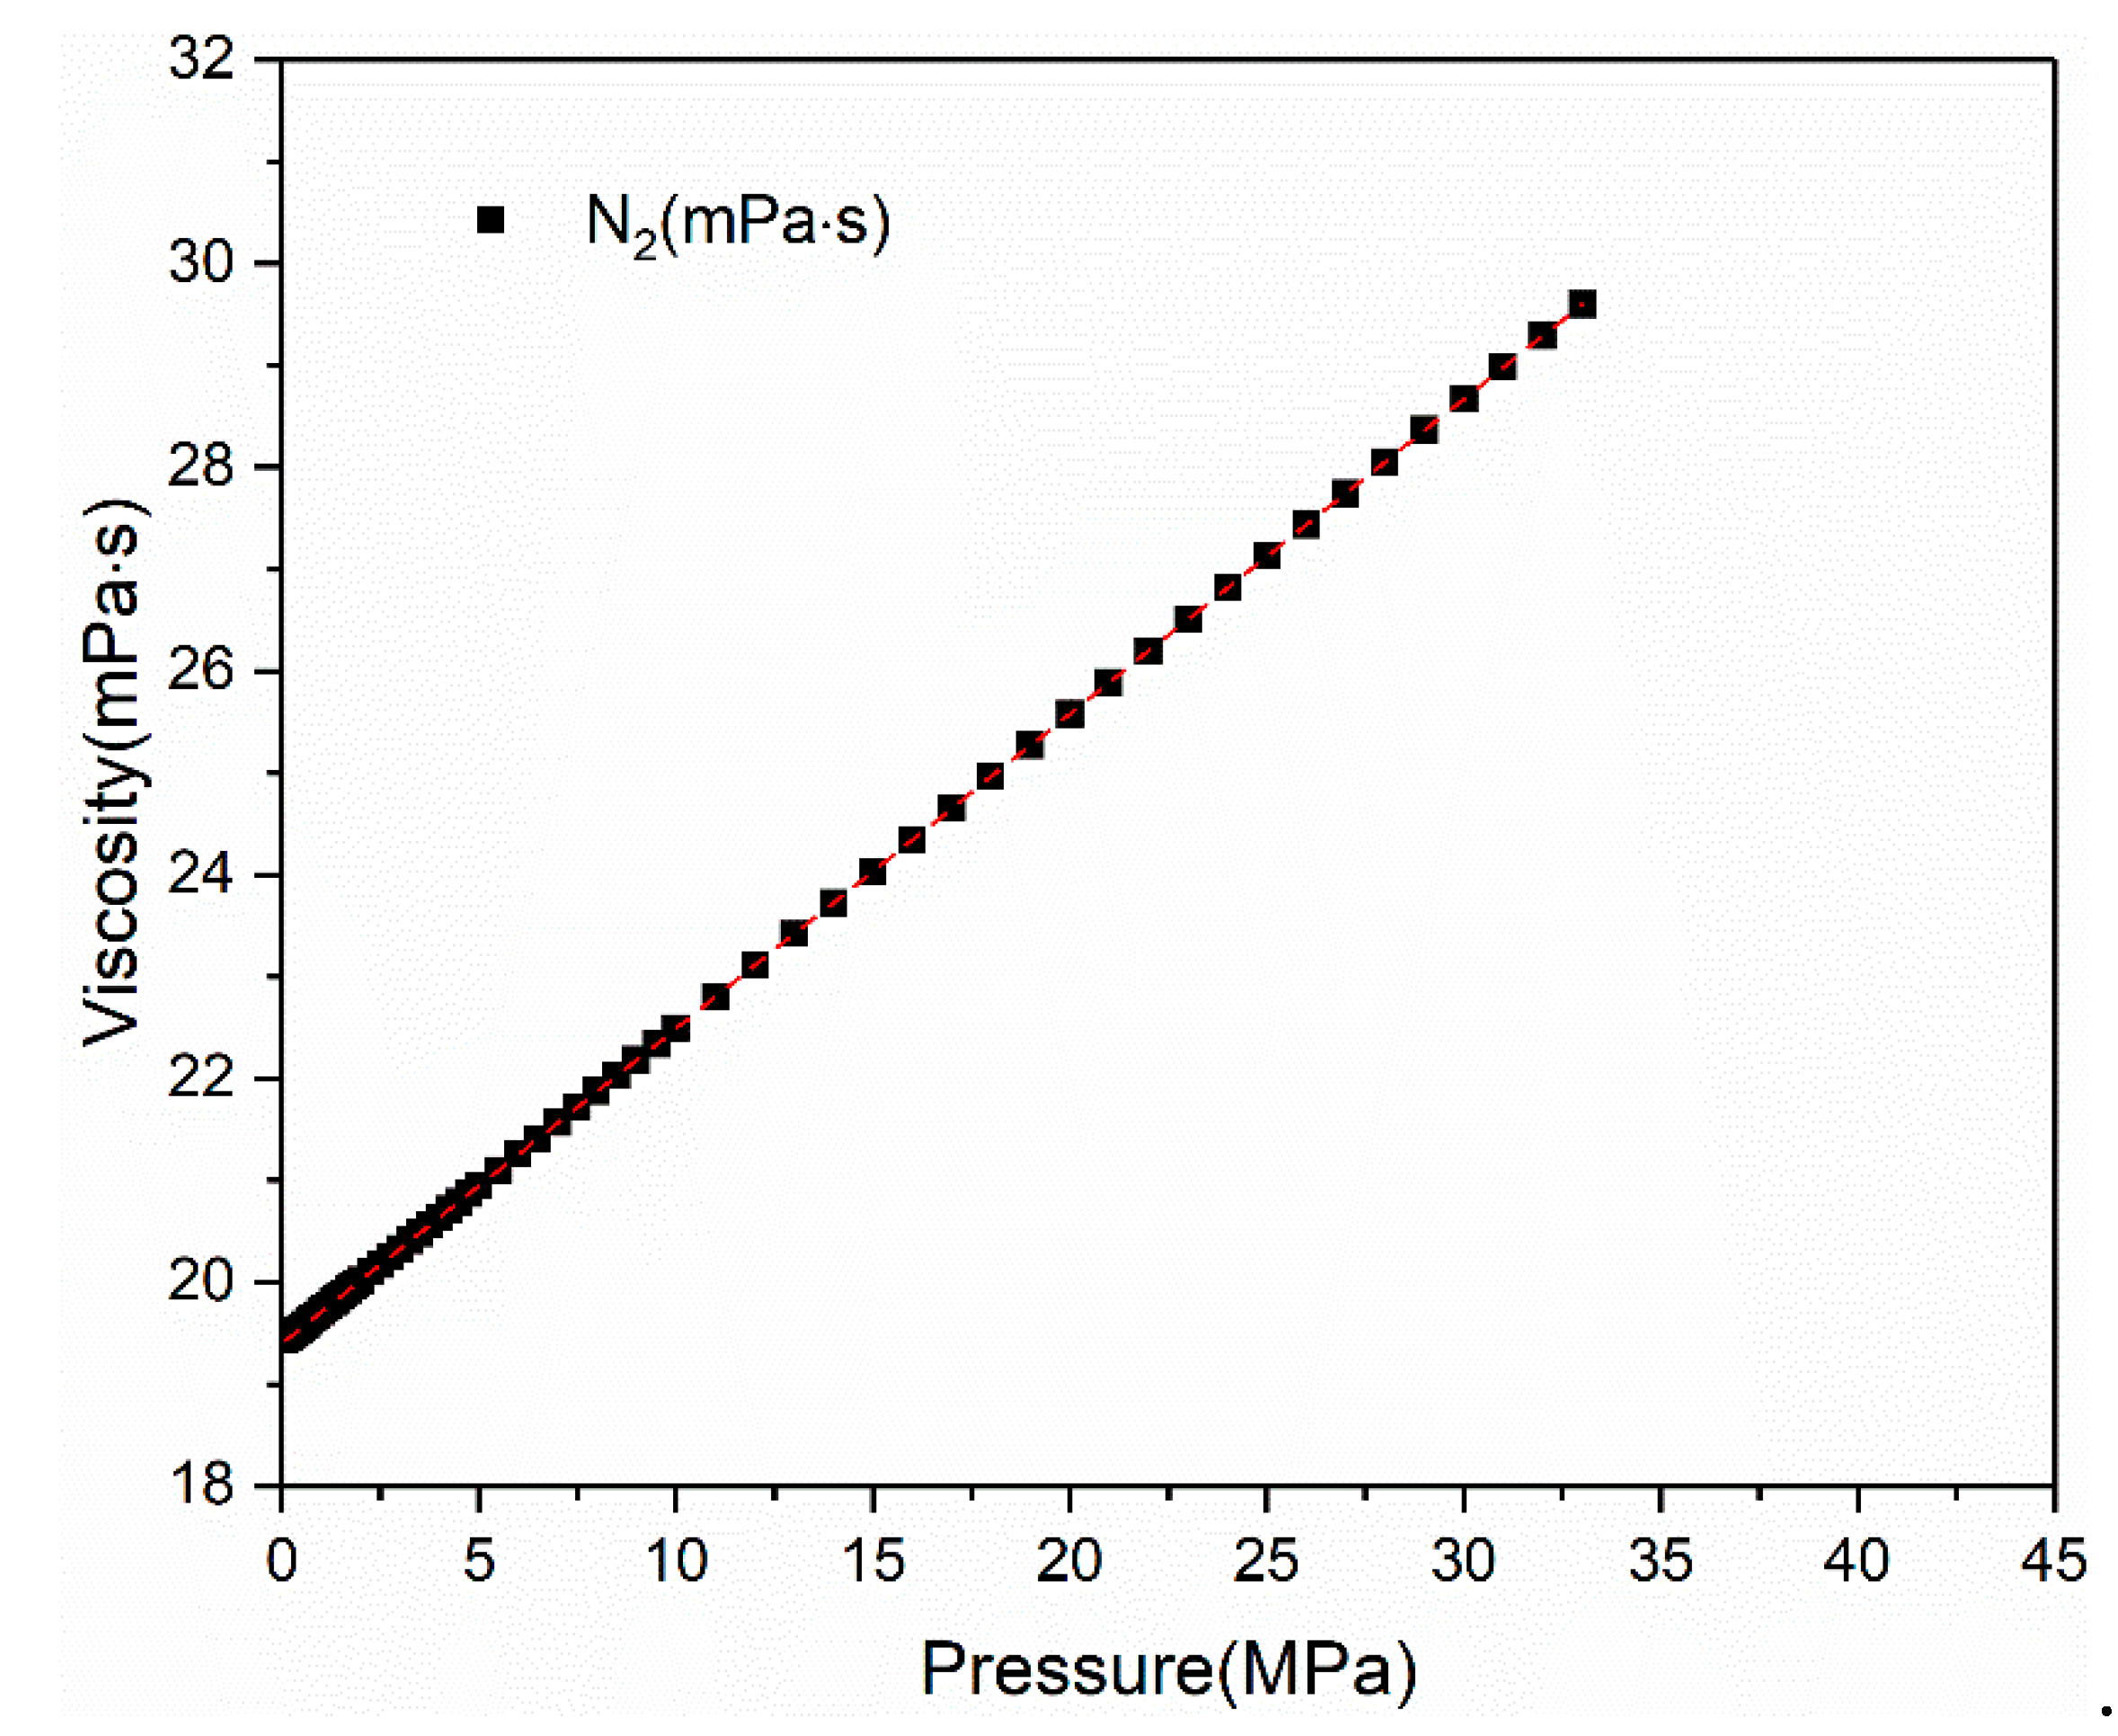
Figure 1. Viscosity of nitrogen as a function of pressure.
Energies 12 02351 g001
Figure 2. Schematic diagram of the experimental device.
Energies 12 02351 g002
Figure 3. Relationships between throat size and permeability contribution.
Energies 12 02351 g003
Figure 4. Permeability versus flowrate at diverse backpressures for core Z1.
Energies 12 02351 g004
Figure 5. Permeability versus flowrate at diverse backpressures for core Z2.
Energies 12 02351 g005
Figure 6. Permeability versus flowrate at diverse backpressures for core Z3.
Energies 12 02351 g006
Figure 7. Permeability versus flowrate at diverse backpressures for core Z4.
Energies 12 02351 g007
Figure 8. Measured flowrate versus theoretical flowrate at diverse backpressures for core Z1.
Energies 12 02351 g008
Figure 9. Measured flowrate versus theoretical flowrate at diverse backpressures for core Z2.
Energies 12 02351 g009
Figure 10. Measured flowrate versus theoretical flowrate at diverse backpressures for core Z3.
Energies 12 02351 g010
Figure 11. Measured flowrate versus theoretical flowrate at diverse backpressures for core Z4.
Energies 12 02351 g011
Table 1. The base data of experiment cores.
Core NumberLength
(cm)
Diameter
(cm)
Porosity
(%)
Dominated Throat Radius
(μm)
Rock Type
Z110.782.5020.571.0382Sandstone
Z27.462.5010.500.1224Sandstone
Z34.092.5111.300.2480Sandstone
Z46.262.529.800.2477Sandstone