Numerical Simulation Investigation on the Windage Power Loss of a High-Speed Face Gear Drive


Abstract
:1. Introduction
2. Methods of Calculating the Tooth Surface Equation and Conducting Simulations
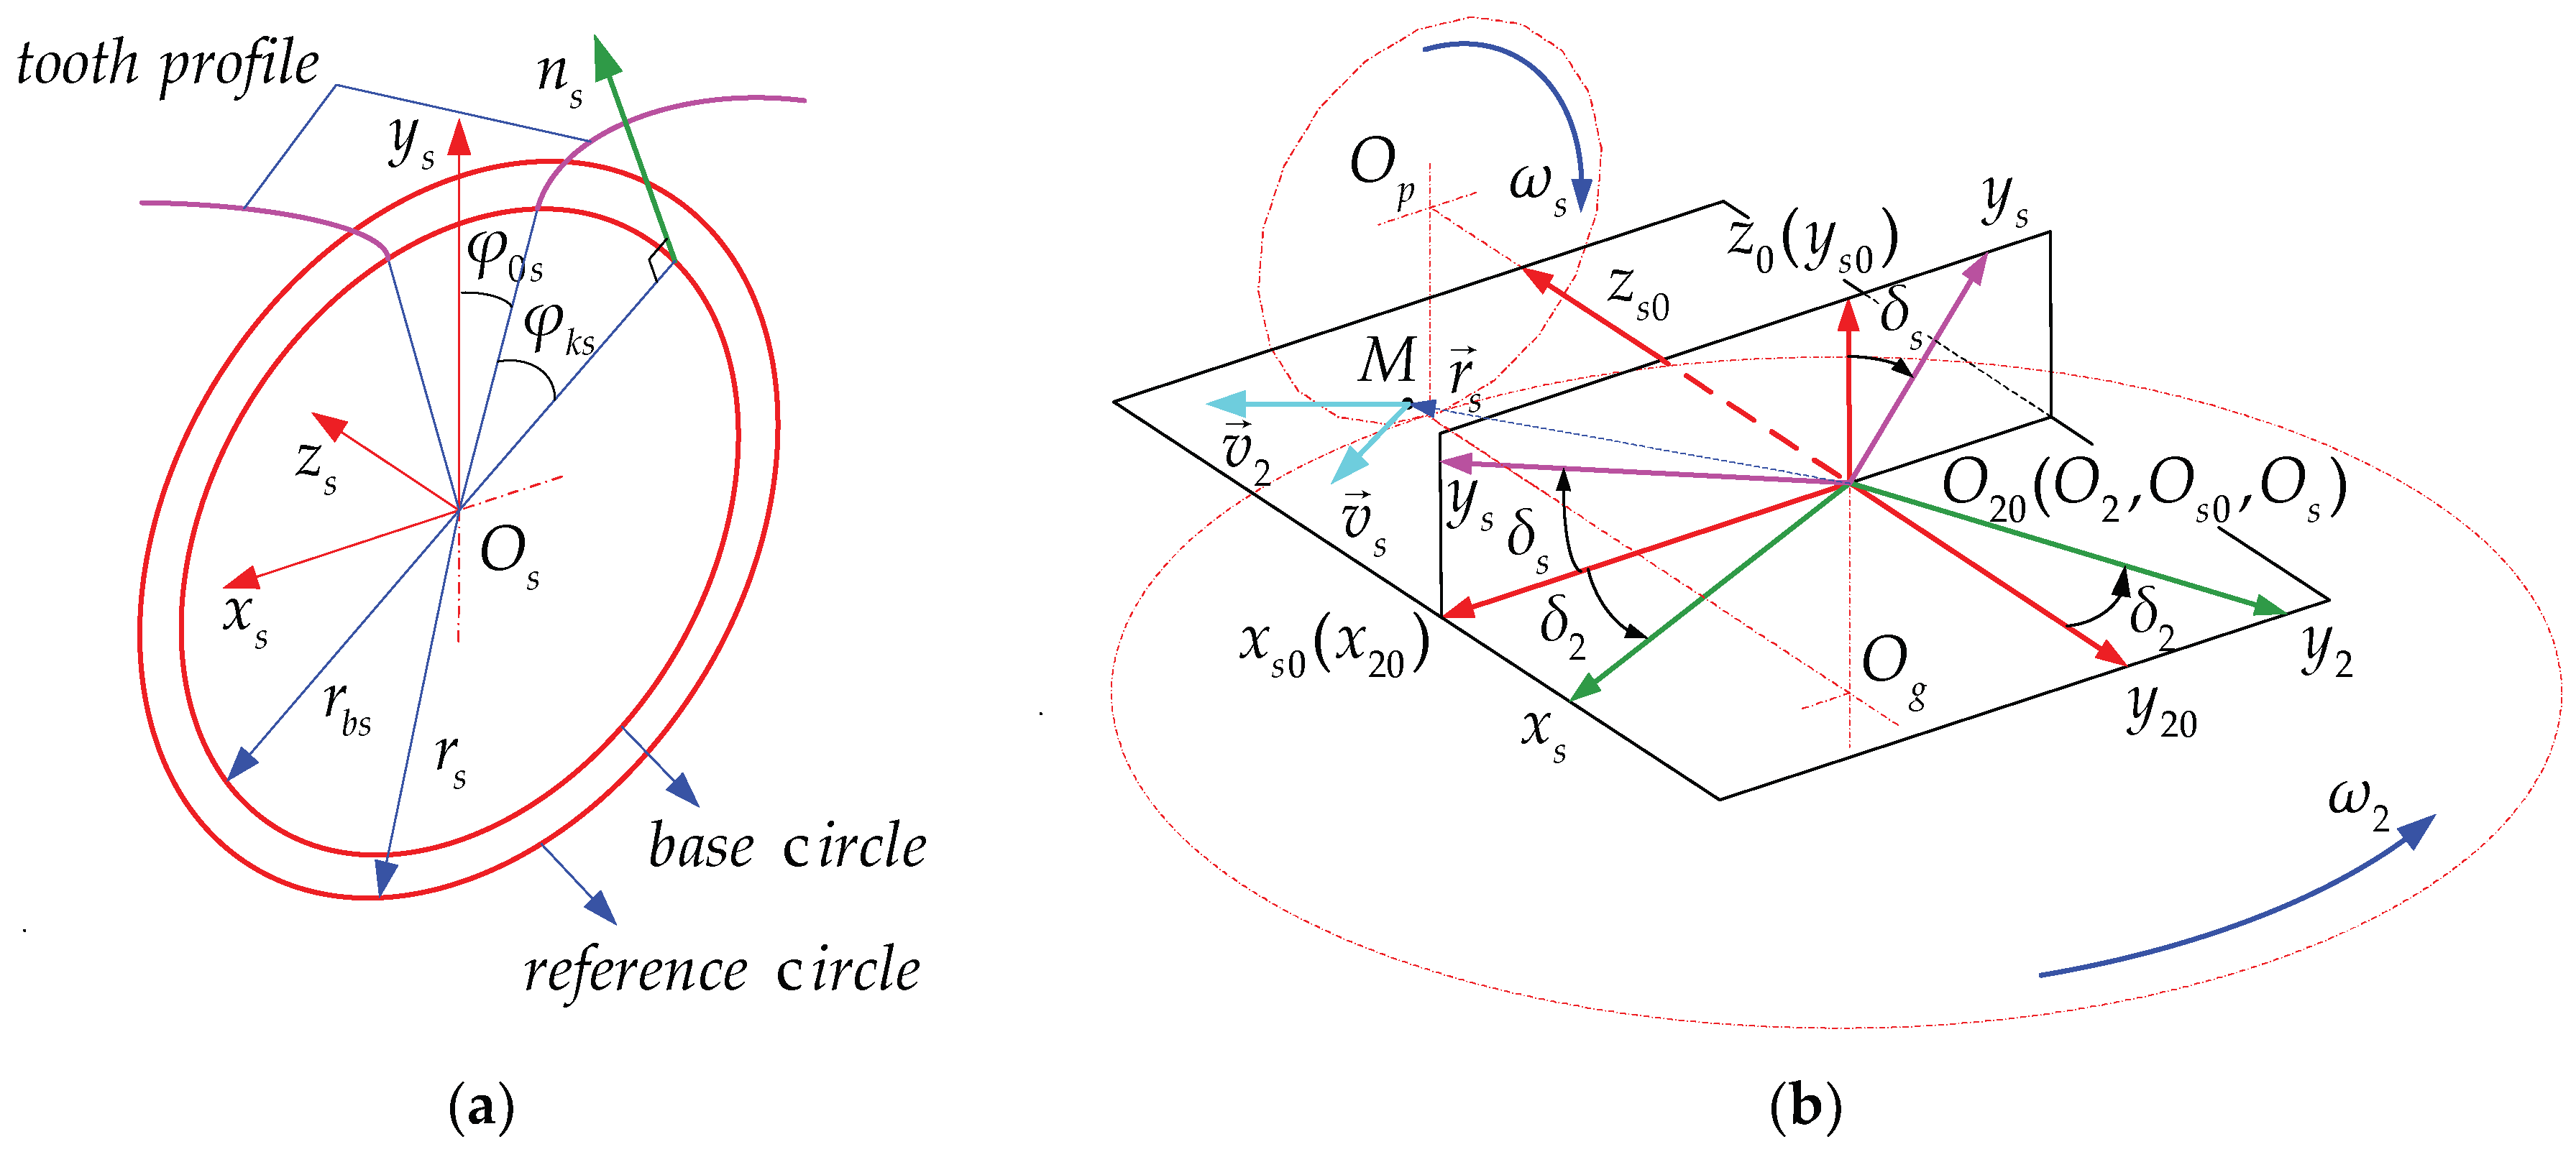
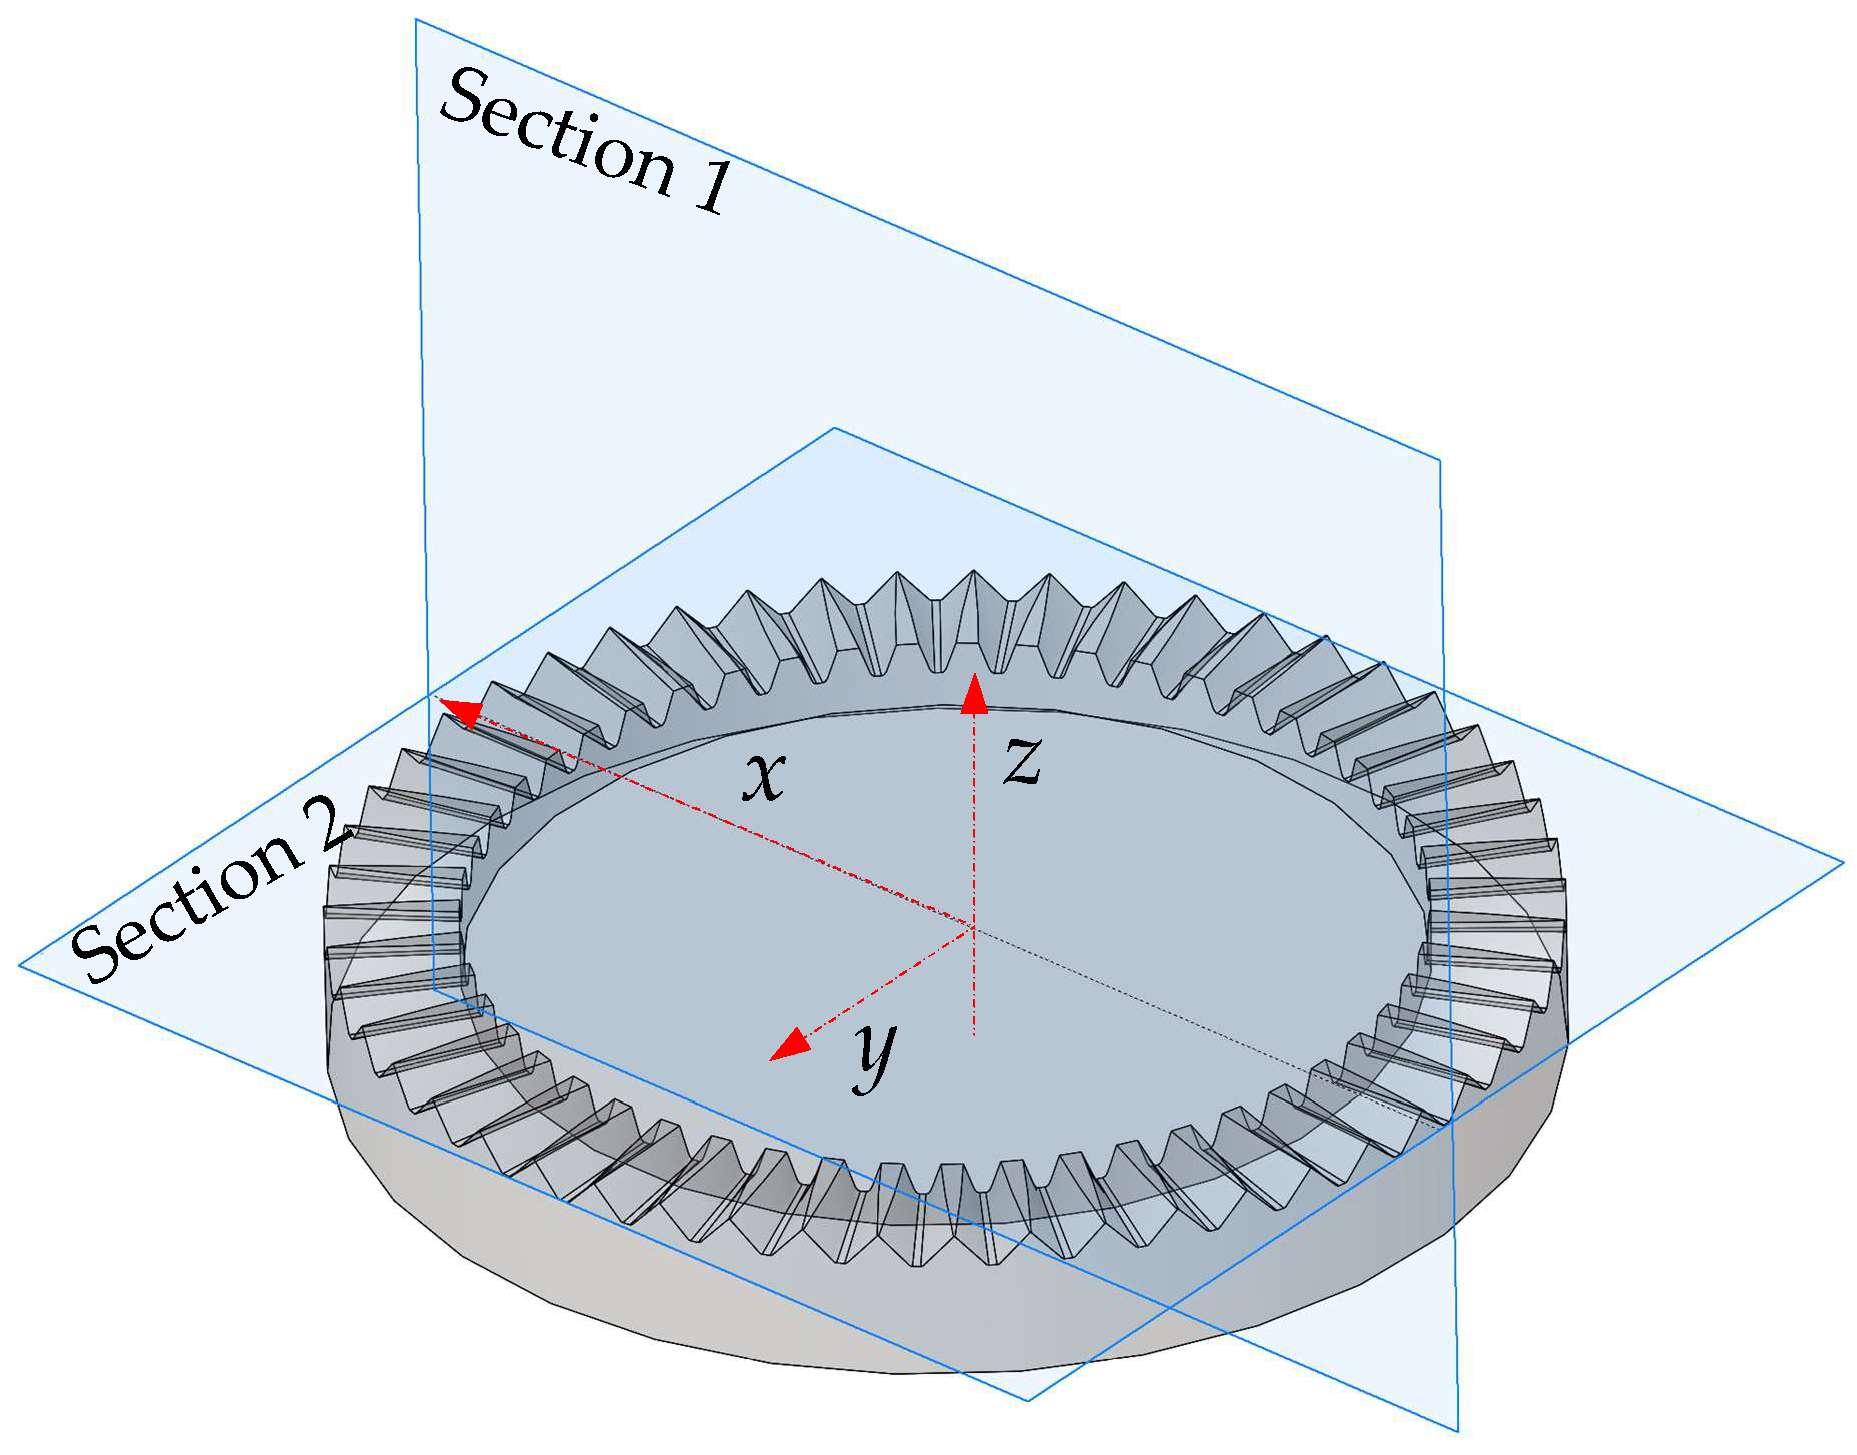
2.1. Tooth Surface Equation
2.2. Fluid Governing Equation
3. CFD Simulation
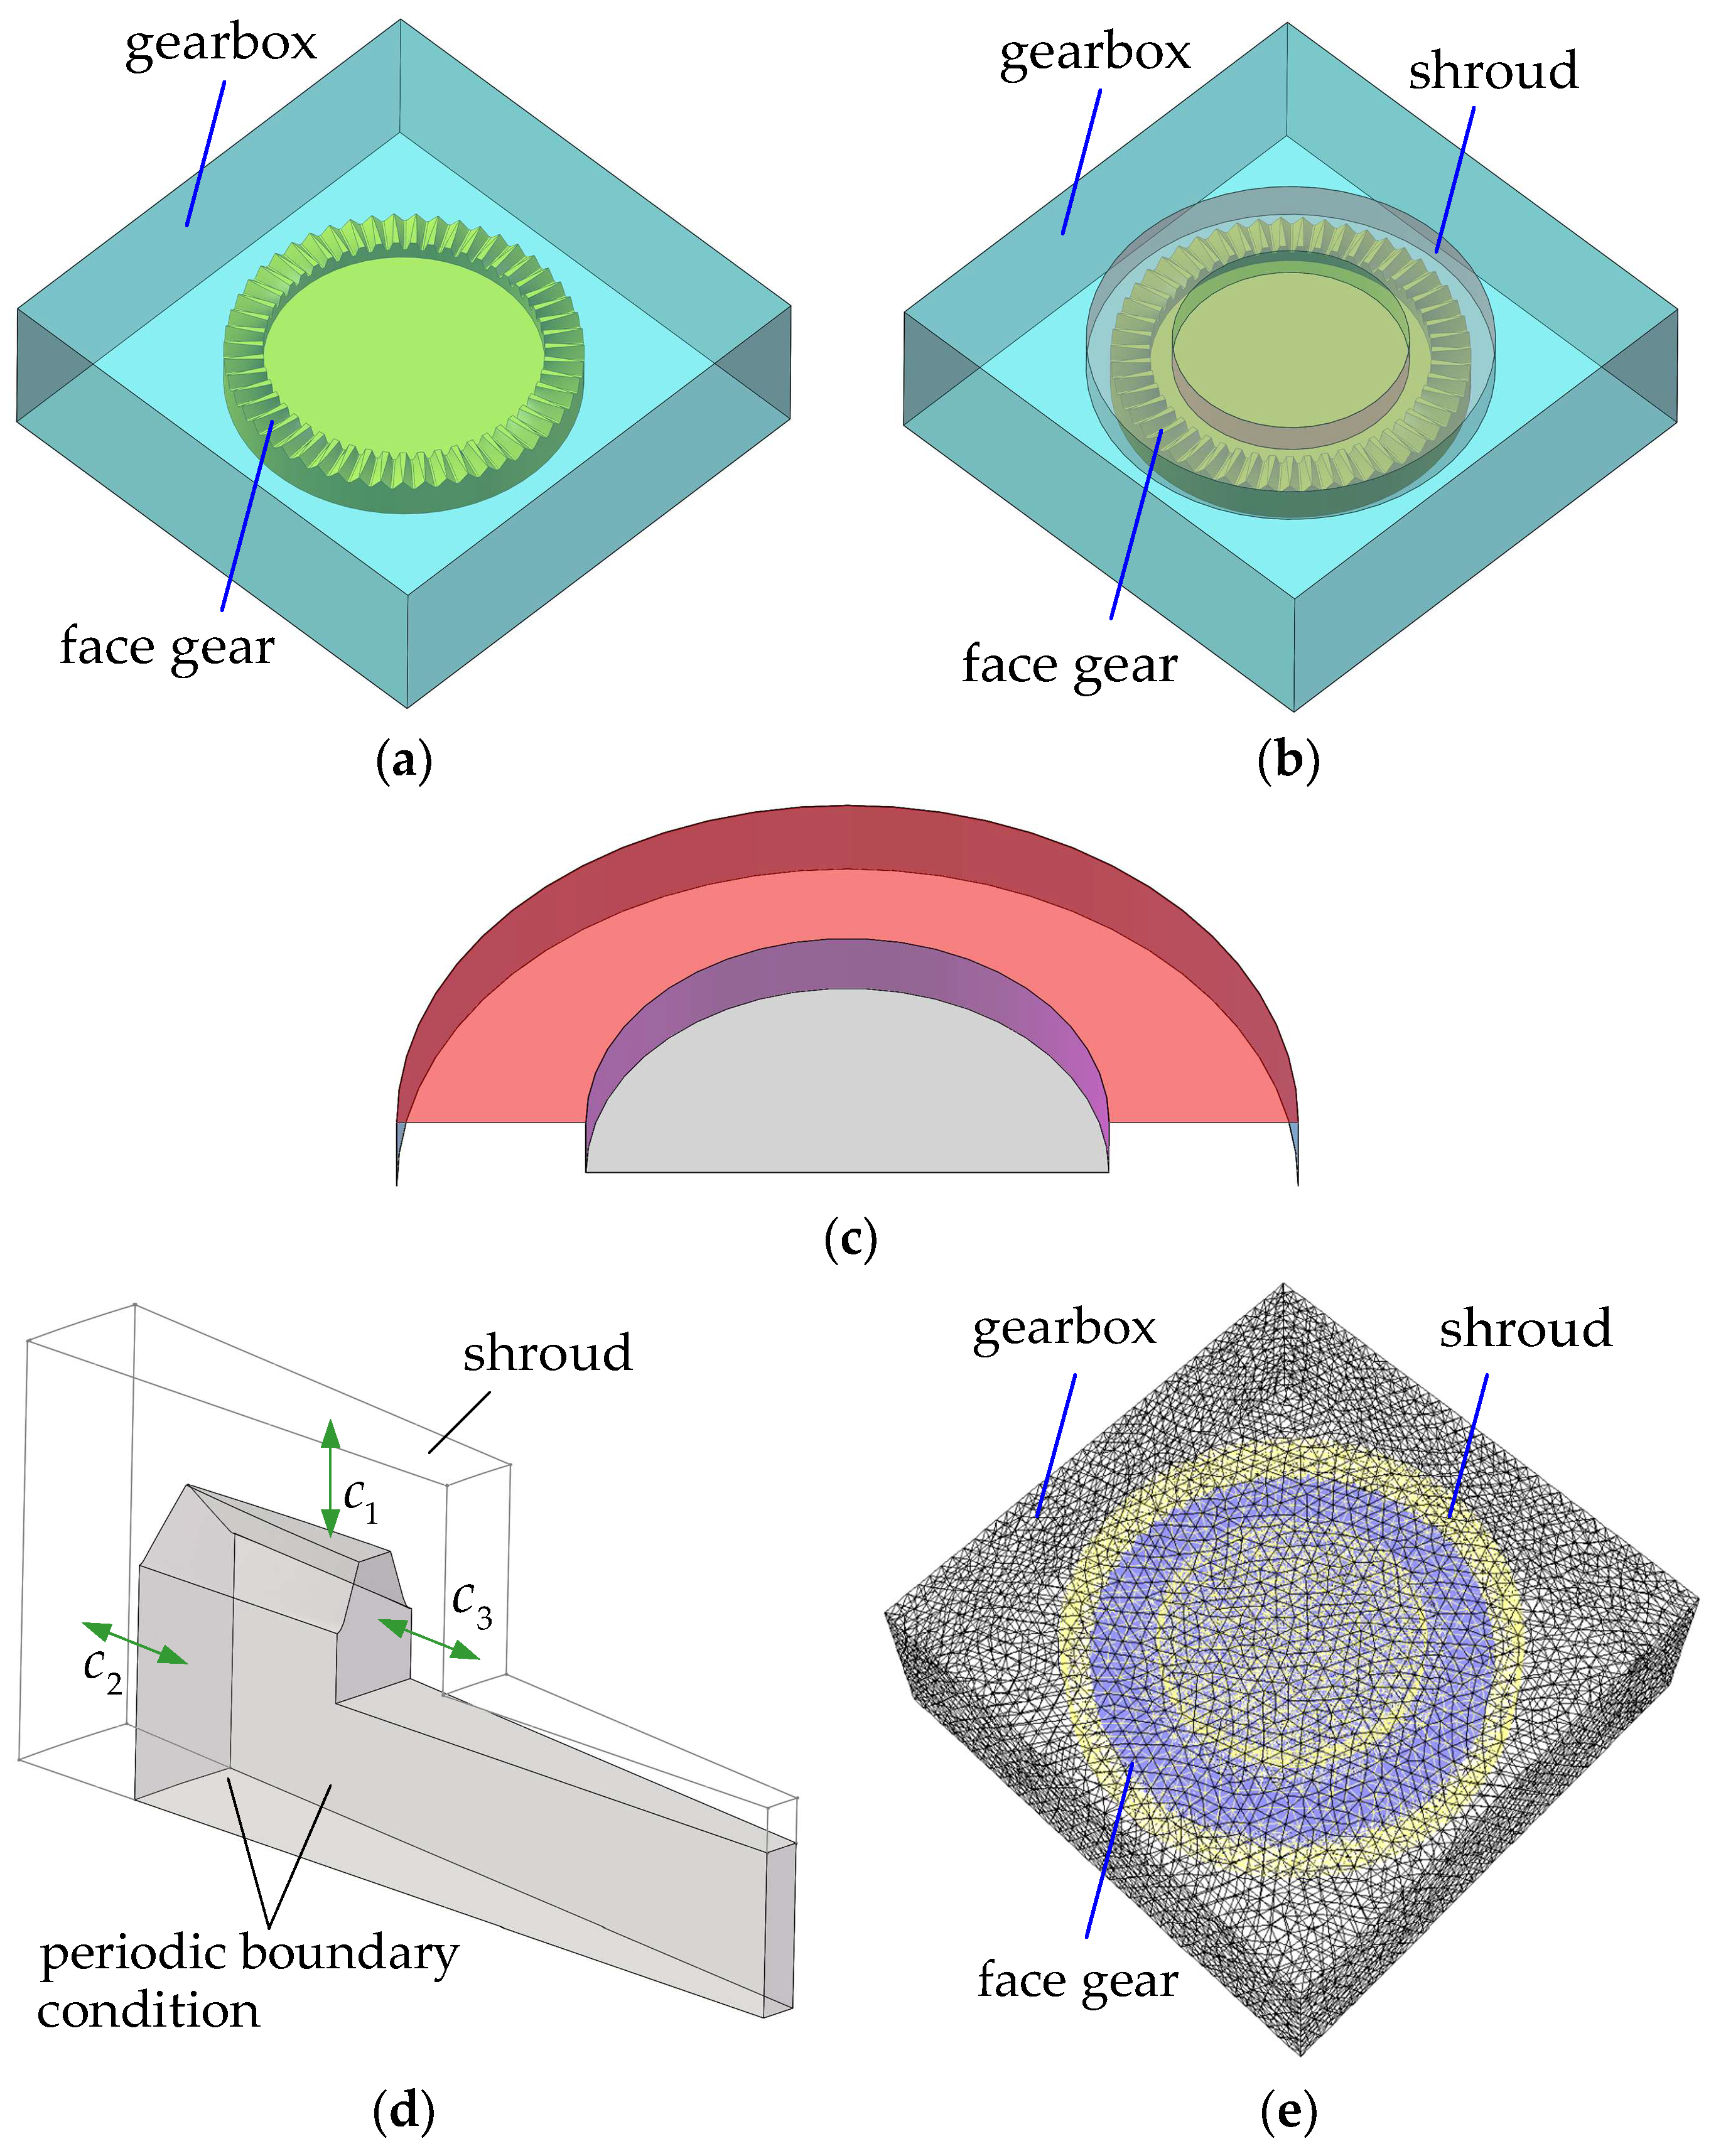
3.1. CFD Model
3.2. Main Settings of Simulation
- The air around the face gear was assumed to be pure and Mach number of the air was less than 0.3; that is, it was incompressible, and the density and viscosity were 1.225 and 0.01834 , respectively.
- When the residuals of the continuity equation and the momentum equation were less than 0.0001, the convergence state can be considered.
- All moving walls were supposed to be unsmooth with a roughness of 3.2 μm.
4. Results Analysis
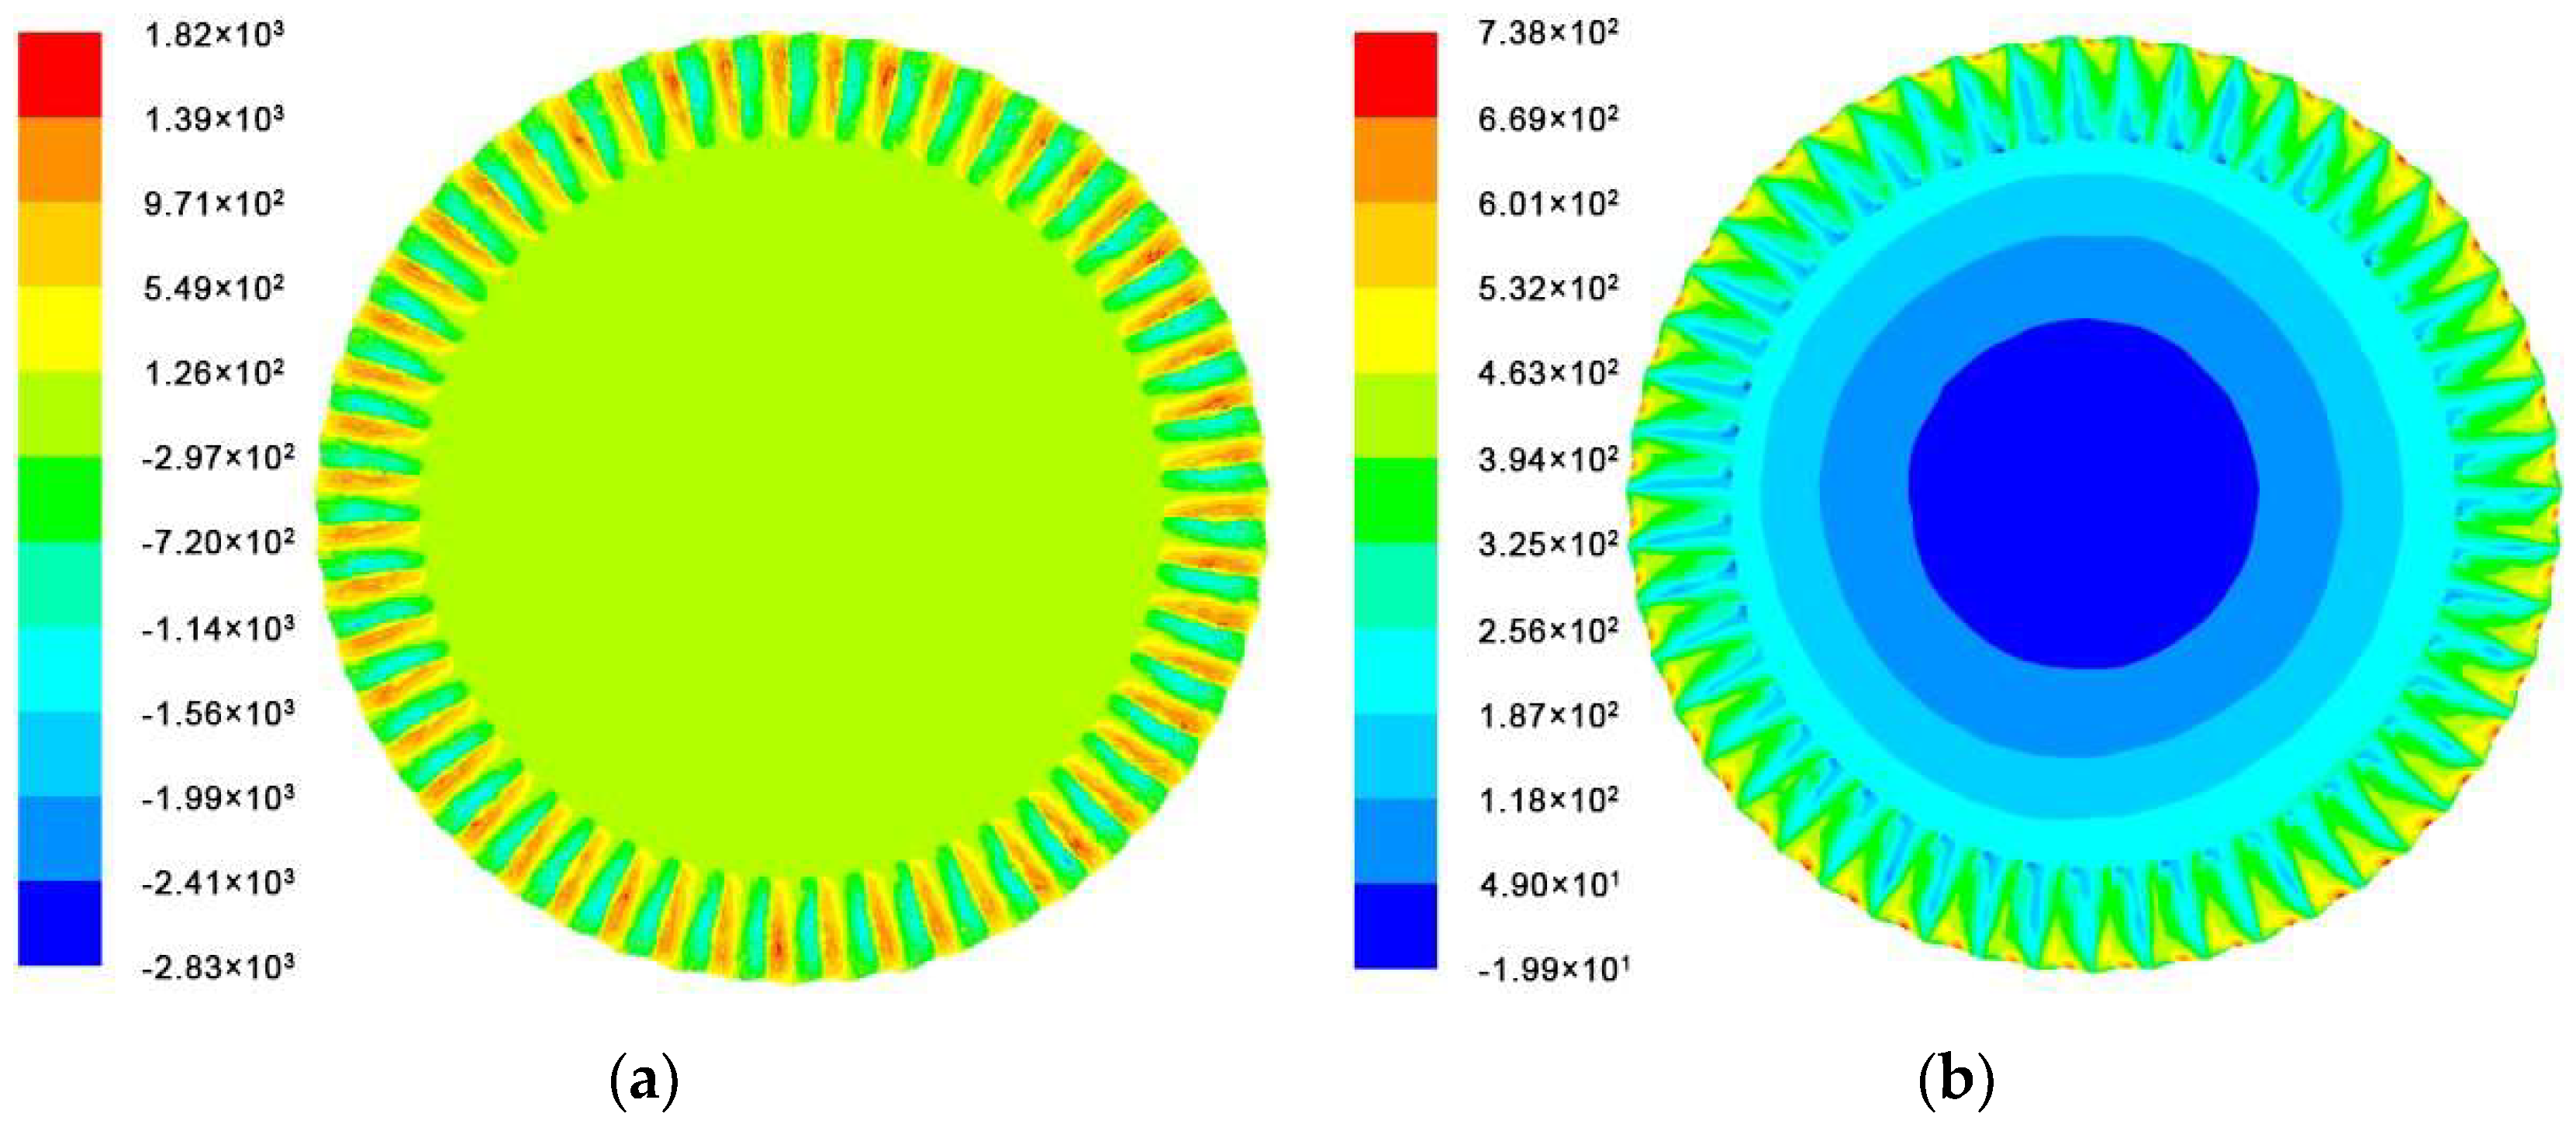
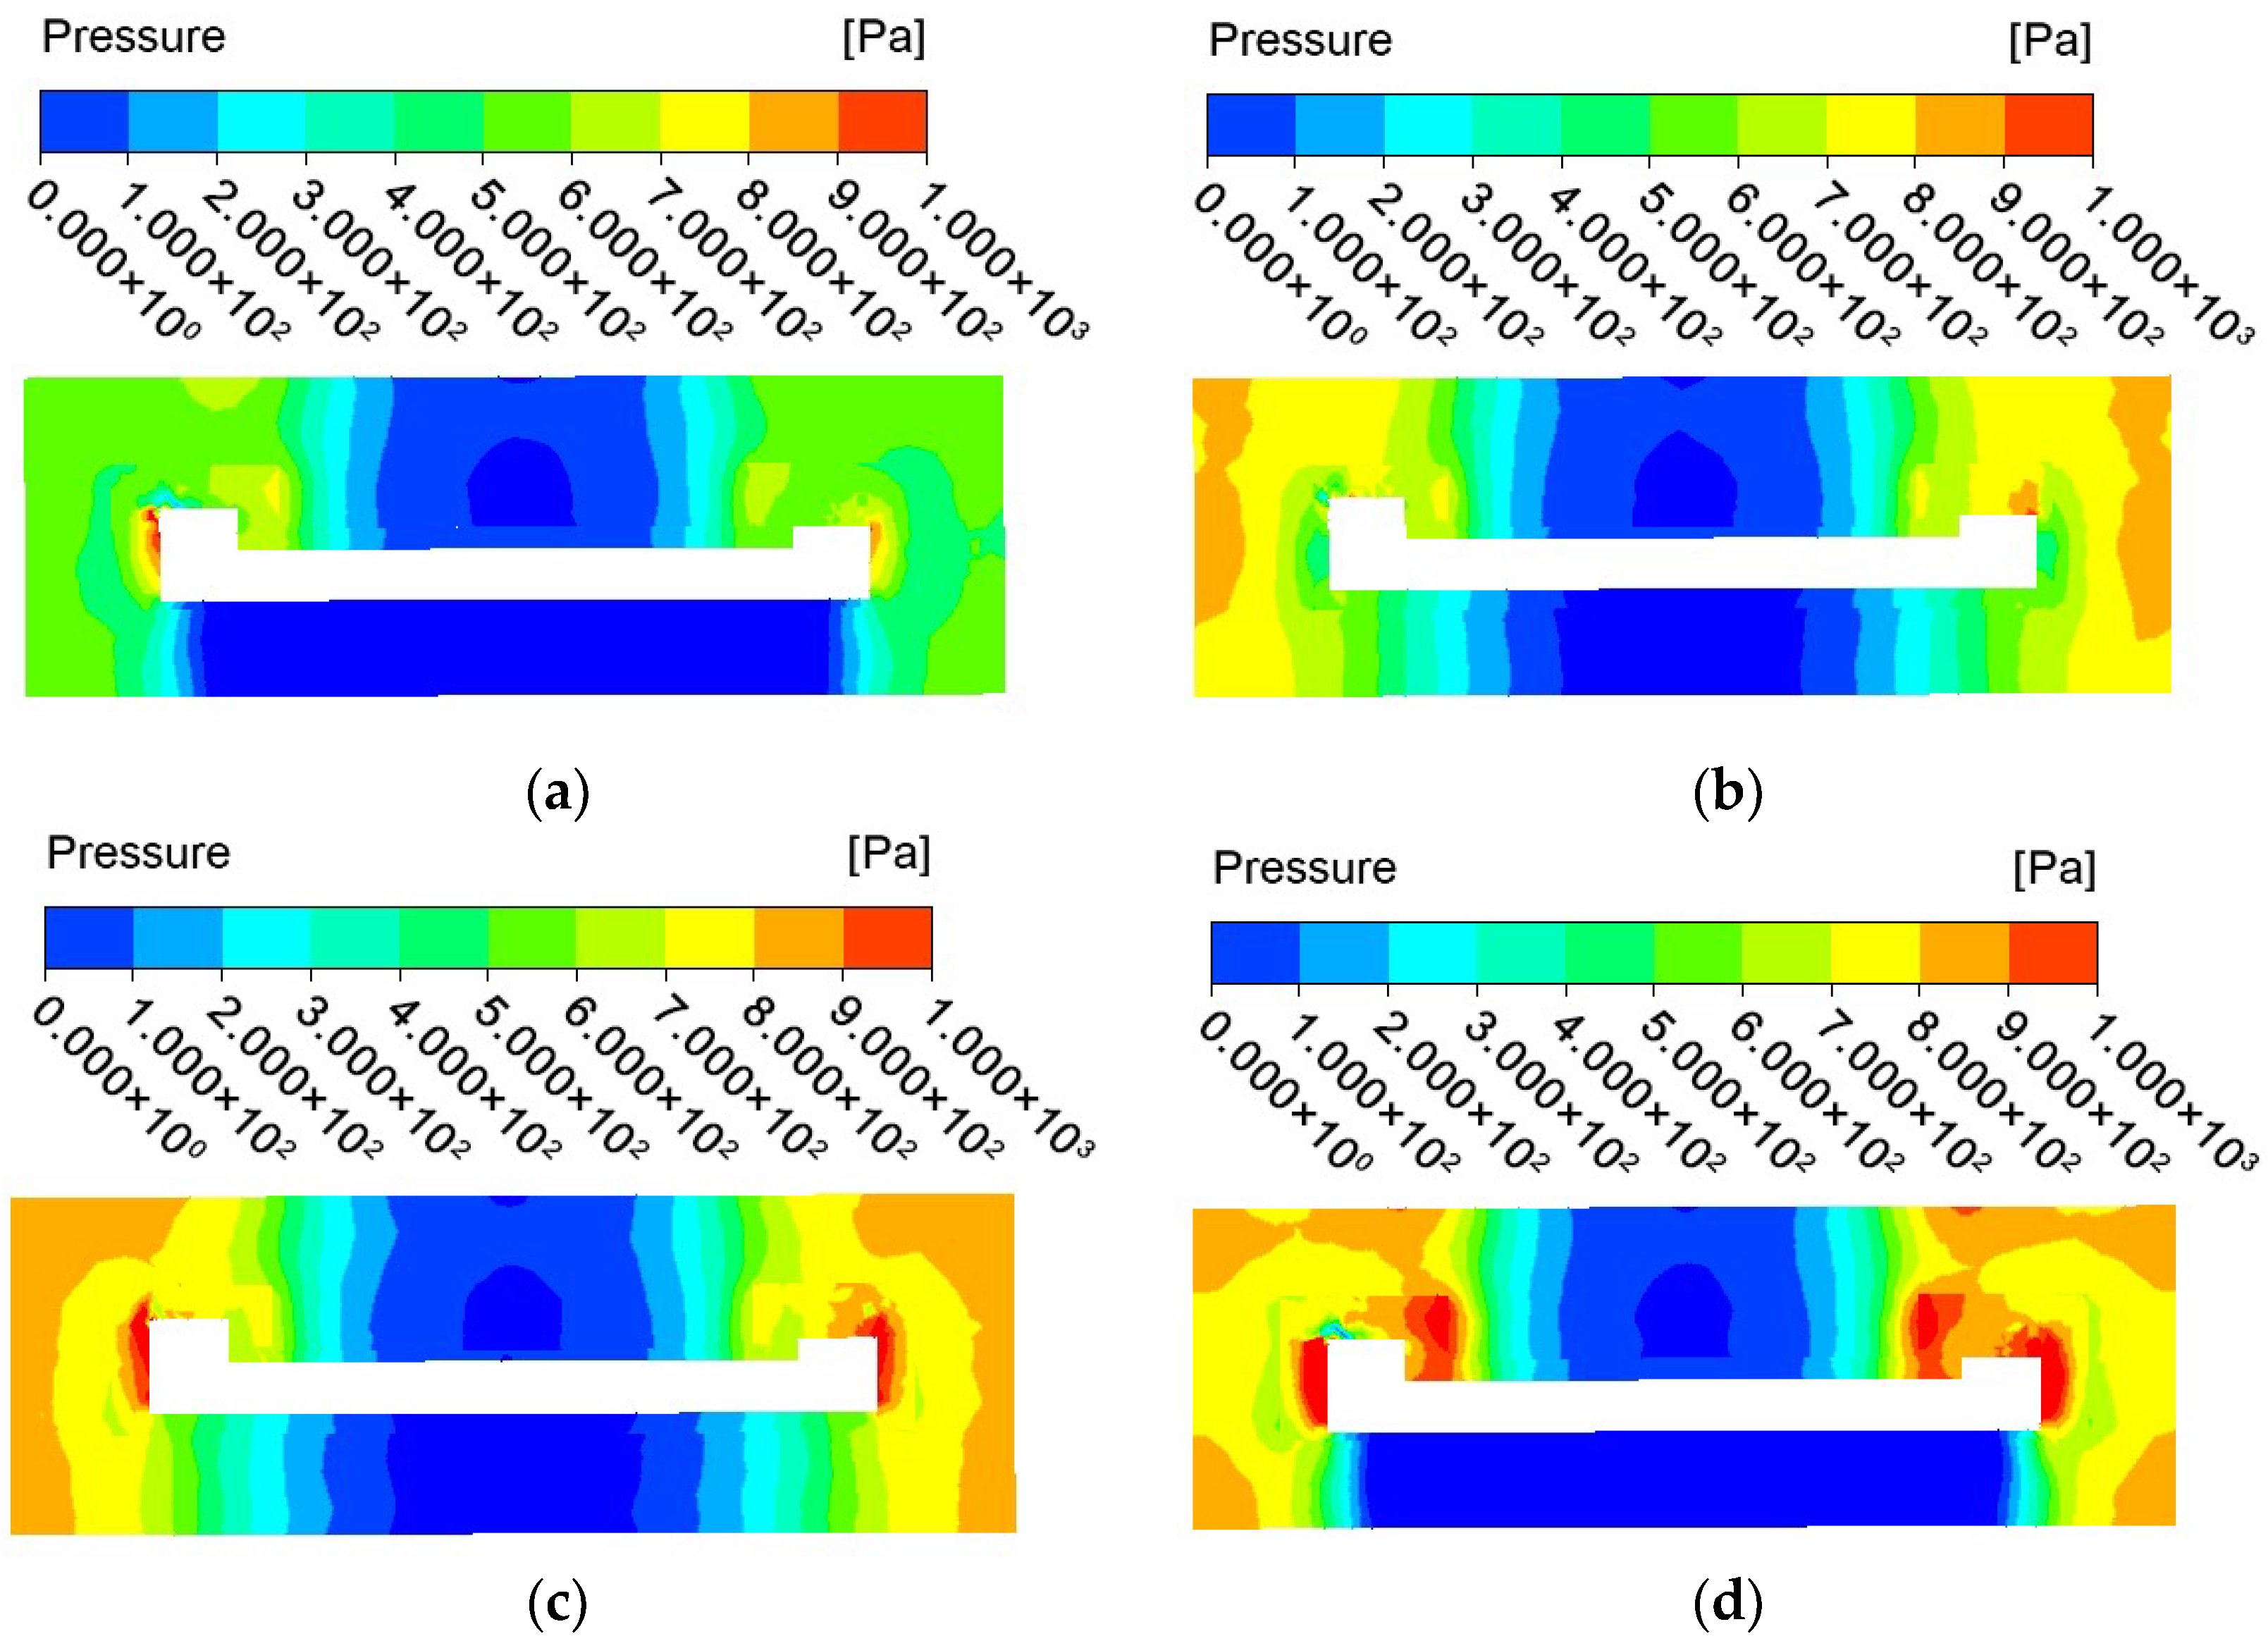
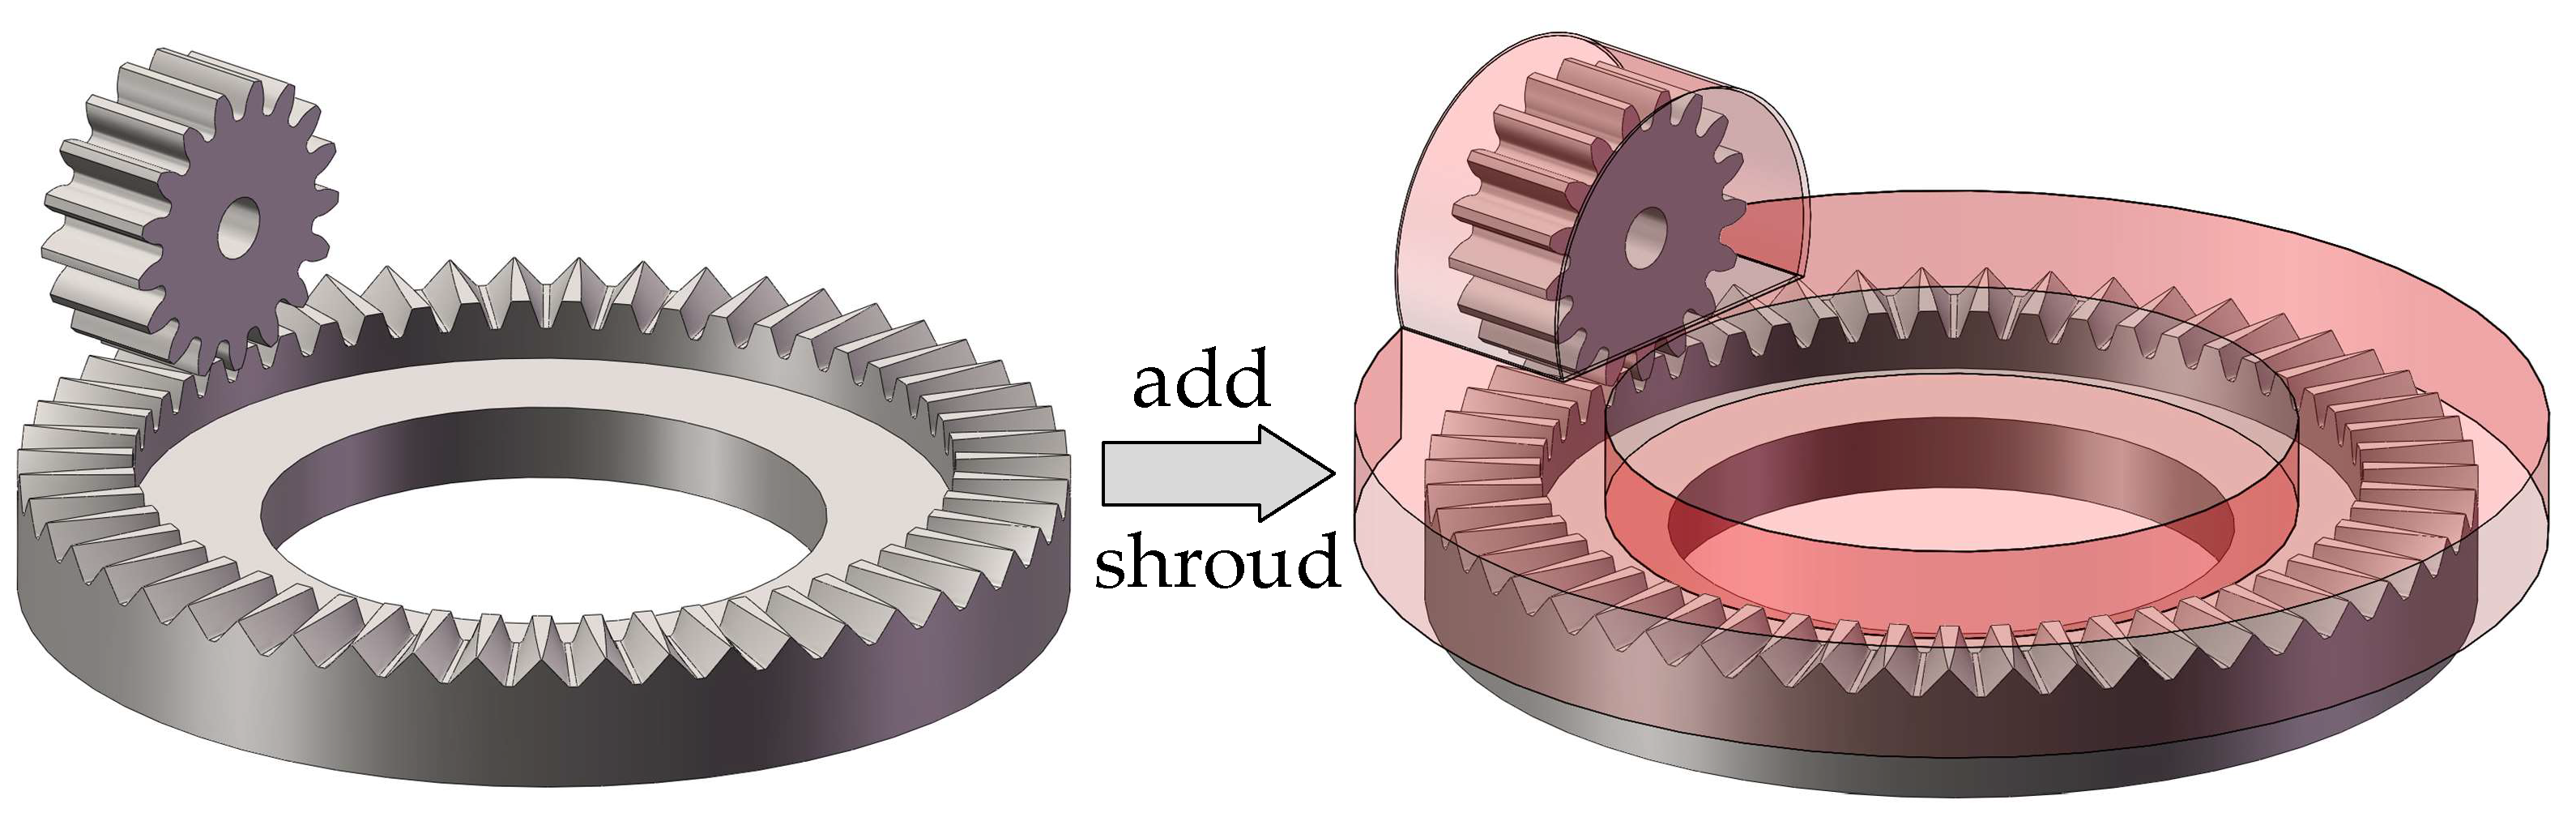
4.1. Analysis of the Gear Speed and Shroud
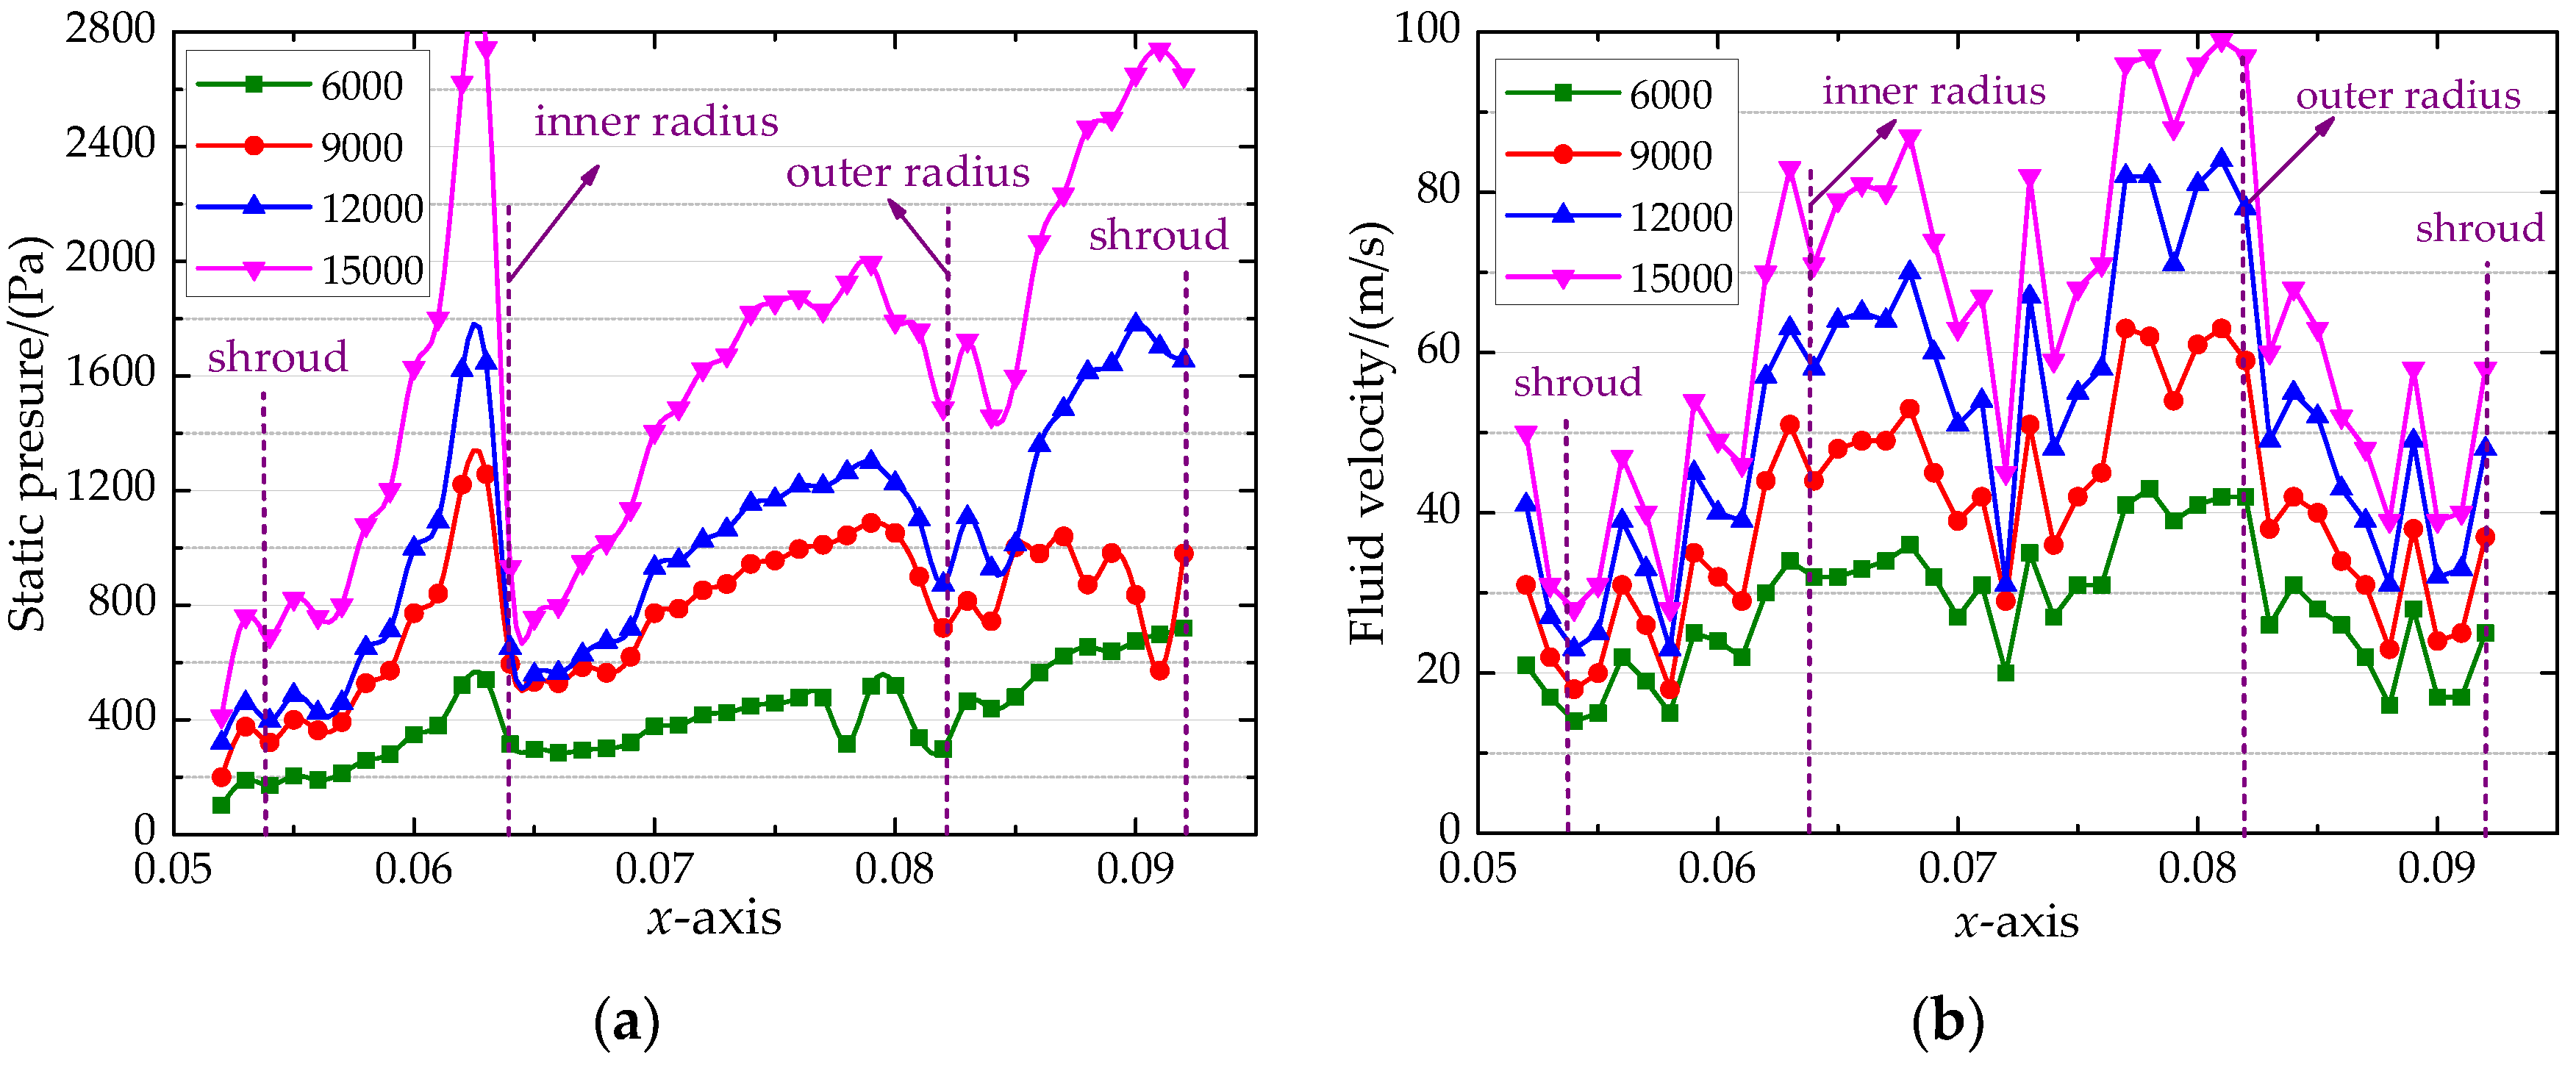
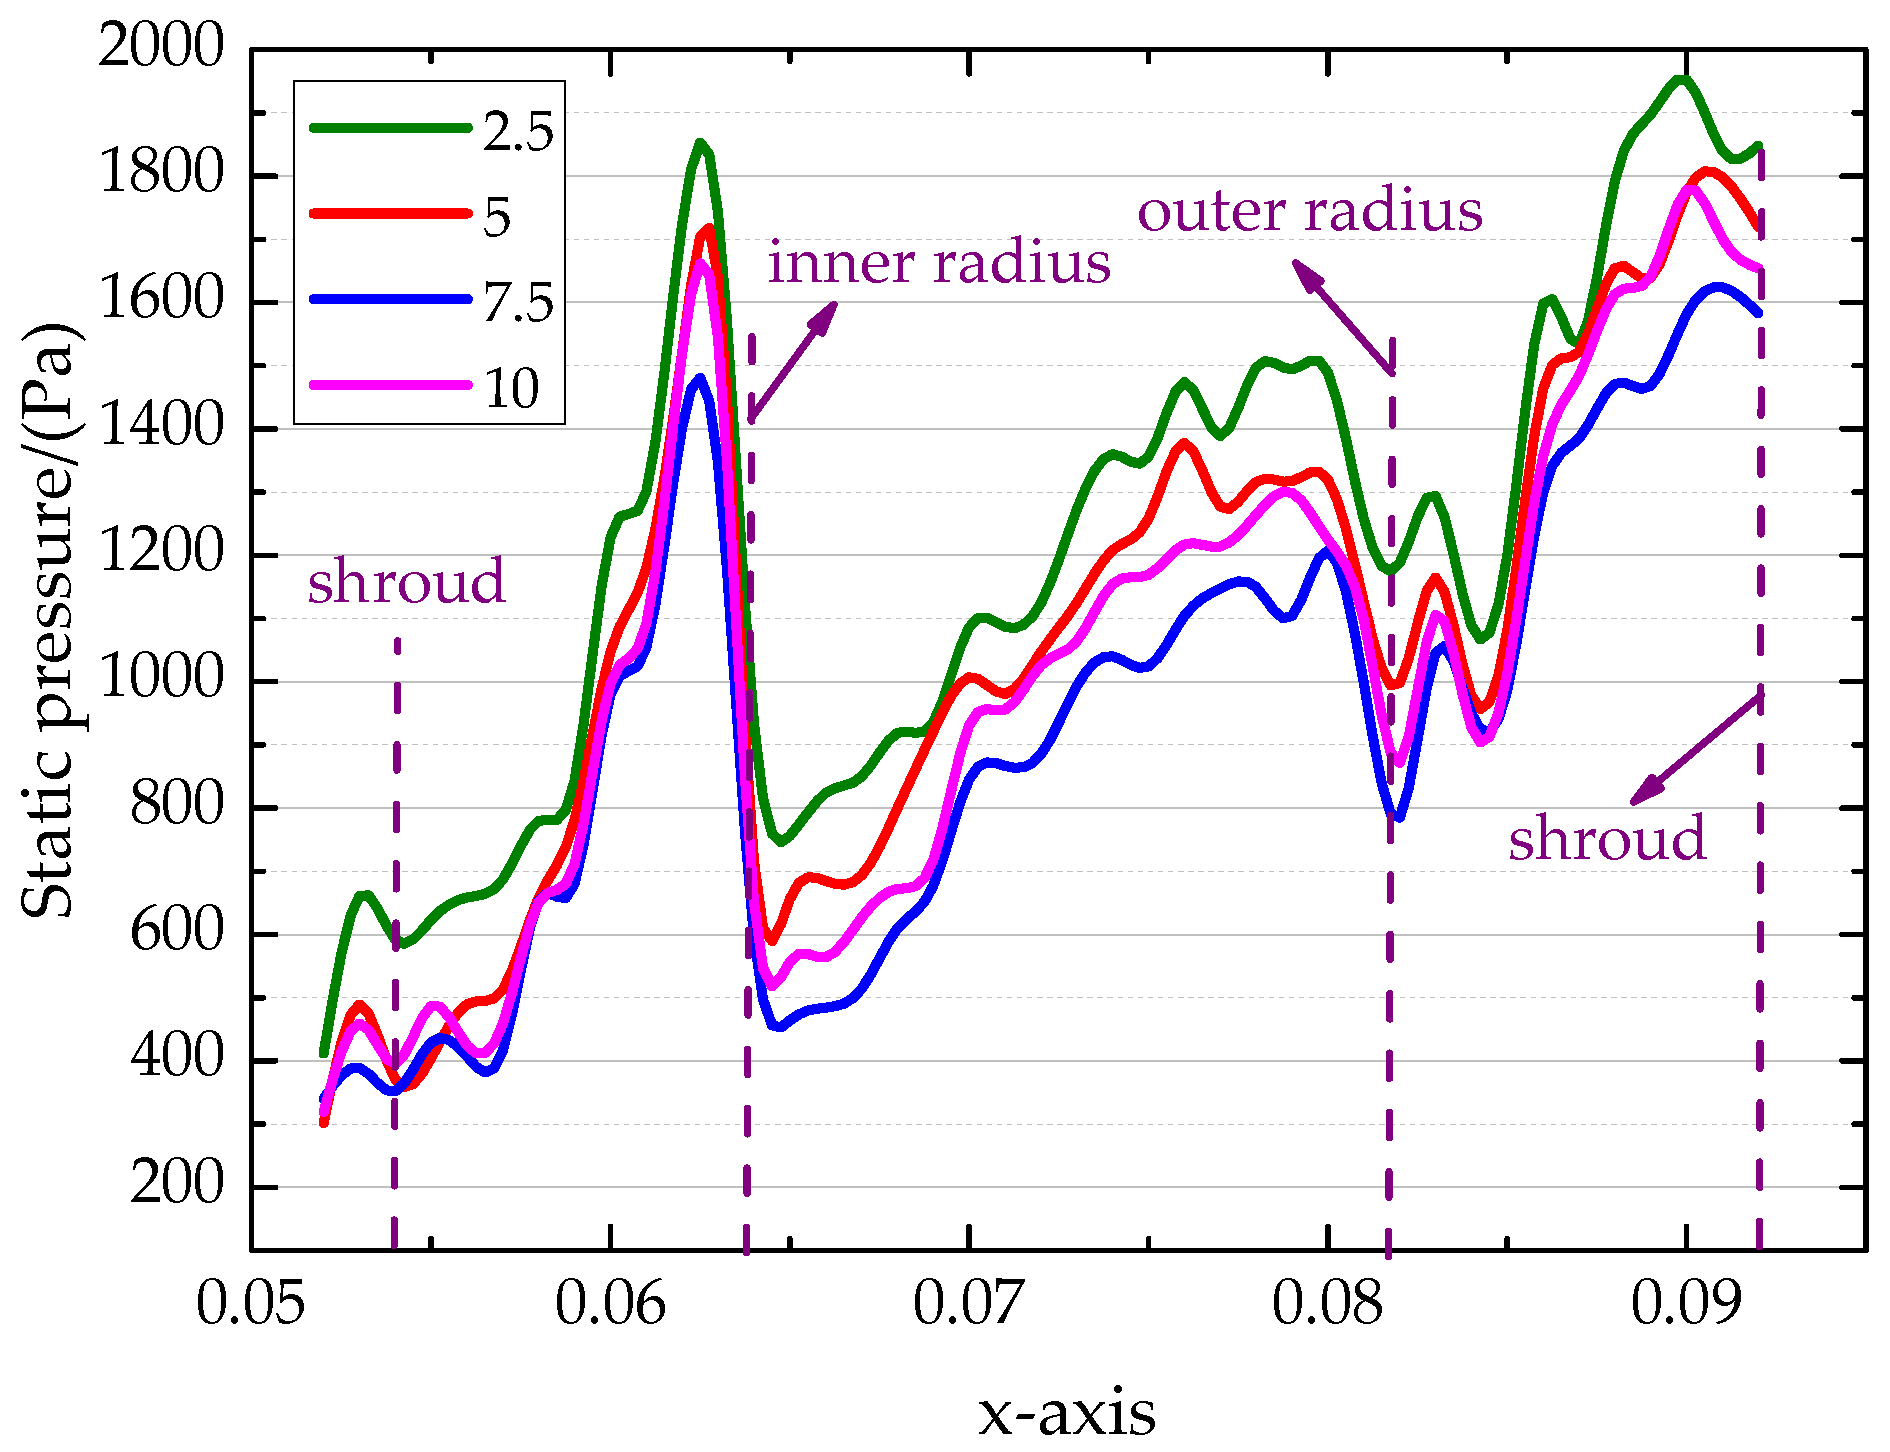
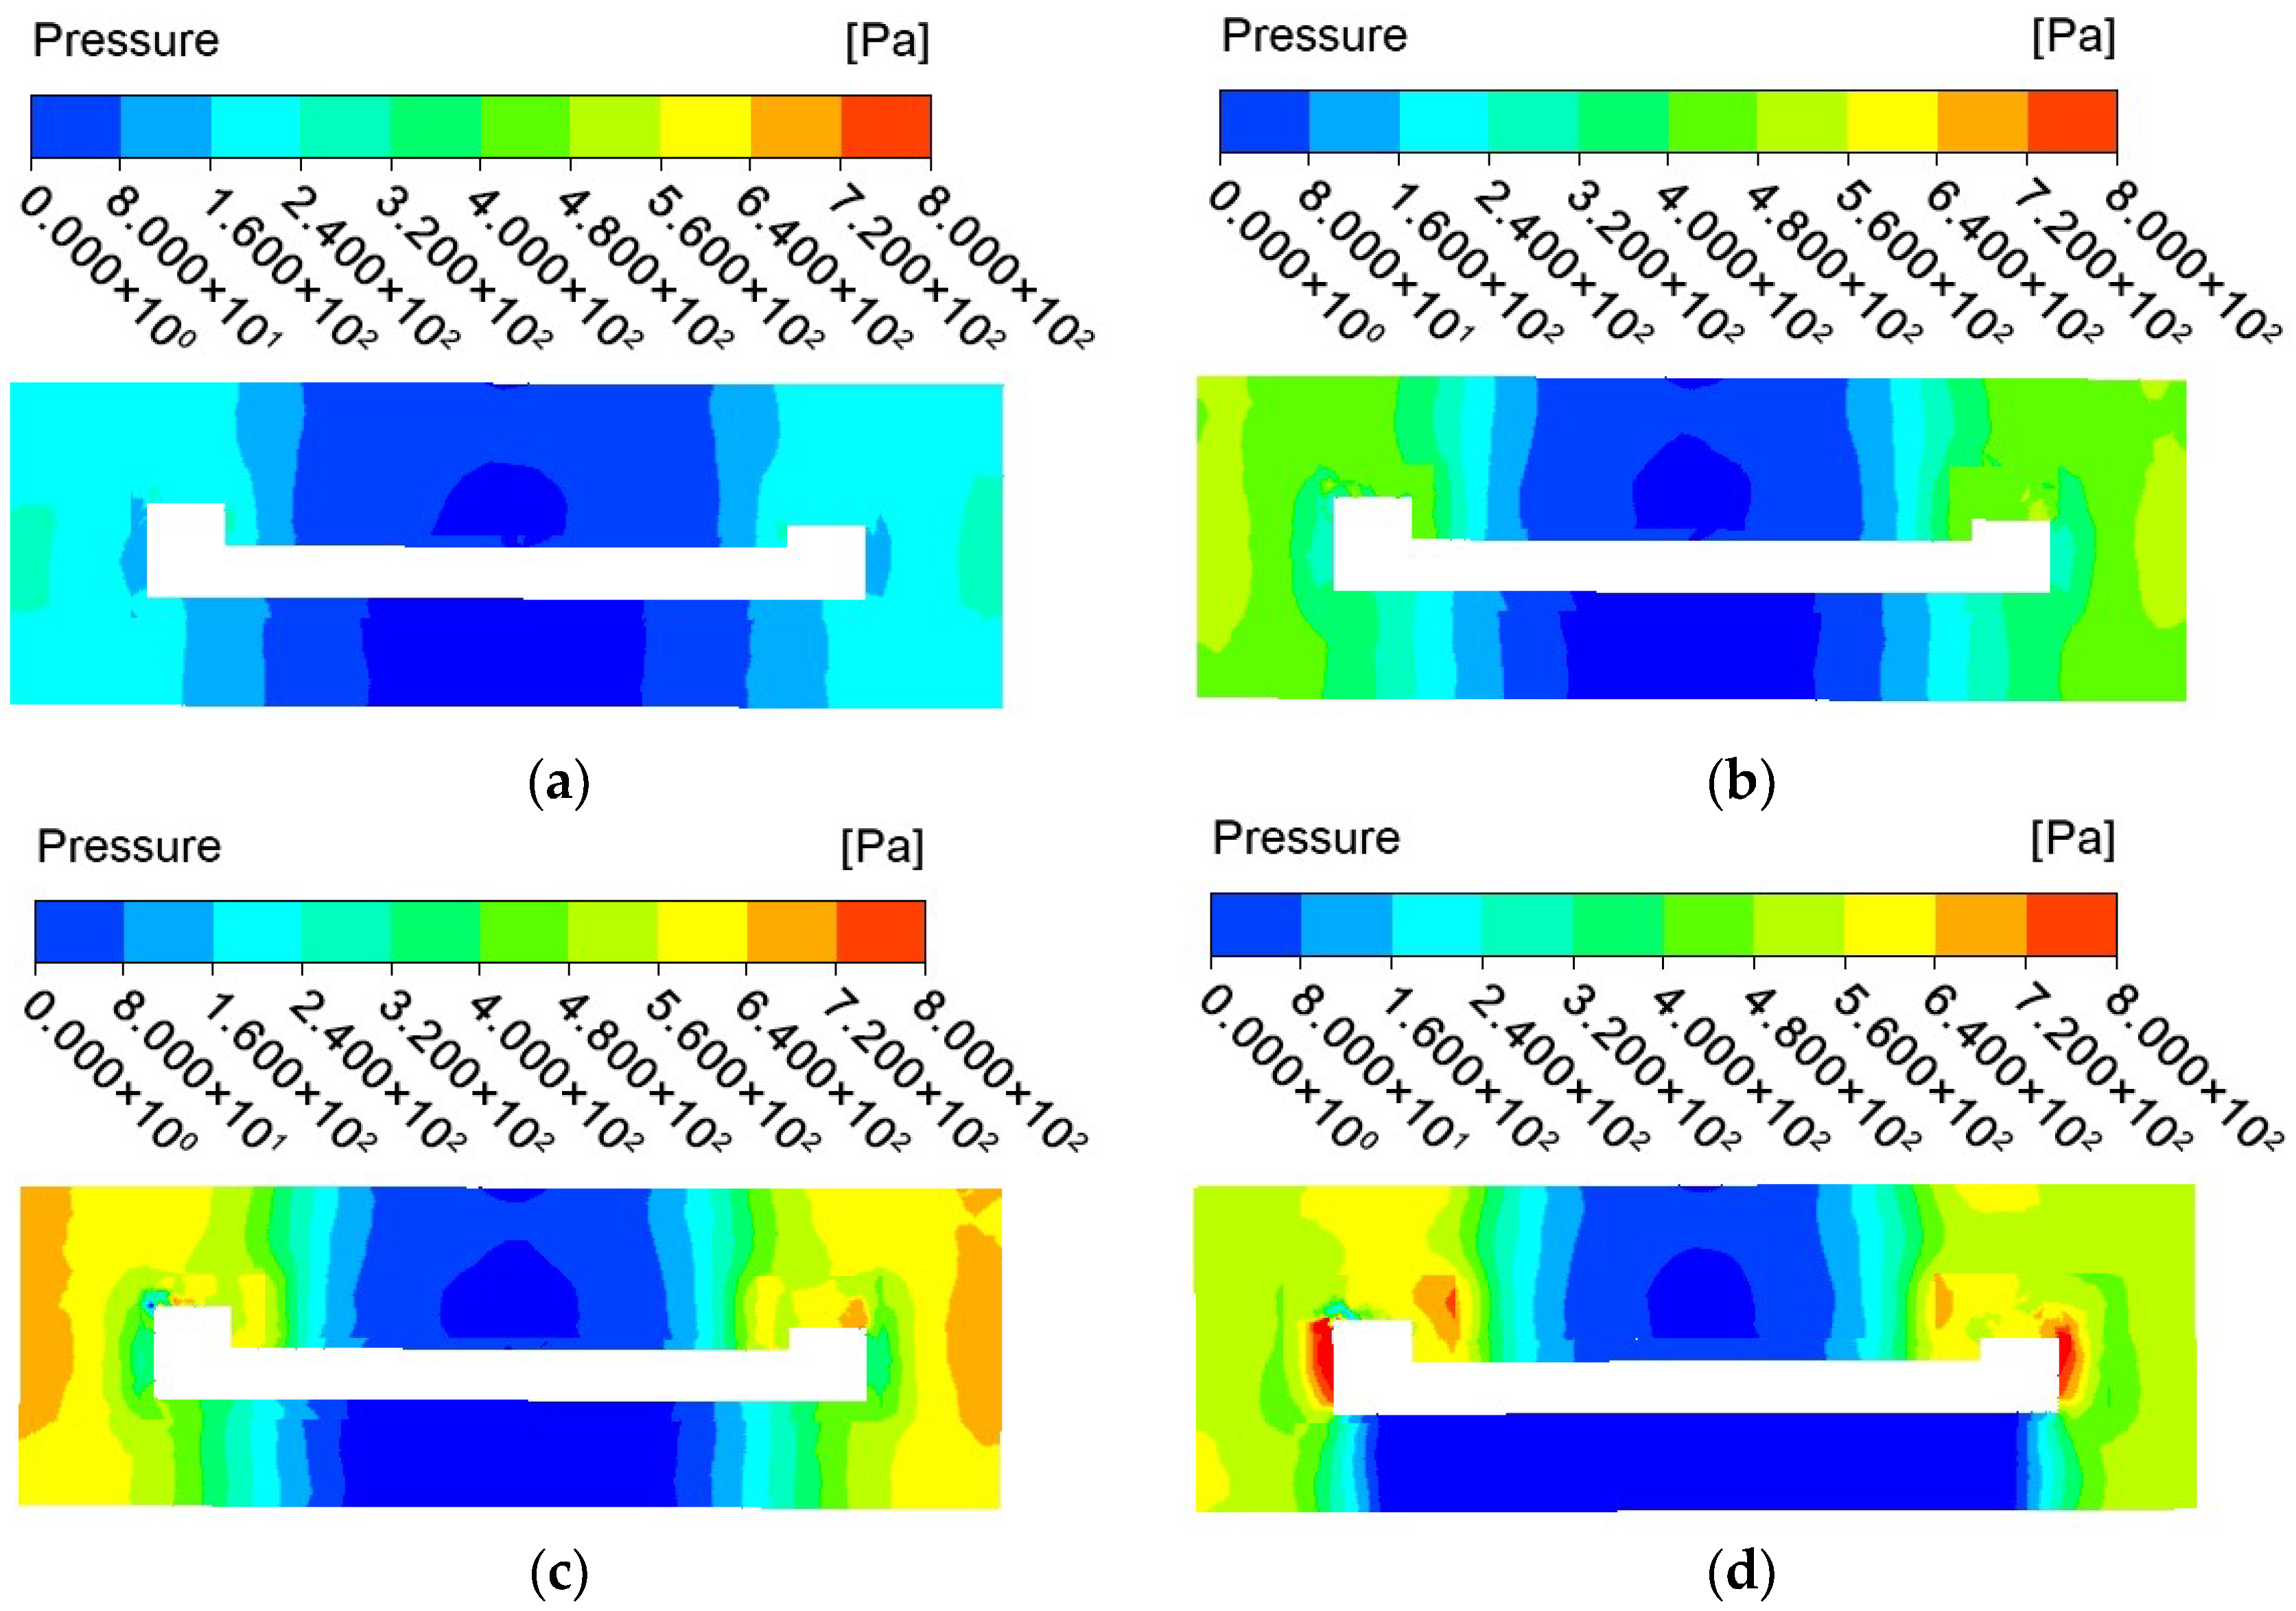
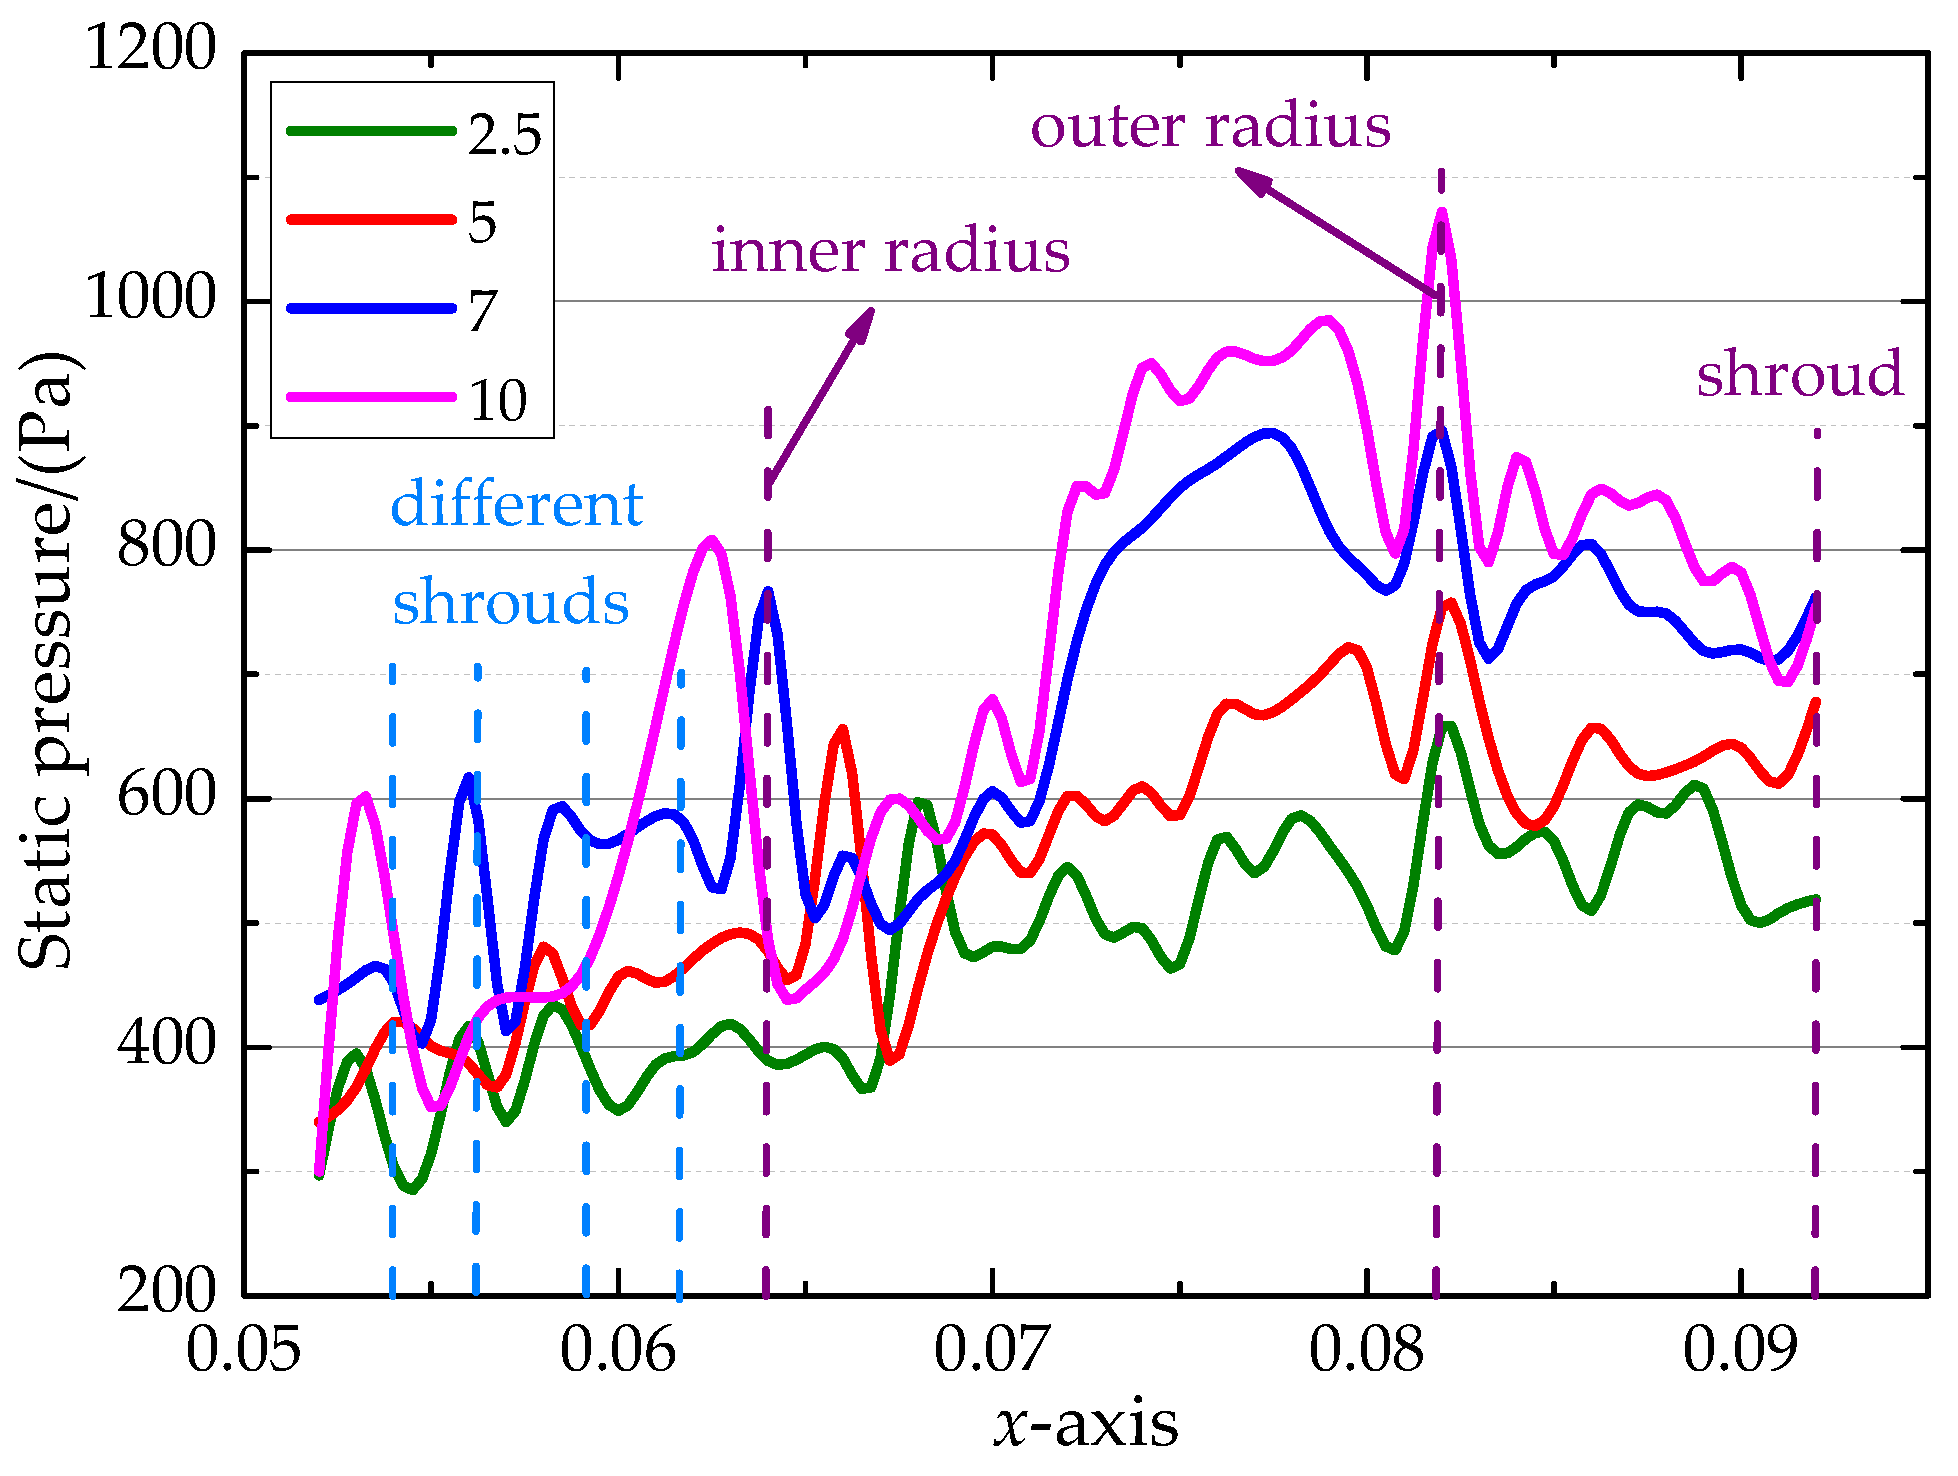
4.2. Analysis of the Distance
4.3. Analysis of the Distance
4.4. Analysis of the Distance
4.5. Practical Applications
5. Conclusions
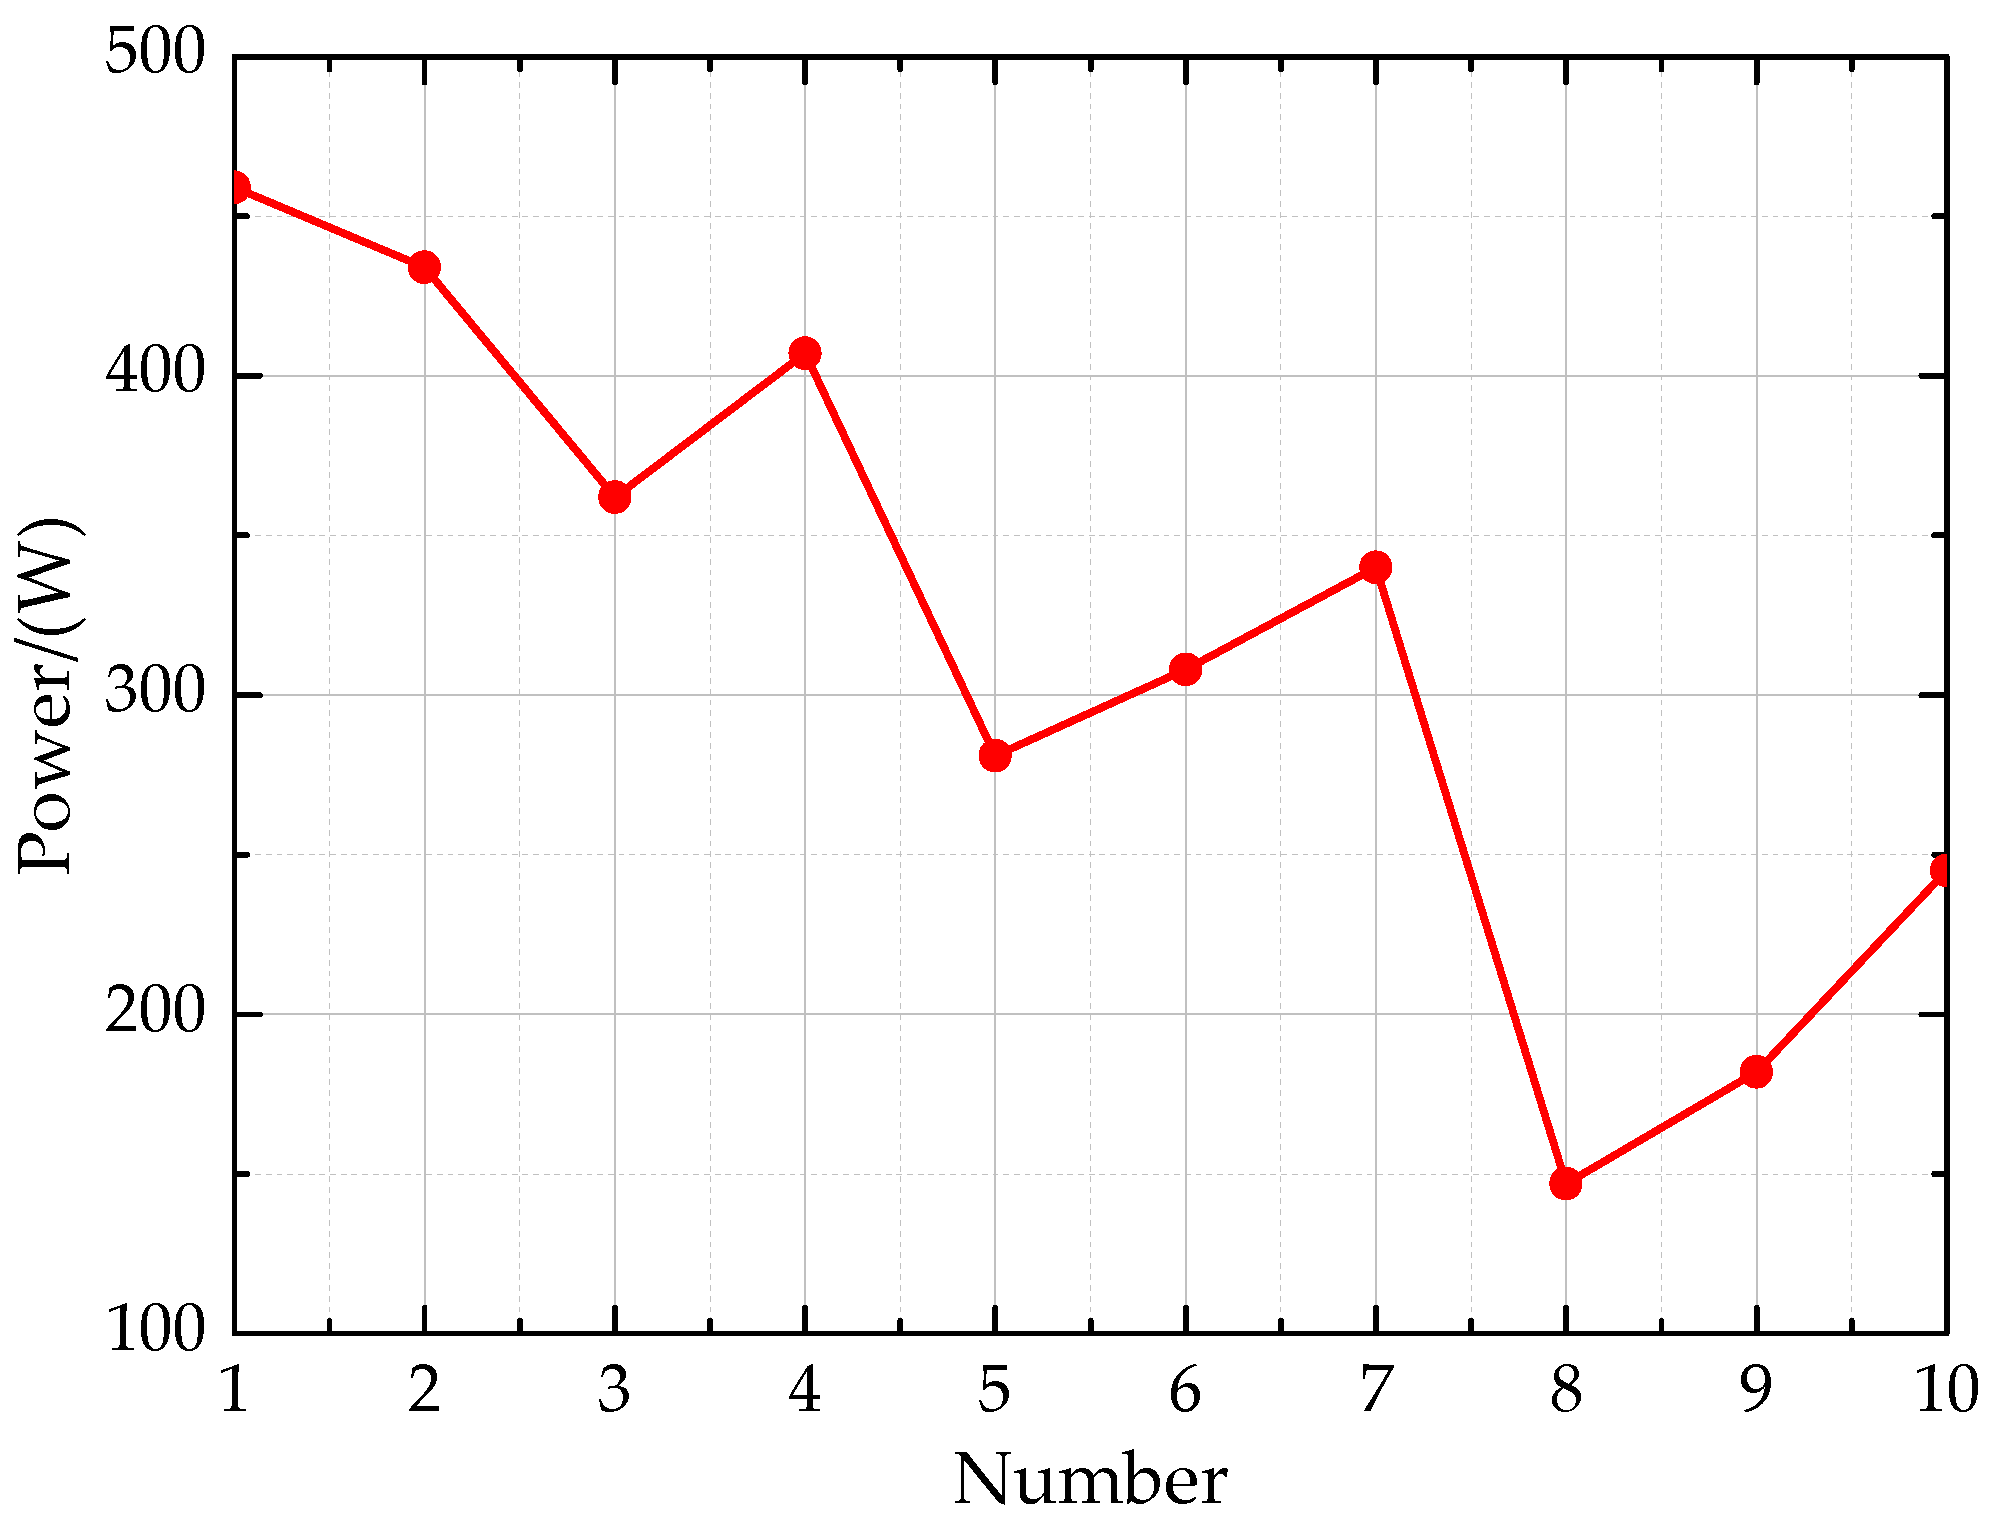
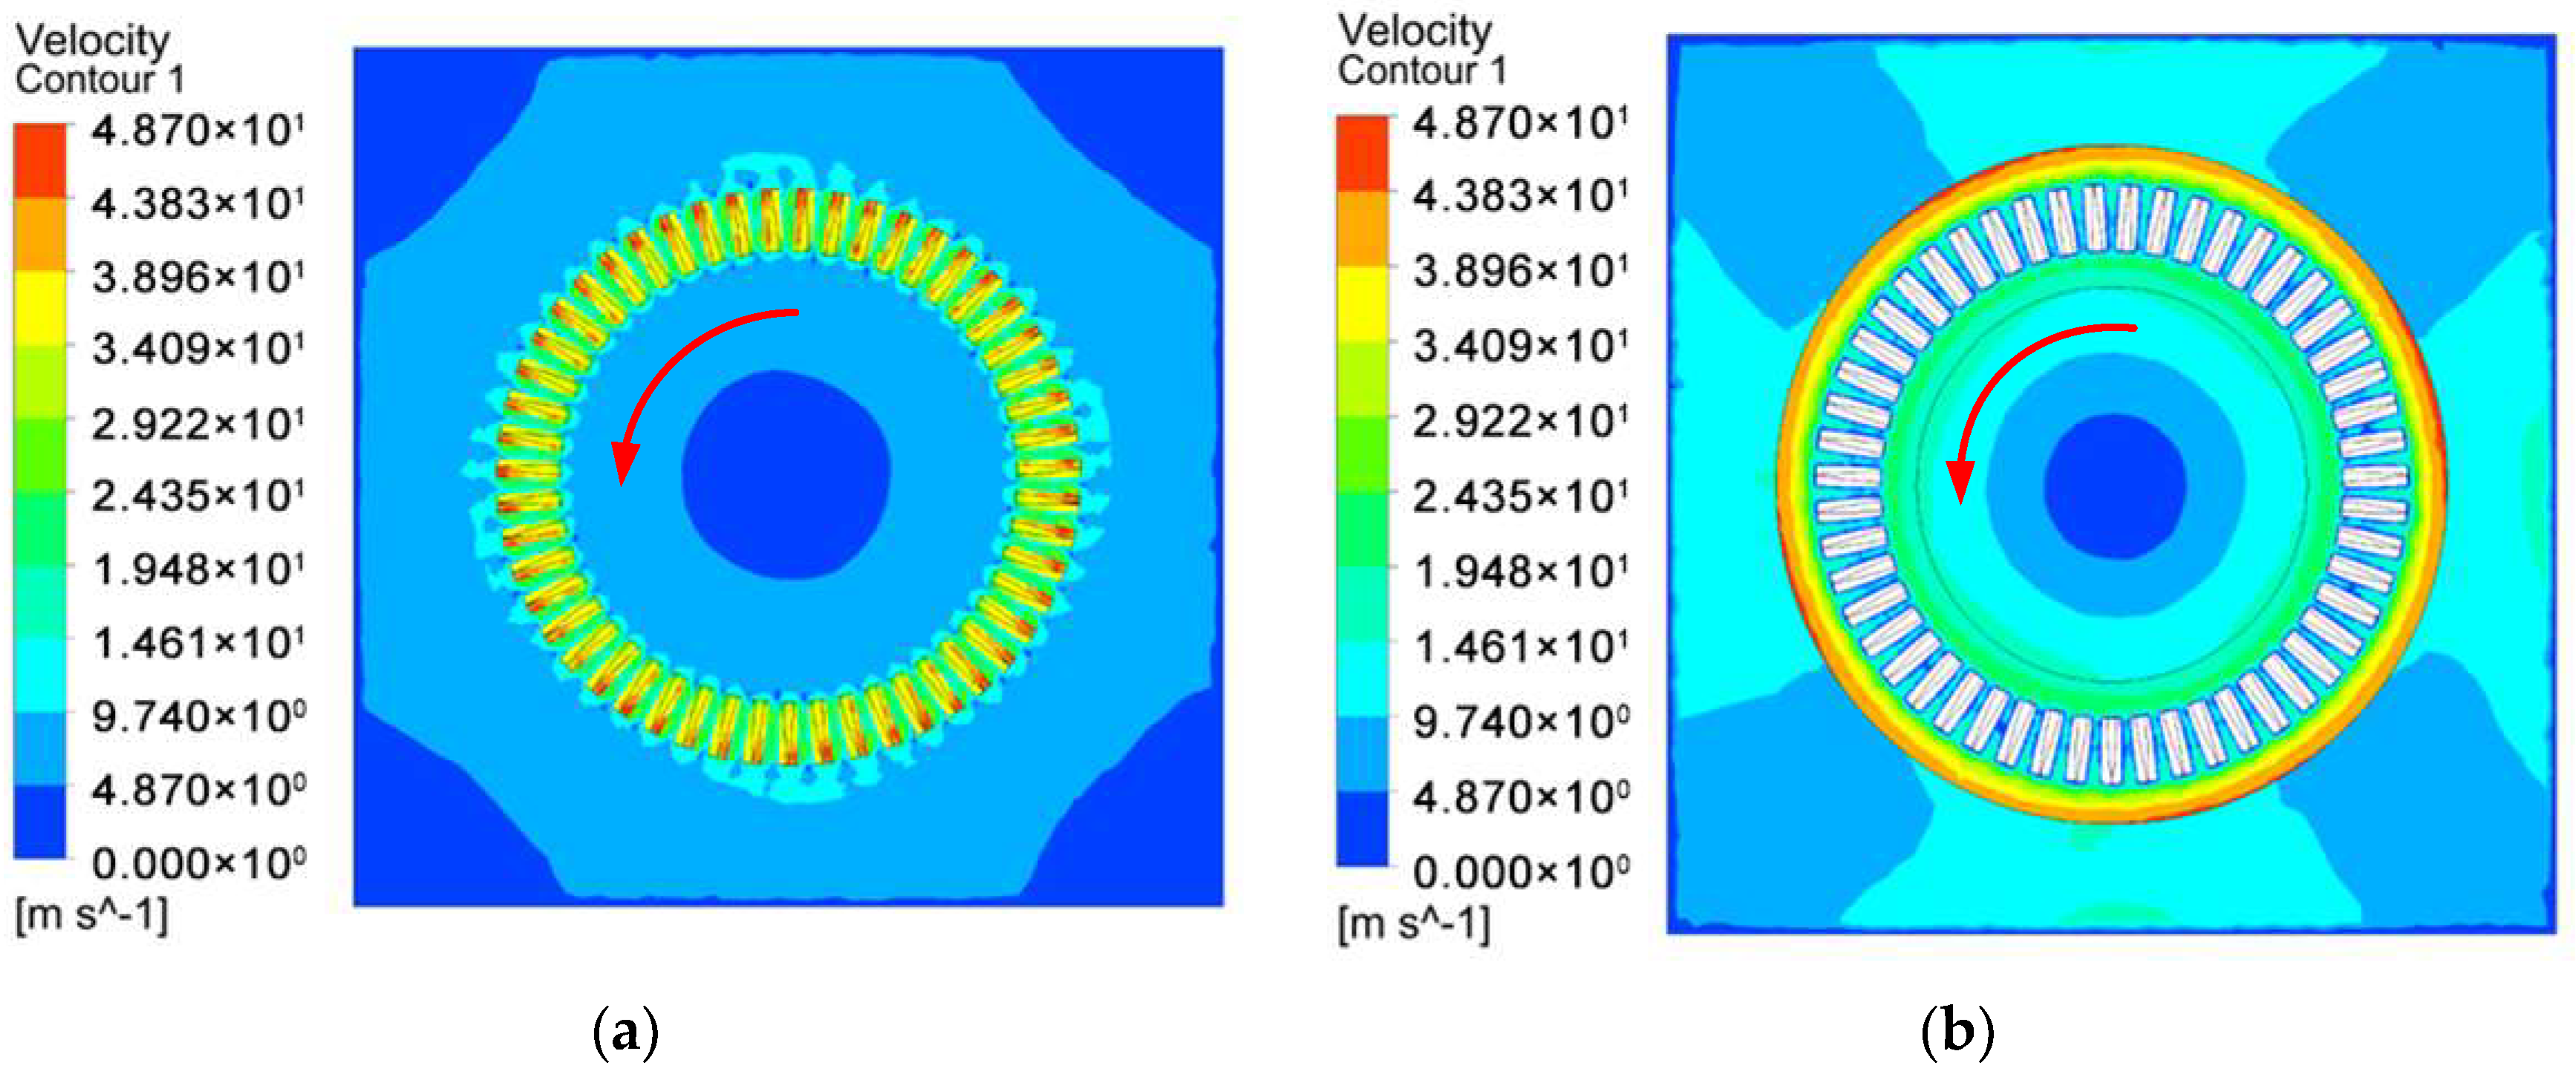
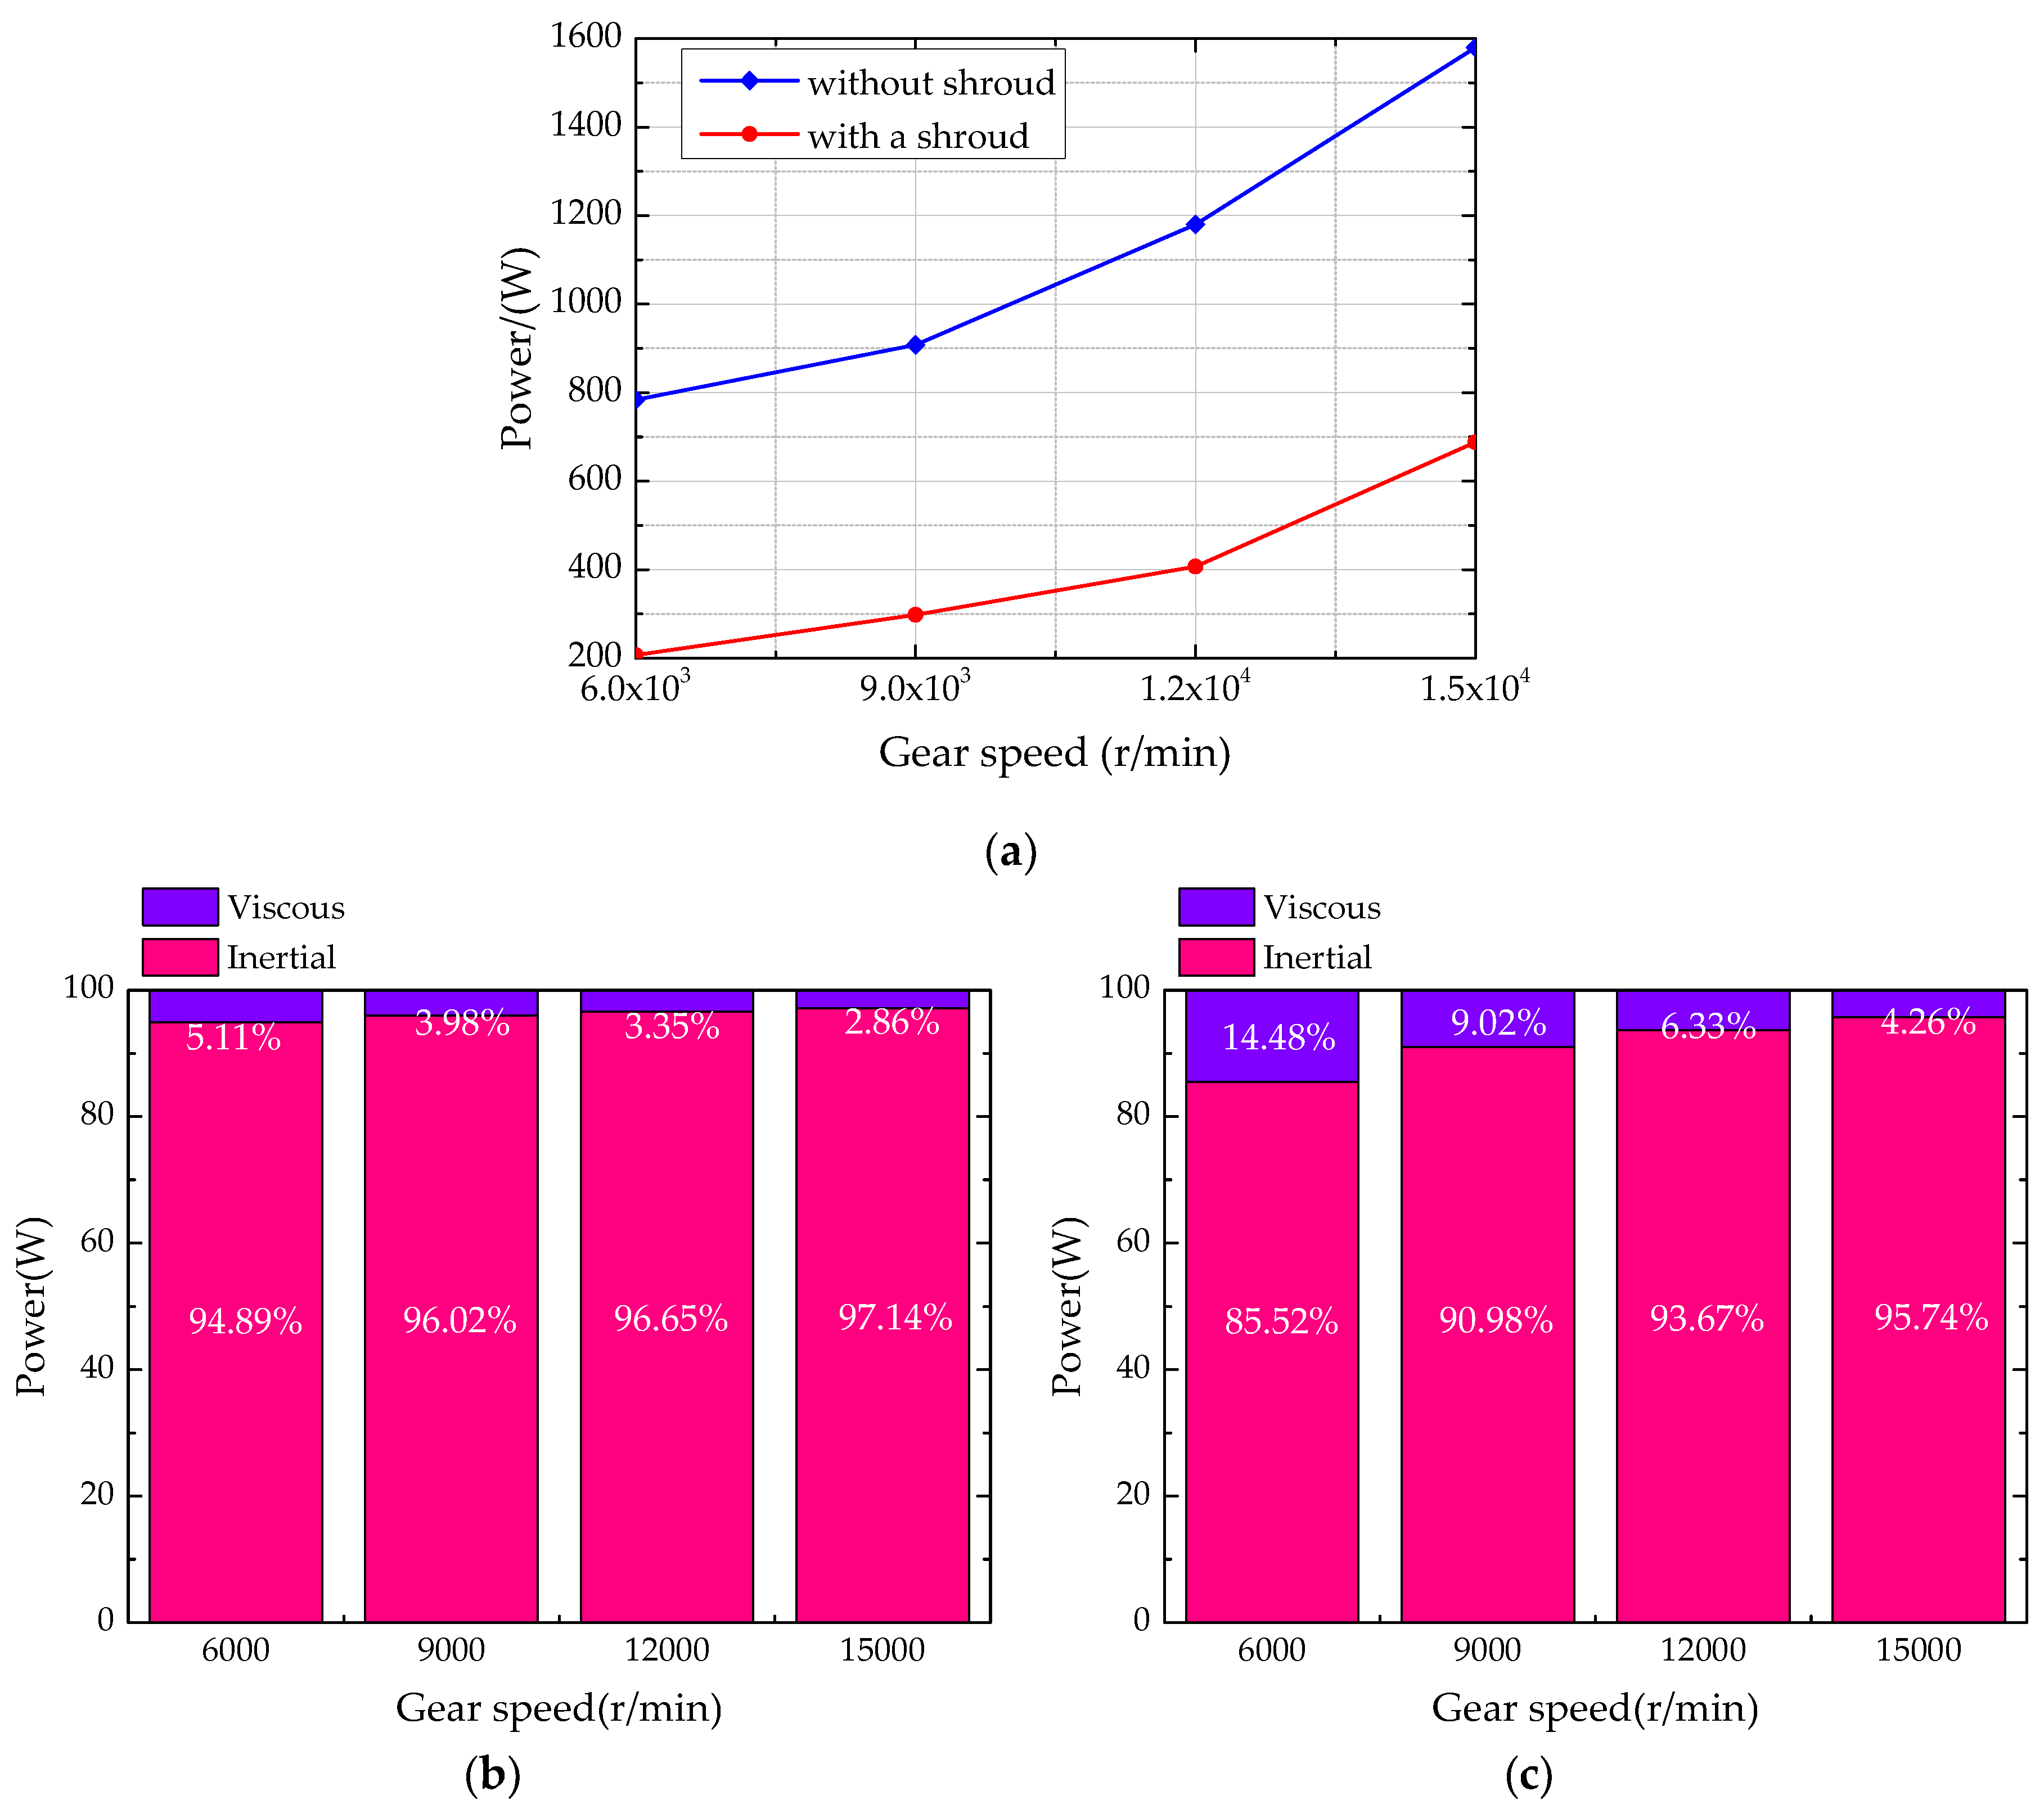
- The steering of the face gear has no effect on the windage losses. The teeth are the main source of windage loss instead of the gear plate. Gear speed plays a significant role in the windage loss of the face gear, and the greater the gear speed is, the greater the windage loss will be.
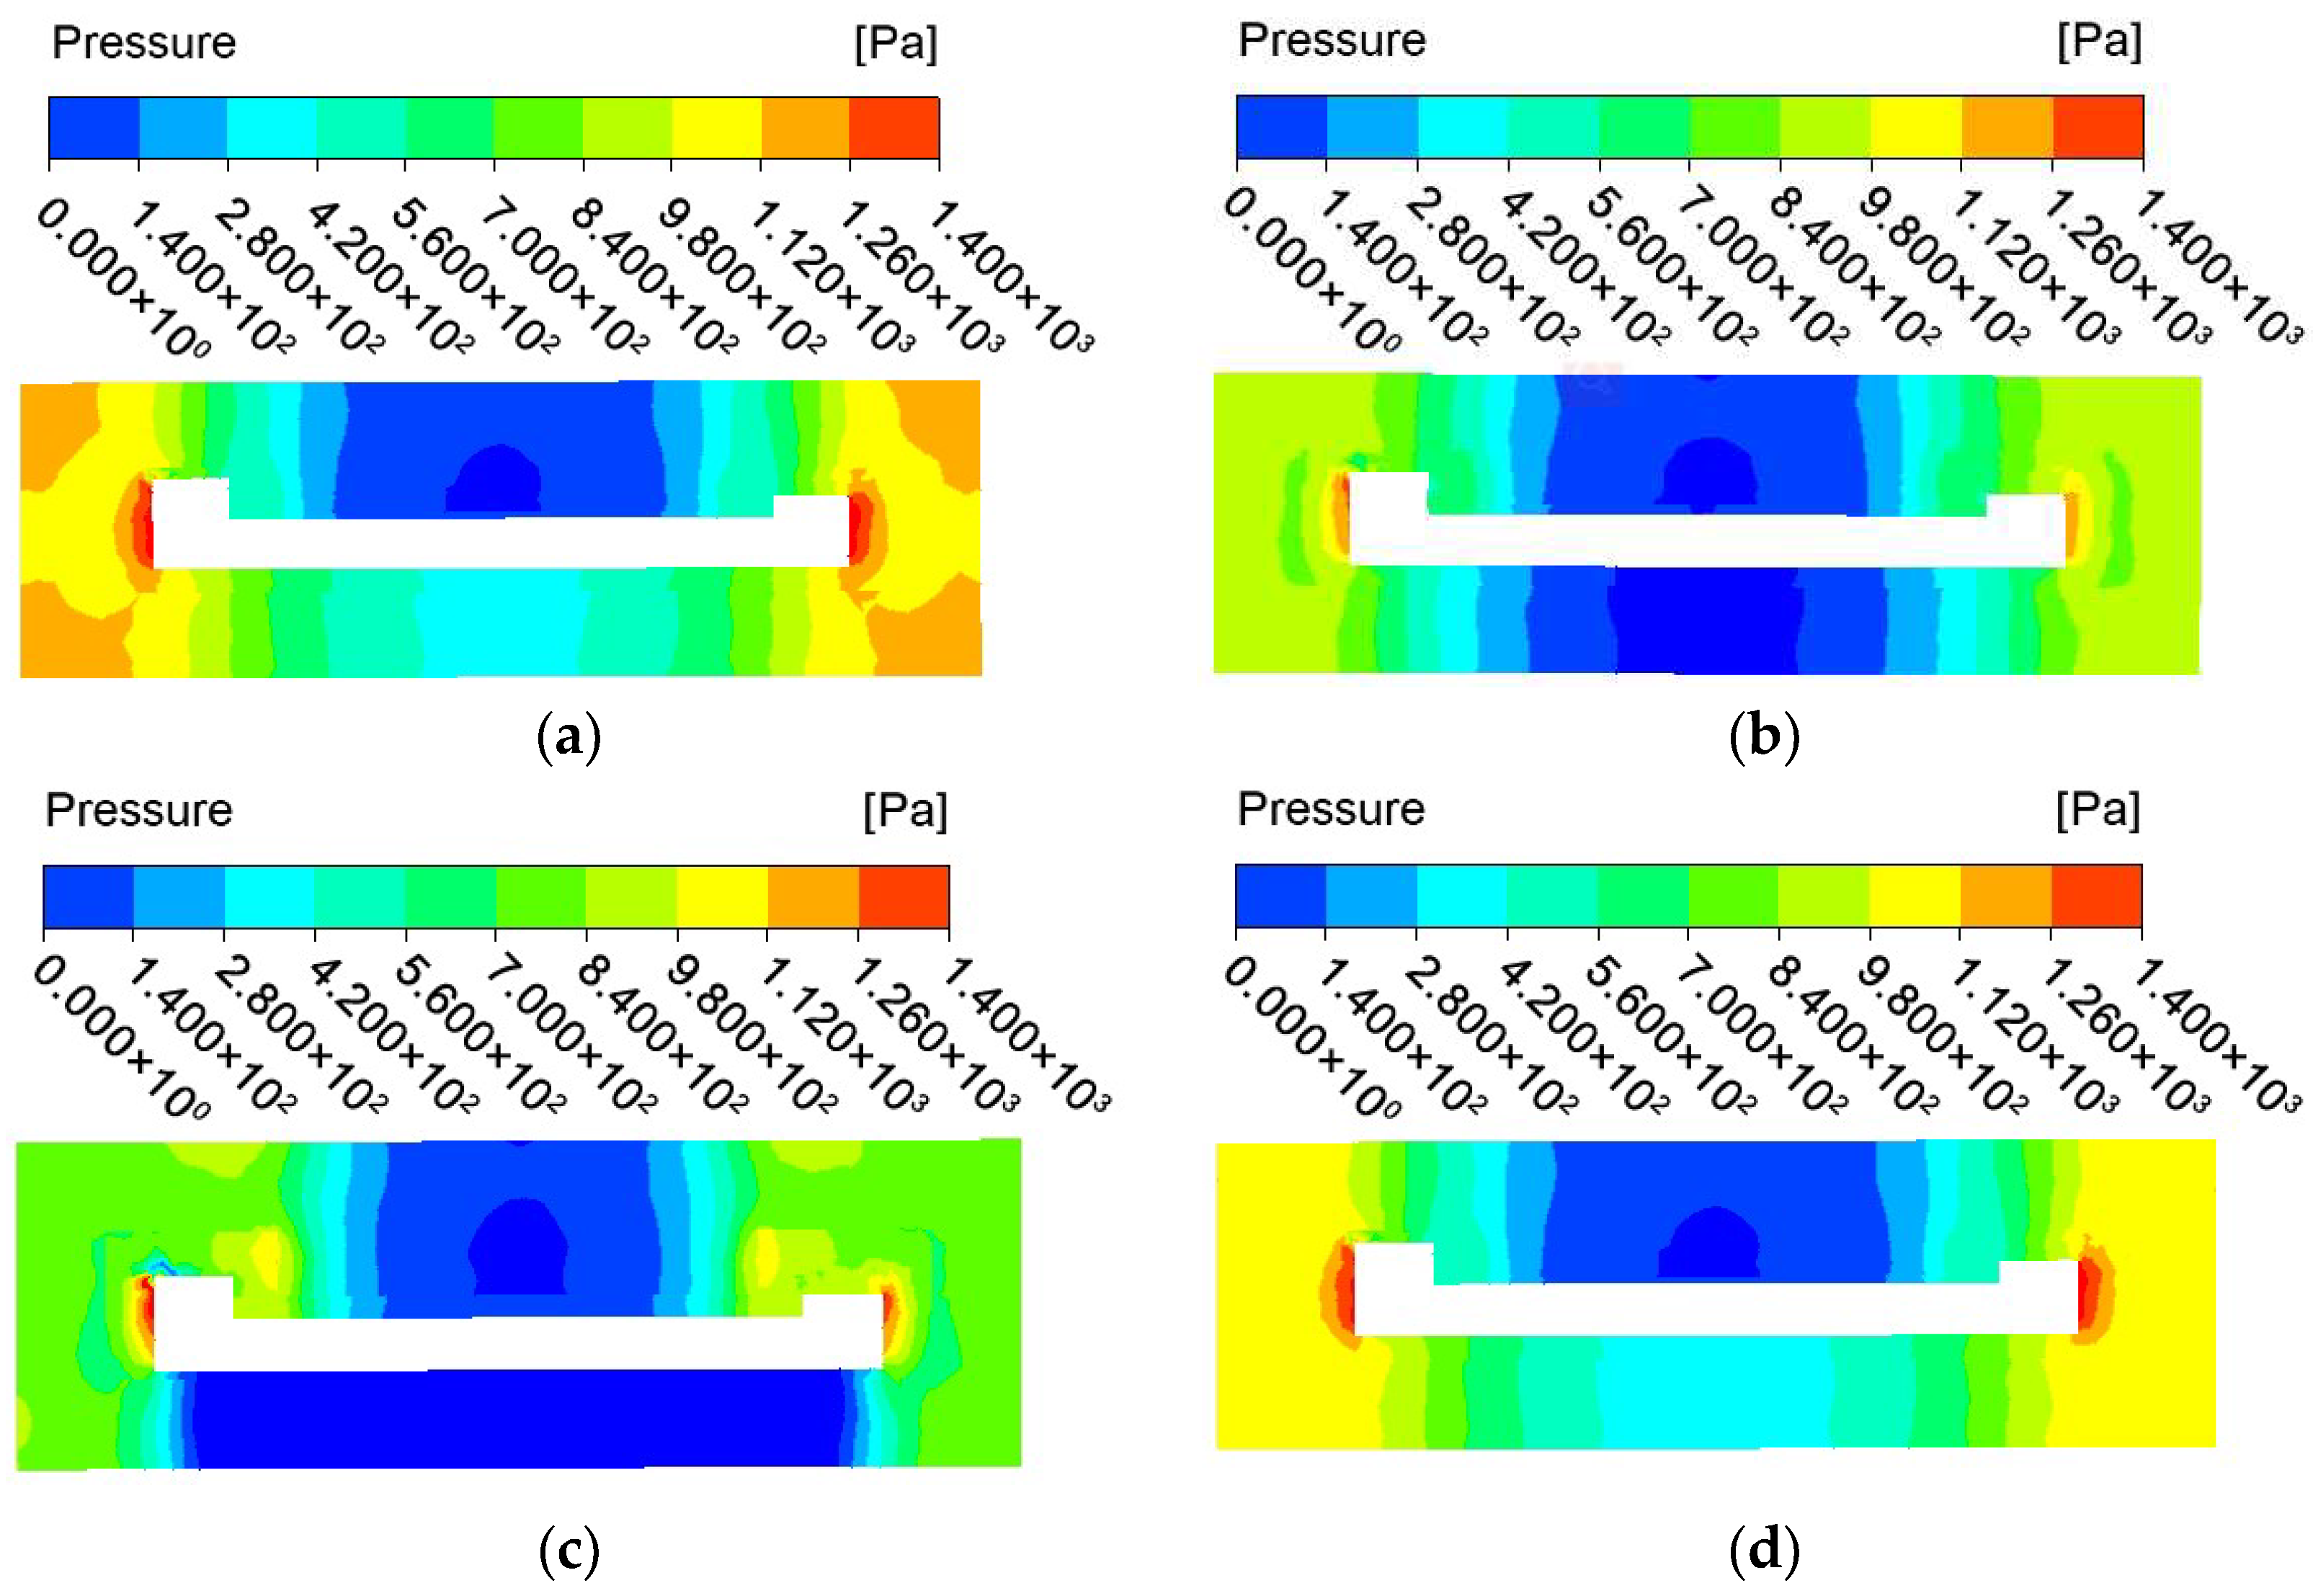
- The shroud can significantly reduce the windage losses of face gears. The distance from the shroud to the gear body in three directions has an effect on the windage losses, including the distance from the shroud to the tooth addendum, the distance from the shroud to the outer radius and the distance between the shroud and the inner radius.
- The distance from the shroud to the face gear addendum should not be as small as possible. As the distance decreases, the windage power loss decreases first and then increases. For the distances between the shroud and the outer radius and inner radius, the smaller the distance values are, the smaller the windage power loss—that is, the greater the efficiency of the face gear drive. Furthermore, the shroud that effectively reduces the windage loss of the face gear drive is recommended.
Author Contributions
Funding
Acknowledgments
Conflicts of Interest
References
- Feng, G.; Xie, Z.; Zhou, M. Geometric design and analysis of face-gear drive with involute helical pinion. Mech. Mach. Theory 2019, 134, 169–196. [Google Scholar] [CrossRef]
- Saribay, Z.B.; Bill, R.C.; Smith, E.C.; Rao, S.B. Geometry and Kinematics of Conjugate Meshing Face-Gear Pairs. J. Am. Helicopter. Soc. 2017, 62, 1–10. [Google Scholar] [CrossRef]
- Hu, Z.H.; Tang, J.Y.; Chen, S.Y.; Sheng, Z.H. Coupled translation-rotation vibration and dynamic analysis of face geared rotor system. J. Sound Vib. 2015, 351, 169–196. [Google Scholar] [CrossRef]
- Dai, Y.; Ma, F.; Zhu, X.; Su, Q.; Hu, X. Evaluation and Optimization of the Oil Jet Lubrication Performance for Orthogonal Face Gear Drive: Modelling, Simulation and Experimental Validation. Energies 2019, 12, 1935. [Google Scholar] [CrossRef]
- Pallas, S.; Marchesse, Y.; Changenet, C.; Ville, F.; Velex, P. Application and validation of a simplified numerical approach for the estimation of windage power losses in spur gears. Comput. Fluids 2013, 84, 39–45. [Google Scholar] [CrossRef]
- Fondelli, T.; Andreini, A.; Facchini, B. Numerical Investigation on Windage Losses of High-Speed Gears in Enclosed Configuration. AIAA J. 2018, 56, 1910–1921. [Google Scholar] [CrossRef]
- Dawson, P.H. Windage Loss in Larger High-Speed Gears. Proc. Inst. Mech. Eng. Part. A Power Process. Eng. 1984, 198, 51–59. [Google Scholar] [CrossRef]
- Dawson, P.H. High-speed gear windage. GEC Rev. 1988, 43, 164–167. [Google Scholar]
- Anderson, N.E.; Loewenthal, S.H.; Black, J.D. An Analytical Method to Predict Efficiency of Aircraft Gearboxes. J. Mech. Transm. Autom. Des. 1984, 108, 424–432. [Google Scholar] [CrossRef]
- Anderson, N.E.; Loewenthal, S.H. Efficiency of nonstandard and high contact ratio involute spur gears. J. Mech. Transm. Autom. Des. 1986, 108, 119–126. [Google Scholar] [CrossRef]
- Diab, Y.; Ville, F.; Velex, P.; Changenet, C. Windage losses in high speed gears—Preliminary experimental and theoretical results. J. Mech. Des. 2004, 126, 903–908. [Google Scholar] [CrossRef]
- Handschuh, R.F.; Hurrell, M.J. Initial Experiments of High-Speed Drive System Windage Losses; NASA TM-2011-216925; NASA: Washington, DC, USA, 2011.
- Farrall, M.; Simmons, K.; Hibberd, S.; Young, C. Computational Investigation of the Airflow Through a Shrouded Bevel Gear. In Proceedings of the GT2005 ASME Turbo Expo 2005: Power for Land, Sea and Air, Reno-Tahoe, Nevada, NV, USA, 6–9 June 2005. [Google Scholar]
- Eastwick, C.N.; Johnson, G. Gear Windage: A Review. J. Mech. Des. 2008, 130. [Google Scholar] [CrossRef]
- Johnson, G.; Simmons, K.; Foord, C. Experimental Investigation into Windage Power Loss From a Shrouded Spiral Bevel Gear. In Proceedings of the GT2007 ASME Turbo Expo 2007: Power for Land, Sea and Air, Montreal, QC, Canada, 14–17 May 2007. [Google Scholar]
- Hill, M.J.; Kunz, R.F.; Medvitz, R.B.; Handschuh, R.F.; Long, L.N.; Noack, R.W.; Morris, P.J. CFD Analysis of Gear Windage Losses: Validation and Parametric Aerodynamic Studies. J. Fluid. Eng. 2011, 133. [Google Scholar] [CrossRef]
- Concli, F.; Gorla, C.; Torre, A.D.; Montenegro, G. Windage power losses of ordinary gears: Different CFD approaches aimed to the reduction of the computational effort. Lubricants 2014, 2, 162–176. [Google Scholar] [CrossRef]
- Concli, F.; Gorla, C.; Della Torre, A.; Montenegro, G. Churning power losses of ordinary gears: A new approach based on the internal fluid dynamics simulations. Lubr. Sci. 2015, 27, 313–326. [Google Scholar] [CrossRef]
- Pallas, S.; Marchesse, Y.; Changenet, C. A windage power loss model based on CFD study about the volumetric flow rate expelled by spur gears. Mech. Ind. 2012, 13, 317–323. [Google Scholar] [CrossRef]
- Arisawa, H.; Nishimura, M.; Imai, H.; Goi, T. CFD Simulation for Reduction of Oil Churning Loss and Windage Loss on Aeroengine Transmission Gears. In Proceedings of the ASME Turbo Expo 2009, Orlando, FL, USA, 8–12 June 2009. [Google Scholar]
- Voeltzel, N.; Marchesse, Y.; Changenet, C.; Ville, F.; Velex, P. On the influence of helix angle and face width on gear windage losses. Proc. Inst. Mech. Eng. C-J. Mech. 2016, 230, 1101–1112. [Google Scholar] [CrossRef]
- Rapley, S.; Eastwick, C.; Simmons, K. The Application of CFD to Model Windage Power Loss from a Spiral Bevel Gear. In Proceedings of the GT2007 ASME Turbo Expo 2007: Power for Land, Sea and Air, Montreal, QC, Canada, 14–17 May 2007. [Google Scholar]
- Marchesse, Y.Y.; Changenet, C.C.; Ville, F.F.; Velex, P.P. Investigations on CFD Simulations for Predicting Windage Power Losses in Spur Gears. J. Mech. Des. 2011, 133. [Google Scholar] [CrossRef]
- Concli, F. Thermal and efficiency characterization of a low-backlash planetary gearbox: An integrated numerical-analytical prediction model and its experimental validation. Proc. Inst. Mech. Eng. J-J. Eng. 2016, 230, 996–1005. [Google Scholar] [CrossRef]
- Concli, F.; Gorla, C.; Stahl, K.; Höhn, B.-R.; Michaelis, K.; Schultheiß, H.; Stemplinger, J.P. Load independent power losses of ordinary gears: Numerical and experimental analysis. In Proceedings of the 5th World Tribology Congress, Torino, Italy, 8–13 September 2013. [Google Scholar]
- Delgado, I.R.; Hurrell, M.J. Baseline Experimental Results on the Effect of Oil Temperature on Shrouded Meshed Spur Gear Windage Power Loss. In Proceedings of the International Design Engineering Technical Conferences and Computers and Information in Engineering Conference, Cleveland, OH, USA, 6–9 August 2017. [Google Scholar]
- Seetharaman, S.; Kahraman, A. A Windage Power Loss Model for Spur Gear Pairs. J. Tribol. Trans. 2010, 53, 473–484. [Google Scholar] [CrossRef]
- Webb, T.; Eastwick, C.; Morvan, H. Parametric Modelling of a Spiral Bevel Gear Using CFD. In Proceedings of the Asme Turbo Expo 2010, Glasgow, Scotland, 14–18 June 2010. [Google Scholar]
- Aktas, M.K.; Yavuz, M.A.; Ersan, A.K. Computational Fluid Dynamics Simulations of Windage Loss in a Spur Gear. In Proceedings of the ASME Turbo Expo 2018 Turbomachinery Technical Conference and Exposition, Oslo, Norway, 11–15 June 2018. [Google Scholar]
- Concli, F.; Gorla, C. Numerical modelling of the churning power losses in planetary gearboxes: An innovative partitioning-based meshing methodology for the application of a computational effort reduction strategy to complex gearbox configurations. Lubr. Sci. 2017, 29, 455–474. [Google Scholar] [CrossRef]
- Concli, F.; Della Torre, A.; Gorla, C.; Montenegro, G. A New Integrated Approach for the Prediction of the Load Independent Power Losses of Gears: Development of a Mesh-Handling Algorithm to Reduce the CFD Simulation Time. Adv. Tribol. 2016, 2016, 2957151. [Google Scholar] [CrossRef]
- Winfree, D.D. Reducing Gear Windage Losses from High Speed Gears and Applying These Principles to Actual Running Hardware. In Proceedings of the ASME 2013 International Design Engineering Technical Conferences and Computers and Information in Engineering Conference, Portland, OR, USA, 4–7 August 2013. [Google Scholar]
- Litvin, F.L.; Fuentesm, A.; Howkins, M. Design, generation and TCA of new type of asymmetric face-gear drive with modified geometry. Comput. Methods Appl. Mech. Eng. 2001, 190, 5837–5865. [Google Scholar] [CrossRef]
- Litvin, F.L.; Fuentesm, A.; Zanzim, C. Face-gear drive with spur involute pinion: Geometry, generation by a worm, stress analysis. Comput. Methods Appl. Mech. Eng. 2002, 191, 2785–2813. [Google Scholar] [CrossRef]
- Guingand, M.; Vaujany, J.P.; Jacquin, C.Y. Quasi-static analysis of a face gear under torque. Comput. Methods Appl. Mech. Eng. 2005, 194, 4301–4318. [Google Scholar] [CrossRef]
- Wang, Y.; Song, G.; Niu, W.; Chen, Y. Influence of oil injection methods on the lubrication process of high speed spur gears. Tribol. Int. 2018, 121, 180–189. [Google Scholar] [CrossRef]
- Dai, Y.; Wu, W.; Zhou, H.; Zhang, J.; Ma, F. Numerical Simulation and Optimization of Oil Jet Lubrication for Rotorcraft Meshing Gears. Int. J. Simul. Model. 2018, 17, 318–326. [Google Scholar] [CrossRef]
- Hu, X.; Jiang, Y.; Luo, C.; Feng, L.; Dai, Y. Churning power losses of a gearbox with spiral bevel geared transmission. Tribol. Int. 2019, 129, 398–406. [Google Scholar] [CrossRef]
- Franco, C.; Carlo, G. Numerical modeling of the power losses in geared transmissions: Windage, churning and cavitation simulations with a new integrated approach that drastically reduces the computational effort. Tribol. Int. 2016, 103, 58–68. [Google Scholar]
- Massini, D.; Fondelli, T.; Andreini, A.; Facchini, B.; Tarchi, L.; Leonardi, F.F. Experimental and Numerical Investigation on Windage Power Losses in High Speed Gears. J. Eng. Gas Turbines Power 2018, 140. [Google Scholar] [CrossRef]


| Parameters | Values |
|---|---|
| Teeth number of the face gear | 51 |
| Module (mm) | 2.5 |
| Pressure angle (°) | 25 |
| Shaft angle (°) | 90 |
| Inner radius of the face gear (mm) | 64.0 |
| Outer radius of the face gear (mm) | 82.0 |
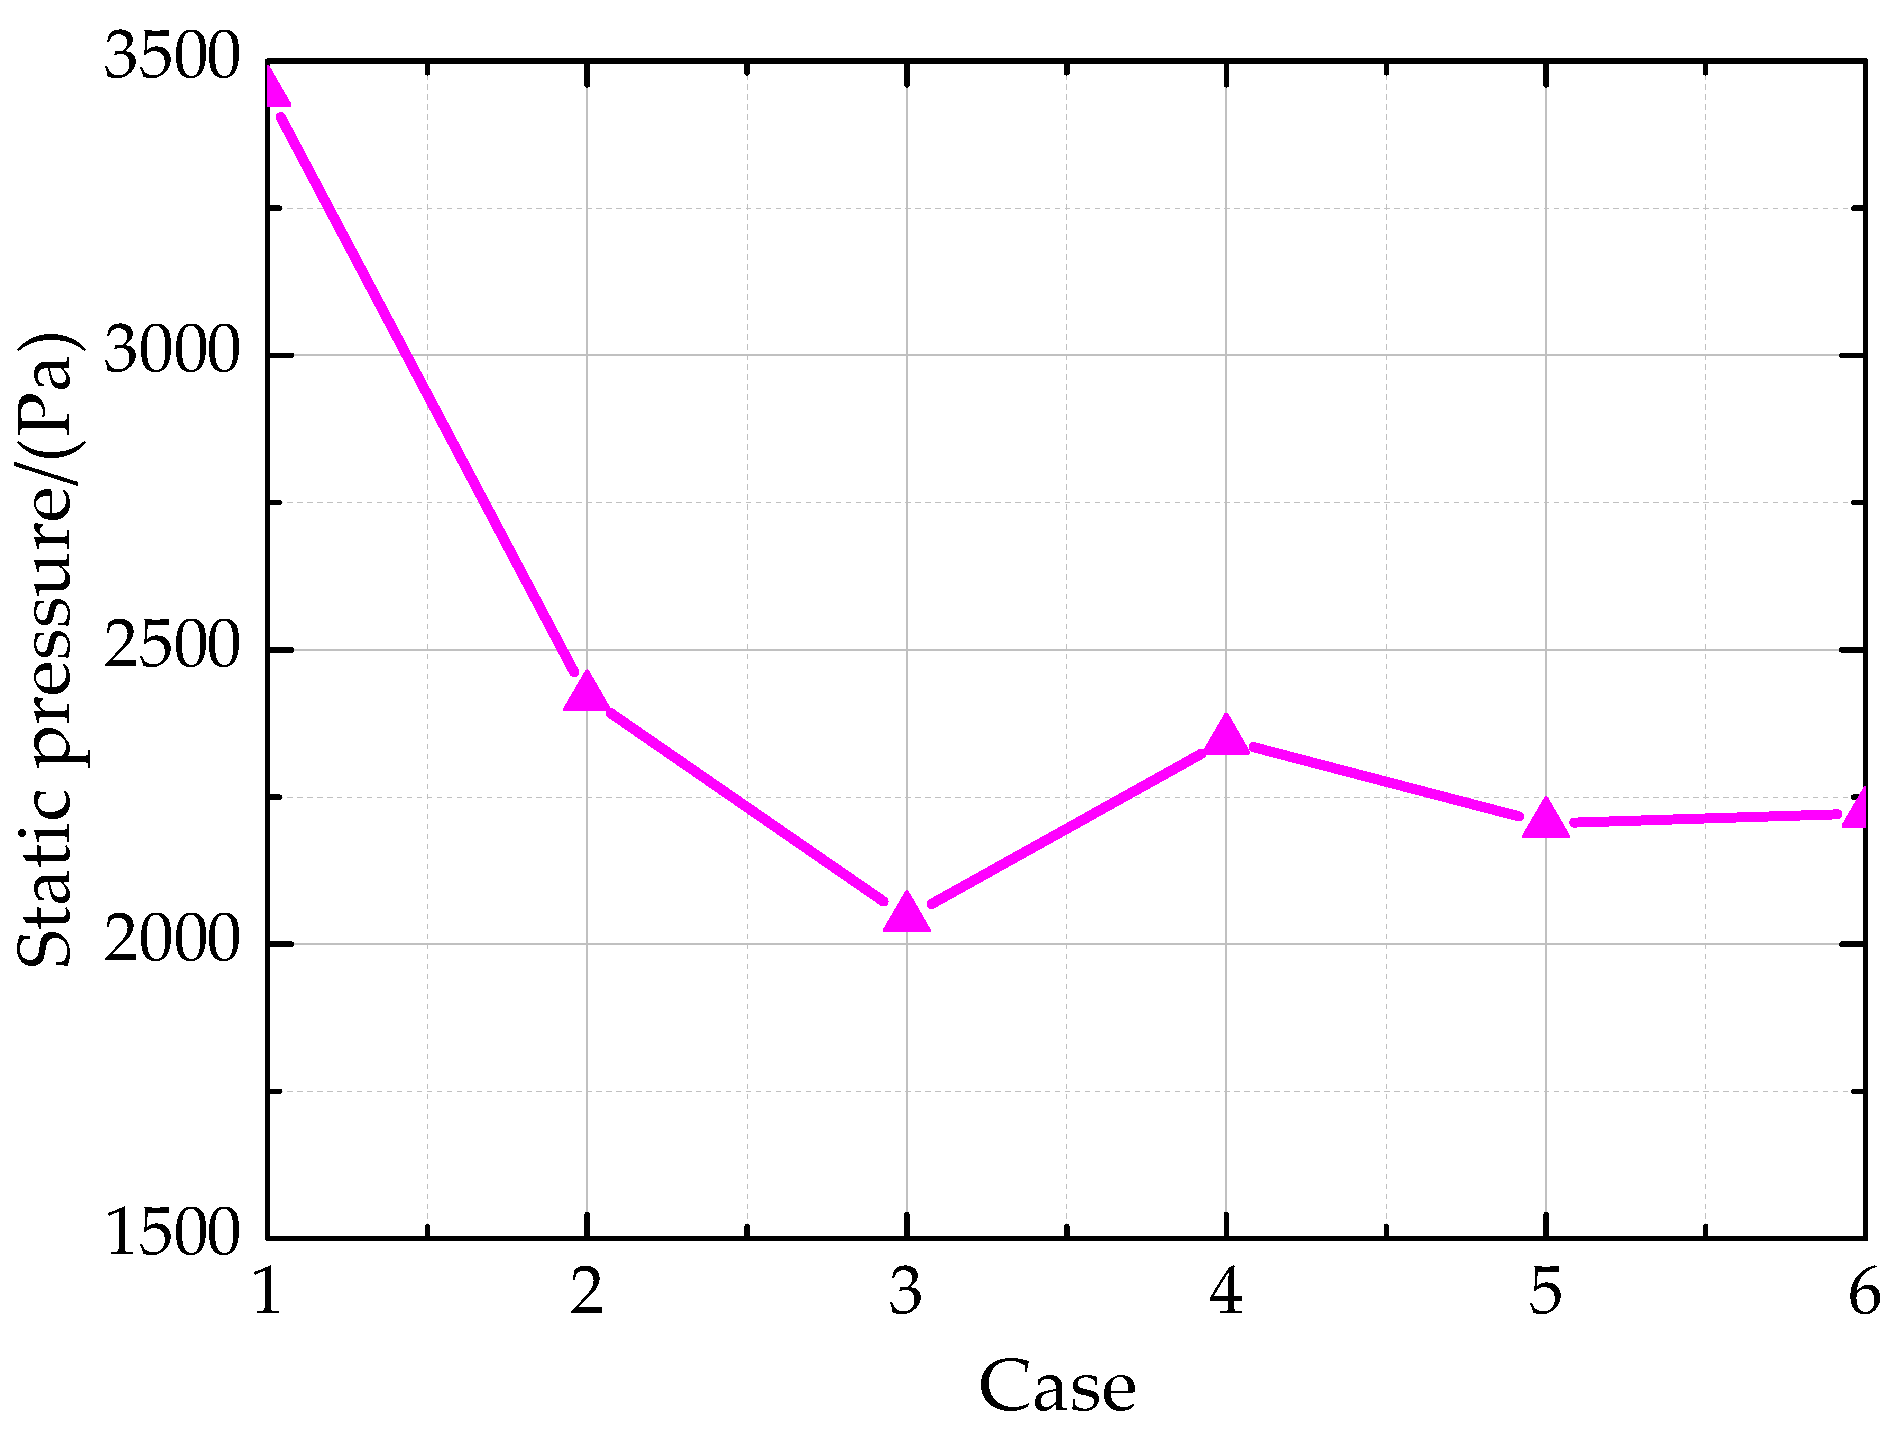
| Case | Total Mesh Elements |
|---|---|
| 1 | 412,752 |
| 2 | 657,916 |
| 3 | 895,308 |
| 4 | 1,157,804 |
| 5 | 1,305,782 |
| 6 | 1,549,800 |
© 2019 by the authors. Licensee MDPI, Basel, Switzerland. This article is an open access article distributed under the terms and conditions of the Creative Commons Attribution (CC BY) license (http://creativecommons.org/licenses/by/4.0/).
Share and Cite
Dai, Y.; Ma, F.; Zhu, X.; Jia, J. Numerical Simulation Investigation on the Windage Power Loss of a High-Speed Face Gear Drive. Energies 2019, 12, 2093. https://doi.org/10.3390/en12112093
Dai Y, Ma F, Zhu X, Jia J. Numerical Simulation Investigation on the Windage Power Loss of a High-Speed Face Gear Drive. Energies. 2019; 12(11):2093. https://doi.org/10.3390/en12112093
Chicago/Turabian StyleDai, Yu, Feiyue Ma, Xiang Zhu, and Jifu Jia. 2019. "Numerical Simulation Investigation on the Windage Power Loss of a High-Speed Face Gear Drive" Energies 12, no. 11: 2093. https://doi.org/10.3390/en12112093
APA StyleDai, Y., Ma, F., Zhu, X., & Jia, J. (2019). Numerical Simulation Investigation on the Windage Power Loss of a High-Speed Face Gear Drive. Energies, 12(11), 2093. https://doi.org/10.3390/en12112093