Article

Energy and Economics Analyses of Condenser Evaporative Precooling for Various Climates, Buildings and Refrigerants

Oak Ridge National Laboratory, Oak Ridge, TN 37830, USA
*
Author to whom correspondence should be addressed.
Energies 2019, 12(11), 2079; https://doi.org/10.3390/en12112079
Submission received: 29 April 2019 / Revised: 24 May 2019 / Accepted: 27 May 2019 / Published: 31 May 2019
(This article belongs to the Special Issue Energy Performance and Indoor Climate Analysis in Buildings)

Abstract

:
Condenser evaporative pre-coolers provide a low cost retrofit option for existing packaged rooftop air conditioning application units. This paper aimed to provide a comprehensive study to assess energy savings and peak power reductions of condenser evaporative cooling. Condenser evaporative cooling leads to a lower temperature of the air entering the condenser of a rooftop unit, which results in smaller compressor power consumption. Using EnergyPlus building energy simulations, we mapped the impacts on energy savings and energy reductions at peak ambient temperatures in three building types and 16 locations with levels of pad effectiveness and demonstrated the effects on air conditioner using either R22 or R410A as refrigerants. Economics and control strategy to maximize the cost saving were also investigated. The results demonstrate that energy savings are much greater for HVAC systems with the refrigerant R410A than they are with R22, and evaporative pre-cooling provides the opportunity for annual energy savings and peak demand reductions, with significant potential in hot, dry climates. Additionally, we validated an improved mathematical model for estimating the condenser pre-cooling wet bulb efficiency which shows clear advantage over the current EnergyPlus model.

1. Introduction

Evaporative cooling is a process that cools air through the simple evaporation of water. It is best suited for climates where the air is warm and dry (low humidity) because both conditions favor high rates of water evaporation that produce the desired cooling effect. Even in locations with moderate humidity, evaporative cooling may be used effectively, especially in the commercial and industrial sectors. In direct evaporative cooling, water is sprayed on a substrate that is placed in the air stream to be cooled. This technique may be used to cool indoor as well as outdoor air. When applied to outdoor air, the wetted media cools down the air entering the condenser coil and the process is called evaporative pre-cooling. Pre-coolers achieve energy savings because the entering air temperature to the condenser coil is lower, decreasing the lift imposed on the vapor compression cycle. These systems have the potential to be deployed immediately at scale for annual power savings and peak power demand reduction in many parts of the country at an attractive payback.
There have been many literatures addressing the evaporative pre-cooling effect around the world. Wu et al., [1] developed a simplified model to describe heat and mass transfer process in evaporative coolers, and validated the model against a wide range of air temperatures, humidities, velocities, and pad thicknesses, etc. They conducted numerical and analytical modeling practices for evaporative pre-cooling, and applied the model in four different regions in northwest China. Wu et al., [2] applied the same model to optimize the frontal air velocity for a given pad geometry. They demonstrated that the pre-cooling effects were significant for the desert climates in China. Waly et al., [3] evaluated the condenser evaporative pre-cooling option on a 2.8-ton/9.8 kW R-22 split unit in Kuwait, and they identified power savings ranging from 8.1 to 20.5%, as a result of the increase in coefficient of performance (COP) ranging from 36 to 59%. Hajidavalloo [4] investigated a window- size R-22 air conditioner with condenser pre-cooling in Iran. The experimental results demonstrated that the pre-cooling reduced the power consumption by 16% and increased COP by 55%. The author recommended using the pre-cooling technique in very hot climate zones, where the pay-back period for adding the condenser pre-cooling devices can be less than one year.
Goswani et al., [5] performed an experimental investigation of performance of a residential air conditioning system with an evaporatively-cooled condenser, based on a 2.5-ton/8.8 kW residential air conditioning system. For the residential application, they investigated seven U.S. locations (Miami, Orlando, Jacksonsville, Key West, Panama City, Fort Meyers and Tampa). It should be noted that the seven locations include a very humid climate zone like Panama City, where the evaporative pre-cooling saving is less significant. At the end, they concluded the payback periods to cover the retrofit cost (pad, pipe, pump, etc.) are less than 2 years. Yu et al., [6] used mist precooling to enhance efficiency of an air-cooled chiller. They concluded that the mist precooling could increase the coefficient of performance up to 10.2%. Liu et al., [7] applied an evaporative-condenser in a gas-engine drive heat pump system, and their experimental results showed that the efficiency increase due to the evaporative condenser was 28.1%, as compared to an air-cooled condenser. Xuan et al., [8] conducted a comprehensive review of evaporative cooling technologies as applied in China. Kim et al., [9] used direct and in-direct evaporative cooling in a 100% outdoor air system. They observed more significant energy savings in the intermediate season than the cooling season. Eidan et al., [10] studied the effects of condenser evaporative pre-cooling on a small window air conditioner in Iraq’s climate where the air temperature can reach 55 °C. They reported that the precooling was able to extend the working range to the extreme temperature, and reduce peak power consumption. The evaporative pre-cooling enabled the compressor to work at 16% lower voltage than 220 V.
The above literatures indicate significant saving potentials and short pay-back periods worldwide using condenser evaporative pre-cooling techniques, but these investigations have been limited in equipment, building types, climate zones, etc. Especially, we didn’t find much investigation related to U.S. commercial applications. In order to promote the quick and wide application of the pre-cooling technique in the U.S. market, we need to extensively assess this promising technique covering all the variances of equipment, buildings and climates, etc. This work intends to provide a comprehensive reference evaluation, in terms of annual energy savings, peak power reduction, water consumption, payback period, for applying the condenser evaporative pre-cooling technique nationwide.
We introduced a mathematical model to correlate the wet bulb efficiency of an evaporative-precooling pad, which requires less data points for fitting and has better accuracy than the current model used in EnergyPlus [11]. The model comparison was based on a manufacturer’s data in a wide range of pad thicknesses and frontal air velocities. Next, EnergyPlus was used to conduct parametric simulation studies covering sixteen US cities, three commercial buildings, three generations (present, before 1980 and post-1980) of rooftop air conditioners using two refrigerants (R-22 and R-410A), respectively. Energy and economics saving potentials were revealed with respect to the multiple influential factors.

2. Mathematical Models

To model the evaporative cooling heat and mass transfer process, the basic assumptions generally include the following: the pad is fully wet, and is exposed to entering air of uniform temperature, humidity and velocity. The boundary layer between the entering air and the wet pad is saturated air at the pad surface temperature. The pad surface has a uniform bulk temperature, i.e., no heat and mass transfer occur within the pad structure. The pad’s thermal capacity and transient temperature change are ignored. There is no heat transfer from the surroundings, other than the entering air.
EnergyPlus [11] is capable of simulating direct evaporative cooling for both indoor as well as outdoor components. Described by EnergyPlus [11], the parameter for gauging efficiency of the evaporative pre-cooling process is the wet bulb (WB) efficiency, which is a measure of the drop in the dry bulb temperature due to the evaporative process. The wet bulb efficiency, Ewb, is defined in Equation (1) as:
E w b = T d b , i T d b , o T d b , i T w b , i
where E w b is the wet bulb efficiency; T d b , i and T d b , o are the entering and leaving air dry bulb temperatures, respectively; and T w b , i is the entering air wet bulb temperature. The maximum possible wet bulb efficiency can be unity when the leaving air dry bulb temperature is cooled to the entering wet bulb temperature. If the wet bulb efficiency is zero, the pad, substrate, or media is dry and evaporative cooling effect is absent.
In EnergyPlus [11], evaporative cooling is treated as a heat transfer process between air and water, following a constant wet bulb temperature line in the psychrometric chart. The media geometry (thickness) and the face velocity (the velocity of air entering the outer surface of the media) are major independent variables that impact the wet bulb efficiency. Other factors like supply water temperature, flow rate, and external heat to the water stream have relatively minor impact. For direct evaporative cooling, EnergyPlus simulates the WB efficiency using a curve-fit polynomial equation with media thickness (Depth) and face velocity (Velocity) as the independent variables, as depicted in Equation (2):
E w b = a 1 + a 2 ( D e p t h ) + a 3 ( V e l o c i t y ) + a 4 ( D e p t h 2 ) + a 5 ( V e l o c i t y 2 ) + a 6 ( D e p t h · V e l o c i t y ) + a 7 ( D e p t h 2 · V e l o c i t y ) + a 8 ( D e p t h · V e l o c i t y 3 ) + a 9 ( D e p t h 3 · V e l o c i t y ) + a 10 ( D e p t h 2 · V e l o c i t y 3 ) + a 11 ( D e p t h 3 · V e l o c i t y 2 )
The EnergyPlus curve-fit form of calculating evaporative cooling efficiency requires a large body of empirical data to obtain the 11 parameters required in the equation and, being a curve fit, is also not physically meaningful.
Braun et al., [12] presented an innovative effectiveness-NTU approach to model a wide range of cooling towers and cooling coils. Through detailed analytical work, Braun et al., [12] treated the simultaneous heat and mass transfer process between sprayed water and entering air as an enthalpy-potential-driven process, characterized by a Lewis Number of unity. Since the Lewis Number is defined as the ratio of thermal diffusivity to mass diffusivity, a value of unity means that the thermal and mass exchanges are of equal significance. Braun et al., [12] proposed three new operational concepts in their model of simultaneous heat and mass transfer process: (1) that the heat and mass transfer rates are proportional to the difference of the enthalpy of saturated air at the entering water temperature and the enthalpy of entering air; (2) introduced a new parameter C s called the specific heat of saturated air, which can be obtained as in Equation (4); (3) defined the ratio of saturated air specific heat flow rate to the water specific heat flow rate, m * as in Equation (5):
Q ˙ =   E H · m ˙ a i r ( H s , w a t e r , i H a i r , i )
C s   [ d H s d T ] T = T w a t e r
m * =   m ˙ a i r · C s m ˙ w a t e r   · C P w a t e r
where:
Q ˙ = total energy transfer rate,
H s , w a t e r , i = enthalpy of saturated air at the entering water temperature,
H a i r , i = enthalpy of entering air,
E H = heat and mass transfer effectiveness, defined later in Equation (7).
With these three operational concepts, Braun et al., [12] defined the number of transfer units (NTU) and the effectiveness E H for evaporative cooling by a simple mathematical form. The NTU and E H both maintain the same form as that for sensible heat transfer applicable to a wide range of counter, parallel and cross-flow geometries. Assuming constant water temperature on the surface of the wet media, we can get E H in the form of Equation (7). Thus:
N T U = h a · A s u r f a c e m ˙ a i r · C P a i r
E H =   T d b , i T d b , o T d b , i   T s , w a t e r = 1 exp ( N T U )
where:
h a = heat transfer coefficient between air and water stream,
A s u r f a c e = heat transfer surface area, usually taken as the pad area,
m ˙ a i r = mass flow rate of dry air,
C P a i r = specific heat of dry air at dry bulb conditions,
T s , w a t e r = water surface temperature (constant).
It should be noted that Braun et al., [12] defined the wet bulb efficiency, E H (Equation (7)) more generally than is described by E w b in Equation (1). In the case of direct evaporative cooling, if the amount of water that is sprayed is much less than the amount of water resident on the pad, i.e., sensible water heat transfer is negligible, then T s , w a t e r T w b , i and E H becomes identical to E w b . In practice, we want the amount of water sprayed on the pad to be small and, in fact, commercial equipment makers control water supply very diligently to apply a fine mist, just enough to wet the pad surface area.
Under these conditions, Wu et al., [1] combined Equation (1) and Equation (7), taking T s , w a t e r = T w b , i to yield:
E w b = E H = 1 exp ( N T U )
Further, Wu et al. [2] formulated the following equations for the air heat transfer coefficient, h a , the surface area for evaporative cooling, A s u r f a c e , and the air mass flow rate:
h a = a × V a i r m
A s u r f a c e = c × δ × A F
m ˙ a i r =   ρ a i r × V a i r × A F
where a, c, and m in Equations (9) and (10) are constants specific to the pad geometry, δ is the pad thickness, and ρ a i r is the density of ambient air [kg/m3]. V a i r is the frontal air velocity [m/s]. Substituting m ˙ a i r from Equation (11) in Equation (6) gives the final form for the NTU:
N T U =   α · δ ρ a i r × C P a i r × V a i r n
where α and n are empirical constants specific to the pad.
An overall mass balance on water gives the water mass flow rate in terms of the humidity ratios of the entering and leaving air, ω a i r , i and ω a i r , o [kg water/kg dry air], respectively, given by:
m ˙ w a t e r =   m ˙ a i r ( ω a i r , i ω a i r , o )
Based on the approaches of Braun et al., [12] and Wu et al., [1] our proposed coupled heat and mass transfer model utilizes Equations (3), (7) and Equations (8)–(13) to solve for m ˙ w a t e r and T s , w a t e r iteratively.
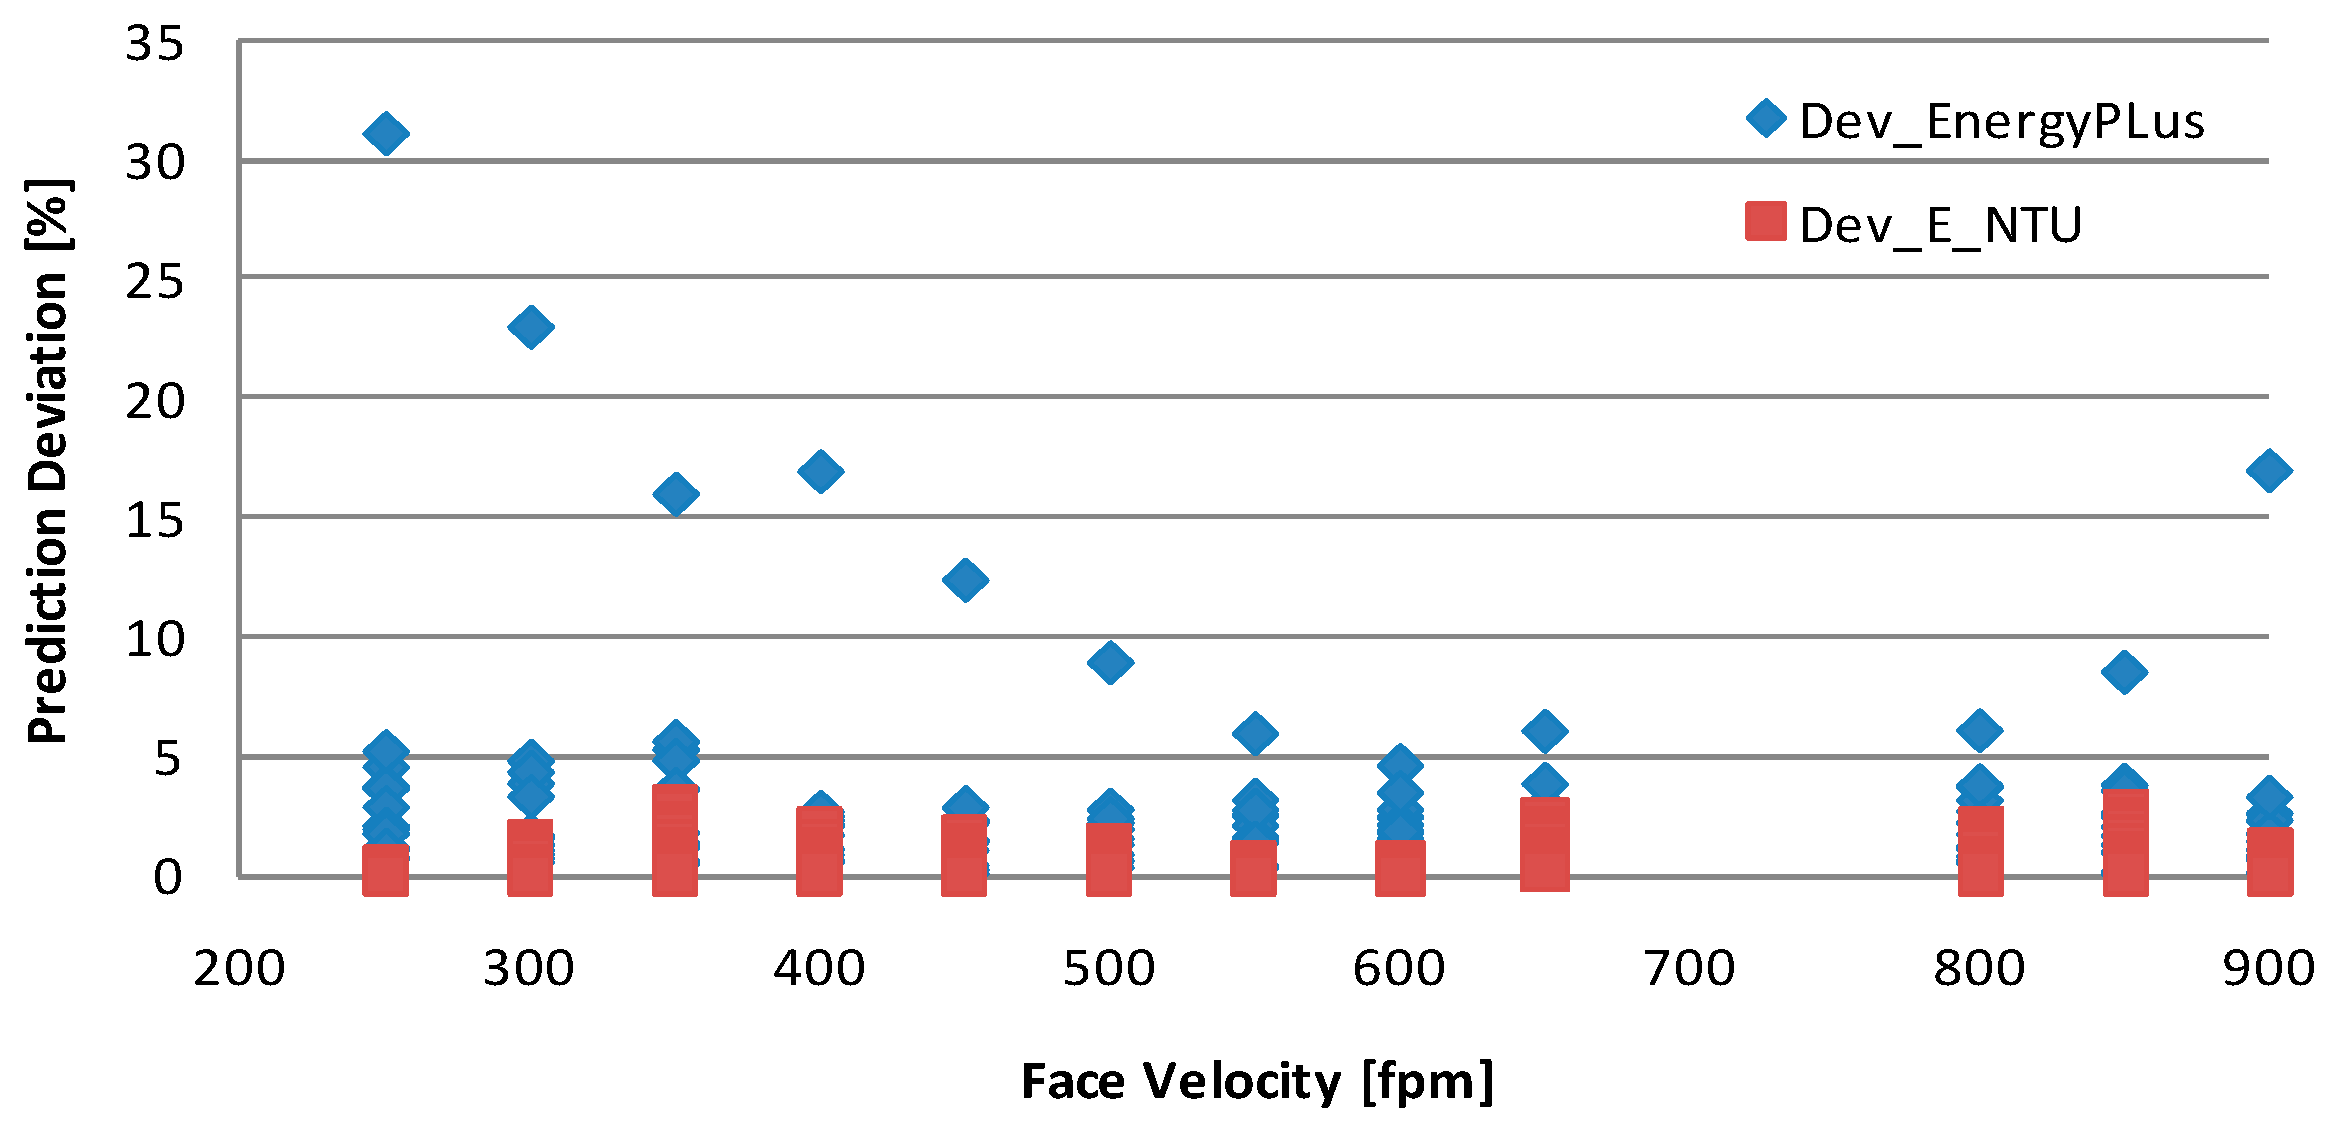
All the equations above from the references are used for the model validation in the section below. Our approach to model validation is based on a comprehensive set of manufacturer’s performance data for a specific type of evaporative pad. The data set consists of 13 levels of pad thicknesses ranging from 1 in to 24 in (0.025 m to 0.61 m), frontal air velocities from 250 fpm to 900 fpm (1.3 to 4.6 m/s) (12 levels) and wet bulb efficiencies ranging from 17.5% to 99.6%. The 12×13 matrix of data points were used to fit the coefficients from a 1 through a 11 for the polynomial curve fit used by EnergyPlus as depicted by Equation (2), and to obtain the parameters α and n used in Equation (12) by Braun’s model.
Our criteria for deciding goodness of a model is to demonstrate how closely the model predicts the measured data gathered by the manufacturer. A good model will show small deviations from actual field measurements. Figure 1 compares the predicted deviations of the EnergyPlus polynomial curve-fit calculations of the wet bulb efficiency and the effectiveness-NTU model versus manufacturer’s data. The effectiveness-NTU method is significantly more accurate with prediction errors having a standard deviation of 0.67% with maximum deviation of 2.9%. In contrast, EnergyPlus with the polynomial curve-fitted equation has a standard deviation of 4% with a maximum deviation of 31%. Prediction deviations are defined as (Model Prediction—Manufacturer’s data)/Manufacturer’s data. We compared the predictions over a wide range of face velocities. With EnergyPlus, big outliers are observed at the upper and lower bounds of the face velocity, whereas for the effectiveness-NTU approach, the predictions are closer and uniformly distributed across a wide range of face velocities even at the upper and lower bounds of face velocity. These simulations are shown in Figure 1.
On the basis of these comparisons, we conclude that the effectiveness-NTU model is easier to use, and yet gives much better agreement with manufacturer’s data than the approach used in EnergyPlus for evaporative cooling. The current EnergyPlus requires constant wet bulb efficiency for modeling condenser evaporative pre-cooling at each equipment speed. So the effectiveness-NTU model can be an efficient tool to predict the wet bulb efficiency as an input to EnergyPlus, based on the actual pad geometry and condenser frontal air velocity.
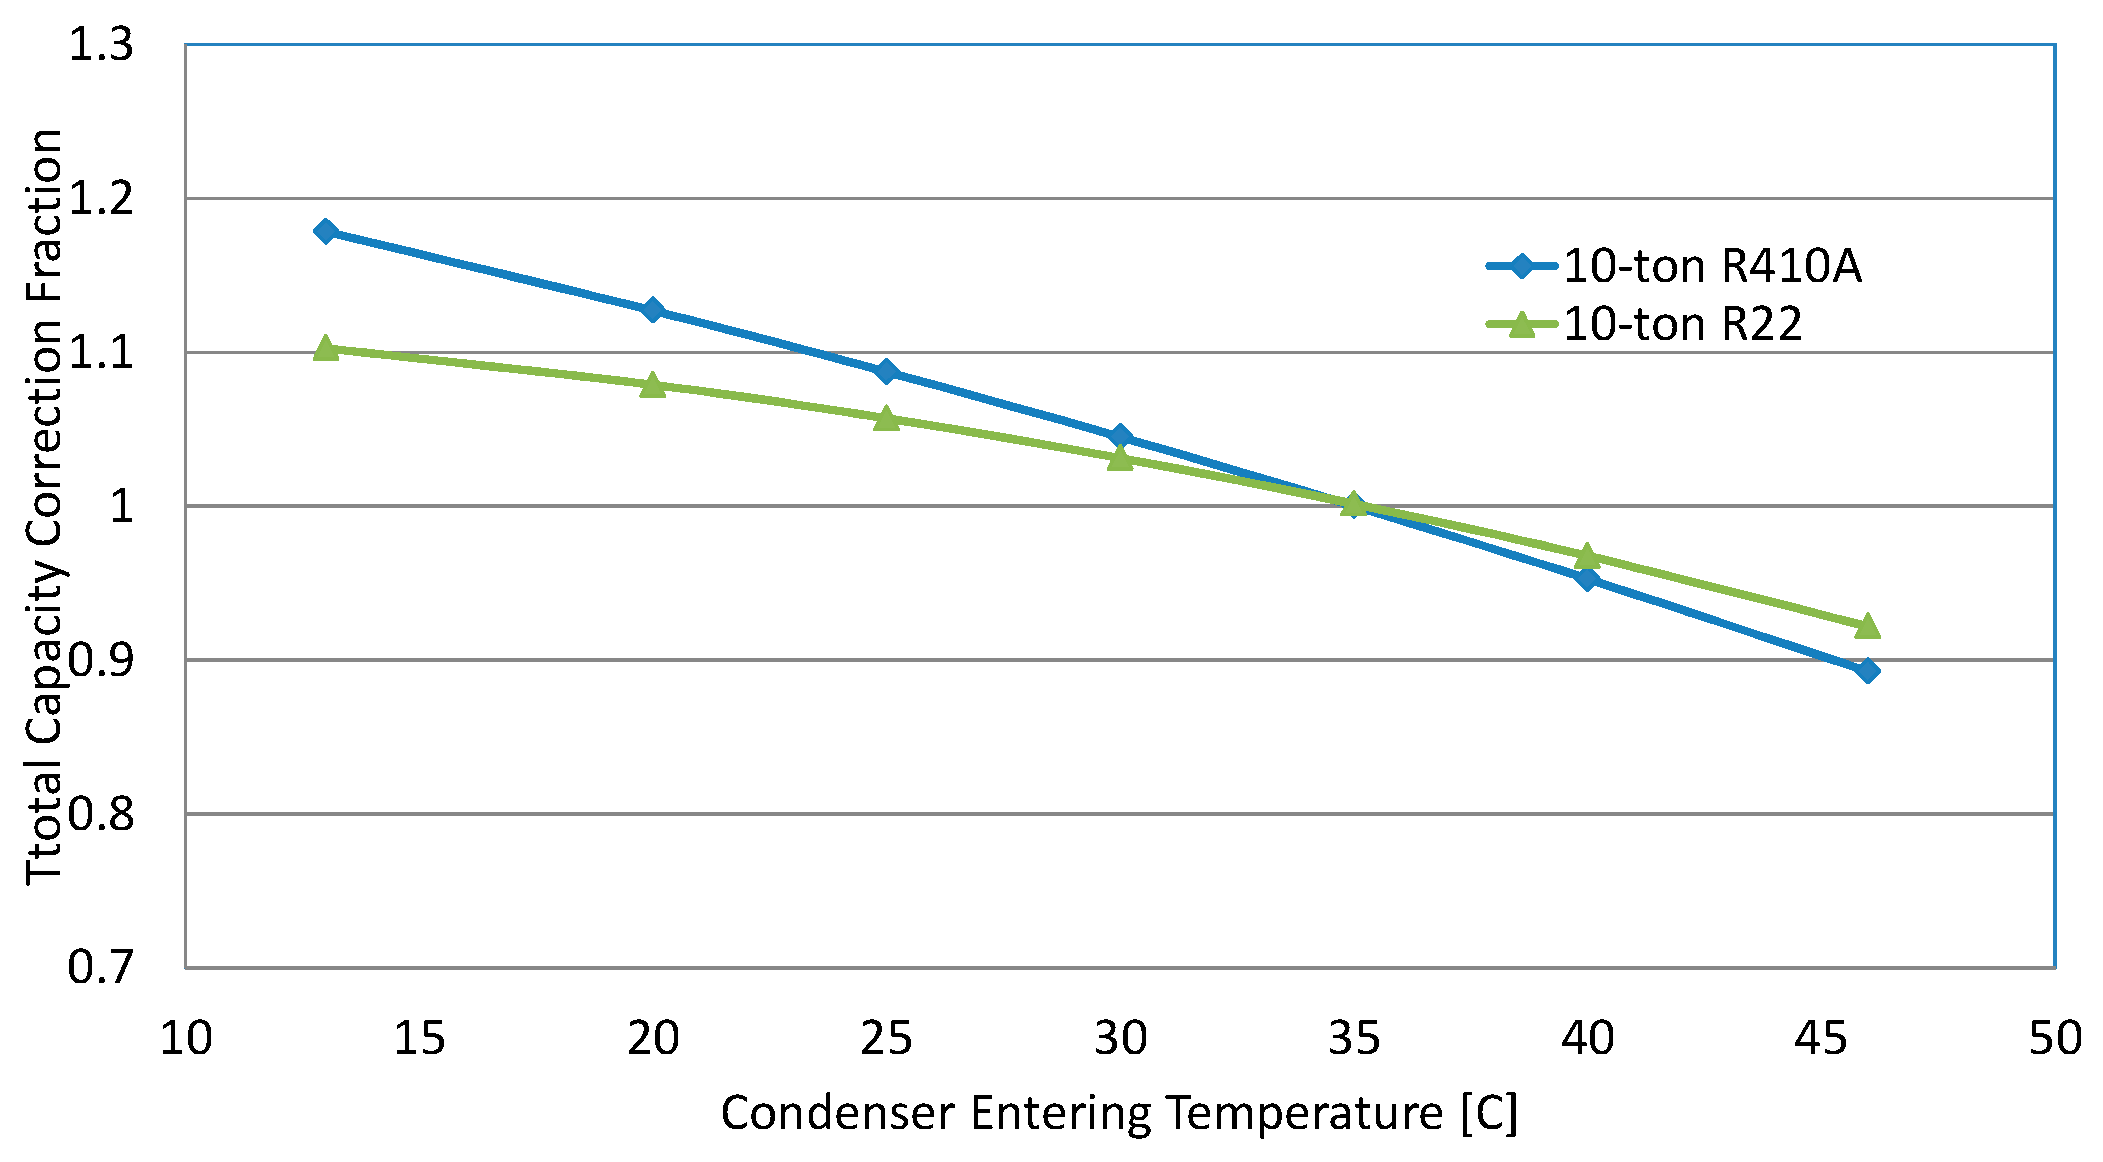
We used EnergyPlus to conduct parametric building energy simulations. In EnergyPlus, direct-expansion (DX) air conditioners, i.e., rooftop air conditioners, are modeled in the form of performance curves. The equation forms are given as below:
C A P F T c o i l , c o o l i n g =   a + b * T w b , i + c * T w b , i 2 + d * T o + e * T o 2 + f * T w b , i * T o
Q ˙ c o i l ( i ) , c o o l i n g , t o t a l =   Q ˙ c o i l ( i ) , c o o l i n g , r a t e d * C A P F T c o i l , c o o l i n g
where C A P F T c o i l , c o o l i n g = Coil Cooling Capacity Correction Factor (function of temperature); Q ˙ c o i l ( i ) , c o o l i n g , t o t a l = unit total (sensible + latent) cooling capacity [W]; Q ˙ c o i l ( i ) , c o o l i n g , r a t e d = rated total (sensible + latent) cooling capacity [W]; T w b , i = wet-bulb temperature of the air entering the cooling coil (°C); To = temperature of the air entering an outdoor heat exchanger (°C); and a f = bi-quadratic equation coefficients for Cooling Capacity Correction Factor.
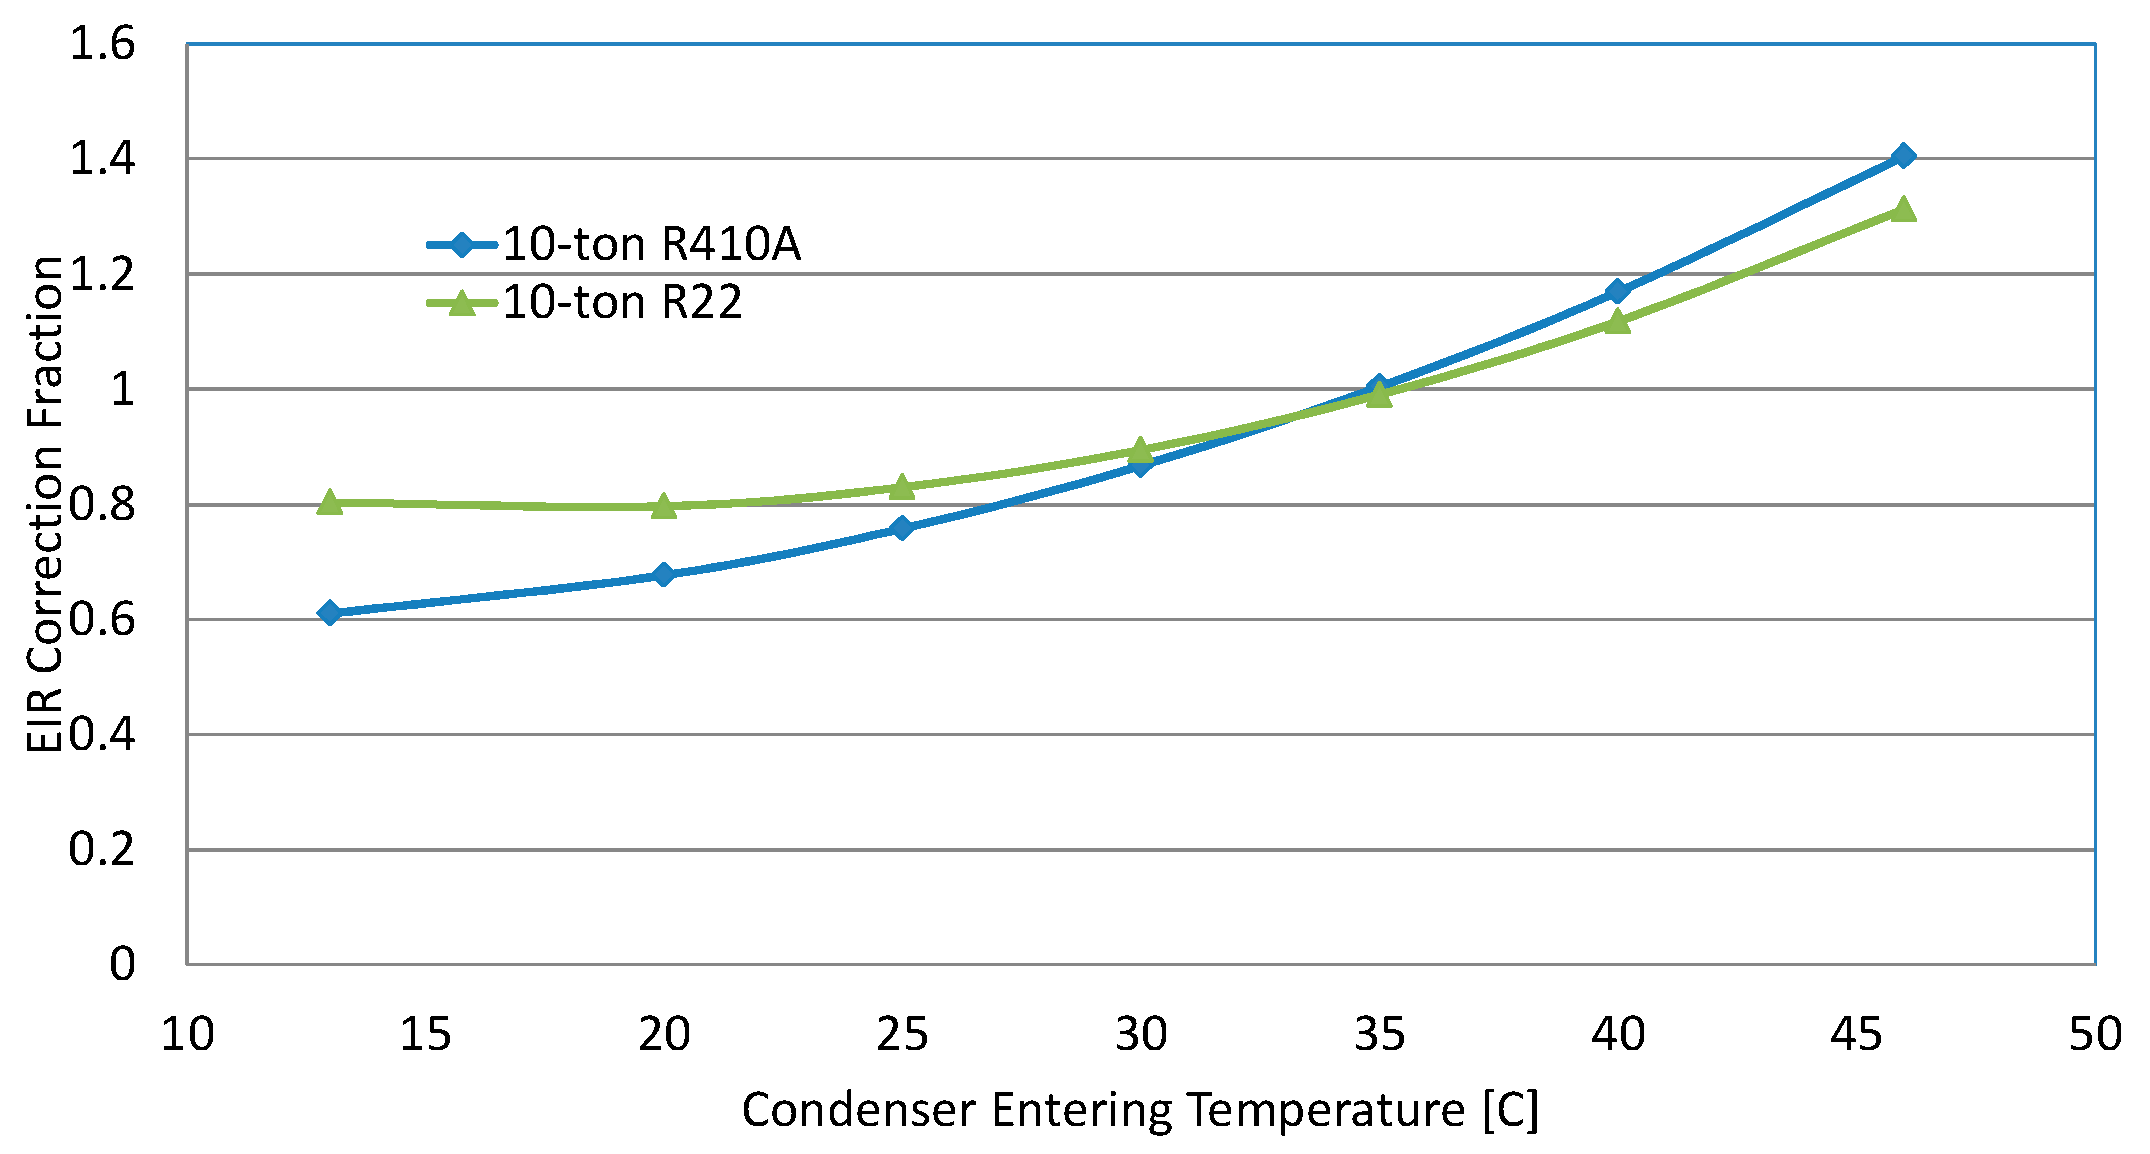
The DX cooling coil energy input ratio (EIRFT) also depends on the wet-bulb temperature of the air entering the cooling coil and ambient temperature.
E I R F T c o o l i n g =   a + b * T w b , i + c * T w b , i 2 + d * T o + e * T o 2 + f * T w b , i * T o
C O P c o o l i n g =   C O P c o o l i n g , r a t e d / E I R F T c o o l i n g
E I R F T c o o l i n g = the cooling energy input ratio correction factor (function of temperature). C O P c o o l i n g , r a t e d is the unit rated COP. The rated conditions for obtaining the capacities, COPs and SHRs are at an indoor dry-bulb temperature of 26.67 °C (80 °F), wet bulb temperature of 19.44 °C (67 °F), and condenser entering air temperature of 35 °C (95 °F).
For simulating a unit with an evaporatively cooled condenser, EnergyPlus simply corrects the condenser entering air temperature T c , i in the form as Equation (18):
T c , i = T w b , o + ( 1 E w b ) * ( T d b , o T w b , o )
where T d b , o and T w b , o are the ambient dry bulb and wet bulb temperatures, respectively. Since the condenser air velocity and the evaporative pad thickness are usually fixed for an existing rooftop unit, the E w b can be inputted as a constant value for a building simulation case at one fixed condenser air flow rate.
EnergyPlus auto-sizes rooftop equipment to match building sensible loads under design days—the statistically hottest day in summer. Operating conditions in design days would vary regarding to locations. Working as a safety factor, the equipment sizing factor is set to scale the equipment rated capacity. If the sizing factor is larger than unity, it means the equipment is oversized in comparison to the required building sensible load. Consequently, the building comfort level is increased, but at the expense of the cyclic loss. However, the equipment sizing factor might vary according to building type, since an individual building type might have a specific comfort level regulation.
EnergyPlus is capable of simulating single-speed, two-speed and multiple-speed rooftop equipment. For two-speed equipment, EnergyPlus uses the rated capacity at high speed to match the building peak sensible load in design days, and the rated capacity at low speed would be assumed as 1/3 of the rated value at the high speed. In addition, for two-speed equipment, we can input evaporative pre-cooling wet bulb efficiency specific to each speed and condenser air flow level.
Certainly, for modeling condenser evaporative pre-cooling, we need to consider the expense in exchange of the energy saving, which are water evaporation and pump power consumed. In EnergyPlus, the evaporative condenser pump rated power consumption is modeled as the total cooling capacity times 0.004266 Watts pump power per Watt rated capacity, i.e., 15 W/ton. For two-speed rooftop equipment, at low speed, the pump power is set equal to 1/3 times the total cooling capacity times 0.004266 Watts pump power per Watt capacity. It should be mentioned that we ignored the extra condenser fan power due to adding the precooling pad upstream of the condenser, since the condenser fan power consumption is less than 10% of the total equipment power consumption, and the extra fan power caused by the precooling pad is marginal, i.e., 2 to 3% to the total power.
The water consumption rate is calculated by the difference between the entering and exit air specific humidity multiplied by the condenser air mass flow rate. A standard rated condenser air flow rate is between 0.00004027 m3/s and 0.00006041 m3/s per Watt of rated total cooling capacity, i.e., 300–450 cfm/ton. The water evaporation amount would be integrated along the running time fraction during operation.

3. Parametric Building Energy Simulations

3.1. Performance Curves of Different Refrigerants

For air conditioning application at high ambient temperature, R-410A usually works under near-critical conditions. With increasing ambient temperature, particularly above 35 °C (95 °F), the equipment performance of R-410A can degrade much faster than that of R-22. Payne et al., [13] compared an R-22 and an R-410A air conditioner operating at high ambient temperature. The two air conditioner systems were tested using the same evaporator and condenser heat exchangers. The capacity and COP of the R-410A system was compared to those of the R-22 system in terms of normalized ratios. The capacities of R-22 and R-410A systems matched each other at 35 °C and COPs matched each other at 27 °C. With changing the ambient temperature from 25 °C to 55 °C, the capacity normalized ratio, R-410A versus R-22, degraded from 1.05 to 0.90, and the COP ratio was reduced from 1.05 to 0.80. The results implied that the R-410A system was more sensitive to the increased outdoor temperature. Rice [14] conducted a comprehensive system simulation studies comparing R-410A to R-22, which basically confirmed the same conclusion.
The condenser evaporative pre-cooling achieves energy savings by lowering the air temperature entering the condenser coil. Consequently, the energy saving effect is directly related to how the working refrigerant responds to the entering air temperature. To have a direct comparison, we obtained product literature and reduced the data in the forms of EnergyPlus equipment performance curves (Equations (14)–(17)). The comparisons of the performance curves at the full compressor capacity between a 10-ton (rated cooling capacity of 35.2 kW) R-22 rooftop unit and a 10-ton R-410A rooftop unit can be seen in Figure 2 and Figure 3. Both the units have a rated cooling COP of 3.0 at 35 °C (95 °F) outdoor air temperature and 26.7 °C DB/19.4 °C WB (80 °F DB/67 °F WB) indoor air, With fixing indoor wet bulb temperature at 67 °F (19.4 °C), Figure 2 shows the capacity correction ratio (capacity at various ambient temperatures versus the rated capacity at 35 °C) and Figure 3 shows the EIR correction ratio (EIR at individual temperatures versus the rated EIR), as a function of the air temperature entering the condenser coil. At 35 °C, i.e., the rated condition, the ratios are unity. With lowering the air temperature, the capacity correction fraction increases while the EIR (reverse of cooling COP) correction fraction decreases, because the units deliver higher capacities with lower power consumptions at reduced temperatures.
We can see that both the total cooling capacity and EIR curves of R-410A change more drastically than R-22. Changing the outdoor temperature from 115 °F (46.1 °C) to 55 °F (12.8 °C), the relative change in capacity for R-22 (compared to the total capacity at 95 °F/35 °C outdoor temperature) is 52%, however, the change for R-410A is 79%; the relative change in EIR for R-22 (compared to the EIR at 95 °F/35 °C outdoor temperature) is 18%, however, the change for R-410A is 29%. This means, given the same rating capacity and EIR at the design condition, the R-410A equipment would get more capacity and operate more efficiently, with the same drop in outdoor temperature. Consequently, applying the same condenser evaporative precooling load, the R-410A equipment will get more relative power reduction than the R-22 equipment.

3.2. DOE Benchmark Commercial Buildings and Locations

DOE selected 16 building types classified as benchmark buildings that represent most of the commercial building stock, across 16 locations (representing all U.S climate zones, NREL/CP-550-43291 [15]). In this study, we examined the effect of pre-cooling technology in three of the 16 building types in all 16 locations to gain an understanding of the extent to which annual and peak energy reductions are realistically possible. Descriptions of these buildings reside within the supplied EnergyPlus input files. The output from our effectiveness-NTU model was input to EnergyPlus, which performed the simulations for the various buildings in the particular climate zones, as the current EnergyPlus requires constant wet bulb efficiency for modeling condenser evaporative pre-cooling at each equipment speed.
We selected a medium office, a secondary school, and a supermarket for the three building types because they have very different equipment sizes, load profiles, zones, and uses. The building characteristics are shown in Table 1.
In addition to the three building types, our simulations covered three building generations (new, pre-1980, and post-1980) and two refrigerants (R‑22 and R-410A) in 16 climate zones. For retrofit applications, the pad is directly added to the original rooftop unit sizes selected by EnergyPlus as equipment sizing. It shall be noted that this study only investigates the retrofit applications; possible equipment size reductions (and any equipment first cost savings) due to the precooling effect are not taken into account.
Building types represent different load distributions. For example, in Phoenix, AZ, the load profile in a medium office building is different from that in a supermarket as shown in Figure 4 and Figure 5, respectively. In cold weather, when the ambient temperature is low, the load in the supermarket is practically zero (no cooling needed, only perhaps heating), whereas in the medium office building heating and cooling may be needed depending on the zones in the building because the loads in the exterior portions are different from that in the interior portions. Most of the cooling load in the supermarket is in the hotter months, whereas in the medium office building, the cooling loads are distributed over more temperature bins. The building load distributions lead to utilizations of evaporative precooling at different ambient conditions.
Using EnergyPlus, we estimated the annual power savings for R-410A rooftop equipment in Phoenix, AZ, for the three classes of buildings (present buildings): medium office, secondary school and supermarket, as shown in Figure 6.
Due to the different load profiles, the annual savings vary according to building type slightly. Figure 6 further exemplifies the benefit of using pre-cooling technology. Relative to no pre-cooling, the percentage of annual energy savings can be as high as 23% with a WB efficiency of 0.7 or as much as 27% with a higher WB efficiency of 0.9 (where many pre-cooling units operate). The decision to operate at a specific WB efficiency depends largely on the pad thickness and face velocity as discussed above and these are operating variables available to the HVAC engineer.

3.3. Effect of Refrigerant Type

Older rooftop units use R-22 as refrigerant while newer models utilize R-410A. We examined the effect of refrigerant type on annual energy and peak power reductions for a medium office building (present) with a two-speed rooftop unit and WB efficiency of 0.7 in 16 climate zones as shown in Figure 7 and Figure 8 A peak power reduction is calculated via comparing power consumptions with/without the condenser evaporative precooling at the hottest temperature of summer in each city. Clearly, the largest benefits are derived with the R-410A refrigerant in hot and dry climates. Note that even in hot and humid climates such as Houston, TX, the benefits with R-410A are significantly higher than it is for R-22.
The effect of refrigerant type can be understood by noting that R-410A condensing pressure operates near the critical region (where the refrigerant liquid and vapor become identical) and any lowering of the condenser temperature (as would be the case of evaporative cooling) causes the two-phase isotherm to move downwards from the apex of the critical region enabling the system to increase its cooling capacity and efficiency. In other words, the refrigerant operates over a larger enthalpy change across the two-phase region, resulting in improved overall condenser heat transfer effectiveness, and hence can reject more heat to the ambient for the same mass flow rate. Consequently, precooling has a more beneficial effect on energy savings for R-410A systems, as compared with R-22 units.

3.4. Annual Energy Savings and Peak Power Reduction of Three Building Types (Present) in 16 Climate Zones

Commercially available evaporative pre-coolers provide a low-cost retrofit for existing packaged rooftop units, commercial unitary split systems, and air cooled chillers. We mapped the impact of energy savings and peak energy reduction in the three building types (present medium office, secondary school, and supermarket) in 16 locations with a fixed pad thickness (giving an effectiveness of 0.816) and show the effect of both refrigerants, R-22 and R-410A. The selected pad wet bulb effectiveness of 0.816 was recommended by a manufacturer for standard 8-inch-thick pad for commercial applications. Simulations are performed with EnergyPlus. In each of the three building types, there is tangible opportunity to reduce annual energy and peak power consumption if pre-cooling is used and if a switch is made from R-22 equipment to R-410A equipment. The air frontal velocity was selected as 250 fpm (1.3 m/s), which is the actual condenser frontal air flow velocity according to the 10-ton R-410A unit obtained from the manufacturer’s literature. Inputting the calculated wet bulb efficiency into EnergyPlus, we obtain annual energy savings and peak power reductions as below. Table 2, Table 3 and Table 4 illustrate annual energy savings and peak power reductions, respectively for the R-410A and R-22 units in the three builing types of medium office, secondary school and supermarket. It can be seen that the condenser evaporative pre-cooling leads to larger savings and peak power reductions in dry and hot cities, e.g., Phoenix, AZ, etc. The reduction percentages with using R-410A is 10% higher than using R-22. On the other hand, there are no apparent differences between the three building types.

4. Economics and Control Strategy

The economics of condenser evaporative pre-cooling is driven by the climate, refrigerant, equipment vintage, utility rate structure, control strategy, and equipment costs. To assess the economics, we collected electricity and water rates in six cities, as given in Table 5.

Annual Electricity Savings and Cost of Water

In our analyses, savings are relative to the baseline equipment without pre-cooling. The variables in the relative savings are the type of building, the pad wet bulb efficiency, the utility rates, and the equipment rated COP and the type of refrigerant. Percent savings represents the annual operating cost savings with pre-cooling (taking into account the cost of water and pumping costs) relative to the cost of operating the same equipment without pre-cooling. One water conserving strategy is to use water for evaporative cooling only when the dry bulb temperature exceeds 90 °F (32.2 °C) instead of using it at all temperatures during the cooling season. Our findings are summarized below.
If pre-cooling is deployed at all ambient temperatures during the cooling season, then the percent energy savings relative to using no pre-cooling at wet bulb efficiency of 0.7 and equipment rated COP of 3.0 is shown Figure 9. It should be mentioned that COP used here considers total cooling capacity and compressor and outdoor fan power consumptions. The indoor blower power and heat are not taken into consideration. This is in line with EnergyPlus input. The COP of 3.0 represents lower efficiency equipment used in current commercial buildings. We observe that annual operating cost savings are increased due to precooling for all three types of buildings particularly in the hot dry climates (Phoenix, Albuquerque) but less pronounced in wet climates (Seattle), and that cost savings with R-410A are significantly greater than it is for the older R-22 refrigerant. Hot dry climates are amenable to water evaporation and hence such climates benefit from this technology. For the same wet bulb efficiency and COP, the percent savings if pre-cooling is deployed when the wet bulb temperature exceeds 90 °F/32.2 °C is shown in Figure 10 for comparison with Figure 9.
Here we observe that, for the equipment using R-410A, if precooling is deployed only when the ambient air temperature exceeds 90 °F/32.2 °C, the percent operating cost savings are less than if precooling was deployed at all operating temperatures in the respective climates. However, the results are different for the equipment using R-22. For example, for the medium office in Phoenix, AZ, spraying water at all temperatures yields an annual relative cost saving of 5.5%, whereas spraying water only when the DB is above 90 °F/32.2 °C, yields a slightly higher annual cost saving of 6.3%. Similar conclusions are reached for the secondary school and supermarket. Therefore, for R-22, it may be beneficial to use water only when DB temperatures exceed 90 °F/32.2 °C to maximize the annual operating cost savings while simultaneously minimizing water use. However, it must be pointed out clearly that the annual and peak energy reductions using R-410A are far greater than that of using R-22, and for R-410A the savings are greater if the equipment is operated at all DB temperatures rather than only when the DB exceeds 90 °F/32.2 °C.
In our EnergyPlus simulations, we consider an upper wet bulb efficiency limit of 0.9; the results for this case are shown in Figure 11 and Figure 12:
Again we see significantly higher annual operating cost savings using R-410A versus R-22 for the three building types in all six cities except Seattle, for the reasons mentioned above, and that increasing the wet bulb efficiency from 0.7 to 0.9 marginally improves the annual operating cost savings as seen by comparing Figure 10 and Figure 12. If precooling is deployed only when the ambient temperature exceeds 90 °F/32.2 °C, annual percent savings using R-410A equipment drop slightly, but the annual percent savings using R-22 equipment increase slightly.
Next, we examine the effect of installing a more efficient rooftop unit with a rated COP = 5, which represents the higher efficiency level of equipment on the market, to replace an older rooftop unit and make the same comparisons described above. As expected, the impact on annual energy savings with precooling as compared to no precooling in more efficient equipment (COP = 5) is smaller than it would be for a less efficient equipment (COP = 3) as shown by comparison of Figure 9 with Figure 13.
A similar trend is observed at higher wet bulb efficiency of 0.9, as shown by comparing Figure 11 to Figure 14. The impact of pre-cooling on annual savings compared to no pre-cooling is attenuated for equipment that operate at high efficiency (COP = 5 compared to COP = 3), nonetheless, pre-cooling does provide energy savings, especially in hot, dry climates.
Comparing the annual energy savings estimates for the higher efficient (COP = 5) equipment that utilizes a water control strategy of deploying pre-cooling only when the DB temperature exceeds 90 °F/32.2 °C, we find similar trends in Figure 15 as discussed for the lower efficiency equipment (COP = 3).
For equipment using R-410A, when pre-cooling is deployed at DB temperatures exceeding 90 °F/32.2 °C, annual operating cost savings are somewhat lower than if pre-cooling is deployed at all DB temperatures. The same trend is observed at the higher WB efficiency of 0.9. Therefore, at least for these three building types, the recommended strategy would be to pre-cool at all DB temperatures, for the equipment using R-410A. On the other hand, for the equipment using R-22 in the cities where the water price is high, we recommend applying pre-cooling at higher ambient temperatures (for example when DB exceeds 90 °F/32.2 °C).

5. Conclusions

  • Commercially available evaporative pre-coolers provide a low cost retrofit option for many existing packaged rooftop units, commercial unitary split systems, and air cooled chillers.
  • Relative energy savings are much greater for HVAC systems with the refrigerant R-410A than they are with R-22. The relative energy savings and peak power reductions of the R-410A unit is 10% higher than the R-22 unit in hot and dry climates.
  • For R-410A equipment, operating cost percent savings are greater if pre-cooling is used at all DB temperatures than they are if used only when the DB temperature exceeds 90 °F/32.2 °C. For R-22 equipment in the cities where the water price is high, we would recommend applying pre-cooling only at high ambient temperatures.
  • Evaporative pre-cooling provides the opportunity for annual energy savings and peak demand reduction, with significant potential in hot, dry climates. For example, in LasVegas, NV, use of an 81.6% efficiency pre-cooling pad can achieve annual energy savings up to 26% and peak power reductions up to 39.0%. Even in cold, wet climates, for example, Chicago, IL, it still achieves 10% annual saving and 18% peak power reduction.

Author Contributions

B.S. conducted major analytical studies and writing; M.A. monitored the work progress, reviewed the analytical work, and greatly enhanced the technical writing; J.N. provided indispensable support for the EnergyPlus building energy simulations in multiple climate zones and three template buildings.

Funding

The authors acknowledge the support provided by the US DOE Building Technologies Office and the Technology Manager, Antonio Bouza. The work was funded under Contract No. DE-AC05-00OR22725.

Conflicts of Interest

Disclaimer: This manuscript has been authored by UT-Battelle, LLC under Contract No. DE-AC05-00OR22725 with the U.S. Department of Energy. The United States Government retains and the publisher, by accepting the article for publication, acknowledges that the United States Government retains a non-exclusive, paid-up, irrevocable, world-wide license to publish or reproduce the published form of this manuscript, or allow others to do so, for United States Government purposes. The Department of Energy will provide public access to these results of federally sponsored research in accordance with the DOE Public Access Plan (http://energy.gov/downloads/doe-public-access-plan).

Acronyms

DOEU.S. Department of Energy.
DBair dry bulb temperature [C].
COPcoefficient of performance [w/w]
C s specific heat of saturated air [J/kg/K].
C A P F T c o i l , c o o l i n g coil cooling capacity correction factor.
E I R F T c o o l i n g cooling energy input ratio correction factor.
E H heat and mass transfer effectiveness.
E w b wet bulb efficiency.
EIRenergy input ratio [w/w].
m ˙ a i r air mass flow rate [kg/s].
NTUNumber of heat transfer units.
SHRsensible heat ratio.
T s , w a t e r water surface temperature [C].
WBair wet bulb temperature [C].
ω a i r , i air inlet specific humidity [kg water/kg dry air].
ω a i r , o air outlet specific humidity [kg water/kg dry air].

References

  1. Wu, J.; Huang, X.; Zhang, H. Numerical investigation on the heat and mass transfer in a direct evaporative cooler. Appl. Therm. Eng. 2009, 29, 195–201. [Google Scholar] [CrossRef]
  2. Wu, J.; Huang, X.; Zhang, H. Theoretical analysis on heat and mass transfer in a direct evaporative cooler. Appl. Therm. Eng. 2009, 29, 980–984. [Google Scholar] [CrossRef]
  3. Waly, M.; Chakroun, W.; Al-Mutawa, N.K. Effect of pre-cooling of inlet air to condensers of air-conditioning units. Int. J. Energy Res. 2005, 29, 781–794. [Google Scholar] [CrossRef]
  4. Hajidavalloo, E.; Eghtedari, H. Performance improvement of air-cooled refrigeration system by using evaporatively cooled air condenser. Int. J. Refrig. 2010, 33, 982–988. [Google Scholar] [CrossRef]
  5. Goswami, D.Y.; Mathur, G.D.; Kulkarni, S.M. Experimental Investigation of Performance of a Residential Air Conditioning System with an Evaporatively Cooled Condenser. J. Sol. Energy 1993, 115, 206–211. [Google Scholar] [CrossRef]
  6. Yu, F.W.; Ho, W.T.; Chan, K.T.; Sit, R.K.Y. Theoretical and experimental analyses of mist precooling for an air-cooled chiller. Appl. Therm. Eng. 2018, 130, 112–119. [Google Scholar] [CrossRef]
  7. Liu, H.; Zhou, Q.; Zhao, H. Experimental study on cooling performance and energy saving of gas engine-driven heat pump system with evaporative condenser. Energy Convers. Manag. 2016, 123, 200–208. [Google Scholar] [CrossRef]
  8. Xuan, Y.; Xiao, F.; Niu, X.; Huang, X.; Wang, S.; Wang, S. Research and application of evaporative cooling in China: A review (I)—Research. Renew. Sustain. Energy Rev. 2012, 16, 3535–3546. [Google Scholar] [CrossRef]
  9. Kim, M.H.; Jeong, J.W. Cooling performance of a 100% outdoor air system integrated with indirect and direct evaporative coolers. Energy 2013, 52, 245–257. [Google Scholar] [CrossRef]
  10. Eidan, A.A.; Alwan, K.J.; Alsahlani, A.; Alfahham, M. Enhancement of the Performance Characteristics for Air-Conditioning System by Using Direct Evaporative Cooling in Hot Climates. Energy Procedia 2017, 142, 3998–4003. [Google Scholar] [CrossRef]
  11. EnergyPlus Engineering Reference, Version 8.7, DOE. 2017. Available online: https://energyplus.net/ (accessed on May 2017).
  12. Braun, J.E.; Klein, A.; Mitchell, J.W. Effectiveness models for cooling towers and cooling coils. ASHRAE Trans. 1989, 95, 164–174. [Google Scholar]
  13. Payne, W.V.; Domanski, P.A. A Comparison of an R22 And an R410A Air Conditioner Operating at High Ambient Temperatures. In Proceedings of the International Refrigeration and Air Conditioning Conference, West Lafayette, IN, USA, July 2002. [Google Scholar]
  14. Rice, C.K. Investigation of R-410A Air Conditioning System Performance Operating at Extreme Ambient Temperatures up to the Refrigerant Critical Point; Final Report, ARTI-21CR/605-50015-01, ORNL/TM-2005/277; December 2005. [Google Scholar]
  15. Torcelini, P.; Deru, M.; Griffith, B.; Benne, K.; Halverson, M.; Winiarski, D.; Crawley, D.B. DOE Commercial Building Benchmark Models: preprint. Presented at the 2008 ACEEE Summer Study on Energy Efficiency in Buildings, Pacific Grove, Ca, USA, 17–22 August 2008. NREL/CP-550-43291. [Google Scholar]
Figure 1. Relative deviations from manufacturer’s data predicted by the effectiveness-NTU model and EnergyPlus.
Energies 12 02079 g001
Figure 2. Total cooling capacity correction ratios of R-22 and R-410A varying with outdoor air dry bulb temperature and fixing indoor wet bulb at 67 °F (19.4 °C).
Energies 12 02079 g002
Figure 3. EIR correction ratios of R-22 and R-410A varying with outdoor air temperature and fixing indoor WB at 67 °F (19.4 °C).
Energies 12 02079 g003
Figure 4. Medium office building in Phoenix, AZ, USA: Percentage of annual building load that is delivered in each temperature bin.
Energies 12 02079 g004
Figure 5. Supermarket in Phoenix, AZ, USA: Percentage of annual building load that is delivered in each temperature bin.
Energies 12 02079 g005
Figure 6. Annual savings depend on the building type (present buildings) and the WB efficiency.
Energies 12 02079 g006
Figure 7. Annual energy savings for a medium office (present) building with two-speed unit and WB efficiency fixed at 0.7 in all 16 climate zones.
Energies 12 02079 g007
Figure 8. Peak power reductions for a medium office building with two-speed unit and WB efficiency fixed at 0.7, in 16 climate zones.
Energies 12 02079 g008
Figure 9. Percentage of energy savings due to pre-cooling relative to no pre-cooling when water is sprayed at all ambient temperatures and wet bulb efficiency of 0.7, and COP = 3.
Energies 12 02079 g009
Figure 10. Percentage of energy savings due to pre-cooling relative to no pre-cooling when water is sprayed after ambient temperature equals or exceeds 90 °F/32.2 °C. Wet bulb efficiency = 0.7, COP = 3.
Energies 12 02079 g010
Figure 11. Percentage of energy savings due to pre-cooling relative to no pre-cooling at all ambient temperatures. Wet bulb efficiency = 0.9, equipment COP = 3.
Energies 12 02079 g011
Figure 12. Percentage of energy savings due to pre-cooling relative to no pre-cooling when water is sprayed after ambient temperature is equal to or exceeds 90°F. Wet bulb efficiency = 0.9, equipment COP = 3.
Energies 12 02079 g012
Figure 13. Percentage of savings due to pre-cooling relative to no pre-cooling at all ambient temperatures. Wet bulb efficiency = 0.7, equipment COP = 5.
Energies 12 02079 g013
Figure 14. Percentage of energy savings due to pre-cooling relative to no pre-cooling at all ambient temperatures. Wet bulb efficiency = 0.9, equipment COP = 5.
Energies 12 02079 g014
Figure 15. Percentage of energy savings due to pre-cooling relative to no pre-cooling when water is sprayed after ambient temperature is equal to or exceeds 90 °F/32.2 °C. Wet bulb efficiency = 0.9, equipment COP = 5.
Energies 12 02079 g015
Table 1. Three benchmark commercial buildings selected for this study.
BuildingFloor Area (m2)Number of FloorsZonesDX Cooling CoilsSizing Factor
Medium office50173153 units, 2-speed1.33
Secondary school19,5092465 units, 1-speed1.5
Supermarket4181166 units, 1-speed1.
Table 2. Medium office building: Annual energy savings and peak power reductions.
City/SavingAnnual Energy SavingPeak Power Reduction
R410AR22R410AR22
Albuquerque, NM16.1%5.1%29.5%18.4%
Los Angeles, CA4.2%−0.5%6.7%1.8%
Atlanta, GA6.9%1.9%22.1%14.9%
Baltimore, MD7.0%2.0%12.7%6.7%
Boulder, CO14.8%3.9%34.4%20.4%
Chicago, IL8.1%2.2%12.6%4.7%
Duluth, MN6.1%0.5%15.2%7.9%
Fairbanks, AK6.8%−0.5%13.5%4.2%
San Francisco, CA4.6%−0.9%27.8%16.3%
Helena, MT13.0%2.8%29.4%17.7%
Houston, TX7.8%3.0%15.4%8.9%
Miami, FL7.1%2.5%13.3%8.0%
Minneapolis, MN7.3%1.6%13.0%6.8%
Phoenix, AZ24.2%13.3%38.0%30.5%
Seattle, WA6.1%−0.2%17.6%7.5%
Las Vegas, NV26.0%13.5%39.0%29.7%
Average10.4%3.1%21.3%12.8%
Max26.0%13.5%39.0%30.5%
Min4.2%−0.9%6.7%1.8%
Table 3. Secondary school building: Annual energy savings and peak power reductions.
City/SavingAnnual Power SavingPeak Power Reduction
R410AR22R410AR22
Albuquerque, NM18.8%6.7%29.8%17.1%
Los Angeles, CA6.8%0.7%12.3%2.5%
Atlanta, GA9.3%3.0%15.6%9.5%
Baltimore, MD9.5%3.4%12.3%7.7%
Boulder, CO18.7%6.2%31.2%17.9%
Chicago, IL9.9%3.2%11.6%6.5%
Duluth, MN9.4%2.2%9.4%3.1%
Fairbanks, AK11.5%1.6%20.2%6.4%
San Francisco, CA10.5%2.0%22.1%11.2%
Helena, MT17.7%6.0%25.2%14.4%
Houston, TX8.3%3.0%11.2%6.7%
Miami, FL6.7%2.1%9.5%4.8%
Minneapolis, MN9.1%2.6%10.8%4.8%
Phoenix, AZ24.6%13.5%31.7%25.2%
Seattle, WA10.2%1.8%14.8%5.5%
Las Vegas, NV26.9%14.4%34.2%25.1%
Average13.0%4.5%18.9%10.5%
Max26.9%14.4%34.2%25.2%
Min6.7%0.7%9.4%2.5%
Table 4. Supermarket: Annual energy savings and peak power reductions.
City/SavingAnnual Power SavingPeak Power Reduction
R410AR22R410AR22
Albuquerque, NM19.2%7.3%26.2%16.0%
Los Angeles, CA6.5%0.7%8.1%2.7%
Atlanta, GA8.9%3.2%20.7%13.4%
Baltimore, MD9.5%3.7%12.2%6.0%
Boulder, CO18.7%6.6%31.0%19.1%
Chicago, IL9.7%3.5%18.1%11.0%
Duluth, MN6.0%0.7%15.2%7.1%
Fairbanks, AK6.5%-0.3%17.4%8.0%
San Francisco, CA9.9%1.9%27.2%15.7%
Helena, MT17.7%6.1%32.1%18.6%
Houston, TX9.1%4.1%13.0%7.6%
Miami, FL7.3%2.7%10.4%4.9%
Minneapolis, MN8.4%2.6%10.7%5.8%
Phoenix, AZ26.4%16.0%37.0%29.4%
Seattle, WA10.7%2.5%28.3%18.4%
Las Vegas, NV28.8%16.7%37.0%27.6%
Average12.7%4.9%21.5%13.2%
Max28.8%16.7%37.0%29.4%
Min6.0%-0.3%8.1%2.7%
Table 5. Electricity and water rates in six cities.
Cost in CentsAlbuquerqueAtlantaHoustonMinneapolisPhoenixSeattle
Water/m349.827.794.1107.4124.0158.6
Electricity/kwh8.78.99.58.110.17.3

