1. Introduction
The energy market (production, control, and distribution) is changing from a centralized control system to a decentralized one with the introduction of new players. Information and Communication Technology (ICT) plays an essential role in this change [
1]. This change comes under the topic of the smart grid, which targets the evolution of power grids towards more efficient, reliable, and environmentally sustainable systems. Adopting this approach, Distributed Energy Generation (DEG) based on renewable energy sources was introduced. The decrease in the price of solar panels and wind turbines allows the proliferation of this DEG in a microgeneration (MG) scenario. This situation is supported by new advances in the scope of the Internet of Things (IoT), with new communication devices and protocols, as well as smaller and cheaper sensors, allowing real-time measurement of distribution and transmission to a central IoT cloud platform [
2].
In this context, peer-to-peer (P2P) models applied to financial transactions with associated security [
3], nowadays called blockchain systems, allow the control of financial transactions without the presence of a central control entity. Blockchain can be applied to the smart grid [
4]. These platforms can also benefit from collaboration systems that increase (and measure) users’ participation in resorting to predefined goals, the so-called gamification platforms [
5].
This new situation raises new research challenges, which we address in this work. In a first conceptual phase, we study the conditions and the potential of applying this new situation to energy markets. The primary outcome of this attempt is the creation of new conditions for small players (domestic consumers) to be part of the market, benefiting from reduced costs or receiving money. This can be applied to MG energy transactions, using the principle that the local energy produced is consumed locally and that associating blockchain with smart meters allows managing these transactions without a central control entity. This approach provides the opportunity to lower prices and increase market flexibility. An application example is the aggregation of electrical vehicles (EVs) as players in the energy market, as described in
Section 5. This community creation approach for EVs can be applied to increase flexibility in consumption as a whole (rather than the usual individual behaviour), where a group of individuals is aggregated into a market player that is able to absorb or supply less energy according to predefined conditions.
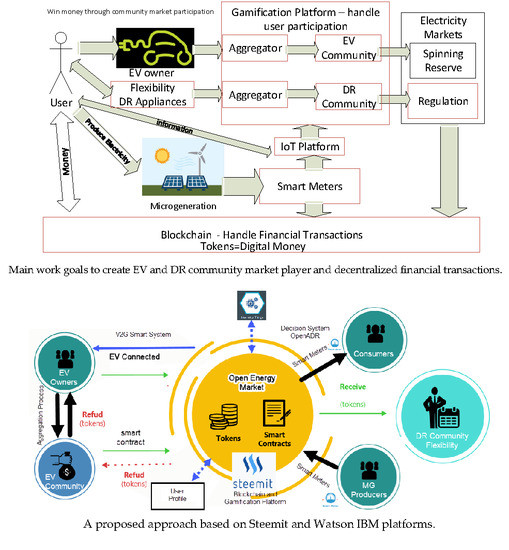
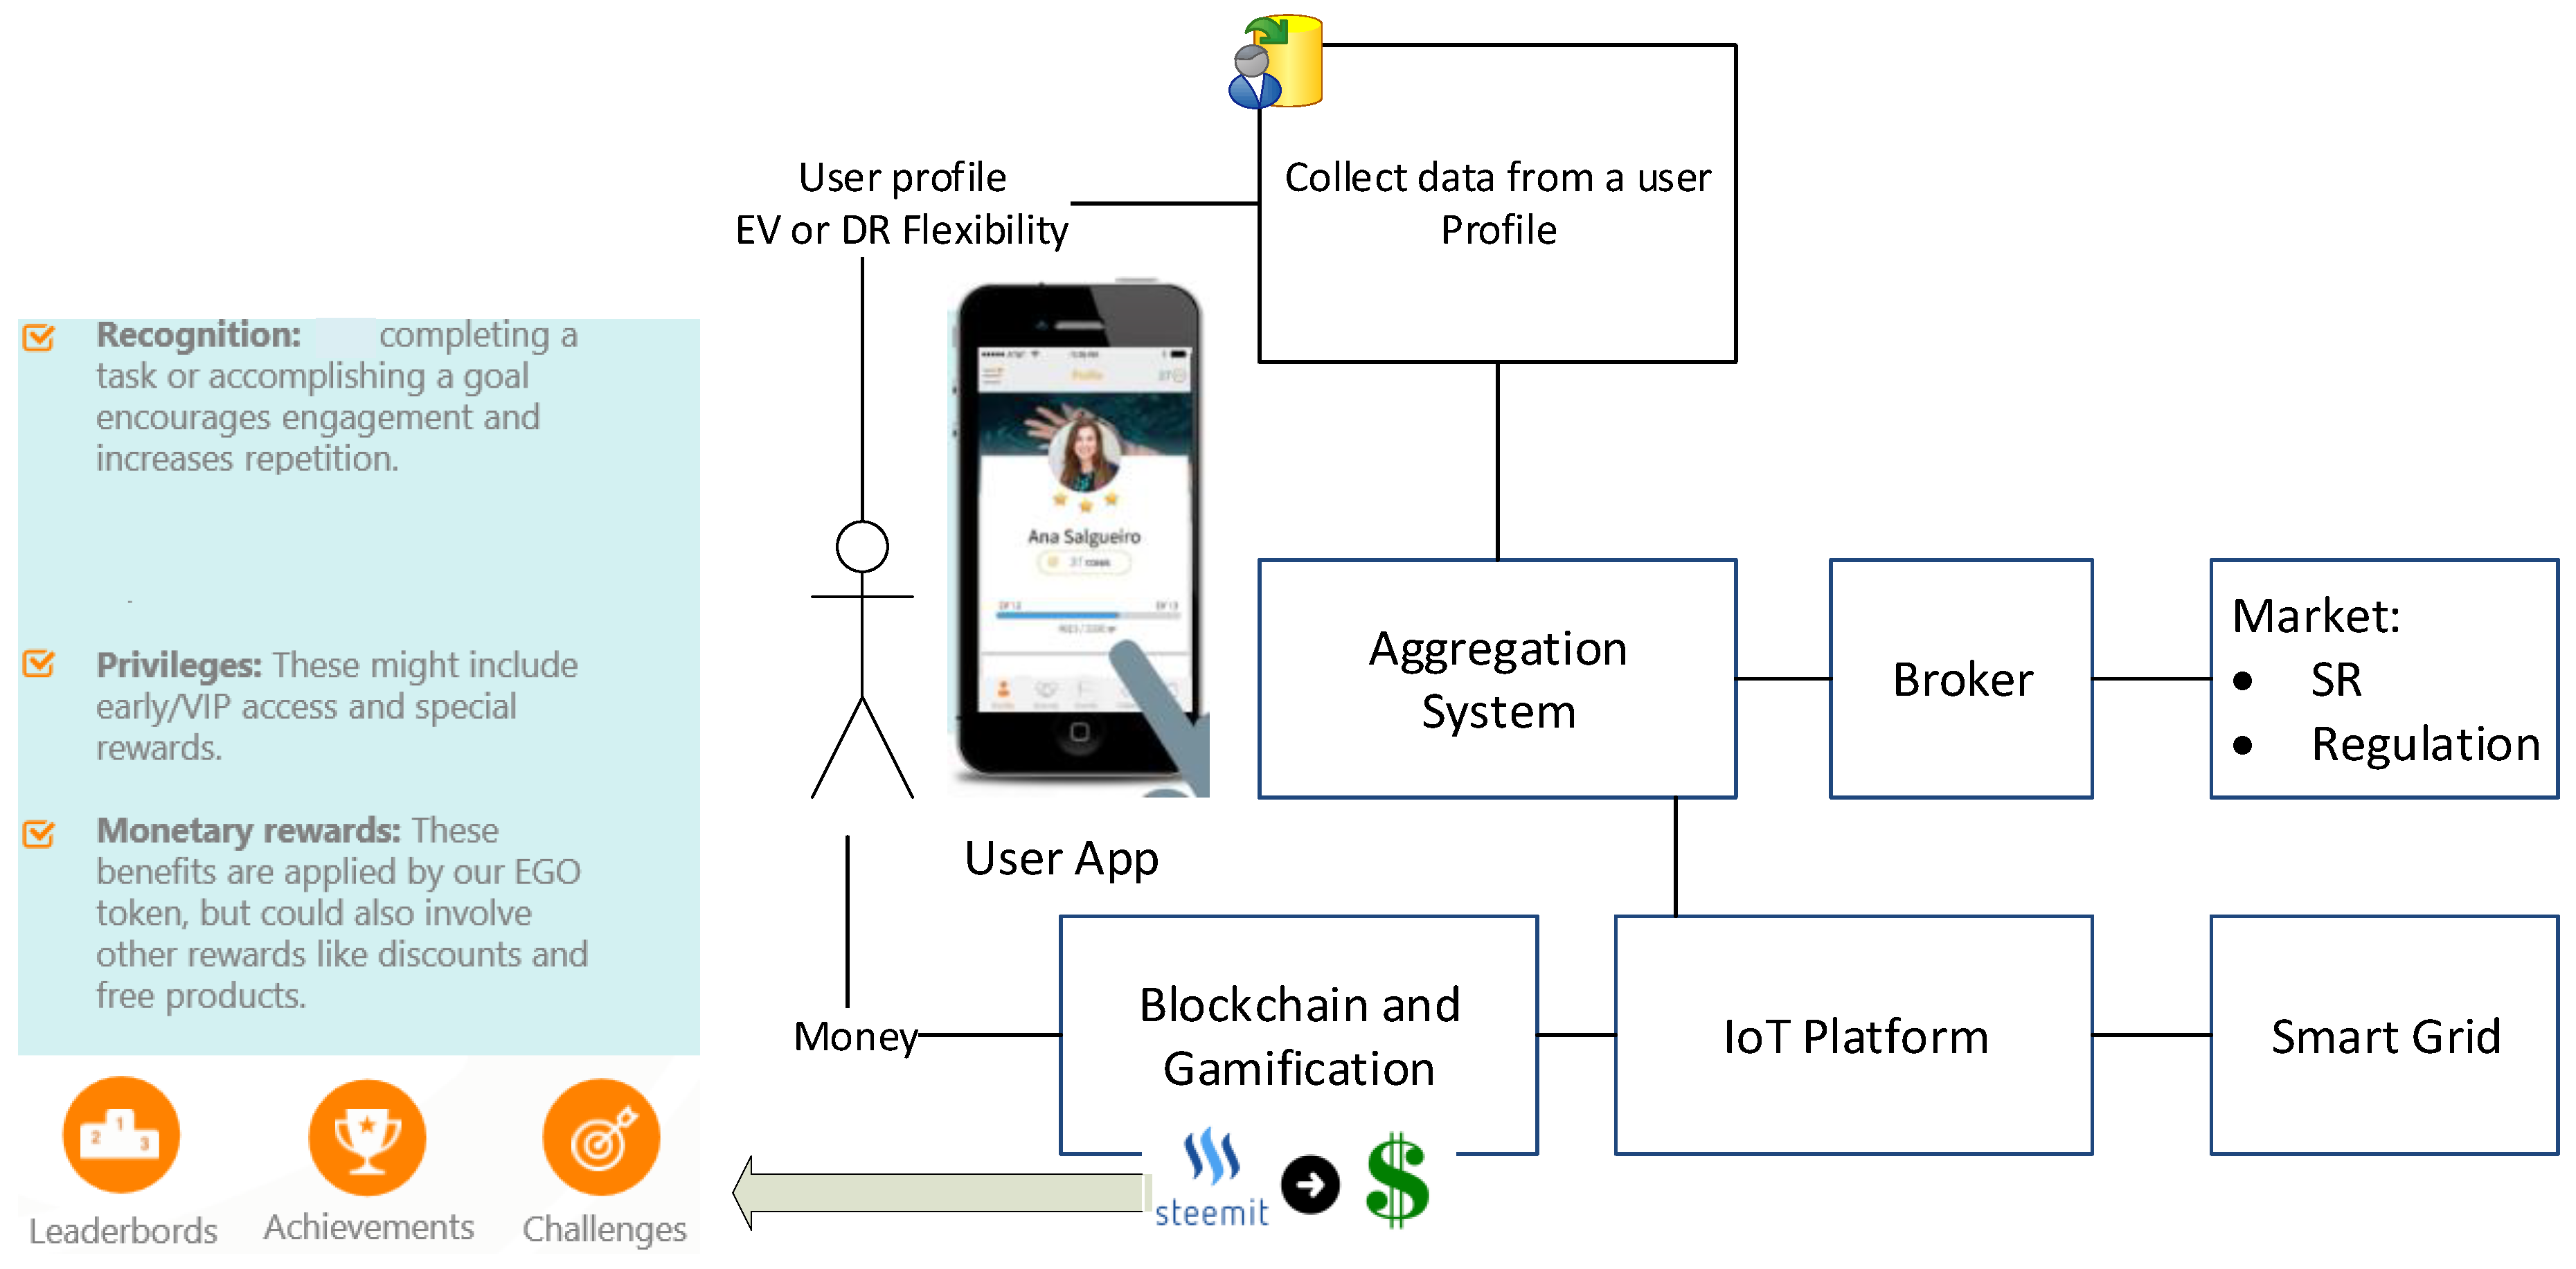
Figure 1 shows this approach where an aggregator can create communities (several local users working together) for electricity market participation based on the aggregation of users with a common predefined goal. Gamification manages users’ behaviour towards the community goal, and blockchain allows secure financial transactions.
The electricity market is a system that allows energy transactions based on a bid approach. Bids and offers use traditional economic supply and demand principles to define the price. In
Section 7, we propose a model based on historical data in which we check users’ energy needs and current MG production is balanced against the whole energy available in the energy market (the price reflects this availability).
Other components of this electricity market are the so-called ancillary services [
6]. These are supporting services to sustain the electricity distribution in a process in which production will always meet demand. These services are based on frequency control, spinning reserves, and operating reserves. These services, with the introduction of intermittent renewable energy, raise new challenges and new market players can be introduced. Currently, blockchain with gamification can be applied to create and maintain aggregated users in a community that can play a role in this business process. The present work is mainly focused on spinning reserves and regulation, which must be able to react very quickly to supply energy (minutes or seconds after demand occurs).
Spinning Reserves is the market concept related with the power capacity available in an unloaded form, normally used to overcome the failure of an operator [
6]. This failure is defined as a short or long-term loss of electrical power in a specific area. As the probability of this occurrence is very low, it is interesting for EV owners to be part of a spinning reserve since there is little chance of them having their EV charge completely used but at the same time, they can receive money for participating in the market. This service is charged based on the time that the predefined power is available. For example, a 1 MW generator kept “spinning” and ready during a 24 h period would be sold as 1 MW-day, even though no energy was actually produced [
7]. Based on this fact, and taking into account that EVs remain plugged in during most of the daytime [
8,
9], consumption patterns may change from case to case, but it is possible to forecast patterns using historical data analysed using a data mining approach [
8,
9]. As the possibility of taking an excessive amount of energy from an EV is low, the probability of reducing the EV’s lifetime is minimized. Contracts for spinning reserves limit the number and duration of calls, with 20 calls per year and no more than 1 h on average per call [
10]. Ancillary services account for 5–10% of the current electricity cost, with 80% of that cost going to regulation services [
10]. Navegant Research [
11] explained that energy storage solutions that can be connected to the grid and scheduled to deliver energy immediately when there is a disruption in distribution are beginning to play a more significant role in the Spinning Reserve (SR) market.
Regulation services are the actions that match energy production to demand. These can be divided into: (1) regulating up, where there is an increase in electricity output in response to the automatic generation control (AGC); and (2) regulating down, which is a decrease of electricity output to the AGC. Depending on the electricity market and the grid operator, regulation may overlap or be supplemented by slower adjustments, including “balancing service” (intra-hour and hourly) and/or “load following” [
6]. Electricity users’ flexible behaviour can also be aggregated into a community that can provide services in this regulation market, using Demand Response (DR) [
6]. Individuals involved in this DR approach have already participated in the service, but, as in the former models, their actions were centrally coordinated, and users only benefited from low energy prices. If they are aggregated, and the processes are controlled locally, they can participate more closely in this market and additionally earn money as it is possible to provide regulation services. Due to the fact that the EV charging process requires a long period of time, EVs become an important element in this flexible process as it is possible to increase or decrease the charging power during the charging period.
Accordingly, we propose a software program, named Aggregator (see
Section 4) that is responsible for collecting user data and aggregating this in a way that allows market participation. Based on these defined conditions it is the responsibility of central mechanics to turn off/on equipment based on the OpenADR protocol [
7]. This community creation and manipulation can be successfully applied to a regulation market for DR aggregation flexibility, where the community is able to shift behaviour either to consume excess energy or to decrease consumption when availability is reduced. This approach can be applied in this DR community. Another community is the EV aggregation since EVs have batteries that can be used to store or deliver energy as requested by the control system.
This paper proposes two significant methods to allow an increase in users’ participation in the electrical market using an integrated approach that combines reward gamification, the blockchain, and the IoT platform (see
Figure 1):
- (1)
An MG transaction account in a decentralized regulated market based on blockchain and IoT platform implementation with associated smart meters;
- (2)
The creation of user communities (EV and DR) for participation in ancillary services markets. Gamification is applied to manage and give incentives for users’ participation in community behaviour towards becoming a community market player. This approach allows EV owners and DR users to earn money, based on participation in the ancillary services market.
2. New Platforms: Blockchain, Gamification, and IoT
In this section, we give a description of new platforms that allow innovation in the energy market, also creating new study opportunities, such as blockchain, gamification, and IoT.
2.1. Blockchain
In this section, we examine how blockchain architecture can be used to distribute the aggregator’s role across all devices on an MG network. It has been demonstrated that it is possible to integrate this architecture in a blockchain platform to control a simulated microgrid, addressing incentive issues while respecting operational constraints [
12]. In recent years, there has been some academic research interest in using the distributed approach of blockchain technology to manage the complex system without centralized supervision [
12].
Blockchains are platforms that support cryptocurrencies, such as Bitcoin [
13]. They allow transactions without the traditional intervention of a third party (usually a bank), based on a shared list of blocks of transactions. These blocks are spread to all network nodes and hold all the transactions. New transactions are performed at the end of the chain and are connected to the previous block of transactions in a hash process, with the following advantages [
12]:
The users’ community manages transactions and data;
Resilience without a single point of failure due to their decentralized nature;
Transparency and immutability—everything is public and can be seen by the community;
Low transaction costs, because there are no third parties with commissions involved.
Blockchain can handle cyber-attacks, communication dropouts, and participants joining/departing the network. The associated smart contract supports monetary transactions in a transparent, conflict-free way while avoiding the services of a middleman. A smart contract is a set of predefined conditions for negotiation of the terms of an agreement, which is programmed to run autonomously.
When one considers that a contract is an individual agreement between two or more parties, this contract entails a specific transaction effort. A smart contract can be considered as a contract that is programmed in computer code. Two or more parties digitally agree upon individual rights, obligations, and possible outcomes.
A secure measurement environment should be addressed so that users will trust the measurements performed. For that, trusted computing using the Trusted Platform Module (TPM), Trusted Execution Environment (TEE), Secure Element (SE), or any similar component could be introduced in smart meters supported by a remote verification service. This approach allows both the users and the energy system to verify the software and hardware configurations of a smart meter to determine whether it is tampered with or not.
Our proposal includes IoT-based low-cost smart meters (see
Section 4), where we account for energy transactions and where the blockchain allows distributed payments with virtual coins. Using this approach, the consumer receives energy directly from the producer(s) without using a central energy buffer, and a smart contract (a software program created based on predefined conditions) handles the process with predefined negotiated rules. The smart contract allows automatic transactions, checking if the requested amount of energy is currently available from one or more MG community producers. This smart contract also checks the price automatically, based on market prices and local MG availability. Contract negotiations can be automated and do not necessarily have to be performed manually by the involved entities. For example, the consumer or producer can predefine maximum prices to buy or minimum prices to sell, and the negotiations can then be carried out by the smart contract, which will seek to find an ideal compromise using a decision implementation process. The advantage of using smart contracts in the proposed context lies in the fact that they are immutable, and can be seen by every actor. Hence, when relying on a smart contract in negotiations, the parties have the guarantee that it will always perform as predefined. The first step is to define a price point agreement, and then the defined amount of money (digital money) is sent to a predefined address that works as an escrow account. After this process, the energy exchange takes place. An IoT approach controls the energy flow from both the producer’s and the consumer’s smart meter.
2.2. Gamification Platforms
Gamification is the strategy of interaction between people towards a pre-defined goal based on the offer of incentives that stimulate the public’s engagement.
Gamification platforms use the same data-driven techniques used by game designers to motivate users’ actions in the critical common goals scenario. These platforms measure users’ efforts towards common goals, and incentivize users’ participation with an associated reputation or digital currency. They reward commitment with recognition and visibility within the community [
5,
14].
We associated big data analytics with previously collected data to identify patterns and critical issues for a community goal—in this case, EV aggregated connected or flexible power, to identify critical periods. In EV aggregation, critical periods are associated with the daily hours when EVs are moving (mainly in the morning (from 7:00 a.m. to 10:00 a.m.) and the afternoon (from 5:00 p.m. to 8:00 p.m.)). In DR flexibility, these critical issues were identified from the current data analysis [
12]. Thus, it is possible to identify the necessary efforts and to incentivize users with more points/tokens and increasing relevancy and visibility among peers. The community is maintained through users’ high engagement levels over time, and also through compliant behaviour towards a pre-defined goal for performance improvement.
2.3. IoT Platforms
The excellent number of IoT platforms is a significant business issue that several companies are working on [
15]. IoT platforms have the goal of receiving data from the IoT sensor, archiving them, and manipulating them towards a pre-defined knowledge extraction objective. Several data mining algorithms have already been implemented and are ready to use as a black box [
15]. Also, there are reporting and visualization tools available which are ready to use. Gamification requires the identification of patterns and is performed once smart meter data is integrated into the IoT. In
Section 4, we describe a locally-developed smart meter in a LoRa communication support system (version 1.0, Cyclope, Grenoble, France), which supports such theorization. Also, Node-Red approaches (flow-based programming for the Internet of Things) available in most IoT platforms allow for the identification of actions based on the sensor data received. This is used to perform OpenADR on/off commands over a pre-defined appliance using data decision criteria [
7]. This data comes from the appliance-associated smart meters and external data reception (like renewable energy production) [
7]. It would then be possible to implement a fast, centralized command center to manage the aggregator process for these two pre-defined communities. Nowadays, the most relevant (in terms of commercial use) IoT platforms in a market of more than 700 IoT platforms are [
16]: (1) Amazon Web Services (AWS) from Amazon; (2) Microsoft Azure IoT; (3) Bluemix/Watson from IBM; (4) Oracle IoT; and (5) Kaa IoT. We chose IBM because of a partnership that was already in place, but all of the platforms perform similar functions in different environments.
3. Related Work
There is a growing research interest in smart grid decentralization processes. A blockchain is a new approach towards such unsupervised processes with technical support to manage distributed energy transactions [
17]. A scalable solution for unsupervised control is presented in [
18] where a communication infrastructure and protocol allows communication between all nodes to provide real-time consumption information and small scale validation. In [
18], the authors discuss several issues of the current centralized system that require a central entity to control and manage payments at a single point of failure, whereas in [
19] the security and privacy issues of blockchain approaches are discussed. Several startups are already paying attention to this new research output:
Bankymoon [
20] is a startup in South Africa that proposes the use of smart meters connected to a blockchain, allowing users to load Bitcoins to enable energy flow. This solution uses cryptocurrency only as a prepaid payment option.
TransActive Grid [
https://lo3energy.com] is developing one of the first blockchain based innovations aimed to revolutionize how energy can be generated, stored, purchased, sold, and used all at the local level.
Solether [
http://solether.mkvd.net] is an open software for energy management applied to renewable solar panels that use blockchain cryptocurrencies as payment.
Slock.it is a blockchain-based approach that rents or sells anything directly without intermediaries. It is already used by several startups such as (1) BlockCharge, which proposes a smart plug to enable on-the-go charging of electric cars using cryptocurrency; (2) PriWatt [
21] is a system to manage energy transactions; (3) NRGCoin [
http://nrgcoin.org] a decentralized approach to support MG transactions [
22]; (4) GridSingularity [
https://gridsingularity.com], an energy finance market using a blockchain-based platform.
Examples of more advanced applications of blockchain technology are the SolarCoin [
https://solarcoin.org/] and the GrünStromJeton [
https://stromstunde.de] reward programs. SolarCoin is a global reward program for solar electricity generation with the goal to globally award solar energy producers with a digital currency in their name, where one coin represents one megawatt-hour (MWh) of solar electricity generated. In its technical implementation, SolarCoin describes its infrastructure as a lite version of Bitcoin that uses a script as a proof-of-work algorithm. GrunStromJeton, on the other hand, is a proposal to award customers with tokens that serve as an indicator of their sustainability behaviour determined by their CO
2 footprint.
Another example is the POWR - Pilot project, with decentralized energy management, using a Brooklyn Microgrid Pilot project, which connects 10 households in Brooklyn using a blockchain based microgrid [
23]. The TenneT can also be highlighted, a European pilot project using decentralized, networked home energy storage systems and blockchain technology to stabilize the power grid.
Blockchain has allowed businesspeople to enter the electricity market to create proofs of concept, enabling anyone, anywhere to participate in and make money from the surge in solar generation globally. Economic benefits emerge from decentralized participation, with dynamic prices based on the fact that it is possible to perform transactions of small energy time units in real time and settled only on the basis of actual consumption. Both energy consumers and energy producers can act as prosumers.
It is then possible to conclude that the initial steps towards using blockchain technology to enable MG transactions in a distributed and dynamic way are already being pursued by several enterprises. In this work, we suggest consumption flexibility for MG prosumers in a locally defined community, based on an OpenADR (version 2.0, OpenADR Alliance, San Ramon, CA, USA) implementation over a blockchain.
4. Proposed Approach
Figure 2 shows the vision and the implementation proposal for the creation of two new flexible community market players: EV community and the DR community. This aggregation allows the reaction to perturbation in production and consumption based on predefined agreements supported by the aggregation performed to create the community. Also, this approach allows MG transactions without supervised control, based on a blockchain approach implementation. Participants, in this case, EV owners, consumers, or MG producers in the blockchain network, can come to a general agreement with predefined conditions and actions. Digital currency allows transactions and is the way to operationalise this smart contract, where Bitcoin and Ethereum are the best-known examples. The contract is recorded in the blockchain and executed by distributed nodes of the network, which eliminates the need for a trusted third party entity in the process [
17]. As it is programmed, it will execute itself and will behave precisely as previously defined, allowing an automatic payment based on a BID. This approach also allows smart charging based on price, which is associated with energy availability.
This market scenario allows the use of Demand Response (DR), which is essential to the introduction of renewable sources, with prices based on the balance between production and demand, state-of-the-art technological approaches, normative regulation, as well as political, psycho-social, and cultural dimensions. These conditions need to be workable for all community members involved in the process.
A blockchain energy model can facilitate the creation and operation of communities. In our approach to MG, we assume a grid in a limited geographical area that shares the same energy distribution network, such as a local neighbourhood where the energy is produced and consumed locally, to build an energy community. A prosumer can either store the energy produced in local batteries or send it immediately to that local grid. Additionally, based on OpenADR [
7], local neighbours or community members can increase or decrease consumption based on this energy MG availability. MG prosumers may produce, consume, and trade energy without any barriers using a blockchain (which provides a decentralization process) coupled with an IoT system to measure energy flows.
The smart meter described in this paragraph is the process that measures all energy transactions. A community control agent turns on/off equipment based on OpenADR. Complementary to trusted computing, we introduced an automated energy detection service from neighbour nodes to check the process of a node injecting energy into the grid. This would allow its neighbour nodes to detect the injected energy and validate it using a consensus solution like a mechanism to accumulate the measurements received for every expected energy transfer.
The currently proposed approach is based on the Steemit platform [
https://steemit.com], which allows differentiating users’ participation in the collective goal. The Steemit platform, launched in 2016, deploys a blogging and social networking website superimposed on the Steem blockchain database. The Steemit structure is based on a reputation system, whereby new accounts start with the endowment of a reputation. This approach, where the economic model can be decentralized, allows individual EV and MG owners to participate in the energy market and besides receiving a lower price for the energy can also earn money from the market. The associated gamification approach allows user participation towards a common goal, which is based on the application of game-design elements and game principles in non-game contexts. In a more structural way, the proposed system architecture, which is illustrated in
Figure 2, is based on the following modules:
V2G Smart System [
24,
25]: This is the system which controls EVs’ connections to the power grid. It allows a smart charging process based on the energy needed for the owner’s mobility process, available production, and network distribution limitations. Node-Red allows the giving of external commands to the developed charging system (charging on/off, increasing/decreasing charging power).
IoT Platform with associated Smart meters: Data is stored in the IBM Watson (cloud version of 28.02.2018, IBM, Armonk, NY, USA), an IoT cloud platform, where data analytics algorithms and visualization tools are ready to use in Watson Analytics and Node-RED, which allows for the development, deployment, and scale server-side of JavaScript apps easily. Rules can be implemented in Node-RED to create automatic actions, such as sending an SMS or an email alert, or even commands (on/off) to appliances when consumption increases above a predefined value, with correlations with external data, like weather conditions, among others—making it necessary to add Node-RED as one of the services.
OpenADR with a decision support system [
7]: Predefined equipment, such as heating/cooling systems, the EV charging battery, and washing machines, among other equipment, have implemented an OpenADR that allows them to turn on/off based remotely on predefined criteria. Node-RED, with associated pre-defined flows, allows external OpenADR commands based on pre-defined conditions.
Mobile apps [
24] and related user profiles [
26]: The development of user App was performed for Android. The app is the interface to the user (MG producer, EV owner, DR flexibility user) and is responsible for user registration, on the first access, and the further creation and maintenance of a user profile related with his electrical behaviour (EV type; time, date, and associated distance traveled; equipment type; schedules for DR flexibility). Accordingly, this module will have the following functions/modules regarding the user: registration, communication interface, and profile. Also, an IoT dashboard was integrated to allow the user to visualize data (electricity consumption, MG production, transactions). Pre-defined templates allow easy visualization on a mobile App. An interface for Sttemit also allows a user to check their reputation (gamification) and missed goals, and check financial transactions.
Aggregation process [
9]: This module enables the community process that creates an interaction with the energy market. This module can be applied to EV aggregation or DR flexibility. Current and historical user data is manipulated using data mining (pattern identification) to generate consumption profiles of the users’ community. Considering market energy bids and collected values, the users’ community expresses its preferences (target market goals to be achieved, where identified patterns represent important decision criteria). A gamification approach is implemented to push users towards the definition of goals and measure their behaviour (profit division). This aggregator also looks for the user’s geographical position in the distribution network—a community emerges from users who share a similar location [
27] and interests towards energy market participation.
Steemit platform: This module aims at measuring users’ participation towards the community’s common goal, and based on IoT data (smart meters), performs relevant financial transactions. All transactions between EVs and the power grid, MG, and DR actions are stored in an IoT cloud platform and are associated with financial transactions in Steemit. To ensure users’ data privacy, data is stored without being directly related to the user.
5. IoT Implementation on a University Campus
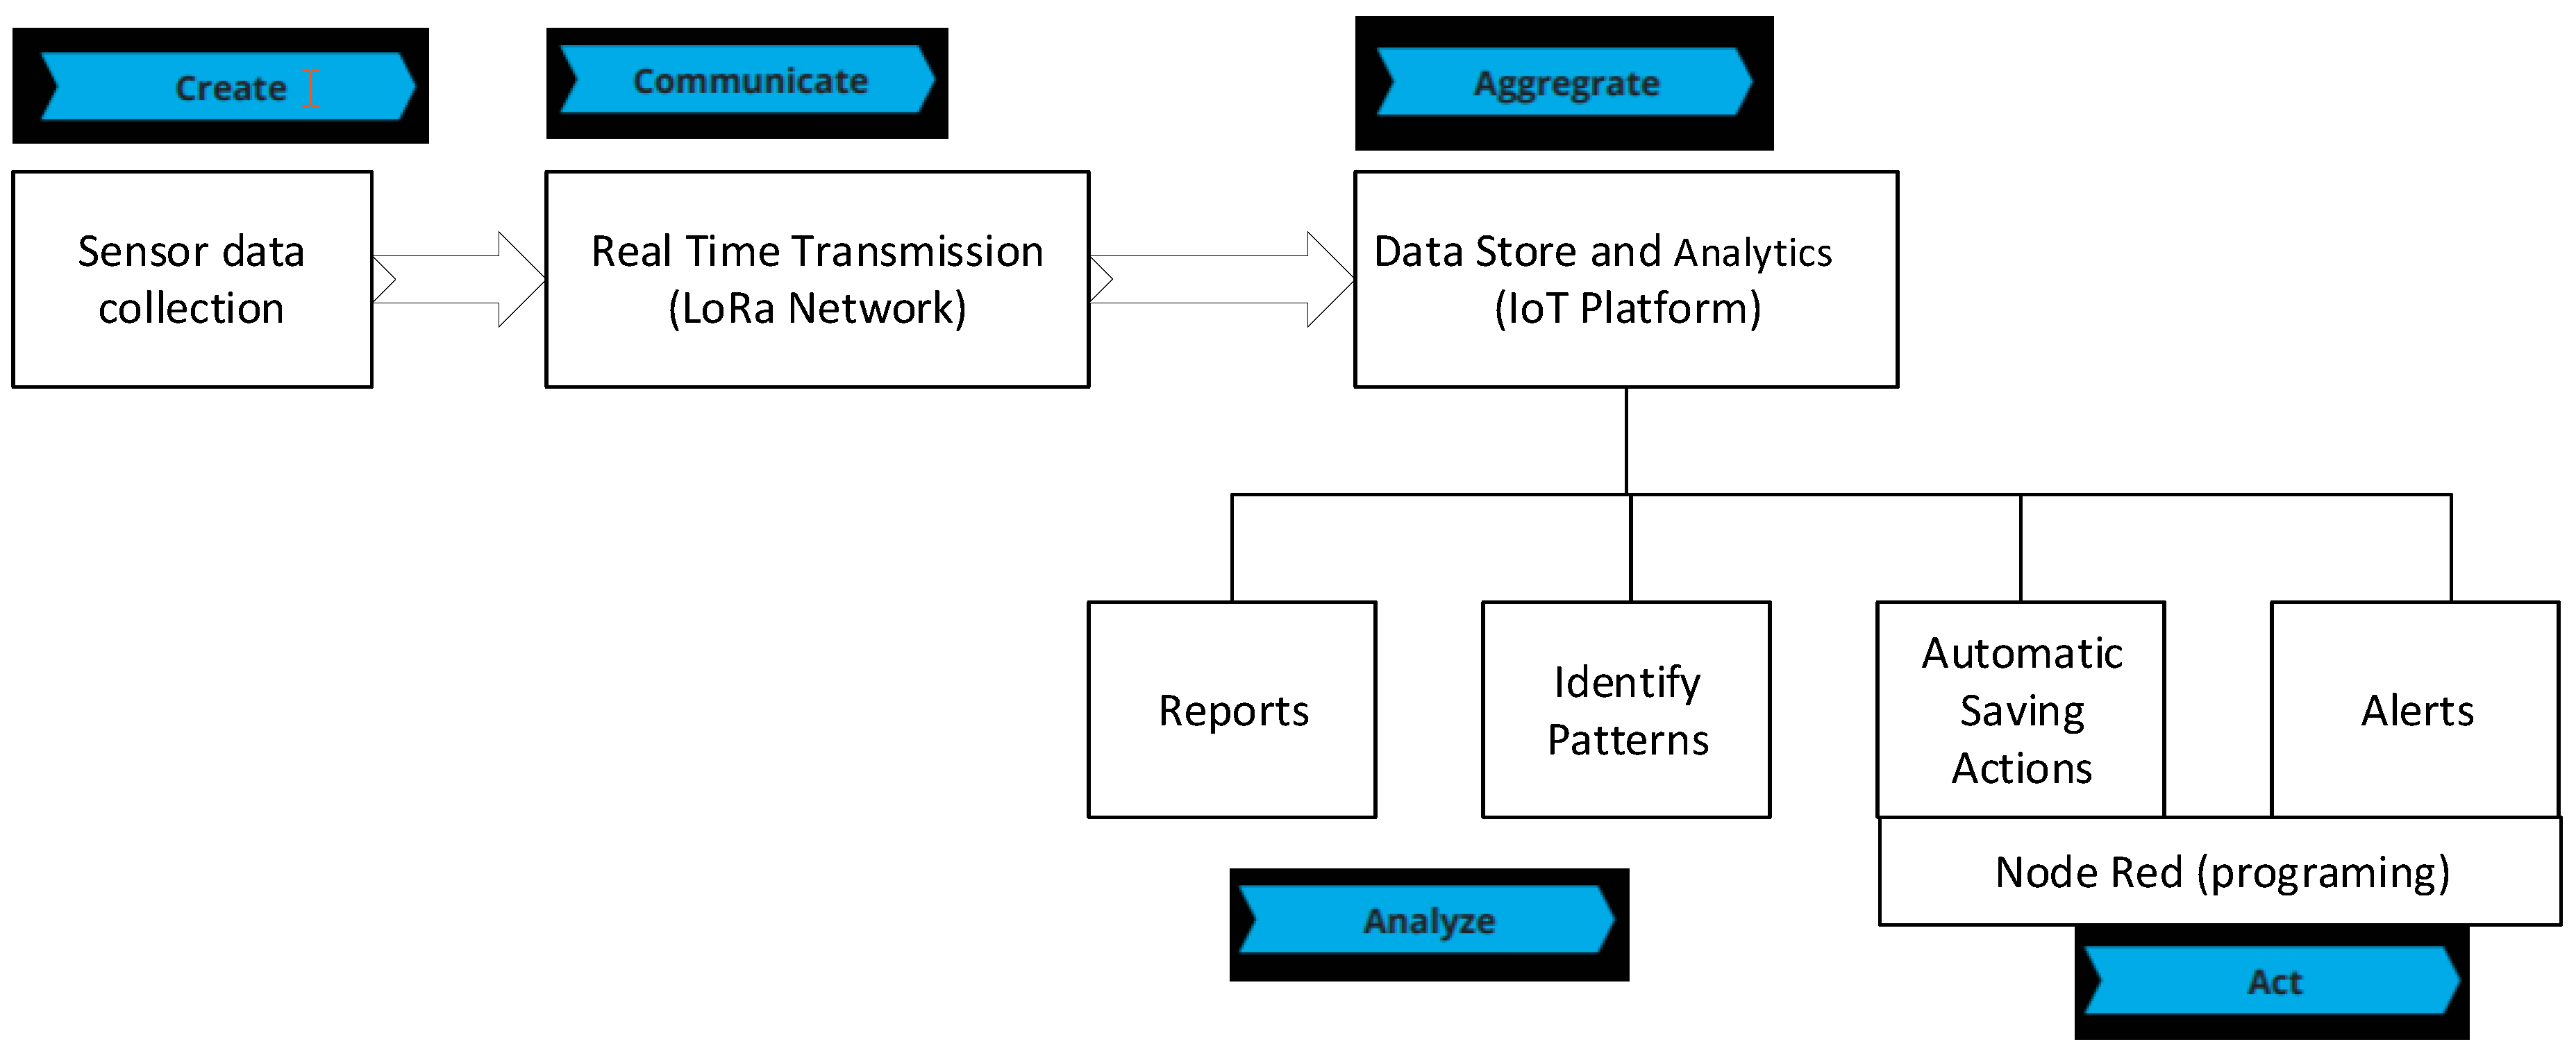
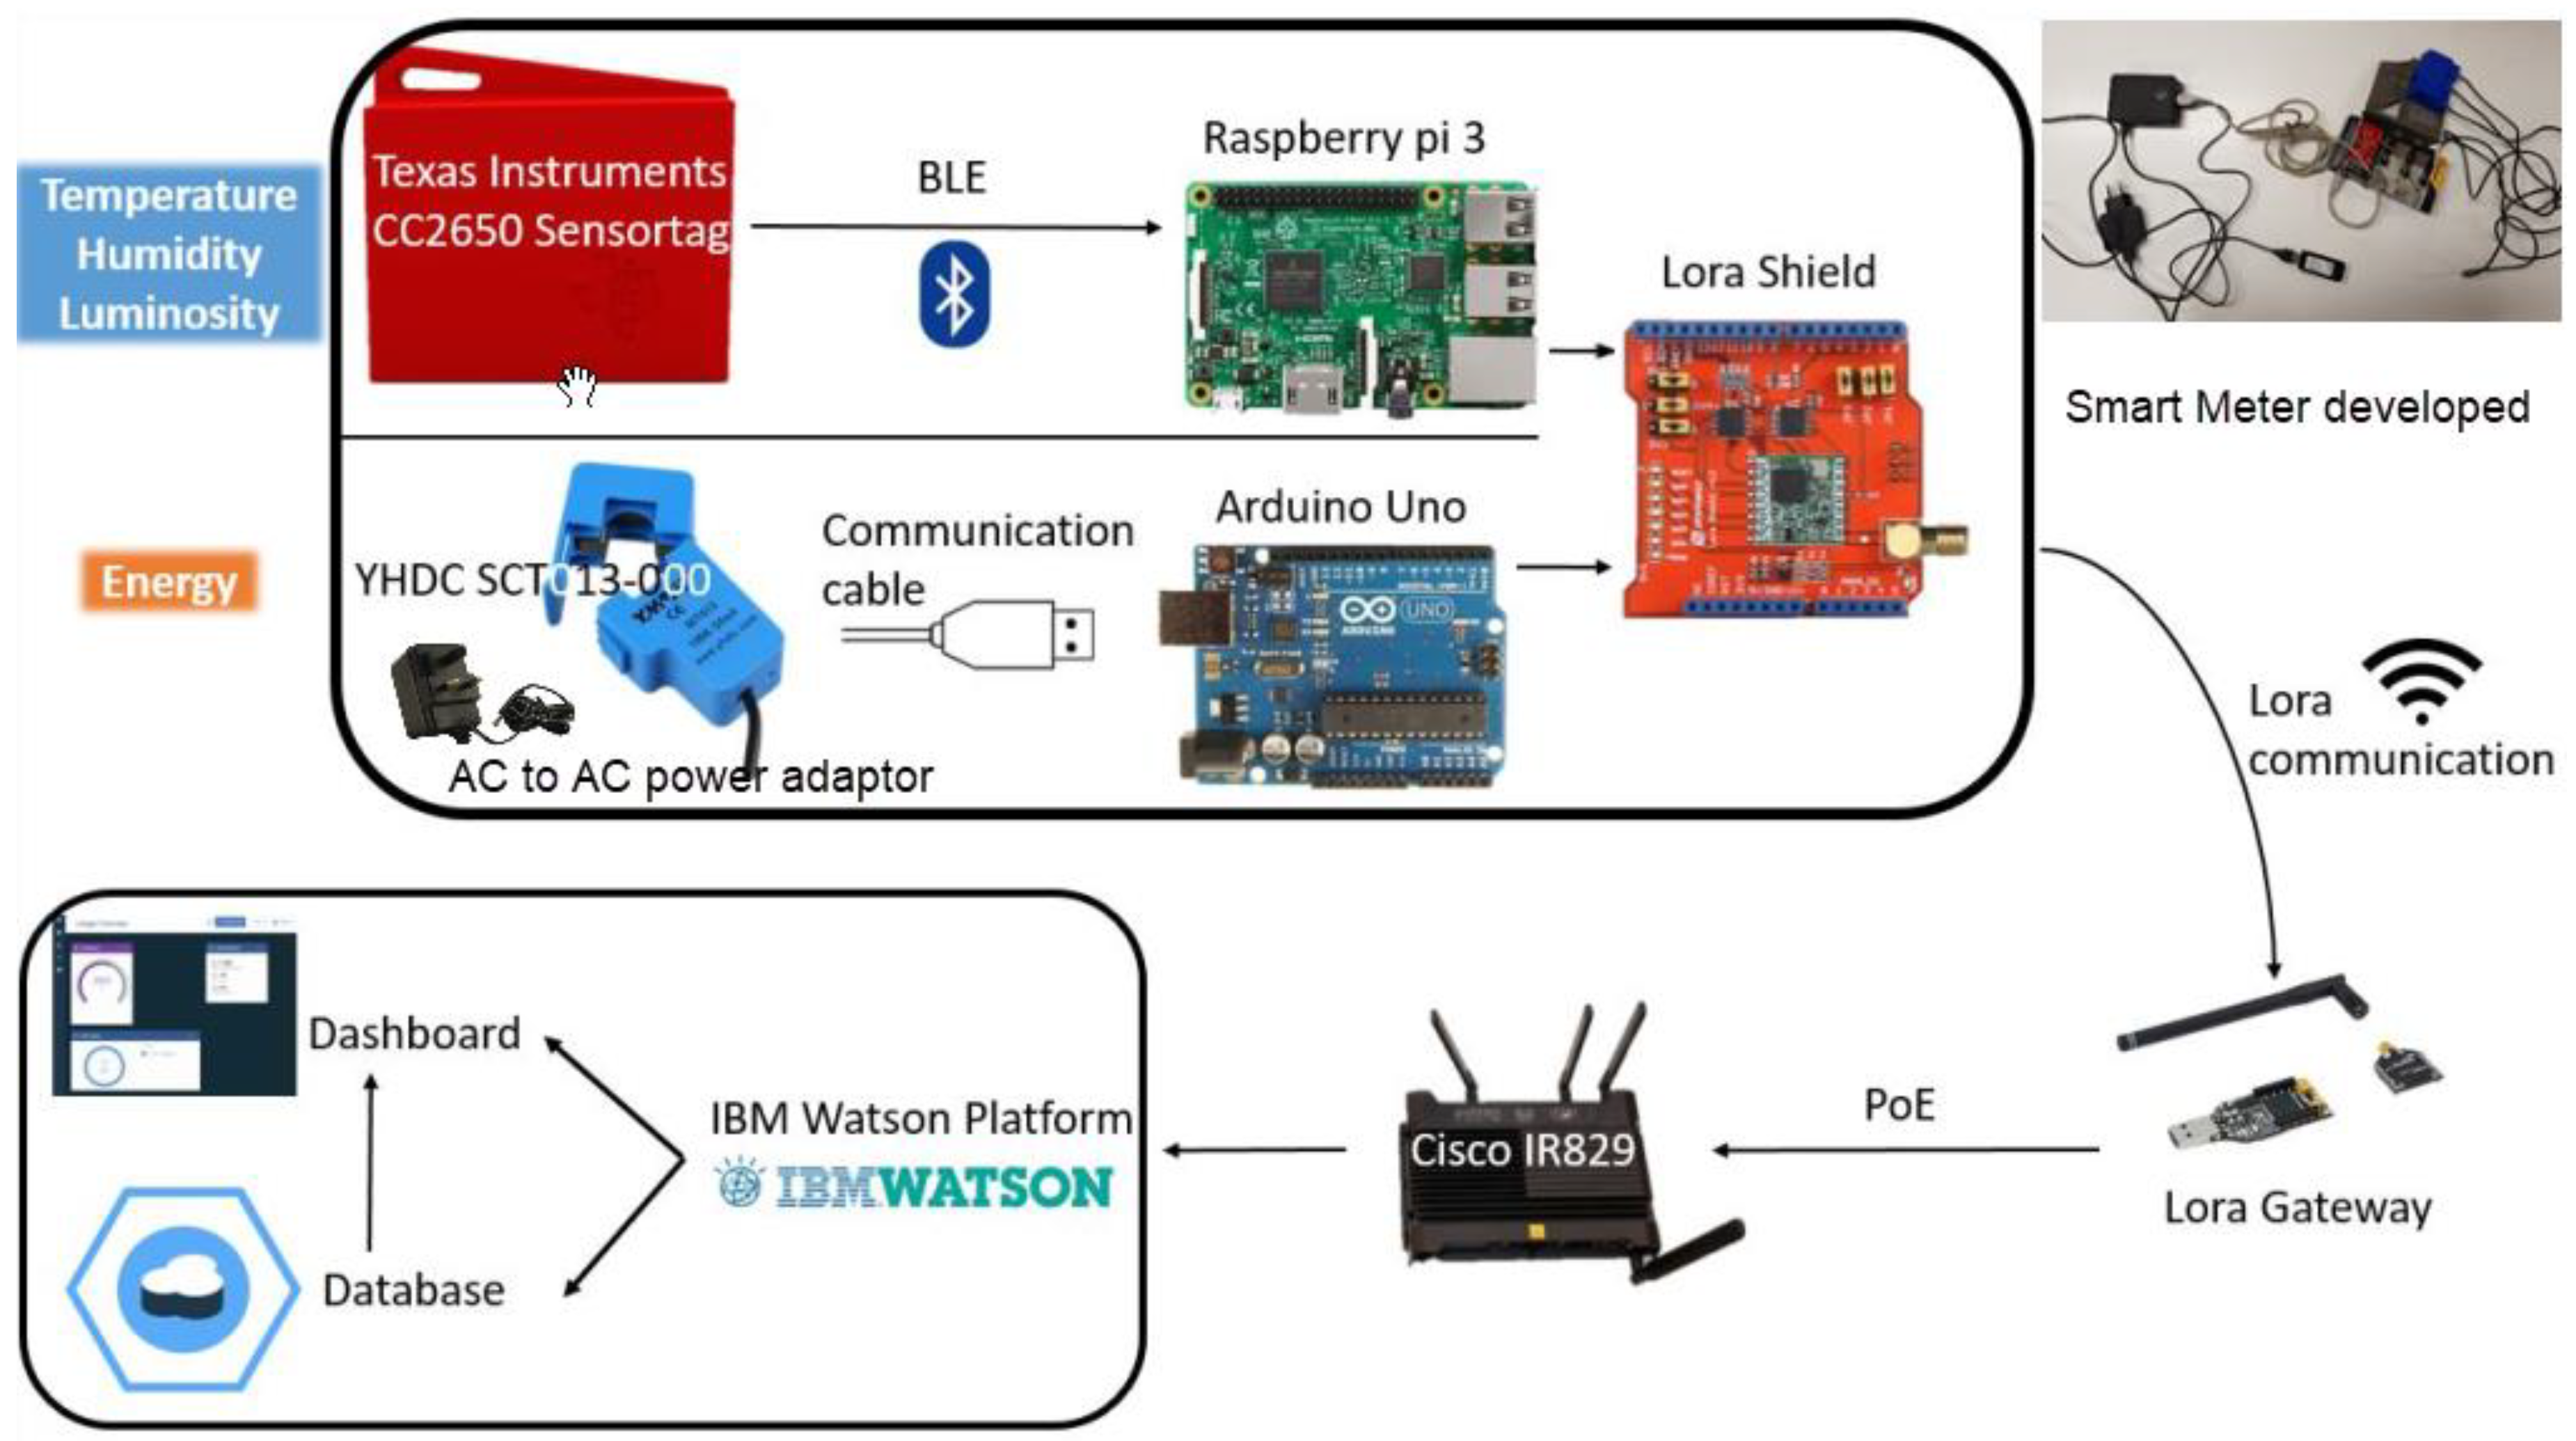
The university at hand is a community of about 10,000 people (students, lecturers, and non-teaching staff), which has four buildings in a central area of Lisbon, with a total of 53,000 square meters of gross built area. The annual energy bill is about half a billion euros, corresponding to total energy of 4 GWh/year (81% electricity, 19% natural gas). As shown in
Figure 3, a smart campus initiative was recently developed, where sensor data collected (electricity, temperature, humidity) was transmitted in real time to an IoT platform for analyses and saving actions were implemented [
15]. These smart meters allow for the measurement of solar energy production, as well as the heating/cooling system, lights, and other configurable equipment.
In the context of the proposed system, we decided to measure electricity consumption and production to test a small MG energy exchange model. Due to the high number of sensors currently available in the market for each task, choice of the most suitable sensor was critical. The primary criterion for this decision process was smooth integration and data calibration. To measure electricity consumption, we chose the YHDC SCT013-000 current sensor (YHDC, Qinhuangdao, China), which is a current transformer (100 A: 50 mA) where its analogue output is received and processed by an Arduino with a Lora Module for wireless communication (see
Figure 4).
For the communication layer, we chose LoRa technology to provide wireless data communication inside the university campus, and a Cisco Lora network was installed to cover the entire campus. The choice of LoRa technology was based on its long-range coverage when compared to other available low-power wireless technologies, such as ZigBee and Bluetooth Low energy (BLE), and its low data rate requirements, as Lora data rates range from 0.3 kbps to 50 kbps. These sensors use low power networks like LoRaWAN to connect to the Lora Gateway. The Lora Gateway uses high-bandwidth networks like WiFi and Ethernet to connect to The Things Network using Cisco IR829 (Cisco Systems, Inc., San Jose, CA, USA), which provides Power of Ethernet (PoE) to the Lora gateway, as well as an encryption connection (shown in
Figure 4). From this IR829, data is sent to the IBM IoT platform for storage and to perform data analytics.
The Instituto Universitário de Lisboa (ISCTE-IUL) infrastructure is comprised of two Cisco Enterprise/Industry-class Gateways, installed in both indoor and outdoor environments, to accommodate diverse environments and support laboratory equipment, IT equipment, and other specific tools.
Figure 3 shows images of the currently implemented solution, based on four layers: (1) a Lora Antenna, which runs the LoRaWAN protocol to communicate with the Lora gateways or sensors; (2) a Lora Gateway IoT Extension Module) (IMX), (Cisco Systems, Inc., San Jose, CA, USA)—the concentrator tunneling the LoRaWAN MAC frames between an endpoint and an IR829; (3) a Cisco IR829, which handles the LoRaWAN MAC traffic, performing endpoint and gateway management, LoRaWAN MAC layer security, and other functions; (4) an application management, Actility, which is a secure form of communication as all data are encrypted.
The Actility ThingPark Wireless™ platform (
https://www.actility.com/products/) (version 5.0, Actility, Paris, France) enables connectivity with customers and allows devices to be used in multiple applications, such as smart cities, to promote sustainability. Cisco’s Low-Power Wide-Area Network (LPWAN) equipment (Cisco Systems, Inc., San Jose, CA, USA), along with its Network Director management software, provides wireless connection between sensors, gateways, and the internet (or the customer’s private network), while the Network Server Acuity ThingPark Operations Support System (OSS) ensures the correct routing of the data packages while allowing simple monitoring, supervision, and management of the network, from the sensors to the application.
The collected data is transmitted to the Arduino (version uno, nteraction Design Institute Ivrea (IDII) in Ivrea, Italy) and Raspberry PI gateways (version 3, Raspberry Pi Foundation, London, UK), and from them to a LoRa communication system using the implemented approach. For the connection of a Current Transform (CT) sensor to an Arduino to be effective, it is necessary to condition the output signal of the CT sensor to match the input requirements of the analogue inputs of the Arduino, i.e., a positive voltage between 0 V and the reference voltage, Analog-to-digital converters (ADC).
The sensor data is transferred through the LoRa network to the Steemit platform, where it is considered for an energy transaction account.
This solution allows real-time data to be obtained from various sources of information and is used in decision support tools. These can result in benefits and optimizations to the processes of continuous improvement of the services provided to the community, contributing to better knowledge of the campus community (in this case, ISCTE-IUL) dynamics and an increase in the quality of life.
6. Blockchain Applications
The following cases are examples of applications of this nature at the university campus:
Case 1—Classroom student footprint energy account in IBM blockchain
We measured all energy consumption, from the lighting, heating/cooling system, and power outlet every 15 min (this is a configurable parameter in our smart meters). It was possible to check student presence based on an identification card reading system connected to our academic management system. Every student could register their presence by inserting their magnetic card into the reader inside the classroom. Teachers used a similar card to open the door. Since we monitored electricity consumption, it was possible to create a transaction model that computed the energy consumption associated with each student in a blockchain. For example, a large classroom uses light, projecting devices, and a heating/cooling system, which consumes about 20 kW/h. In this case, the presence of 40 students equaled an individual consumption of about 500 W/h per student. Based on the student population in the monitoring classrooms (two), we tested blockchain transactions for a period of 3 months for a population of about 1000 students, with an average of 35 students per classroom transaction (see
Figure 5). This energy consumption was transformed into a token at the blockchain, where we defined a token as a watt/hour of energy. Some students showed high transaction tokens due to the fact that they had more classes in that classroom, and in the same cohort, some students missed classes and therefore would show fewer tokens. It should be noted that we did not explore this energy consumption footprint, but the number of transactions performed. We had a classroom of about 100 students which generated 100 transactions in the blockchain every 15 min.
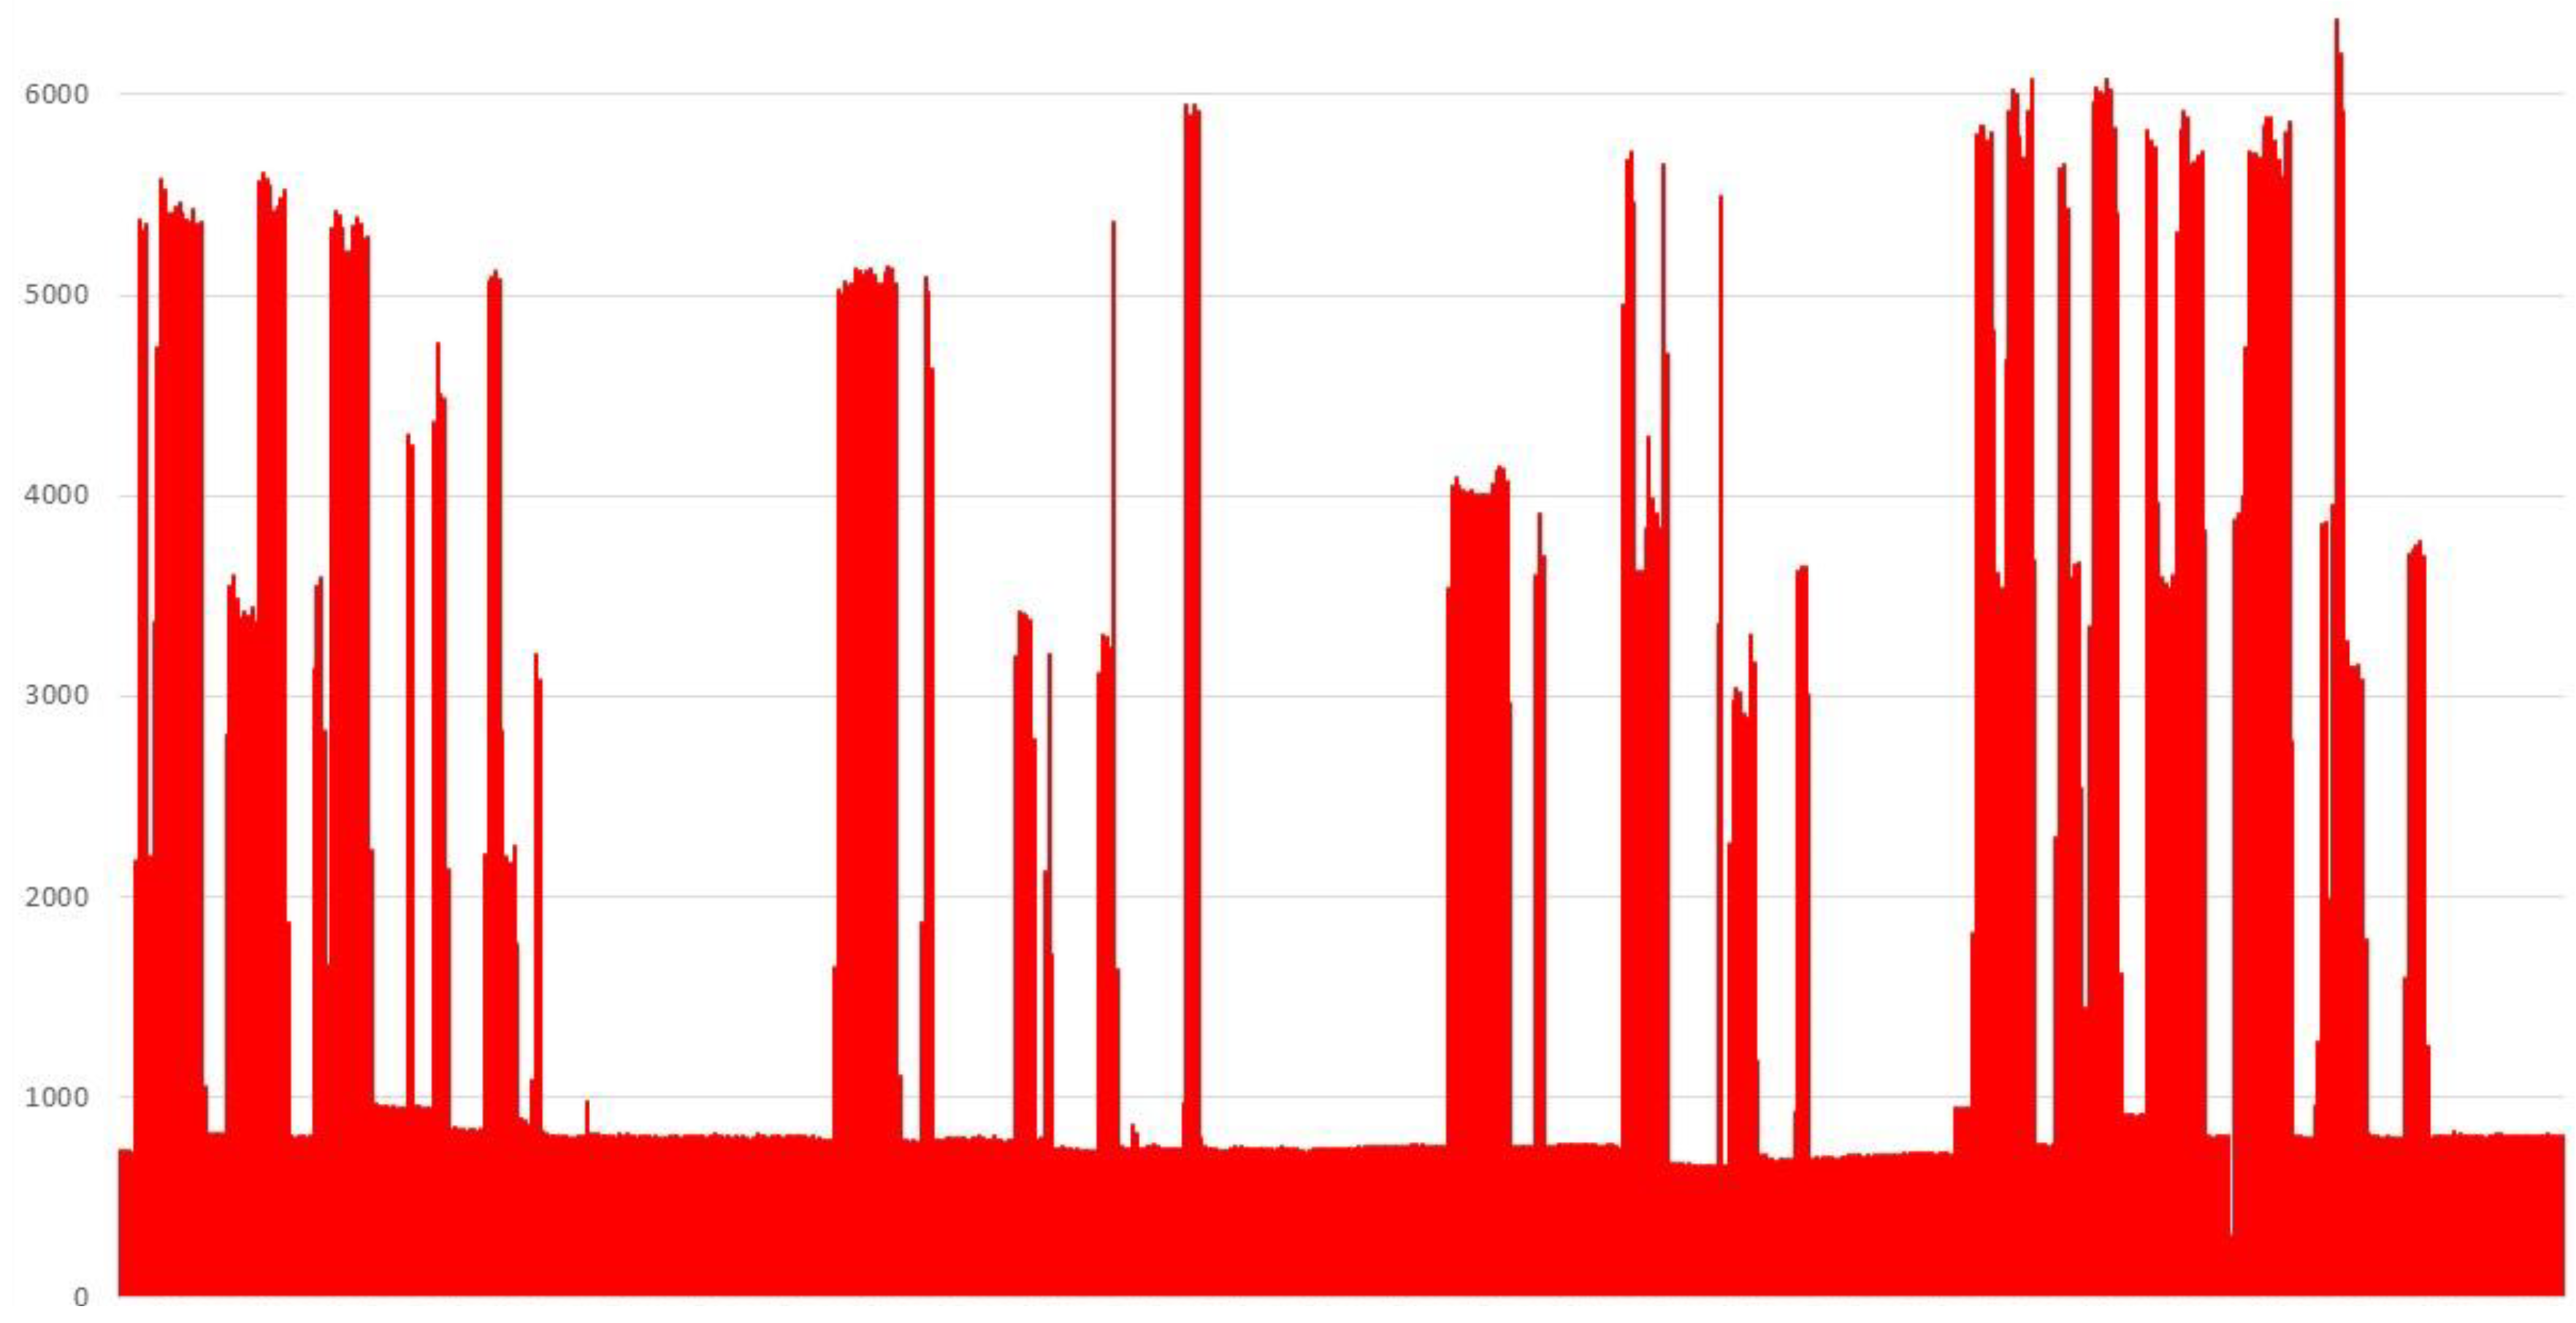
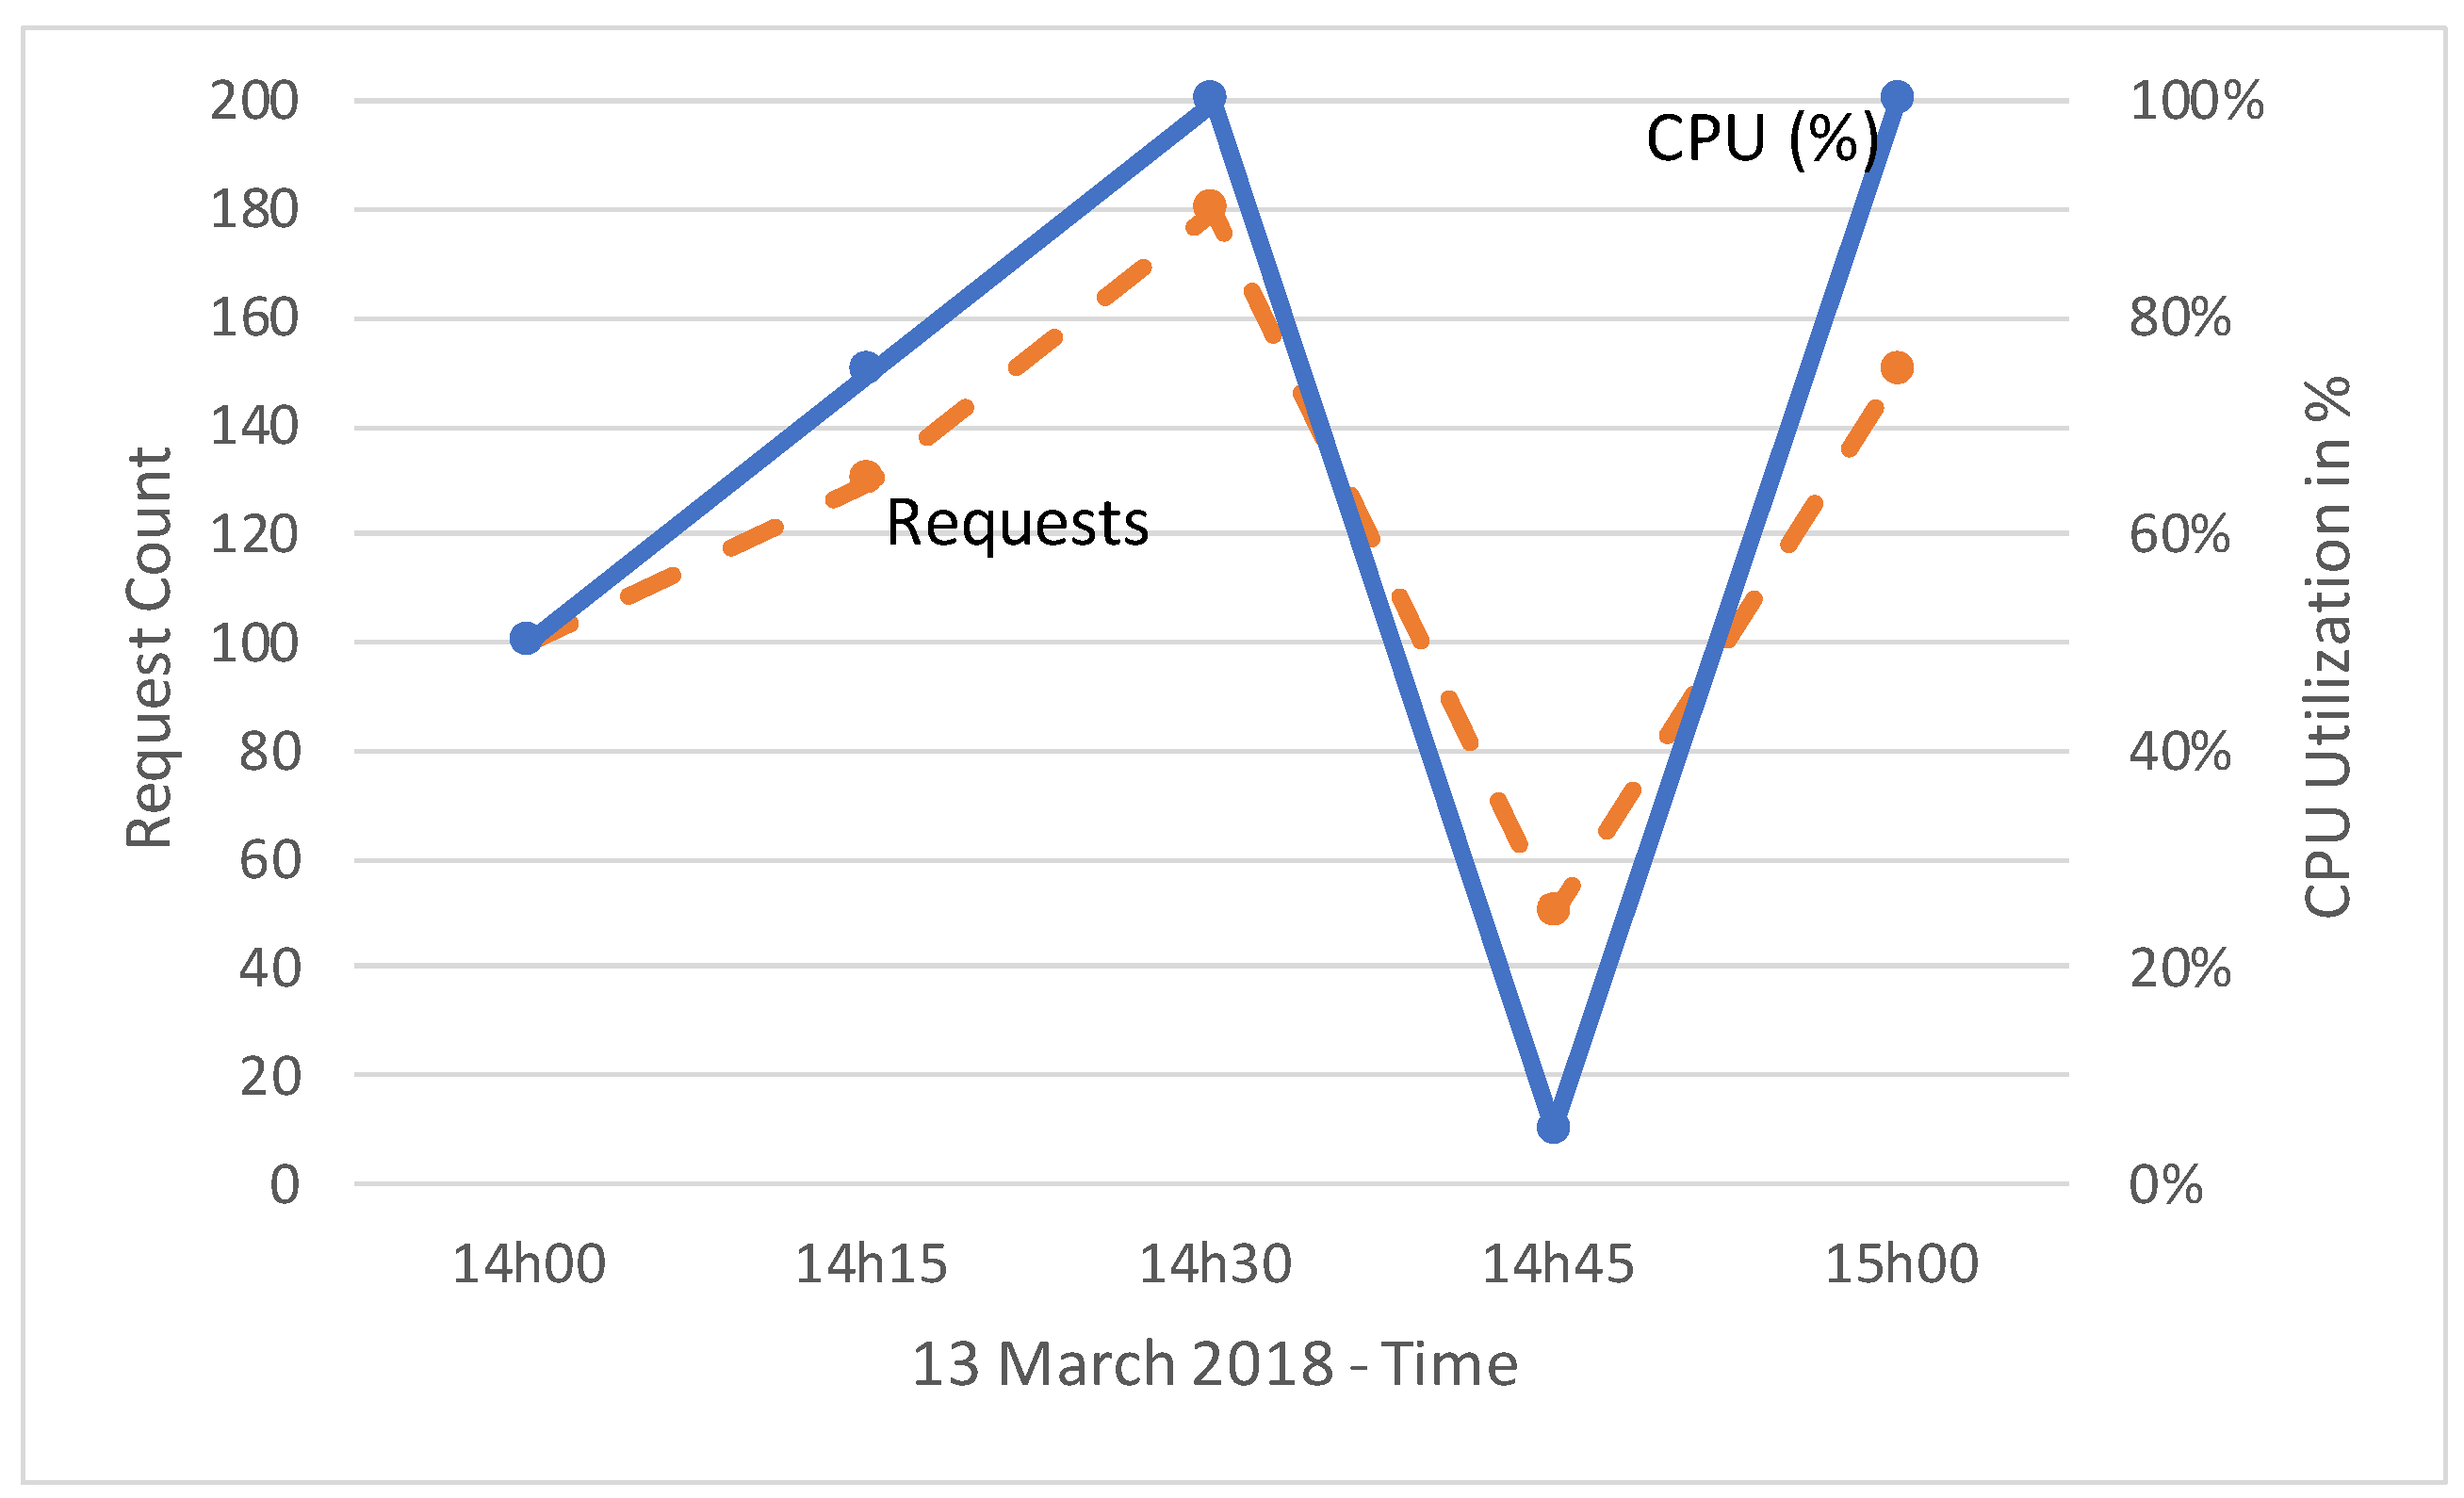
Figure 6 shows the worst scenario observed, with data from the two classrooms generating 180 requests arriving simultaneously to the server. Machine CPU (IBM Watson IoT platform) went to 100% utilization as requests went up to 150. All transactions were performed in this period with these processes. We generated 350,000 transactions in total, with an average of 3500 per student.
Case 2—Microgeneration—Testing blockchain MG transaction model at our IoT Laboratory
We created a simulation environment using information from the real production of 16 solar panels, each producing about 250 W. We associated two panels (of 500 W each) in each classroom (CR). Each CR represents a house and, based on classroom occupancy (occupied or not), we simulated electricity consumption. If the classroom (CR) was occupied, it had the capacity to consume—but if not, the MG went to the nearest CR. We assumed that lighting consumed 1.5 of the MG energy of each classroom (750 W). In this investigative scenario, we only accounted for MG transaction from CR-X to CR-Y, each trying to simulate a real case of MG energy transaction without a central control infrastructure. Excess production of MG went from one CR to the next, using the MG event and the CR occupancy. If CR1 was occupied, its light consumption took all its MG production, but if class lights were off, the energy went to the nearest CR. Based on this process, we tested the proposed approach with all transactions accounted for in the blockchain using 3 months’ worth of data.
Table 1 shows how our experiment expanded to 8 CRs, as well as the associated transactions in the blockchain. To simplify, we showed the kW consumption in the process as follows: In
Table 1, the intersection between the second line in the fourth column shows CR1→CR2, which means that during this 3-month period, CR2 used 31 kW/h from CR1. This MG comes from solar panels 1 and 2, producing energy that was not used by CR1 because lights were off during that period, and CR2 was able to take that energy. The CR number represents the physical distance between the CRs as they were all located in the same hallway.
Table 1 shows it is possible to account for these transactions in an implementation using the IoT blockchain from IBM. Although other blockchains could have been used, we chose IBM due to its fast development, since this approach was already integrated into IBM Watson. Values represent kW/h, but these are converted to tokens in the blockchain, considering time and the agreed prices. In this phase, static prices were applied, but it is possible to apply dynamic prices based on production offer.
7. Gamification Process to Reduce Lighting Consumption
Here, we propose a public visualization of non-sustainable behaviour.
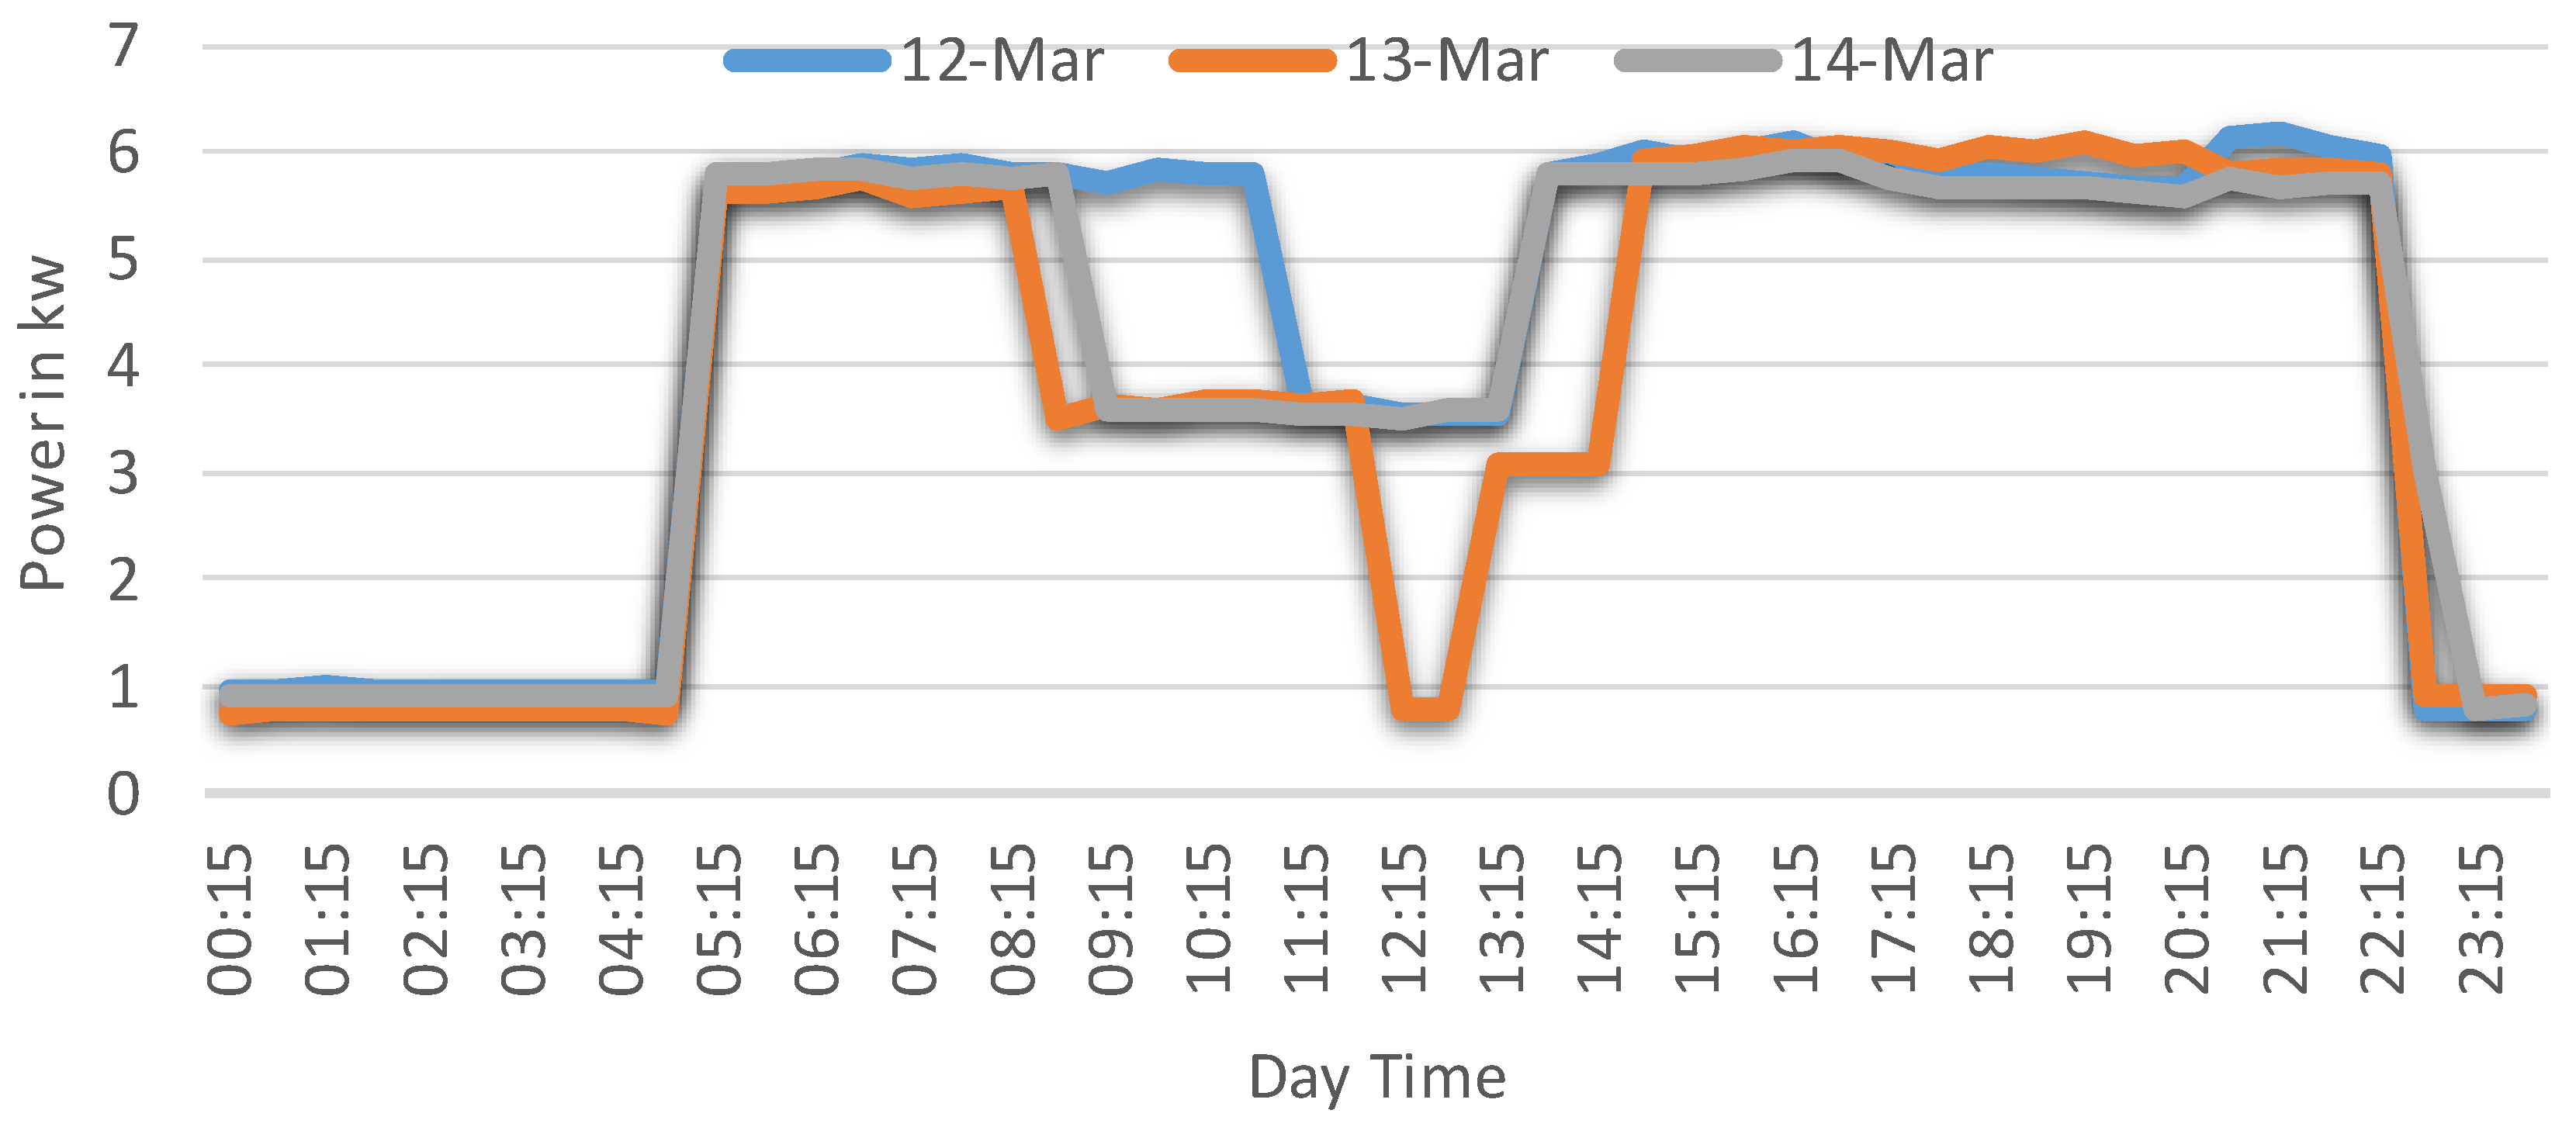
Figure 7 outlines a small example of data collected, where it is shown that the light was turned on at 4:15 p.m. This was done by the security personnel, and classes only started at 8:00 a.m. CRs had no windows, or these were small—and curtains prevented daylight from entering the room.
Figure 7 shows that lights were on for most of the time, even during periods where no classes were taking place or no people were in the class. Our study showed there was an average waste of 100€ per year in each classroom due to the fact that lights were on even though classes were not being held or no people were present.
To overcome the problem of lights being left on even when rooms were not being used, a gamification approach was introduced, with light consumption being checked against luminosity. For example, if a class finished at 1:00 p.m. and the following one started at 6:00 p.m., the consumption during that time range was accounted for, which was around 5 kW/h. If the former class had 50 students, the system collected 100 W/h for each student, and 5 kW/h for the teacher. In this way, we made weekly and monthly announcements of the top ten most sustainable students (with the least energy accounted in the gamification platform) and the top ten least sustainable (with more electricity consumption in their account).
This approach provided a common behavioral example towards our sustainable goals for light consumption. This approach ran for three months and, based on the initial consumption levels (for the first month), led to savings, because the energy consumption patterns changed. It is also possible to identify more periods of all lights being turned off, such as that of March 13 at 12:15 p.m. We think we can go further with the saving behaviour, possibly reaching savings of more than 50%.
With this approach, it was possible to enable and motivate consumers to change their consumption levels and create more sustainable behaviour. The visualization board, in fact, creates a social comparison and serves to provide motivation towards reaching the pre-defined goal.
8. EV Community and Associated Gamification
For the spinning reserve (SR) market, the EVs need to be aggregated to allow considerable energy stored in batteries. This load aggregation is more easily achieved during the night, as during the day, when the EVs are moving, availability is more difficult. Based on the EV driver’s usage profile, created from a mobile APP that handles the EV charging process, it is possible to identify the availability pattern of each EV and the associated energy. It is then possible to associate the amount of energy available and the periods when that availability occurs based on historical data. EV owners define their participation in the spinning reserve market by providing information concerning the energy that they allow to give back to the system and when (hours). Based on this aggregation, a community profile is created. The market revenues are divided among the community considering the standard behaviour of each EV participant. A gamification process allows increasing EV participation to fulfil periods of time when most EVs are moving, and alerts allow setting targets for EV drivers to achieve.
Figure 8 shows this gamification approach in a mobile APP (used as a user interface with the system), in which the system asks for collaboration to achieve a particular volume of energy that allows increased revenue and the EV driver can adjust their behaviour towards that goal. We use our V2G smart system, with LoRa communication and OpenADR interface. It is possible to collect charging data with this solution. Other market participation solutions can be tried out, but since the energy in the EV battery is a precious value and the charging/discharging process can damage battery lifetime, we propose that only the load available for the spinning reserve market is used. The daily distance travelled by each EV is not always the same, and therefore the level of energy stored in their batteries is not always the same throughout the day. The aggregator analyses historical data to identify deviations from the standard behaviour defined, such as:
- -
the time span each EV from a specific community is connected to the grid;
- -
the daily distance each EV travels;
- -
the State of charge (SOC) of each EV at each moment in time.
This data is analyzed from two perspectives: (1) individual data, and (2) collective community data. We propose the use of Naïve Bayes approach [
8,
9], where the probability of data being within defined parameters (with a predefined value, for example, 8am is represented as 8am plus or minus 5 min) is measured against other periods. In the scope of our proposed model, the following assumptions were used:
- -
Energy losses in the EV batteries are not considered as the losses at the charging stations that emerge due to conversion efficiency, or in the EV batteries, or due to transmission is minimal [
25];
- -
The battery storage capacity of each EV is constant during the study period;
- -
Parking slots have significant capacity available, so there are no waiting times for charging (simplified approach);
- -
EVs are always connected to the grid where they are parked;
- -
The power of the charging stations and outlets is unlimited;
- -
When the number of EVs increases, new communities should emerge based on their geographical location for the physical electrical distribution networks;
- -
A user can belong to several communities, but during each connected period only belongs to one of them.
Different behaviour profile templates are available:
- -
EVs that are continually travelling, for example, taxis, and receive fast charging processes. These cannot be used by an aggregator;
- -
EVs that usually receive slow charging processes but at random locations, i.e., always travelling. These represent additional complexity for the aggregator to use because the behaviour cannot be predicted;
- -
EVs that are known to change charging location and time, but do different trip lengths. For this group, the charging level is variable;
- -
EVs for which the location of the charge station is known and usually doing the same trip.
The main idea is to promote a gamification approach, in which users are joined in communities based on a common goal. This effort is translated into tokens, which are then converted into digital currency. The aggregator identifies critical hours (periods of time when fewer EVs are connected) based on users’ data.
Gamification handles this process where tokens are used to promote users’ participation. The award of tokens is based on the periods of time when the EVs are plugged in, classified by their criticality level. This classification is developed based on: 1) the power offered by the electrical grid to the market, 2) the power made available by the community to be given back to the electrical grid, and 3) the criticality of the period of time (in our case, based on the criteria described above) for the goals of the community.
Users’ misbehaviour (for instance, changes in the profile of their plugged-in time) are penalised with the loss of tokens. If that user
a priori overcomes the failure by providing another user as a replacement, no penalty is applied. All these actions are available in the App; users need only to perform system interaction. If the misbehaviour is not reported in advance, the system heavily penalises the user and forwards the failure report so that an alternative solution can be found inside the community [
9].
The gamification approach, illustrated in
Figure 5, allows users’ interaction and collaboration with the community goal. Users should try to fulfil the community offer, and disruption in predefined or expected user behaviour should be replaced by another community user with the incentive of tokens. The suggestions presented below aim to keep users informed, motivated, and willing to collaborate more frequently:
- -
Infrequent Changes of User’s Plugging Time: users who cannot fulfil their plugged-in time commitment can find a replacement in the community to avoid penalties if an alert is provided in due time. When a user finds a replacement, the community goals remain unchanged.
- -
Area for Reporting Abuses or Faults: the app should have an area where users can report abuses, such as comments or wrong use of the System. The System Manager can penalise users for these abuses. This feature aims mainly aims to discourage users from performing misuses or faults.
- -
Token (Monetary) rewards to promote and recognize community behaviour towards market participation. These rewards are based on the token, which is digital money;
- -
Community Newsletter: this digital newsletter aims to keep the community informed and provide additional information concerning the EVs;
- -
Request: an area in the app for users to ask questions. This area can be used by the system manager to adjust the behaviour of the community;
- -
Users’ Rankings: This aims to highlight the collaborators contributing most and is based on the tokens earned by each user. This is a feature of the gamification platform.
Our testing used data from seven V2G systems in the Nissan Leaf (five of them with 24 kW batteries and two with 30 kW). We extracted charging behaviour patterns, and gamification was tested with pre-defined behaviour checked against the real data collected. The V2G smart systems and LoRa protocols allowed for communication in most places. Our network has a range of 15 km, but other networks are also available.
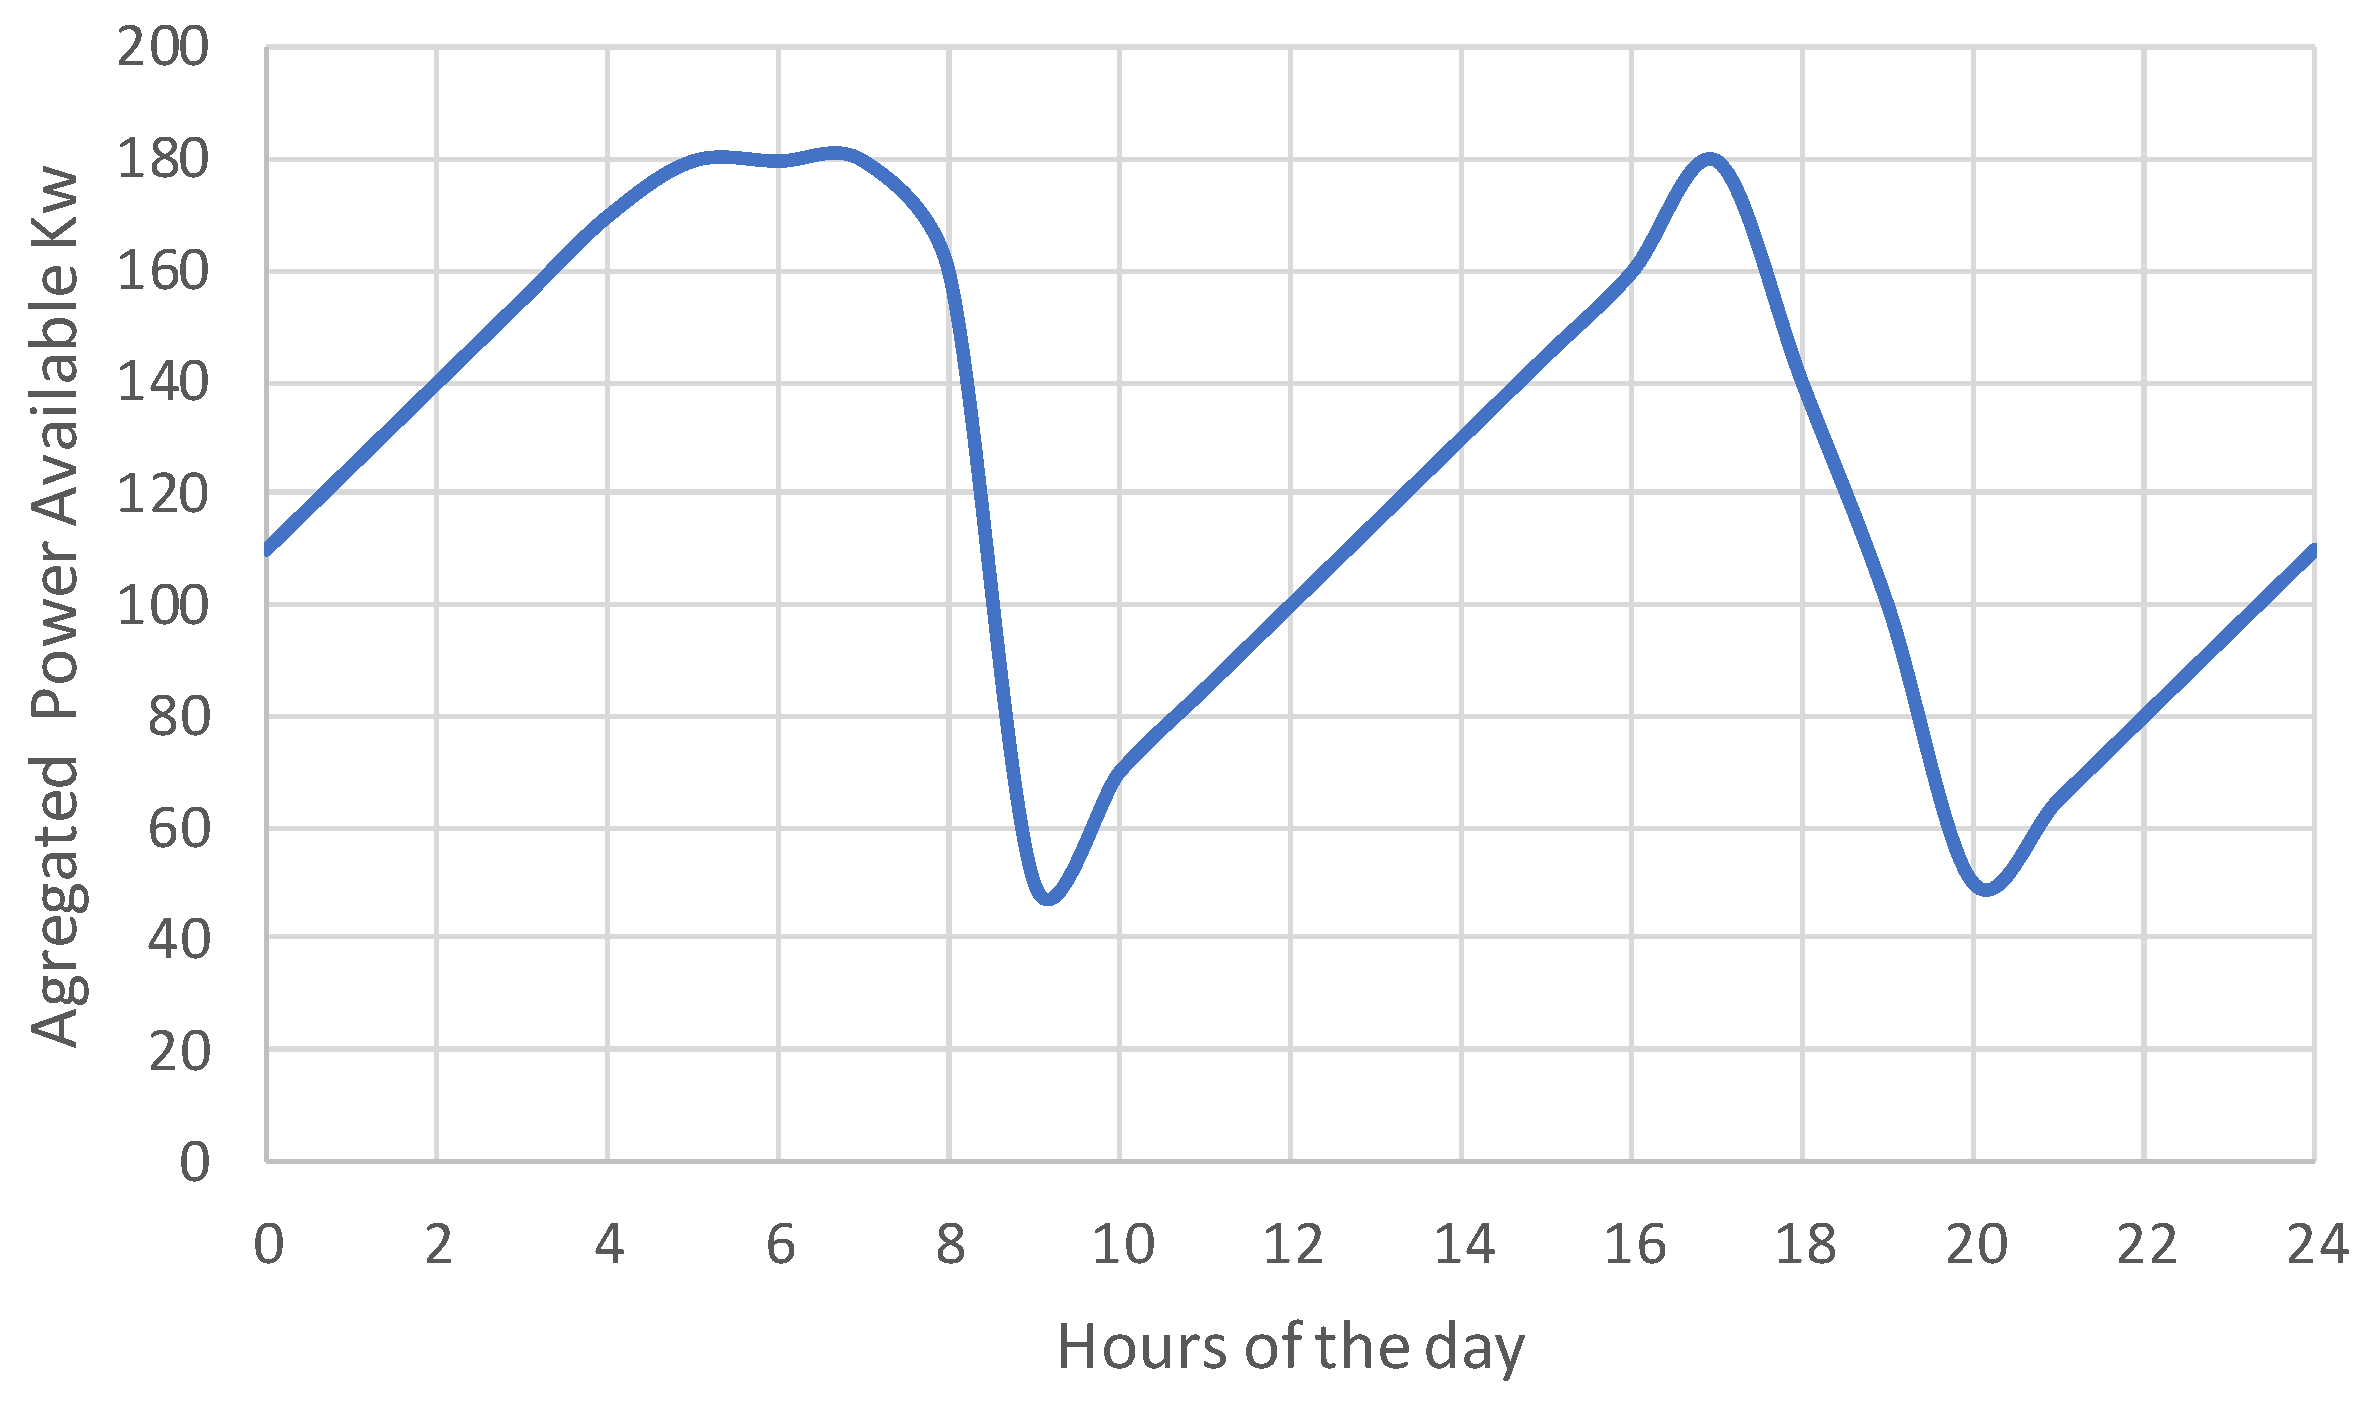
If a user says that his car has been plugged in at 7:00 p.m. and it turns out not to be, the system will take tokens from him unless he sends a prior alert of this change and finds another user to replace him. The total power available in this small community is 5 × 24 + 2 × 30 = 180 kW. Patterns show (
Figure 9) that critical periods (with less aggregated power available) occur after mobility periods (no connection to the grid). It is relevant to check the gamification approach during these critical periods (8:00 a.m. to 10:00 a.m.) and (6:00 p.m. to 9:00 p.m.). We observed several changes in behaviour 15% of the time over 3 months’ worth of data. Due to the small number of users in this pilot testing experiment, finding users to replace these changes was not always possible. Nonetheless, exceeding our expectations for such a small pilot, available power was always above 35 kW, and the system handled transactions based on a pre-defined value (introduced for market participation) with the associated division on blockchain with gamification inputs.
9. The flexibility of the Demand Response Community and Associated Gamification
The powerful global flexibility of the Demand Response (DR) approach has the goal of shifting demand from peak to off-peak hours. It is based on a two-way Internet Protocol (IP) communication connection between suppliers (offer) and consumers (demand). Grids can also quickly adapt to such transactions in order to allow the inclusion of other sources of renewable energy and lead to more ecological behavior from the users by reducing their consumption profile and, in parallel, increase their participation in the DR strategy. The proposed DR is grounded on demand management and on variables such as the price of the energy, the quantity of energy available and the forecasting of the level of production of renewable energy, which requires complex ways of signal handling and optimization. There are two perspectives for DR: (1) peak clipping when the total level of demand for electricity is unpredictable, and a financial incentive reduces the demand level in traditional peak periods; and (2) demand shifting, which consists of delaying or anticipating demand to off-peak periods.
In the electricity market, flexibility associated with DR can be defined as a consumption adjustment performed in a specified period of time to balance supply and demand at a given moment in time [
27]. Individually, this behaviour will not have a market impact (will not be valued), but at an aggregated level it is possible to become an SR market player and profit from it. Our approach uses a predefined set of consumption templates from which users choose based on their equipment flexibility (type, power, and flexibility approach). The four templates considered are as follows [
28]:
T1—Scheduled-Based Appliances (SBA)—This template is related to electrical appliances with flexible operation periods. Since there are household appliances that come within the scope of this template such as washing machines, drying machines, and dishwashers, users can pre-define their operation time frame based on their preferences and lifestyle.
T2—Range Temperature Based Appliances (RTBA)—This template is focused on appliances for which temperature can be regulated, such as refrigerators, heating systems, or air conditioners. In these situations, users can pre-define a temperature operation range or pre-accept a fully flexible range (deep learning data analysis can identify the main working temperature ranges, and the user can check if it is acceptable). This approach has already been applied in tensor flow [
28], but the description is beyond the scope of this paper.
T3—Battery Assisted Smart Appliances (BASA)—This template relates to EVs. Their charging process can be conducted based on the availability of energy and on optimization of costs, e.g., based on the energy consumption of other electrical appliances that are connected to the same consumption node.
T4—Full Flexibility (FF) operation mode. Patterns extracted from historical data collected from smart sensors in flexible equipment allow users to check if the flexible approach is positive. For example, a user who chooses full flexibility for the heating system can check from historical data if he always has hot water in this approach and check if it is beneficial as if on one hand the full flexibility system leads to earning more from the system, on the other hand, the user may occasionally have cold water (although the probability is low, it makes sense to allow this to be based on the user’s decision).
A Regional Aggregator (RA) (defined as an aggregator for a specific community) takes users’ choice of the predefined templates to maximize the total power flexibility within the associated time period. Taking into account market goals, a gamification approach is applied to promote users’ participation to achieve those goals. The RA manages the full set of electrical appliances at the same location with OpenADR interfaces based on user-defined profile and market operation needs. Based on regional capacity flexibility, this RA exchanges information with a central market operation, where the necessary actions towards the OpenADR command centre are defined. This command centre aims to share the excess production of renewable energy among the different RAs. This sharing is based on the loading and unloading capacity of each RA and, as previously discussed, this capacity varies throughout the day based on the user’s definition of how the appliances will be used. The central RA also advises users on how to reduce their energy bills by producing suggestions to adjust appliance aggregation with OpenADR, expand flexibility periods, and manage heating/cooling systems based on the level of energy available in the market. The suggestions provided by the RA are registered in the local (home) energy management system. This system can be accessed by the user using a mobile or a web interface. Based on all the requests from the different users, the RA sends the aggregated demand level to the central system in the shape of a time function. As a first approach (others could be implemented), the central system suggestion is to share the renewable energy available among the several RAs based on their particular levels of demand. If the aggregated demand loads from all RAs is not enough to absorb all the excess energy produced, traditional reserves (such as batteries) should be used. If the production excess is lower than the power available in the flexible community a rationing approach between all RAs based on the priority of the templates (T1 to T4) should be implemented. Within each RA the energy should be distributed based on a similar approach, using the defined power profile. Examples of how to share this energy are already available in the literature [
29]. In each household, the energy received also has to be distributed based on a pre-defined prioritization of the equipment template. If the level of demand is higher than the energy available, it is possible to turn off appliances according to the predefined sequence provided to the node-red flow.
Each input to turn on/off or increase/decrease power in the appliances originates a token transaction in the blockchain, and associated commands based on node-red actions using OpenADR appliance interfaces. Based on random events, we simulated a renewable production based on pre-defined rules with originating flexible behaviour. A small case study was performed in the IoT laboratory using data collected from the classrooms and information about class events and the number of persons in each class, where we simulated DR behaviour using blockchain and gamification. Data used came from the eight classrooms, the AVAC systems (T2 defined System), with the seven EV (T3 defined systems), and our IoT laboratory appliances (for T1 we used a power outlet and for T4 another power outlet where a local heating system is connected). The aggregated power was created based on the heating/cooling process and the EV charging process. Each AVAC in each classroom represents the DR flexibility of an individual (simulates a house with the power of 3 kW), and each EV represents one owner. Random events simulate changes in production with an on/off or increase/decrease in power consumption. The acceptance of this external command creates blockchain transactions associated with this flexible behaviour. Based on this approach, we created a process to account for flexible behaviour. We defined transaction time units of 5 min (a configurable parameter), and in future work will check the impact of different time units and improve the centralised coordination rule-based system towards the pre-defined collective market goal.
10. Current Status and Challenges
In Europe, smart meter real-time measurements and communications have only been implemented in large companies; in the small energy market, which includes domestic users, the large majority are not yet using IoT smart meters [
4]. Overcoming this lack of flexibility requires OpenADR or similar approaches (which are still lacking standardization) with metering to implement DR at a residential level [
30]. This situation with missing data sources for end users’ consumption behaviour using specific equipment, for instance, the EV charging process, delays the application of data analysis. The unadapted current market status for the aggregation process of DR flexibility and EV is a fact [
9,
30]. Nevertheless, the smart grid vision of electricity markets requires open markets and demands flexible services. These markets work based on bids and have substantial requirements for minimum bidding volumes and bid duration. This situation has constraints that can be overcome through the use of powerful gamification platforms for users to develop joint efforts to achieve the market goal.
In summary, in the European Union, only a limited number of aggregators can be identified [
31]. In many countries, the market rules for electricity do not favour the emergence of aggregators. Also, market rules are not yet similar in the different member countries, meaning a lack of coherence in the European Union. Therefore, policymakers should take a holistic approach to enhance community market participation, where DR flexibility and EV aggregated batteries could represent essential players as long as end users recognise the profits and benefits from this approach.
This aggregation, along with local MG, can be a solution to overcome network and supply constraint problems.
11. Conclusions and Future Work
Current technological developments allow prosumers to produce electrical energy in-house or in local green energy communities. However, the energy market is still dominated by big energy players. This means that, until now, the majority of prosumers only had access to the (energy) market by using standard bilateral agreements. This has profoundly impacted the expansion of MG as the economic advantages for the prosumers are limited. In this paper, we presented an energy model based on users to study the feasibility of implementing a solution for the micro-generation of in-house energy with the possibility of exchanging energy at a community level, leveraging on the disruptive potentialities of blockchain technologies. The proposed system is based on a blockchain platform with associated gamification and can manage decentralised MG transactions. It can also be applied to the EV spinning reserves market and DR flexibility. The advantages of this approach are diverse:
- -
It allows prosumers’ true engagement in the energy market as they will be acting as enablers for the creation of energy communities;
- -
It enhances the transparency and trust of the energy market system;
- -
It guarantees a high level of security, integrity, and resilience (a consequence of the intrinsic nature of blockchains);
- -
It guarantees accountability while preserving privacy requirements;
- -
It promises new business opportunities that can emerge from the concept of the energy community.
To gather evidence of the viability of the described model, we have developed and tested the different substructures of the system, from its assembly and configuration of the different physical devices (solar panels, batteries, smart meters, IoT control devices) to the implementation of these substructures. Aggregation was simulated based on the local student population. The physical component of the system has some flexibility, and can be configured to work either autonomously or connected to a main grid. In terms of the functioning logic, the model proposed in our approach, and to the best of our knowledge, is the first release of the smart contract. Although at this point it is still at an embryonic level, we plan further developments for our model. We will continue this research aiming to assess the effectiveness of the model if used from a commercial perspective, i.e., assuring the interconnection with a real energy market platform. The system’s business model deserves deeper analysis to be able to produce a final product that can be used in a real context. Furthermore, other essential factors that could have an impact on a prosumer-based energy model require further study, such as:
- (a)
Enhancing trust in the system by using enabled smart meters. Our LoRa network encrypted all sensor data in a secure environment;
- (b)
Increasing systems’ measurement reliability by introducing a consensus mechanism on top of the proposed architecture;
- (c)
Extending the current implementation of the smart contract to include not only more complex subprocesses such as the ability of third parties to interact with coins, but also the ability to automatically control the transaction fees from each owner’s account;
- (d)
Calculating and considering that there is energy loss during transfer, which is not under consideration at this point but should be considered in the implementation phase to allow further detail.
Another relevant research topic is to compute the most adjusted value of the tokens, but once the system is running these values can be improved.
Overall, considering the arguments used and our initial design, the deployment of a prosumer energy model is considered feasible. To facilitate its large-scale adoption in the single digital market, trust and cyber-security, in such a critical service, should be provided at the highest standard.
All work has applied to the LV (Low Voltage) market, but this can be applied to MV (Medium Voltage). To be able to cover the entire population, we conceptualize that several local blockchains will handle transactions regionally and an inter-regional blockchain will handle this in a global approach.


