Article

Exploring Energy Pathways for the Low-Carbon Transformation in India—A Model-Based Analysis

1
TU Berlin, Workgroup for Infrastructure and Policy, Straße des 17. Juni 135, 10623 Berlin, Germany
2
DIW Berlin, Energy, Transport, and Environment, Mohrenstraße 58, 10117 Berlin, Germany
*
Author to whom correspondence should be addressed.
Energies 2018, 11(11), 3001; https://doi.org/10.3390/en11113001
Submission received: 29 September 2018 / Revised: 23 October 2018 / Accepted: 25 October 2018 / Published: 1 November 2018
(This article belongs to the Special Issue 100% Renewable Energy Transition: Pathways and Implementation)

Abstract

:
With an increasing expected energy demand and current dominance of coal electrification, India plays a major role in global carbon policies and the future low-carbon transformation. This paper explores three energy pathways for India until 2050 by applying the linear, cost-minimizing, global energy system model (GENeSYS-MOD). The benchmark scenario “limited emissions only” (LEO) is based on ambitious targets set out by the Paris Agreement. A more conservative “business as usual” (BAU) scenario is sketched out along the lines of the New Policies scenario from the International Energy Agency (IEA). On the more ambitious side, we explore the potential implications of supplying the Indian economy entirely with renewable energies with the “100% renewable energy sources” (100% RES) scenario. Overall, our results suggest that a transformation process towards a low-carbon energy system in the power, heat, and transportation sectors until 2050 is technically feasible. Solar power is likely to establish itself as the key energy source by 2050 in all scenarios, given the model’s underlying emission limits and technical parameters. The paper concludes with an analysis of potential social, economic and political barriers to be overcome for the needed Indian low-carbon transformation.

Graphical Abstract

1. Introduction

India is one of the crucial actors when international climate mitigation goals are to be met. Today, the country already contributes almost 18% to the world’s population and is set to account for around one-quarter of the projected rise in global energy demand by 2040 [1].
In 2015, India emitted 1869 Mt CO2 in total, of which 51% came from power and heat generation. At present, the Central Electricity Authority of India (CEA) projects total estimated CO2 emissions of 983 million tons for the year 2021–2022 and 1165 million tons in 2026–2027 [2]. The main driver of this absolute increase is expected growth of total energy demand. The projected peak demand is 235 GW, with an overall energy requirement of 1611 TWh at the end of the year 2022 [2]. Energy consumption is expected to rise further by 32% from 2022 to 2027 [2].
India submitted its Intended Nationally Determined Contribution (INDC) on 1 October 2015. On the national level for India, it implies three key goals to achieve this agreement:
(i)
to reduce the emissions per gross domestic product (GDP) output by 33% to 35% by 2030 from 2005 levels;
(ii)
to increase the cumulative electric power installed capacity from non-fossil fuel-based energy resources up to 40% by 2030;
(iii)
to create an additional carbon sink of 2.5–3 billion tons of CO2 equivalent through additional forest and tree cover by 2030 [3].
The Draft National Electricity Plan by the CEA [2] includes the INDCs, targeting a path of electricity generation and reduction of greenhouse gas (GHG) emissions in line with the Paris pledges.
By contributing to global climate efforts, India pursues international but also domestic objectives. The adverse consequences of climate change have a significant impact on the Indian population and economy, as weather extremes influence the important agriculture sector and the security of food supply [4]. Furthermore, the rise of the world temperature affects India through climate migration, water scarcity, and famine. In addition, the energy sector is an important element of India’s future development strategy, seeking to reduce poverty, reduce local pollutants, and assure access to electricity for all [5]. Along with the aim to achieve the sustainable development goals (SDG), especially SDG7 “Ensure access to affordable, reliable, sustainable and modern energy for all” and SDG13 “Take urgent action to combat climate change and its impacts” established by the United Nations (UN), India seeks to make its energy system sustainable, and thereby enhance the population’s living conditions.
According to the 2015 Paris climate agreement, India will revise and resubmit its INDCs by 2020. In this context, the potential contributions of sustainable energy supply have received particular interest, e.g., the future of coal as the baseload power, the potential role of natural gas as a “transformation fuel”, and the potential of renewable energy to contribute to sustainable energy development. Given the global acceleration of renewable deployment, in particular solar energy, the INDCs currently developed for 2020 may be more ambitions than those back in 2015, and perhaps not even more expensive.
In addition to meeting targeted climate goals, India may benefit from a fast energy transition from both a sustainable energy and a geopolitical perspective, due to its current dependency on fossil fuels and energy imports [6].
There is a broad and growing literature base on the perspectives of the Indian energy system, to which our paper seeks to contribute. Bhushan [7,8] laid out the principle challenges to governance of energy resources for India that are still valid today, e.g., the energy–poverty challenge, central and regional coordination, the role of coal, nuclear, and renewables, and the insertion of India into global resource markets and innovation systems. Bhushan [8] stressed that India is expected to fulfill its INDC targets for 2030 easily and the focus now lies on the long-term planning. Identifying challenges, such as the need for improvements in the transmission infrastructure and facilitating access to low cost finance, is important for successful development. Currently, there is a market shift towards renewable energy sources (RES) through decreasing prices for renewable power generation, including a rapid innovation in technology [9,10].
The role of coal, and the competition with other fuels for financial resources and policy considerations, is also addressed by the Boston Consulting Group (BCG) [11] and Tripathi et al. [12].
The Indian energy sector has also been subject to model-based analysis in the context of recent policy and technology developments. In the context of the global sustainability initiative launched by Sachs [13] and Transport Scenarios by Dhar et al. [14], both studies identify possible challenges and opportunities of a low-carbon transformation of the energy and economic systems.
Löffler et al. [15] developed a cost-minimal path for the global energy system up to 2050, including India as part of ten global regions. The paper focuses on the interdependencies between traditionally segregated sectors, including electricity, transportation, and heating. Due to the scale of the referenced model, detail within the model node India is lost, which this paper will address.
A comparably different model-based approach is chosen by the Integrated Research and Action for Development (IRADe) [16]. The IRADe’s low-carbon sustainable development (LCSD) model is a dynamic, multi-sectoral and intertemporal linear programming activity analysis model based on an input–output framework. In addition to scenarios which target the compliance with CO2 budgets of 155 Gt (LC1 scenario) and 133 Gt (LC2 scenario) for India by 2050 and a baseline scenario “dynamics as usual (DAU)”, the IRADe also includes human development thresholds and well-being indicators within the “visionary development (VD)”. The results of the LC1 and LC2 scenarios conclude that the CO2 budgets can be met by 2050, but cause a decrease in the overall GDP growth throughout the years.
The Massachusetts Institute of Technology (MIT) has developed a multi-sector applied general equilibrium model of the Indian economy that uses CO2 emissions from burning fossil fuels to generate a 2030 reference case [17]. Sectoral imports and exports capture transactions with the rest of the world. The MIT developed various scenarios, such as the “emission intensity” scenario, which imposes India’s NDCs, and the “non-fossil scenario”, corresponding to India’s non-fossil electricity capacity target of 40% installed non-fossil electricity capacity by 2030. The “combined” scenario simulates the jointly pursued targets of both “emission intensity” and non-fossil electricity. While both “emission intensity” and “combined scenario” lead to the same emission intensity in 2030, the combined scenario includes the additional constraints of non-fossil electricity targets.
Shukla et al. propose an integrated modeling framework [18,19] for analyzing alternative development pathways with equal cumulative CO2 emissions within the first half of the 21st century. They provide a comparison of alternative development strategies on multiple indicators, including energy security, air quality, and technology stocks. Short and long-term drivers of decarbonization pathways for several regions, including Europe, the United States, China, and India are explored in a multi-model decomposition analysis by Marcucci and Fragkos [20]. Their research finds that in the short term, energy efficiency improvements are the key strategy to achieving current climate targets. In a joint project between the Indian planning office National Institution for Transforming India (NITI Aayog) and MIT, Singh et al. [17] employed a numerical economy-wide model of India with energy sector detail to simulate the impact of India’s commitments to the Paris Climate Agreement.
Focusing on India’s important renewable potentials, Gulagi et al. [21] explored the conditions under which India could be supplied by 100% RES by 2050. Similar exercises, with a lower level of detail, for a 100% renewables-based energy supply for India were prepared by Teske et al. [22], Jacobsen et al. [23] and Löffler et al. [24]. International organizations, too, have put a focus on India and its energy challenges, such as the International Energy Agency (IEA) [25] World Energy Outlook (“India Focus”). Shortcomings of the above-mentioned research, however, include a limited focus on electric power (no sector coupling), which will be addressed in this paper.
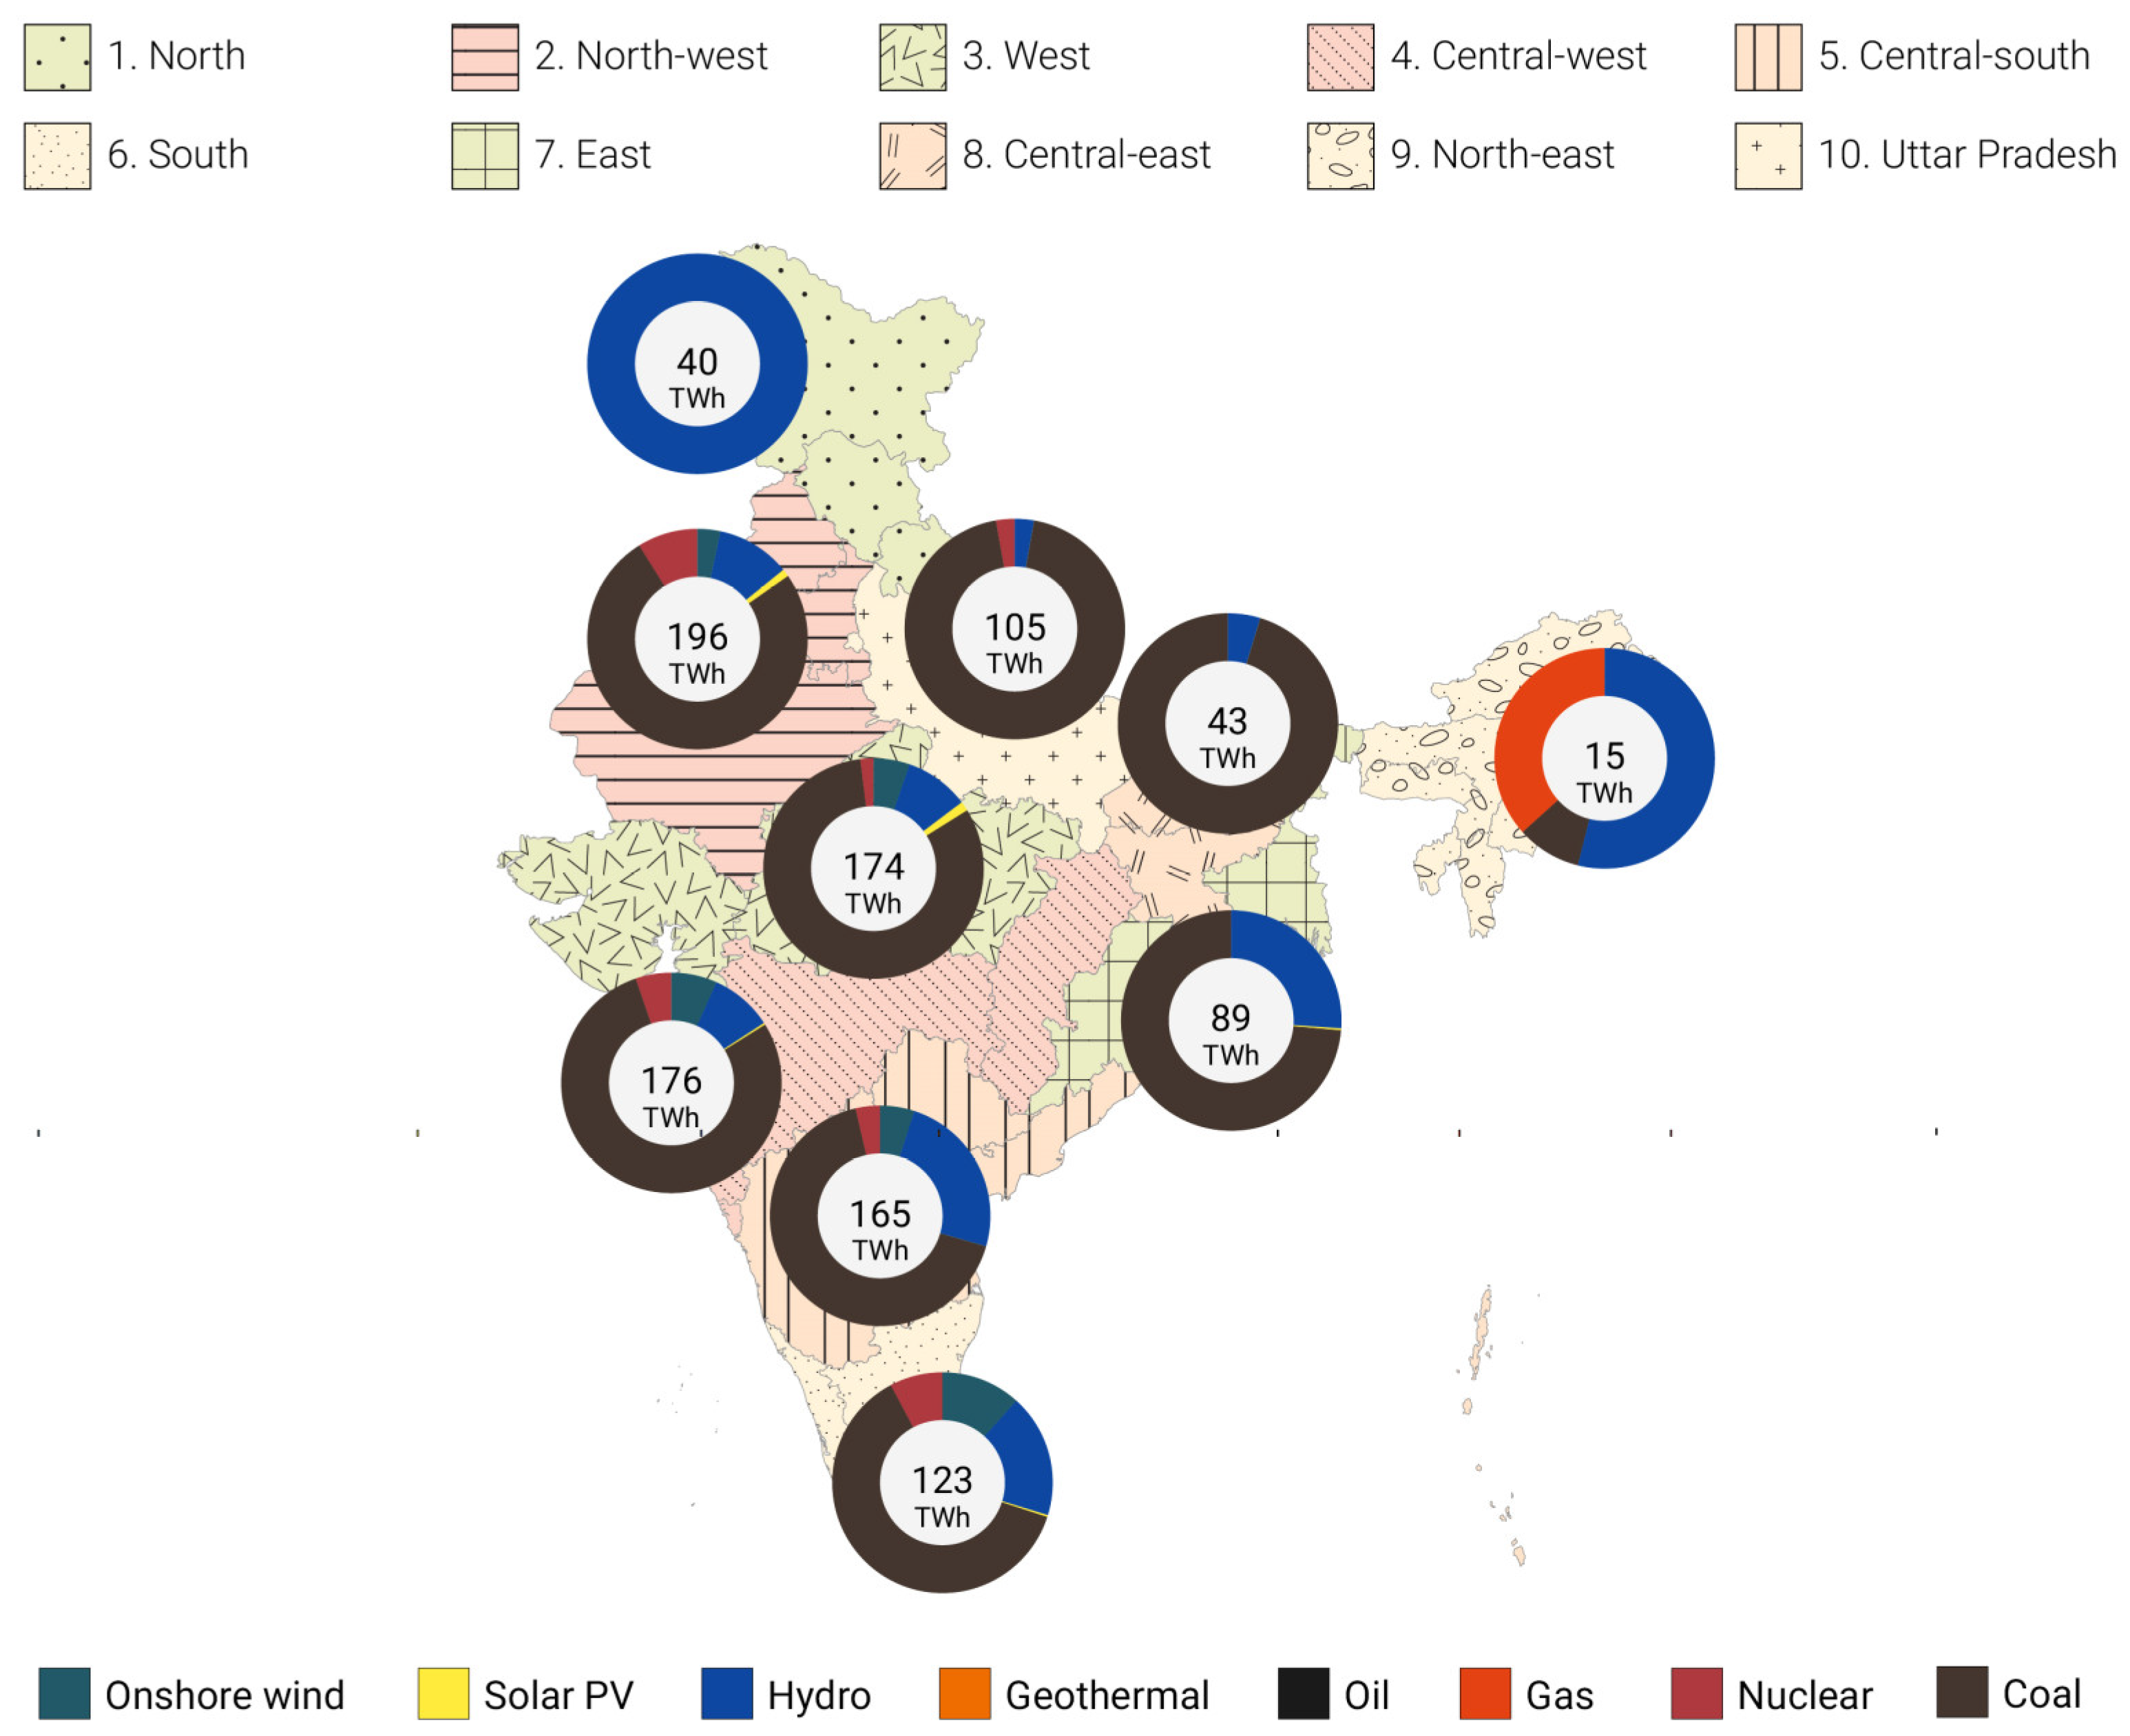
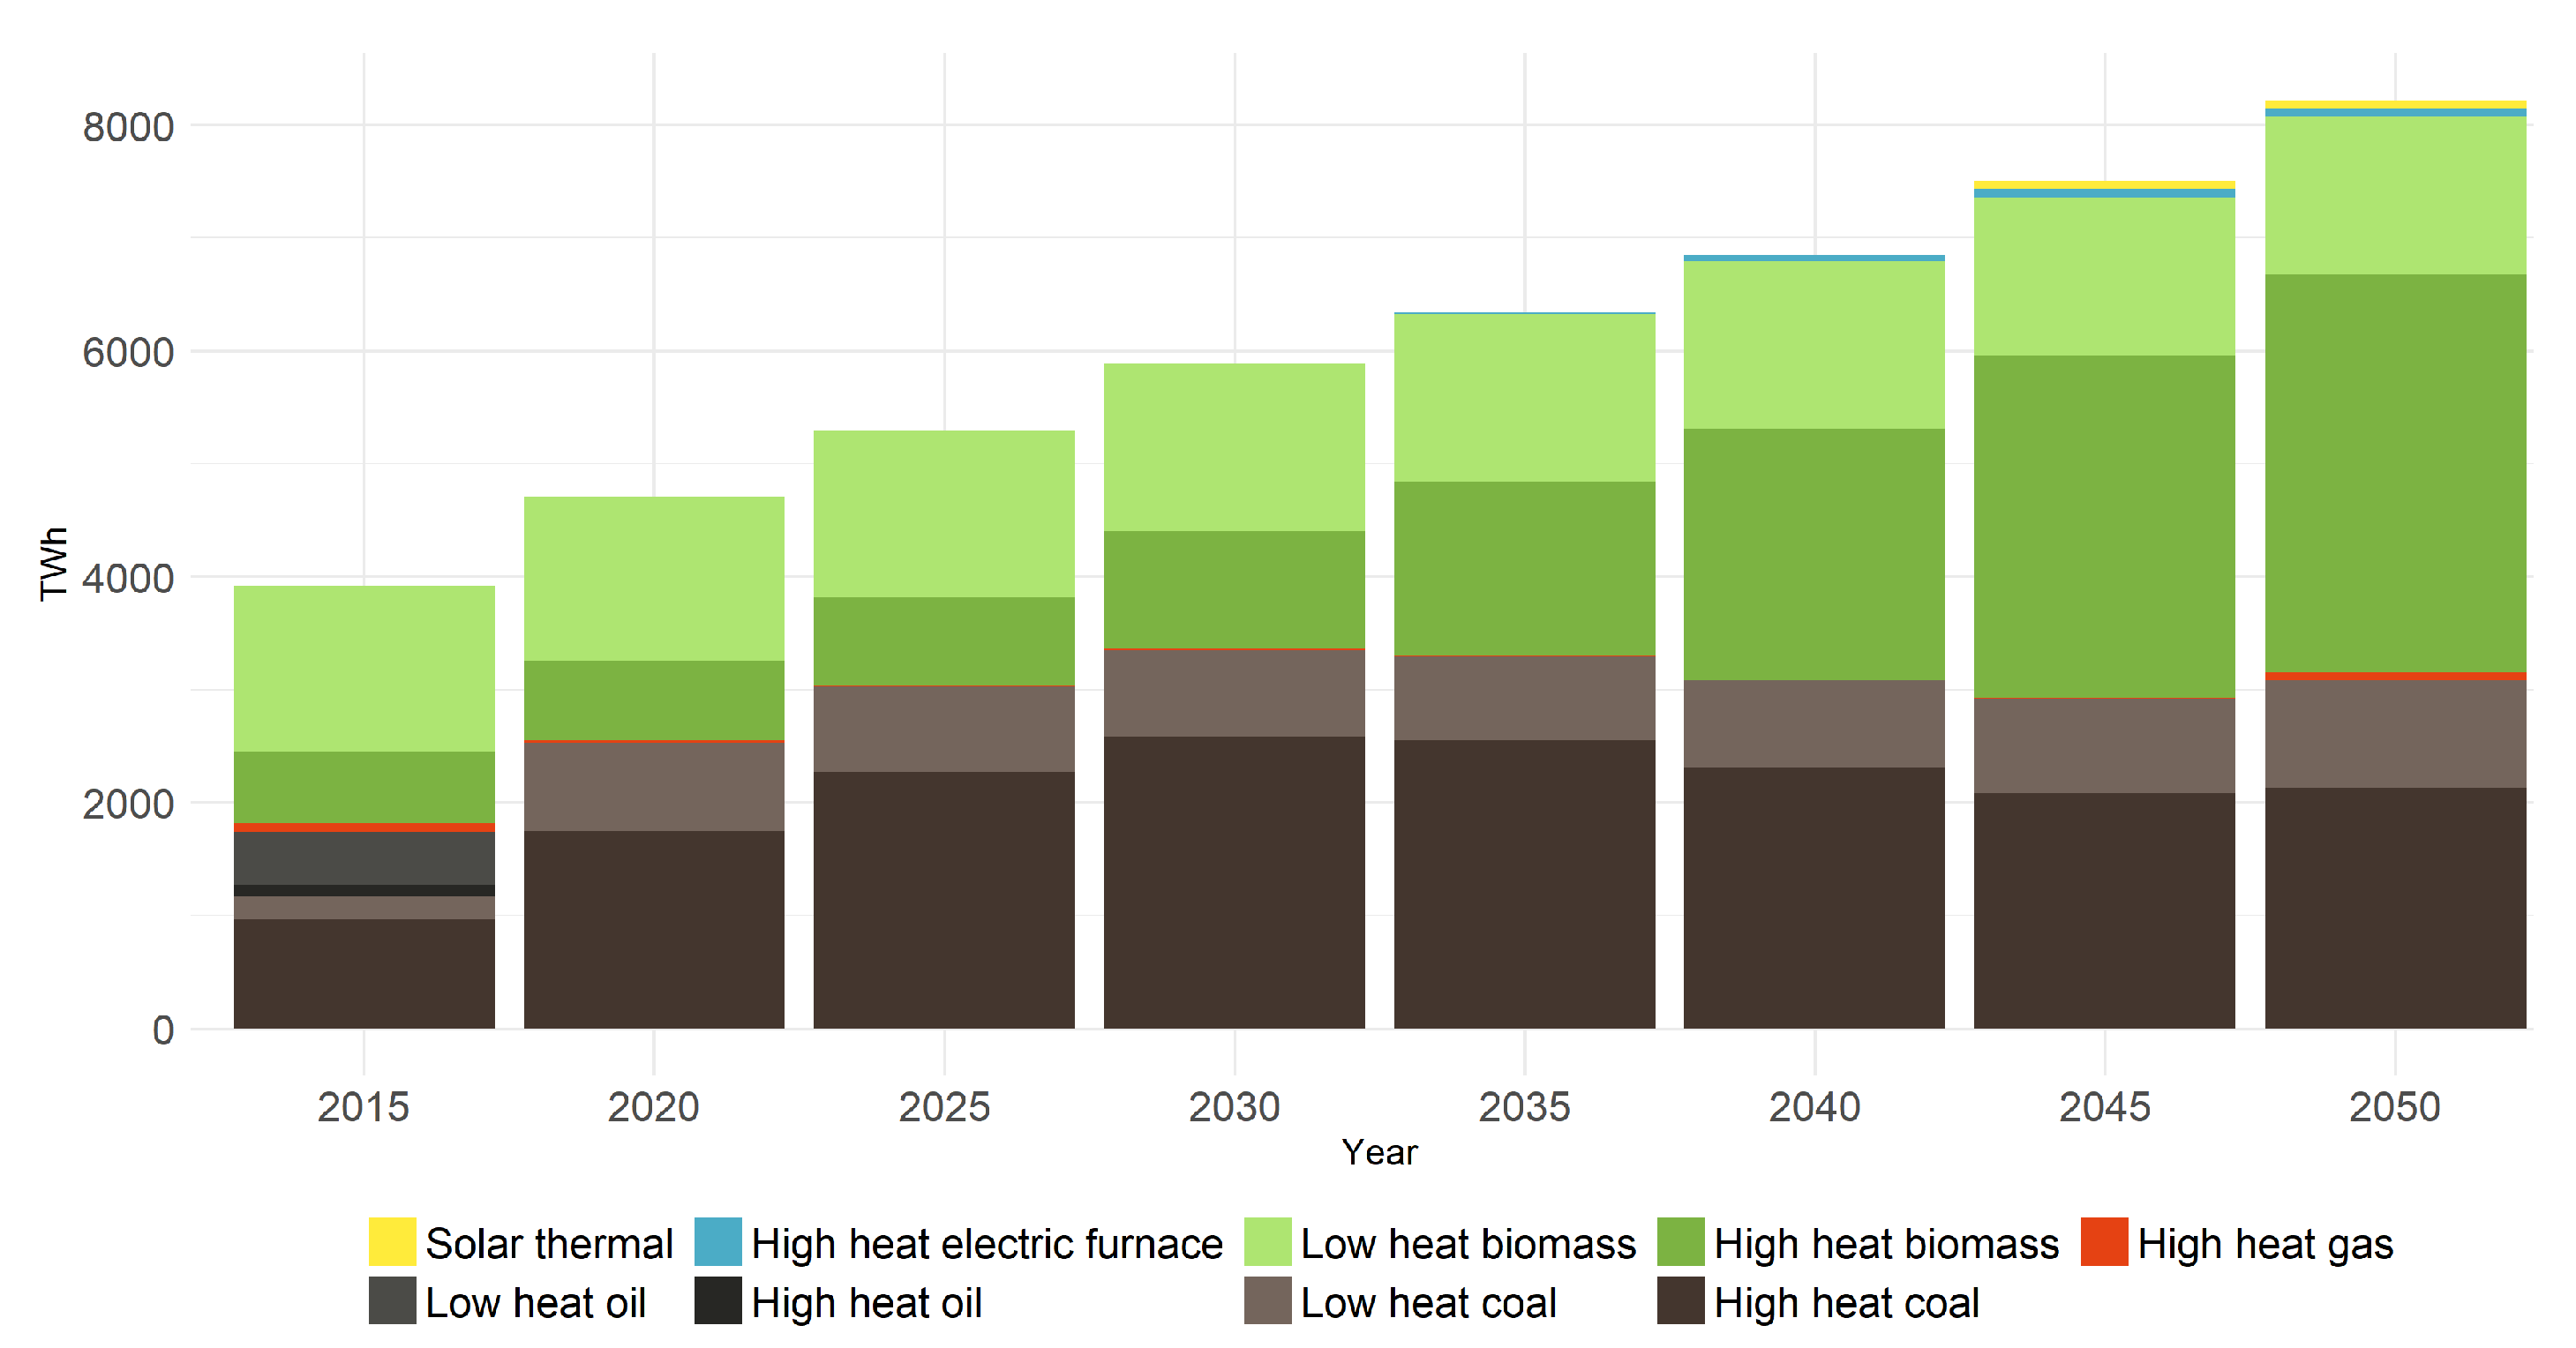
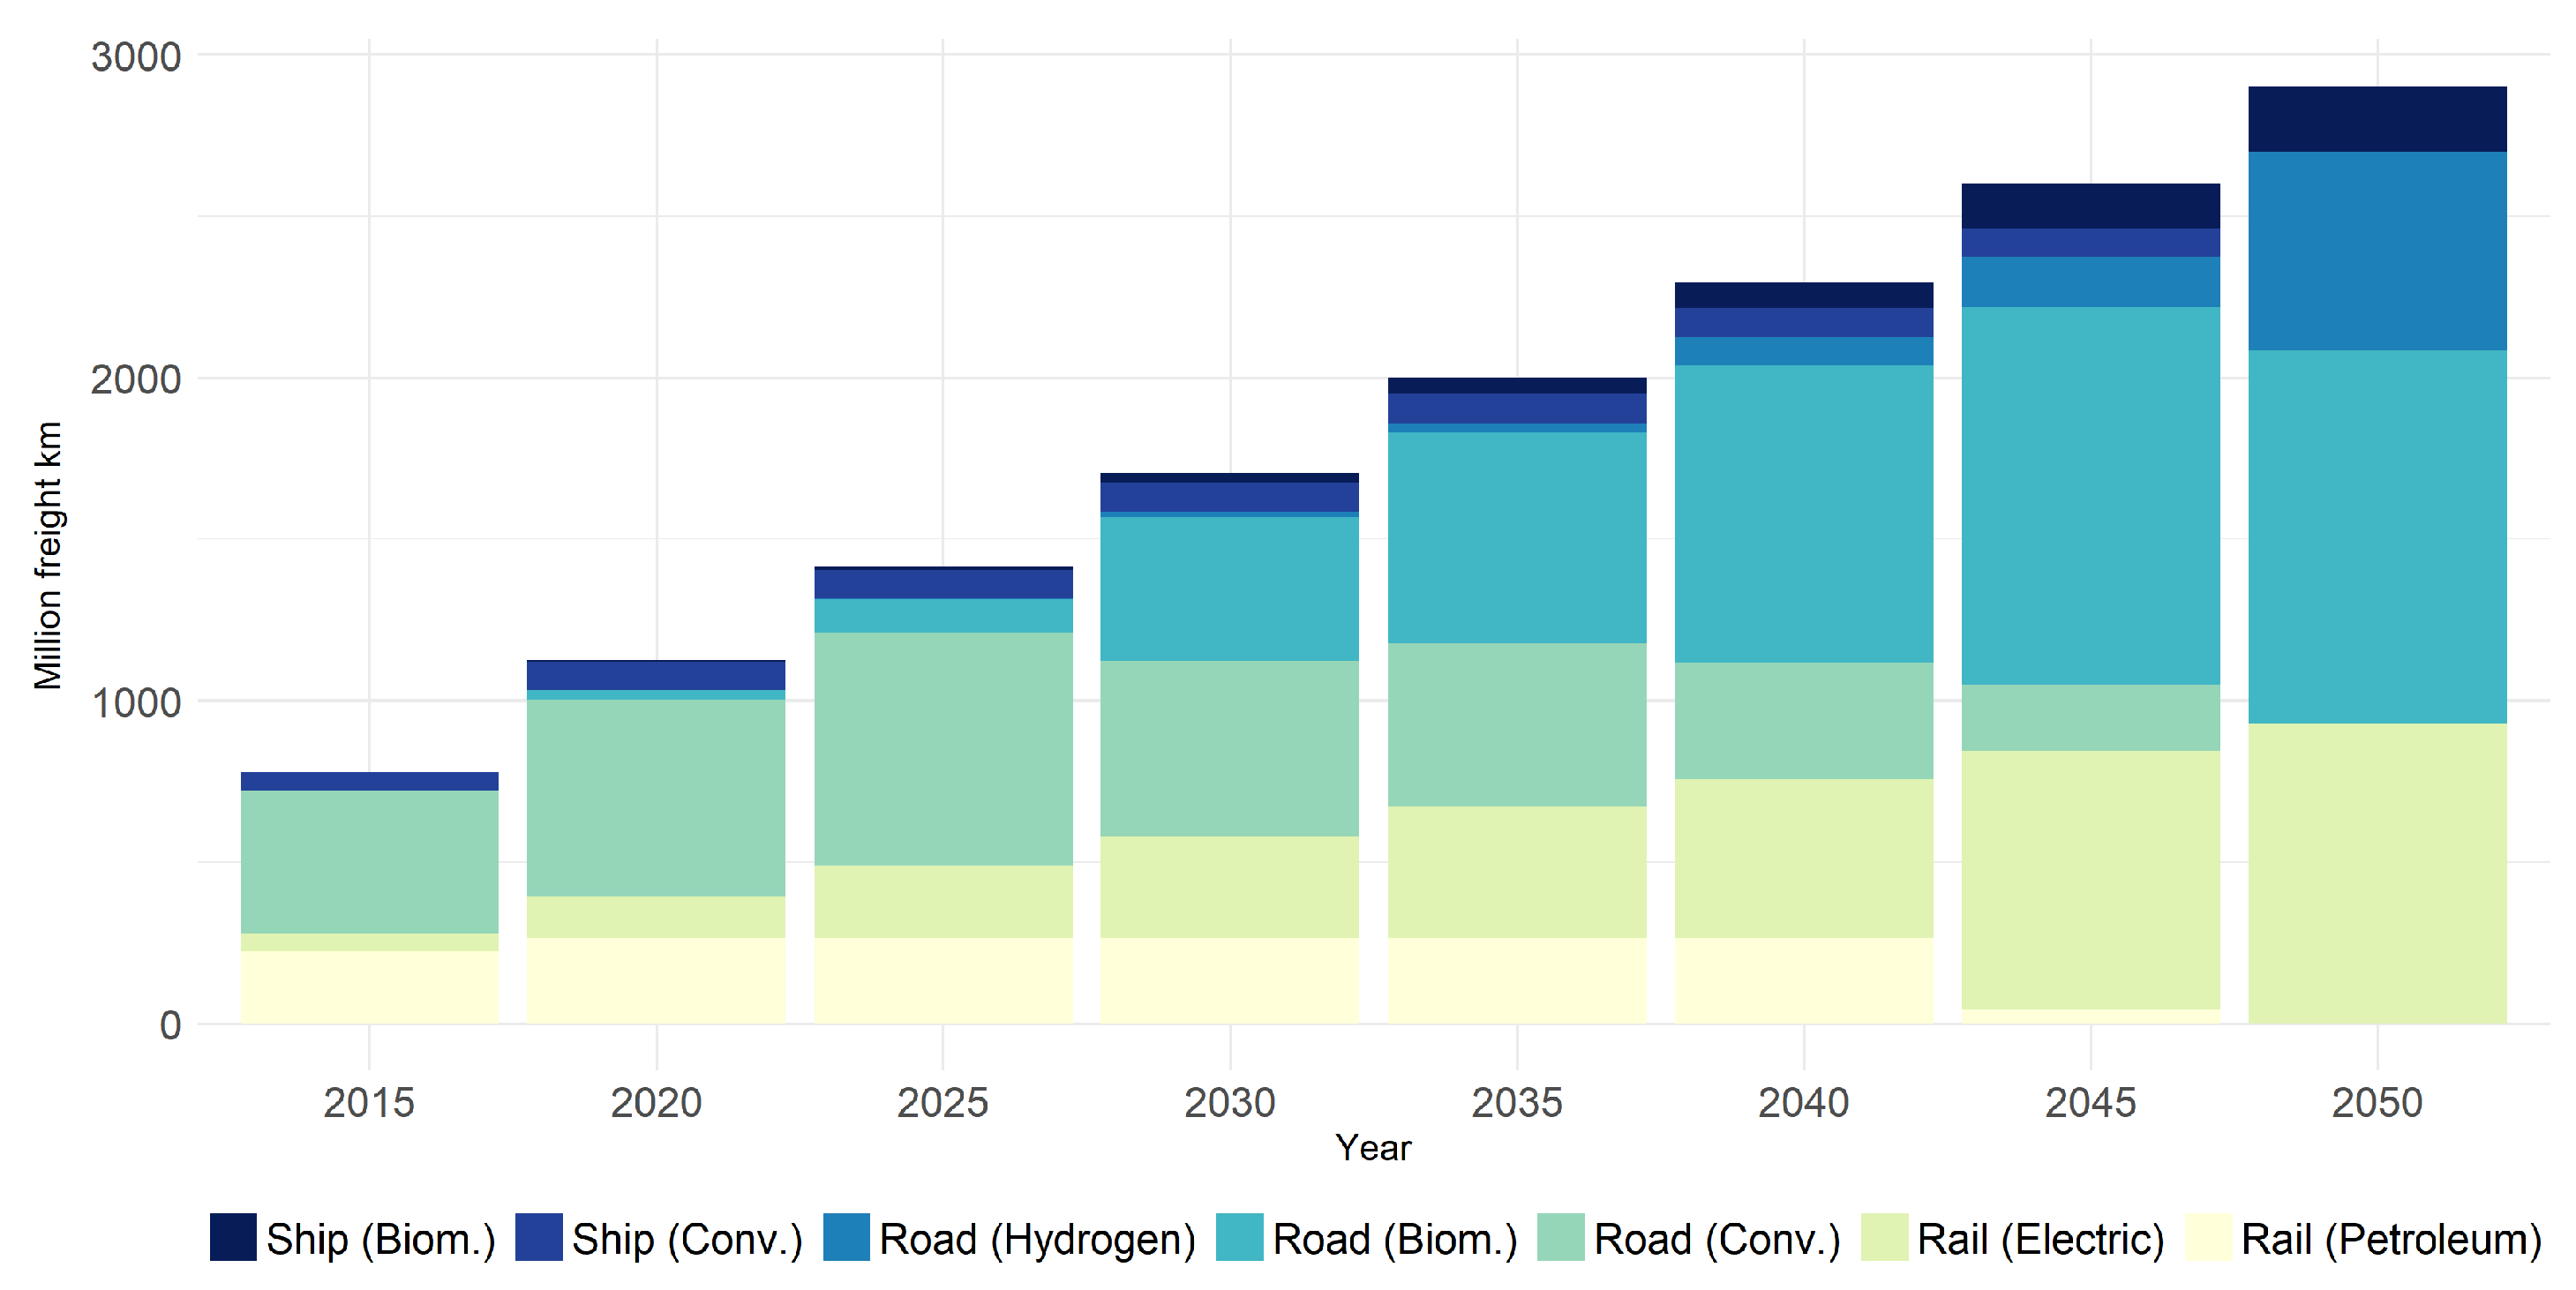
This paper adds to the existing literature by exploring alternative pathways to sustainable energy system development in India that respect both the specifics of the current energy system, but also stringent climate targets and global technological trends favoring non-fossil, low-cost solutions. We deploy an open-source linear cost-optimizing global energy system model (GENeSYS-MOD) to analyze different scenarios to meet increasing demand in India until 2050. A particular feature of the model is the regionalization of India into 10 regions. Thus, the model is able to illustrate regional idiosyncrasies, as well as potential imbalances, in the future energy system. The model not only focusses on the electricity sector, but also provides an in-depth analysis of the heat and transportation sectors. The implementation of different scenarios enables a qualitative comparison of the total cost for the specific optimized energy pathways until 2050. Thus, the results provide a comparability of the total cost of the different scenarios.
Projecting future energy scenarios for India also needs to account for other aspects besides the technical potential of renewables. An assessment of present literature and expert interviews is therefore used to set the modeled low-carbon energy transformation in context with the social, political and economic environment. The low-carbon transformation of the energy sector is not solely driven by climate consideration, but is inserted into a complex process of sustainable development that includes (amongst others) reducing health risk, affordable energy and a circular economy. In order to make an evaluation about whether the country is truly able to become mostly RES based in 2050, further implications on India’s energy transformation have to be considered. The main sources for the literature review regarding the contextualization of the model results were, in particular “The Political Economy of Clean Energy Transitions“ by Arent et al. [26], which is a distilled compendium of cross-cutting academic projects on clean energy transitions, “India’s low carbon transition” by Pandey [27], “India: Meeting Energy Needs for Development While Addressing Climate Change” by Joshi et al. [28], and “Coal Transition in India-Assessing India´s energy transition options” by Vishwanathan et al. [29].
After this introduction, Section 2 sketches out the status quo of the energy system in India with respect to existing technologies and recent trends on policies and technological developments. Section 3 provides a non-technical description of the model, and develops the three scenarios, the results of which are reported and discussed in Section 4. Section 5 identifies potential barriers to a low carbon transition and is followed by the concluding Section 6.

2. Status Quo of the Indian Energy Sector

2.1. Energy Mix

The current energy mix of India is dominated by coal, with a share of 58% of electricity generation in 2017, and 193 GW installed capacity. India is the third largest producer of coal and still holds the fifth biggest reserves [30]. Most of India’s coal resources can be found in the eastern regions of Jharkand, Chhattisgarh, and Odisha [31]; they are also the basis for the heavy industry, like steel and metallurgy, benefitting from close-by coking coal and convenient supply chains. The coal sector is currently one of the strongest lobbying groups in Indian energy politics. The public mining company Coal India Limited (CIL) alone employs over 310,000 people [32]. Power production relies mostly on coal and the biggest share of installed coal capacities has been added in the last 15 years [31]. Around 45% of all Indian thermal power plant capacities are coal based and younger than 10 years. This implies that the remaining power plants will potentially not be in line with medium and long-term climate targets.
Natural gas contributes about 7.2% to electric power generation [33]. A large share of the natural gas has to be imported and—given the relatively high cost—natural gas has not yet obtained a significant share of the electricity mix. Nuclear energy plays an important political role, in particular in regional and international conflicts (e.g., with Pakistan), but its contribution to electricity generation is small (2.7% of generation and capacity) [34].
Small-scale and large-scale hydropower have a share of 20% and 16% in installed capacity and electricity generation, respectively. There is a controversial discussion about the future development potential of hydropower, which has a high theoretical potential, but significant practical and political challenges to its realization [8].
Renewable energy in India has several applications, the most important being biomass fuels for cooking and heating. Non-commercial energies, mainly biofuels and waste, made up about 23.1% of India’s primary energy supply in 2015 [1]. With respect to electricity, the installation of grid-connected renewable generation capacities (excluding large-scale hydropower) is small, but rapidly rising at a rate of 20–25% annually over the last 15 years [7,8]. Wind energy dominates this trend, accounting for 32.8 GW of installed capacity, followed by solar photovoltaics (PV) (17.1 GW), and small hydropower (4.4 GW) as of January 2018 [35]. India’s renewable energy sector has already reached a size of economic relevance for the whole country. India has a total renewable capacity share, including large hydro power, of around 32% of its installed capacity as of January 2018 [36]. In 2016, it directly and indirectly employed around 385,000 people (large hydropower plants add additional 200,000 jobs) in the renewable energy sector [37]. From April 2014 to December 2016, the equity flow into India from foreign investors surpassed US$ 2 billion [38], which was established under the Paris Agreement and is to be fully implemented in the next couple of years. As these types of investments will continue to grow [39], specific plans for an expansion of investments into renewables in developing countries have been designed. India’s Prime Minister Modi, along with former French President Hollande, initialized the International Solar Alliance to mobilize US$ 1 trillion of investment worldwide into solar energy programs [40]. In addition to fiscal incentives such as accelerated depreciation, India’s government has also eased the path for renewable projects [38]. Some examples are the setup of big solar parks with over 500 MW over the coming years, and mandatory ratios for rooftop solar to involve cities in renewable investments.
Just like coal, the installed capacities for renewables vary significantly between different states and regions [26]. The western regions have invested much more into renewables compared to the rest of the country. These states are almost all governed by the Bharatiya Janata Party (BJP), the national ruling party. Furthermore, these states are also the ones with very little coal and steel industry.

2.2. Government Plans

2.2.1. Official Plans by the Indian Government

The CEA government regularly establishes longer-term development plans, the most recent one ranging from 2017 to 2022 [2]. This plan includes a capacity increase of about 50 GW of coal-based power projects currently under way, as well as an increase in RES share (Table 1). However, the plan also states that no additional coal power plants are required after 2022. The CEA also predicts additions of 4.3 GW of natural gas, and 2.8 GW of nuclear power until 2022.
Simultaneously, the CEA has set ambitious plans to expand renewable capacities by 2022 (Table 2). Thereby, the summarized total capacity addition until 2022 is targeted at 137.8 GW [2]. Consequently, the expected share of “non-fossil” based installed capacity, which is defined as nuclear power, hydropower, and RES by the CEA, is likely to increase to 46.8% by the year 2022 and will further increase up to 56.5% by the year 2027. Total renewable energy generation of about 20.3% will contribute to the total energy generation requirement in 2022 [2].

3. Model and Scenarios

3.1. Global Energy System Model: A Linear Energy System Model

This paper uses a modified version of the GENeSYS-MOD, an open source tool for the linear optimization of energy systems. It is based on the open-source energy modeling system (OSeMOSYS) by Howells et al. [41] and minimizes a cost function to find the lowest discounted cost solution for an energy system to meet a given energy demand. It also allows for temporal and regional disaggregation and is thereby able to model pathways of development of diverse energy systems. In particular, our implementation is based on the version of GENeSYS-MOD by Löffler et al. [15], whereby calculations were done using their general algebraic modeling system (GAMS) code adaption based on the initial OSeMOSYS GAMS translation by Noble [42]. GENeSYS-MOD is a powerful tool to help to identify the lowest-cost solutions and pathways for the energy transformation necessary to keep global warming below 2 °C.
One of the strengths of GENeSYS-MOD is its adaptable and flexible structure. As shown in Figure 1, it is organized into multiple blocks. The basic OSeMOSYS implementation contains seven blocks, including the objective function, costs, storage, capacity adequacy, energy balance, constraints, and emissions. GENeSYS-MOD includes three additional blocks renewable target, trade, and transportation, as well as a reworked implementation of the storage block. All these blocks serve different functionalities within the energy system model, as all costs, energy production, consumption values, and constraints, such as on investments or capacity additions, need to be accounted for. The block capacity adequacy ensures that necessary capacities are met at all times, while the energy balance levels energy use and production, taking into account efficiencies of technologies. A more detailed discussion of the blocks composing the model can be found in Löffler et al. [15] and Howells et al. [41]. This research paper includes an endogenous transmission network upgrade as part of the trade block, which allows the model to extend existing transmission capacities, focusing on the trade of electricity. For this extent, capacities of grid infrastructure, as well as capacity expansion costs based on line length, have been added to the model equations.
The original, global model application was adjusted for the analysis of India’s energy system on a detailed level. Amongst other things, we have introduced a constraint on renewable capacity extensions (50% on previous figure every five years), which reflects institutional and political constraints of expanding renewables. Also, grid connections between the ten regions can now be calculated endogenously, improving the interpretation of the spatial aspects of energy system development.

3.2. Data and Limits of Our Model

Our model requires strong assumptions for input; hence, reliable data on, i.e., demand or RES potentials is essential (see Appendix A for key representative data). The power, heat (Table A1), and transport (Table A2) demand in our model is significantly determined by projected population growth and to a smaller extent due to a rise in urbanization [43]. Due to the integrated modeling approach for the entire modeling period from 2015 until 2050, only a limited number of time slices per year can be included (six time slices, including three distinct seasons, winter, summer and intermediate (autumn, spring), each consisting of day and night to model seasonal fluctuations, respectively, see Table A3). Furthermore, cost developments of implemented technologies are given exogenously.
The results allow for a both qualitative and quantitative assessment for: (1) whether India can achieve an energy system consisting of 100% RES; (2) where the current trend is going; and (3) where we see further steps are necessary.

3.3. Regional Disaggregation of the Indian Energy System

India has an enormous potential for renewable energies. Due to geographical circumstances, regional disparities in potentials for renewable energy technologies occur and are considered within the model according to Table 3. In total, India has a total solar power potential of 11,195 GW as of 2015 [44]. Estimates of India’s wind power potential vary greatly, depending on assumptions on efficiency, hub heights, turbine-size and land-use considerations. The model is based on data which is retrieved from a report of India’s wind power potential by Hosain et al. [34]. The total onshore wind power potential for India is estimated to range between 2733 GW and 6439 GW. The highest potentials are observed in the western and southern regions, where most of the installed onshore wind capacities already exist. Data regarding India’s offshore wind energy potentials are retrieved from Löffler et al. [15] and are proportionally assigned to the coastal regions (see Section 3.1) according to the coastal kilometers of the relevant regions.
Hydro energy can be divided into large and small hydropower. In India, large hydropower is defined to have a capacity of more than 25 MW, whereas small hydropower has a capacity of less than 25 MW [45]. According to this definition, the country has a total installed capacity of more than 35 GW in large and small hydropower cumulated in 2015 [46]. These capacities are mostly located in the northern regions, as well as in the central–south areas. India has a potential of more than 151 GW of large hydropower, especially in the northern region, due to the Himalaya Mountains and other important river systems such as the Indus. The north, north-west (NW), and north-east (NE) account for more than 75% of the total large hydropower potential in India. In addition, small hydropower has a potential of 19.7 GW.
In order to represent its geographical, industrial, and political diversity, India is split into different zones. We follow the approach by Gulagi et al. [47] and split India into ten zones, along respective federal state borders (Figure 2). Thus, the following regions are obtained:
  • the north (N) consists of Jammu and Kashmir, Himachal Pradesh, and Uttarakhand, and Is characterized by a decent potential of solar power and very large hydropower potential (51 GW);
  • the NW consists of Punjab and Rajasthan, quite rural regions with a significant potential of solar power;
  • Gujarat and Madhya Pradesh form the west (W) region, with a broad portfolio of renewables potential (solar, onshore and offshore wind);
  • central-west (CW) is comprised of Maharashtra, Goa, and Chhattisgarh, likewise large solar and wind resources, but, particular in Chhattisgarh, a higher level of heavy industrialization and coal;
  • India’s central-south (CS) is comprised of Karnataka and Andhra Pradesh, with the highest onshore wind potential of the country (955 GW);
  • the south (S) comprises Tamil Nadu and Kerala, also featuring solar and wind potential, but very little fossil fuels (except for the liquefied natural gas (LNG) import terminal in Chennai);
  • the east (E), consisting mainly of Orissa and West Bengal, appended by Sikkim, has quite heavy industrial roots, and is continuously struggling for electricity supply;
  • somewhat similar, the central-east (CE), consisting of Bihar and Jharkhand, has high energy demand, but also a significant potential, in particular of solar energy (1000 GW);
  • the NE consists of the somewhat isolated states of Assam Arumachal Pradesh, Nagaland, Manipur, Mizoram, Tripura, and Meghalaya, with some solar and significant potential hydro resources (59 GW);
  • Uttar Pradesh (UP), bordering the national capital territory of Delhi, is one of the largest and most heavily industrialized states, with a particular dynamic energy demand.

3.4. Scenarios

Current discussions about the future energy direction of the Indian energy sector are quite diverse, varying between the continuations of the traditional coal-based pattern, to the possibility of a 100% supply by renewable energies. In order to cover some of this research gap, while still respecting India’s INDC targets, we have developed three distinct scenarios.

3.4.1. Limited Emissions Only Scenario

The limited emissions only (LEO) scenario describes a development where the goal of limiting global warming to 2 °C is respected, and the globally available CO2 budget is distributed according to current population size. Generally, this corresponds to the 450 ppm scenario of the IEA [48] (now renamed “Sustainable Development Scenario”). The derived emission budget for India is about 118 gigatons from 2015 until 2050 in order to meet the 2 °C target. This budget would be considerably lower if the distribution was based on other characteristics, e.g., GDP or current emissions. The LEO scenario informs decision makers about the potential cost for the Indian economy, especially compared to the rather deviant scenarios and the respective role of fossil fuels and renewables therein.

3.4.2. Business as Usual Scenario

In the business as usual (BAU) scenario, the Indian government (and all other governments) stick to given commitments and signed treaties, but nothing more. In international terms, this corresponds to the new policy scenario (NPS) of the IEA. The BAU scenario uses the projected capacities for renewable energy capacities until 2040 of the new policies scenario by the IEA [31]. These projected capacities are included as upper limits and thus restrict the construction of renewable generation capacities in the model. No specific emission limits for CO2 or other GHGs are included. The goal of the BAU scenario is to compare the resulting CO2 emissions with the other two scenarios, where the national CO2 emissions are fixed by using a national budget. Moreover, the point of interest lies on the pathways after 2040, when the usage of renewable energies is not limited by the projected IEA capacities anymore.

3.4.3. 100% Renewable Energy Sources Scenario

The Indian government has regularly updated its commitment towards using more RES in the future. In contrast to the LEO scenario, the aim of the 100% RES scenario therefore examines if it would be possible to fulfill the total energy demand with 100% renewable energy in 2050. Therefore, the model is restricted such that no non-renewable energies, including nuclear energy, can be used by 2050. The included CO2 budget of 60 gigatons corresponds with the goal to restrict the amount of global warming to only 1.5 °C.

3.4.4. Further Assumptions

We adopt the assumptions on energy and electricity demand taken from the IEA 2017 World Energy Outlook. A sensitivity analysis is added for all scenarios that reduces demand growth by 50%. This accounts for the uncertainty on increasing energy efficiency, new demand patterns, and a slower adaptation of very energy- and electricity-intensive demand behavior. The assumptions on the cost of conventional and renewable energies (Table 4) are based on a variety of sources. [49,50,51].

4. Results and Interpretation

4.1. Scenario Results and Comparisons

Model results suggest that in all three scenarios, the total energy demand can be met, and that a major change in the fuel mix, away from fossil (mainly coal-based production), to renewables is likely to occur. This change is not only imposed by environmental constraints, but also pushed by the increasing competitiveness of renewables, mainly solar energy.

4.1.1. Limited Emissions Only Scenario Results

In the LEO scenario, the share of fossil fuels is gradually reduced over time, though some fossil capacities are still available in 2050. In the electricity sector, upon which we focus on in this paper, solar takes over a leading role in power generation, resulting in an accumulated share of 69% for all regions in 2050 (Figure 3). Apart from solar, wind and hydropower are the main sources for power generation in 2050 with 17% and 9%, respectively. While wind power is continuously increasing in its capacity after the year 2035, hydropower stays almost constant over all periods. While coal is the main component in the power generation energy mix in 2015 with a share of 82%, it continuously reduced until 2050. A slight increase in coal usage can be observed in 2050. This is due to the huge increase in power generation (induced by sector-coupling effects in the other sectors) between 2045 and 2050, which is compensated for by the already installed coal capacity. Despite the growing energy demand, the power generated by coal is reduced by more than half by the year 2025. In 2050, coal still has a share of about 5% in power generation. Nuclear power is hardly used during the entire period, nor does natural gas play any significant role. Figure 3 illustrates the pathway within the LEO scenario.
In the rest of the energy system, heat generation is dominated by biomass (60%) and coal-based heating (38%) in 2050. Natural gas, electric heating, and solar heating play only a minor role (Figure 4). The transportation sector has the chance to become emission free by 2050 as well.
Demands for passenger transportation will be fully supplied by electric fueled rail services and battery electric vehicles (BEV) in 2050 (Figure 5). As demand is assumed to increase by up to 3000 million freight km per year in 2050 (+273% compared to 2015), an increase in H2 powered road trucks and electrical rail traffic can be observed from 2025 on. In addition, the shipping sector will completely become independent of conventional sources (conv.) by using biomass-powered means by 2050. Air traffic is assumed to convert from conventional fuels to hydrogen-based technologies (predicted breakthrough between 2030 and 2035).
In the freight sector, conventional ships in 2015 will shift towards biomass (biom.) powered means. On the road, internal combustion engines will be replaced by hydrogen and biomass run vehicles. For freight transportation by rail, petroleum powered trains will fade out in favor of electric trains by 2050 (Figure 6).
The total emissions within the model amount to 96 gigatons of CO2 from 2015 until 2050.

4.1.2. Comparison with Other Scenarios

A comparison between the LEO scenario and the BAU scenario confirms that with less stringent climate targets, more fossil energy (mainly coal) is used for electrification. Figure 7 shows the difference between the generation mixes of the LEO scenario, compared with the BAU scenario. In both scenarios, complete decarbonization of the Indian energy system is not accomplished. Differences mainly occur in the more dominant usage of natural gas and coal-based energy throughout the years. Overall, coal as an energy carrier is still declining in the years leading to 2050, having its peak in 2040. Coal still has a share of about 7.4%, whilst natural gas accounts for nearly 1% of the energy production in 2050. Compared to the LEO scenario, solar power (66%) develops on a smaller basis. Wind (17%) and hydro power (9%) remain rather constant over the years. The total emissions are about 9% higher compared to the LEO scenario, but still achieving the 2 °C goal.
Figure 8 shows a similar comparison between the LEO scenario and the 100% RES scenario. The small share of coal (and the marginal share of natural gas) disappears by 2050, and more solar and onshore wind are generated. The contribution of offshore wind is marginal, and hydroelectricity observes a smaller share in the 100% scenario.
As stated in the scenario description, the model is forced to only use renewable energies in 2050 in the 100% RES scenario. This leads to a much higher power demand over the years, which is due to the increased usage of power-to-x technologies in the heat and transportation sector. Compared to the other scenarios, power trading between the nodes is even more relevant because of the regional differences in the potentials for renewable energy generation. Natural gas does not play a role in the energy mix within this scenario. Solar and wind power replace the then phased-out coal-based energy, leading to a 15% decrease in CO2 emissions until 2050. The research shows that with the given potentials, a 100% renewable energy system, meeting the 1.5 °C climate target, would be feasible in the year 2050. Regarding heat and mobility, no significant differences were found.
Similar results and transformation pathways were found by Gulagi et al. [21,47]. Comparing the country-wide scenario by Gulagi et al. [47] to our 100% RES scenario, a moderate phase out of coal and fast expansion of solar PV and onshore wind can be observed. While India’s power generation is dominated by coal in 2015, solar PV establishes itself as the key technology by 2050, followed by onshore wind and biomass [47]. Differences in absolute values can be traced back to the ability of GENeSYS-MOD to also include the heat and transport sector.

4.2. Regionalization of Scenario Results

The analysis of the regional supply mixes reveals significant differences (see Appendix B). In the LEO scenario in 2050, solar is the dominant source of supply in all regions, except for two: the north and the NE, both mountainous regions with a lot of hydropower. Onshore wind is most prominent in the west and the south, whereas offshore wind occurs hardly anywhere.
Starting from 2020, solar capacities heavily increase in all regions, whereby CE and UP are relying nearly solely on solar power in the final year. The north and NE regions exhibit the highest hydro potentials and account for about 64% of India’s total hydropower generation.
In the LEO scenario, coal electrification is mainly concentrated in UP in 2050 (26%). The nodes CW (2%), NW (5%), south (3%), and west (6%) play a minor role. With relatively modest wind resources, UP is the only state that uses natural gas electrification.
All scenarios have a similar regionalization of energy sources. However, more conventional fuels are used in the BAU scenario, especially in the NW region (21%). In the 100% RES scenario, all regions are relying on RES with a similar distribution as the LEO scenario, substituting the conventional energy sources in the south-west, south-east, and UP with RES and electricity imports.

4.3. Energy System Cost and Long-Term Electricity Prices

Given that the energy mix between the three scenarios is not very different, it is not surprising that the energy system costs are quite similar as well. With the BAU scenario having the lowest discounted costs over the whole model period, it shows that feeding demand in the high-temperature heat and freight transportation sectors based on power-based technologies is more cost-intensive than using fossil fuels, especially in the case of high shares of RES. Although it might be the cheapest, external cost and effects on the environment that are difficult to be quantified need to be kept in mind. In comparison, the LEO scenario comes to a result with slightly higher costs (about 2%), while the 100% RES scenario results in 9% higher total discounted costs than the BAU scenario.
The average costs of electricity generation within the model will decline from 7.5 €cents/kWh in 2015 to less than 3 €cents/kWh in 2050 in the LEO scenario. However, infrastructure and transportation costs are not included. Nevertheless, variations in the power generating costs between the technologies can be observed and depend on the different operational lifetimes, operational and maintenance costs, as well as capital and fuel costs. Within the model, coal-based electricity ranges from 3.3 to 3.7 €cents/kWh. These costs are currently lower than the daily updated data of the Ministry of Power [52], as they do not include the costs for infrastructure. Apart from that, renewable technologies will become increasingly competitive, with solar and wind power observing the biggest reduction of power generating costs over time, which drive coal-based generation out of the market. Utility-scale solar power lies in the range of 1.3–2.8 €cents/kWh for power generation, with wind power ranging from 3 to 5 €cents/kWh. At the same time, hydro power shows up with 2–3 €cents/kWh for electricity generation within the model. Regarding the projections of Bloomberg New Energy Finance [53], similarities can be observed as there will be a tipping point where coal will be replaced by cheap renewable options. In between the regions of India, prices can vary up to 50%, which can be traced back to different capacity factors and full load hours of generation facilities. While different climate targets do play a role in the energy mix, their overall economic effects seem to be modest.

5. Barriers to the Low-Carbon Energy Transformation in India

As seen in the previous sections, renewable energy technologies have an enormous potential in India and a 100% RES based energy system in 2050 can be achieved. However, experience shows that economic theory and reality do not always match. An assessment of present literature and expert interviews aims to contextualize the low-carbon energy transformation and the model results within the social, political and economic contexts. The low-carbon transformation of the energy sector is not solely driven by climate consideration, but is inserted into a complex process of sustainable development that includes (amongst others) reducing health risk, affordable energy and a circular economy. In order to make an evaluation about whether the country is truly able to become 100% RES-based in 2050, further implications on India’s energy transformation have to be considered. Based on this literature review, those factors can be divided into social, political, and economic barriers.

5.1. Social Barriers

In acknowledgement of the complexities associated with the low-carbon transformation in India, it is important to contextualize the transition against the overall economic situation of the broader population. India, having a GDP per capita of 1974.76 USD [54], a high share of its population living in extreme poverty, and a rapid urbanization, economic growth is often perceived as more pressuring than investment into green development projects [27].
Currently, there are still more than 300 million people with no access to electricity [8]. Consequently, environmental standards for power plants are perceived as barriers to economic growth. A prime example for this is the protest against higher environmental standards in 2014 by the population of Vapi, one of the most polluted cities in India [55]. This can mainly be explained by the cities’ dependence on its large and highly-polluting pharmaceutical and chemical industries and the public fear of losing much-needed jobs and capital [26].
A low-carbon transition as planned by governmental motivations, however, holds various opportunities for further economic growth in green industries—despite the rate of employment in the coal industry decreasing constantly since 2002 [37]. Especially in regard to the enormous solar potential and the ambitions to extend the national capacities in wind and solar (see Section 2.2.1), it could generate up to 330,000 jobs over the next five years, i.e., in manufacturing, project design, construction, business development, and operations and maintenance [56]. Changing the perception of the low-carbon transition as a barrier for economic growth by educational work and improving social circumstances is thus crucial for a successful energy transformation.

5.2. Political Barriers

A significant barrier to the increase in RES are lobbies of the conventional energy sector. The coal industry still meets most of India’s energy demand and employs over 400,000 people. Their businesses include rail, port, and road transport, loading and unloading, as well as the power plants (see Section 2.1). In addition, a substantial portion of the coal-mining sector is dominated by the state-owned company CIL. A possible depletion of coal mining would therefore have a negative influence on the government’s budget. Consequently, past and current Indian governments have been pushing the expansion of the coal mining sector and plan to increase the annual production from a current level of 600 million tons to 1.5 billion tons in 2020 [26].
Not only external factors are of importance for the implementation of policies in a country. Internal factors, such as the lack of coordination and cooperation within and between various Indian institutions and other stakeholders, slow down and restrict the transformation to RES. Currently, multiple agencies (i.e., the Federal Ministry for New and Renewable Energy, Ministry of Power, Department of Environment and Forests, Department of Rural Development, as well as corresponding agencies in each state) have overlapping areas of responsibilities regarding renewable energy. A good example of this lack of coordination is the implementation of the generation based incentive (GBI) for solar power, a scheme provided to, among other things, “support small grid solar power projects connected to the distribution grid (below 33 KV) to the state utilities” [57]. Soon after its announcement by the Ministry of New and Renewable Energy (MNRE), the Indian Renewable Energy Development Agency (IREDA) started accepting applications for solar projects under the GBI scheme. Later, however, the Indian government rejected all applications that were made before the official announcement of the scheme through the federal gazette [58]. While this reaction is justified and the IREDA should not have accepted applications in advance, it is this lack of coordination between institutions that complicates the implementation of policies and discourages investors.
Furthermore, there are currently two policy narratives for the development of the Indian energy system: the centralized approach, in which the Indian government mainly pushes for the integration of renewables through a unified power grid, and the former being decentralized, providing basic energy access using off-grid solutions [59].

5.3. Economic Barriers

The fact that India’s energy demand is predicted to increase heavily until 2050 forms one of the biggest challenges in its low-carbon transformation. The growth can be traced back to the increasing electricity access, especially in rural areas, and to urbanization. Lifestyle and dietary changes, i.e., increasing demand for meat, dairy products, and luxury goods are all factors which contribute to India’s growing energy consumption [60]. Growing electrification in the agricultural sector, and more reliable energy supply for industry and highly populated areas, are coupled with India’s economic growth. Merging those interactions represents a challenge for the energy system. Within the model results, India’s electricity generation is estimated to increase by a factor of ten from 2015 to 2050, whereby the analysis shows that renewable energy potentials are sufficient. Correspondingly, Bhushan [8] points out that the organization of the distribution systems needs to be tackled. Thus, an ambitious increase in power-generating capacity and change towards renewable technologies on a large scale is necessary to ensure a sustainable power supply.
In general, renewable energy projects tend to have little or no fuel, operating, or maintenance cost, but their relative initial investment costs tend to be much higher than for those of conventional energy systems [58]. Renewables in India are often around 24–32% more expensive compared to similar projects financed in the US or Europe. Indian financial market conditions are the main cause of high interest rates for renewable energy. Growth, high inflation, and country risks all contribute [61]. Therefore, by requiring these large-scale upfront investments, renewable energy projects are reliant on long-term investors [27].
It has been difficult, however, to attract those long-term investors for a multitude of reasons. First and foremost, India’s legal and regulatory system is often viewed as uncertain and risky, as manifested in various forms like changes in tax codes, a lack of protection for policy changes and enforcement of contracts [27]. Furthermore, there is a deficiency in information about renewable energy projects, as well as the value of different companies. That information, however, is crucial for the analysis and decision-making of investors.
India’s losses in the transmission and distribution (T&D) power grid are one of the highest worldwide, with a total share of 19.4% [62]. Those high T&D losses are an additional consequence of the widespread power theft, illegal hook-ups, and a low payment morale [63]. Agriculture users in particular pay for less energy than they consume [63]. Regarding the model results, a 100% RES-based power supply is only feasible if regions can compensate imbalances in RES potentials through an efficient power exchange. A sensitivity analysis showed that a decrease down to 5% of losses ensures a feasible power supply for all regions in the 100% RES scenario. Overcoming this technical challenge through promoting investments forms one of the biggest hurdles in the low-carbon transformation for India.
To finance large-scale investments, private investors could impact the velocity of the transformation within the energy system. Considering the current share of 6.7% private players in the transmission network, it stands out that the regulatory framework is still not exhausting the full financing potential through private contributions. The “Doing Business” ranking by The World Bank underlines those circumstances, whereas India is on rank 185 in “Dealing with Construction Permits” and on rank 172 in ‘Enforcing Contracts’ out of 190 economies by comparison [64]. For that reason, the government is encouraging private investments. Financial mechanisms and policy frameworks for a faster commercialization of renewable energy technologies are analyzed by Balachandra et al. [65].
Currently, increasing attention is given to off-grid technologies, such as solar rooftops with battery back-ups to achieve energy access to all regions. This also concerns households in highly populated areas to become independent from local network operators [8]. Despite the high willingness to invest in off-grid technologies, low-income households still need to be addressed [66]. Within the National Electricity Plan, 40 GW of solar rooftops are planned to be installed by March 2022 to relieve the local power grids [2].
Regarding the model, the results of all three scenarios visualize that the most economically viable energy path leads to an energy mix dominated by solar. With a total share of 68% of solar energy in power generation, India will become a solar reliant country in 2050, which consequently takes risks within. Especially in times when solar power generation is very low, security of energy supplies is difficult to ensure. Considering the concentrated energy demand in conurbations (like UP), on the other hand, makes clear that a sufficient power supply can only be reached if the power system gets optimized. Therefore, storage technologies play a significant role to compensate for fluctuating energy generation.

6. Conclusions

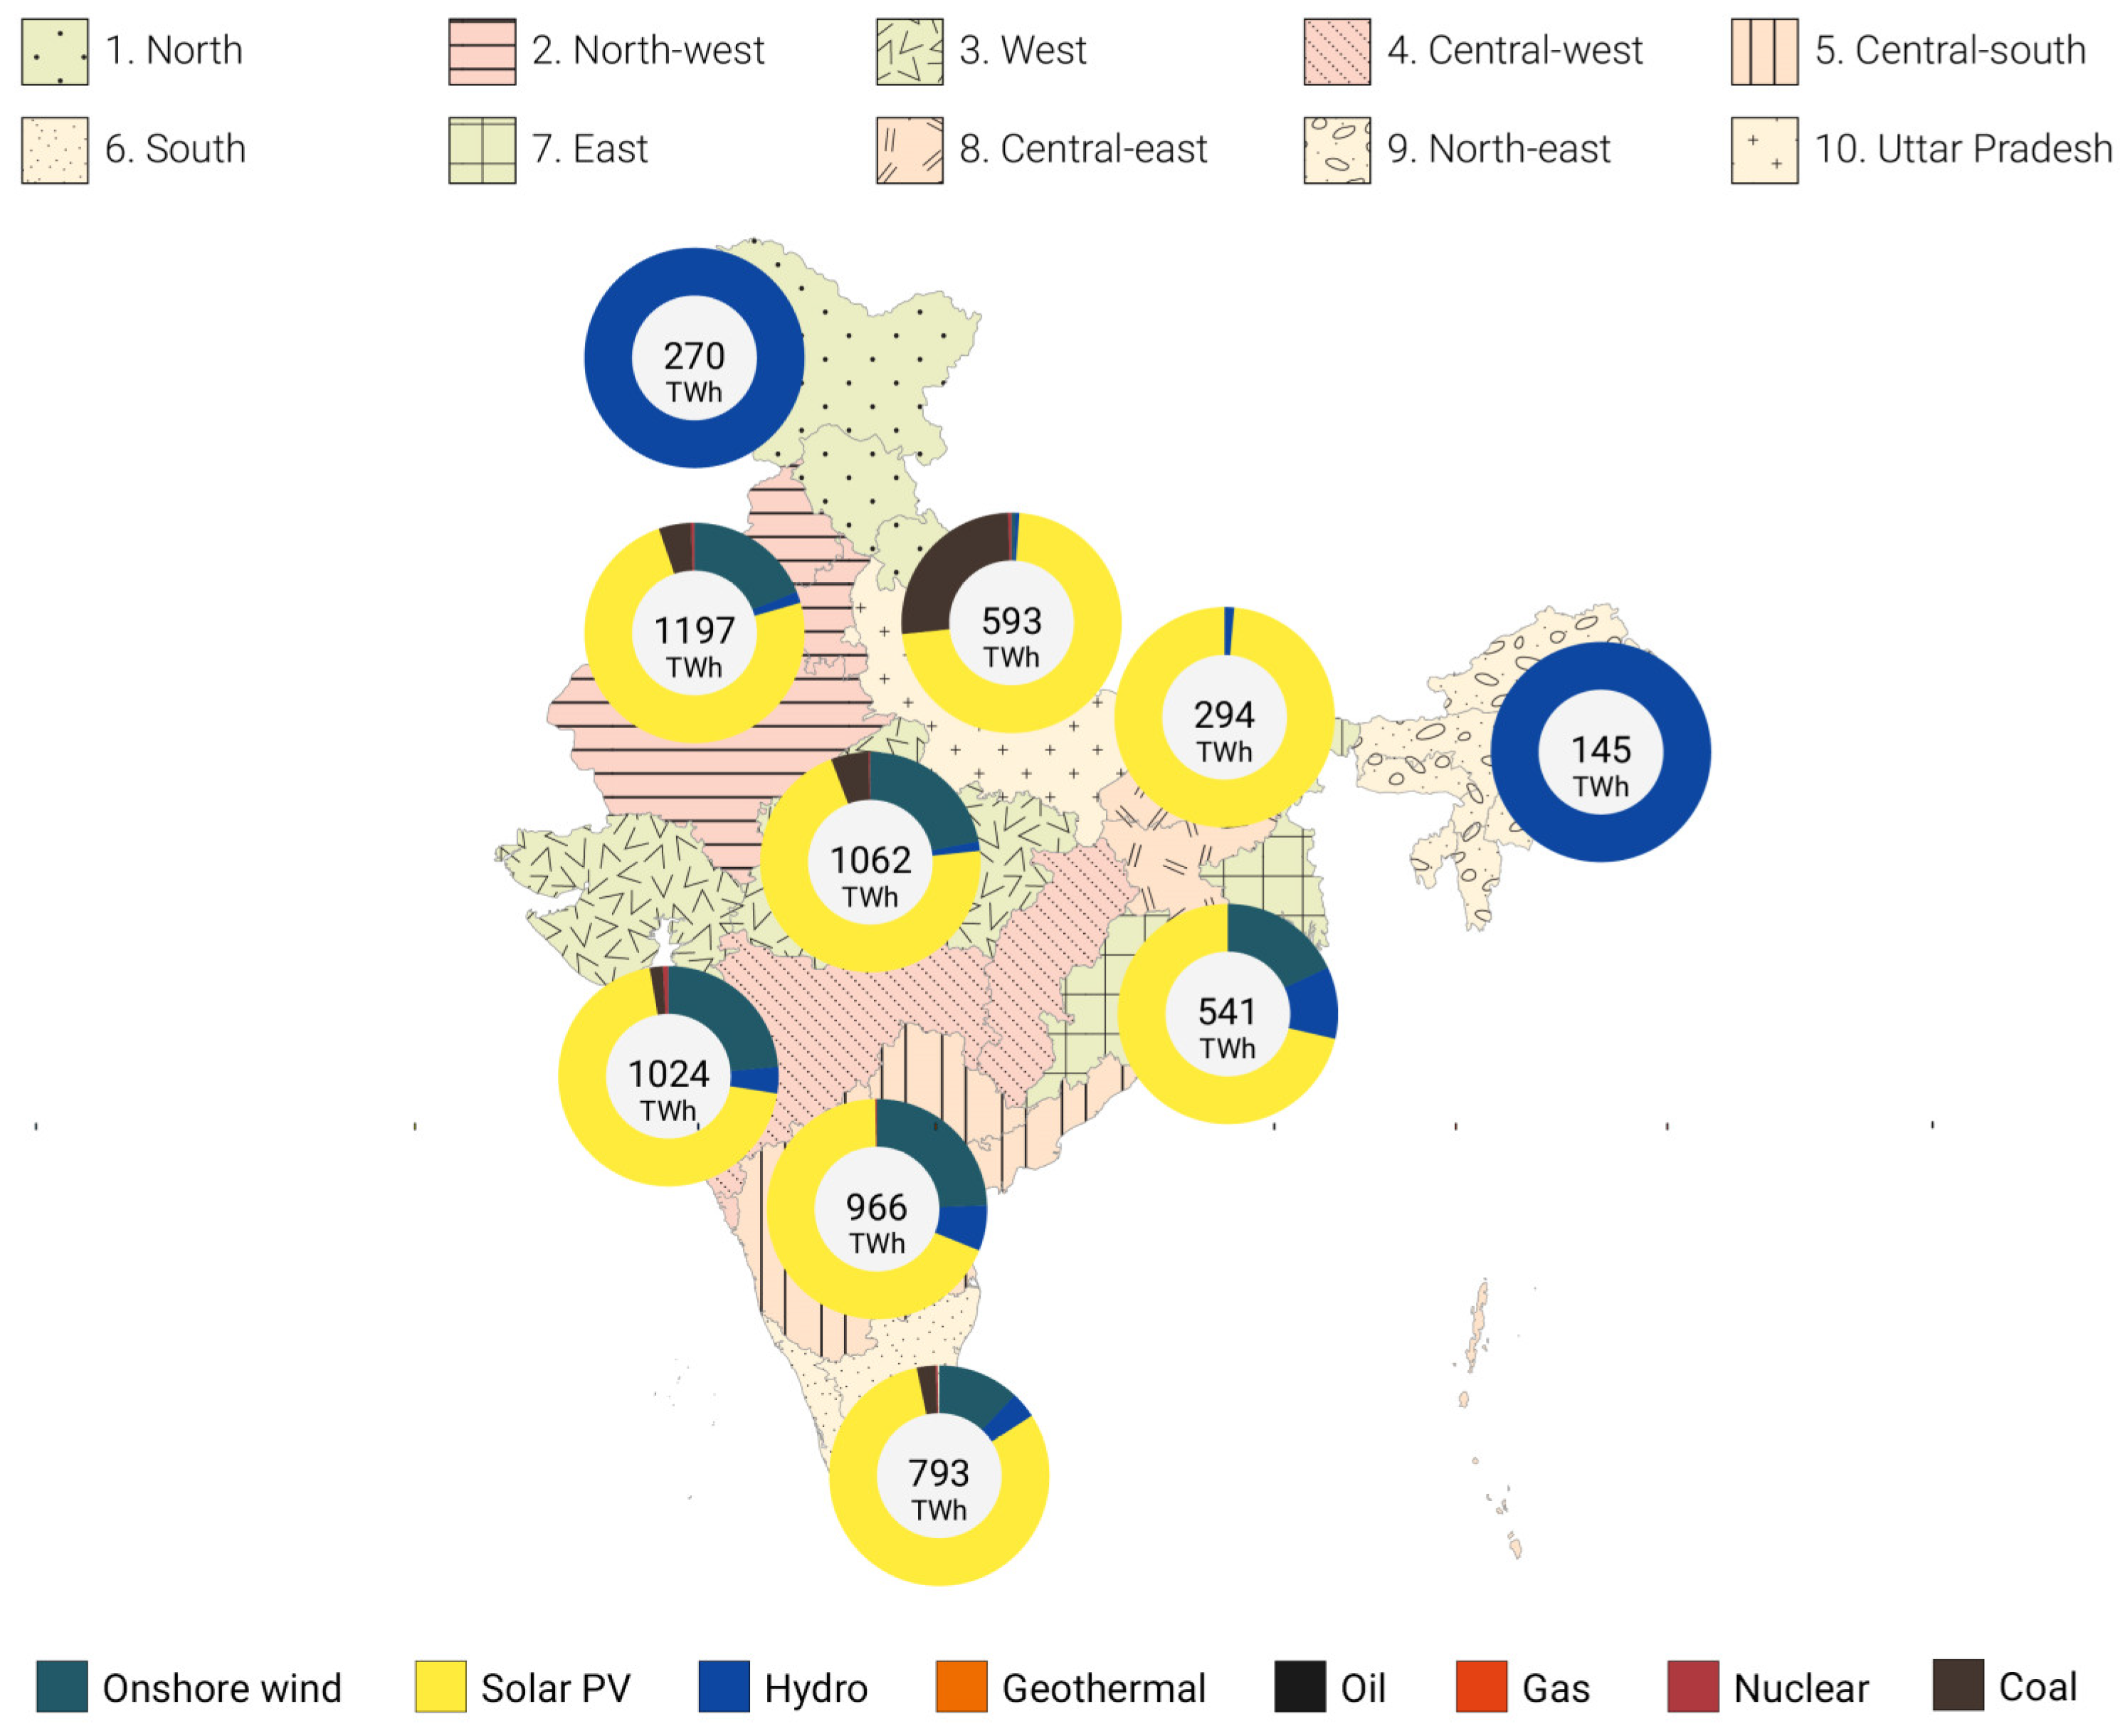
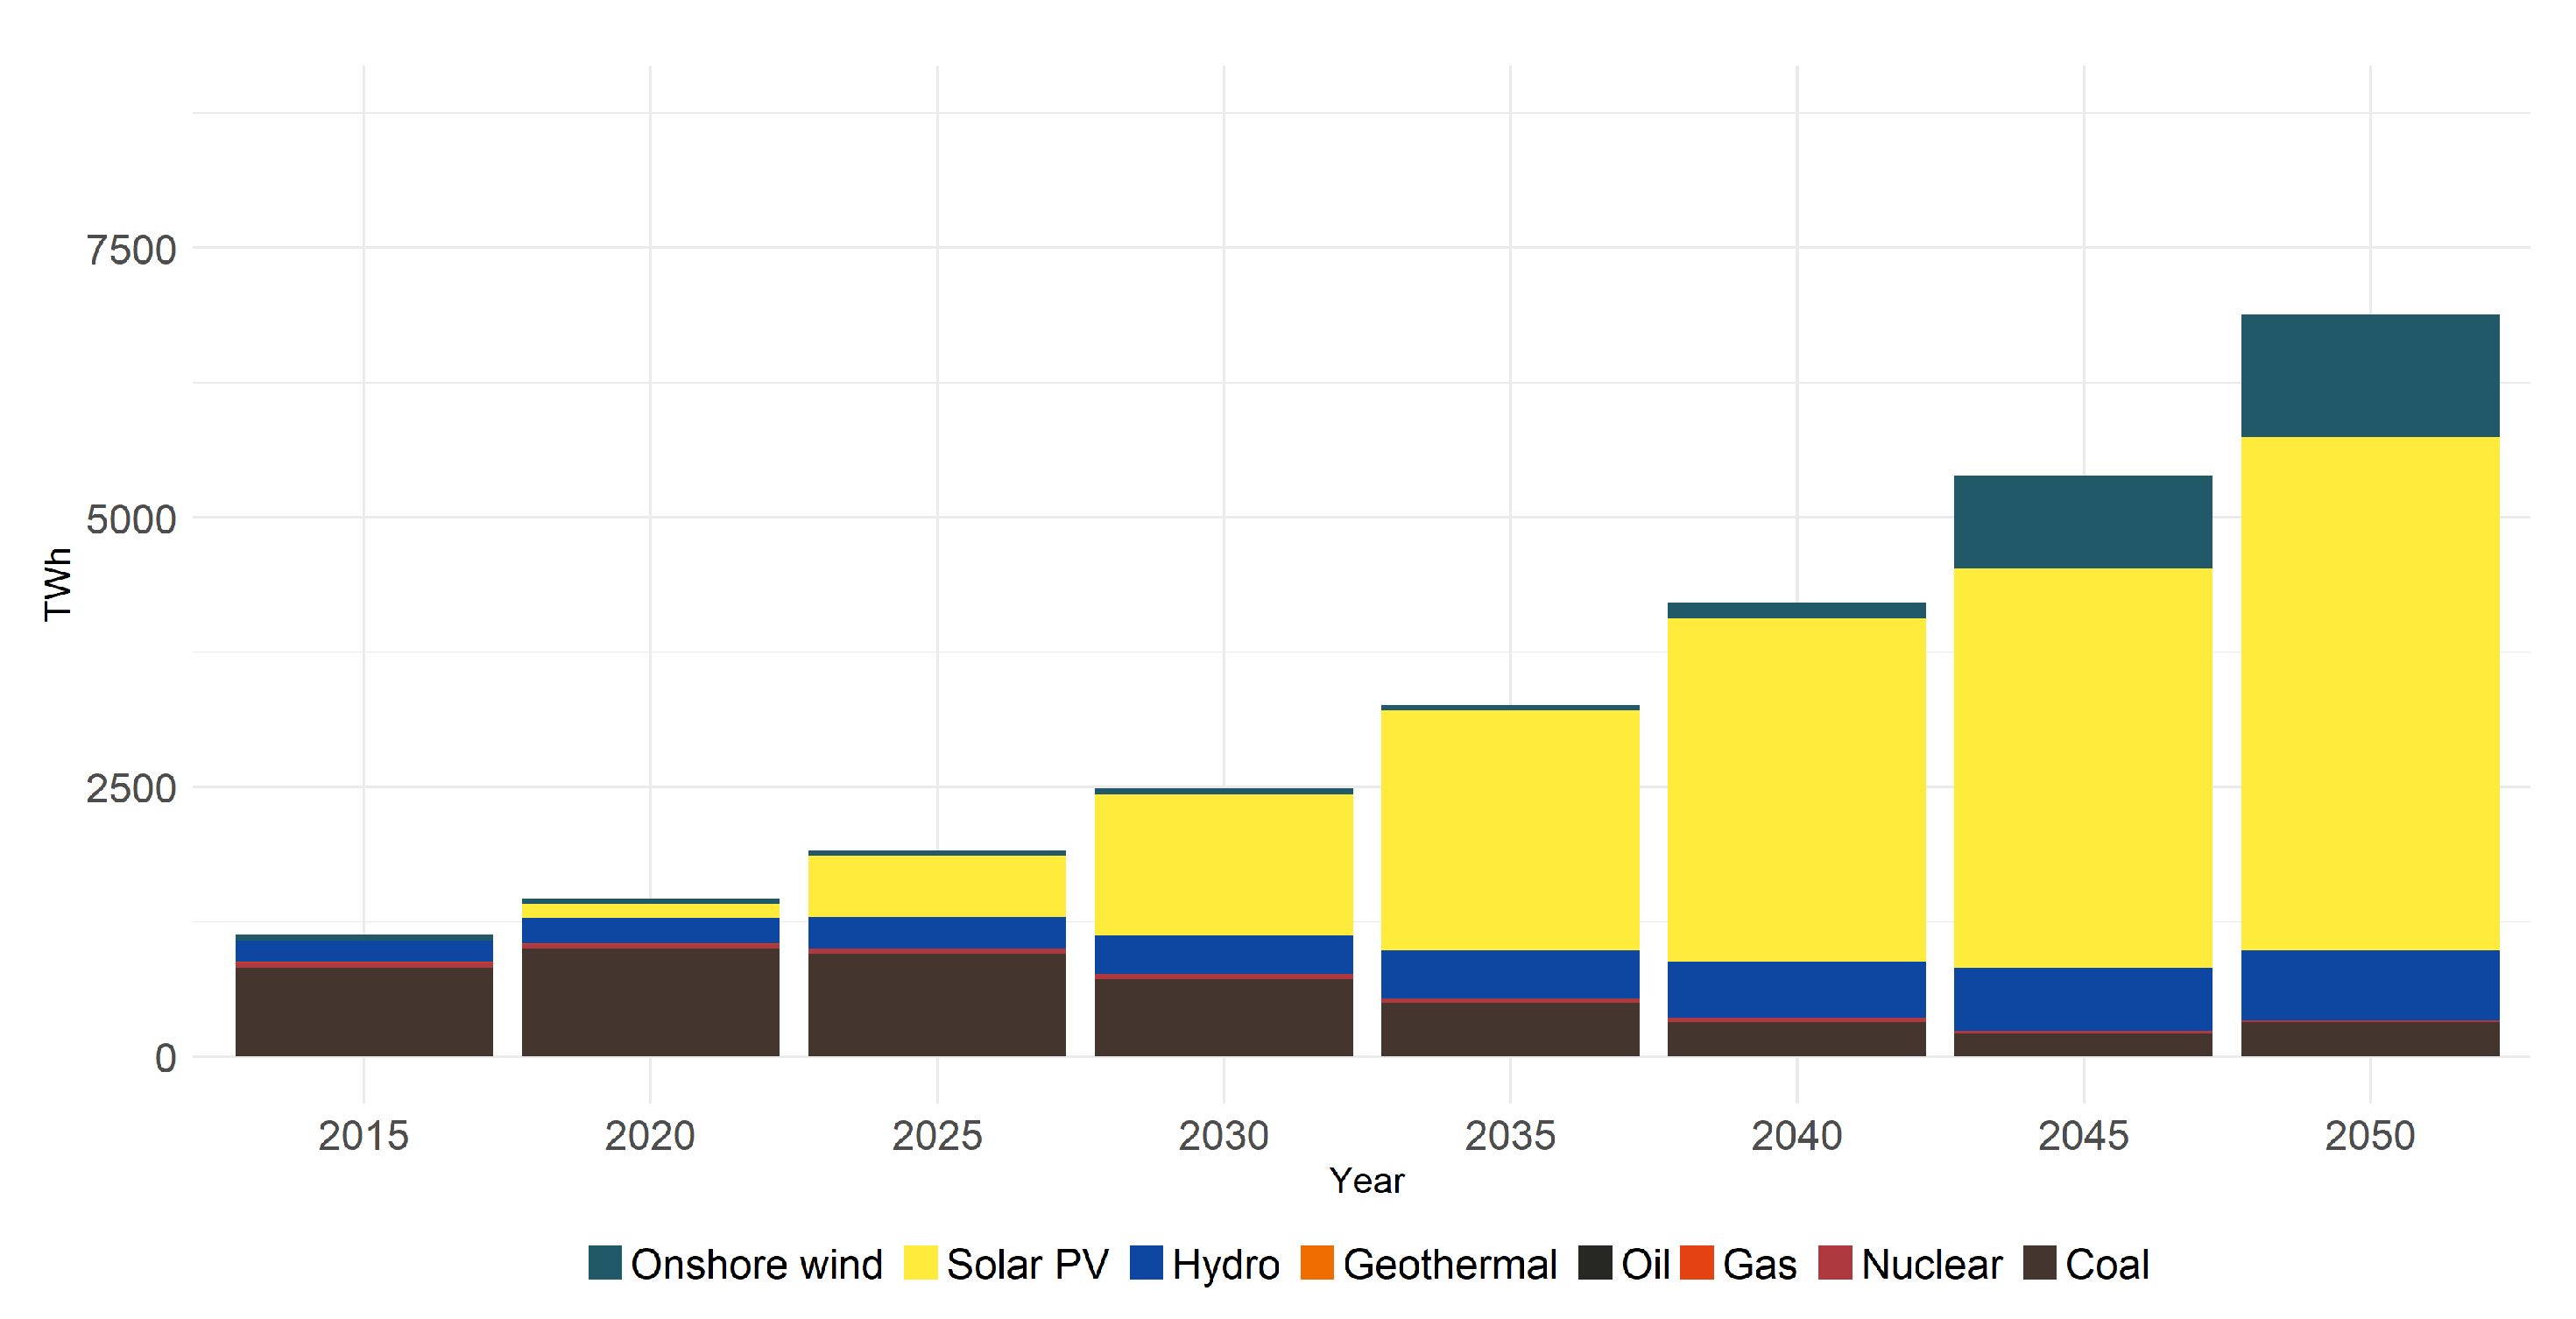
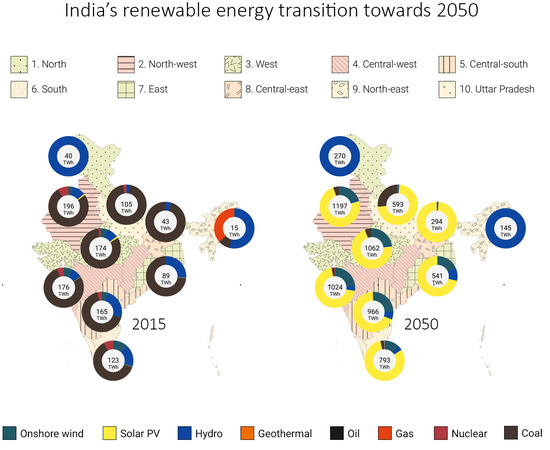
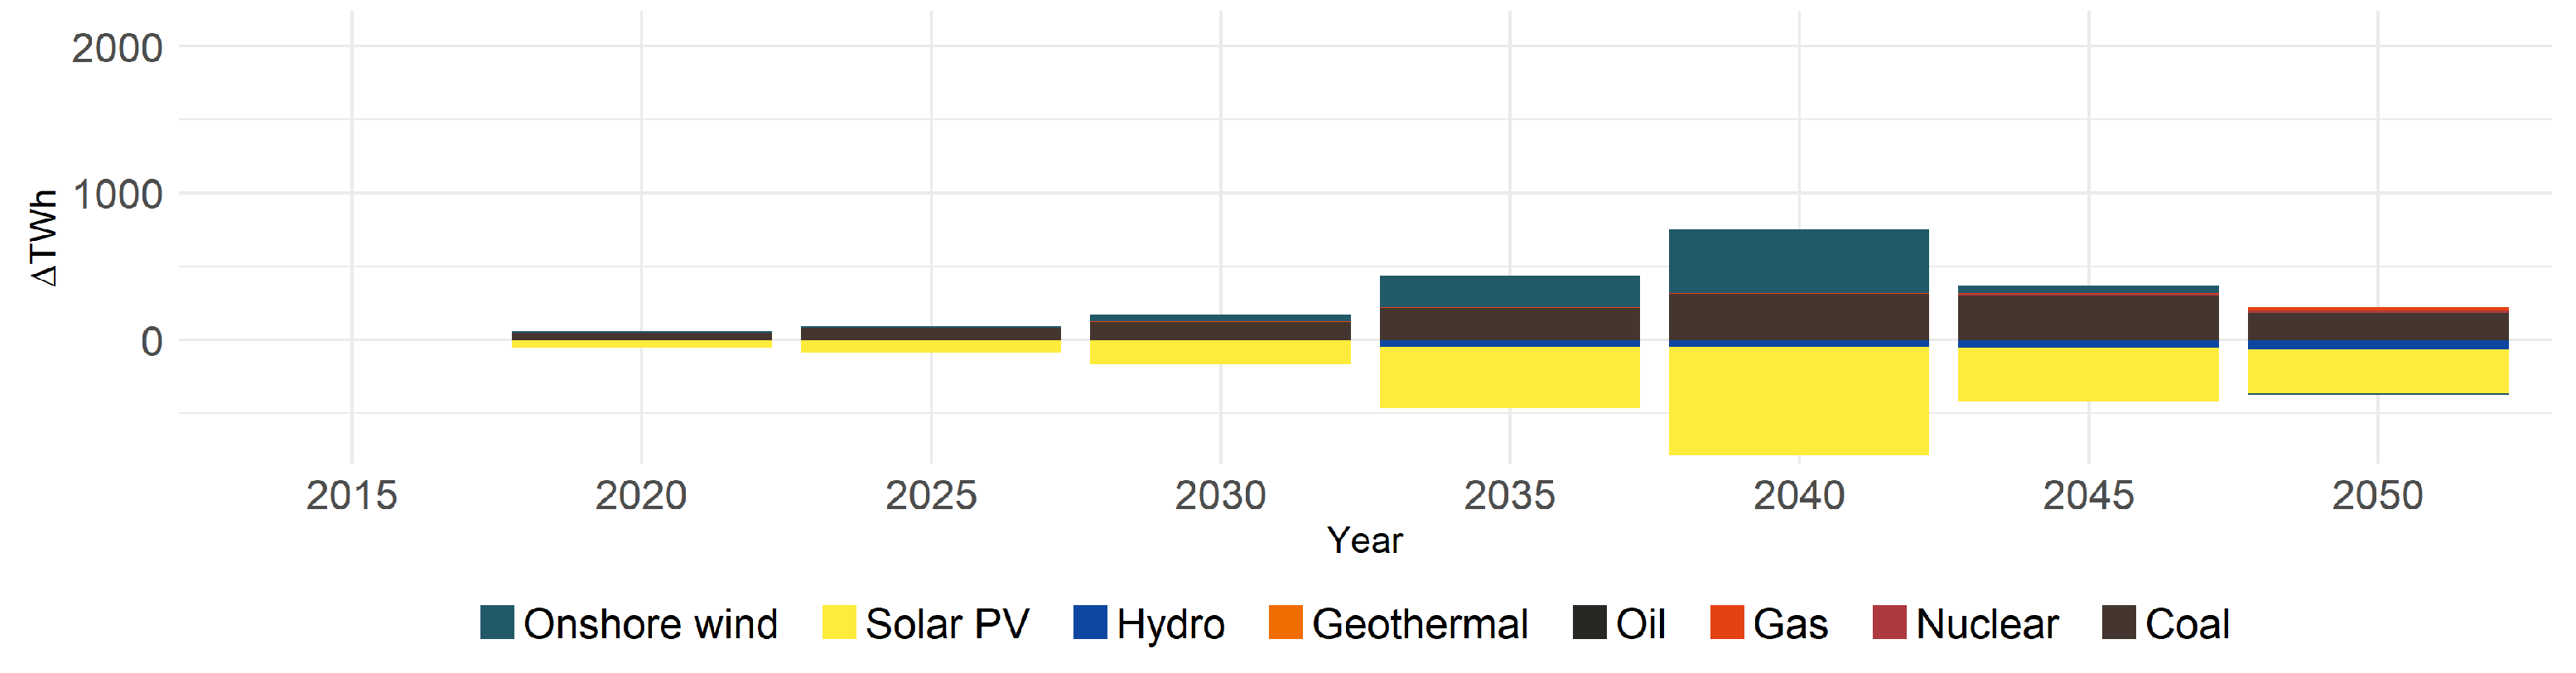
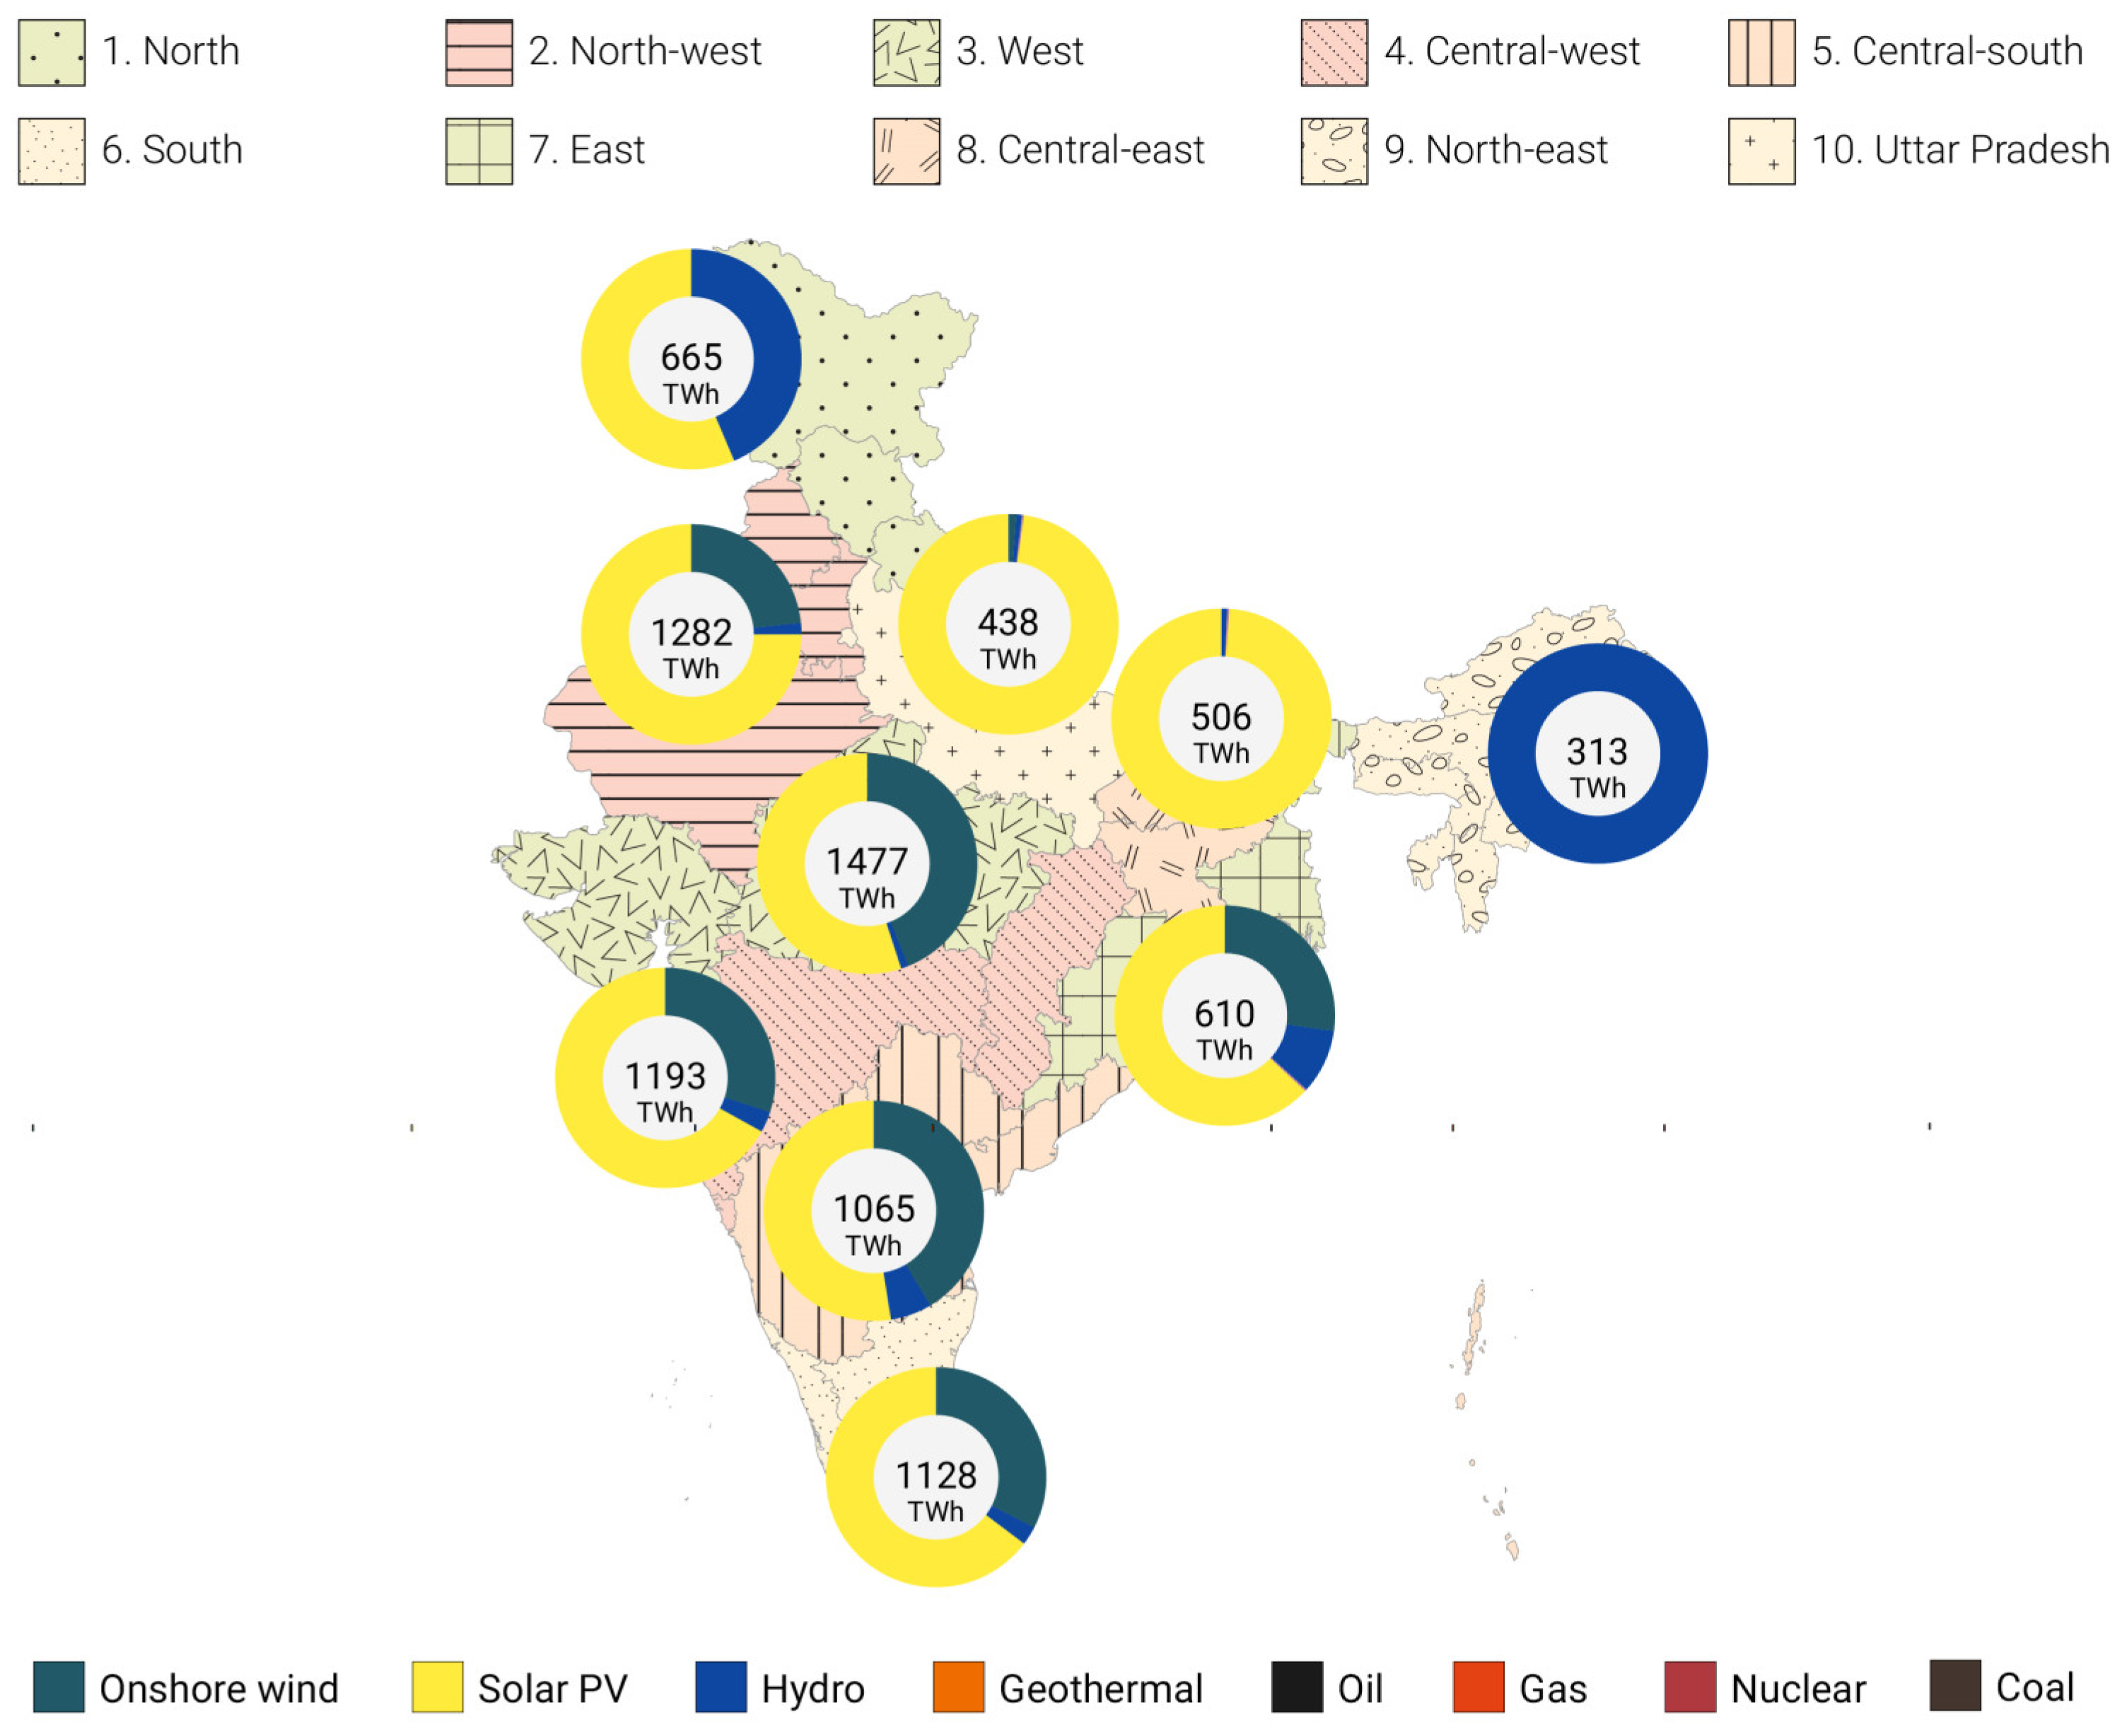
With 6% of global GHG emissions and a predicted future increase, India plays a determining role in future climate policies. In this paper, we explore energy pathways for India from 2015 to 2050 by applying the GENeSYS-MOD to different scenarios. The model results of the LEO scenario visualize the future importance of solar energy within the low-carbon transformation. Even without setting a strict restriction for using conventional energy sources in 2050, renewables (especially solar) will satisfy almost the whole energy demand in 2050, whereas conventional sources will have a negligible share of 2.8% (mainly located in densely populated regions, e.g., UP). In 2050, the share of solar takes over 67% of the whole power production, followed by wind (23%) and hydropower (6%) in the LEO scenario.
For progressive planning, crucial circumstances have to be kept in mind. First of all, India as a developing economy is facing an increasing demand in power, and energy access is an ongoing issue, especially in rural areas [2]. Furthermore, within the conventional energy sources, the future of coal electrification depends on market design, the implementation of existing environmental norms, and regional development perspectives in affected areas. Apart from that, the recent growth of utility-scale solar needs to be accompanied by distributed solar (and batteries), both at the urban and the rural level, to become sustainable and extend the rural electrification progress. As current plans are perceived to be achieved before 2025, set goals submitted in the INDCs and the current Five-Year Plan are assessed as not ambitious enough. Moreover, it is illustrated within the BAU scenario that current electricity plans of the Indian government diverge from needed requirements to contribute to the global rising limit of 2 °C to pre-industrial levels. Tightening the government’s goals until 2030 would consequently both counterbalance and reduce the total cost of the path from there on to 2050, which is projected to be a largely renewable energy-based system. Consequently, fulfilling the Paris Agreement will require stronger efforts in India’s current policies, especially in the last two decades leading up to 2050 in comparison to a smoother and more cost-efficient increase of RES over time. While the model incorporates a high level of detail on a multitude of technologies, inter-sectoral-connections, and the resulting energy mix, its rather rough time disaggregation has to be noted. Variable renewable energy (VRE) technologies and their inherent unstableness, creating a need for flexibility options such as storage, might require a more detailed distinction between time slices. Future research should focus on how to implement such an assessment for even more detailed data on the different sectors and the effects of variable RES on the electricity system.
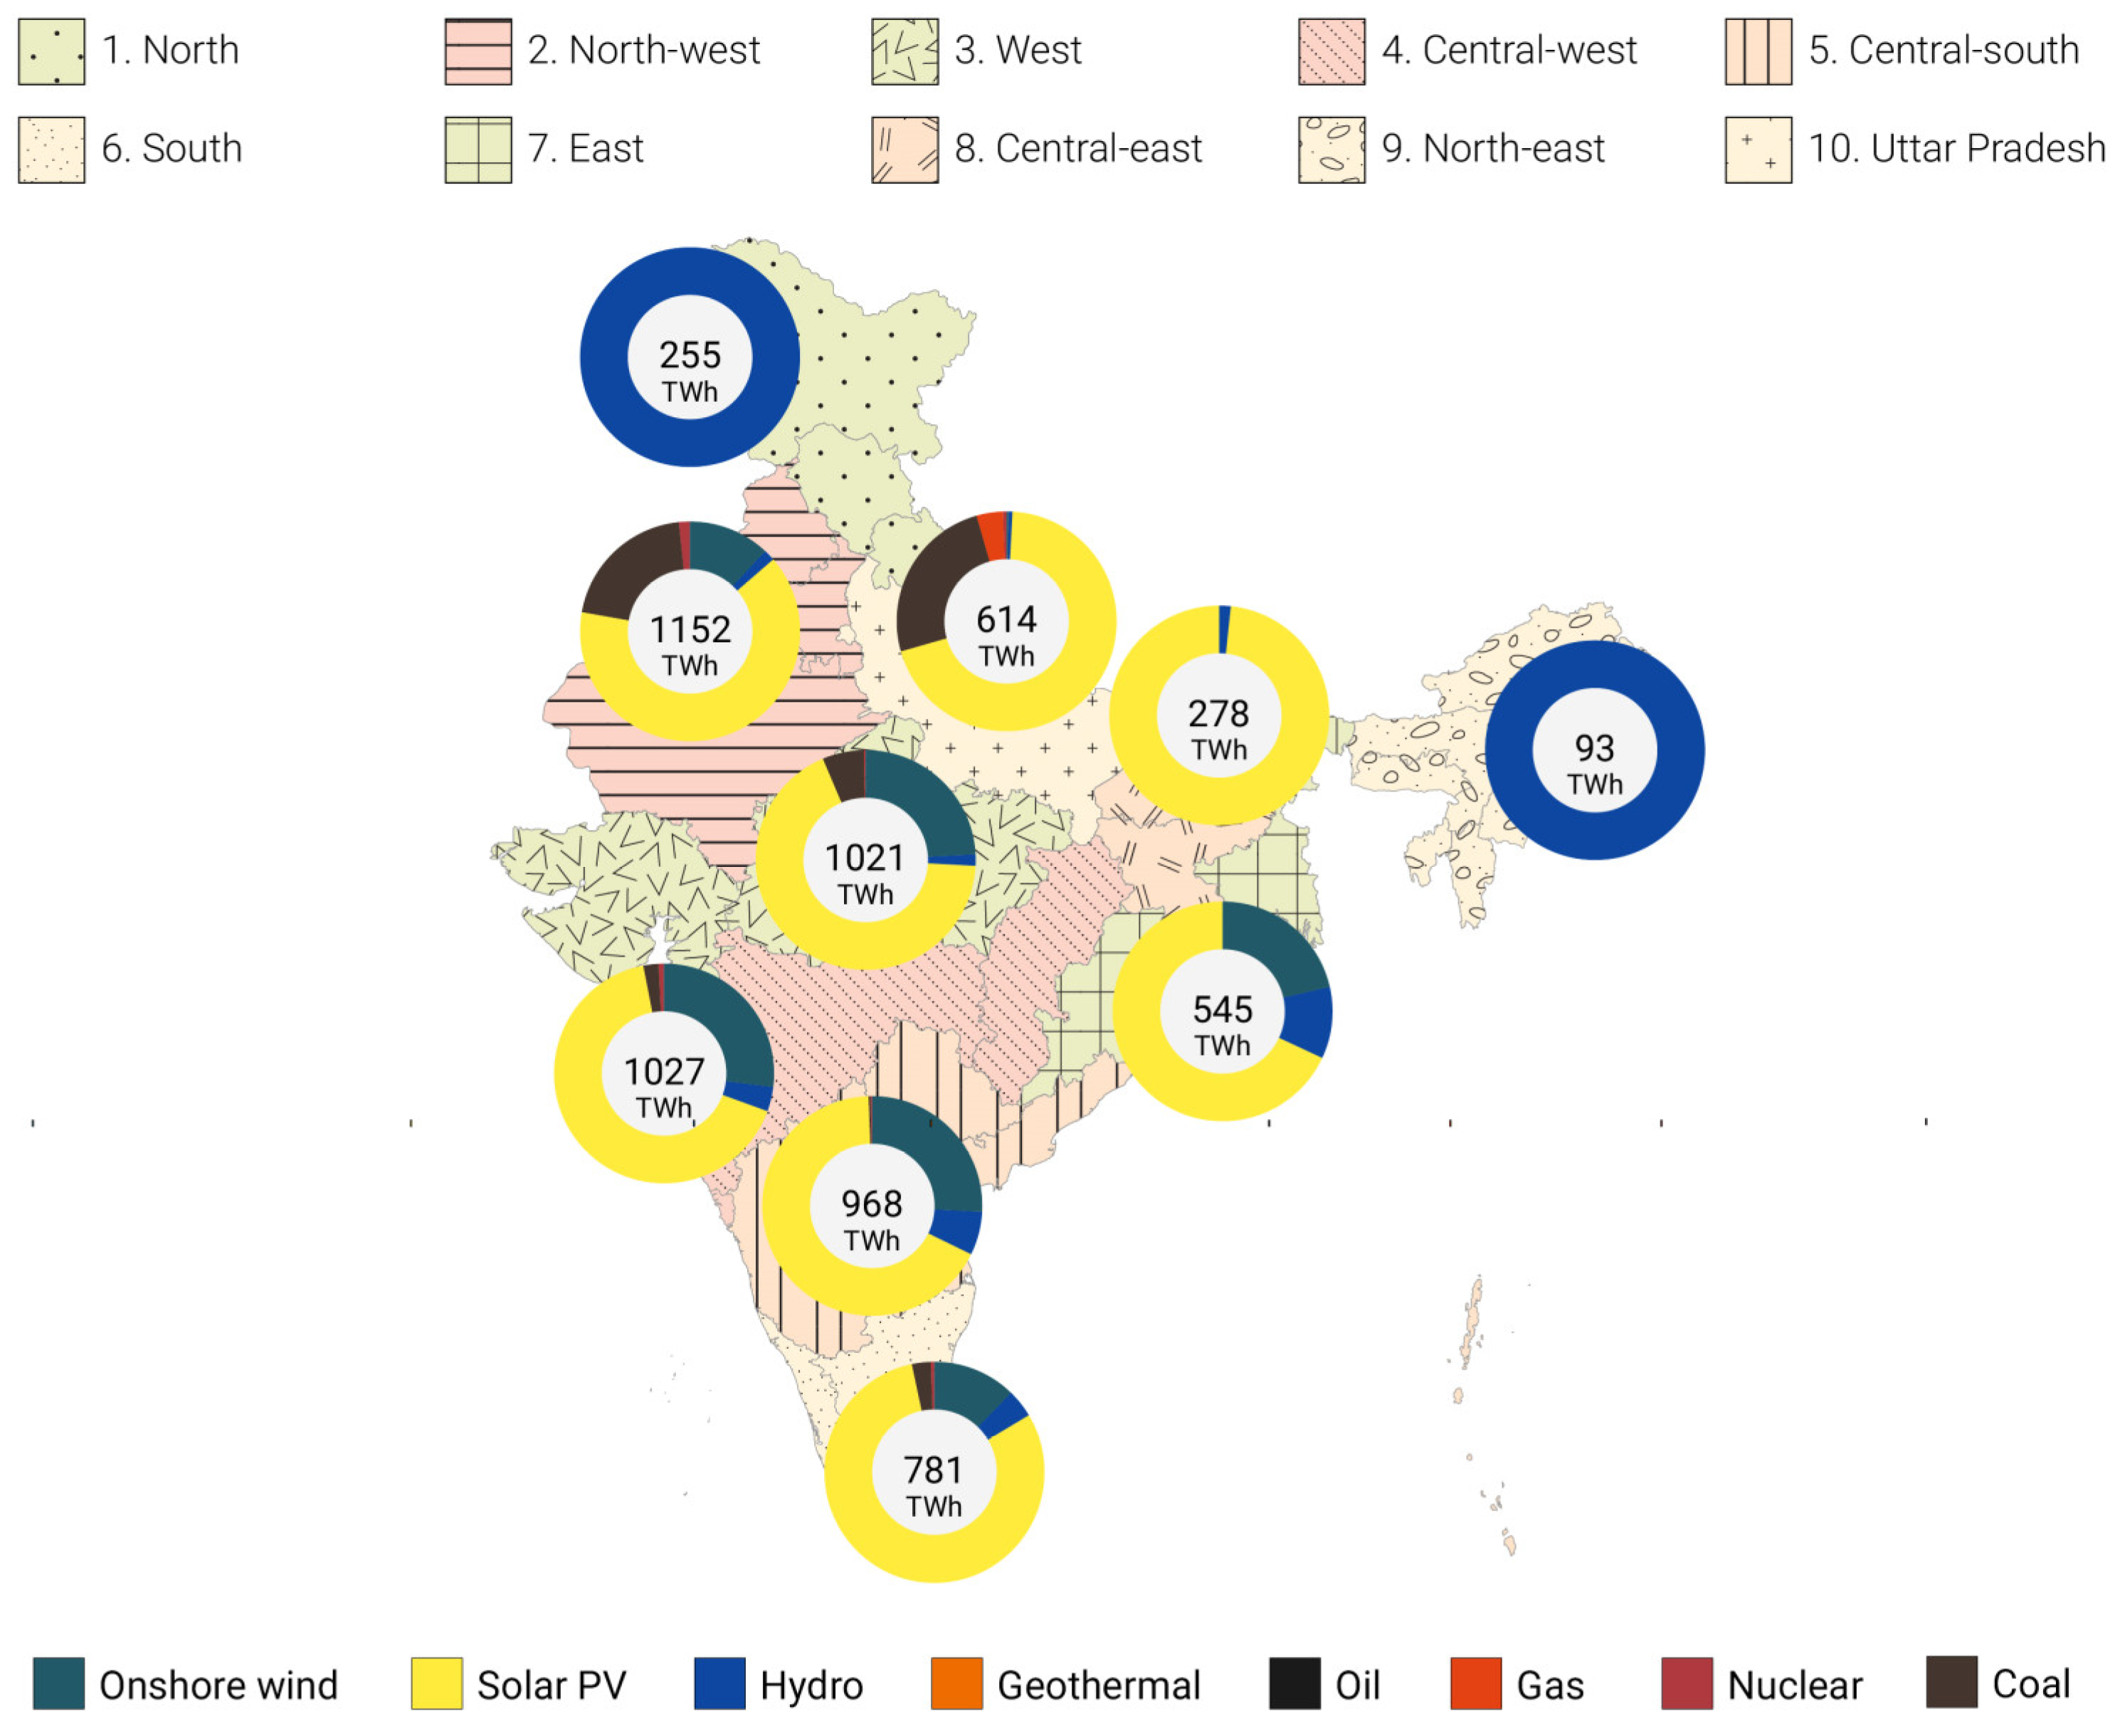
A reduction of the losses and tackling power theft within the power trade would ensure an efficient overcoming of imbalances in between the regions of different renewable energy potentials. Making up leeway in the transmission grid sector is one of the important actions. The results for the 100% RES scenario illustrate the cost-optimized pathway towards 2050 for a technically feasible energy system based on 100% RES, a finding which has been shown by Gulagi et al. [21,47] independently. Additionally, the difference between the LEO and 100% RES scenario in the use of conventional sources indicates that a 100% renewable energy supply is an ambitious goal for 2050. Noticing the negligibly higher total cost of an energy system based on 100% RES to the LEO benchmark or the BAU scenario, this goal may be ambitious but not impossible to achieve.

Author Contributions

L.L. (Linus Lawrenz), B.X., L.L. (Luise Lorenz), A.K., H.H. led the coding and modeling efforts, as well as data research and writing the paper. T.B., K.L., P.-Y.O., and C.v.H. initiated the research, supervised the model implementation, supported the data input and policy backgrounds, and contributed to writing the text. Additionally, T.B., L.L. (Linus Lawrenz), K.L., P.-Y.O., and B.X. (in alphabetical order) managed the reviewing and editing process.

Funding

This work was supported by the German Ministry for Education and Research (BMBF) under grant number 01LN1704A for the research group CoalExit.

Acknowledgments

Previous works of this research have been presented at various workshops and conferences in India and across Europe. We therefore thank the conference and workshop audiences, and in particular Christian Hauenstein, Claudia Kemfert and Roman Mendelevitch for useful discussions and suggestions, the usual disclaimer applies. We also thank the reviewers and editors of Energies for their helpful advice and constructive criticism during the submission process.

Conflicts of Interest

The authors declare no conflict of interest.

Appendix A. Model Parameters

Table A1. Regional electricity, high and low heat demand in PJ.
Region20152020202520302035204020452050
Annual electricity demand (PJ)North136.51173.39220.25279.76355.36451.38573.35728.28
NW700.57889.871130.331435.771823.732316.532942.503737.60
West620.66788.381001.411272.011615.722052.312606.883311.30
CW627.82797.461012.951286.671634.352075.972636.933349.47
CS590.04749.47951.991209.241535.991951.042478.243147.90
South440.51559.55710.74902.801146.751456.621850.222350.17
East319.53405.87515.54654.85831.801056.571342.071704.72
CE153.64195.15247.89314.87399.95508.03645.31819.68
NE53.4267.8686.19109.48139.07176.65224.38285.01
UP373.60474.55602.78765.66972.551235.351569.161993.18
401651026480823110,45513,28016,86921,427
Annual high heat demand (PJ)North217.00302.10373.46444.83503.68562.53635.46708.39
NW1113.651550.381916.632282.882584.922886.963261.233635.50
West986.631373.551698.022022.502290.092557.682889.263220.84
CW998.001389.381717.602045.812316.492587.162922.573257.97
CS937.951305.771614.231922.702177.092431.472746.693061.91
South700.26974.871205.161435.461625.381815.302050.632285.97
East507.94707.13874.171041.221178.981316.741487.441658.15
CE244.23340.01420.33500.65566.89633.13715.21797.28
NE84.92118.22146.15174.08197.11220.14248.68277.22
UP593.88826.781022.091217.411378.481539.551739.141938.73
6384888810,98713,08714,81916,55018,69620,841
Annual low heat demand (PJ)North262.70274.70265.05255.40233.99212.58206.48200.37
NW1348.191409.771360.261310.741200.861090.991059.651028.31
West1194.421248.971205.111161.241063.90966.55938.79911.03
CW1208.191263.371219.001174.631076.16977.69949.61921.53
CS1135.481187.341145.641103.941011.40918.86892.46866.07
South847.73886.45855.32824.18755.09686.00666.30646.59
East614.91642.99620.41597.83547.71497.60483.31469.01
CE295.67309.17298.31287.45263.36239.26232.39225.51
NE102.81107.50103.7399.9591.5783.1980.8078.41
UP718.96751.80725.39698.99640.39581.80565.09548.38
77298082779875146884625460745895
Table A2. Regional demand for transportation in Gpkm (passenger) and Gtkm (freight).
Region20152020202520302035204020452050
Annual demand for passenger transportation (Gpkm)North497189107126145164183
NW252364458552647743841940
West223323406489573658745832
CW226326410494580666754842
CS212307386465545625708791
South158229288347407467529591
East115166209252295339384429
CE5580100121142163184206
NE1928354249576472
UP134194244294345396449501
14432087262531623710425848225386
Annual demand for freight transportation (Gtkm)North2638485868788899
NW136196247297349400453506
West120174219263309355402449
CW122176221266313359406454
CS114165208250294337382427
South85123155187219252285318
East6290113136159183207231
CE30435465768899111
NE1015192327313539
UP72105132159186213242270
7781125141517042000229525992903
Table A3. Regional capacity factors for solar PV, onshore and offshore wind. WN = winter night, WD = winter day, SN = summer night, SD = summer day, IN = intermediate night, ID = intermediate day.
RegionWNWDSNSDINID
Solar PVNorth0.000.250.000.300.000.28
NW0.000.270.000.290.000.30
West0.000.300.000.240.000.30
CW0.000.320.000.230.000.29
CS0.000.350.000.220.000.28
South0.000.490.000.290.000.39
East0.000.320.000.210.000.31
CE0.000.280.000.260.000.30
NE0.000.320.000.210.000.31
UP0.000.320.000.210.000.31
Onshore windNorth0.320.190.370.200.350.24
NW0.320.120.480.300.260.12
West0.280.170.360.420.220.13
CW0.250.140.430.570.200.14
CS0.270.130.440.520.200.13
South0.170.140.290.460.120.13
East0.230.090.330.290.200.14
CE0.240.160.190.170.240.21
NE0.330.170.240.200.360.24
UP0.270.150.200.170.310.19
Offshore windNW0.190.340.490.520.190.27
CW0.140.220.470.420.150.13
CS0.080.170.390.370.100.10
South0.360.390.610.580.230.29

Appendix B. India’s Regional Electricity Production

Figure A1. India’s regional electricity production in the benchmark (LEO) scenario (2050).
Energies 11 03001 g0a1
Figure A2. India’s regional electricity production in the BAU scenario (2050).
Energies 11 03001 g0a2
Figure A3. India’s regional electricity production in the 100% RES scenario (2050).
Energies 11 03001 g0a3
Figure A4. Capital cost development of electricity-generating technologies in million €/GW.
Energies 11 03001 g0a4

References

  1. International Energy Agency (IEA). India Energy Outlook—World Energy Outlook Special Report; IEA Publications: Paris, France, 2015; ISBN 978 92 64 24365 1. [Google Scholar]
  2. Government of India, Ministry of Power. GOI—Draft National Electricity Plan (Volume 1): Generation. Available online: http://www.cea.nic.in/reports/committee/nep/nep_dec.pdf (accessed on 10 July 2017).
  3. Natural Resources Defense Council (NDRC). The Road from Paris: India’s Progress toward its Climate Pledge. Available online: https://www.nrdc.org/sites/default/files/paris-climate-conference-India-IB.pdf (accessed on 2 April 2018).
  4. Chakrabarty, M. Climate Change and Food Security in India; Observer Research Foundation (ORF): New Delhi, India, 2016; Available online: https://www.orfonline.org/research/climate-change-and-food-security-in-india/ (accessed on 16 September 2017).
  5. GOI—Ministry of Power Press Release: Village Electrification. Available online: http://pib.nic.in/newsite/erelcontent.aspx?relid=161968 (accessed on 16 August 2017).
  6. Sen, S.; Ganguly, S.; Das, A.; Sen, J.; Dey, S. Renewable energy scenario in India: Opportunities and challenges. J. Afr. Earth Sci. 2016, 122, 25–31. [Google Scholar] [CrossRef]
  7. Bhushan, C. The Indian Energy Sector-A Survey by Fuel and Institutional Framework; Technical Report or Bulletin Number; Heinrich Boell Foundation-India: Delhi, India, 2014. [Google Scholar]
  8. Bhushan, C. India’s Energy Transition-Potential and Prospects; Heinrich Boell Foundation-India: New Delhi, India, 2017; Available online: https://in.boell.org/sites/default/files/india_renewable_energy_report_2017_final_1.pdf (accessed on 27 April 2018).
  9. Greenpeace India Greenpeace India-Home. Available online: http://www.greenpeace.org/india/en/ (accessed on 12 June 2017).
  10. Prakash Jena, L.; Meattle, C.; Shrimali, G. Getting to India’s Renewable Energy Targets: A Business Case for Institutional Investment. Available online: https://climatepolicyinitiative.org/publication/getting-to-indias-renewable-energy-targets-a-business-case-for-institutional-investment/ (accessed on 2 May 2018).
  11. Boston Consulting Group (BCG). Future of Coal-Based Power Generation in India; The Boston Consulting Group, Inc.: Mumbai, India, 2017; Available online: http://www.ciienergyconclave.com/download/BCGCII_Report_2017.pdf (accessed on 17 November 2017).
  12. Tripathi, L.; Mishra, A.K.; Dubey, A.K.; Tripathi, C.B.; Baredar, P. Renewable energy: An overview on its contribution in current energy scenario of India. Renew. Sustain. Energy Rev. 2016, 60, 226–233. [Google Scholar] [CrossRef]
  13. Sachs, J. The Age of Sustainable Development; Columbia University Press: New York, NY, USA, 2015; ISBN 978-0-231-17314-8. [Google Scholar]
  14. Dhar, S.; Pathak, M.; Shukla, P.R. Transport Scenarios for India: Harmonising Development and Climate Benefits; United Nations Environment Programme (UNEP): Copenhagen, Denmark, 2015; ISBN 978-87-93130-67-8. [Google Scholar]
  15. Löffler, K.; Hainsch, K.; Burandt, T.; Oei, P.-Y.; Kemfert, C.; von Hirschhausen, C. Designing a Model for the Global Energy System—GENeSYS-MOD: An Application of the Open-Source Energy Modeling System (OSeMOSYS). Energies 2017, 10, 1468. [Google Scholar] [CrossRef]
  16. Parikh, J.; Parikh, K.; Ghosh, P.P.; Khedkar, G. Low Carbon Development Pathways for a Sustainable India; IRADe: New Dehli, India, 2014; Available online: https://www.researchgate.net/publication/274515855_Low_Carbon_Development_Pathways_for_a_sustainable_India (accessed on 23 September 2017).
  17. Singh, A.; Karplus, V.J.; Winchester, N. Evaluating India’s Climate Targets: The Implications of Economy-Wide and Sector Specific Policies; Report 327; MIT Joint Program: Cambridge, MA, USA, 2018. [Google Scholar]
  18. Shukla, P.R.; Dhar, S.; Mahapatra, D. Low-carbon society scenarios for India. Clim. Policy 2008, 8, S156–S176. [Google Scholar] [CrossRef]
  19. Shukla, P.R.; Dhar, S.; Fujino, J. Renewable energy and low carbon economy transition in India. J. Renew. Sustain. Energy 2010, 2, 031005. [Google Scholar] [CrossRef]
  20. Marcucci, A.; Fragkos, P. Drivers of regional decarbonization through 2100: A multi-model decomposition analysis. Energy Econ. 2015, 51, 111–124. [Google Scholar] [CrossRef]
  21. Gulagi, A.; Choudhary, P.; Bogdanov, D.; Breyer, C. Electricity system based on 100% renewable energy for India and SAARC. PLoS ONE 2017, 12, e0180611. [Google Scholar] [CrossRef] [PubMed]
  22. Teske, S.; Sawyer, S.; Schäfer, O. Energy [R]evolution—A Sustainable World Energy Outlook 2015—100% Renewable Energy for All; Greenpeace, Global Wind Energy Council, SolarPower Europe: Brussels, Belgium, 2015; Available online: https://www.researchgate.net/publication/310018861_Energy_Revolution_-_A_sustainable_world_energy_outlook_2015 (accessed on 27 August 2017).
  23. Jacobsen, M. Roadmaps to Transition Countries to 100% Clean, Renewable Energy for All Purposes to Curtail Global Warming, Air Pollution, and Energy Risk. Earth’s Futur. 2017, 5, 948–952. [Google Scholar] [CrossRef] [Green Version]
  24. Löffler, K.; Hainsch, K.; Burandt, T.; Oei, P.-Y.; von Hirschhausen, C. Decarbonizing the Indian Energy System until 2050: An Application of the Open Source Energy Modeling System OSeMOSYS. Available online: https://www.researchgate.net/publication/318966842_Decarbonizing_the_Indian_Energy_System_until_2050_-_An_Application_of_the_Open_Source_Energy_Modeling_System_OSeMOSYS (accessed on 1 November 2017).
  25. International Energy Agency (IEA). World Energy Outlook 2016; IEA Publications: Paris, France, 2016; ISBN 978-92-64-26494-6. [Google Scholar]
  26. Arent, D.; Arndt, C.; Miller, M.; Finn, T.; Zinaman, O. The Political Economy of Clean Energy Transitions; World Institute for Development Economics Research, Oxford University Press: New York, NY, USA, 2017; ISBN 978-0-19-880224-2. [Google Scholar]
  27. Pandey, A. India’s Low Carbon Transition; Observer Research Foundation: New Delhi, India, 2017; Available online: https://www.oecd.org/environment/cc/g20-climate/collapsecontents/ORF-India-low-carbon-transition.pdf (accessed on 18 April 2018).
  28. Joshi, M.; Khosla, R. India: Meeting Energy Needs for Development While Addressing Climate Change. In Sustainable Energy in G20: Prospects for a Global Energy Transition; Institute for Advanced Sustainability Studies e.V.: Potsdam, Germany, 2016. [Google Scholar] [CrossRef]
  29. Vishwanathan, S.S.; Garg, A.; Tiwari, V. Coal Transition in India. Assessing India’s Energy Transition Options. Available online: https://www.iddri.org/en/publications-and-events/report/coal-transition-india (accessed on 22 September 2018).
  30. India Brand Equity Foundation. Metals and Mining. Available online: https://www.ibef.org/industry/metals-and-mining-presentation (accessed on 5 November 2017).
  31. International Energy Agency (IEA). World Energy Outlook 2015; IEA Publications: Paris, France, 2015; ISBN 978-92-64-24366-8. [Google Scholar]
  32. The Hindu Business Line CIL Plans to Shut Down 65 Loss-Making Mines. Available online: http://www.thehindubusinessline.com/companies/cil-plans-to-shut-down-65-lossmaking-mines/article9717877.ece (accessed on 27 June 2017).
  33. GOI—Ministry of Power Power Sector at a Glance. Available online: https://powermin.nic.in/en/content/power-sector-glance-all-india (accessed on 15 October 2018).
  34. World Nuclear Association Nuclear Power in India. Available online: http://www.world-nuclear.org/information-library/country-profiles/countries-g-n/india.aspx (accessed on 12 February 2018).
  35. GOI—Ministry of Power. Power Sector: Executive Summary for the Month of March 2018; Government of India, Ministry of Power, Central Electricity Authority: New Dehli, India, 2018; Available online: http://www.cea.nic.in/reports/monthly/executivesummary/2018/exe_summary-03.pdf (accessed on 7 April 2018).
  36. GOI—Ministry of Power. Power Sector: Executive Summary for the Month of Feb 2018; Government of India, Ministry of Power, Central Electricity Authority: New Dehli, India, 2018; Available online: http://www.cea.nic.in/reports/monthly/executivesummary/2018/exe_summary-02.pdf (accessed on 7 April 2018).
  37. International Renewable Energy Agency (IRENA). Renewable Energy and Jobs—Annual Review 2017; International Renewable Energy Agency: Abu Dhabi, UAE, 2017; ISBN 978-92-9260-027-3. [Google Scholar]
  38. Department of Industrial Policy and Promotion (DIPP). New & Renewable Energy Sector—Make in India Achievement; Department of Industrial Policy and Promotion, Ministry of New and Renewable Energy: New Delhi, India, 2017; Available online: http://www.makeinindia.com/article/-/v/renewable-energy-sector-achievement-report (accessed on 12 April 2017).
  39. Green Climate Fund (GCF). Readiness and Preparatory Support—Proposal (India); GCF: New Delhi, India, 2015; Available online: https://www.greenclimate.fund/documents/20182/466992/Readiness_proposals_-_India___UNDP___NDA_Strengthening_and_Country_Programming.pdf/8dbb05a8-93b6-4a07-b7c2-8e74c68cc043 (accessed on 18 June 2017).
  40. UNFCCC International Solar Alliance Mobilizing USD 1 Trillion for Solar Energy by 2030. Available online: https://unfccc.int/news/international-solar-alliance (accessed on 15 October 2018).
  41. Howells, M.; Rogner, H.; Strachan, N.; Heaps, C.; Huntington, H.; Kypreos, S.; Hughes, A.; Silveira, S.; DeCarolis, J.; Bazillian, M.; et al. OSeMOSYS: The Open Source Energy Modeling System: An introduction to its ethos, structure and development. Energy Policy 2011, 39, 5850–5870. [Google Scholar] [CrossRef]
  42. Noble, K. OSeMOSYS: The Open Source Energy Modeling System-A translation into the General Algebraic Modeling System (GAMS); KTH: Stockholm, Sweden, 2017; Available online: https://www.kth.se/en/itm/inst/energiteknik/forskning/desa/publicationsdesa/osemosys-the-open-source-energy-modeling-system-a-translation-into-the-general-algebraic-modeling-system-gams-1.573937 (accessed on 24 October 2017).
  43. O’Neill, B.C.; Ren, X.; Jiang, L.; Dalton, M. The effect of urbanization on energy use in India and China in the iPETS model. Energy Econ. 2012, 34, S339–S345. [Google Scholar] [CrossRef]
  44. Hosain, J.; Mishra, N.; Ansari, M.Z.A.; Deepshikha, S. Report on India’s Wind Power Potential; WinDForce/MNRE/Shakti Foundation/C-STEP: Delhi, India, 2015. [Google Scholar] [CrossRef]
  45. GOI—Ministry of Power FAQs on Hydropower | Government of India | Ministry of Power. Available online: http://powermin.nic.in/en/content/faqs-hydropower (accessed on 21 July 2017).
  46. Farfan, J.; Breyer, C. Structural changes of global power generation capacity towards sustainability and the risk of stranded investments supported by a sustainability indicator. J. Clean. Prod. 2017, 141, 370–384. [Google Scholar] [CrossRef]
  47. Gulagi, A.; Bogdanov, D.; Breyer, C. The Demand for Storage Technologies in Energy Transition Pathways Towards 100% Renewable Energy for India. Energy Procedia 2017, 135, 37–50. [Google Scholar] [CrossRef]
  48. IEA Scenarios and Projections. Available online: https://www.iea.org/publications/scenariosandprojections/ (accessed on 17 July 2017).
  49. Schröder, A.; Bracke, M.; Gerbaulet, C.; Mendelevitch, R.; Islam, M.; von Hirschhausen, C. Current and Prospective Costs of Electricity Generation until 2050; Data Documentation 68; DIW Berlin, TU Berlin: Berlin, Germany, 2013. [Google Scholar]
  50. Ram, M.; Bogdanov, D.; Aghahosseini, A.; Breyer, C. Global Energy System Based on 100% Renewable Energy—Power Sector; University of Technology Lappeenranta: Lappeenranta, Finland, 2017; ISBN 978-952-335-171-4. [Google Scholar]
  51. Energy Technology Reference Indicator (ETRI). Energy Technology Reference Indicator (ETRI) Projections for 2010–2050; European Commission: Petten, The Netherlands, 2014. [Google Scholar] [CrossRef]
  52. GOI—Ministry of Power. Power Procurement. Available online: http://meritindia.in/ (accessed on 14 September 2017).
  53. Landberg, R. Clean Energy Is Approaching a Tipping Point. Bloomberg New Energy Finance. Available online: https://www.bloomberg.com/news/articles/2017-09-19/tipping-point-seen-for-clean-energy-as-monster-turbines-arrive (accessed on 29 October 2017).
  54. CEIC India GDP per Capita. Available online: https://www.ceicdata.com/en/indicator/india/gdp-per-capita (accessed on 6 May 2018).
  55. Barry, E.; Bagri, N.T. Narendra Modi, Favoring Growth in India, Pares Back Environmental Rules. The New York Times. Available online: https://www.nytimes.com/2014/12/05/world/indian-leader-favoring-growth-sweeps-away-environmental-rules.html (accessed on 3 August 2017).
  56. World Resources Institute (WRI). Can Renewable Energy Jobs Help Reduce Poverty in India; World Resources Institute: Washington, DC, USA, 2017; ISBN 978-1-56973-924-2. [Google Scholar]
  57. Farooq, A. Generation Based Incentive Scheme; Ministry of New and Renewable Energy; New Delhi, India, 2011. Available online: http://pib.nic.in/newsite/PrintRelease.aspx?relid=78829 (accessed on 14 July 2017).
  58. Infrastructure Development Finance Company Ltd. (IDFC). Barriers to Development of Renewable Energy in India & Proposed Recommendations; IDFC: Chennai, India, 2010; Available online: http://www.idfc.com/pdf/publications/Discussion-paper-on-Renewable-Energy.pdf (accessed on 12 August 2017).
  59. Mohan, A.; Topp, K. India’s energy future: Contested narratives of change. Energy Res. Soc. Sci. 2018, 44, 75–82. [Google Scholar] [CrossRef]
  60. Lebel, L.; Garden, P.; Banaticla, M.R.N.; Lasco, R.D.; Contreras, A.; Mitra, A.P.; Sharma, C.; Nguyen, H.T.; Ooi, G.L.; Sari, A. Integrating Carbon Management into the Development Strategies of Urbanizing Regions in Asia. J. Ind. Ecol. 2007, 11, 61–81. [Google Scholar] [CrossRef]
  61. Shrimali, G.; Shobbit, G.; Srinivasan, S.; Nelson, D. Solving India’s Renewable Energy Financing Challenge: Which Federal Policies Can Be Most Effective? Climate Policy Initiative (CPI): New Delhi, India, 2014. Available online: https://climatepolicyinitiative.org/publication/solving-indias-renewable-energy-financing-challenge-which-federal-policies-can-be-most-effective/ (accessed on 8 September 2017).
  62. World Bank Group Electric Power Transmission and Distribution Losses (% of Output): India. Available online: http://data.worldbank.org/indicator/EG.ELC.LOSS.ZS?locations=IN (accessed on 24 July 2017).
  63. Golden, M.; Min, B. Theft and Loss of Electricity in an Indian State. Available online: https://leitner.yale.edu/sites/default/files/files/resources/papers/GM_PowerTheft_20120409.pdf (accessed on 17 July 2017).
  64. World Bank Ease of Doing Business in India. Available online: http://www.doingbusiness.org/data/exploreeconomies/india (accessed on 5 November 2017).
  65. Balachandra, P.; Kristle Nathan, H.S.; Reddy, B.S. Commercialization of sustainable energy technologies. Renew. Energy 2010, 35, 1842–1851. [Google Scholar] [CrossRef]
  66. Jolly, S.; Raven, R.; Romijn, H. Upscaling of business model experiments in off-grid PV solar energy in India. Sustain. Sci. 2012, 7, 199–212. [Google Scholar] [CrossRef] [Green Version]
Figure 1. Layout of the Global Energy System Model (GENeSYS-MOD) with new additions based on Löffler et al. [15]. OSeMOSYS: open-source energy modeling system.
Energies 11 03001 g001
Figure 2. India’s regional configuration and electricity production (2015) based on Gulagi et al. [47].
Energies 11 03001 g002
Figure 3. India’s power pathway in the limited emissions only (LEO) scenario.
Energies 11 03001 g003
Figure 4. India’s heat pathway in the LEO scenario.
Energies 11 03001 g004
Figure 5. India’s freight transportation pathway in the LEO scenario.
Energies 11 03001 g005
Figure 6. India’s passenger transportation pathway in the LEO scenario.
Energies 11 03001 g006
Figure 7. Comparison between the LEO and the business as usual (BAU) scenarios.
Energies 11 03001 g007
Figure 8. Comparison between the LEO and the 100% RES scenarios.
Energies 11 03001 g008
Table 1. India’s renewable energy sources (RES) addition in GW predicted by the Central Electricity Authority of India (CEA) based on GOI—Ministry of Power [2].
RES CategoryInstalled Capacity as on 31 March 2016Expected Capacity Addition from 2017 to 2022Target RES Installed Capacity as on 31 March 2022Expected Capacity Addition from 2022 to 2027
Solar18.781.310050
Wind31296040
Biomass5.44.6107
Small Hydro4.50.553
Total59.7115.3175100
Table 2. India’s RES addition predicted by the CEA based on GOI—Ministry of Power [2].
YearEnergy Requirement (TWh) 1Peak Demand (GW) 2
20151114153.4
20221611235.3
20272132317.7
1 After considering reduction in demand due to demand side management (DSM). 2 After reducing solar and wind generation (i.e., variable renewable energy (VRE) generation).
Table 3. RES potentials in GW based on GOI – Ministry of Power [45] and Hosain et al. [44]. N = north. NW = north-west. W = west. CW = central-west. CS = central-south. S = south. E = east. CE = central-east. NE = north-east. UP = Uttar Pradesh. PV: photovoltaics.
RES TechnologyNNWWCWCSSECENEUP
Solar PV72430961705206911353912765001000300
Onshore wind0394359555955309154052
Offshore wind00614114740000
Hydro51437115101591
Table 4. Assumptions on the cost of conventional and renewable energies in India based on Schröder et al. [49], Ram et al. [50] and the Energy Technology Reference Indicator (ETRI) [51].
Technology20152020202520302035204020452050
Cost in M€/GWOnshore wind128011521050972940900860823
Offshore wind25602304210019441880180017201664
Large-scale hydropower826826826826826826826826
Utility-scale solar PV1000580466390337300270246
Biomass656656656656656656656656
Cost in M€/PJHard coal1.061.111.171.231.291.351.421.49
Natural gas3.303.303.303.303.303.303.303.30

