Article

Performance Analysis of Permanent Magnet Motors for Electric Vehicles (EV) Traction Considering Driving Cycles

1
Department of Systems and Naval Mechatronic Engineering, National Cheng Kung University, Tainan 70101, Taiwan
2
Department of Electrical Engineering, National Cheng Kung University, Tainan 70101, Taiwan
*
Author to whom correspondence should be addressed.
Energies 2018, 11(6), 1385; https://doi.org/10.3390/en11061385
Submission received: 1 May 2018 / Revised: 24 May 2018 / Accepted: 25 May 2018 / Published: 29 May 2018
(This article belongs to the Collection Electric and Hybrid Vehicles Collection)

Abstract

:
This paper evaluates the electromagnetic and thermal performance of several traction motors for electric vehicles (EVs). Two different driving cycles are employed for the evaluation of the motors, one for urban and the other for highway driving. The electromagnetic performance to be assessed includes maximum motor torque output for vehicle acceleration and the flux weakening capability for wide operating range under current and voltage limits. Thermal analysis is performed to evaluate the health status of the magnets and windings for the prescribed driving cycles. Two types of traction motors are investigated: two interior permanent magnet motors and one permanent magnet-assisted synchronous reluctance motor. The analysis results demonstrate the benefits and disadvantages of these motors for EV traction and provide suggestions for traction motor design. Finally, experiments are conducted to validate the analysis.

1. Introduction

Electric vehicles (EVs) have become more and more attractive in recent years, as they are considered as the most viable solution to help protect the environment and to achieve high energy efficiency for transportation [1]. In EVs, traction motors are the key component for propulsion, which requires high torque and power density, wide speed range, high efficiency, high reliability, low noise, and reasonable cost. Interior permanent magnet synchronous machines (IPMSMs) have emerged as the brightest candidates, which have been widely used for EV (or hybrid EV) tractions, such as Toyota Prius and Nissan Leaf. These electric motors may be designed with different rotor topologies, where rare-earth magnet is often employed to achieve high performance [2]. However, the material cost of rare-earth magnet is high and the supply is mainly controlled by few countries owning the mineral resources. Some EVs adopt propulsion solutions without rare earth permanent magnet (PM), such as Tesla Model S, which uses copper rotor induction motors (IMs). However, the starting current of IMs can be high and this is disadvantageous for battery duration [3]. In response to the demands for rare-earth-free or less-rare-earth traction motors, PM-assisted synchronous reluctance motors (PMa-SynRMs) can be an excellent candidate [4]. The PMa-SynRM is often designed with ferrite magnets or small amount of rare-earth magnets in the rotor core. The weaker or less PM can be potentially demagnetized during high performance operation (e.g., high armature reaction or flux weakening). Also, the rotor should be well designed in order to gain as much reluctance torque as possible in order to compensate the loss in electromagnetic torque due to less amount of PM used [4,5].
On the other hand, the EVs require high torque for starting at zero speed, acceleration, climbing, and high power for cruising at highway speeds [6]. Therefore, traction motors are usually designed to produce peak torque or power that is several times the rated values. However, for frequent urban or suburban driving, traction motors can be mostly operated in low torque, low power, and low efficiency conditions. This would lead to energy waste and the cruise range reduces. To investigate the effect of driving conditions on design of traction motors, some established driving cycles could be employed to test the vehicles. Degano and Carraro [7,8], based on the torque profiles of selected driving cycles, determined some representative operating points of traction motors for PMa-SynRM global optimization. Nguyen and Wang [6,9] proposed a method to calculate the losses and to optimize the design of a surface-mounted PM motors (SPMSM), according to a selected driving cycle. Sarigiannidis [10,11] evaluated the energy consumption, optimized the design, and compared the performance of a fractional-slot concentrated-winding SPMSM and IPMSM based on the New European Drive Cycle (NEDC). Yang [12] determined the target torque and the speed curve based on a driving scenario and the design for an axial-flux permanent magnet (AFPM) was optimized to minimize energy consumption. Most of these studies focused on evaluating and minimizing the losses and energy consumption of traction motors. However, the evaluation of traction motor designs by employing driving cycle test results has not been comprehensively studied. The performance of an IPMSM was evaluated using a driving cycle [13]; however, the thermal issue was not considered for the traction motor to satisfy the driving cycle. Thermal imaging was employed in diagnosis of faults that are related to temperature rise for industrial induction motors [14,15]. The thermal problem can be even more crucial for traction motors with high performance operations, and therefore, the thermal analysis is considered to be critical. The design factors of tractions motors should involve flux linkages, inductances, torque generation, and thermal condition. More study is also required for EV tractions while using PMa-SynRM.
This paper compares two IPMSMs and one PMa-SynRM (all using rare-earth magnet) that are based on two standard driving cycles: the Urban Dynamometer Driving Schedule (UDDS) and Highway Fuel Economy Driving Schedule (HWFET) [16]. These driving cycles are employed to comprehensively test the traction motor performance in terms of torque, efficiency, and thermal condition. The torque–speed envelope is derived under the current and voltage limits that the inverter can supply. Thermal analysis is performed to check the temperature of the magnets and windings under various loading conditions. Based on the analysis, the benefits and the disadvantages of the IPMSMs and PMa-SynRM for EV tractions can be fully elaborated. Some suggestions regarding the design of EV traction motors are provided. Finally, experiments are conducted to verify the analysis.

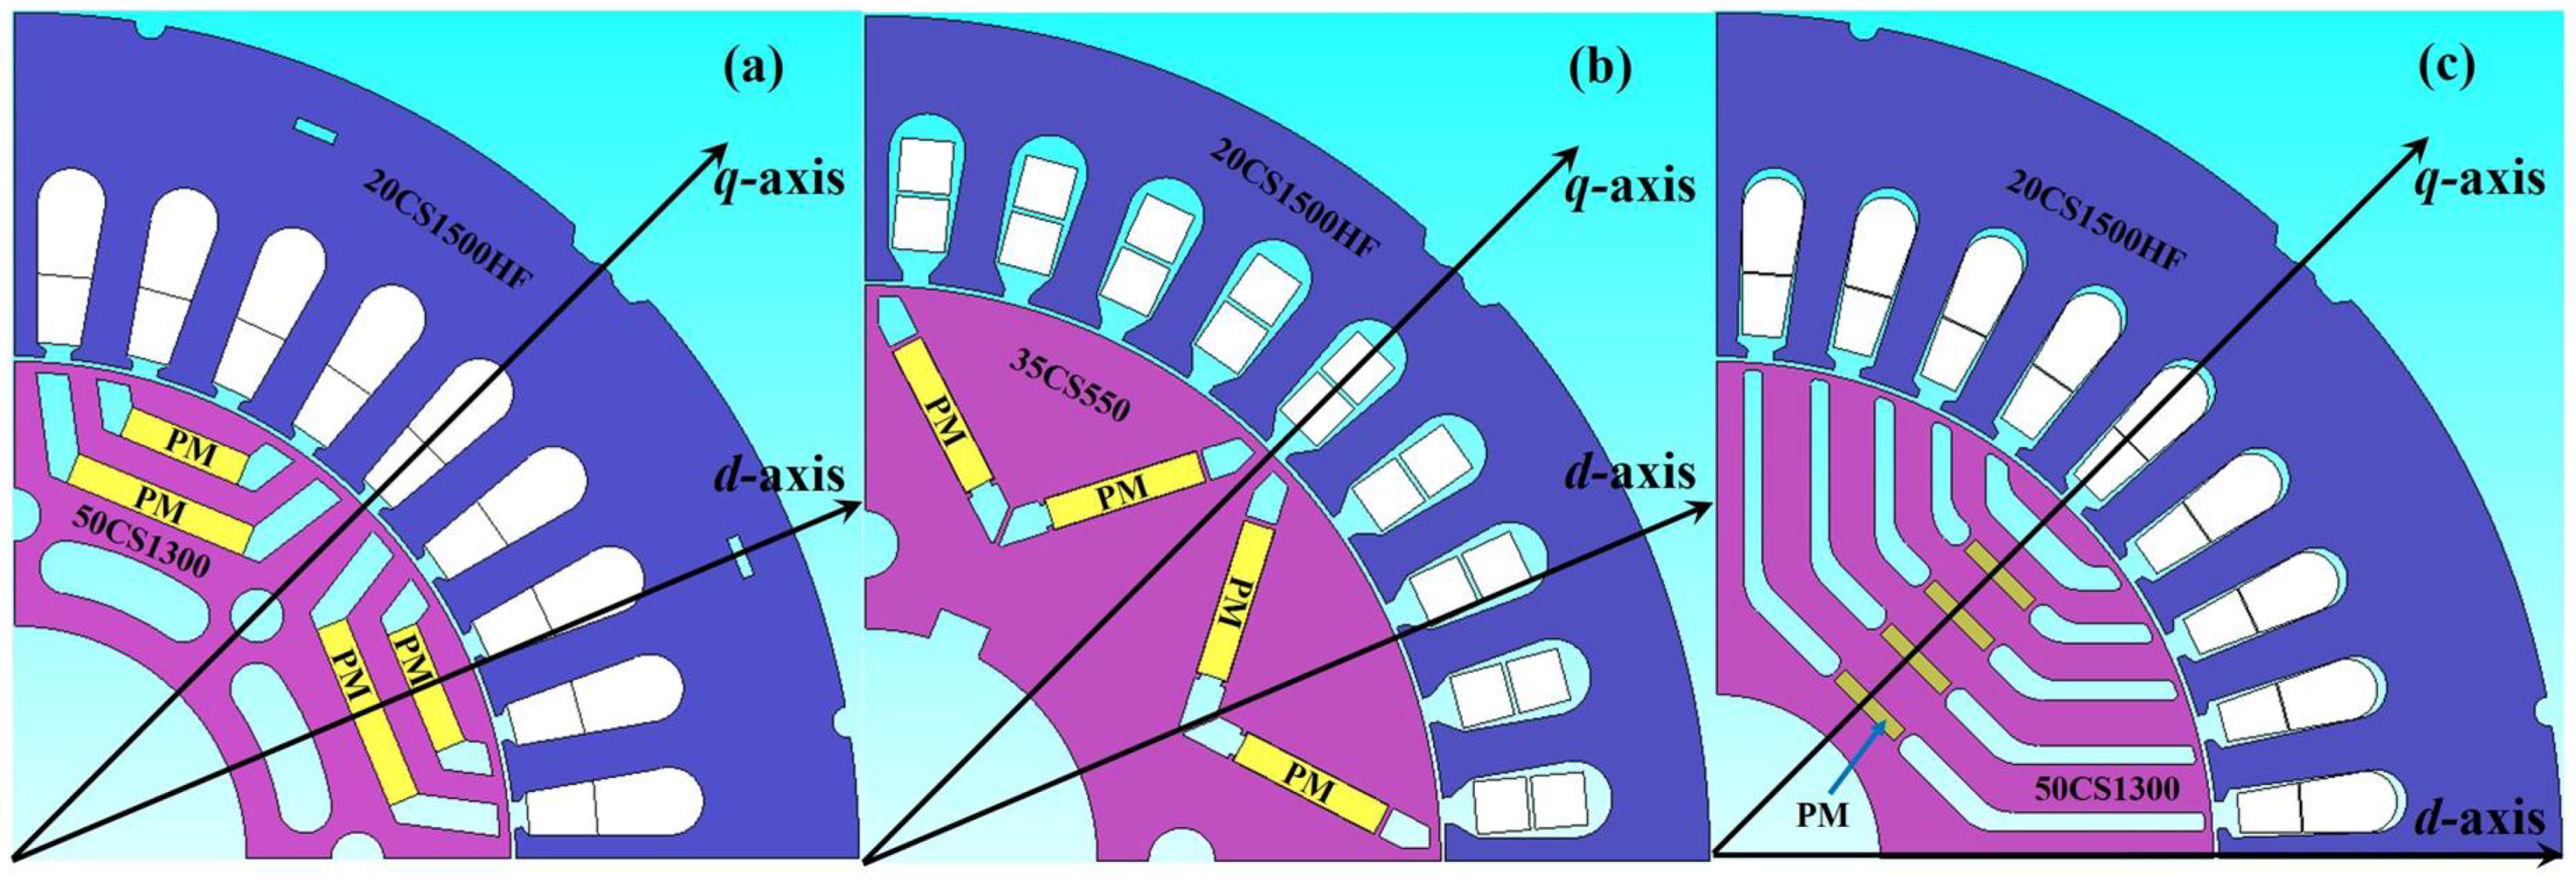
2. Target Traction Motors and EV

As previously mentioned, two IPMSMs and one PMa-SynRM with rare-earth magnet are investigated. Among these motors, the PMa-SynRM is a less-magnet option with a dominant reluctance torque. This would make its torque performance at high speed different to that of the IPMSMs, whose electromagnetic torque dominates. For fair comparison, some design constraints for the motors are listed, as follows:
(a)
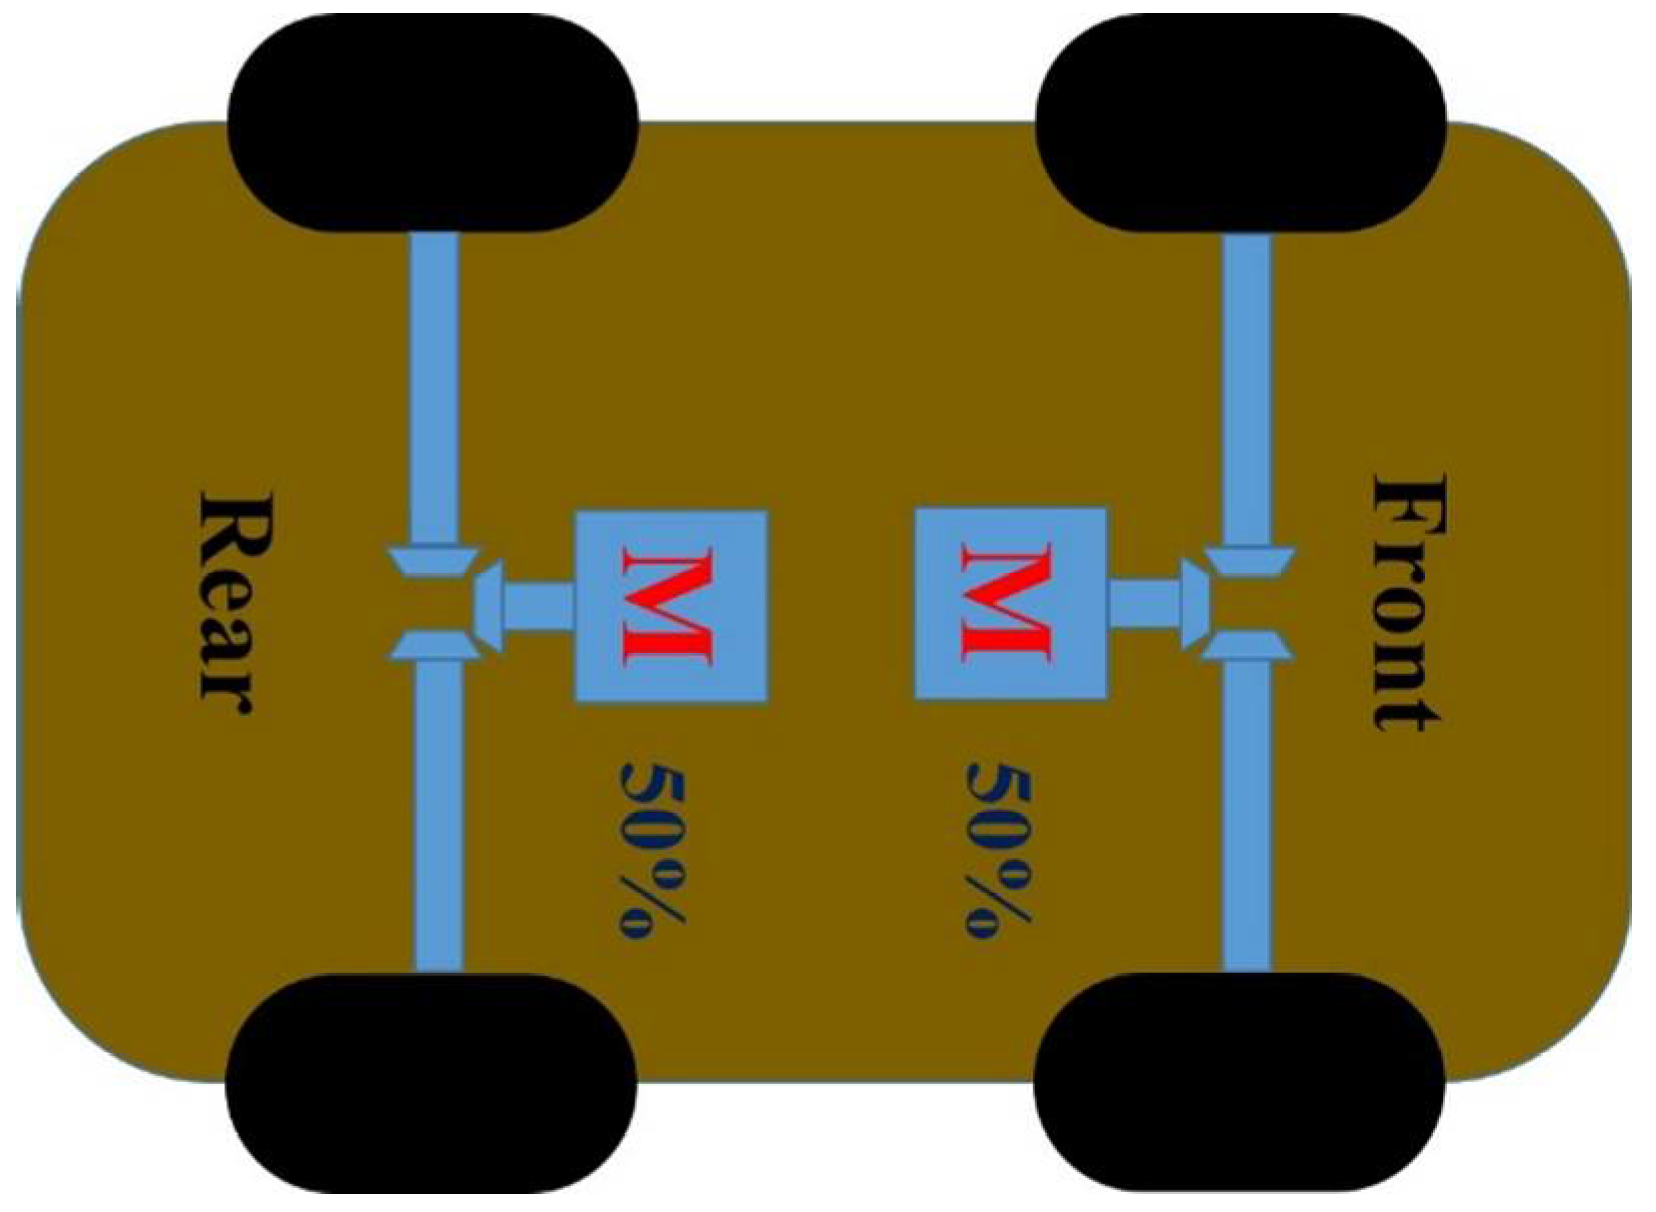
output power: greater or equal to 10 kW (this makes a total power of 20 kW for the EVs. Explained later);
(b)
torque density: greater or equal to 30 Nm/L;
(c)
maximum current density: 16–17 Arms/mm2;
(d)
outer stator diameter: 160 mm;
(e)
air gap: 0.5 mm;
(f)
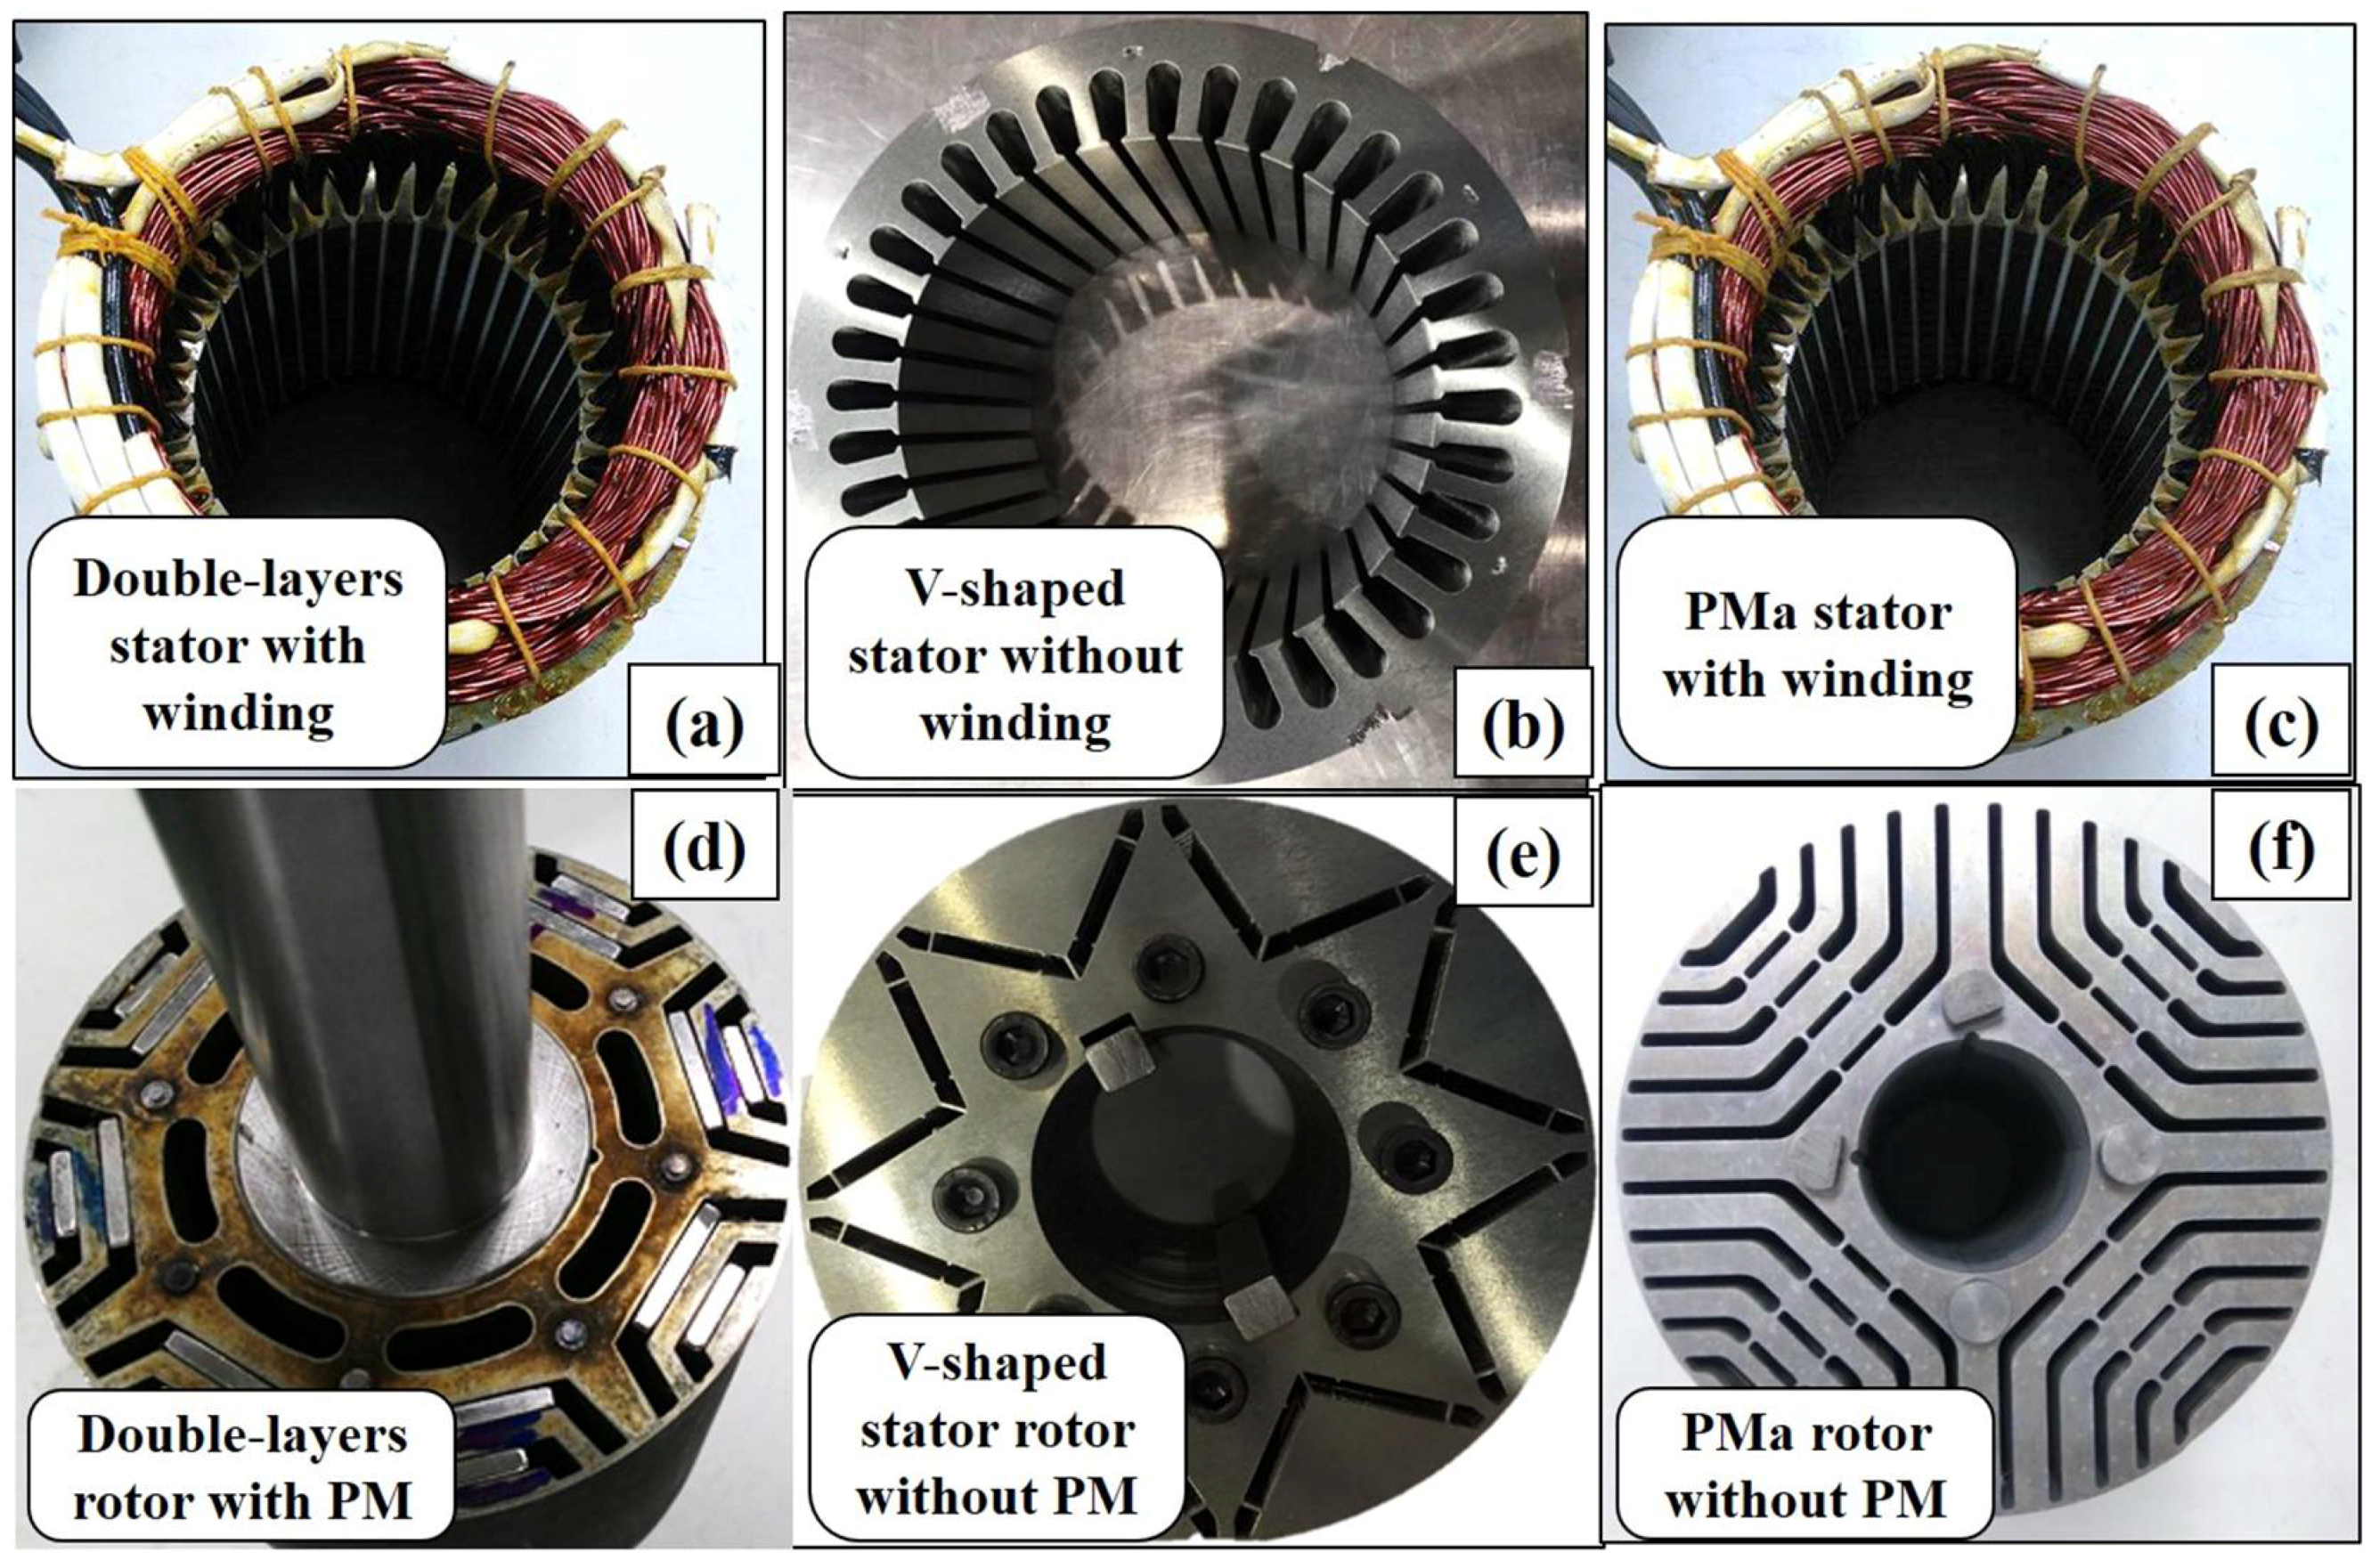
number of slots: 36;
(g)
winding configuration: distributed winding; and,
(h)
efficiency: greater or equal to 95%.
Figure 1a shows the design of the IPMSM with double-layers PM. This rotor design can reduce the torque ripple due to the harmonics that are induced by the flux barriers/magnets with the stator teeth. The reluctance torque can also be improved although the electromagnetic torque (hereafter called PM torque) may be slightly reduced. The greater number of magnet poles usually generates a higher torque for the same current level; however, it also requires more room for each pole.
The V-shaped IPMSM that is shown in Figure 1b is known to possess the advantages of flux weakening capability [17]. The PM position and dimension for the V-shaped design are also arranged to satisfy the constraints given previously. The iron loss of the V-shaped design is expected to be greater than that of the double-layers one because the harmonics in the air gap flux density distribution may increase the stator core loss.
Figure 1c shows the design of the PMa-SynRM using rare earth PM with each piece having the same dimension. This PMa-SynRM adopts five flux barriers per pole to reduce the torque ripple and to increase the reluctance torque. Only four of the barriers are filled with PMs (except the outermost one) for each pole, as seen in Figure 1c.
Using thin electrical steel laminations for motor core would reduce iron losses and enhance traction motor efficiency [18,19]. However, thin laminations are usually expensive [18]. Therefore, as a compromise between loss reduction and material cost, thin laminations can be used for the stator (with alternating flux) and common laminations (e.g., thicker with a possible higher saturation flux density) are for the rotor. This may improve the efficiency by 2% to 2.5%, as demonstrated in [19]. This idea is adopted here. In Figure 1, thin laminations (20CS1500HF) are employed for the stator due to the alternating flux that generates significant iron losses and other materials (50CS1300 or 35CS550) are utilized in the rotors. Note that all of the laminations are produced by China Steel Corporation in Taiwan. The Neodymium Iron Boron (NdFeB) magnet used for all the three motors is N35H with a remanence (Br) and coercive force (Hc) of 1.2 T and 915 kA/m, respectively.
The main specifications and parameters of the motors are given in Table 1. As can be seen, the PMa-SynRM is axially longer than the other two. All of the motors are designed to meet the prescribed minimum requirements. Note that the design processes are not the focus in this paper, and thus will not be detailed here.
As shown in Figure 2, two traction motors, one in the front, and the other the rear drivetrains, are employed to a light-duty vehicle and each is connected to the front or rear axles via a differential. With the driving independence of the front and rear wheels, this offers advantages, such as fault tolerance, excellent safety, and enhanced steering ability with an appropriate distribution of driving torque to the front and rear wheels according to operating conditions. This also helps to improve the stability of the vehicle by precisely distributing the braking torque to the front and rear wheels upon the detection of a wheel slip or wheel lock [20]. Table 2 lists the parameters of the target EV. The analysis process for the traction motors while considering driving cycles is summarized in the flow chart shown in Figure 3.

3. Theoretical Background

To satisfy the required performance of the EV shown in Table 2 and Figure 2, the designed motors should possess excellent capabilities in terms of flux-weakening and peak torque output under the inverter current and voltage limits. Thus, the first constraint is the maximum current and the maximum voltage for the IPMSMs and PMa-SynRM, which can be given by [21]:
I s = I d 2 + I q 2 I s _ m a x
V s _ m a x = p ( L d I d + λ m ) 2 + ( L q I q ) 2 V D C 3 ω s
where Is and Is_max are armature current and the maximum current provided by the inverter, respectively; Id and Iq are d- and q-axis currents, respectively; Ld and Lq are d- and q-axis inductances, respectively; p is number of pole pair; λm is PM flux linkage; ωs is rotor speed; Vs_max is maximum phase voltage; and, VDC is battery voltage applied to the inverter.
The induced back electromotive force at the maximum speed is determined by:
E = p λ m ω s _ m a x V D C 3
where E is the induced back electromotive force (BEMF) and ωs_max is maximum rotor speed.
To maximize the flux weakening capability and constant-power speed range that is required by the traction motor, the following ideal condition should be satisfied [21]:
λ m = L d I s
for IPMSM and
λ m = L q I s
for PMa-SynRM [22]. However, this is only an ideal condition. Practically, the stator flux linkage should be carefully designed with a limit, so that PM would not be demagnetized. If the design cannot fully meet the conditions in Equations (4) or (5), a reasonable high constant power speed range can still be achieved if the values of both sides are as close as possible. Note that the conventional d-q-axis definitions with respect to PM flux linkage are different for IPMSMs and PMa-SynRMs [21,22], since the IPMSM is essentially a PM motor, while the PMa-SynRM is basically a SynRM with enhanced performance using PMs. Note that the definitions of d- and q-axis for the two types of motors are indicated in Figure 1, and these are used for all of the analysis and results that are presented.
Traction motors should be maintained at high efficiency for a speed range that is as wide as possible. This may be achieved by employing the maximum torque per ampere (MTPA) control at low speed for peak torque and the flux weakening control at high speed. For a wider speed range, a lower back EMF is needed (i.e., lower λm), and this indicates an increase of d-axis inductance and reluctance torque referring to Equation (4) for IPMSMs [22]. For the two types of motors, the output torque can be calculated by [6]:
T = 3 2 p [ λ d ( I d , I q ) I q λ q ( I d , I q ) I d ] = 3 2 p [ λ d ( I d = 0 , I q ) I q + λ d ( I d , I q ) λ d ( I d = 0 , I q ) I d I d I q λ q ( I d , I q ) I q I d I q ] = 3 2 p { λ m (   I q ) I q + [ L d ( I d , I q ) L q ( I d , I q ) ] I d I q }
where λd and λq are, respectively, d- and q-axis flux linkage, p is number of pole pair, Id and Iq are, respectively, d- and q-axis currents excitations.
The flux linkages of the motors can be defined by:
λ m ( I q ) = λ d ( I d = 0 , I q )
λ d ( I d , I q ) = L d ( I d , I q ) I d + λ m ( I q )
λ q ( I d , I q ) = L q ( I d , I q ) I q
It can be seen from Equations (1)–(6) that a small value of m is preferred for low induced BEMF at high speed. In contrast, a large value is desirable for high torque and high efficiency. Therefore, the PMa-SynRMs may require higher total electric loading than that for IPMSMs to achieve the same torque that is required.

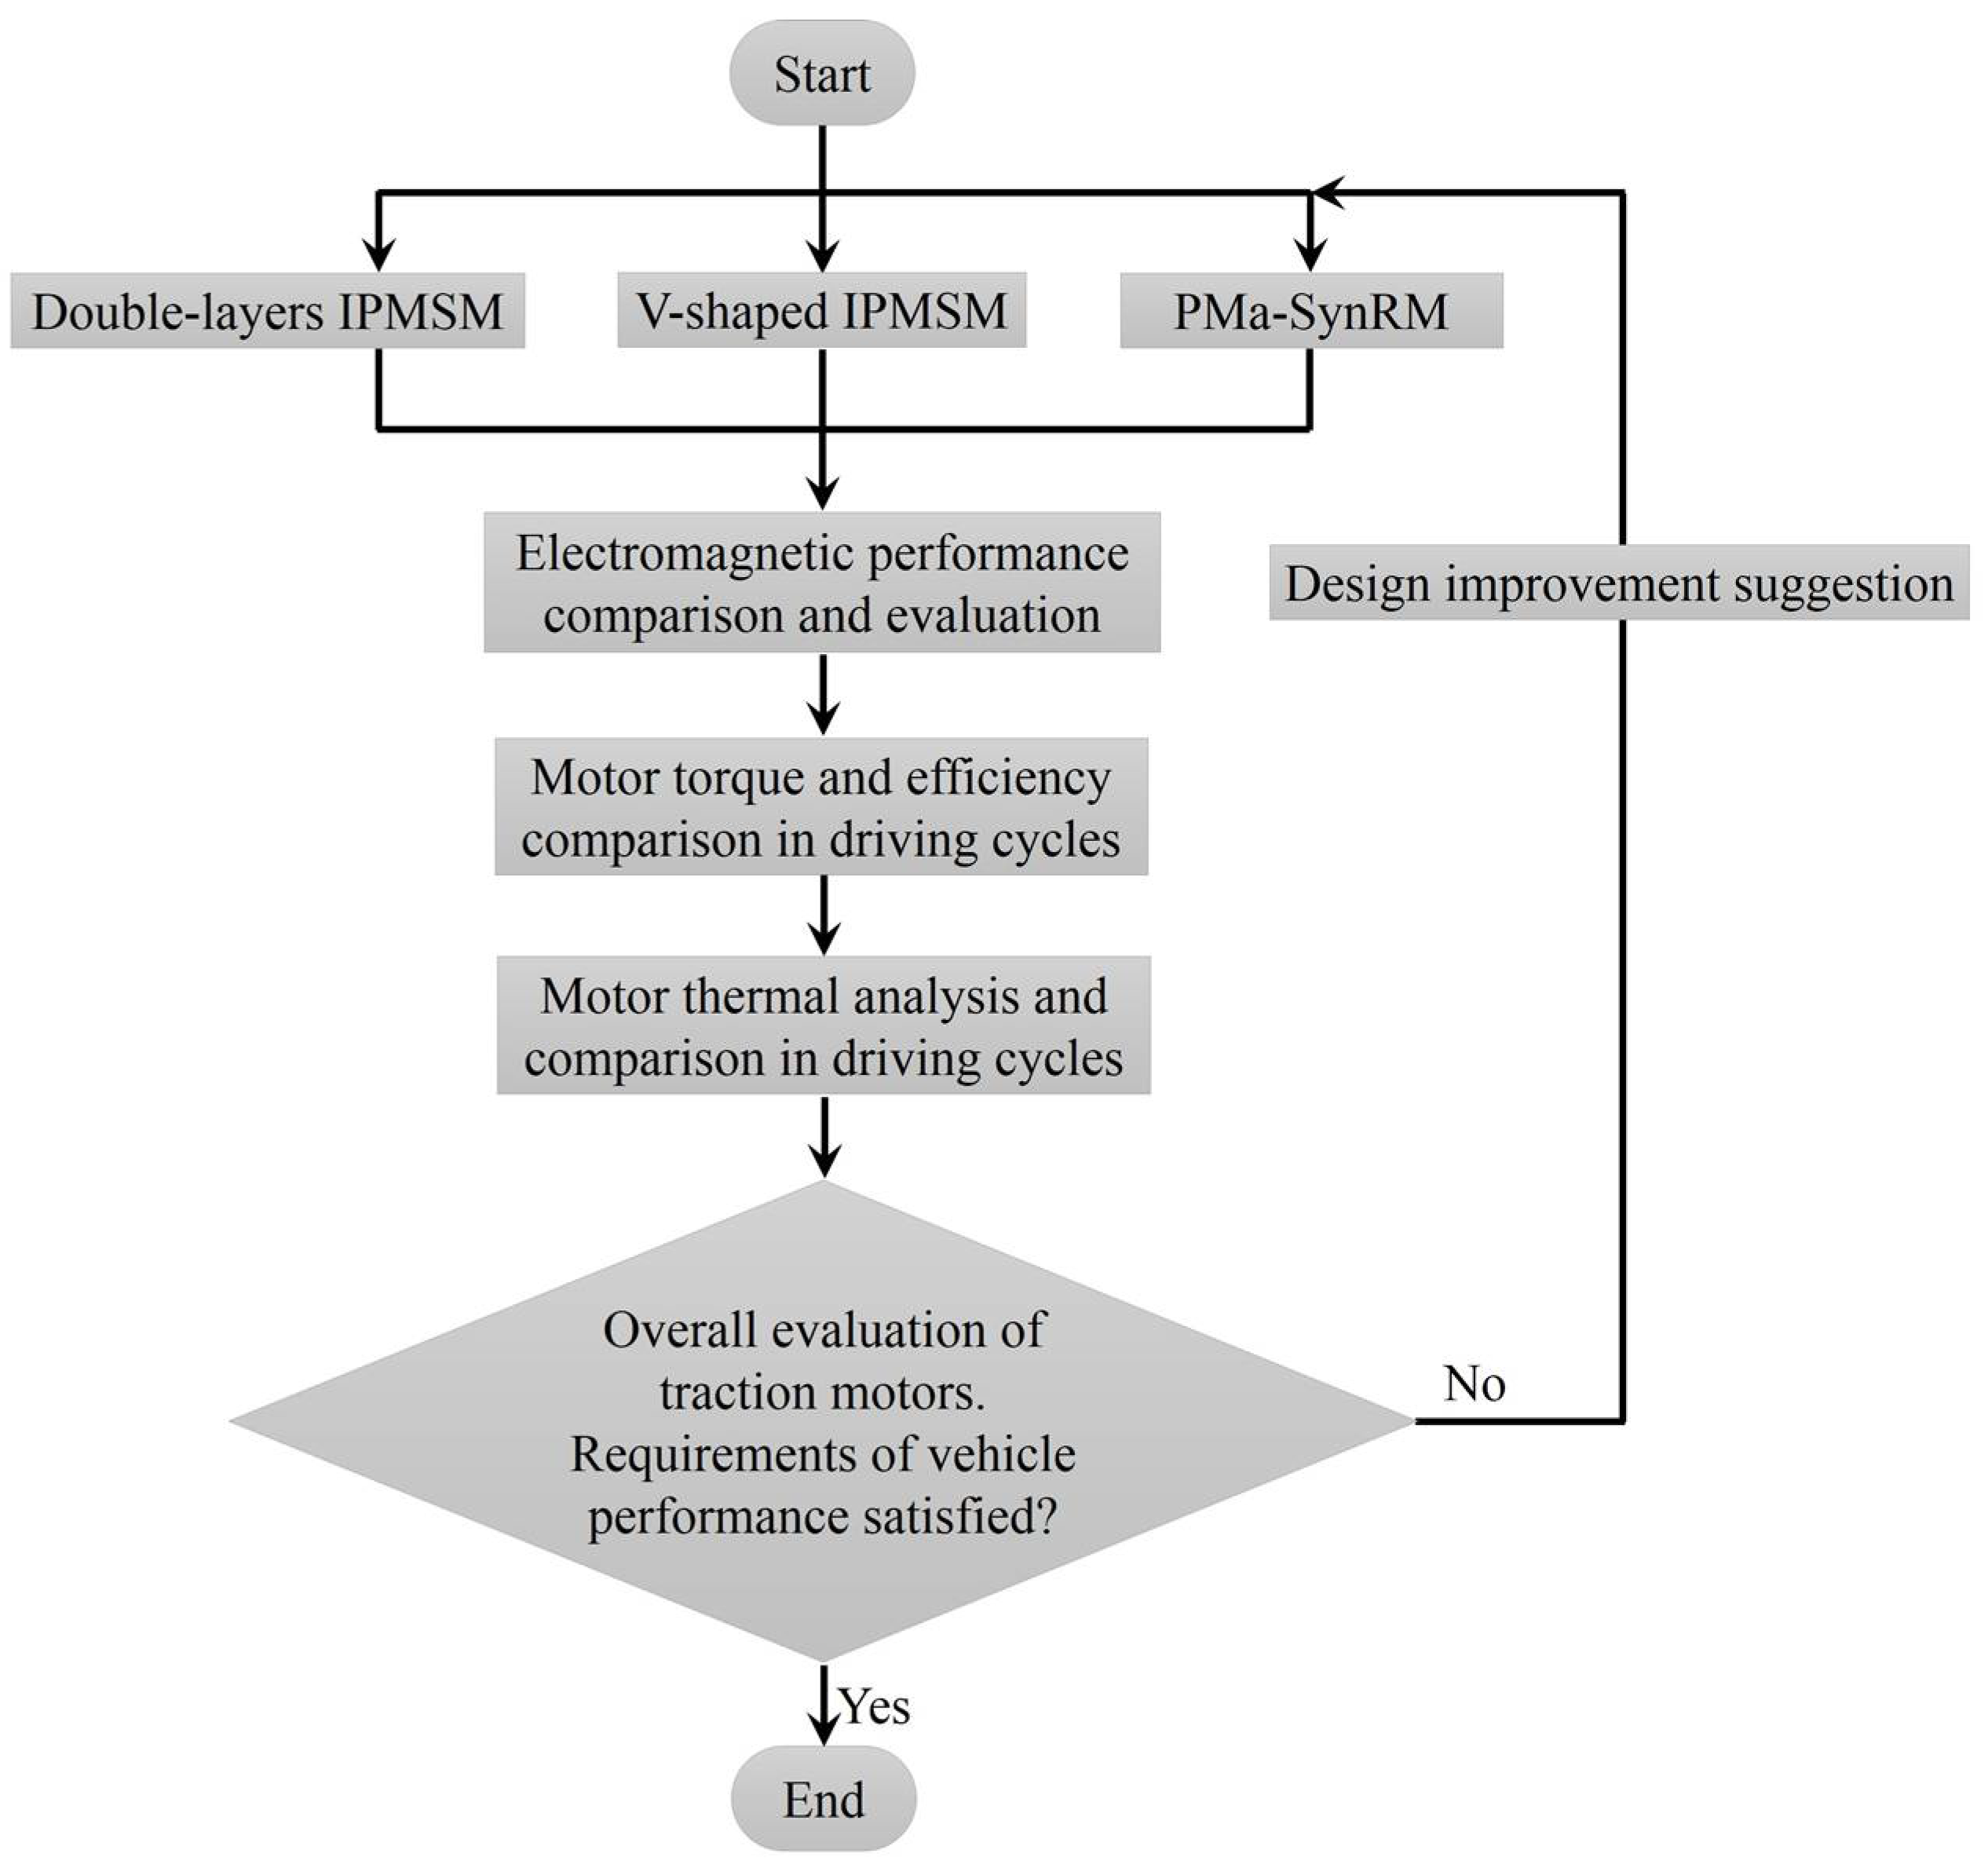
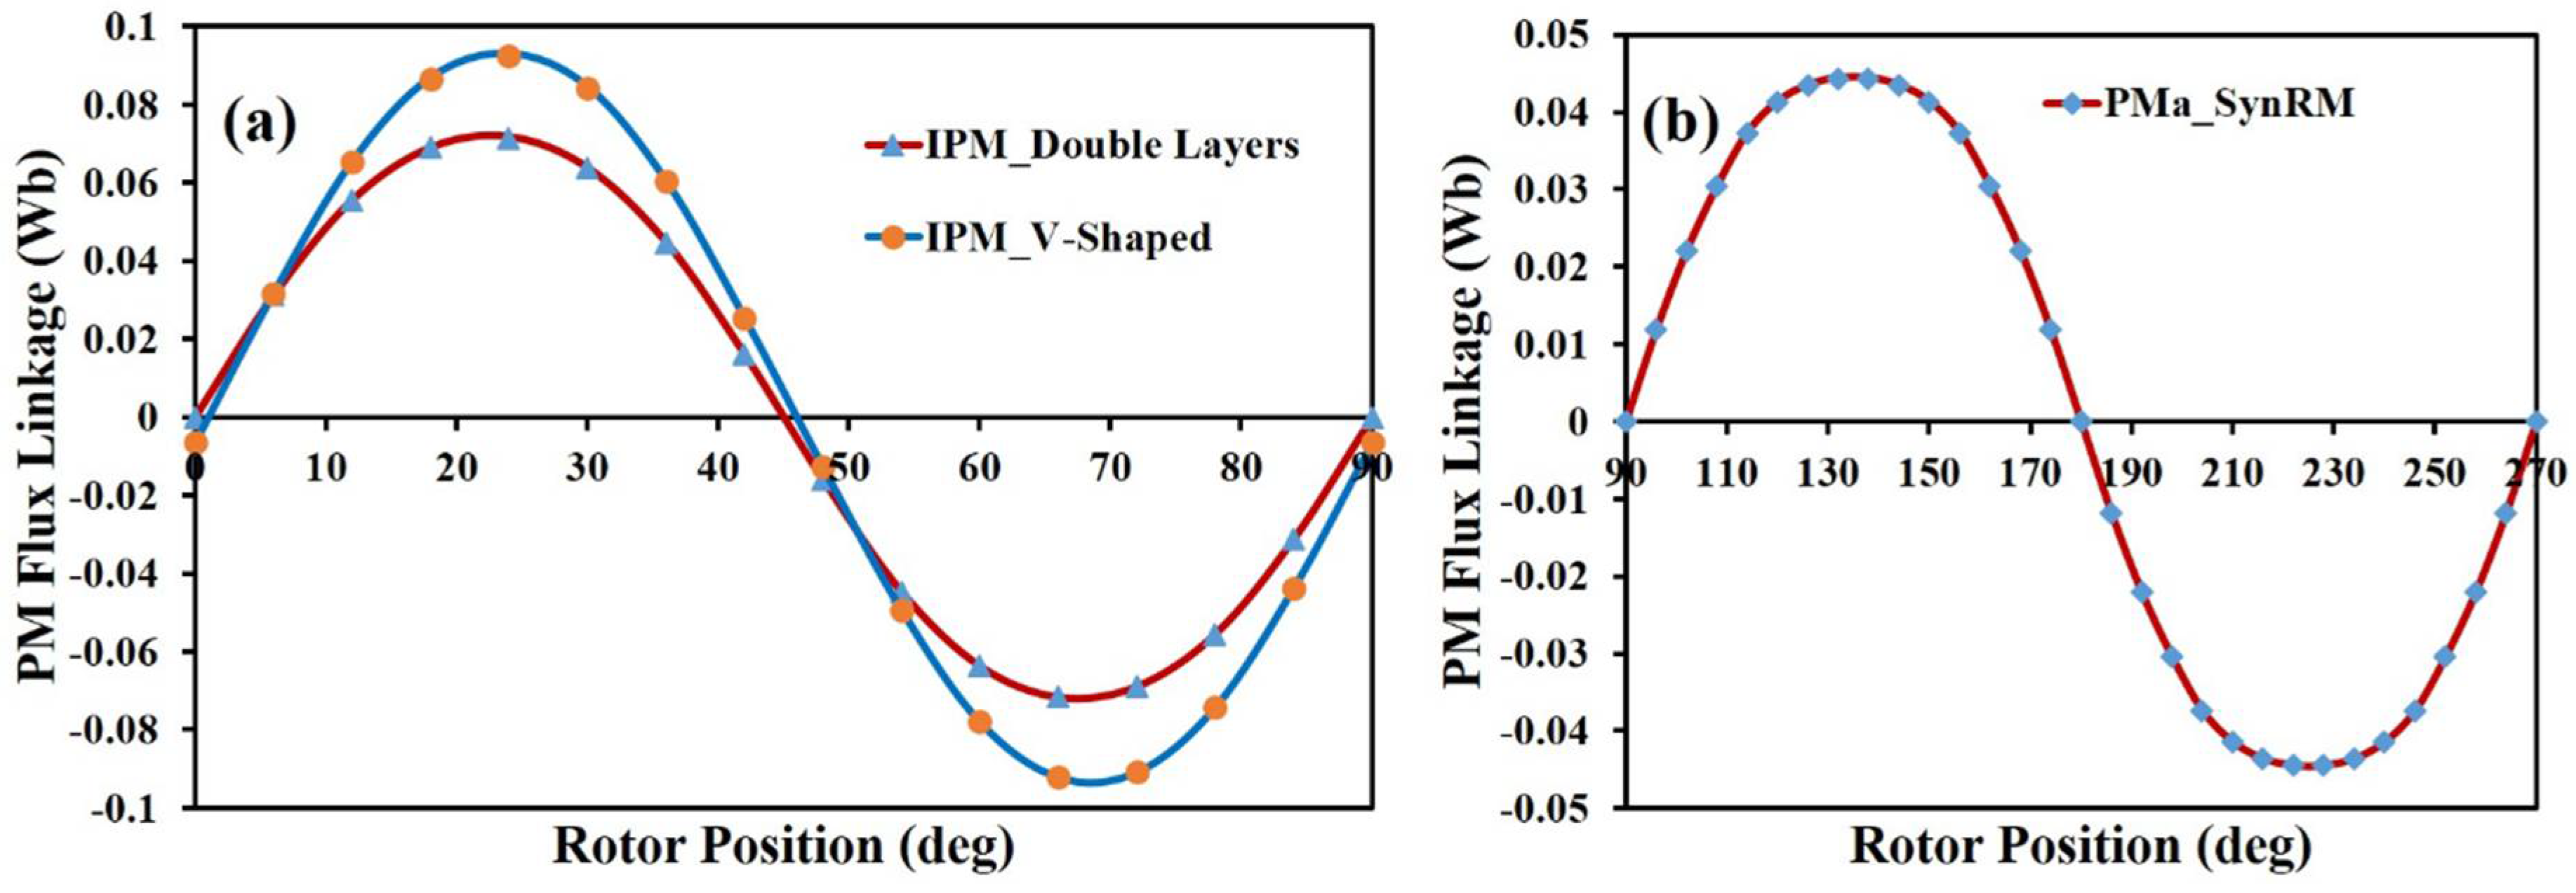
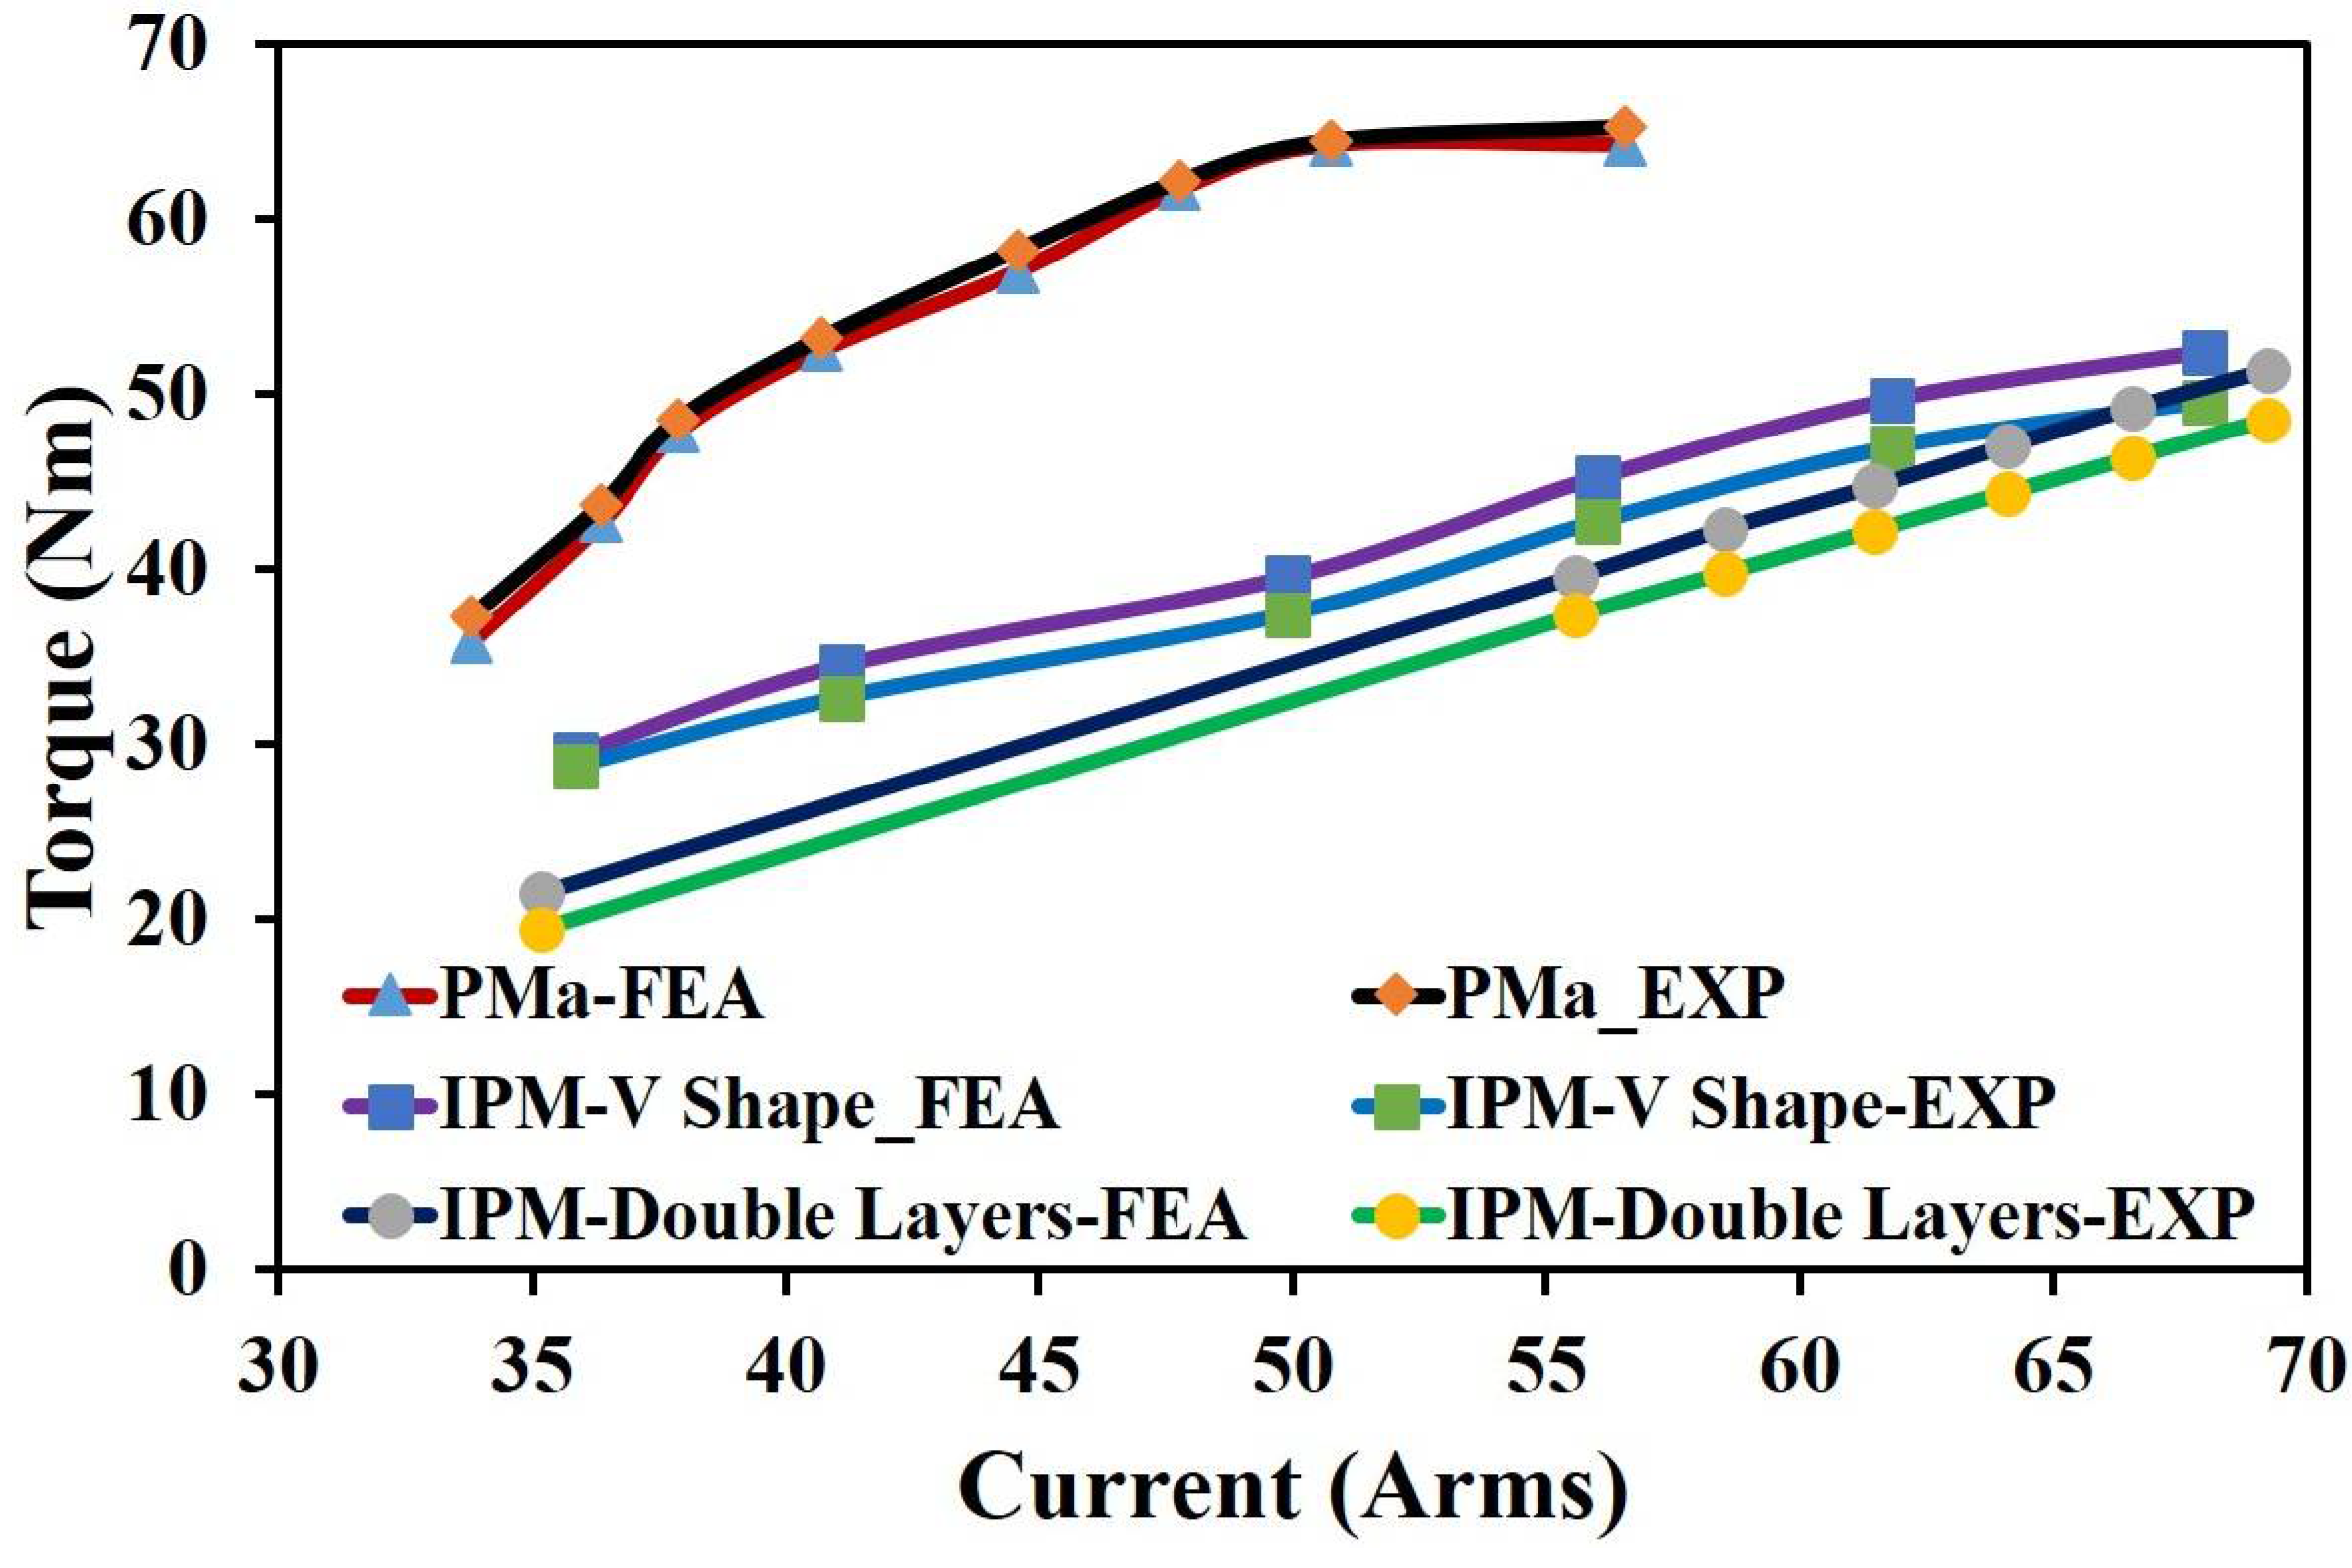
4. Performance Evaluation of Traction Motors

The design characteristics of the two types of motors under no-load and load conditions are evaluated using finite element analysis (FEA). The PM flux linkage at no-load is given in Figure 4. As can be seen in Figure 4a, the PM flux linkage of the V-shaped IPMSM is higher than that of the double-layer one. This is due to a higher amount of PM that is used in the V-shaped design. However, the total torque of the two IPMSMs is designed to be equivalent at the same current density by using full coil pitch windings on the double-layer IPMSM and the short-pitch windings for the V-shaped one. Figure 4b shows the PM flux linkage at no-load of the PMa-SynRM, which is apparently smaller than that of the IPMSM. The major torque of IPMSMs is contributed by PM flux. This is different for PMa-SynRM, whose torque mainly comes from the flux linkage that is produced by current excitation. Thus, using large amount of PM does not help improve the output torque of the PMa-SynRM, but increase the material cost [5]. Therefore, the PM volume in PMa-SynRM should be kept small, but the risk of demagnetization should be avoided by maintaining the required performance [5].
Inductance variation plays a critical role in the speed range of the IPMSM and PMa-SynRM, as indicated in Equations (4) and (5). Therefore, accurate calculation of the inductance variation in the entire operating range is necessary, especially when saturation occurs. Figure 5, Figure 6 and Figure 7 show the inductance variation for the entire operating range. As can be observed, the variation of the d-axis inductance for the double-layer IPMSM is smaller than that of the V-shaped one. This might be partially caused by the iron bridges in the V-shaped rotor that creates additional flux paths. This leads to a higher saliency ratio and a wider speed range for the double-layer case, where the saliency ratio S is defined as:
S = L q / L d
for IPMSM, or
S = L d / L q
for PMa-SynRM. The inductance variation in Figure 7 shows a high saliency ratio of the PMa-SynRM. This indicates that the high reluctance torque can help to maintain the operation at high speed for the PMa-SynRM.
Figure 8 shows the flux linkage characteristics of the IPMSM (double-layer) with different current excitations and phase angles that were calculated using Equations (7)–(9) based on the PM flux linkage and inductance previously obtained. It is observed that the IPMSM can be potentially demagnetized with high current excitation and deep flux weakening. Therefore, the armature current, current angle, torque for MTPA control, and flux weakening operations should be carefully analyzed in order to achieve a sufficient and safe speed range. Figure 9 and Figure 10 show the calculated armature current, current angle, and torque characteristics of the IPMSM for wide speed range. At the armature current below 54.8 A, the IPMSM cannot achieve the maximum speed (7000 rpm), as shown in Figure 10. This is because the low armature current cannot sufficiently weaken the PM flux to extend the operating speed within the voltage limit. The PM flux can be effectively weakened for the armature current greater than 54.8 A (current density 9.7 Arms/mm2), for the cases beyond which a wide speed range can be reached with the voltage limit. Beyond the base speed, the armature current is maintained and the current phase angle is increased for flux weakening until the maximum speed. Note that the base speed depends on the voltage or the power limit. High armature current would also lead to a low base speed. Figure 10 shows that the IPMSM hits the voltage limit at a base speed of 2500 rpm (achievable base speed), an armature current of 54.8 A, and a current density of 9.7 Arms/mm2 without force cooling. Nevertheless, the speed range of the IPMSM can be enhanced if better cooling is used so that more current can be input to improve the torque at high speed.
Contrarily, the PMa-SynRM can achieve the maximum speed (7000 rpm) with low armature current (lower than 40 A) for the MTPA and flux weakening operations, as shown in Figure 11 and Figure 12. This is due to the low PM flux linkage, which can be easily weakened with a small armature current. Therefore, the torque-speed curve can be extended under voltage limit to a high speed. However, the base speed reduces at maximum torque where the voltage saturates due to the high current and winding resistance. The high current weakens the PM flux and it increases the reluctance torque, leading to speed extension under the voltage limit.

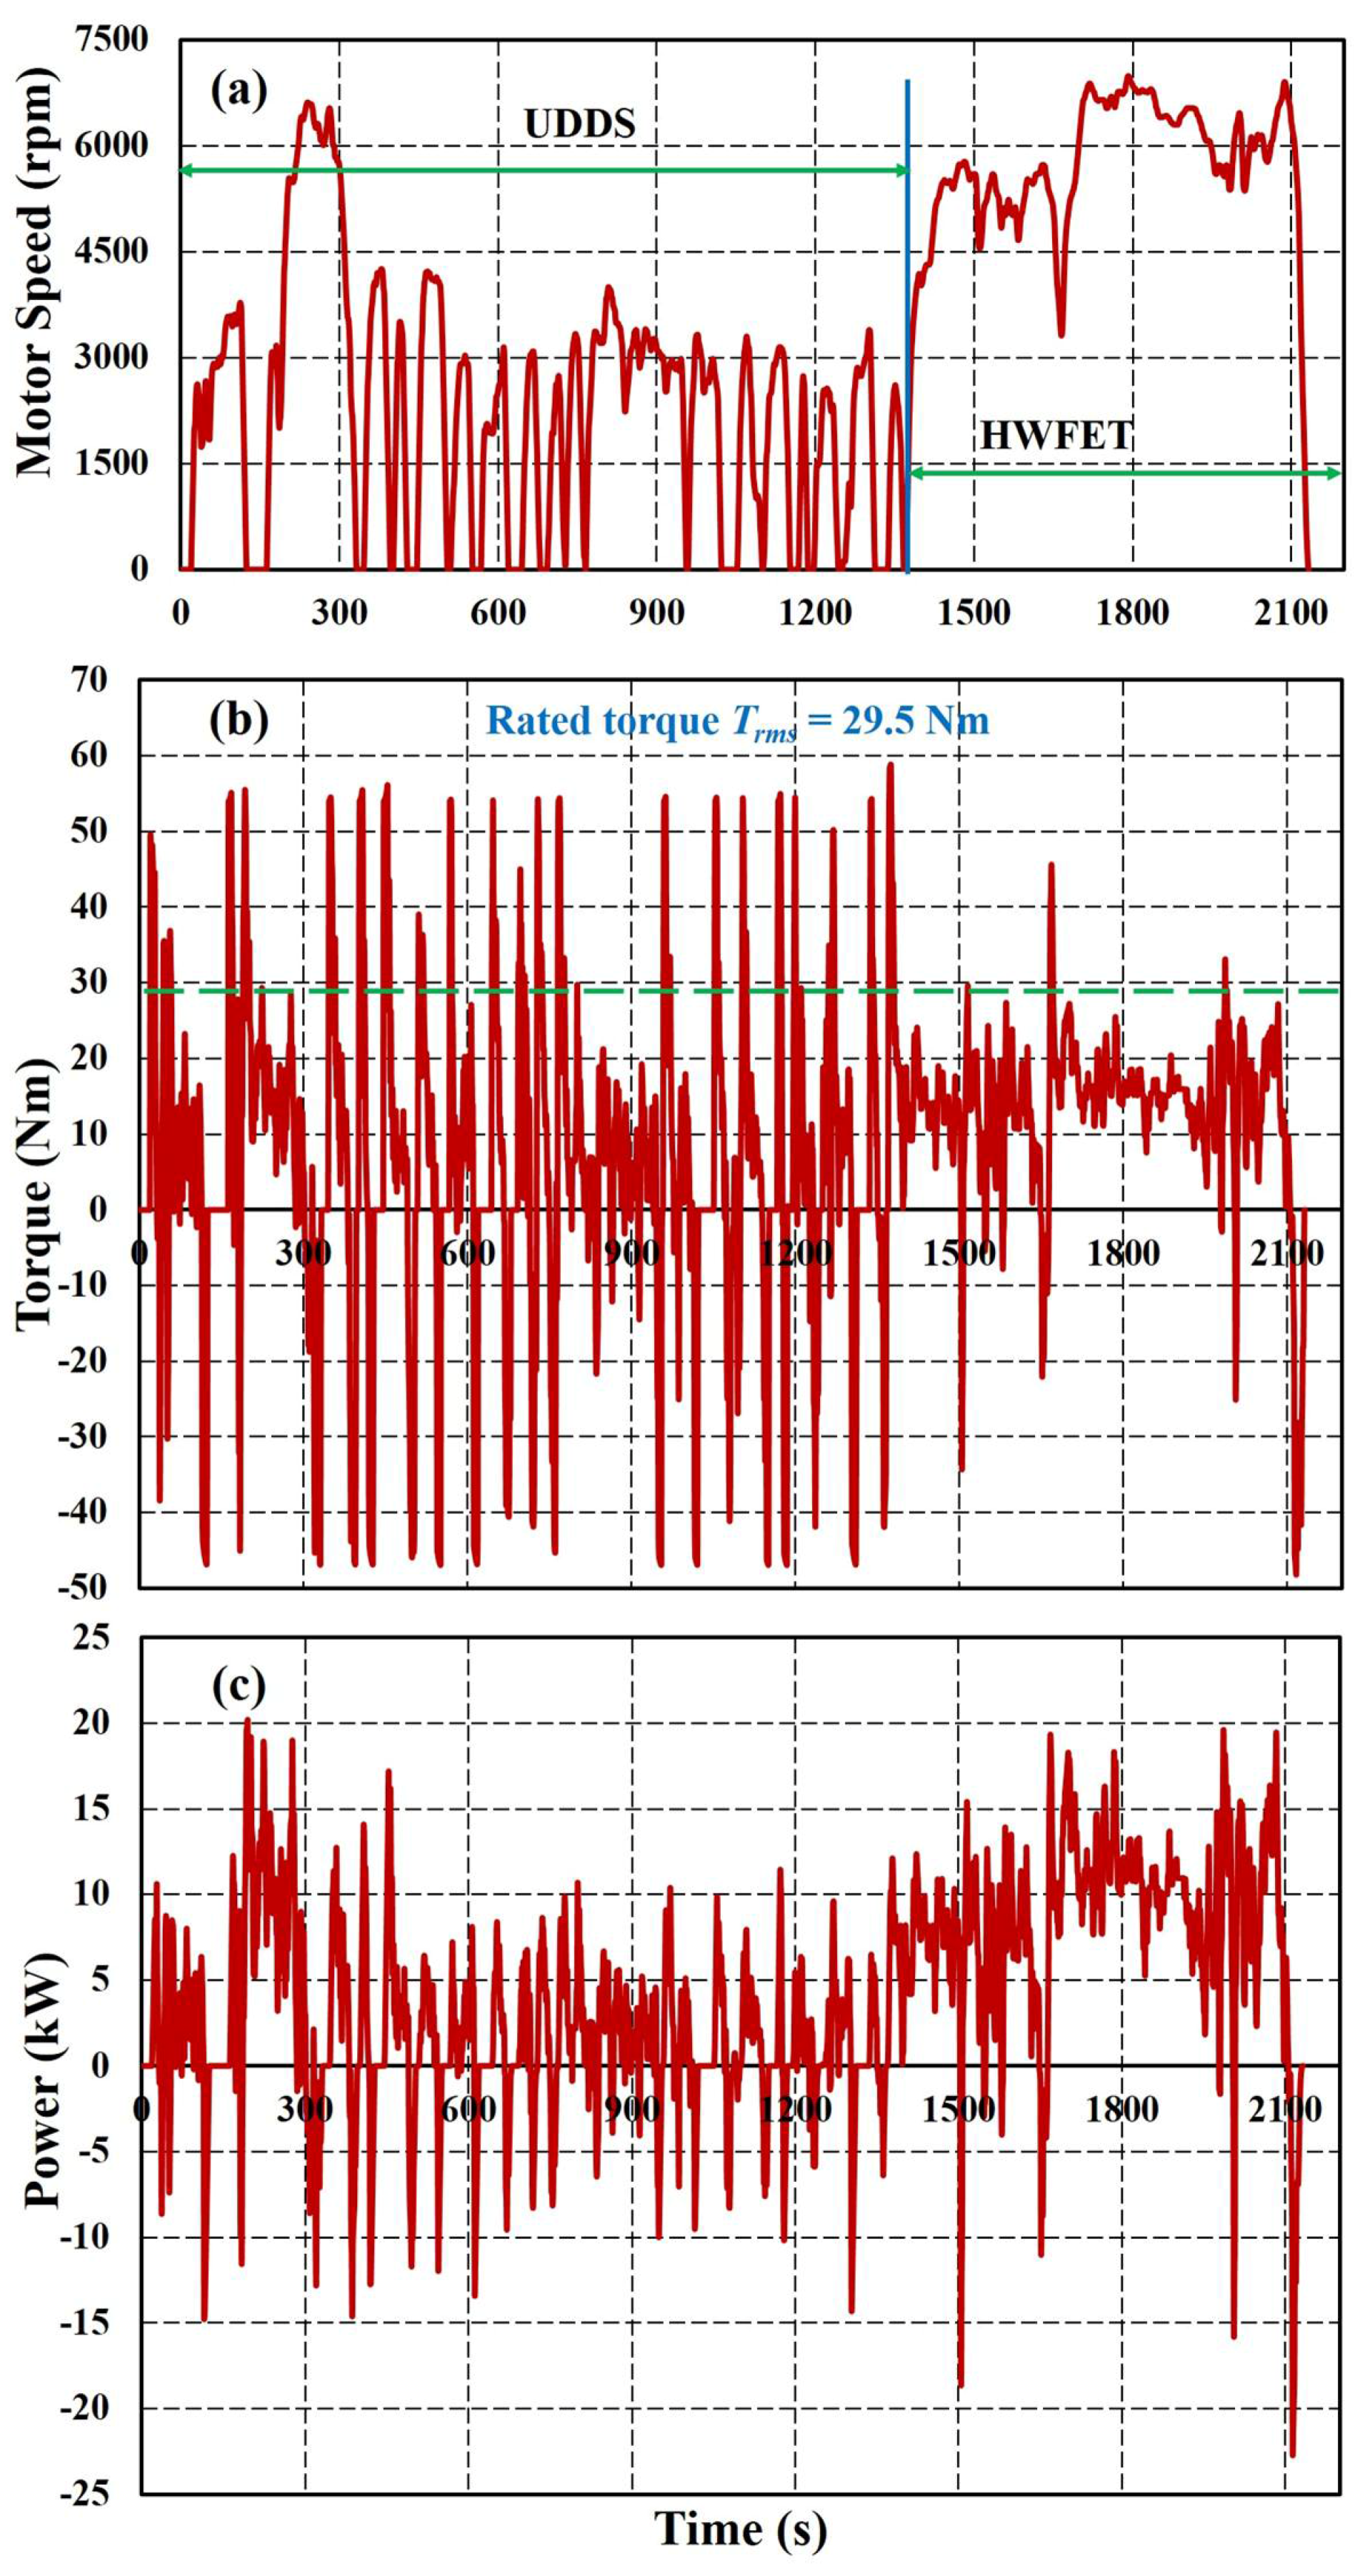
5. Driving Cycle Applications

The combination of UDDS and HWFET driving cycles is used to evaluate the traction motor performance based on the vehicle specifications, including the battery and the drivetrain properties, as shown in Table 2. The combined UDDS and HWFET is converted into traction motor speed, as shown in Figure 13a. The UDDS is suitable for urban lightweight vehicles with 23 start-stop cycles and a maximum speed of 91.2 km/h. There are two phases of speed: a “cold start” phase of 505 s for a distance of 5.78 km with 41.2 km/h average speed, and a “transient phase” of 864 s in the total duration of 1369 s. The HWFET is used to test the thermal condition of the traction motors without stop cycles. It is suitable for highway driving with an average speed of 77 km/h and a peak speed of 97 km/h in a total duration of 765 s and 16.45 km route [16].
The torque of the traction motor should be generated and delivered to satisfy the vehicle dynamics during the operation of the prescribed driving cycles, i.e., short-term overload (peak) torque output for acceleration/climbing, and the effective energy utilization in the medium- and high-speed ranges. Therefore, the root-mean-square (RMS) torque is defined to relate the operating condition to the thermal limits of the traction motors in the driving cycle, as given by [8]:
T r m s = 1 t c y c l e t 1 t 2 T 2 ( t ) d t
where tcycle is the time period of the entire driving cycle and T(t) is the instantaneous torque.
Figure 13 shows the motor speed, load torque, and power in the motor mode, and the regenerative braking mode over the combined UDDS and HYFET driving cycles, where the maximum speed is 97 km/h. It can be seen that for the target vehicle, the driving cycle requires a maximum torque and peak power of approximately 60 Nm and 20 kW, respectively. However, the RMS torque is about 29.5 Nm and the average power is only 5.4 kW for the whole cycle. Note that the torque and power that is required by the vehicle calculated above is assumed to be evenly shared by the front and rear motors, as seen in Figure 2. Therefore, the motor specifications in Table 1 satisfy this vehicle if the prescribed driving cycles are used. The performance of the IPMSMs and PMa-SynRM will be evaluated based on the torque and power that is required for the prescribed driving cycles. Note that, practically, this lightweight vehicle may not be suitable for highway driving. However, it would make a useful reference if the highway driving can be included in the analysis for design considerations of traction motors.

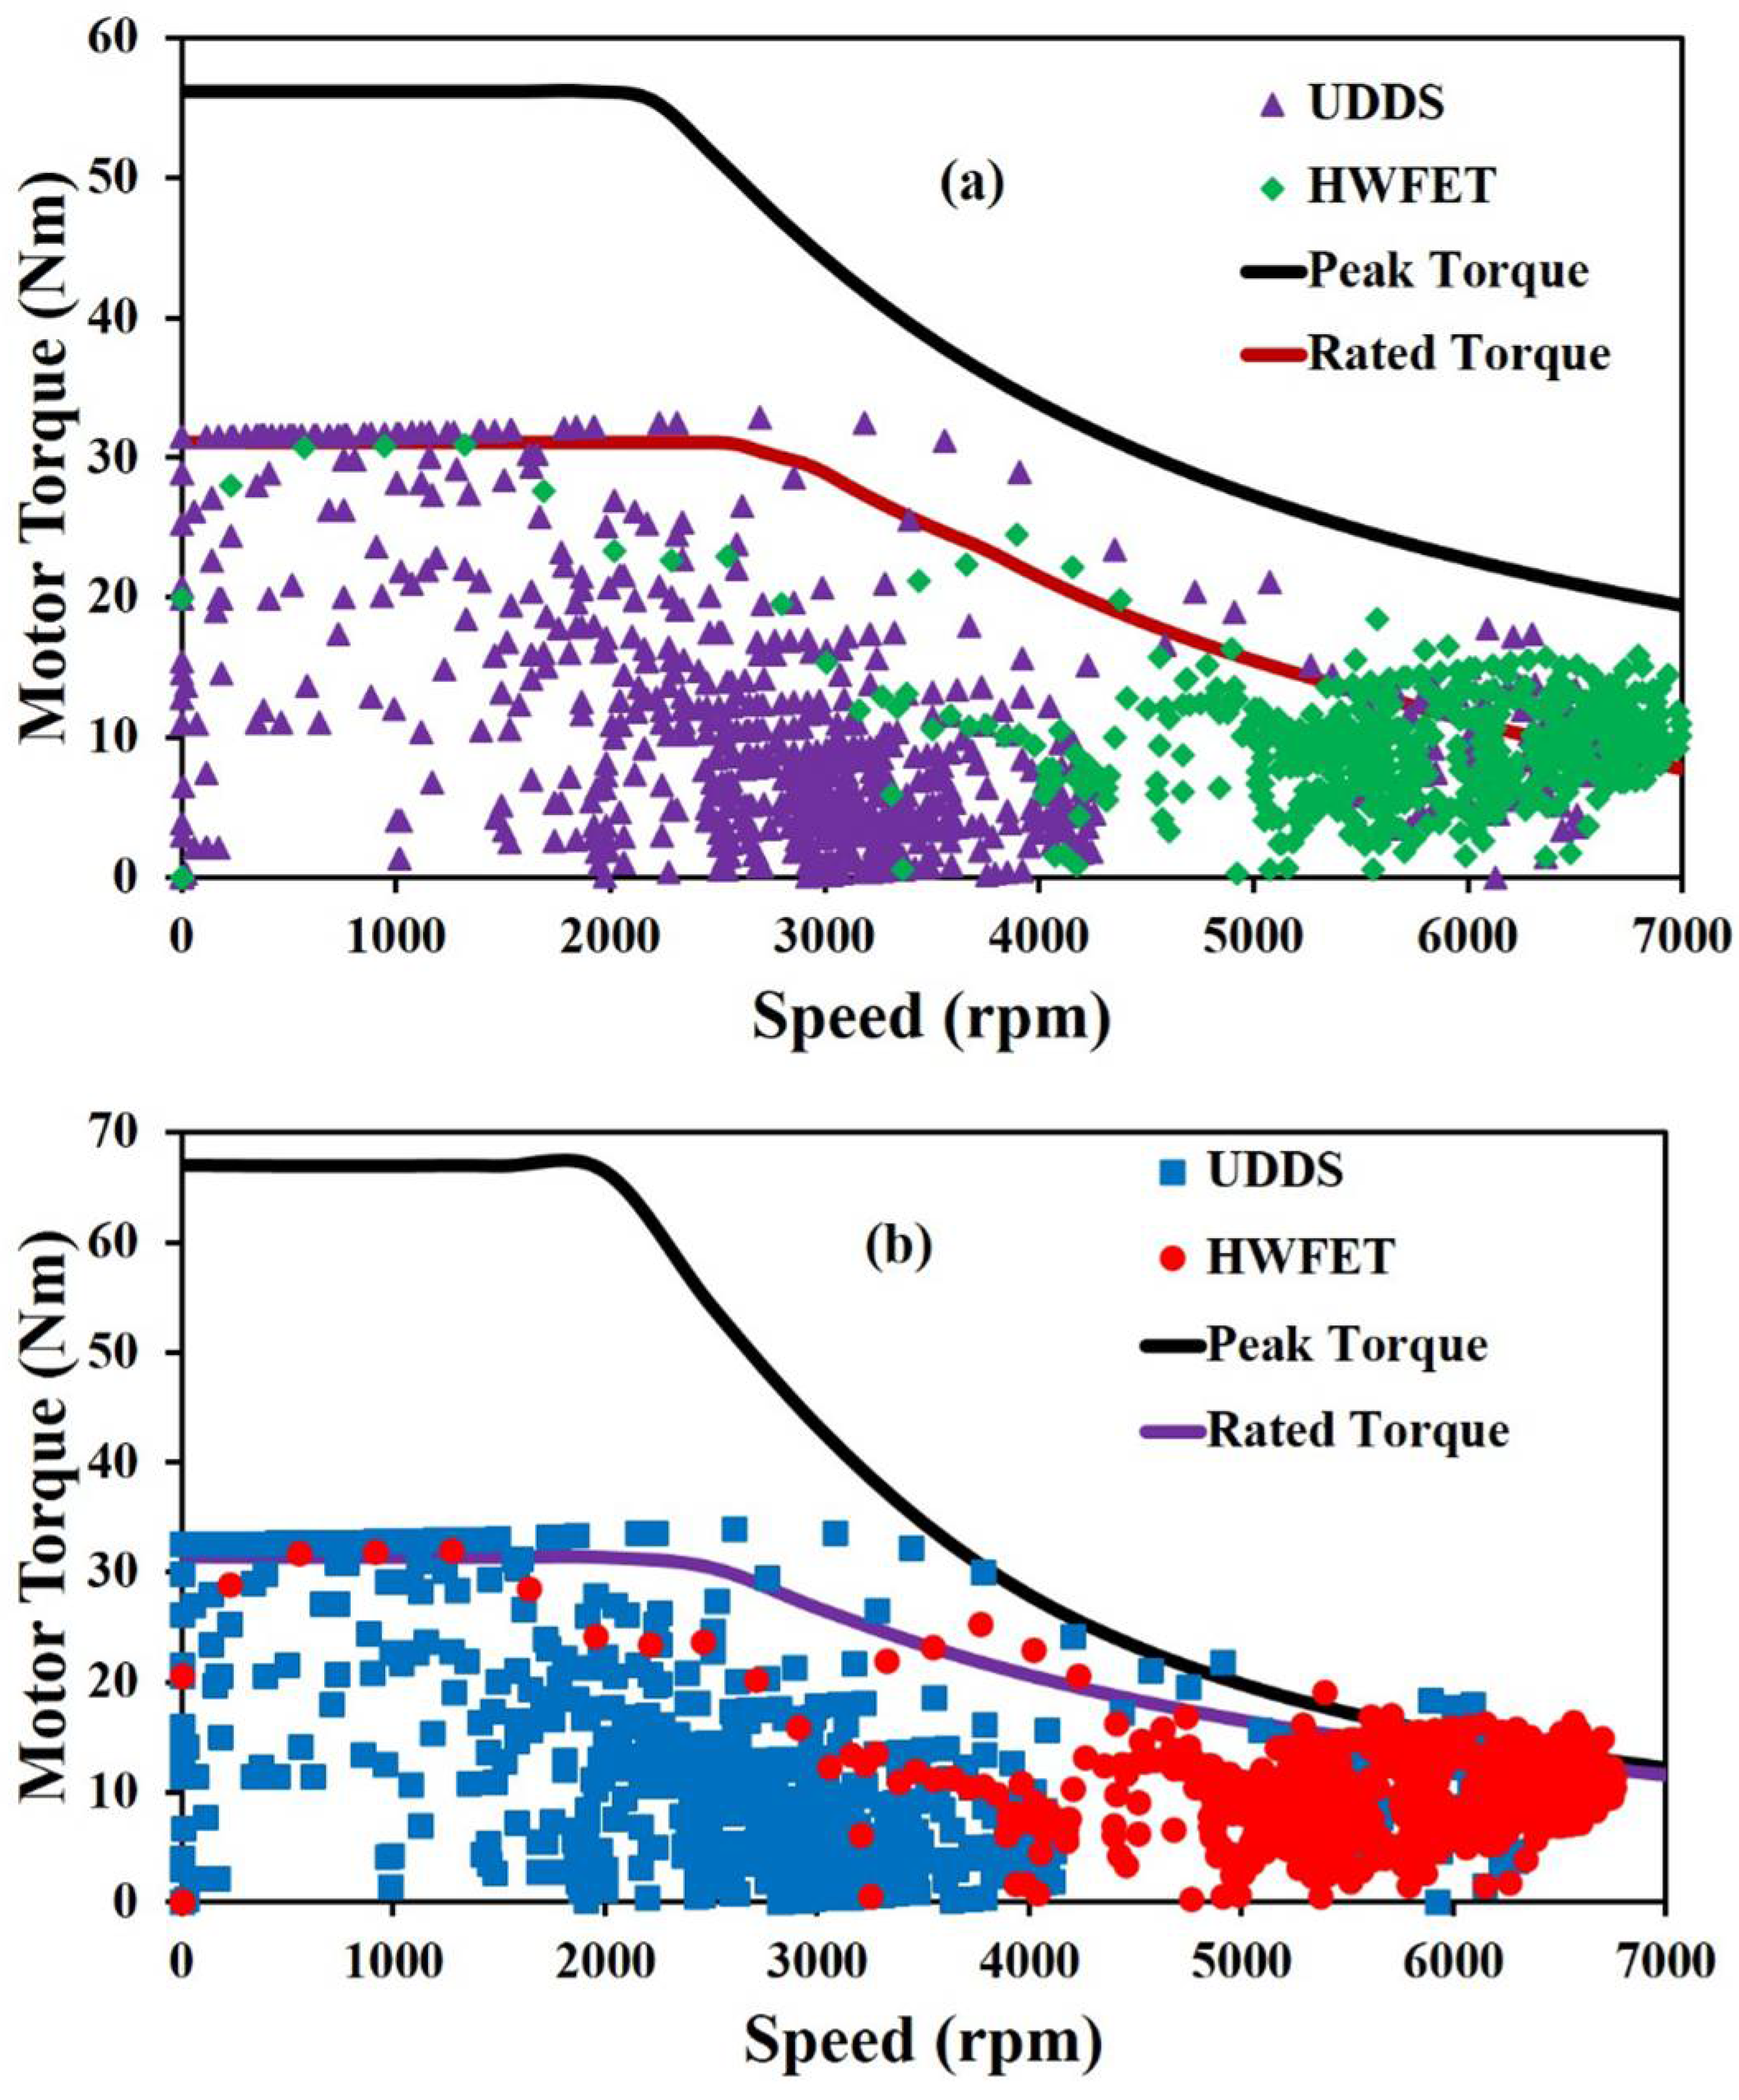
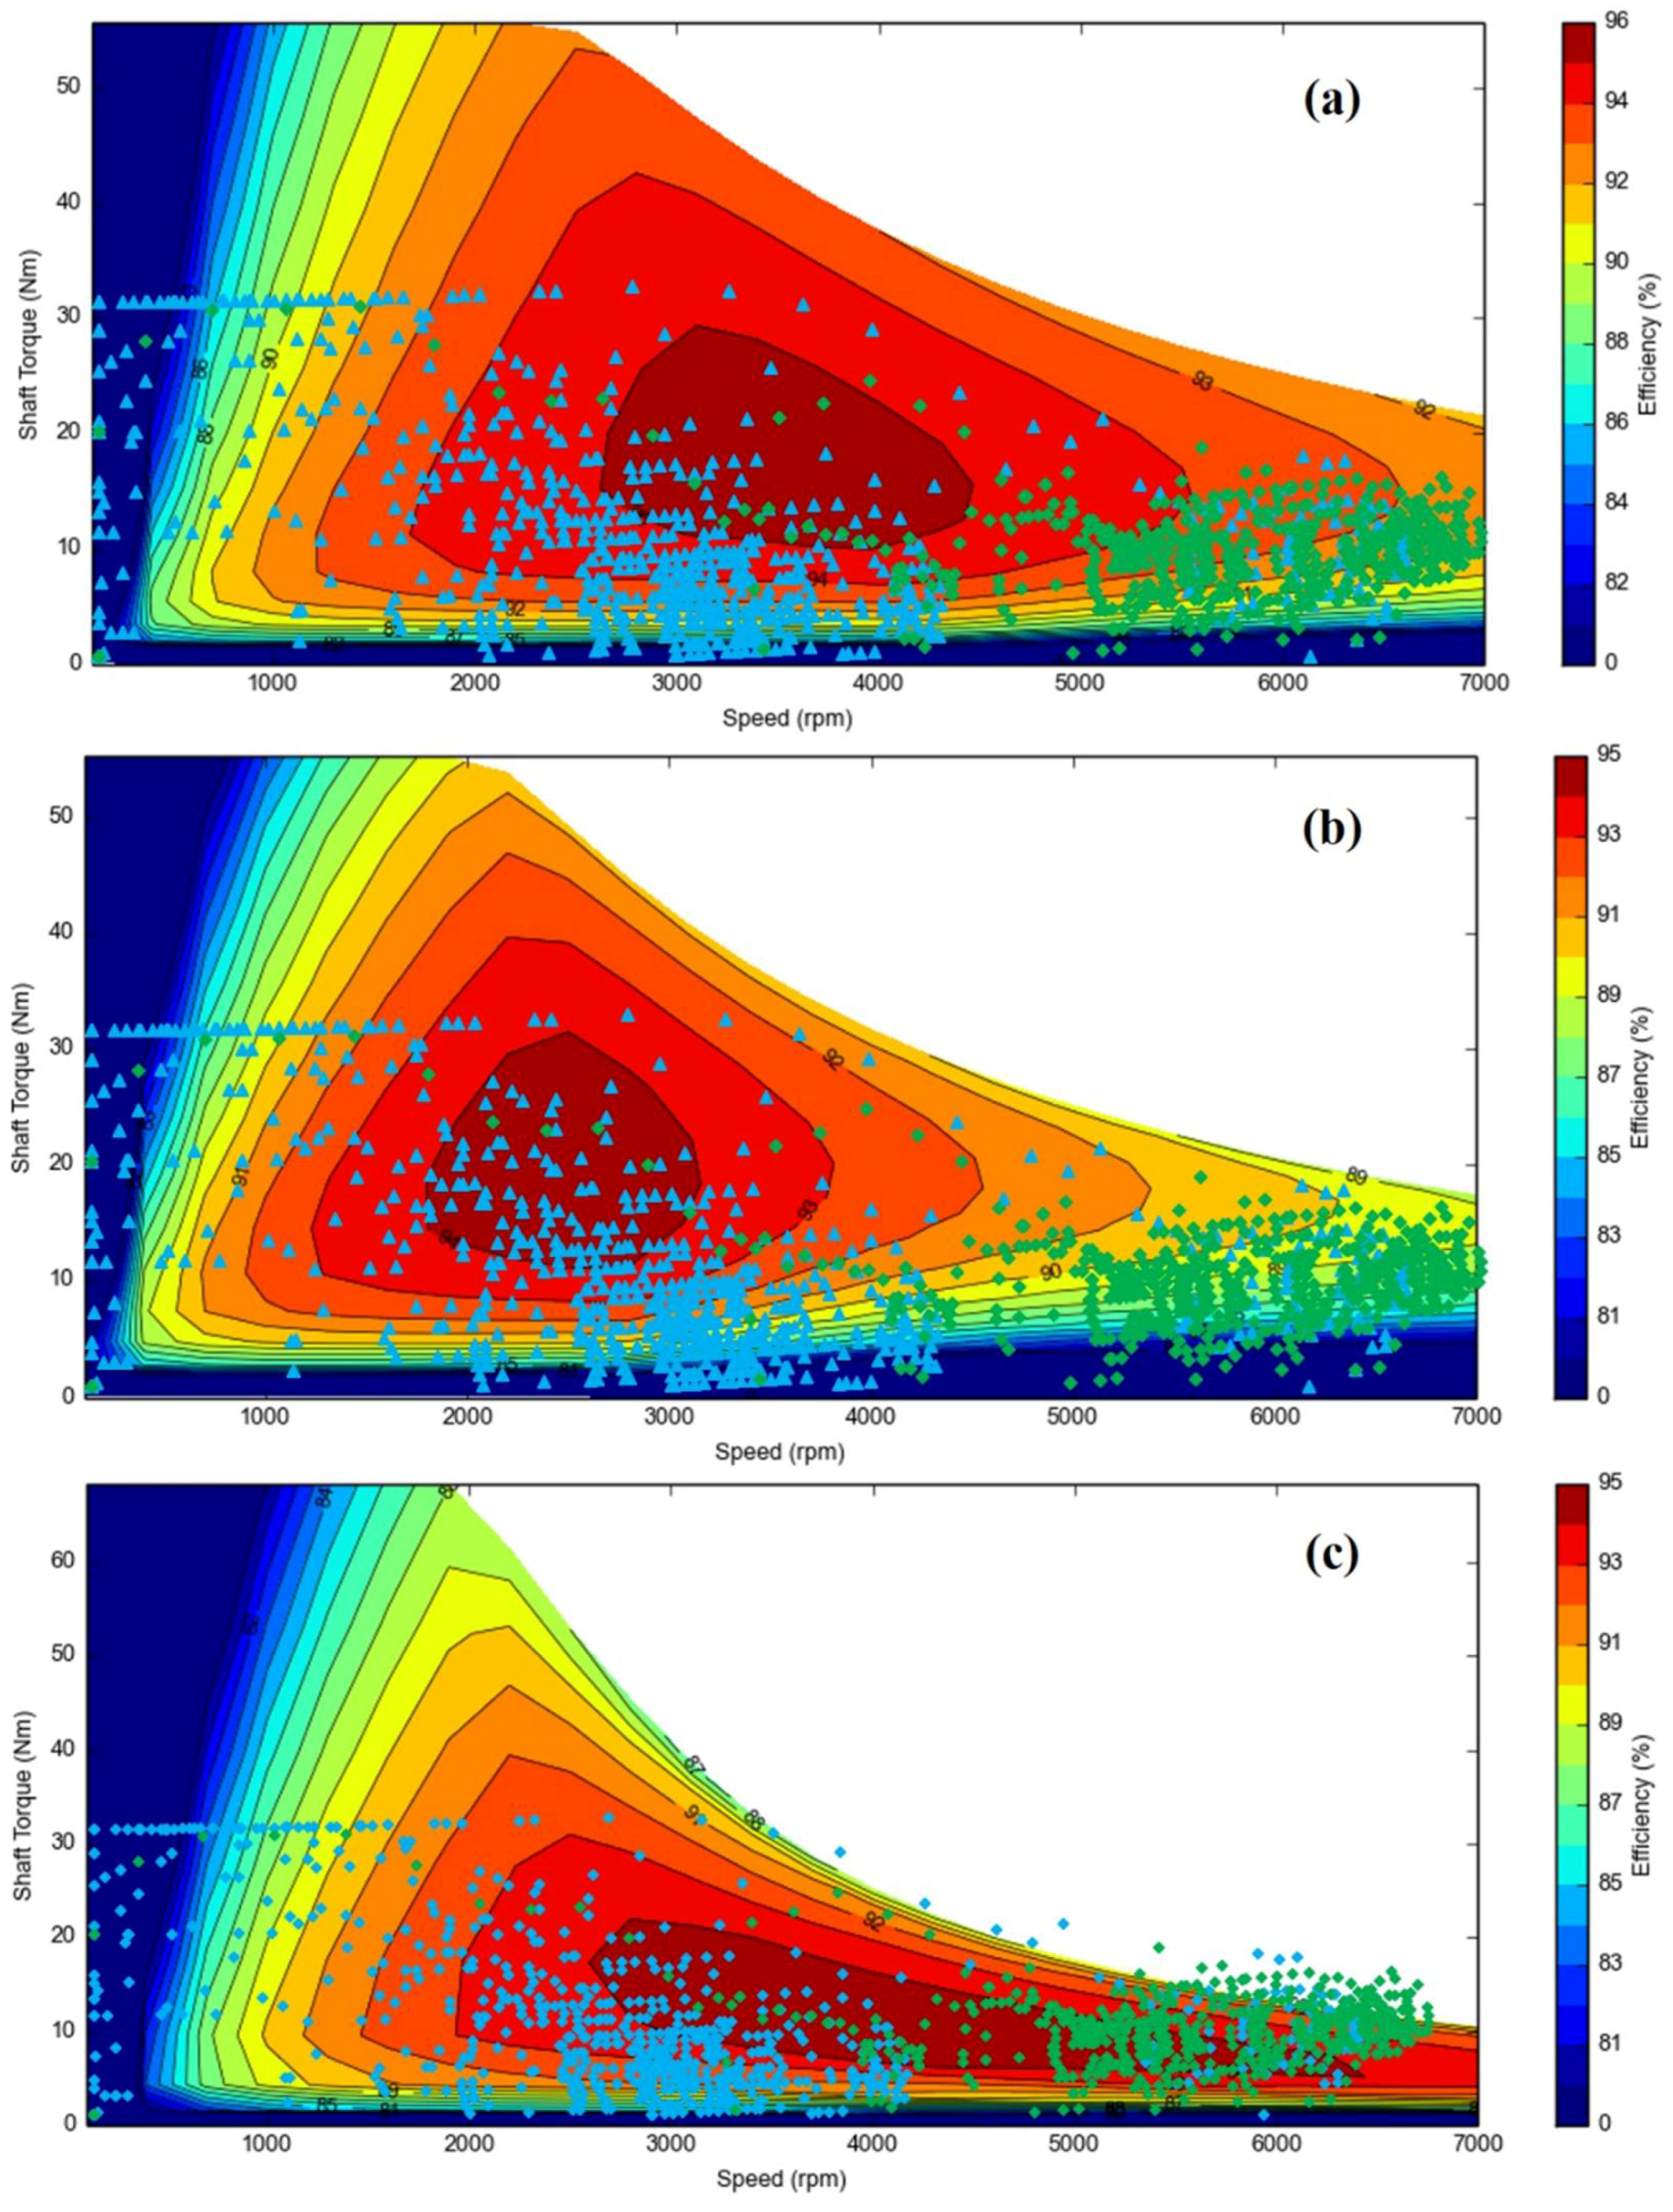
6. Comparison of Motor Performance in Driving Cycles

Again, the FEA (JMAG software) is used for simulation of the motor electromagnetic performance. Figure 14 shows the torque-speed curves of the IPMSM (double-layer) and PMa-SynRM under the peak and continuous conditions, where the maximum torque of the IPMSM and PMa-SynRM is 57 Nm and 68 Nm, respectively. The rated conditions of the motors should be determined using thermal analysis, which will be discussed later. Nevertheless, at this stage, the rated torque of both types of motors is preliminarily determined by the root-mean-square torque that was calculated from the driving cycles using Equation (12), which is 29.5 Nm. Then, beyond the rated torque in Figure 14, the speed gradually increases by increasing the current angles for flux weakening with the same current amplitude. Thus, the two IPMSMs have similar characteristics.
It can be seen in Figure 14, that, under the UDDS and HWFET driving cycles, some operating points are higher than the rated conditions of both the IPMSM and PMa-SynRM. For the PMa-SynRM, some operating points are even out of the maximum capability. This appears that the 10 kW PMa-SynRM is insufficient for high speed operation of the vehicles due to the small torque. Even for the IPMSM, the rated power is slightly too low for high speed driving. It should be noted that operation in highway mode usually lasts for a long period so that the rated condition of the traction motors should cover this driving cycle. From the previous results, it is found that the PMa-SynRM seems to be suitable for low speed operation, such as urban bus, since its output power drops at high speed. In contrast, the IPMSM can be easily improved for high speed operation by improving the cooling capability or modifying the design (no forced cooling so far). This accounts for the importance of thermal design and analysis, which will be discussed later. Note that the data sampling time is one second for all of the operating points of both driving cycles (i.e., all of the dots in Figure 14).
Figure 15a,b shows the efficiency map of the double-layers and the V-shaped IPMSMs. The highest efficiency (dark red regions) for the two cases is beyond 96% and 95%, respectively, and this is within a speed range of 2000 rpm to 4000 rpm and a torque lower than 30 Nm. The double-layers IPMSM has a slightly higher efficiency for a wider operating range than the V-shaped one. This could be due to a higher total Ampere-turns for the V-shaped IPMSM. For the two IPMSMs, the operating points for the UDDS driving cycle (blue dots) mostly locate around 2000 rpm to 4000 rpm, where the high efficiency region is. Meanwhile, the operating points for the HWFET driving cycle (green dots) fall within the lower efficiency regions, ranging from 5000 rpm to 7000 rpm for the two IPMSMs. This may be caused by a large part of the armature current that is used to weaken the flux at high speed where deep flux weakening is required (Figure 8). Contrarily, the PMa-SynRM achieves higher efficiency at high speed due to the reduced armature current, as shown in Figure 15c. Therefore, it is suitable for the HWFET and the higher speed operating points of the UDDS in terms of efficiency. The maximum efficiency is 95% beyond 2000 rpm and it is maintained until the maximum speed. However, this PMa-SynRM requires a redesign or decent forced cooling in order to fully cover the operating points of the driving cycles. Again, the data sampling time is also one second here.

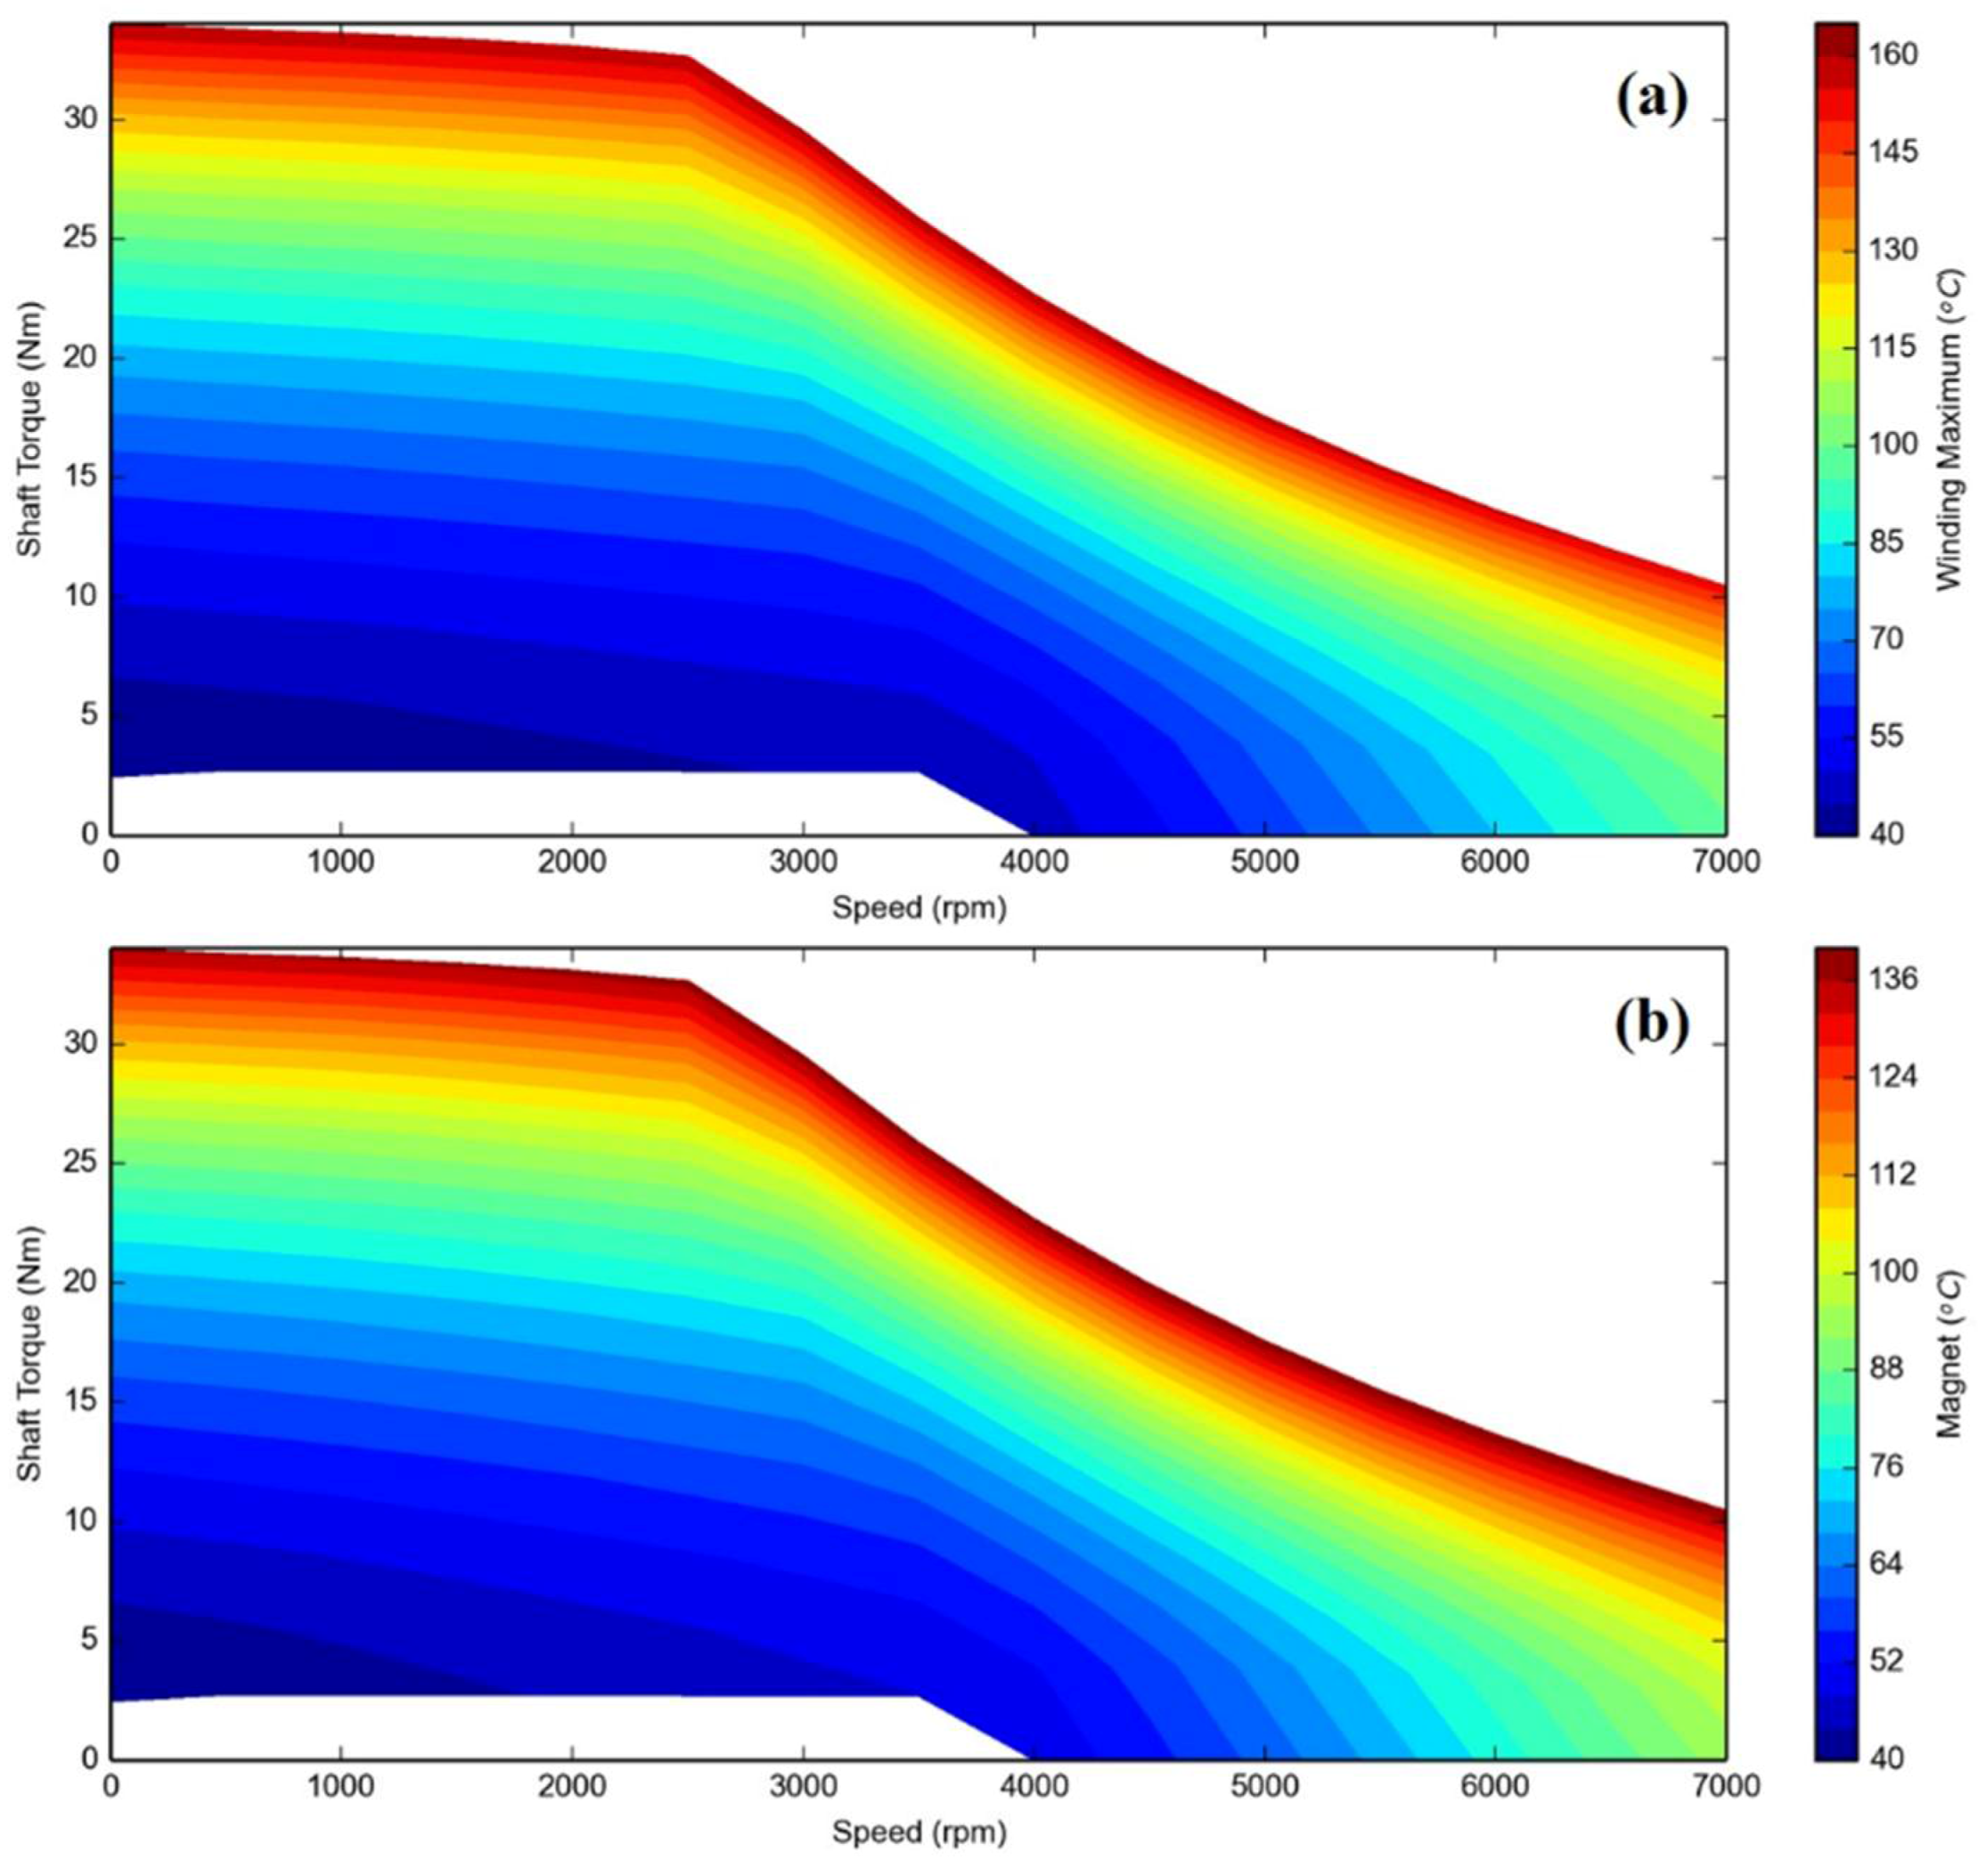
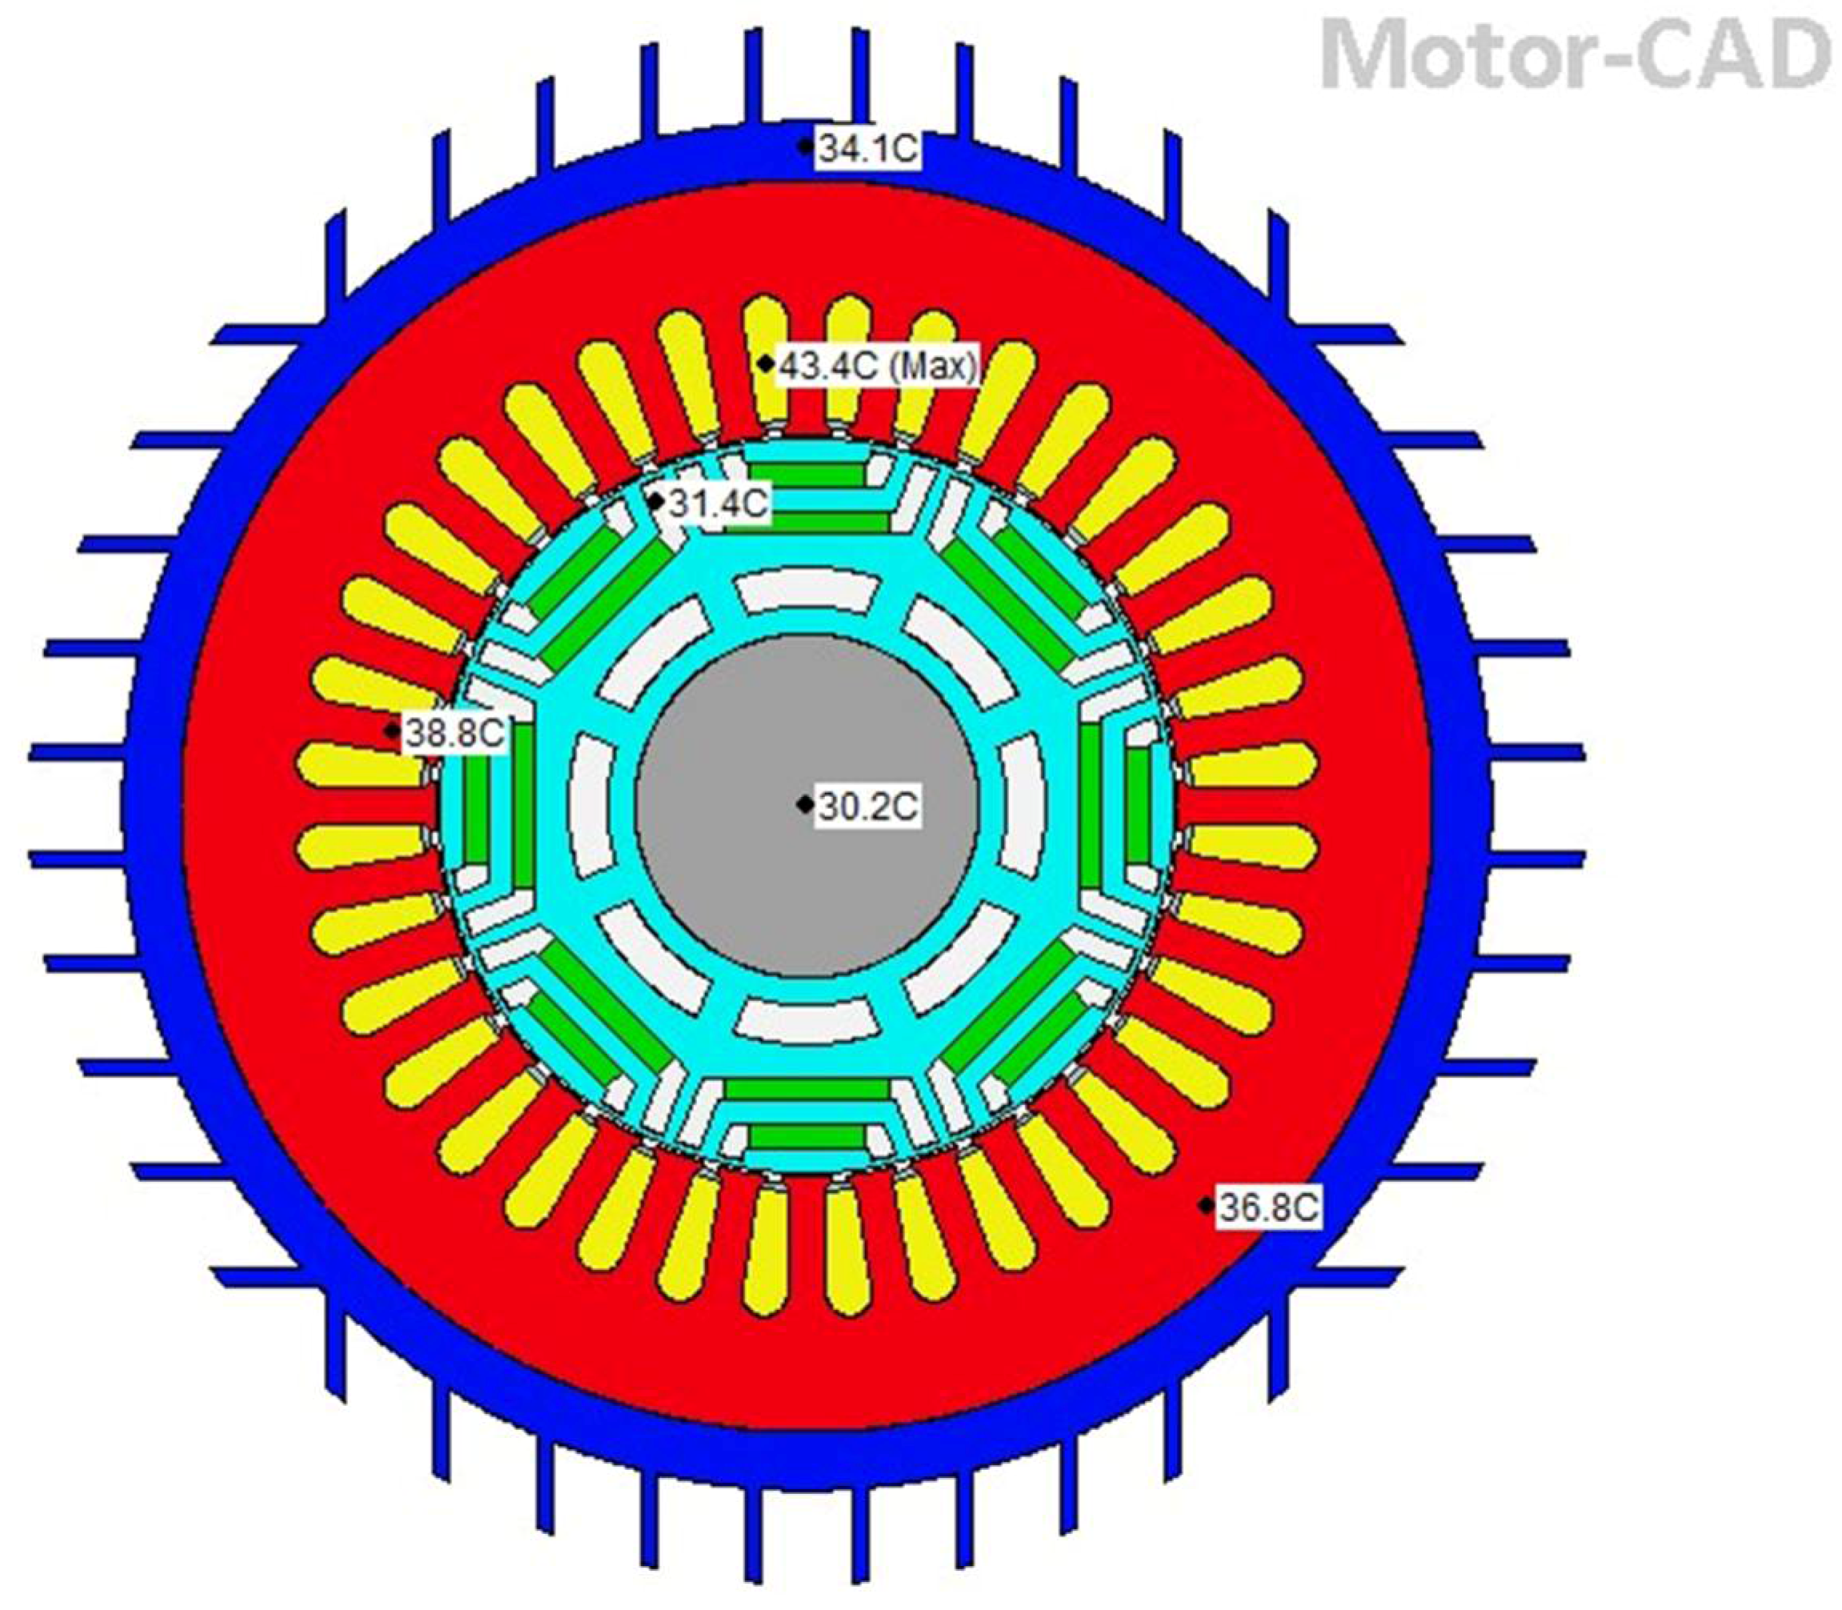
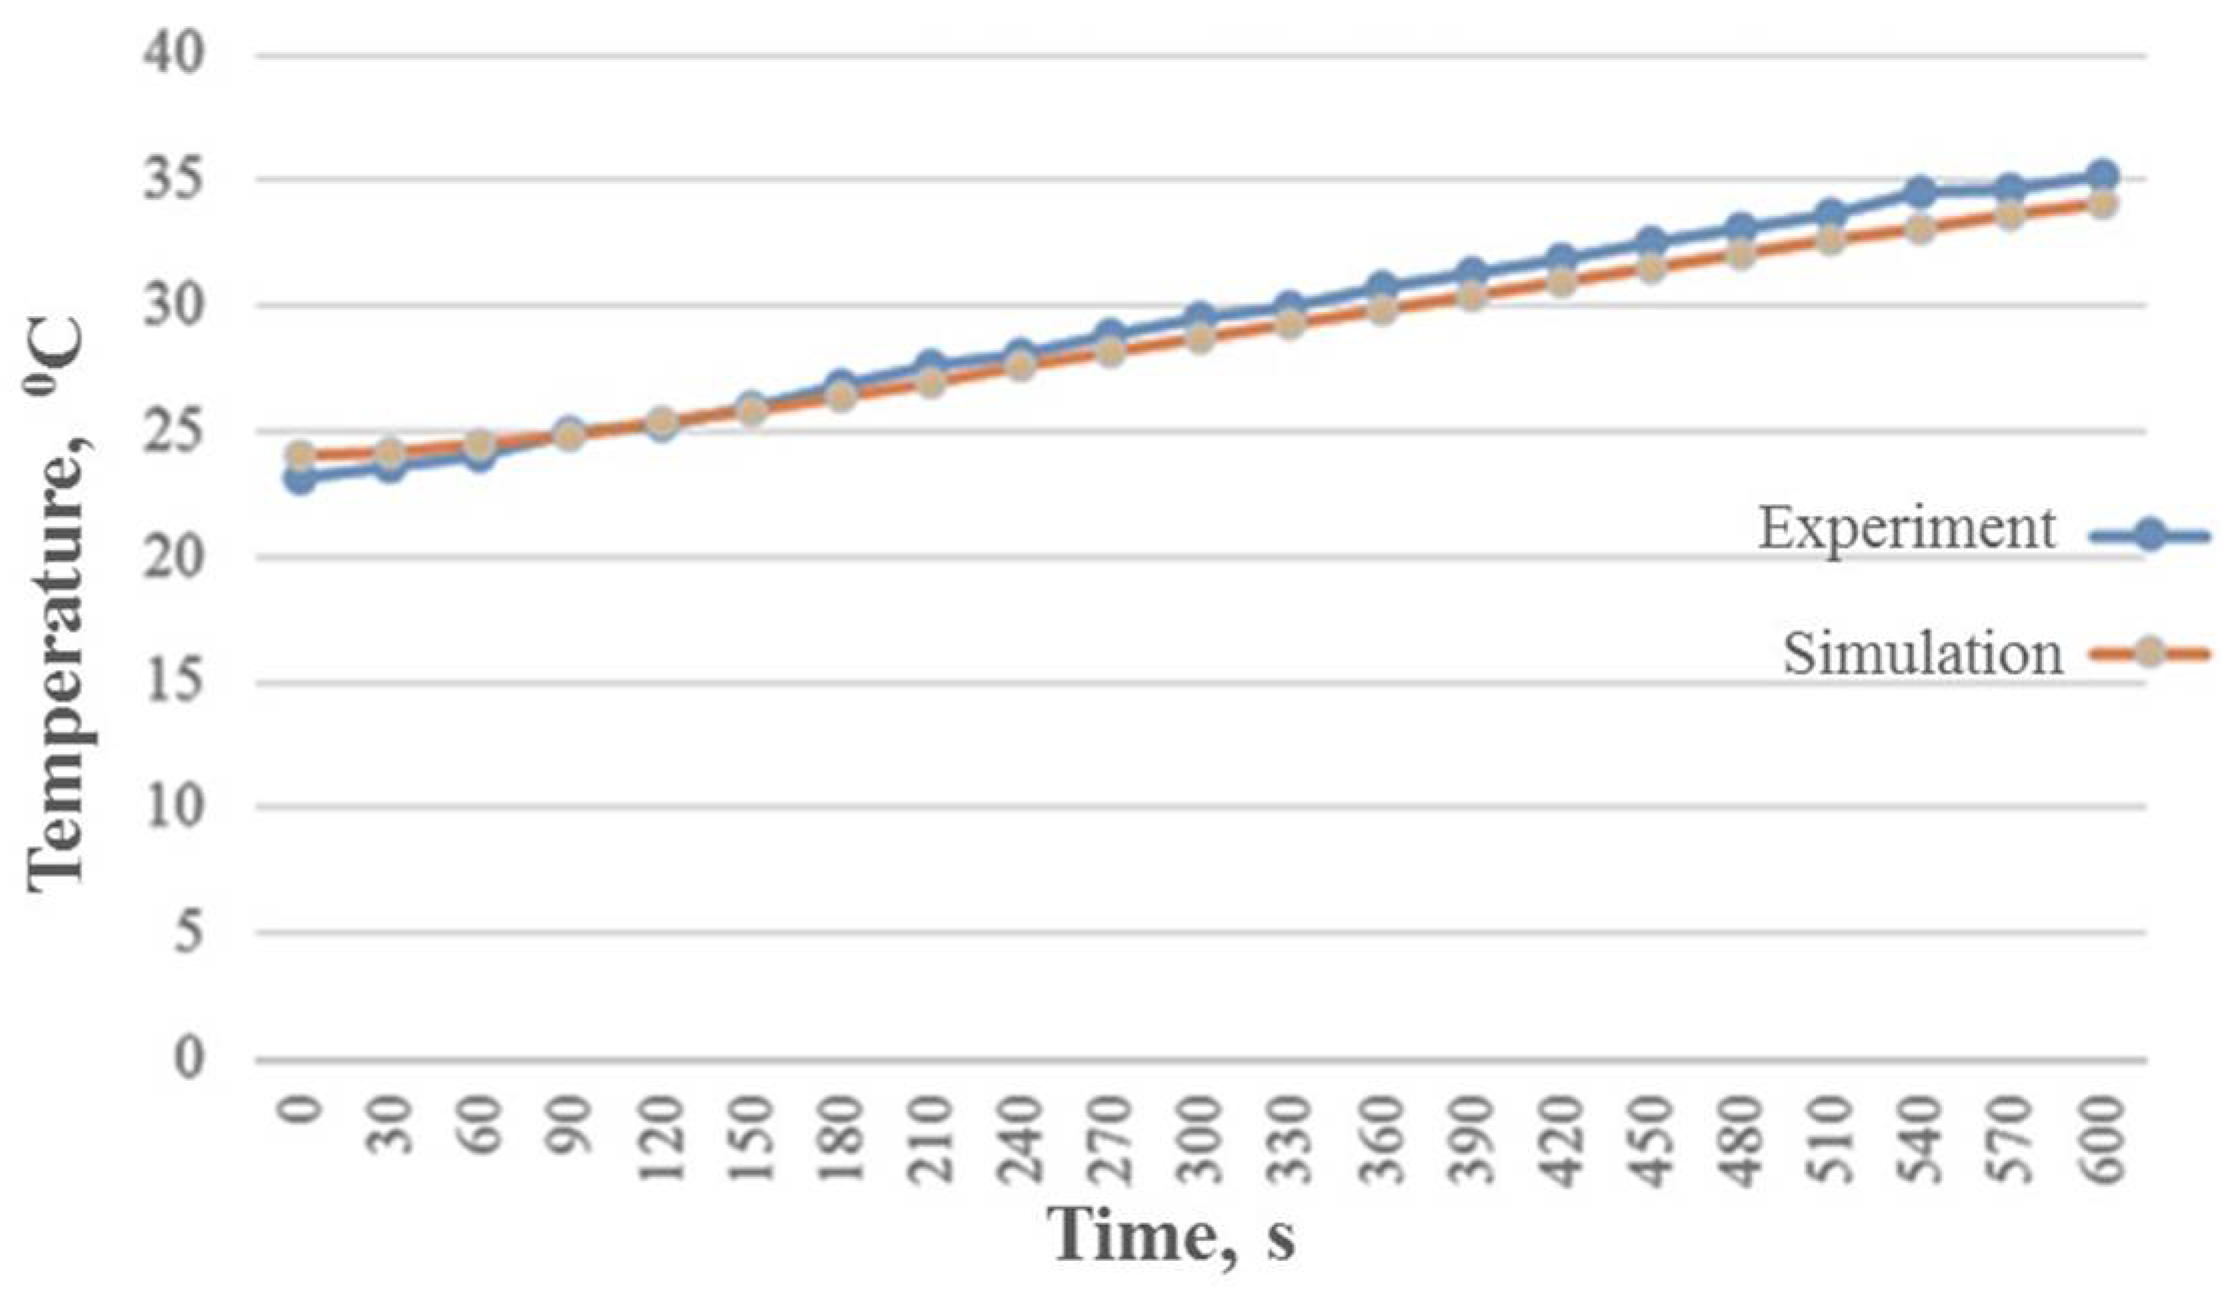
7. Thermal Analysis with Driving Cycle

Thermal analysis (using MotorCAD) for the IPMSMs and PMa-SynRM is conducted for the prescribed driving cycles. This would be critical for the design of traction motors since the performance can be limited by thermal conditions. First, the operating range of the traction motors for the driving cycles under prescribed temperature limits (PM: 130 °C; winding: 140 °C) without forced cooling is investigated. As shown in Figure 13b, the output torque of the traction motors varies significantly within a driving cycle. Therefore, to represent the equivalent effect, the root-mean-square torque within a cycle is taken, as calculated by Equation (12). (29.5 Nm, as previously discussed).
Figure 16 shows the torque-speed profiles under a series of temperature limits in the winding and magnet until the maximum limits (PM: 130 °C; winding: 140 °C) for the double-layer IPMSM. It can be seen that the effective torque of this motor can achieve 30 Nm under the temperature limits of 140 °C for winding and 130 °C for PM. Note that the PM used is N35SH, whose product maximum operating temperature is 150 °C. Similarly, as shown in Figure 17, the effective torque for the V-shaped IPMSM can also achieve 30 Nm, with a slightly less peak magnet temperature of 124 °C. Therefore, the PM of the V-shaped IPMSM is safer than that of the double-layer one, despite a slightly lower rated torque. The analysis results show that the double-layer and V-shaped IPMSMs can both operate at the rated condition without forced cooling. However, water cooling should still be employed to fully satisfy the UDDS, and particularly HWFET driving cycles.
The thermal analysis for the PMa-SynRM without forced cooling is shown in Figure 18, where the motor fails to reach the torque, as calculated by Equation (12). Water cooling may help to reduce the winding and magnet temperature and to fit into the requirement of the driving cycles for the PMa-SynRM. Nevertheless, the magnet of PMa-SynRM should be redesigned to avoid demagnetization.
Figure 19 shows the temperature rise of the winding, stator, and PM of all the three motor in the peak and continuous conditions for a period. As can be seen, the winding temperature of the PMa-SynRM is higher than that of the IPMSMs although their current densities are almost the same (around 16.5 Arms/mm2 for peak torque). This is because the phase resistance of the PMa-SynRM is double that of the IPMSMs. Therefore, the PMa-SynRM can only operate about 4 min at the peak condition and about 26 min at the rated condition, while the IPMSM can achieve 8 and 40 min, respectively. Also, the high winding temperature of the PMa-SynRM leads to the high magnet temperature, as shown in Figure 18. The above analysis can also be verified by the simulation results with the driving cycles, as shown in Figure 20, where the winding temperature of the PMa-SynRM is higher than that of IPMSM, and therefore, the IPMSMs can operate more safely than the PMa-SynRM for the driving cycles.

8. Discussions

According to the previous analysis, the benefits and drawbacks of the IPMSMs and PMa-SynRM for EV application are summarized as below:
-
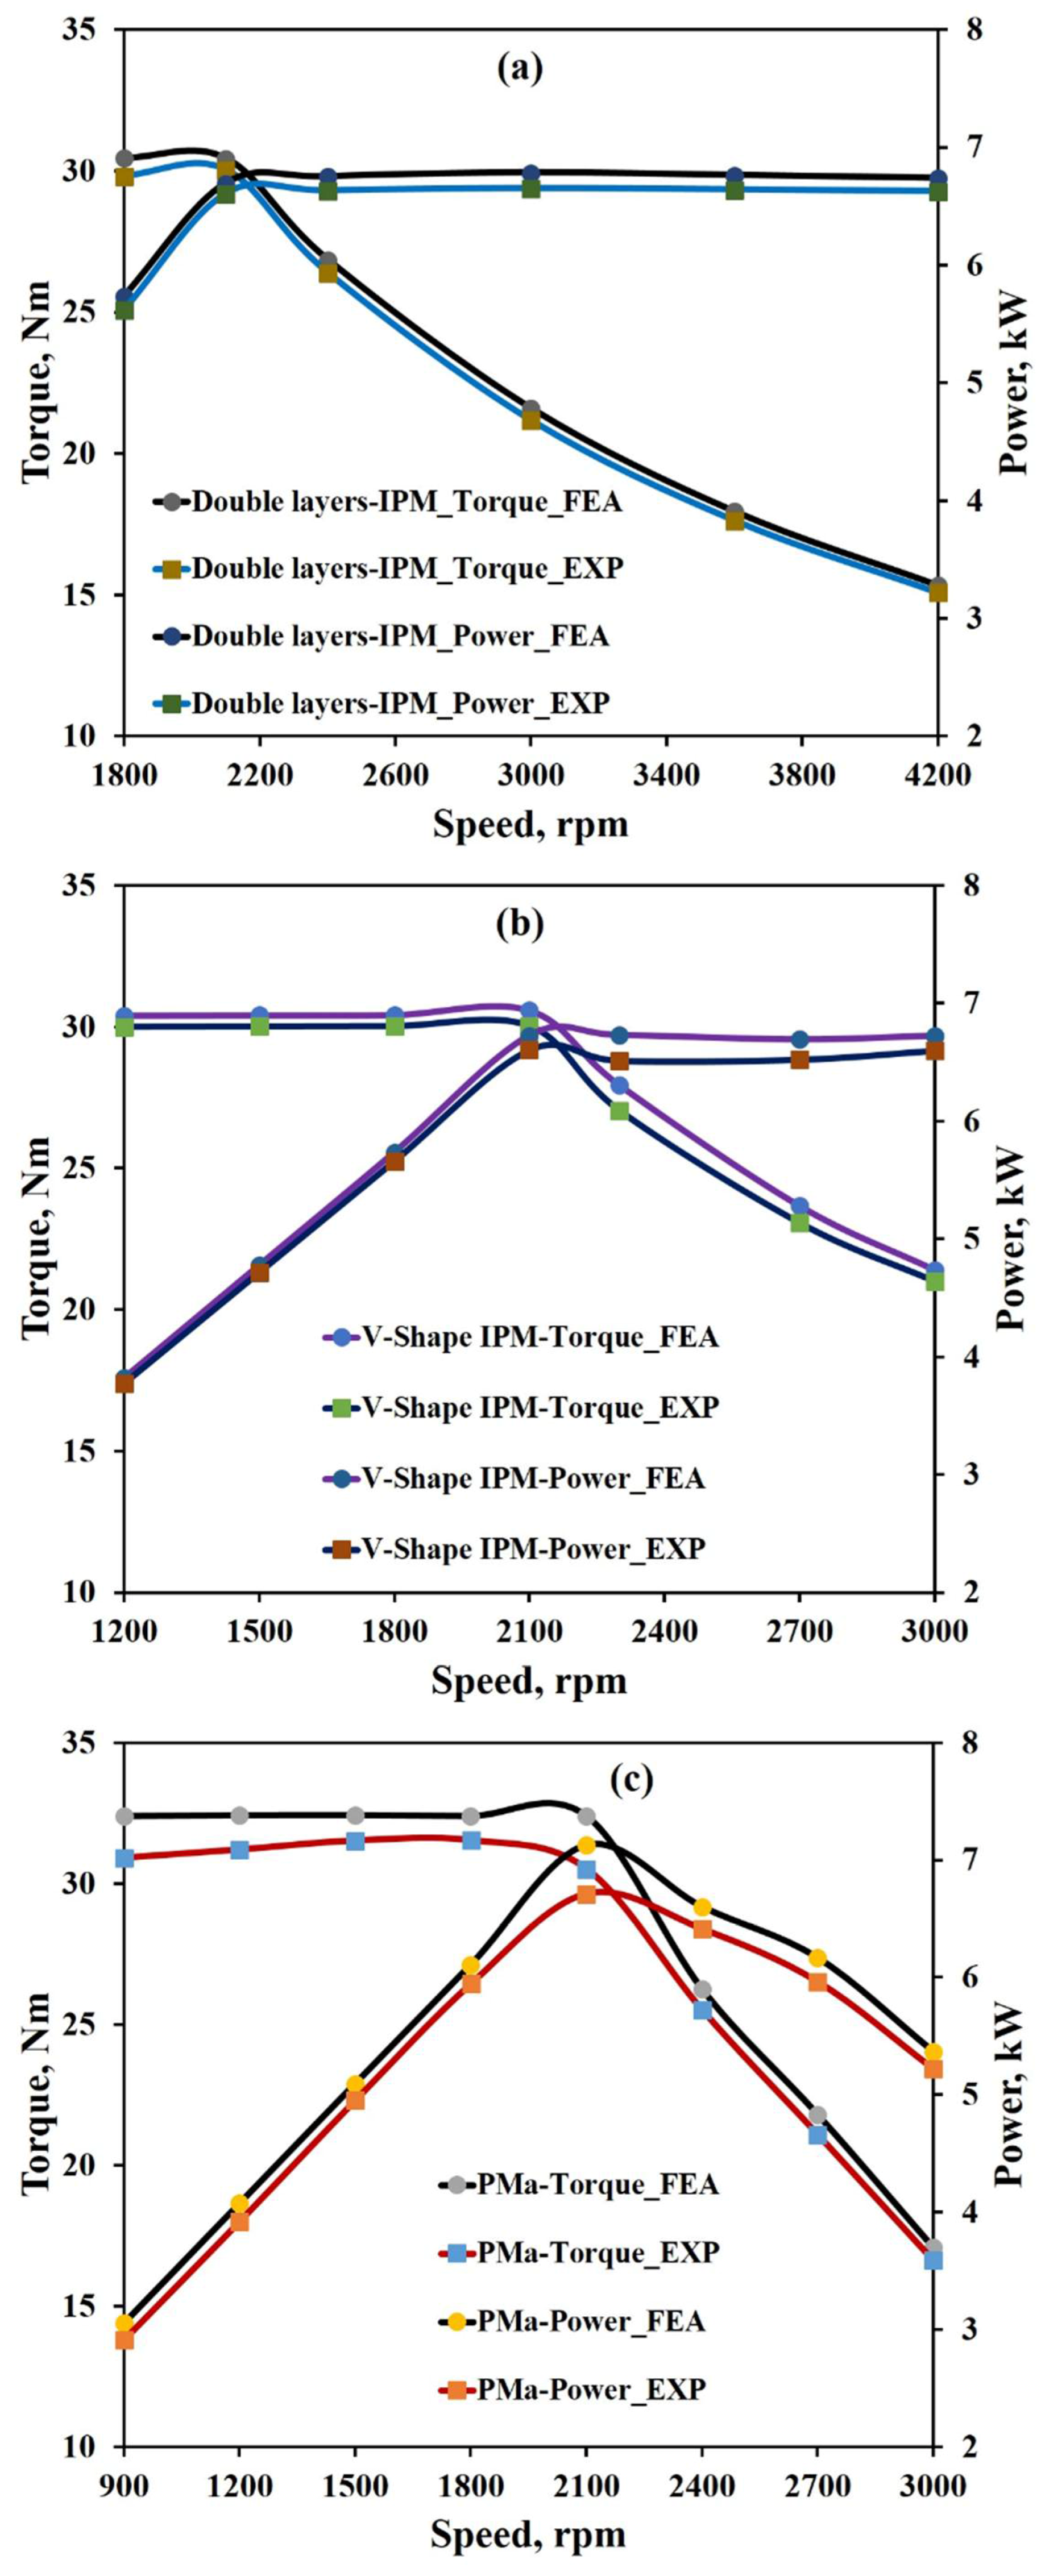
The IPMSMs possess the benefit of high PM flux linkage, low armature current, and current angle to reach the maximum torque. Meanwhile, the torque of PMa-SynRM is almost derived from the armature current. Therefore, a higher armature current and current angle are applied in order to generate the maximum torque for PMa-SynRM.
-
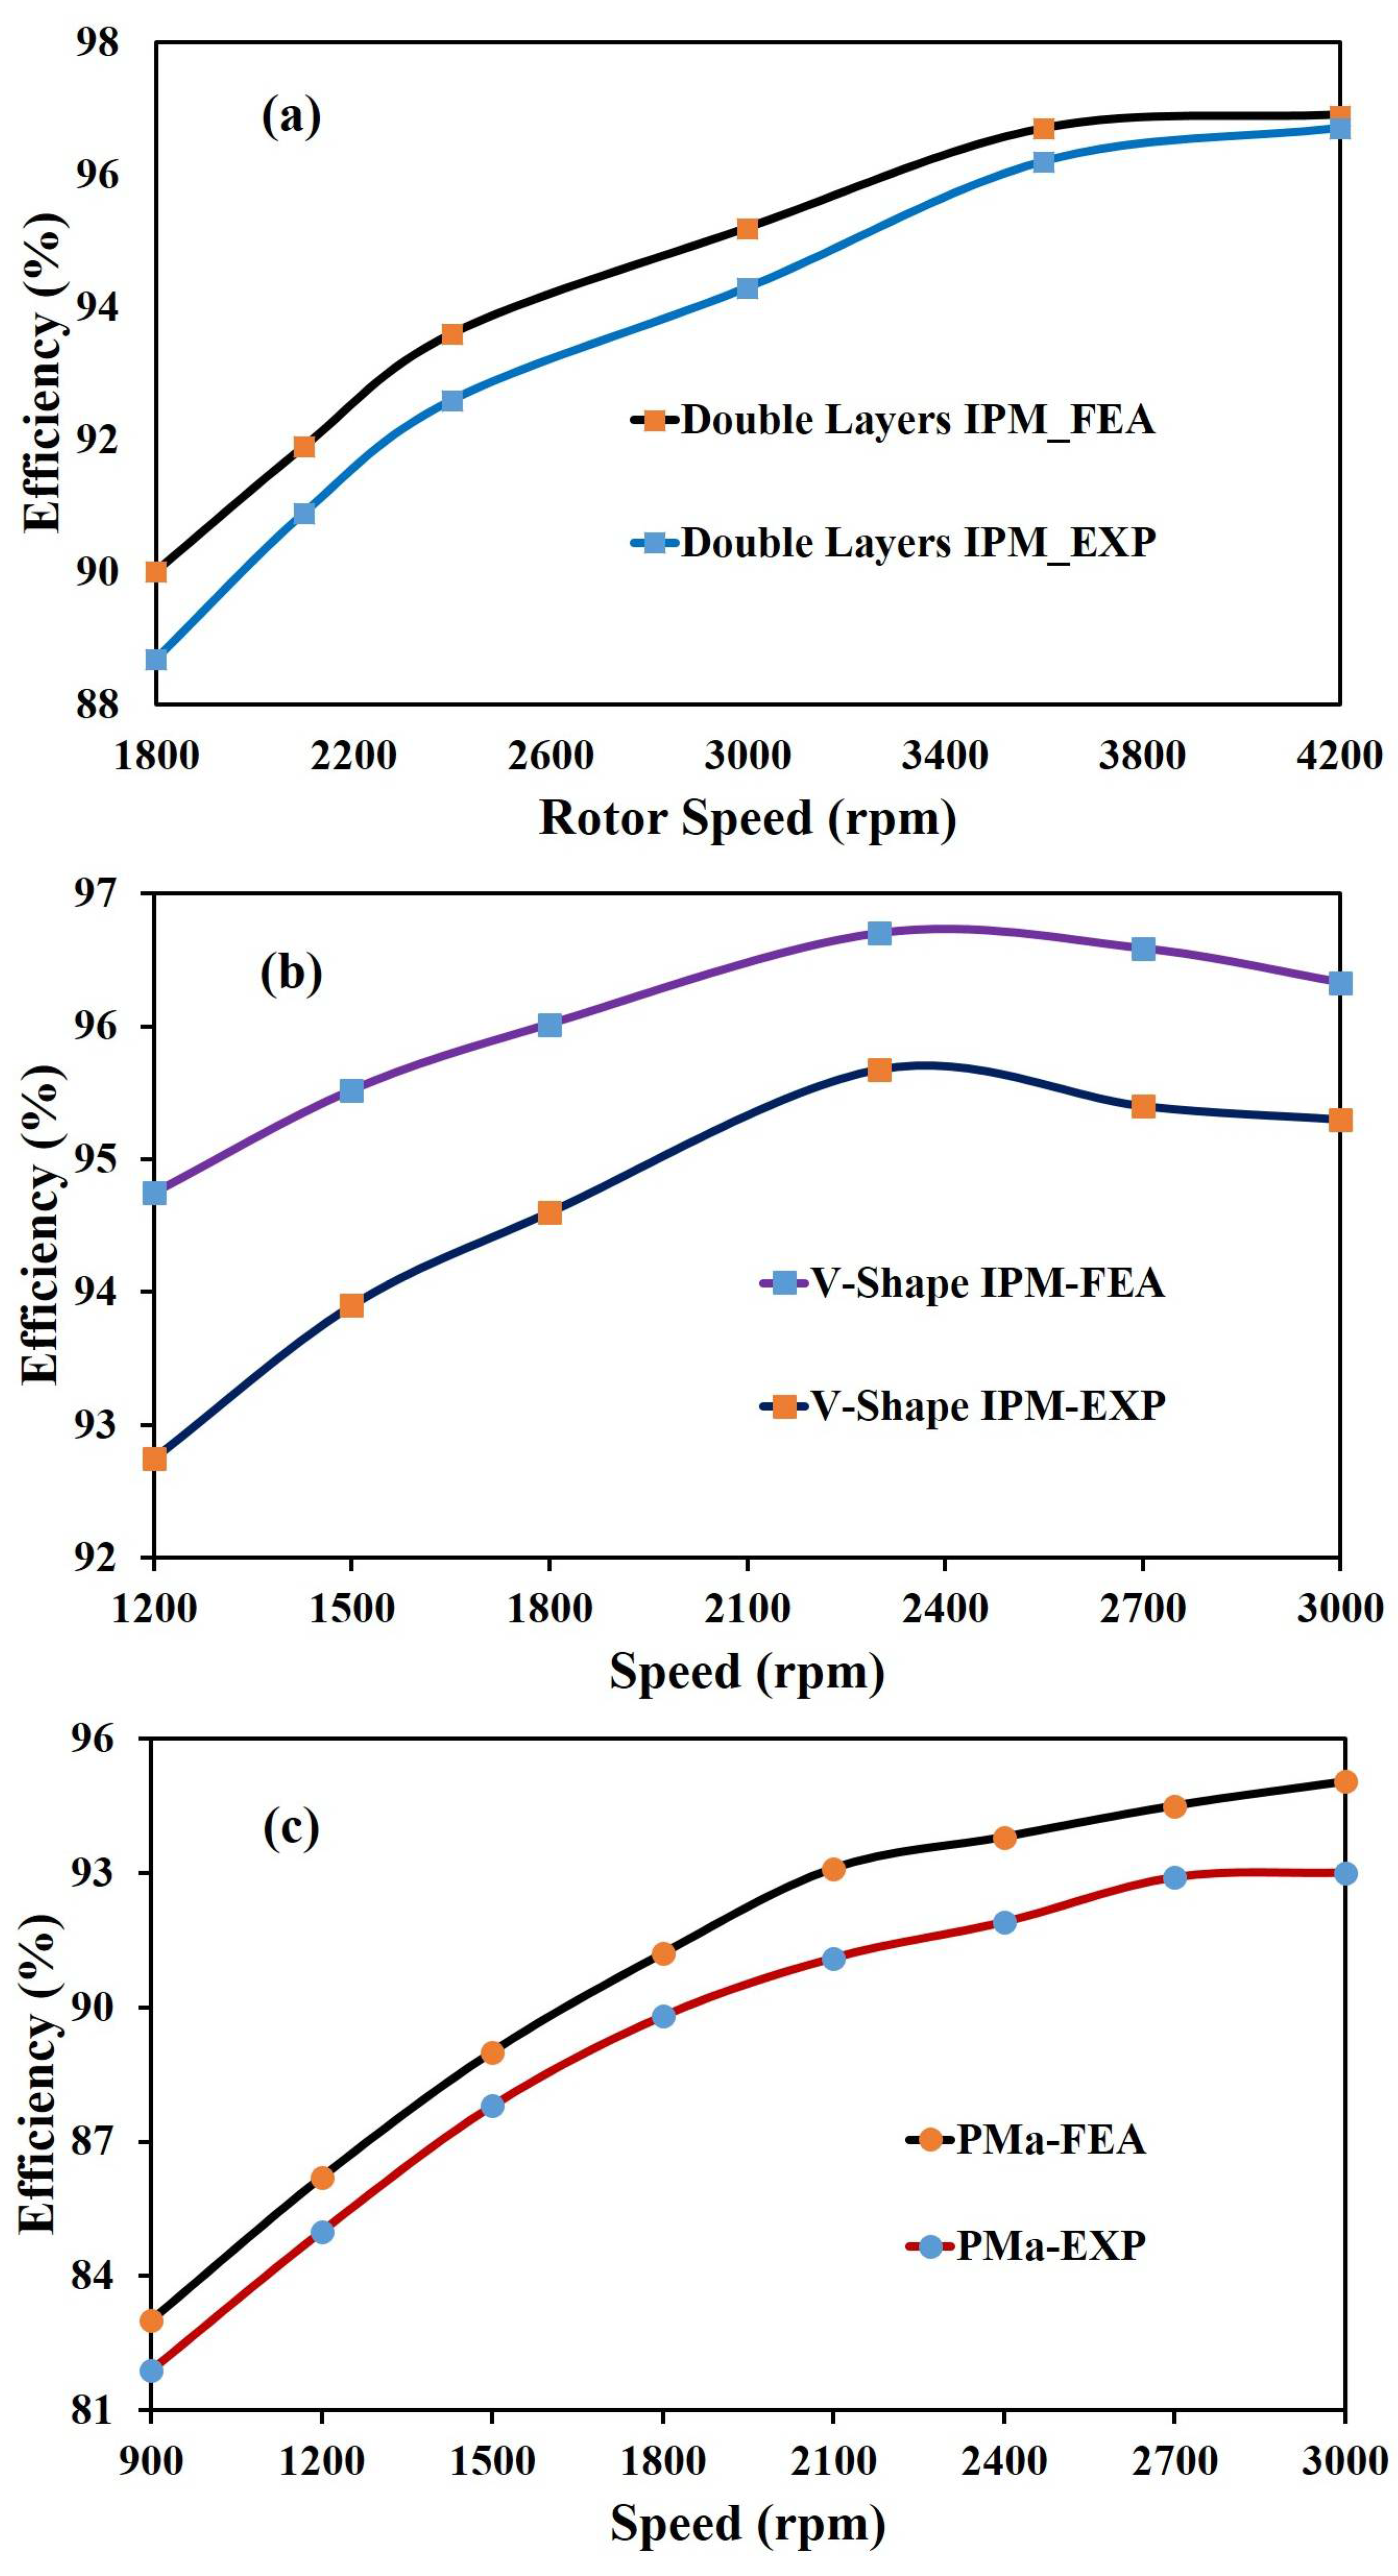
The PMa-SynRM can achieve very high speed at low armature current because the reluctance torque and saliency ratio are higher than that of IPMSMs. In addition, the PMa-SynRM has a higher efficiency at high speed than that of IPMSMs. This is the advantage of PMa-SynRM for high speed application.
-
To produce the same power as the IPMSMs, the PMa-SynRM should be designed with a higher motor volume than that of the IPMSM. Moreover, higher electrical loading is needed for the PMa-SynRM, and this can lead to temperature rise that limits the operating range.
-
The IPMSMs are more advantageous in urban driving because of their higher performance and efficiency at lower speed.
-
The PMa-SynRM is more suitable than the IPMSM in the highway driving cycle in terms of efficiency. However, the design should be improved by slightly increasing the PM amount so that the winding temperature can be brought down and the torque at high speed can be enhanced. This indicates a better design would lie between the two types of motors that are presented in this paper in terms of PM amount that is employed or sharing between the PM and reluctance torques. Moreover, better cooling may be necessary.
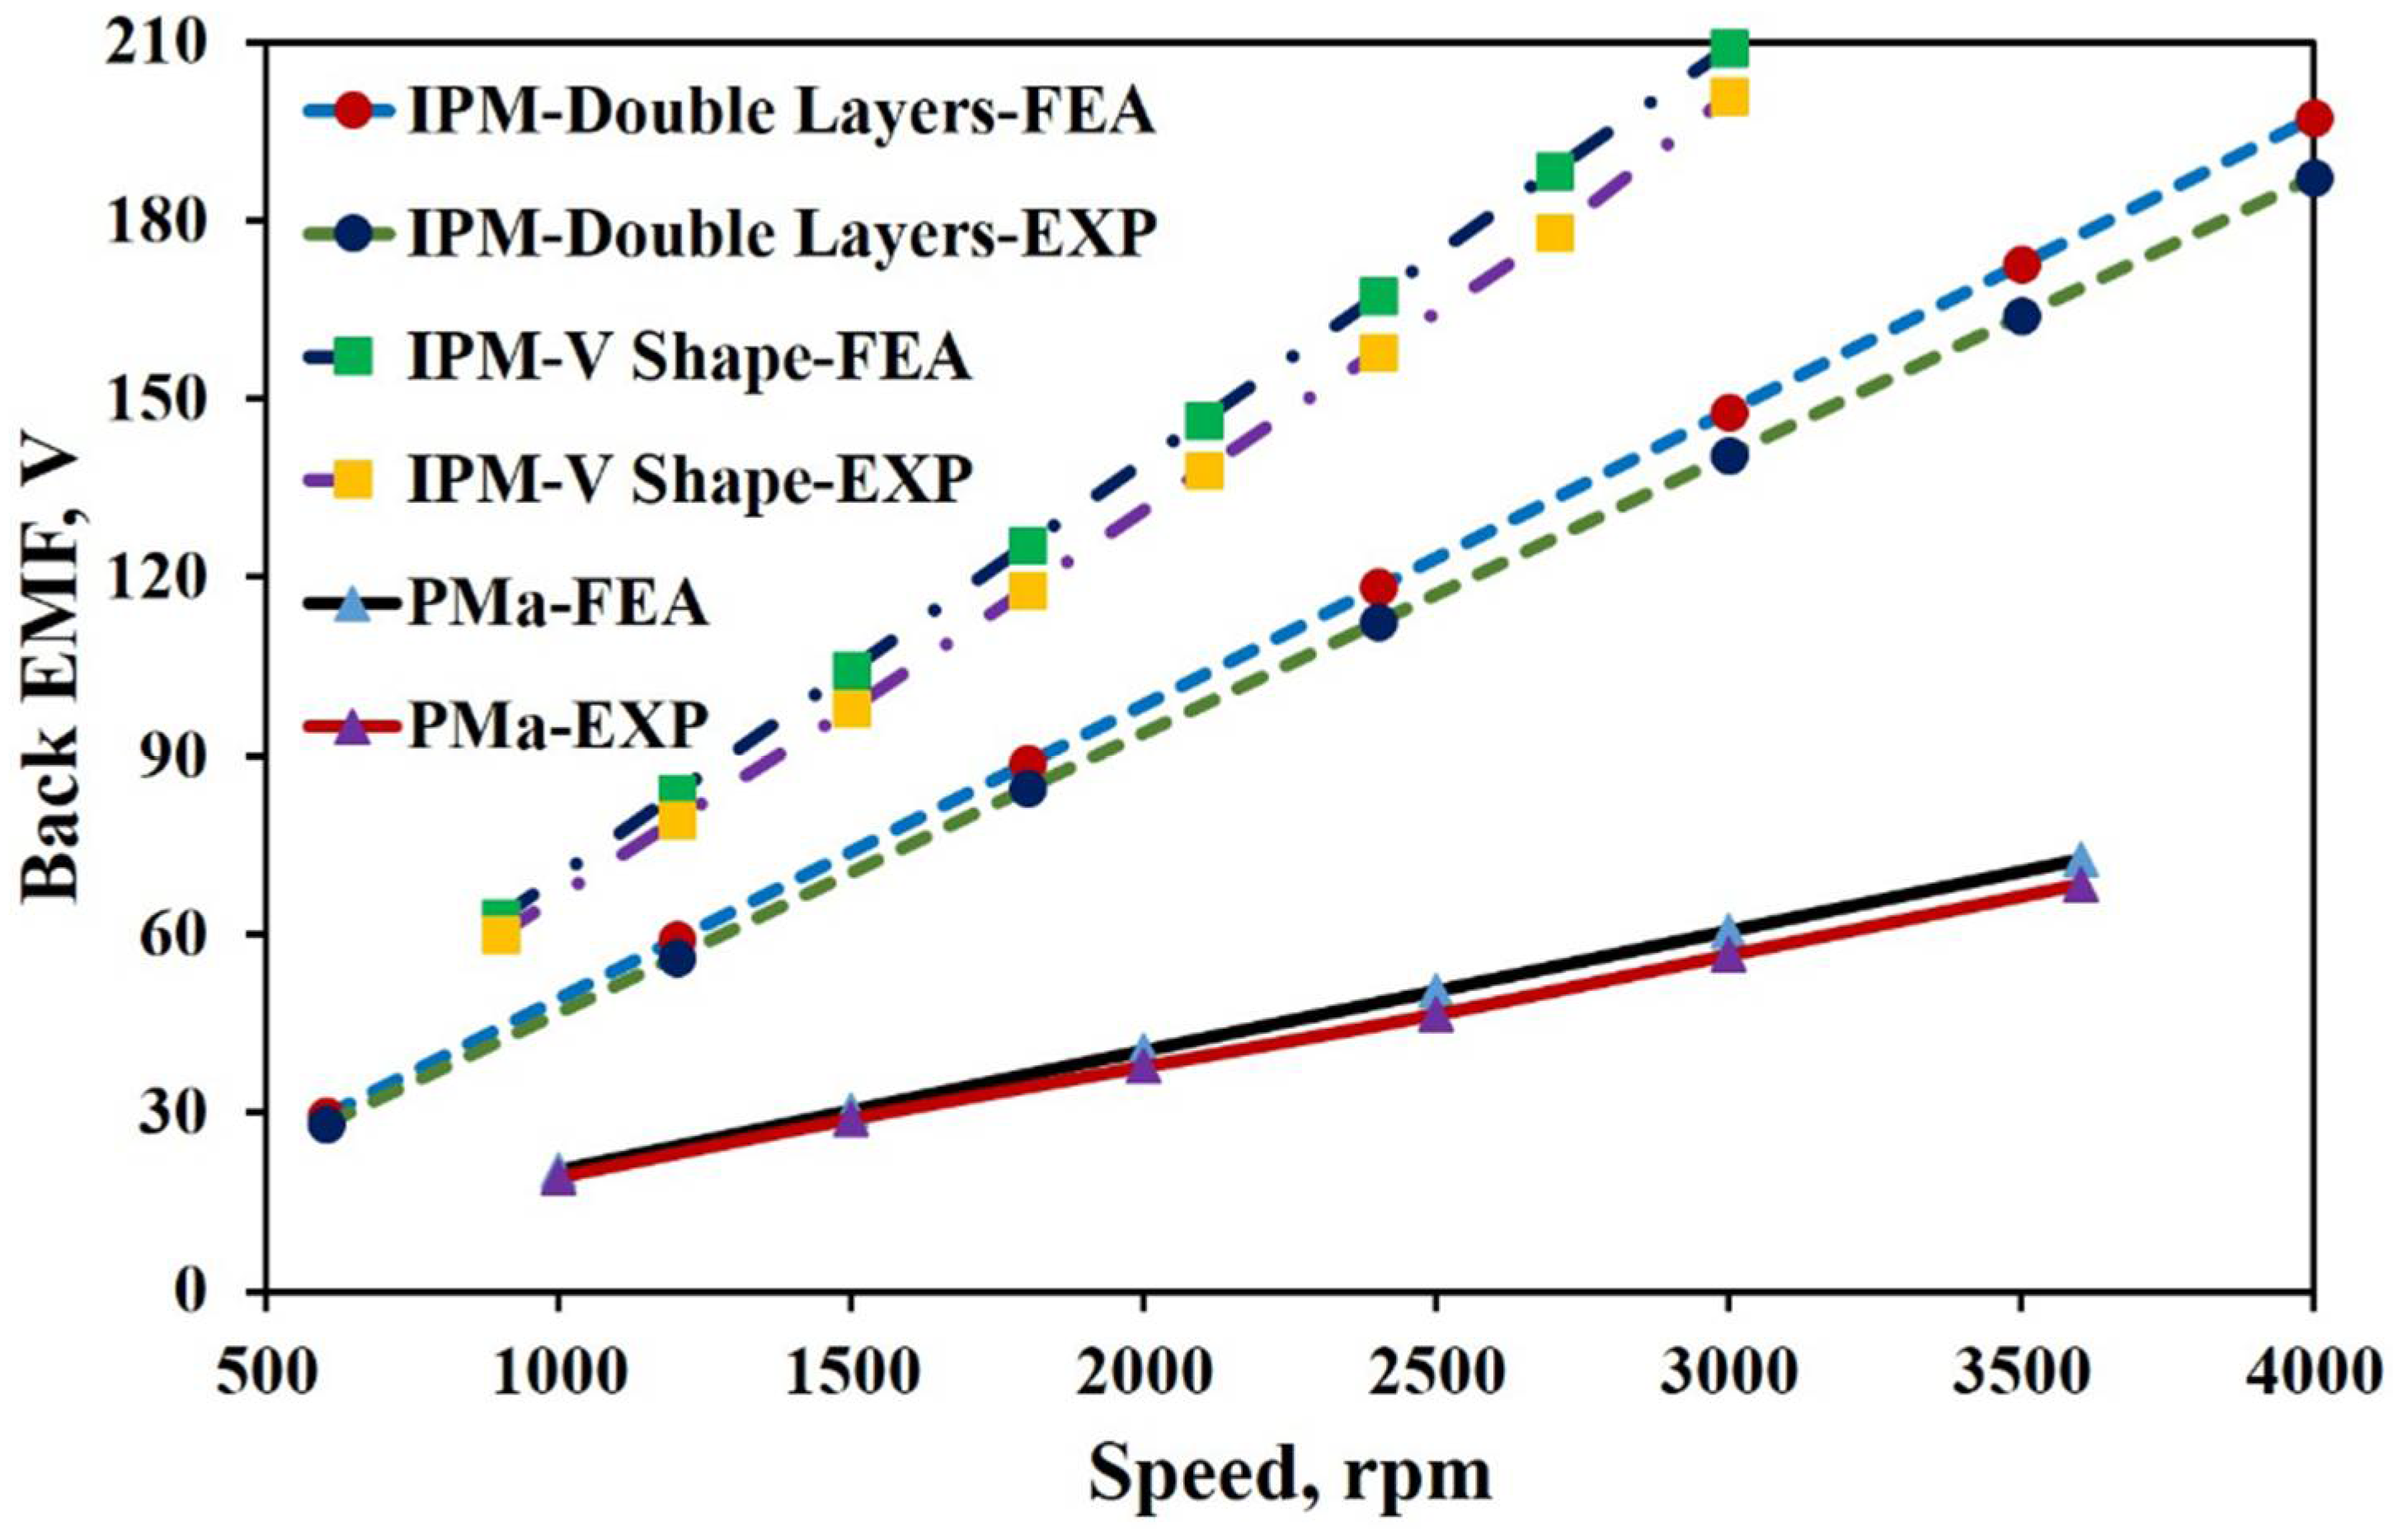
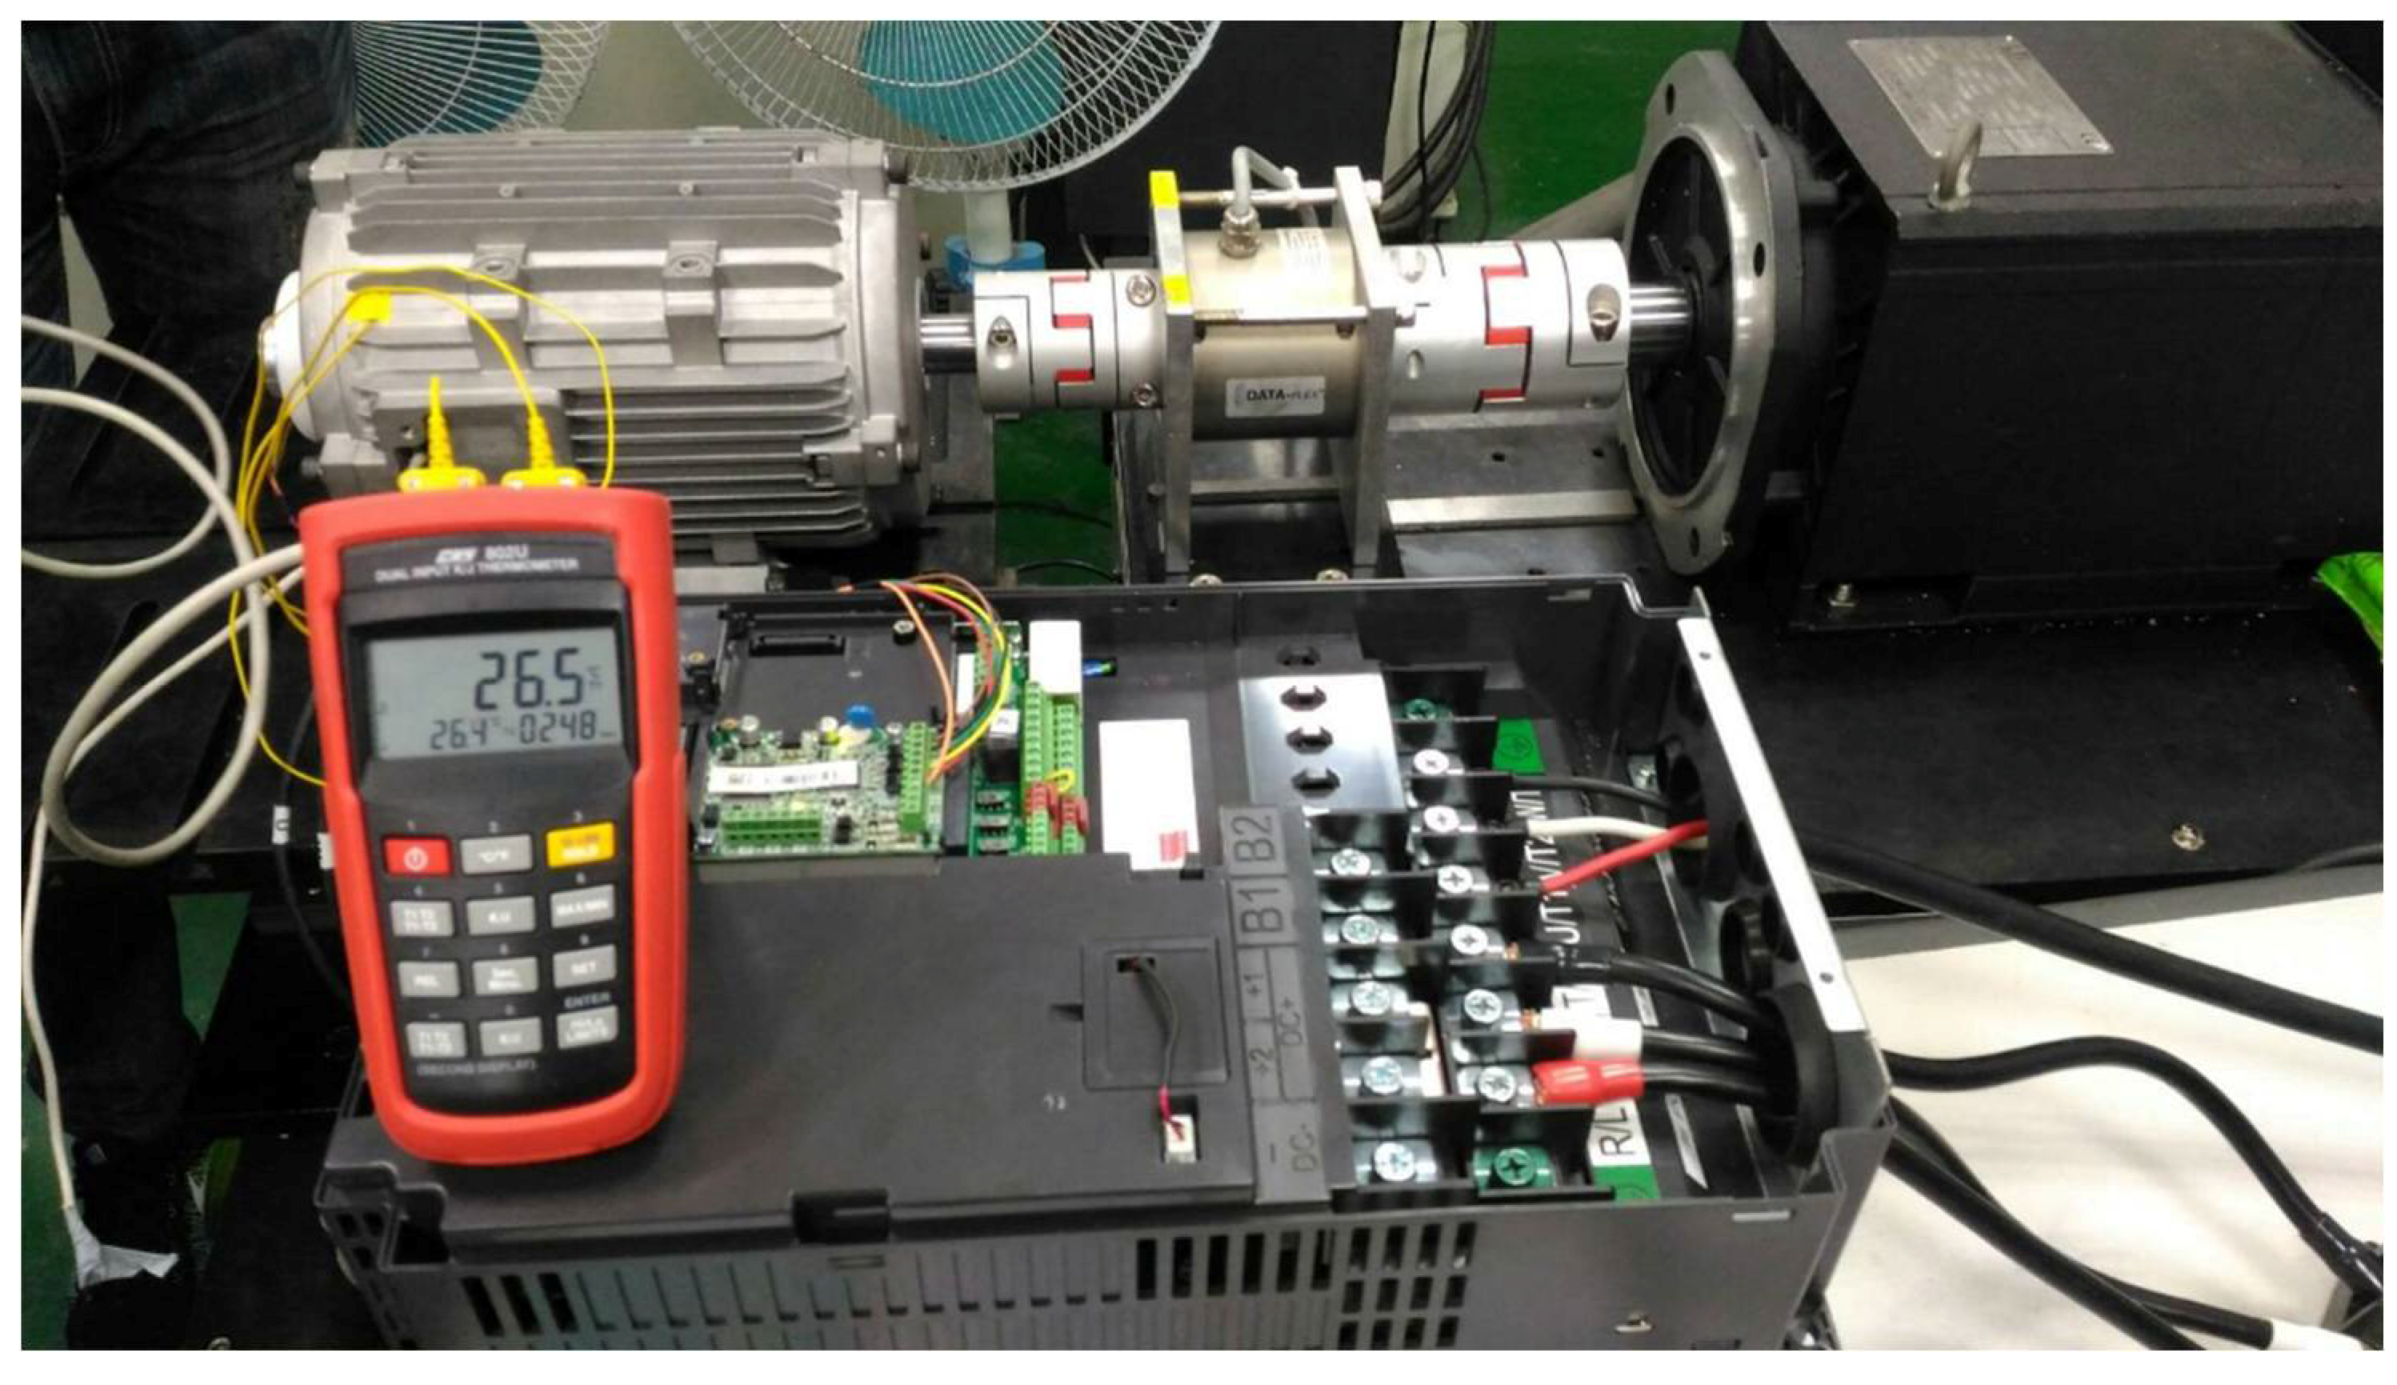
9. Experiments

The three motors were fabricated, as shown in Figure 21. The experimental results are shown in Figure 22 and Figure 23. In Figure 22, the BEMF (peak value) comparison shows that the simulations and experiments agree well for the three motors. Figure 23 shows the torque and power versus speed curves for the three motors at the prescribed rated conditions. It can be observed that the motors can be achieved the 30 Nm rated torque and 6.6 kW rated power. However, the power for the PMa-SynRM cannot maintain beyond 2100 rpm, while that for the IPMSMs can. Figure 24 shows the efficiency versus speed curves of the three motors at the rated condition. Note that the three motors were tested at different times for different projects so the measured speed ranges varied. The measured maximum efficiency for the double-layers IPMSM, V-shaped IPMSM and PMa-SynRM are 96.7%, 95.6%, and 93%, respectively. The largest error between the simulations and the experiments for the three motors is about 2.5% (based on the simulations). This indicates that the simulations and experiments agree well. The error can be attributed to some factors that are not considered in the simulations (e.g., mechanical losses). Figure 25 shows the peak torque of the IPMSMs and PMa-SynRM at their own base speeds (Table 1), where all of the motors can achieve the maximum torque with the maximum current excitation. The comparison in Figure 25 also shows that the FEA and experiments agree well.
Unlike the thermal imaging method that is presented in [14,15], this paper employed the thermocouples for temperature measurement of the double-layers IPMSM when considering facility availability, as the test setup shown in Figure 26. To ensure the safety in the experiments, only a light load is applied in simulation and measurement with a 34 Arms current, 1800 rpm speed, and 15 Nm torque for 10 min operation. Figure 27 shows the simulation model and some sample temperatures in different parts of the motor. Figure 28 shows the comparison between the measurement and simulation for the motor housing within 10 min operation. Both cases agree well. Although the above experiments are limited by the laboratory facilities, the accuracy of the simulations is still properly validated. Thus, the simulations that are presented in this paper should be sufficiently reliable.

10. Conclusions

This paper has investigated the characteristics of IPMSMs and PMa-SynRM in terms of electromagnetic and thermal performance via driving cycles for EV applications. It is found that the PMa-SynRM has an advantage in high speed operation for its high efficiency, despite insufficient torque. Instead, the IPMSMs possess better efficiency at low speed for the urban driving cycle. The thermal analysis showed that the IPMSMs possess better performance than the PMa-SynRM subject to temperature limits. In addition, the analysis results show that the operating range of the motors can be limited if proper cooling is not employed. Therefore, to achieve the same required performance, the traction motors should be designed differently, according to the conditions with or without cooling systems and the cooling capacity. The analysis in this paper has demonstrated the advantages and disadvantages of the IPMSMs and PMa-SynRM for EV tractions and the suitability of these motors for specific driving cycles. Suggestions have also been provided for the design improvement of traction motors for future study. Three prototypes were fabricated and the measurement validates the analysis in this paper.

Author Contributions

T.A.H. conceived and conducted the research and wrote the paper. M.-F.H. suggested the research topic, guided T.A.H. to complete the research and helped edit and finalize the paper. M.-F.H. also provided the laboratory space and facilities for this study.

Acknowledgments

This work was in part supported by Taiwan’s Ministry of Science and Technology under contracts MOST 106-2622-8-006-001 and 106-2218-E-006-023. The authors would like to thank Jian-Shin Lai, Ping-Yuan Wang and the lab-mates for the assistance in experiments.

Conflicts of Interest

The authors declare no conflict of interest.

References

  1. Ruiwu, C.; Chris, M.; Ming, C. Quantitative Comparison of Flux-Switching Permanent-Magnet Motors with Interior Permanent Magnet Motor for EV, HEV, and PHEV Applications. IEEE Trans. Magn. 2012, 48, 2374–2384. [Google Scholar] [CrossRef]
  2. Won, H.; Hong, Y.K.; Lee, W.; Choi, M. Roles of coercivity and remanent flux density of permanent magnet in interior permanent magnet synchronous motor (IPMSM) performance for electric vehicle applications. AIP Adv. 2018, 8. [Google Scholar] [CrossRef]
  3. Mounir, Z.; Mohamed, B.; Demba, D. Electric Motor Drive Selection Issues for HEV Propulsion Systems: A Comparative Study. IEEE Trans. Veh. Technol. 2006, 55, 1756–1764. [Google Scholar] [CrossRef] [Green Version]
  4. Wu, W.; Zhu, X.; Quan, L.; Du, Y.; Xiang, Z.; Zhu, X. Design and Analysis of a Hybrid Permanent Magnet Assisted Synchronous Reluctance Motor Considering Magnetic Saliency and PM Usage. IEEE Trans. Appl. Supercond. 2018, 28, 1–6. [Google Scholar] [CrossRef]
  5. Huynh, T.A.; Hsieh, M.-F. Comparative Study of PM-Assisted SynRM and IPMSM on Constant Power Speed Range for EV Applications. IEEE Trans. Magn. 2017, 53, 1–6. [Google Scholar] [CrossRef]
  6. Wang, J.; Yuan, X.; Kais, A. Design Optimization of a Surface-Mounted Permanent-Magnet Motor with Concentrated Windings for Electric Vehicle Applications. IEEE Trans. Veh. Technol. 2013, 62, 1053–1064. [Google Scholar] [CrossRef]
  7. Degano, M.; Carraro, E.; Bianchi, N. Robust Optimization of a Traction PMASR Motor according to a Given Driving Cycles. In Proceedings of the IEEE International Conference on Electrical Machines (ICEM), Berlin, Germany, 2–5 September 2014; pp. 270–276. [Google Scholar] [CrossRef]
  8. Carraro, E.; Morandin, M.; Bianchi, N. Traction PMASR Motor Optimization according to a Given Driving Cycle. IEEE Trans. Ind. Appl. 2016, 52, 209–216. [Google Scholar] [CrossRef]
  9. Nguyen, P.H.; Hoang, E.; Gabsi, M. Performance Synthesis of Permanent-Magnet Synchronous Machines during the Driving Cycle of a Hybrid Electric Vehicle. IEEE Trans. Veh. Technol. 2011, 60, 1991–1997. [Google Scholar] [CrossRef]
  10. Sarigiannidis, A.G.; Beniakar, M.E.; Kladas, A.G. Fast Adaptive Evolutionary PM Traction Motor Optimization Based on Electric Vehicle Drive Cycle. IEEE Trans. Veh. Technol. 2017, 66, 5762–5774. [Google Scholar] [CrossRef]
  11. Sarigiannidis, A.G.; Beniakar, M.E.; Kakosimos, P.E.; Kladas, A.G. Performance Evaluation and Thermal Analysis of Interior Permanent Magnet Traction Motor over a Wide Load Range. In Proceedings of the IEEE International Conference on Electrical Machines (ICEM), Lausanne, Switzerland, 4–7 September 2016; pp. 2662–2668. [Google Scholar] [CrossRef]
  12. Yang, Y.P.; Shih, G.Y. Optimal Design of an Axial-Flux Permanent-Magnet Motor for an Electric Vehicle Based on Driving Scenarios. Energies 2016, 9, 285. [Google Scholar] [CrossRef]
  13. Gu, W.; Zhu, X.-Y.; Li, Q.; Yi, D. Design and Optimization of Permanent Magnet Brushless Machines for Electric Vehicle Applications. Energies 2015, 8, 13996–14008. [Google Scholar] [CrossRef]
  14. Glowacz, A.; Glowacz, Z. Diagnosis of the three-phase induction motor using thermal imaging. Infrared Phys. Technol. 2017, 81, 7–16. [Google Scholar] [CrossRef]
  15. Glowacz, A.; Glowacz, Z. Diagnostics of stator faults of the single-phase induction motor using thermal images, MoASoS and selected classifiers. Measurement 2016, 93, 86–93. [Google Scholar] [CrossRef]
  16. United States Environmental Protection Agency, EPA Emission Standards for Light-Duty Vehicles and Trucks. Available online: https://www.epa.gov/emission-standards-reference-guide/epa-emission-standards-light-duty-vehicles-and-trucks (accessed on 30 April 2018).
  17. Liu, X.; Chen, H.; Zhao, J.; Belahcen, A. Research on the Performances and Parameters of Interior PMSM Used for Electric Vehicles. IEEE Trans. Ind. Electron. 2016, 63, 3533–3545. [Google Scholar] [CrossRef]
  18. Liu, C.T.; Chung, H.Y.; Lin, S.Y. On the electromagnetic steel selections and performance impact assessments of synchronous reluctance motors. IEEE Trans. Ind. Appl. 2017, 53, 2569–2577. [Google Scholar] [CrossRef]
  19. Huynh, T.A.; Hsieh, M.-F. Performance Evaluation of Interior Permanent Magnet Motors Using Thin Electrical Steels. IEEJ J. Ind. Appl. 2017, 6, 422–428. [Google Scholar] [CrossRef]
  20. Yuan, X.; Wang, J. Torque Distribution Strategy for a Front- and Rear-Wheel-Driven Electric Vehicle. IEEE Trans. Veh. Technol. 2012, 61, 3365–3374. [Google Scholar] [CrossRef]
  21. Soong, W.L.; Ertugrul, N. Field weakening performance of interior permanent magnet motors. IEEE Trans. Ind. Appl. 2002, 38, 1251–1258. [Google Scholar] [CrossRef]
  22. Guglielmi, P.; Boazzo, B.; Armando, E.; Pellegrino, G.; Vagati, A. Permanent-magnet minimization in PM-assisted synchronous reluctance motors for wide speed range. IEEE Trans. Ind. Appl. 2013, 49, 31–41. [Google Scholar] [CrossRef]
Figure 1. Traction motors using rare-earth permanent magnet (PM): (a) double-layers interior permanent magnet synchronous machines (IPMSM). Rotor material: 50CS1300. Stator material: 25CS1500HF; (b) V-shaped IPMSM. Rotor material: 35CS550. Stator material: 25CS1500HF; and, (c) PM-assisted synchronous reluctance motors (PMa-SynRM). Rotor material: 50CS1300. Stator material: 25CS1500HF. Permanent magnet: NdFeB-N35H, Br = 1.2T @ 20 °C, Hc = 915 kA/m. All of the cases are distributed windings.
Energies 11 01385 g001
Figure 2. Schematic of a front and rear drives of light-duty vehicle.
Energies 11 01385 g002
Figure 3. The analysis process for traction motors with driving cycle.
Energies 11 01385 g003
Figure 4. Comparison of PM flux linkage of IPMSM and PMa-SynRM: (a) IPMSM and (b) PMa-SynRM. Reference angle starts from q-axis.
Energies 11 01385 g004
Figure 5. d-q-axis inductance of double-layer PM IPMSM: (a) Ld, (b) Lq.
Energies 11 01385 g005
Figure 6. d-q-axis inductance of V-shaped PM IPMSM: (a) Ld, (b) Lq.
Energies 11 01385 g006
Figure 7. d-q-axis inductance of PMa-SynRM: (a) Ld, (b) Lq.
Energies 11 01385 g007
Figure 8. Flux linkage variations on (a) d- and (b) q-axis of IPMSM with respect to current and current angle.
Energies 11 01385 g008
Figure 9. (a) Current and (b) current angle variation of IPMSM with speed.
Energies 11 01385 g009
Figure 10. (a) Torque-current angle and (b) torque-speed curves of IPMSM.
Energies 11 01385 g010
Figure 11. (a) Current and (b) current angle variations of PMa-SynRM with speed.
Energies 11 01385 g011
Figure 12. The torque-speed curves of PMa-SynRM.
Energies 11 01385 g012
Figure 13. Motor (a) speed; (b) torque; and, (c) power over the driving cycles.
Energies 11 01385 g013
Figure 14. Torque distribution profiles for (a) IPMSMs and (b) PMa-SynRMs over the driving cycles.
Energies 11 01385 g014
Figure 15. Efficiency map of IPMSMs and PMa-SynRM over the driving cycles: (a) double layers magnet IPMSM, (b) v-shaped magnets IPMSM, and (c) PMa-SynRM.
Energies 11 01385 g015
Figure 16. The temperature distribution profiles for (a) winding and (b) magnet of double-layer IPMSM.
Energies 11 01385 g016
Figure 17. The temperature distribution profiles for (a) winding and (b) PM of V-shaped IPMSM.
Energies 11 01385 g017
Figure 18. The temperature distribution profiles for (a) winding and (b) PM of PMa-SynRM.
Energies 11 01385 g018
Figure 19. The temperature rise for winding and magnet: (a) peak; and, (b) rated/continuous operations.
Energies 11 01385 g019
Figure 20. The temperature rise for winding and magnet: (a) UDDS, and (b) HWFET.
Energies 11 01385 g020
Figure 21. Prototypes of IPMSMs and PMa-SynRM: (a) stator of double-layers IPMSM with winding, (b) stator of V-Shaped IPMSM without winding, (c) stator of PMa-SynRM with winding, (d) rotor of double-layers IPMSM with PM, (e) rotor of V-shaped IPMSM without PM, and (f) rotor of PMa-SynRM without PM.
Energies 11 01385 g021
Figure 22. Comparison of back electromotive force (BEMF) of IPMSMs and PMa-SynRM.
Energies 11 01385 g022
Figure 23. Torque-power vs speed curve at rated condition: (a) double layers IPMSM, (b) V-Shaped IPMSM, and (c) PMa-SynRM.
Energies 11 01385 g023
Figure 24. Efficiency vs speed curve at rated condition: (a) double layers IPMSM, (b) V-Shaped IPMSM, and (c) PMa-SynRM.
Energies 11 01385 g024
Figure 25. Torque comparison of IPMSMs and PMa-SynRM.
Energies 11 01385 g025
Figure 26. Temperature measurement setup for the double layer IPMSM.
Energies 11 01385 g026
Figure 27. Thermal simulation model and temperature for the double layer IPMSM.
Energies 11 01385 g027
Figure 28. Temperature Measurement of double layer IPMSM.
Energies 11 01385 g028
Table 1. Motor specifications.
Parameter (Unit)Double LayersV-ShapedPMa-SynRM
Max. power (kW)101010
Max. torque (Nm)565665
Max. speed (rpm)700070007000
Rated power (kW)6.66.66.6
Rated torque (Nm)303030
Base speed @ maximum torque (rpm)≥1800≥1800≥1500
Base speed @ rated torque (rpm)≥2100≥2100≥2100
No. of slots363636
No. of poles884
No. of turns456
Max. current (A)11010080
Outer rotor diameter (mm)9410994
Stack length (mm)8690120
Coil pitch439
PM amount per pole (mm3)774081005760
Current density @ rated torque (A/mm2)8.38.38.3
Table 2. Vehicle specifications.
Parameter (Unit)Value
Radius of wheels (m)0.265
Vehicle mass (kg)950
Mass correction coefficient1.04
Gravitational acceleration (m/s2)9.8
Rolling resistance coefficient0.011
Air mass density (kg/m3)1.225
Aerodynamic drag coefficient0.4
Vehicle frontal area (m2)2.14
Differential gear ratio7
Battery pack nominal voltage (V)310

