Abstract
Research demonstrated that the application of a multi-speed transmission could improve the dynamic and economic performance of electric vehicles. This paper deals with a novel multi-speed transmission for the electric dump truck (EDT) operating on the structure route (SR), which has a definite starting point and end point without complex traffic conditions. To optimize the gear ratio and shift schedule to reduce energy consumption in such conditions, the mathematical model of the transmission and the dynamic model of the EDT are initially required. Following this, the shift schedule is presented according to the motor efficiency map. After that, the gear ratio optimization is carried out by a particle swarm optimization (PSO) algorithm. Moreover, the proposed EDT is compared with an EDT with a single-speed transmission. The simulation results show that the energy consumption is reduced by 6.1%.
1. Introduction
Hybrid Electric Vehicles (HEV) and Battery Electric Vehicles (BEV) are appropriate substitutes for internal combustion vehicles, as a means of reducing harmful emissions and saving energy. At present, many studies have been devoted to the application of a multi-speed transmission on the BEV to improve the economic and dynamic performance [1,2,3,4]. However, most applications are related to passenger cars, with a lack of research for electric heavy vehicles such as dump trucks and construction vehicles, which have a broad application prospect. These kinds of vehicles usually operate in a structure route (SR) environment. The SR is a kind of road with foregone road information such as slope, curvature, the location of the start point and with destination locates on the closed areas such as mine sites, construction sites, and harbor sites. Generally, the energy consumption proportion is large on these occasions. Correlational research shows that the energy consumption of the dump trucks accounts for 32% of the total energy consumption in a typical open-pit mine site [5,6,7,8]. Oh et al. [9] focused on the gear ratio and shift schedule optimization of a wheel loader transmission in the V-pattern working cycle, and the results show that the energy savings can reach up to 8%. In addition, the fluctuation of the slope of mine roads is remarkable, leading to an important change in motor load [10]. Thus, the optimization of a multi-speed transmission for mining dump trucks can improve the efficiency of the driveline system, which has a significant impact on reducing the operation cost.
The application of a multi-speed transmission for electric cars includes Automatic Manual Transmission [11], Double Clutch Transmission (DCT) [12], multi-speed planetary transmission [13], as well as dual motor multi-speed EV transmissions [14]. Each form has its own advantages and disadvantages. Additionally, some algorithms for the improvement of the economic performance, which concentrated on the passenger cars on road condition, have been presented. Datong et al. [15] presented a method of gear ratio optimization via Genetic Algorithm (GA), which only aimed at minimizing the energy consumption. Wu et al. [16] built a Battery Electric Vehicle model with Matlab SIMULINK and AUTONOMIE and used Dynamic Programming (DP) to find the optimal gear ratio, taking added weight and lower transmission efficiency into consideration. Sorniotti et al. [17] and Morozov et al. [18] established the multi-objective optimization model of the two-speed transmission for electric delivery step van in different ways, taking the economic performance and dynamic performance into consideration at the same time. However, the optimization processes were carried out based on the hypothesis that different ratio combinations obey the same shift schedule. Gao et al. [19] presented a way to define the shift schedule of several different drive cycles via the maximum overlapping area of gear operational points, which exhibits a strong robustness, as the schedule is the compromise of the optimal operating point under different cycle conditions.
This paper designed a two-speed transmission for the electric dump truck (EDT) in particular, which consists of two planetary sets instead of parallel axis gear trains. Generally speaking, planetary gears are more suitable for heavy-duty trucks as the epicyclic gear train has the advantages of reduction volume, light weight, compact structure and high power density [20,21]. Following this, the mathematical model and the EDT dynamic model are developed for simulation. Based on the efficiency map of the motor, the dynamic shift schedule has been proposed and applied to the EDT simulation model. Following this, a gear ratio optimization strategy for the novel transmission has been proposed, based on the classical dump truck working cycle of an iron mine in China. The simulation results show that the transmission with an optimized gear ratio can improve the energy conversion efficiency while maintaining the satisfactory acceleration ability. The paper is organized as follows: Section 2 is devoted to the model development of the transmission and the EDT. The shift schedule is presented in Section 3. Section 4 shows the optimization solutions and simulation results. Finally, the summary and conclusions are given in Section 5.
2. Modeling and Analysis of Electric Dump Truck
In this paper, the developed simulation model of the EDT, established in the Matlab/Simulink (R2016b) with state flow, consists of the environment information, road spectrum, energy and powertrain system, vehicle control system and driver system, which is a proportional-integral-derivative (PID) control model that allows for the reference velocity to be followed, as shown in Figure 1. The overall status information is collected by the vehicle control system, and the corresponding information is fed back to the driver model. Some of the basic parameters related to the EDT are shown in Table 1 [22].
Figure 1.
Vehicle model schematic (acc, acceleration signal; dec, deceleration signal; SOC, state of charge).
Table 1.
Basic parameters of the electric dump truck (EDT).
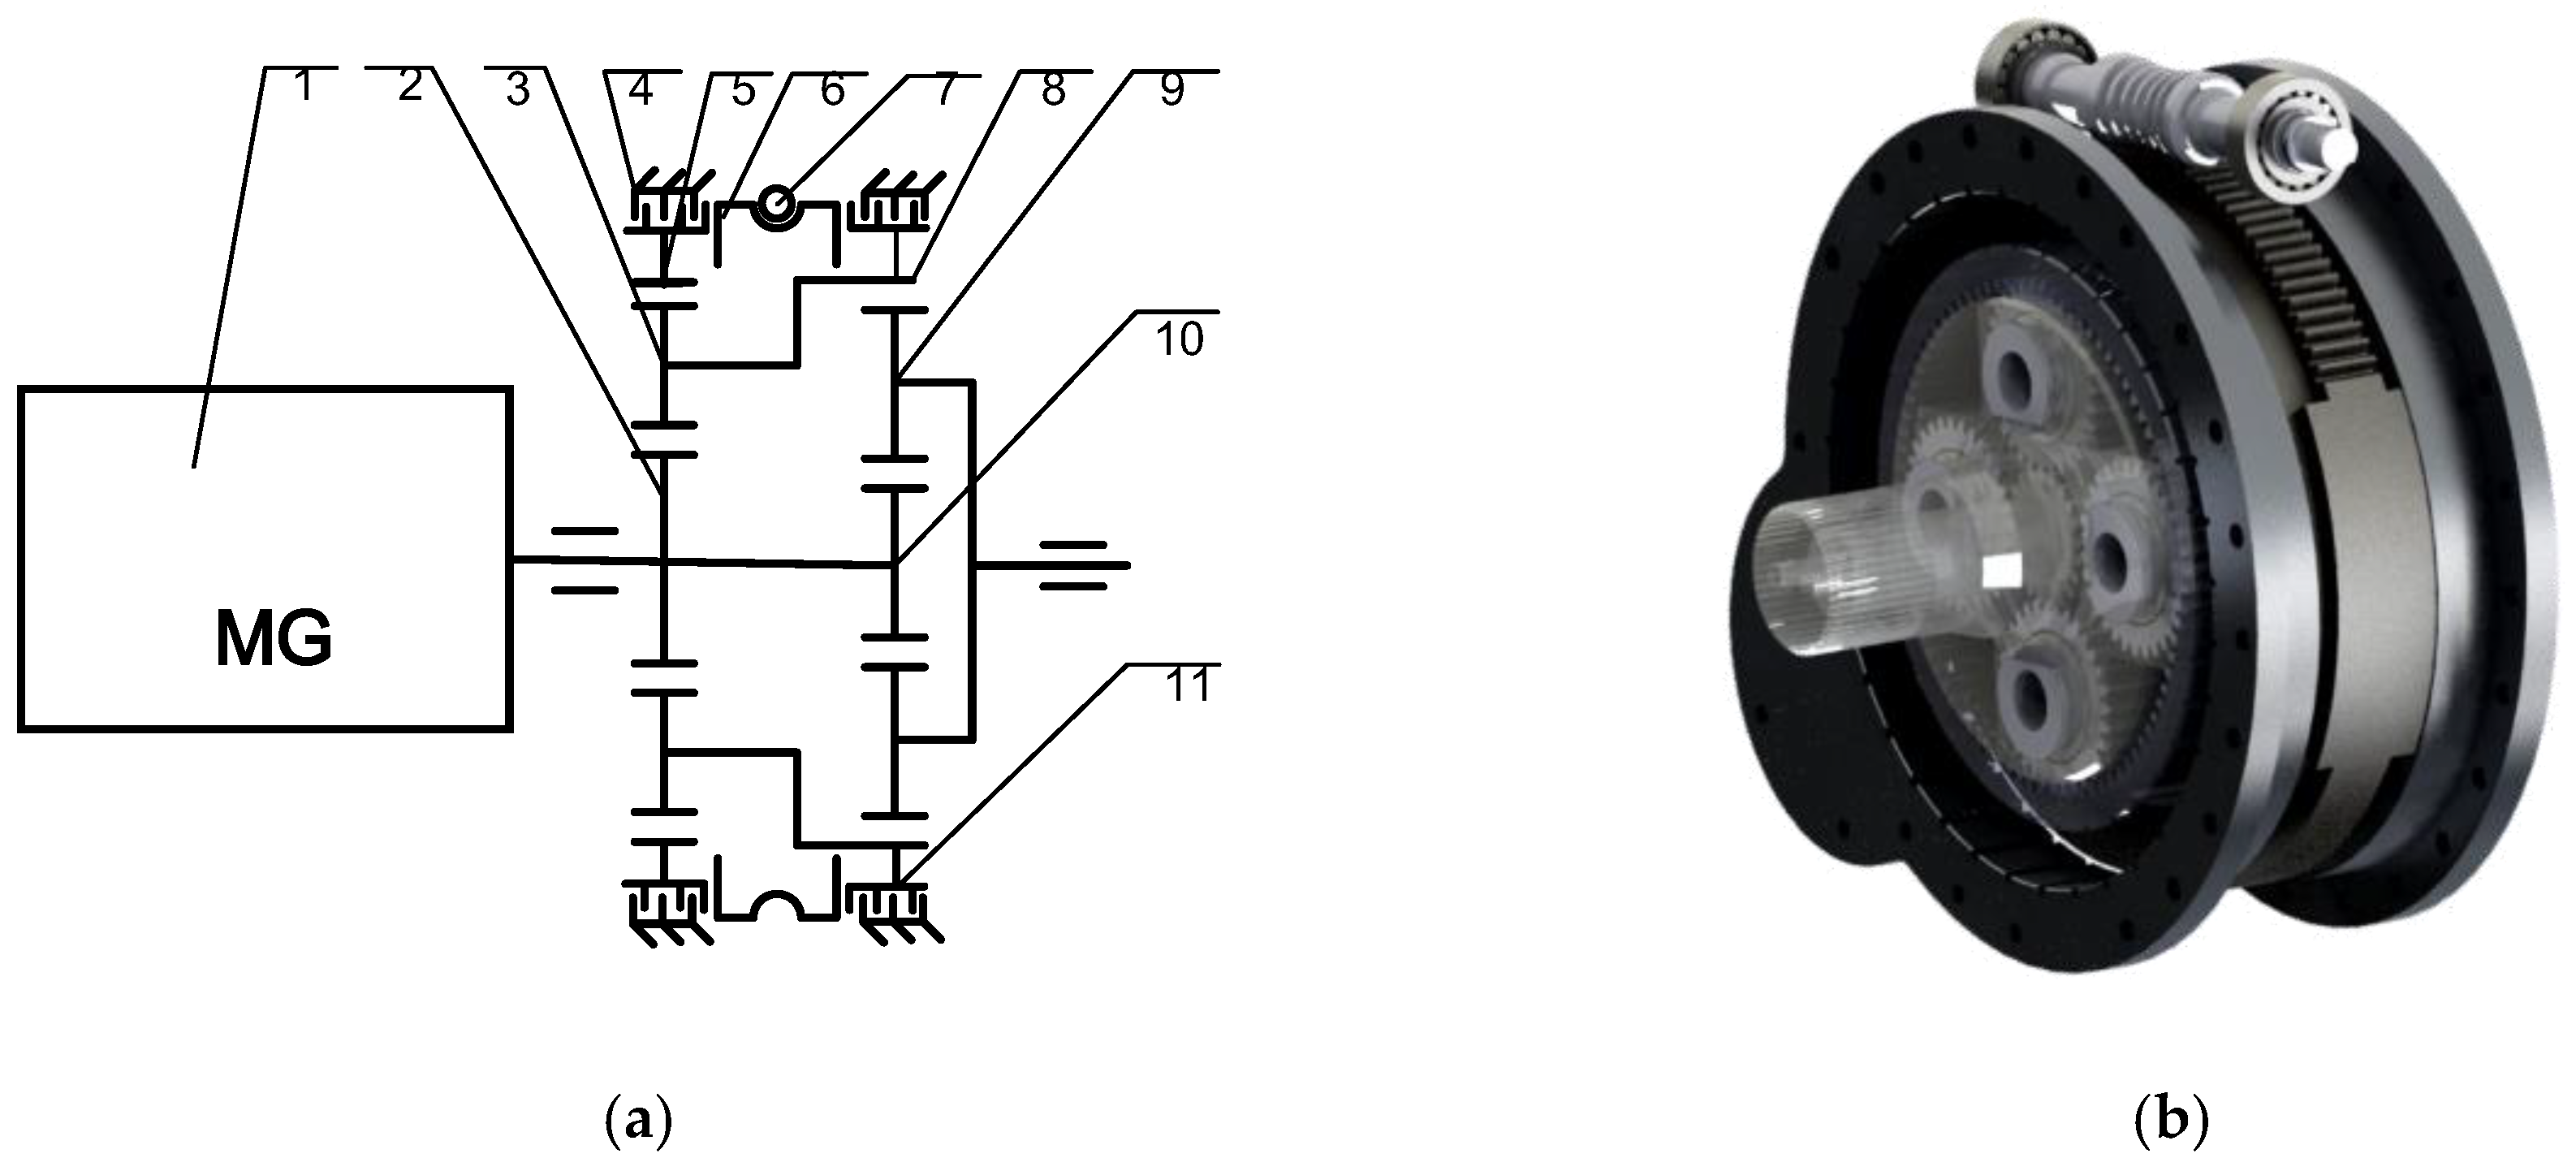
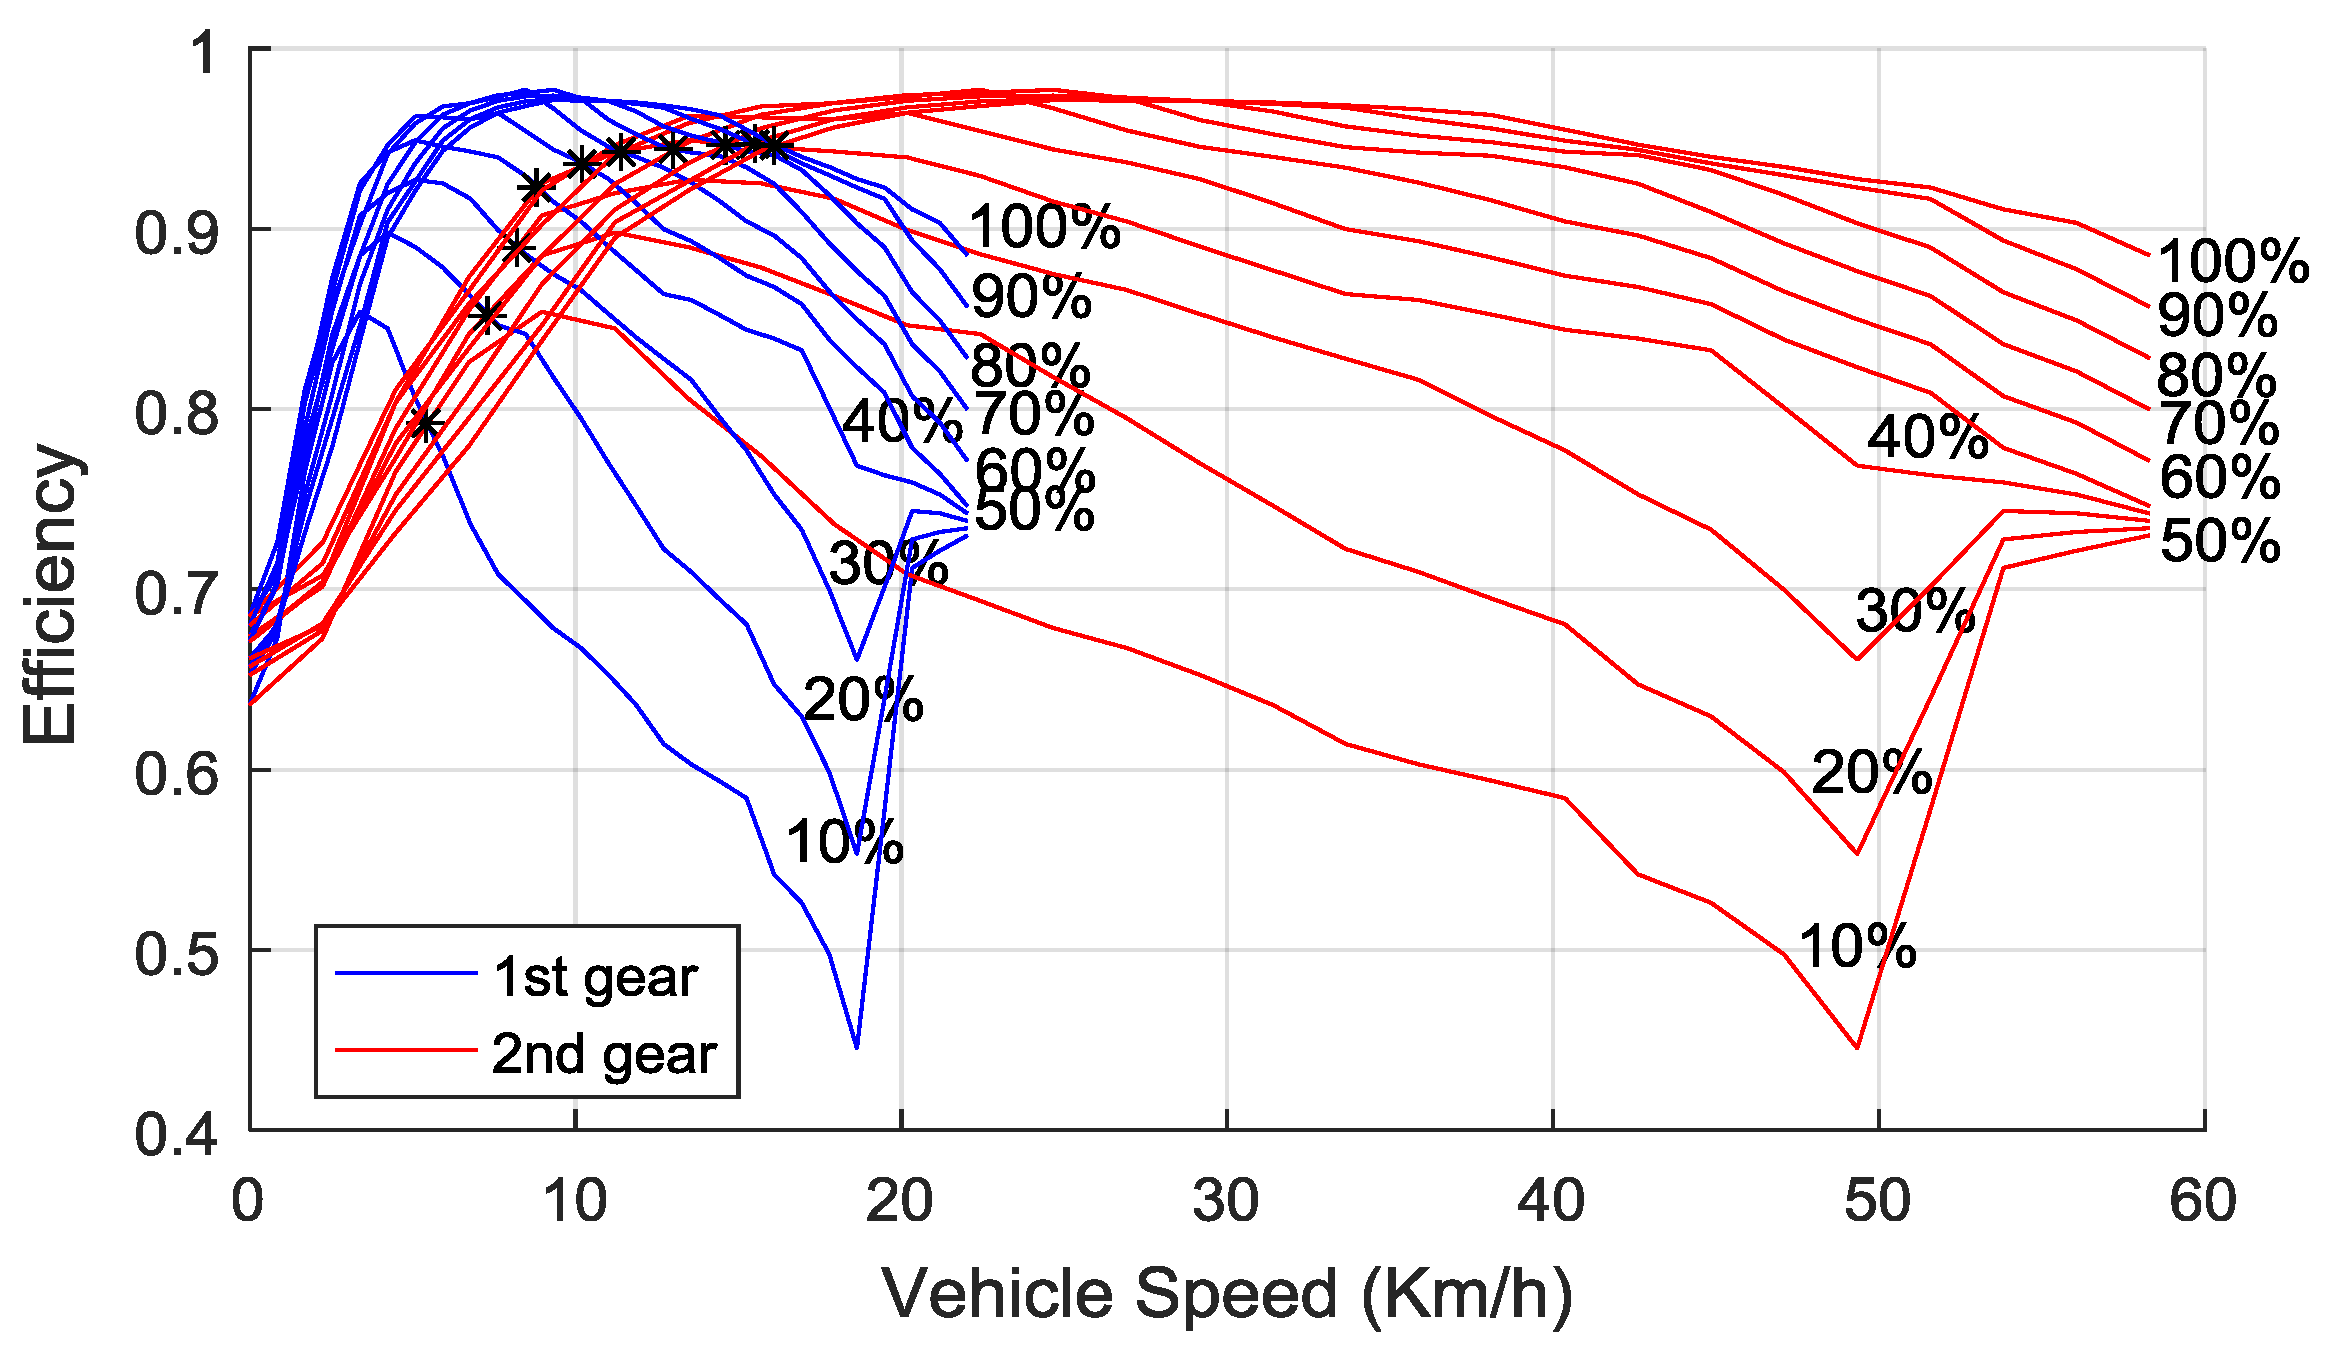
2.1. Dynamics of the Transmission
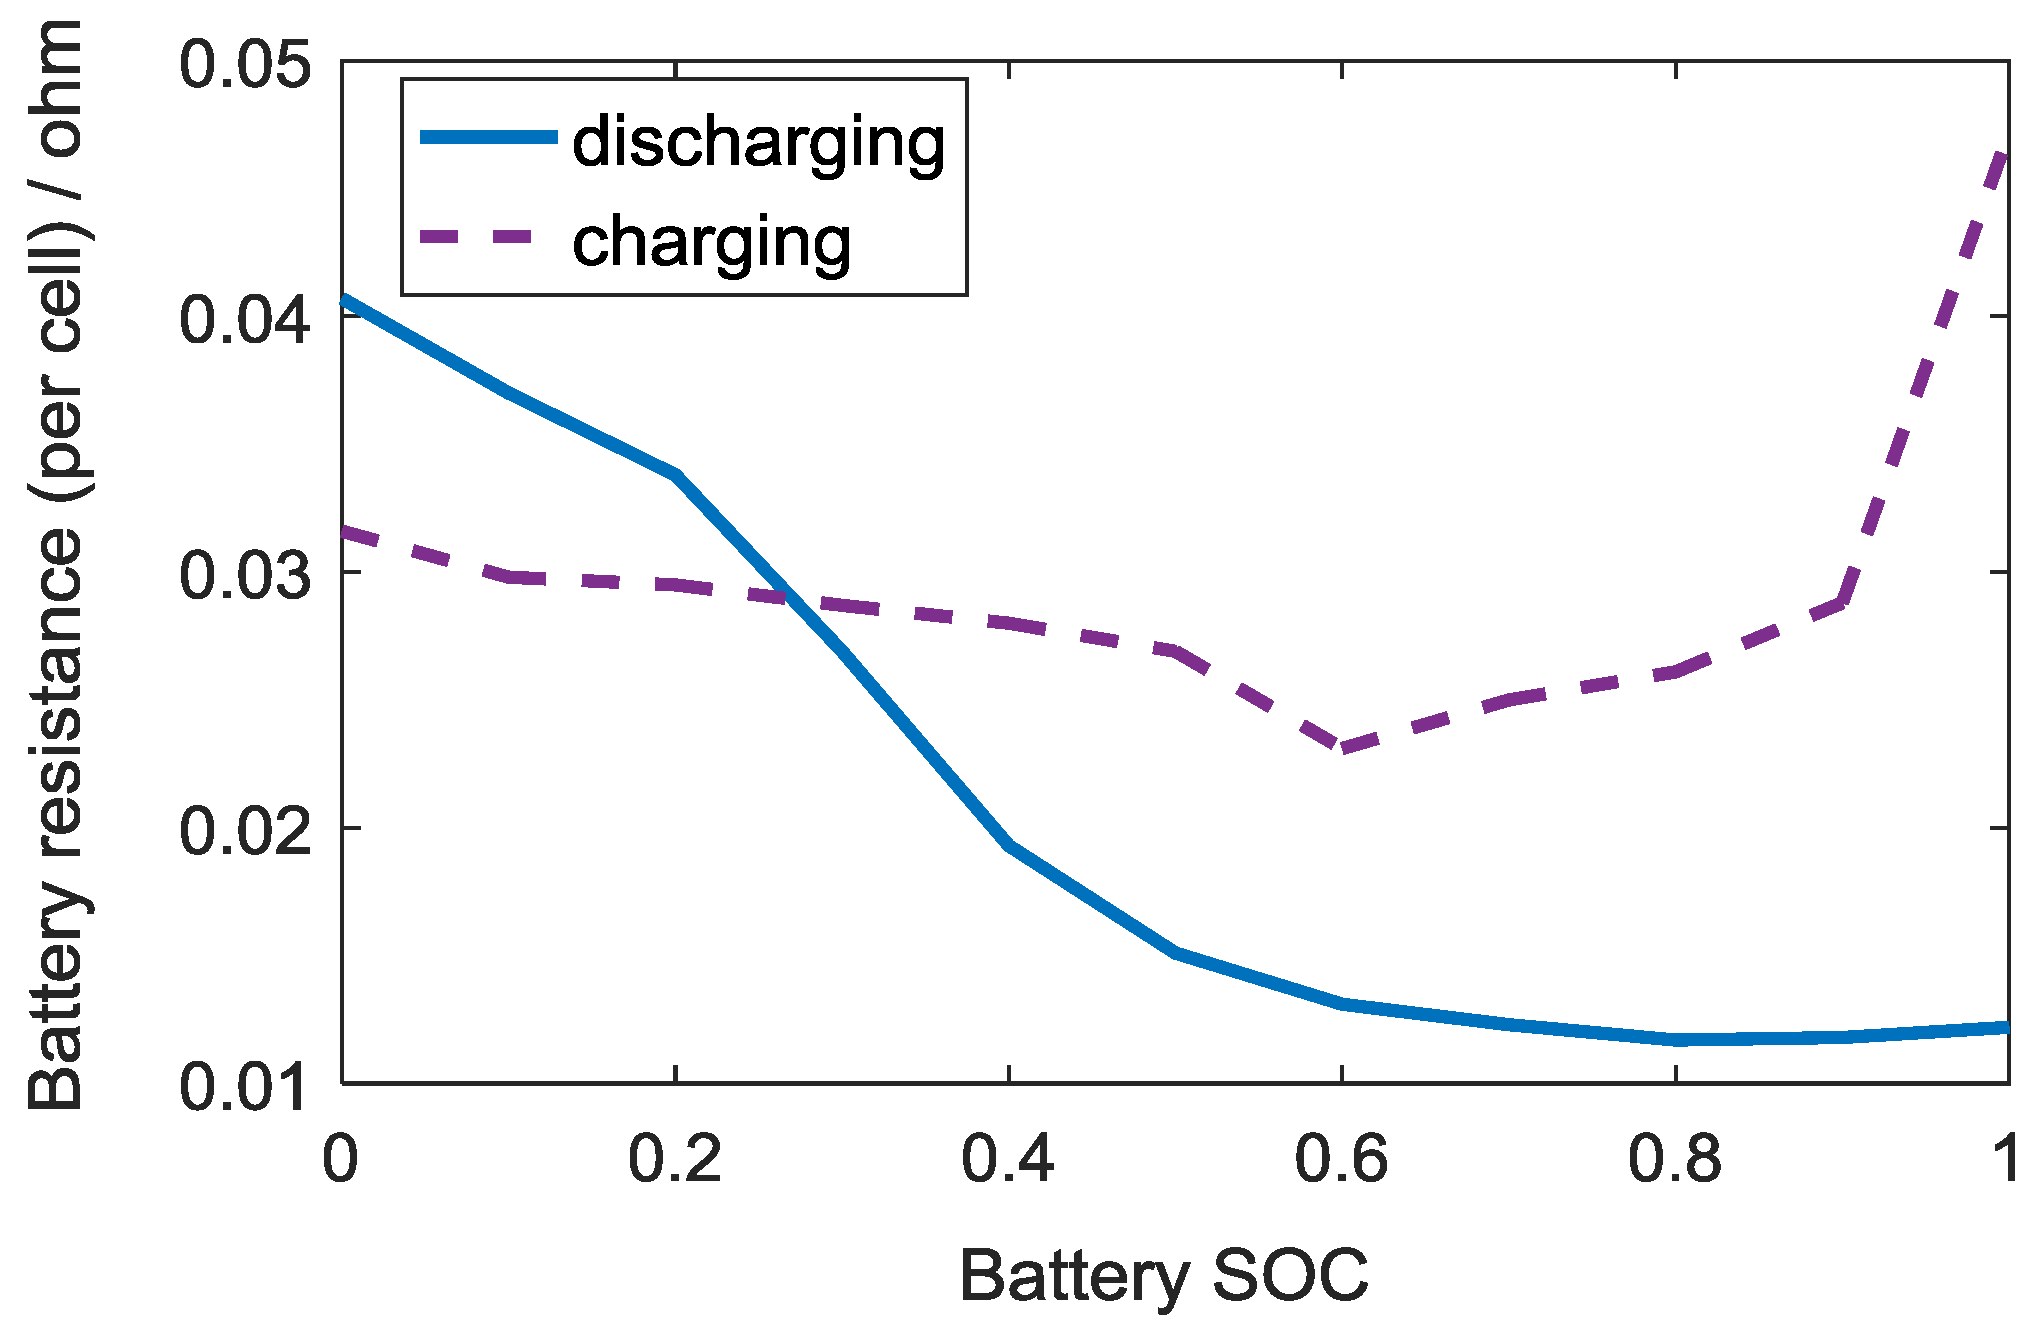
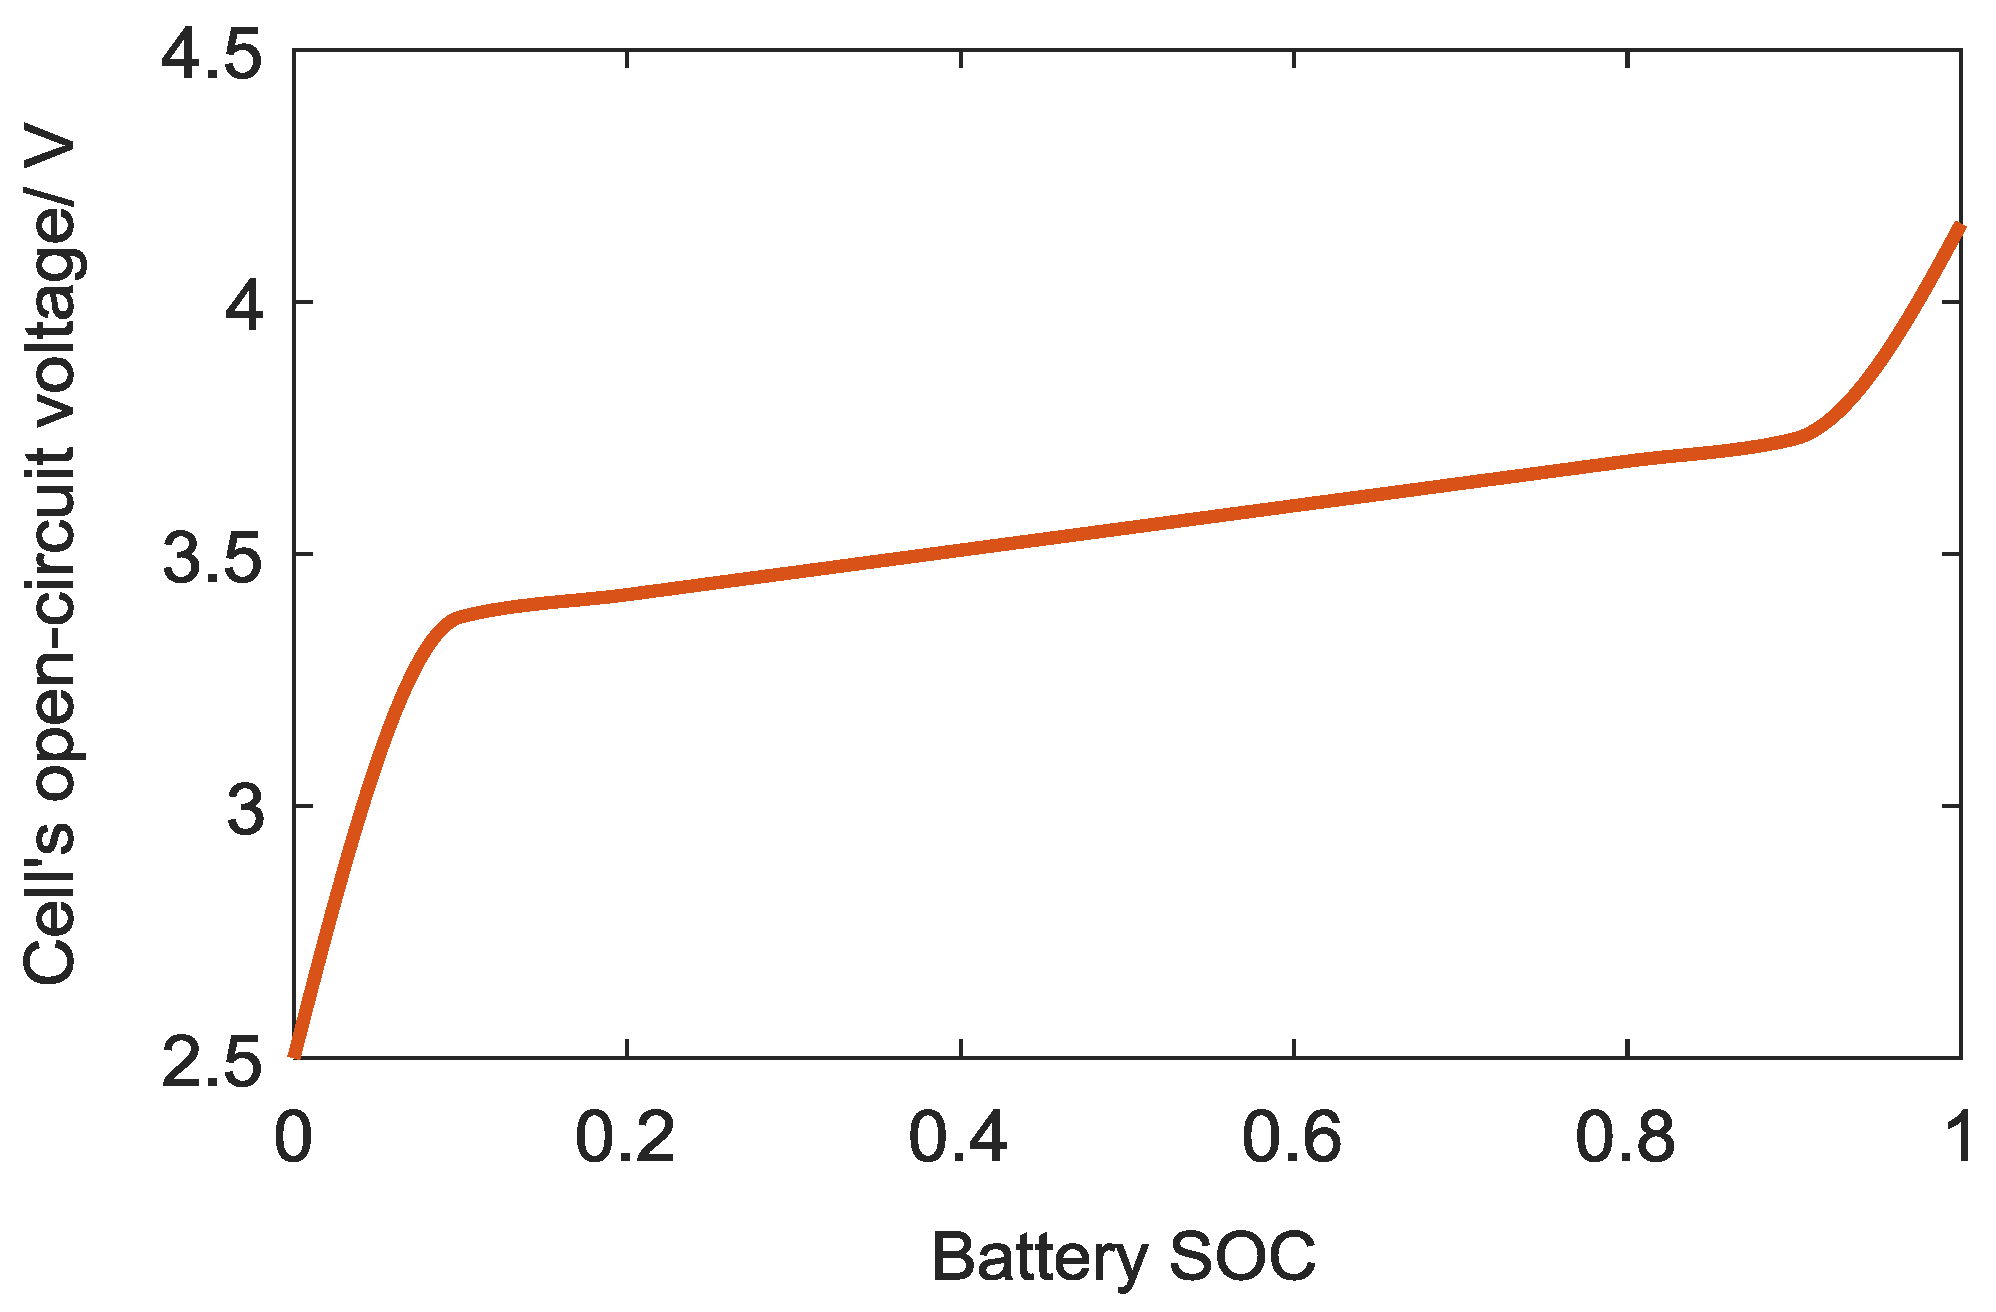
As shown in Figure 2a, the novel transmission is composed of two planetary sets and two brakes with two sun gears installed on the same shaft and connected to the input shaft, while the 1st carrier and 2nd ring gear are joined together. The gear position is determined by the states of the two brakes, as illustrated in Table 2. The engagement process is performed by the screw clutch, shown in Figure 2b. The worm is driven by a motor, and the rotational motion of the worm gear is subjected to the guidance of the spiral line to produce an axial displacement to press the brake disc.
Figure 2.
The layout of the transmission: (a) Schematic diagram; and (b) the designed transmission in SolidWorks ( MG, motor/generator; 1, drive motor; 2, 1st sun gear (S1); 3, 1st planet gear (C1); 4, 1st brake (B1); 5, 1st ring gear (R1); 6, worm shaft; 7, worm gear; 8, 2nd ring gear (R2); 9, 2nd planet gear (C2); 10, 2nd sun gear (S2); 11, 2nd brake (B2)).
Table 2.
Brake states for gear.
A planetary gear is made up of a sun gear, a carrier, a ring and four planet gears. Supposing to be the angular velocities of the sun, planet, carrier and ring gears, respectively, the kinematic constraints can be expressed as follows in the hypothetical situation of pure rolling between each two contacted elements [23].
with
stands for the number of teeth of the corresponding gear. Besides, considering the physical connections between the two planetary sets, there are several extra constraints:
where represents the angular velocity of the input shaft.
Applying the D’Alembert principle [24], the torque balance equations of the relevant components can be established as shown below, assuming all elements to be rigid bodies.
with denoting the torque applied to the corresponding element, referring to the respective angular acceleration, and presenting the moment of inertia of the related element.
Finally, substituting Equations (5) and (6) into Equations (2) and (3), and arranging the rest of the equations, the final mathematical model of the transmission is established as below.
2.2. Battery Model
The Li-ion battery, which is known as the energy storage system for the electric vehicle, forms a significantly complicated nonlinear and time-varying system with plenty of related research [25,26,27]. As this paper does not focus on the study of battery performance or cycle life, a simplified model is applied in the simulation experiment to speed up the calculation. Thus, the static equivalent circuit model, which considers both the degree of simplicity and accuracy, is considered in the simulation, ignoring the dynamic characteristics of the battery. The mathematical expression of the battery can be expressed as:
where stands for the battery terminal voltage, open-circuit voltage, instantaneous current and internal resistance, respectively. The relationship between the internal resistance and the state of charge (SOC) is shown in Figure 3, with the solid line presenting the discharging resistance and the dashed line presenting the charging resistance, assuming the temperature is constant during the working cycle; meanwhile, the tendency of the battery open-circuit voltage with SOC is presented in Figure 4. Additionally, the operating range of the battery SOC is limited from 0.3 to 1 according to the battery management strategy.
Figure 3.
The relationship between the battery internal resistance (per cell) and state of charge(SOC).
Figure 4.
Open-circuit voltage (OCV)–SOC curve.
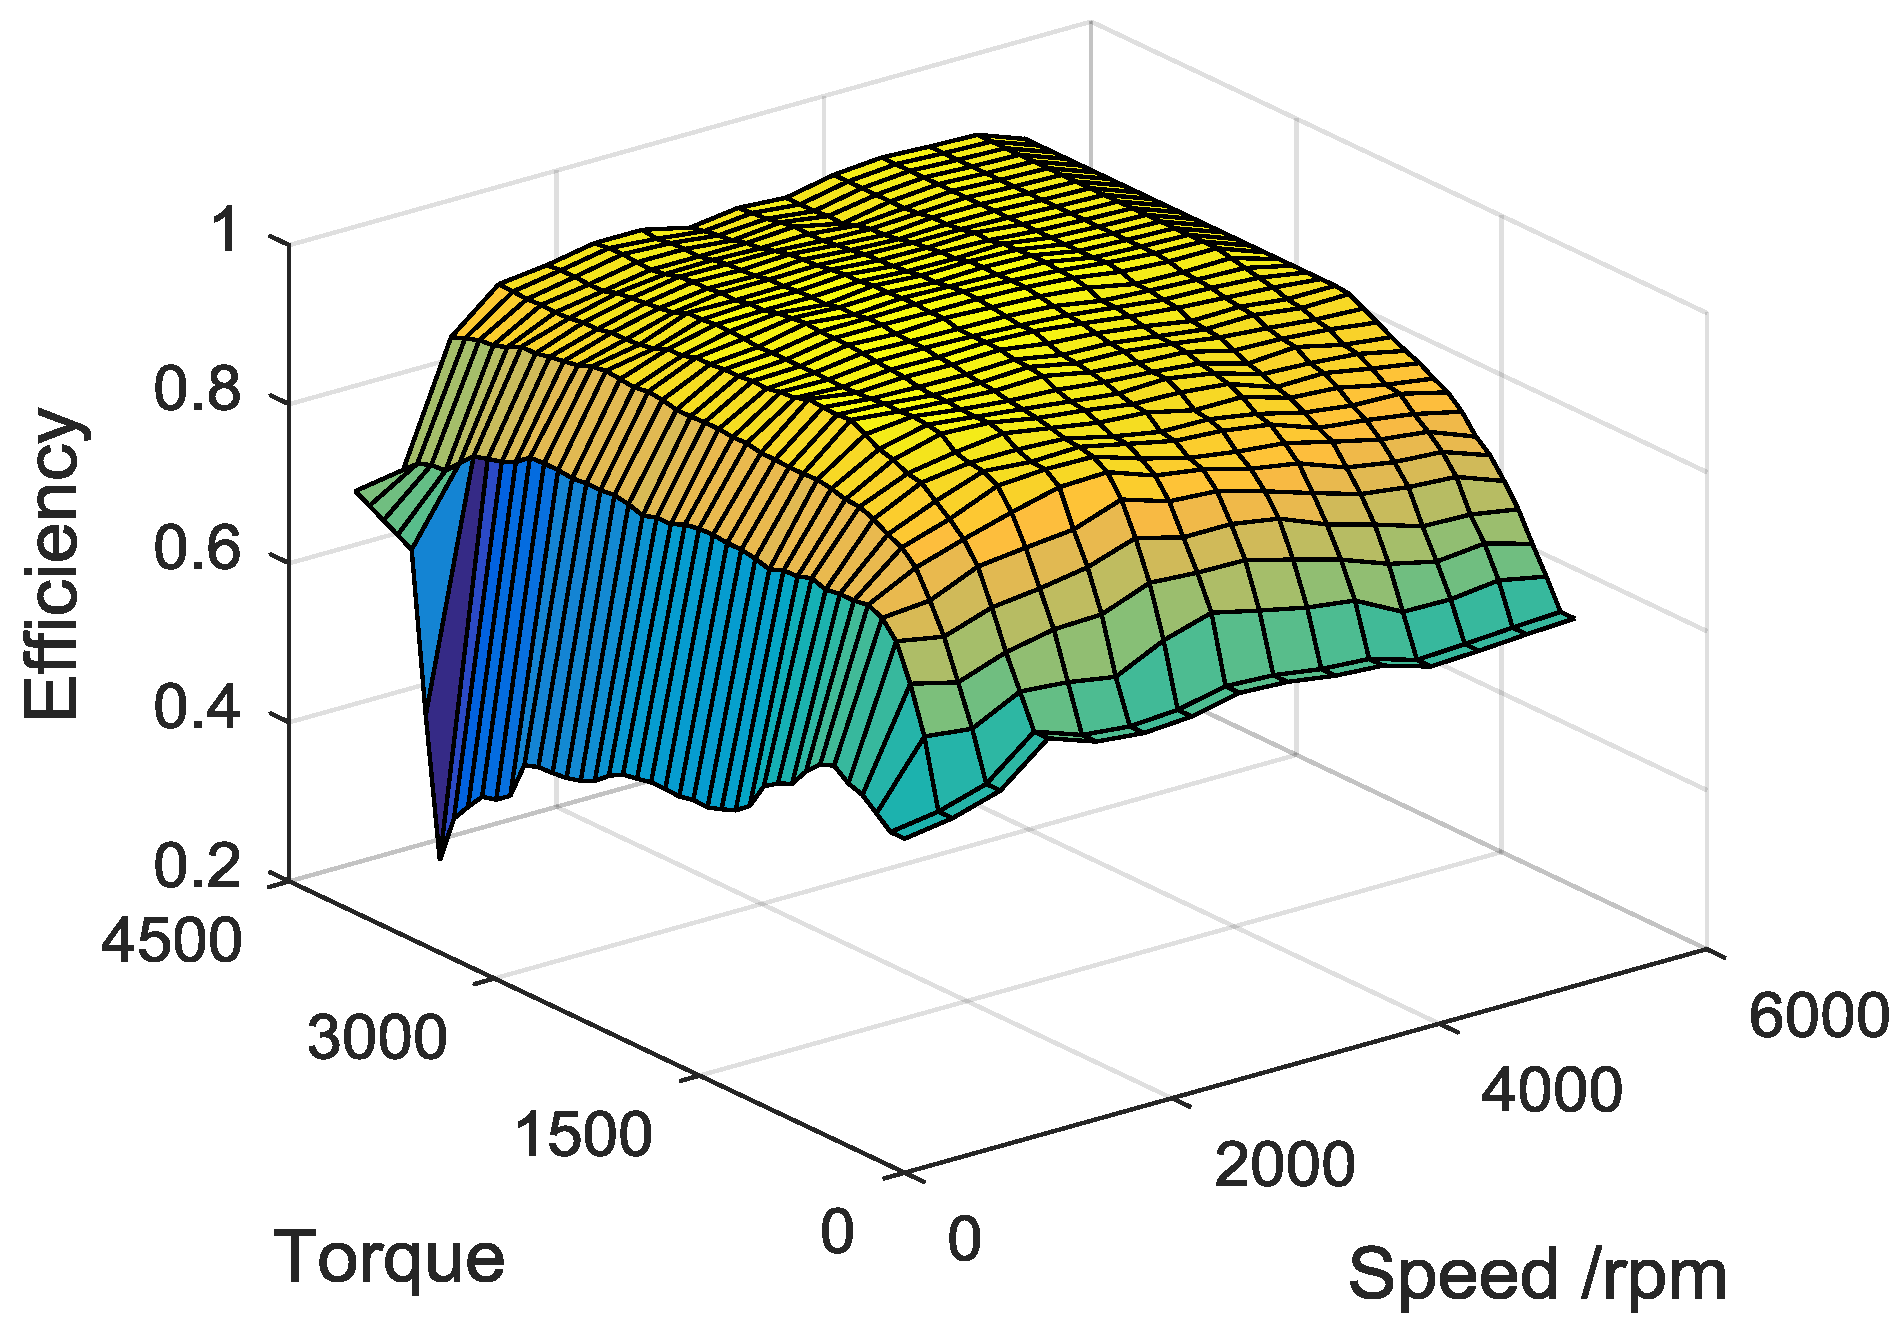
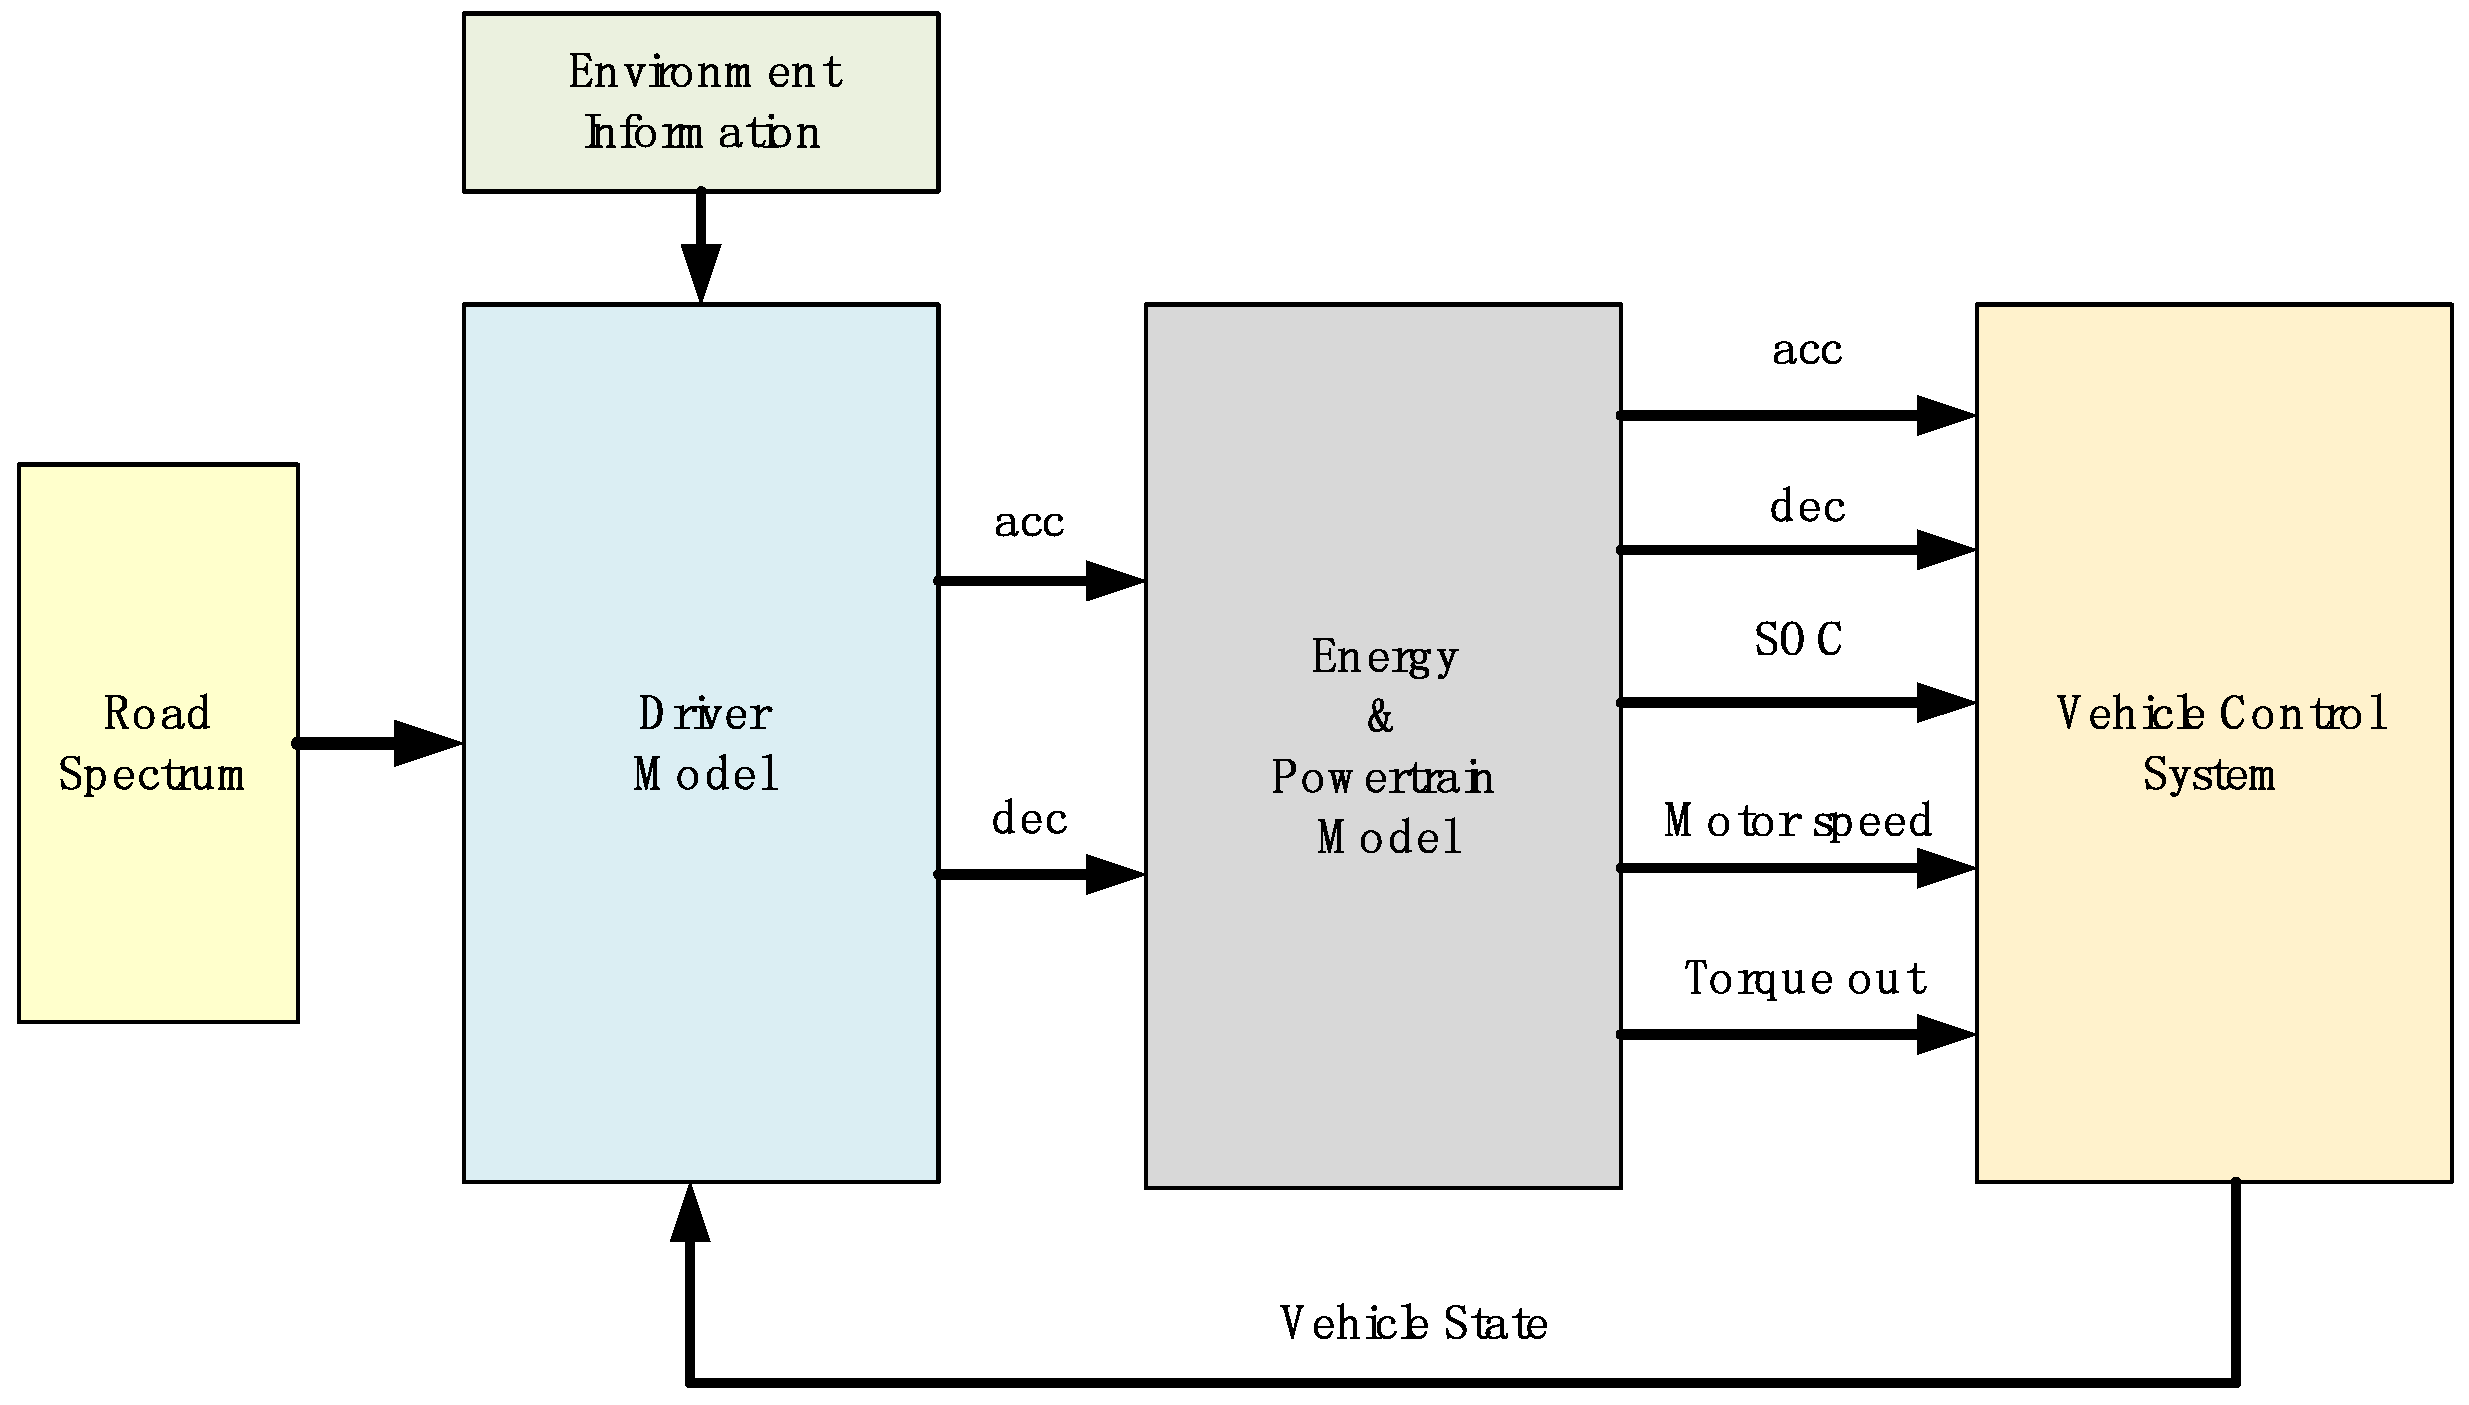
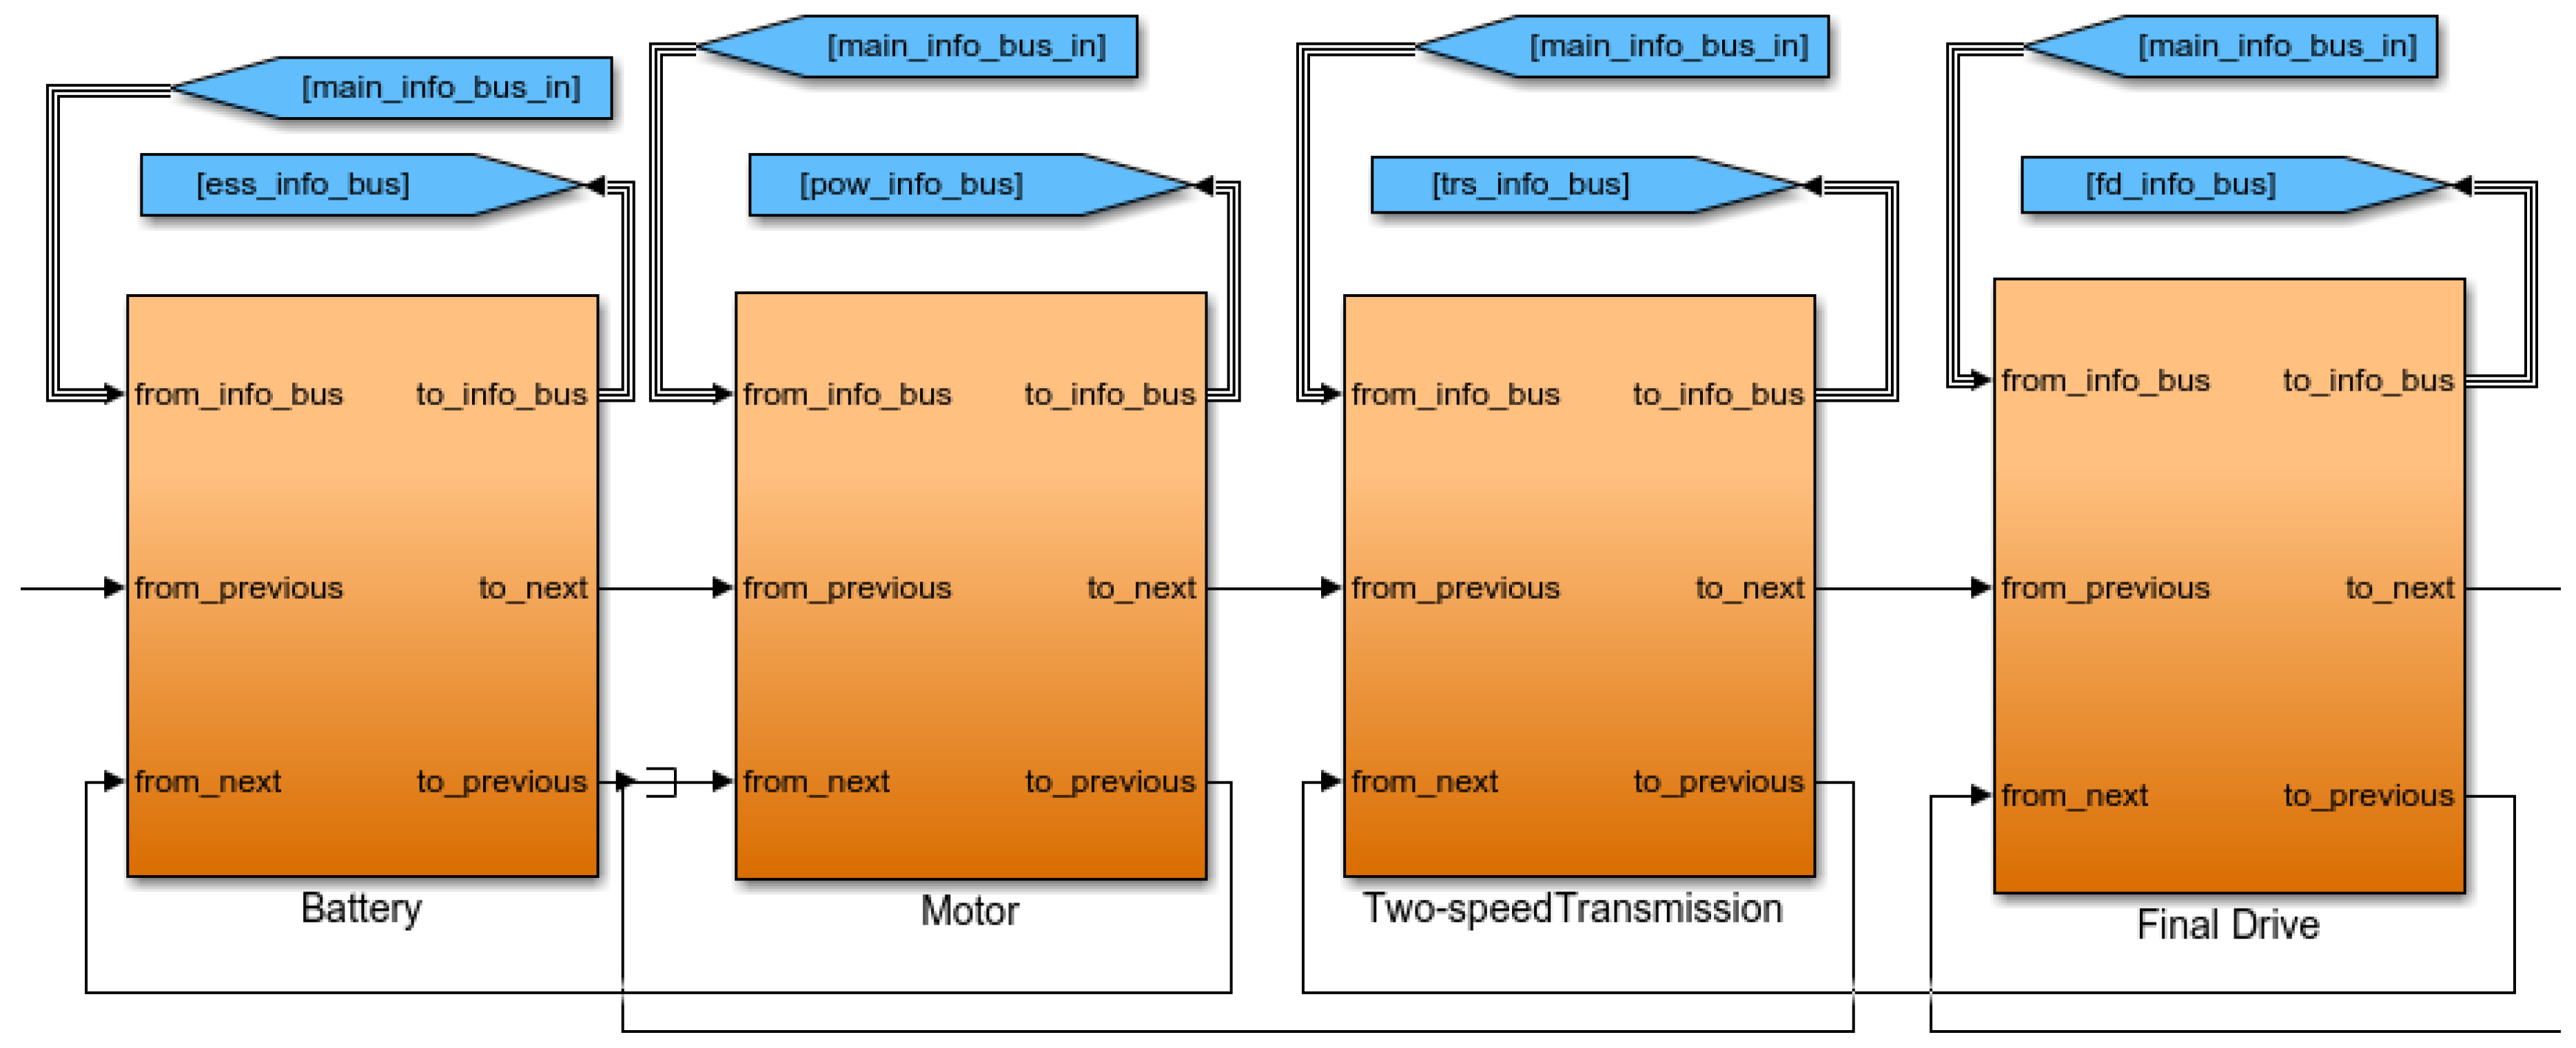
2.3. Powertrain System
The mechanical powertrain model is the crucial part of the model, involving the energy storage unit, a permanent magnet synchronous motor (PMSM), the two-speed transmission and the final drive. Figure 5 describes the overall arrangement of the powertrain in simulink.
Figure 5.
Block diagram of the powertrain.
3. Shift Schedule and Gear Ratio Optimization
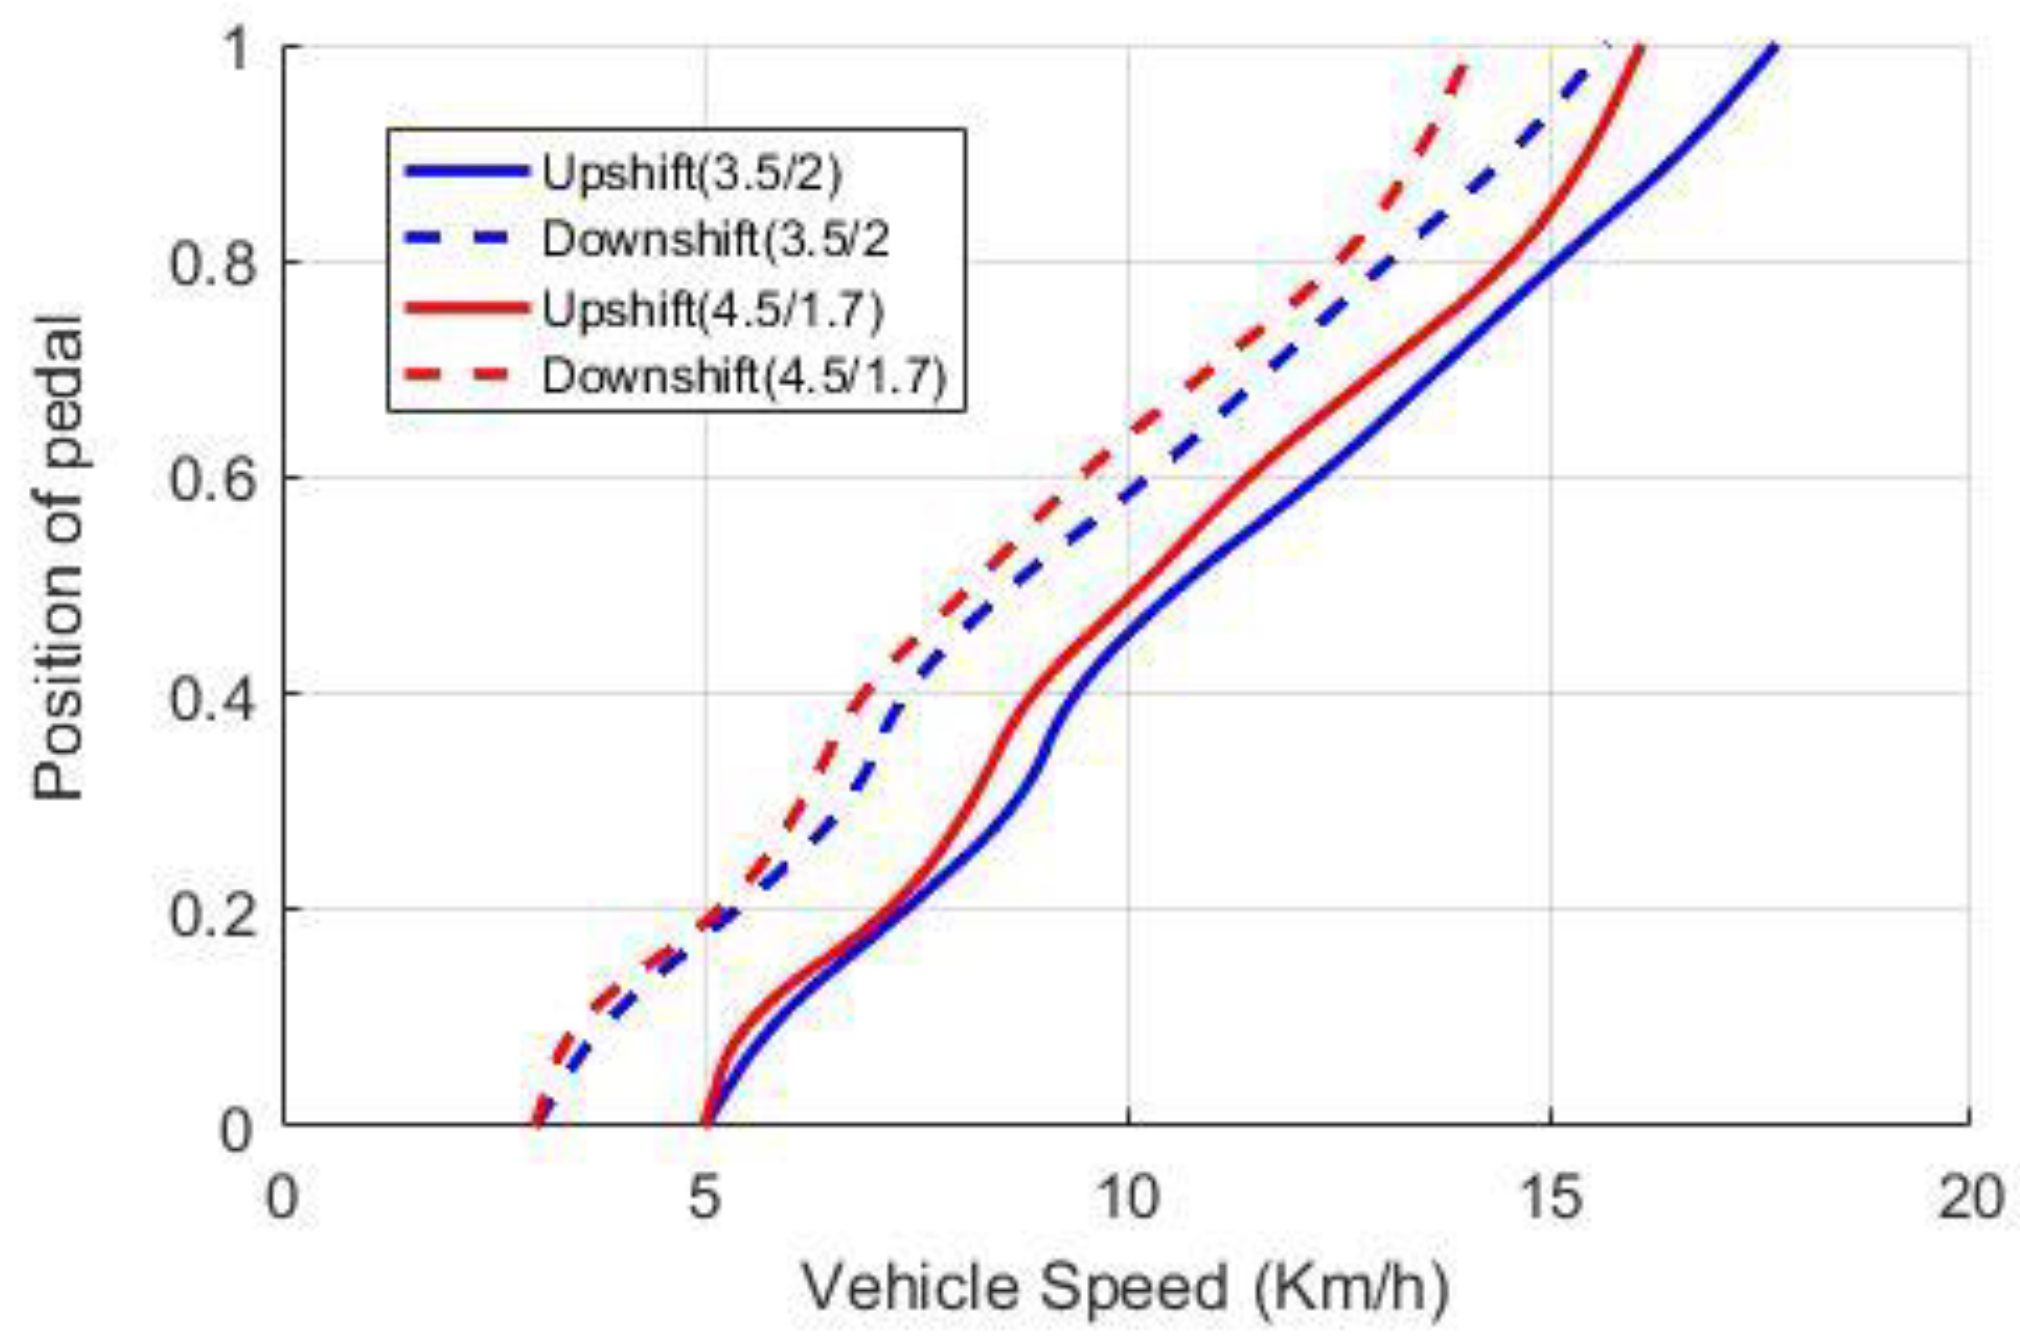
For the sake of applying the two-speed transmission in the EDT powertrain system, the gear ratio and shift schedule have in this section been developed via the optimization algorithm to reduce the energy consumption during the working cycle.
3.1. Shift Schedule
The shift schedule can influence the energy consumption to a degree. To achieve the energy conservation goal, the shift schedule basis of the economic performance, similar to the internal combustion vehicle shift schedule, is designed. The pedal position and motor speed are considered the shift parameters. Initially, the efficiency curves of each gear in different pedal positions are plotted according to the motor efficiency map. The motor efficiency map and efficiency curve are shown in Figure 6 and Figure 7, respectively. Following this, the intersection of the 1st gear curve and the 2nd gear curve is designed as the shifting point. The shift schedule changes with the change of gear ratio in the iteration to make the optimization results more accurate. Figure 8 shows two different shift schedules with different gear ratios. The red line presents the shift schedule under the ratios 4.5 and 1.7, while the blue one represents the ratios 3.5 and 2. As shown in the figure, the shift schedules are quite diverse due to different gear ratios. Moreover, to avoid shifting frequently, there is a speed interval between the upshift and downshift schedules.
Figure 6.
The motor efficiency map.
Figure 7.
Efficiency curves on different pedal positions.
Figure 8.
Shift schedules under different gear ratios.
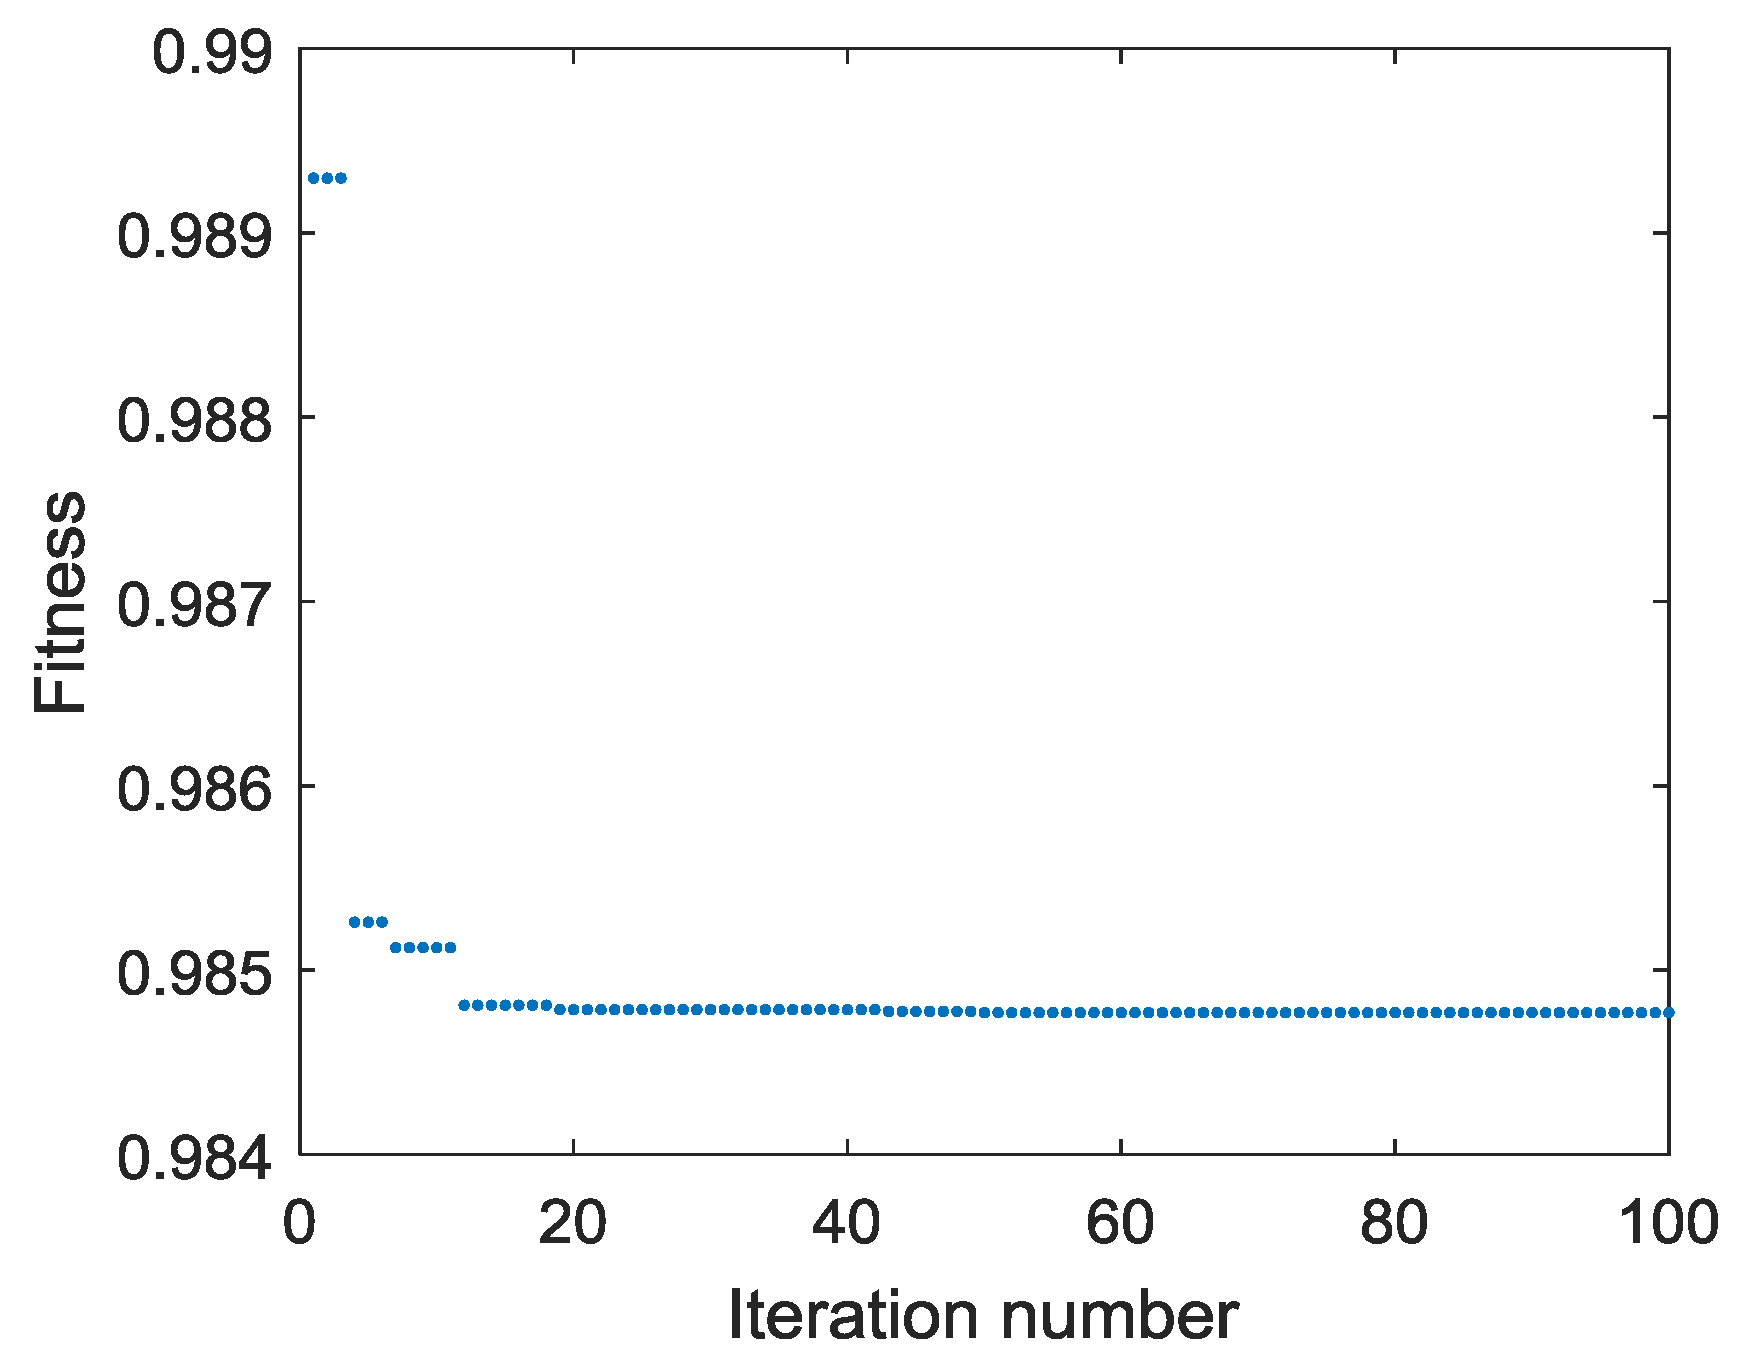
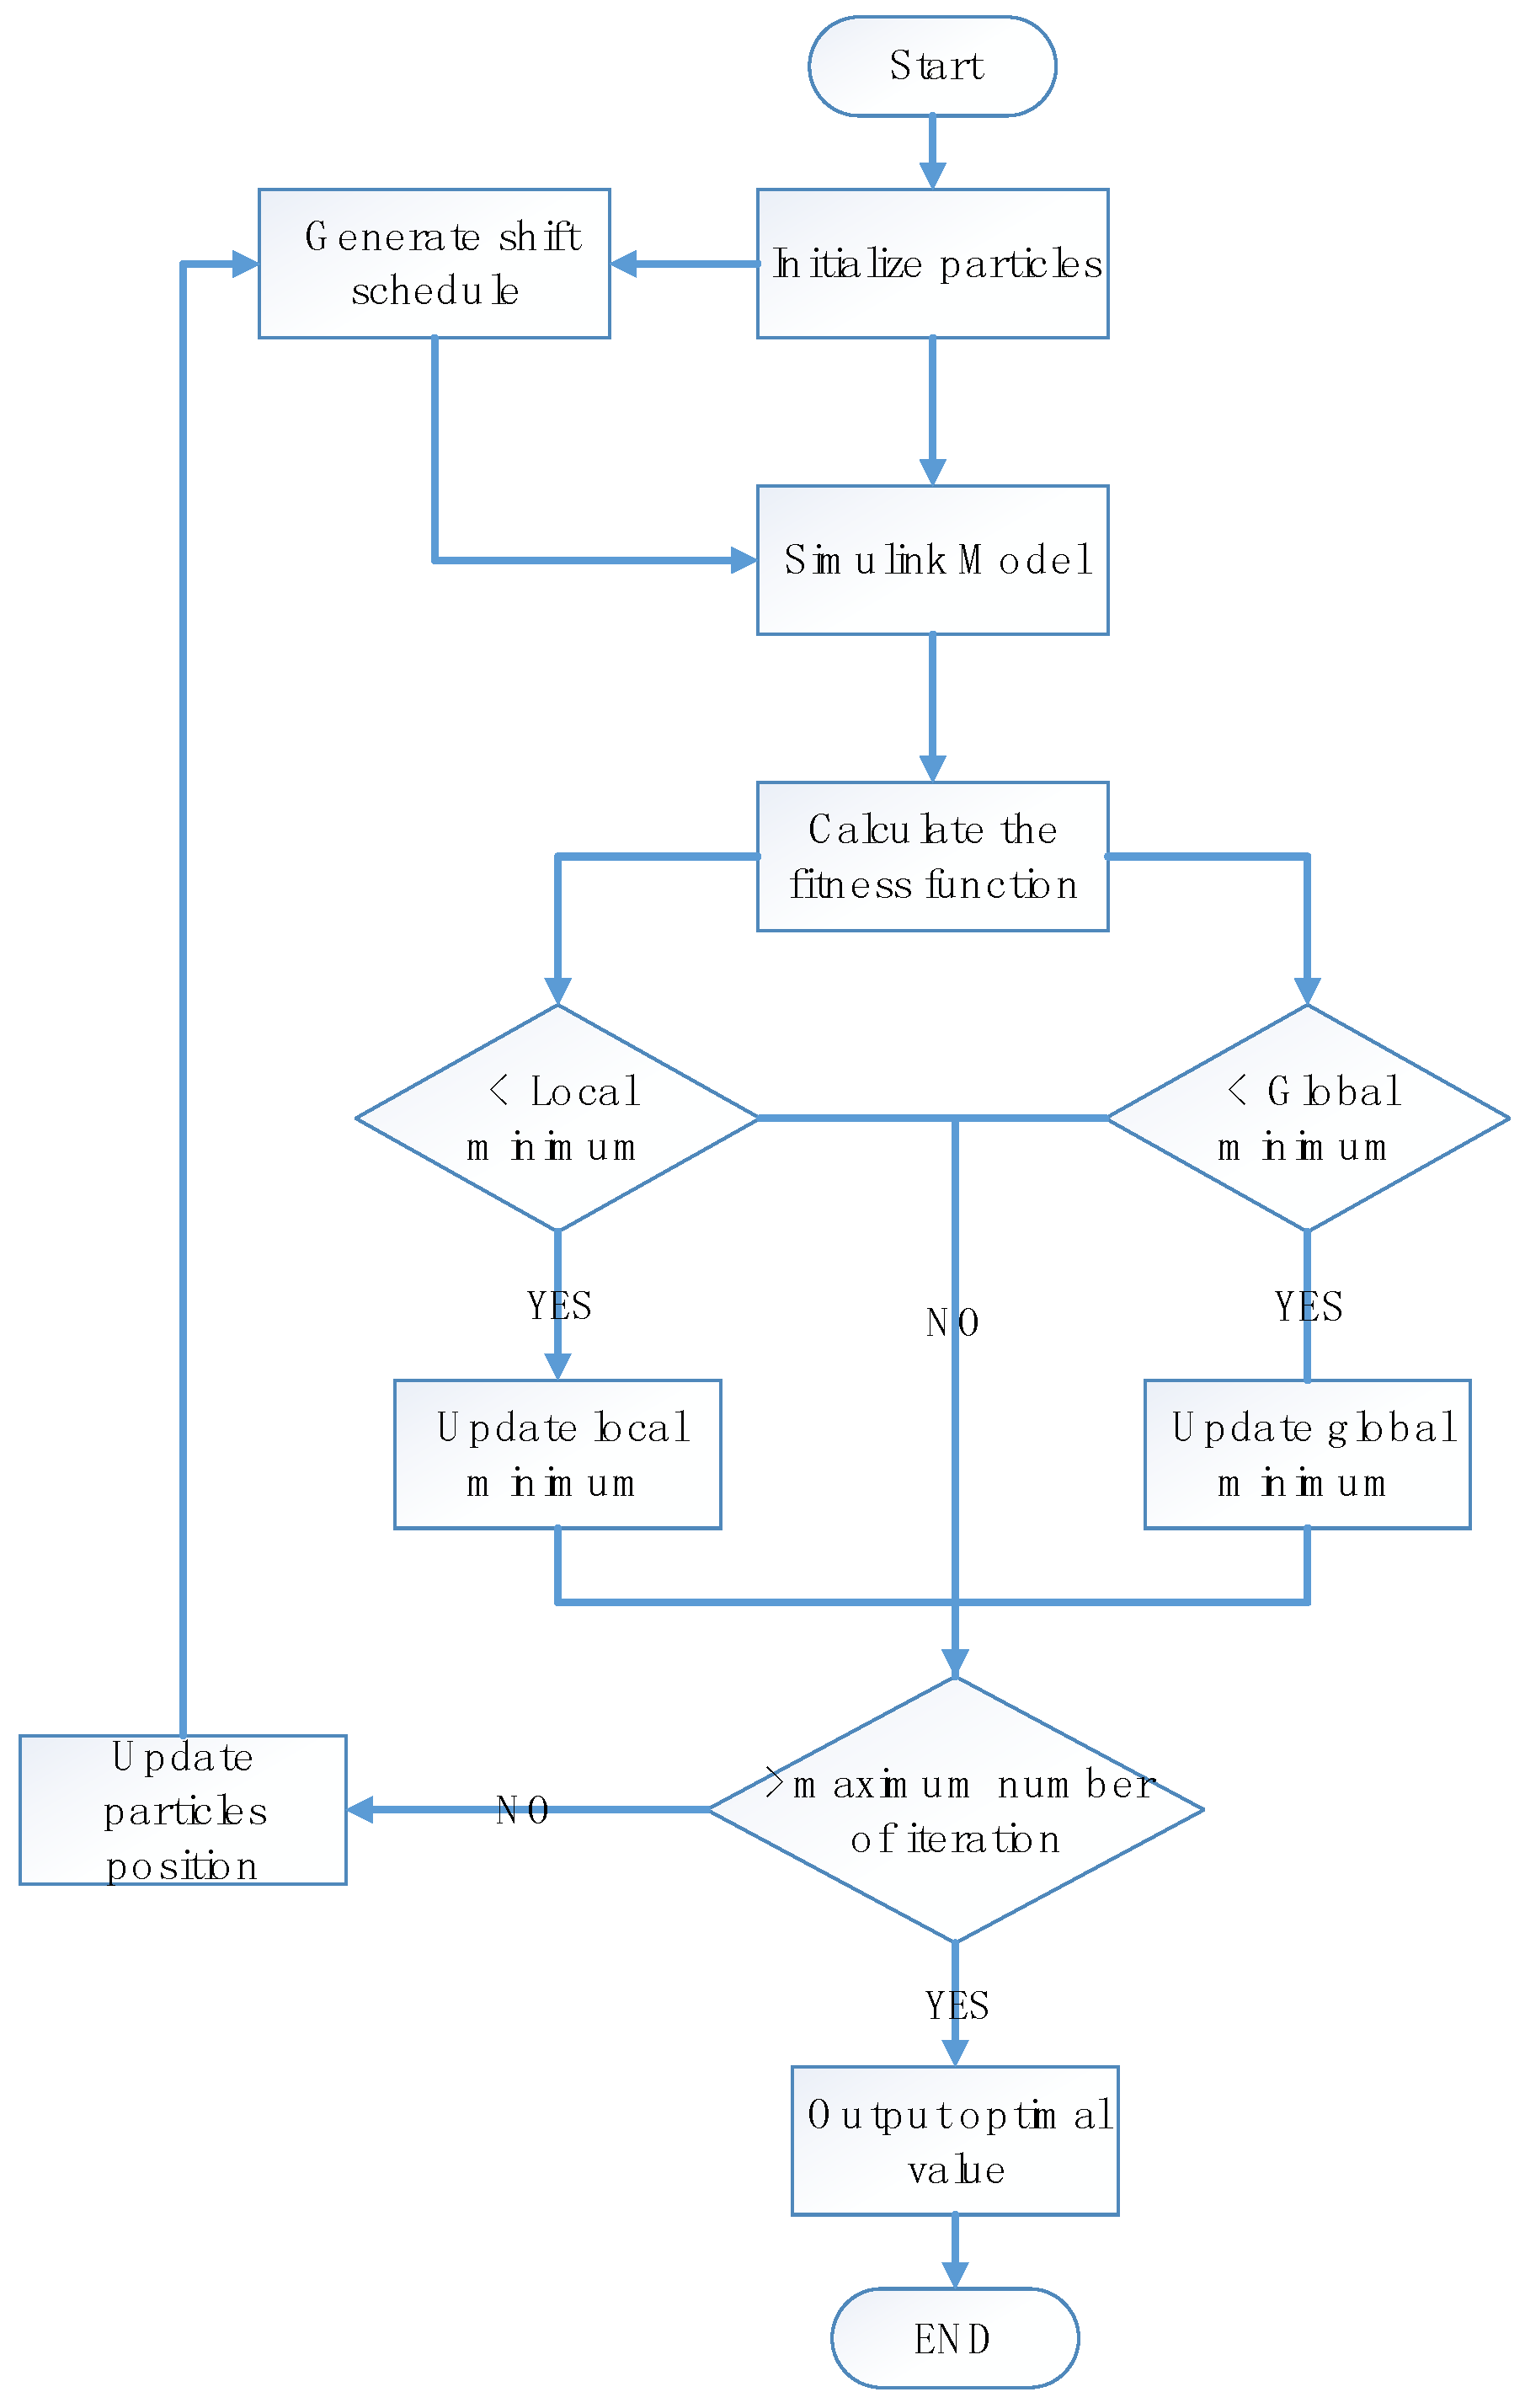
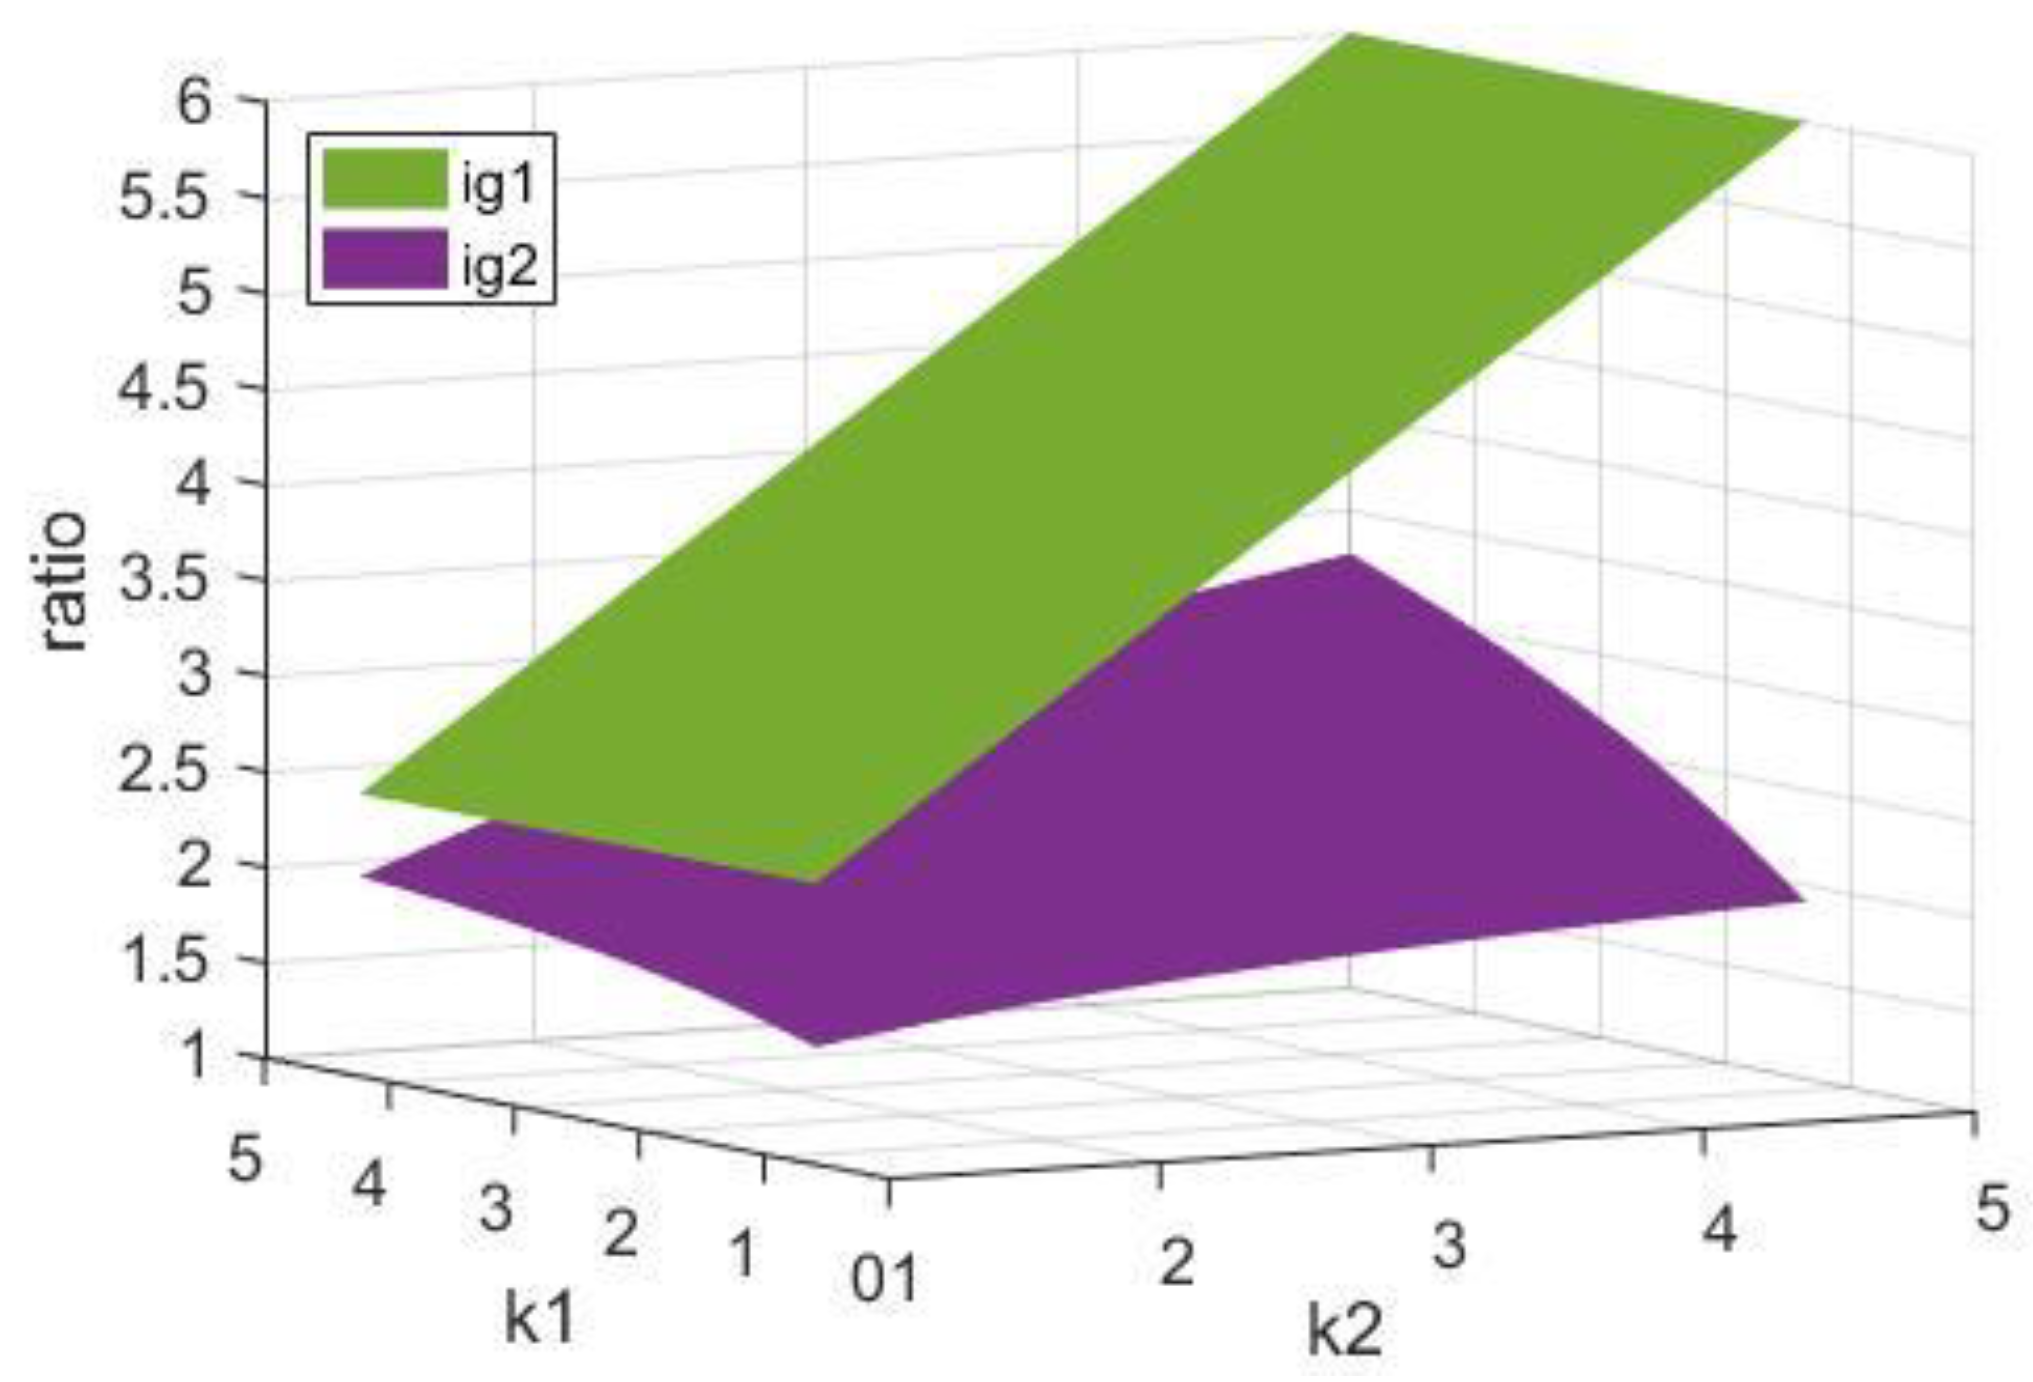
3.2. Gear Ratio Optimization
There are many algorithms for gear ratio optimization. Additionally, the common method is the enumeration algorithm, in which the global optimization result can be ensured. However, the accuracy of enumeration is limited to the step length and computing capability. In this paper, a gear ratio optimization algorithm is put forward based on the improved particle swarm optimization algorithm (PSO). The PSO algorithm is a kind of swarm intelligence optimization algorithm, in which the random particles generated by the initialization are iterated to search for the optimal solution. In each iteration, the particle location is updated by tracking the current local optimum and the global optimal solution. Additionally, the termination condition is generally set to achieve the maximum cycle number or to meet the minimum error condition [28,29]. To prevent the PSO algorithm from falling into the local optimal solution, a random variation factor is introduced to the algorithm. If it meets the trigger condition, the particle location generates a random offset. The flow of the PSO algorithm can be described in the following steps:
Step 1 (Initialization): Set the time counter and generate particles randomly, , with a uniform probability over the parameter feasible region. Similarly, the initial velocities of all particles, , is generated randomly with a uniform probability. The initial particles are evaluated via the objective function, . Search for the best value as . Set the particle related with as the initial global optimal position, , and set each particle as the initial local optimal, , respectively.
Step 2 (Time updating): Update the time counter .
Step 3 (Velocity updating): Using the global optimum and local optimum of each particle, the velocity is updated according to the following equation:
where and are positive coefficients, and are two random values belonging to (0, 1).
Step 4 (Position updating): Each particle updates its position based on the updated velocity:
Step 5 (Local optimal position updating): Each particle is evaluated according to its updated position. If , then update the local optimal position as and .
Step 6 (Global optimal position updating): Search for the minimum value among , where min is the index of the particle with a minimum objective function. If , then update the global optimum as .
Step 7 (Stopping): If one stop requirement is satisfied then stop; otherwise, go to Step 2.
Figure 9 shows the flowchart of the gear ratio optimization procedure in the Matlab/Simulink environment.
Figure 9.
Optimization flow chart.
3.3. The Objective Function
The objective function is essential in optimization problems. The correct selection of the objective function can guarantee the rationality of the optimization results. Gao et al. [18] and Wu et al. [15] combined the solution of an optimal gear ratio and dynamic programming (DP) together; in their research, the minimum energy consumption of the whole working cycle is taken as the objective function. Moreover, an extra term is introduced to penalize the shift frequency, which can suppress the sudden shift cases effectively in the DP progress. Sorniotti et al. [16] described the optimization procedure based on both the dynamic performance and energy consumption cost that conduct both the unladen and fully laden vehicle cases. Additionally, an estimation of the additional power that would be required to track the velocity profile is added to the objective function to filter out the unbefitting ratios. In this paper, the objective function is made up of the acceleration time, which can to a certain degree represent the time cost for vehicles under an SQ situation, and of the energy consumption, in relation to the work condition characteristics of the dump truck. Moreover, related research shows that the scale of the two gear ratios can influence the electrotype of the motor. The larger the scale, the faster the response that is required. To control the cost of the powertrain system, the scale of the two ratios should be limited to a reasonable range using a penalty term. The details of the objective function are shown below:
First, the energy consumption of the whole cycle is used as the economic performance objective function. In this simulation, the whole cycle is divided into N segments by time interval. In every tiny span, the energy consumption is calculated by integration of the demand power, after which the total energy consumption is obtained by accumulation. The mathematical expression is:
Following this, the dynamic performance is determined via the acceleration time of 0 to 60 km/h as being a straight path, given that the maximum speed of the EDT is 60 km/h. Thus, the dynamic objective function consists of the acceleration time during the first gear stage, acceleration time during the second gear stage and shifting time. The time consumed at each stage can be calculated via the integral of the velocity. Consequently, the function can be expressed as:
where represent the driving force in first gear and second gear, respectively; is the auto rotary mass coefficient; , which is the shifting time, is 1 s; and represent the air resistance and rolling resistance, respectively.
Finally, if there is a disparity between the two gears, the difficulty of shifting would increase and the ride comfort performance could not be guaranteed. As it shows the more noticeable difference, the faster response speed of the motor is required, and it would influence the cost of the motor significantly. Thus, a penalty term is applied to limit the ratio of the two gears:
To guarantee the uniformity of magnitude between different objective functions, normalization is necessary. Therefore, by defining the corresponding performance indicators of the single speed transmission dump truck as the reference values, the final objective function can be expressed as:
where on behalf of the optimization variables; and represent the reference energy consumption and reference acceleration time, respectively; and represent the energy consumption and acceleration time in each iteration; and is the disparity between the two gears in each iteration. are the weight coefficients of different objective functions. In combination with the demand characteristics of the mining operation, the selection of the weight coefficients is:
3.4. Inequality Constraints
During the optimization procedure, it is essential to set inequality constraints to ensure the basic dynamic performance of the vehicle and safe operation of the motor and battery. Additionally, the mechanical structure of the planetary sets could restrict the ratio within a certain range.
In this optimization, the constraints are therefore determined by the maximum vehicle speed, maximum climbing degree, adhesion limit and planetary rows structure. To ensure the maximum speed as well as the torque demand at the maximum speed, the inequality constraints for can be expressed as follows:
where 0.377 is the unit conversion factor.
where is the gravity acceleration, is the transmission efficiency at second gear, and is the air density.
The value of is related to the maximum ascendable road grade of the vehicle, so the constraint is:
where is the driving efficiency of the transmission at first gear.
To retrain the driving force under the tire adhesion limit, should not exceed the threshold:
Additionally, according to the design principles of the mine dump truck, the characteristic parameters of the planetary sets of the transmission () should be limited to a reasonable range:
Once the structure of the planetary set of the transmission is given, as shown in Figure 2, the mechanical system equation of each gear can be determined as follows:
Combining Equation (22) with Equations (23) and (24), the available range of the two ratios is:
In addition, Figure 10 shows the achievable and by varying and from 4/3 to 5.
Figure 10.
The available values of ig1 and ig2.
Following this, the ultimate ratios feasible region is obtained by the comprehensive dynamic constraints and the structural constraints of the transmission:
4. Simulation Results
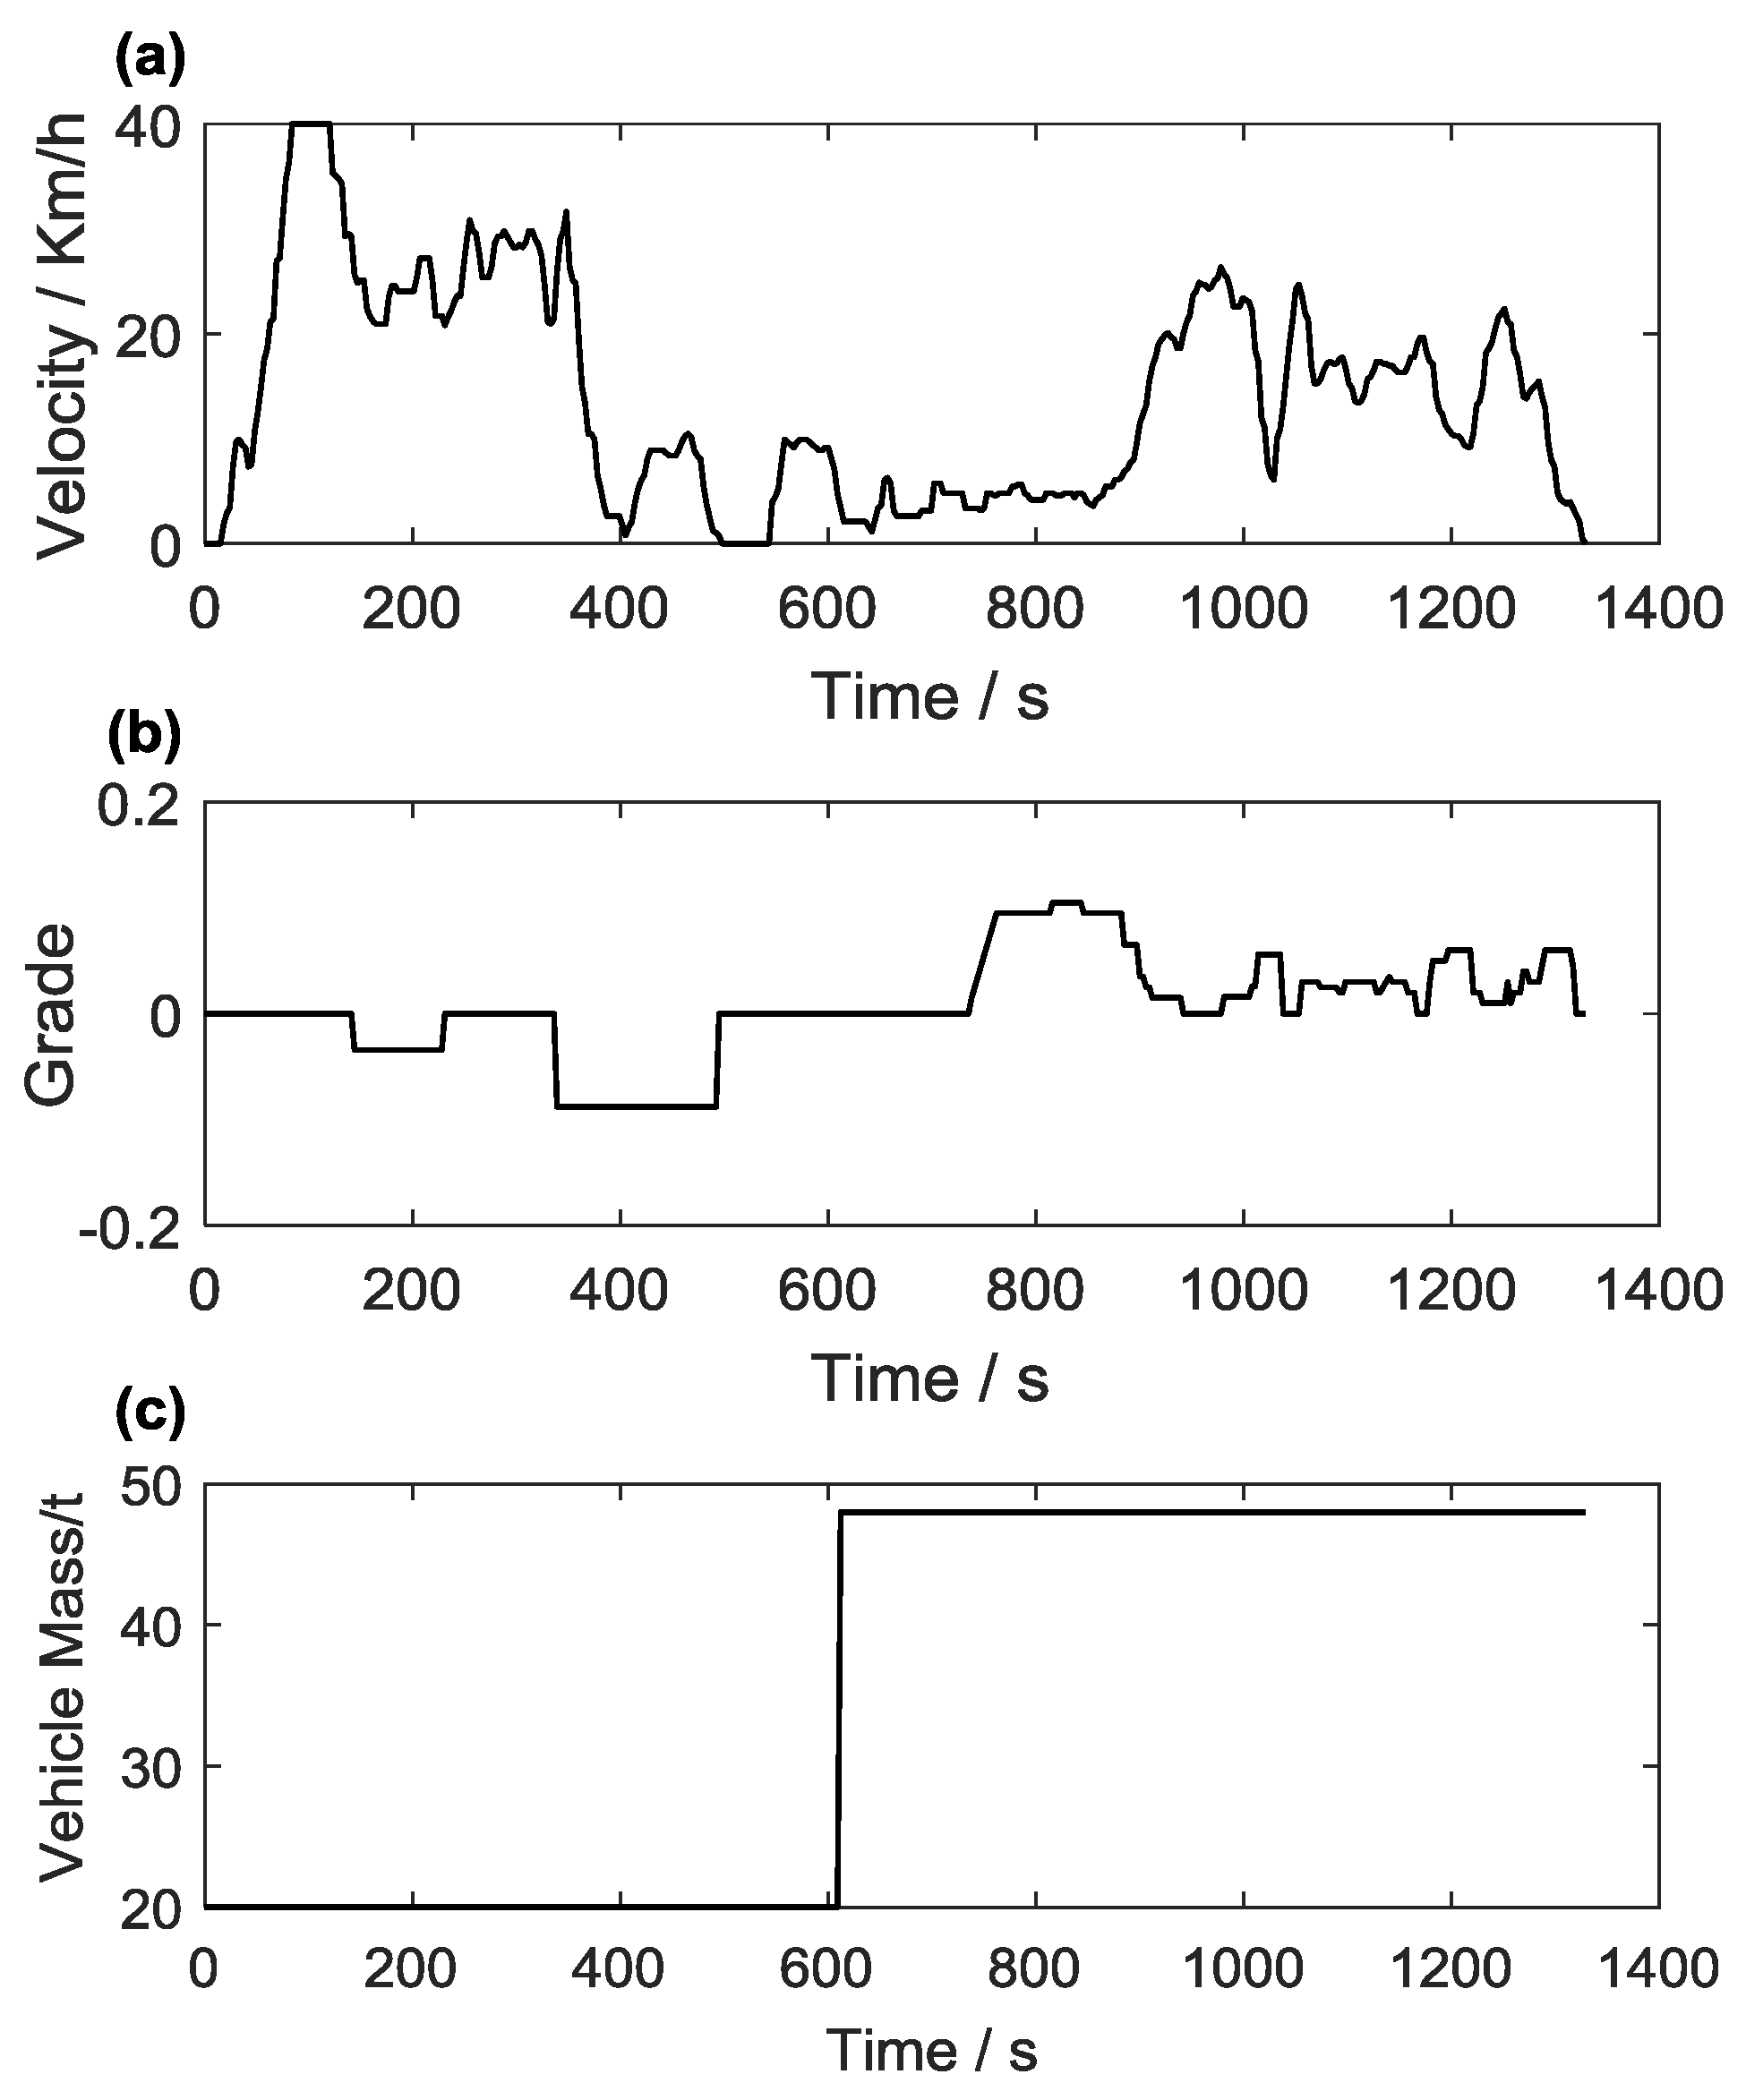
4.1. Driving Cycle Analysis
Most of the current standard driving cycles, such as NEDC, UDDS, and FTP75, are designed for passenger cars, while a small part is also designed for heavy trucks, during which the vehicle mass is usually constant given that the cycles are established without considering the variation in load. Thus, the existing standard driving cycles are not applicable to EDT. The EDT, cooperating with the help of shovels or other loaders, run on SR in areas full of long-distance uphill and downhill situations. In addition, during a holonomic cycle condition, full load and empty load situations occur alternately, having an obvious influence on the energy consumption calculation. A SR driving cycle for EDT is introduced in this paper, designed based on the road condition of some iron mines, which are typical mines in China, as shown in Figure 11, integrating the classical working conditions of the EDT. The information on the vehicle speed, load and road ramp of the driving cycle are shown in Figure 12.
Figure 11.
Iron mine.
Figure 12.
Driving cycle information: (a) velocity; (b) road grade; and (c) vehicle mass.
As indicated in Figure 12, the whole cycle takes 1329 s with a distance of 8.5 km, and the maximum slope is 8%. According to the working condition of the vehicle, the driving cycle can be divided into three stages. The first stage is from 0 to 480 s, during which the dump truck sets out from the ore inventory and arrives at the loading point through a downhill road. The second stage is the loading time from 580 s to 680 s. During the last stage, from 680 s to 1329 s, the truck runs toward the ore inventory through an uphill road after the loading process finished. The strategy can also be applied on an unmanned dump truck, as the engine control unit (ECU) has full control over the throttle, which means that it can follow the speed curve accurately.
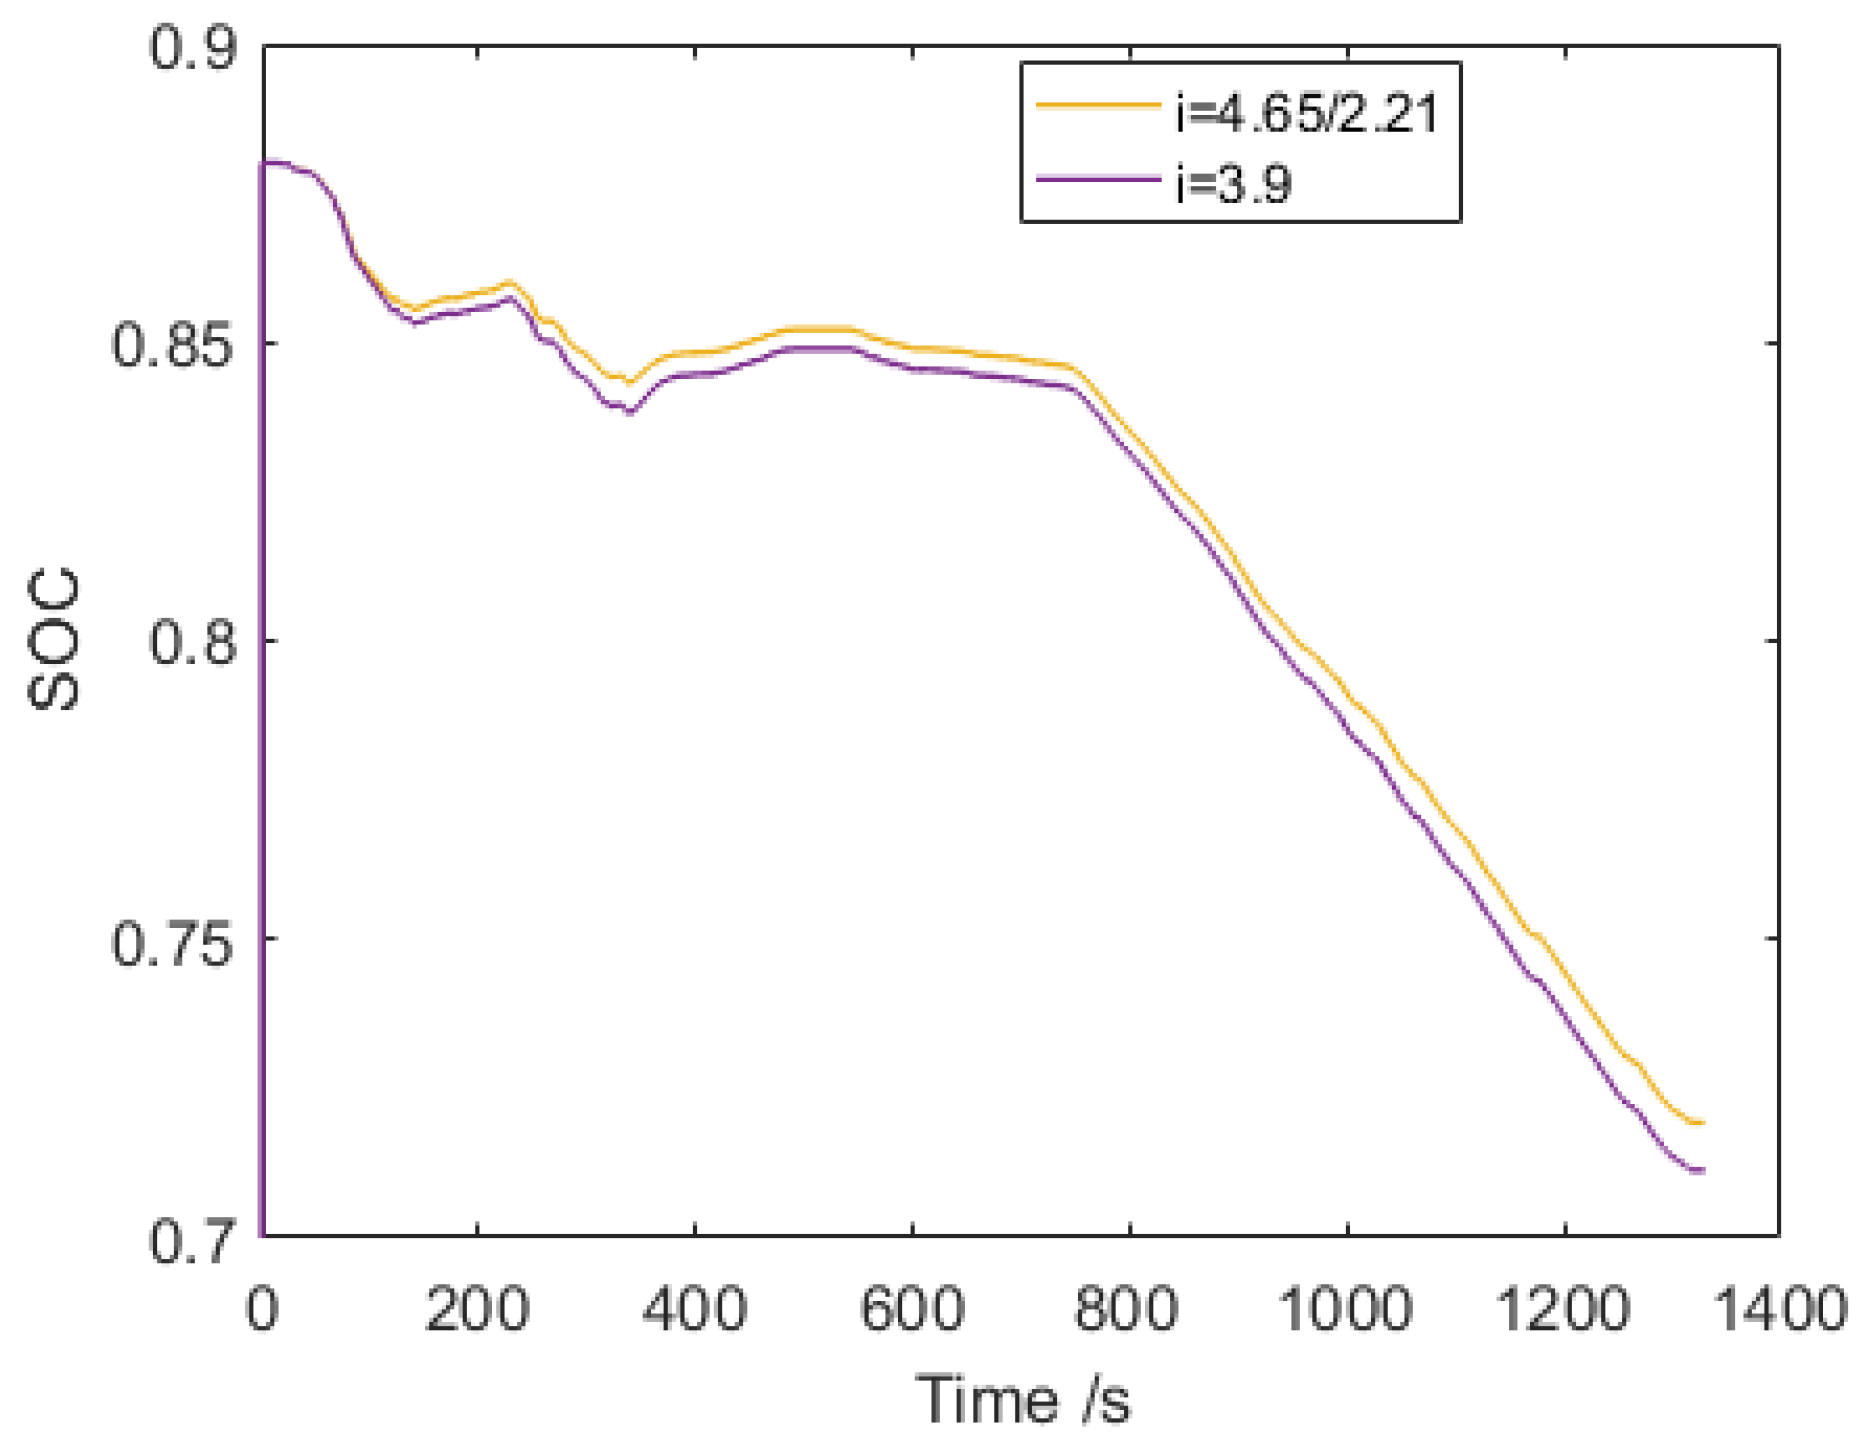
4.2. Optimization Results
The improved PSO algorithm described above is used to determine the optimal values of the gear ratio. Setting the size of the population to 5 and the iteration number to 100, the fitness values generated during the iteration process are shown in Figure 13. The iteration result illustrates the optimal values of the gear ratio for certain driving conditions. The optimal ratio for first gear is 4.65, while for second gear it is 2.21.
Figure 13.
Fitness values in the optimization process.
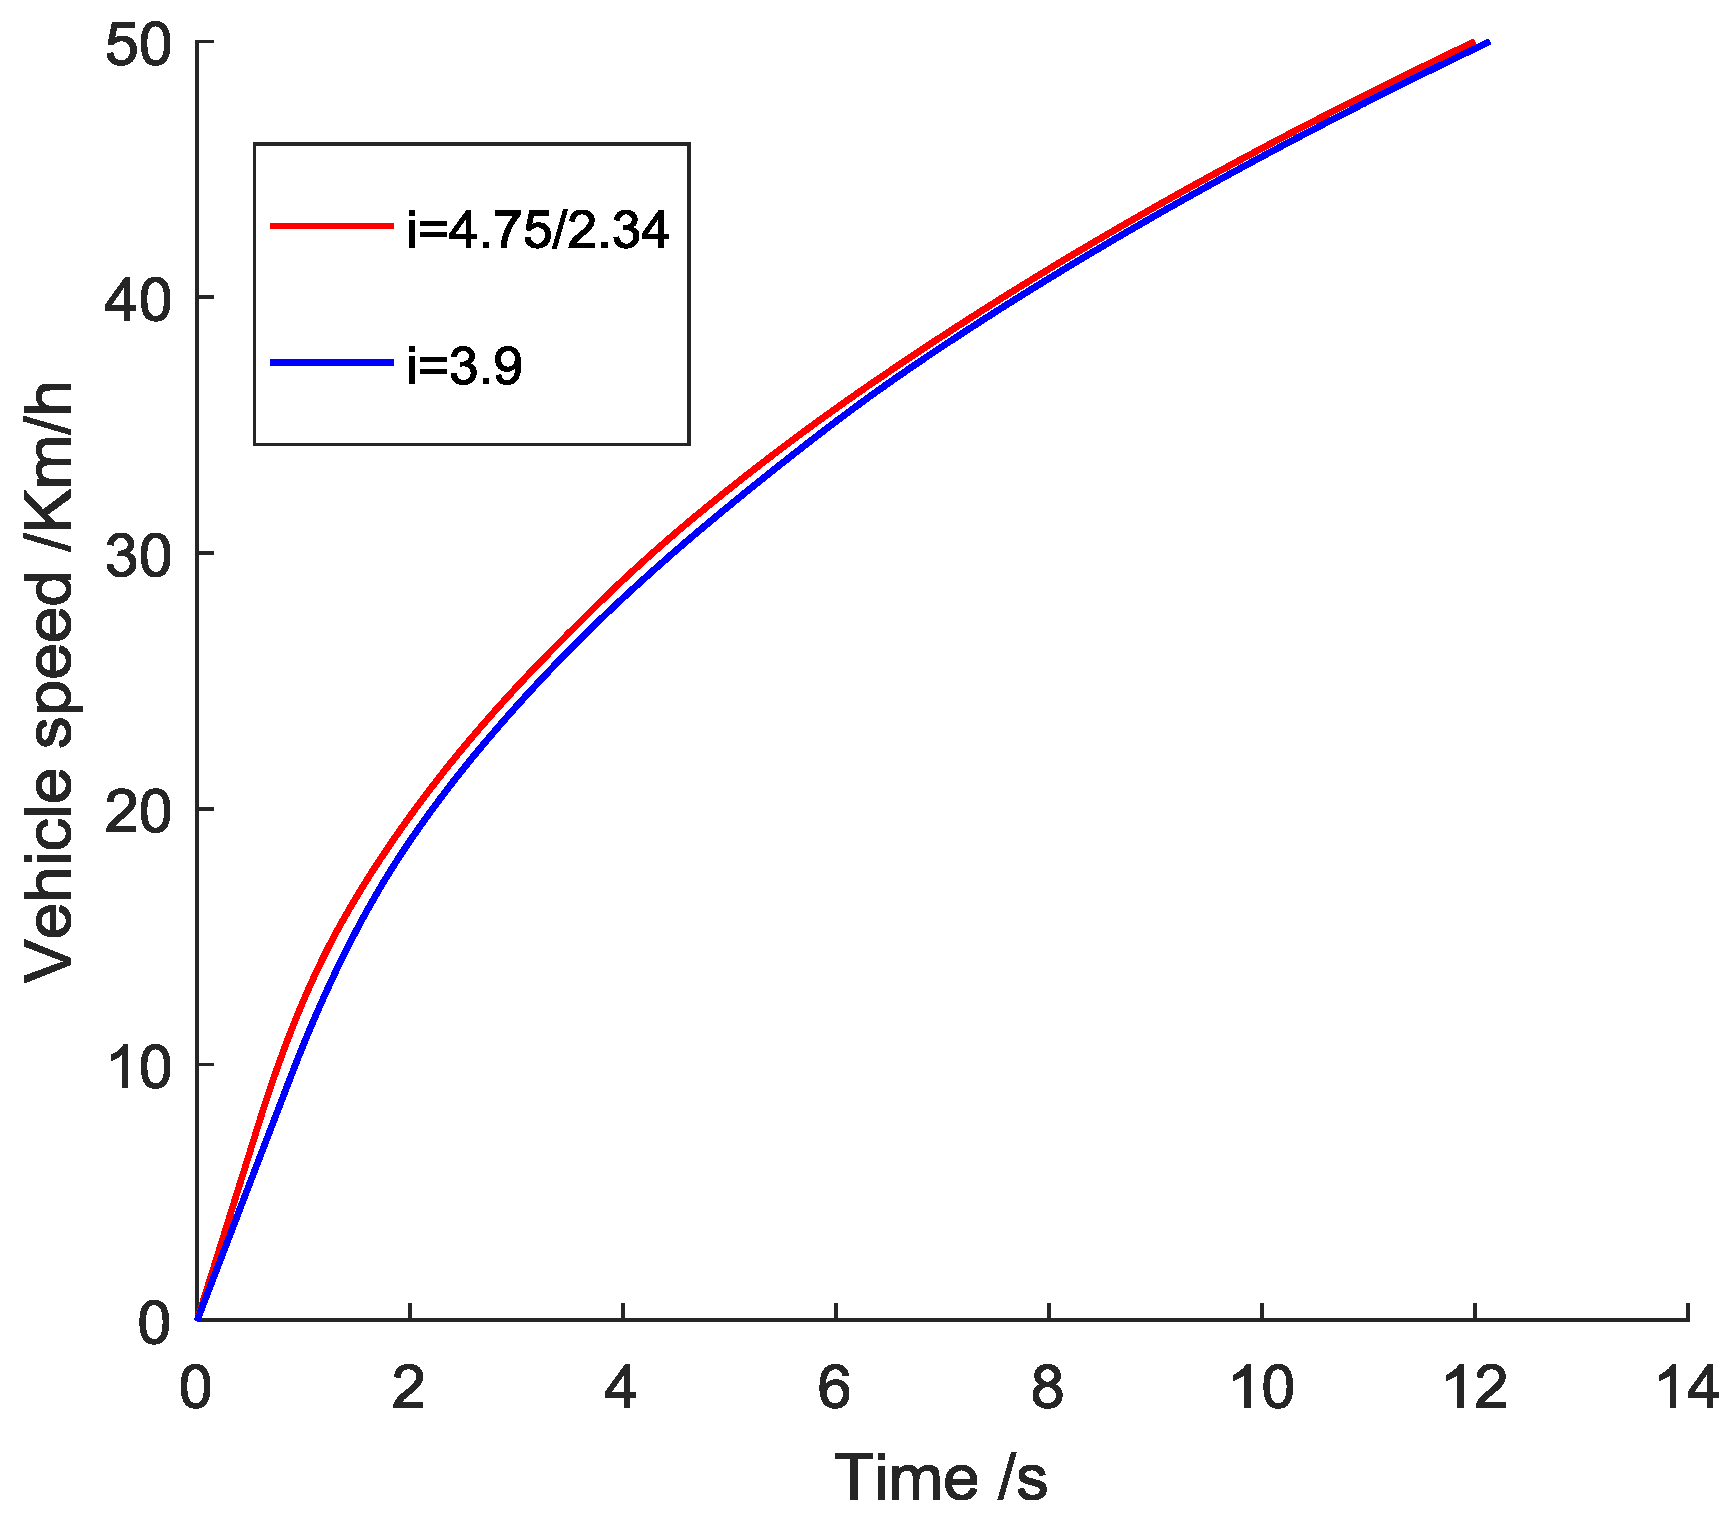
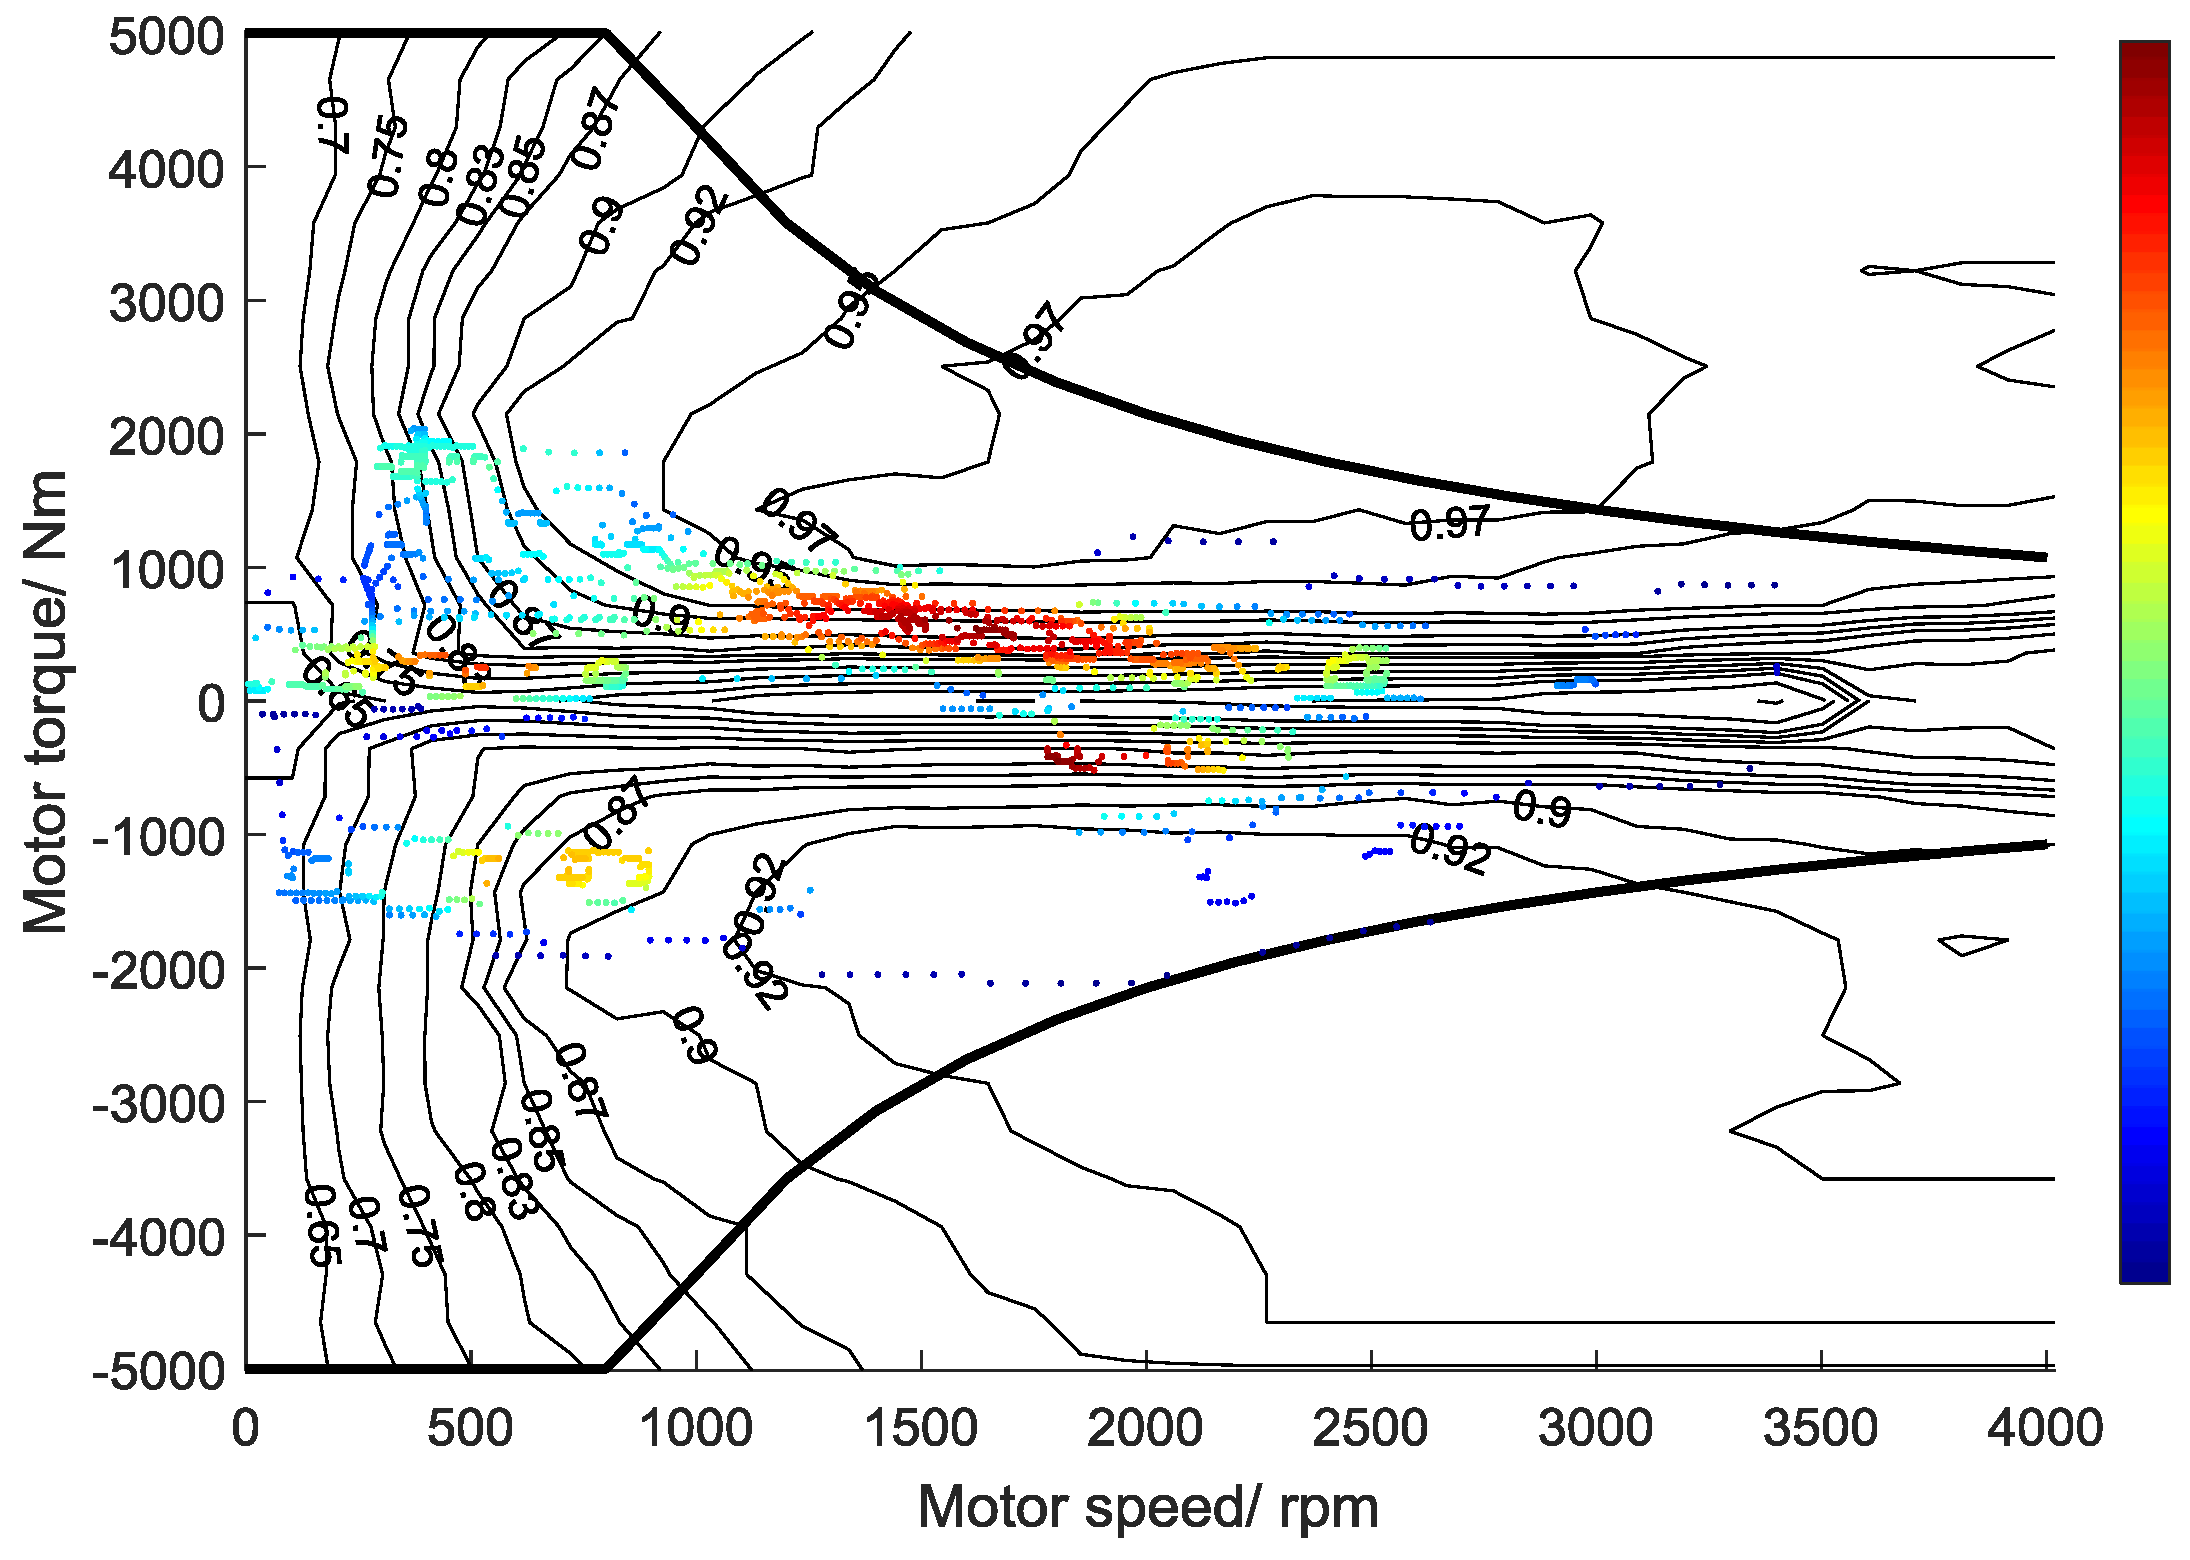
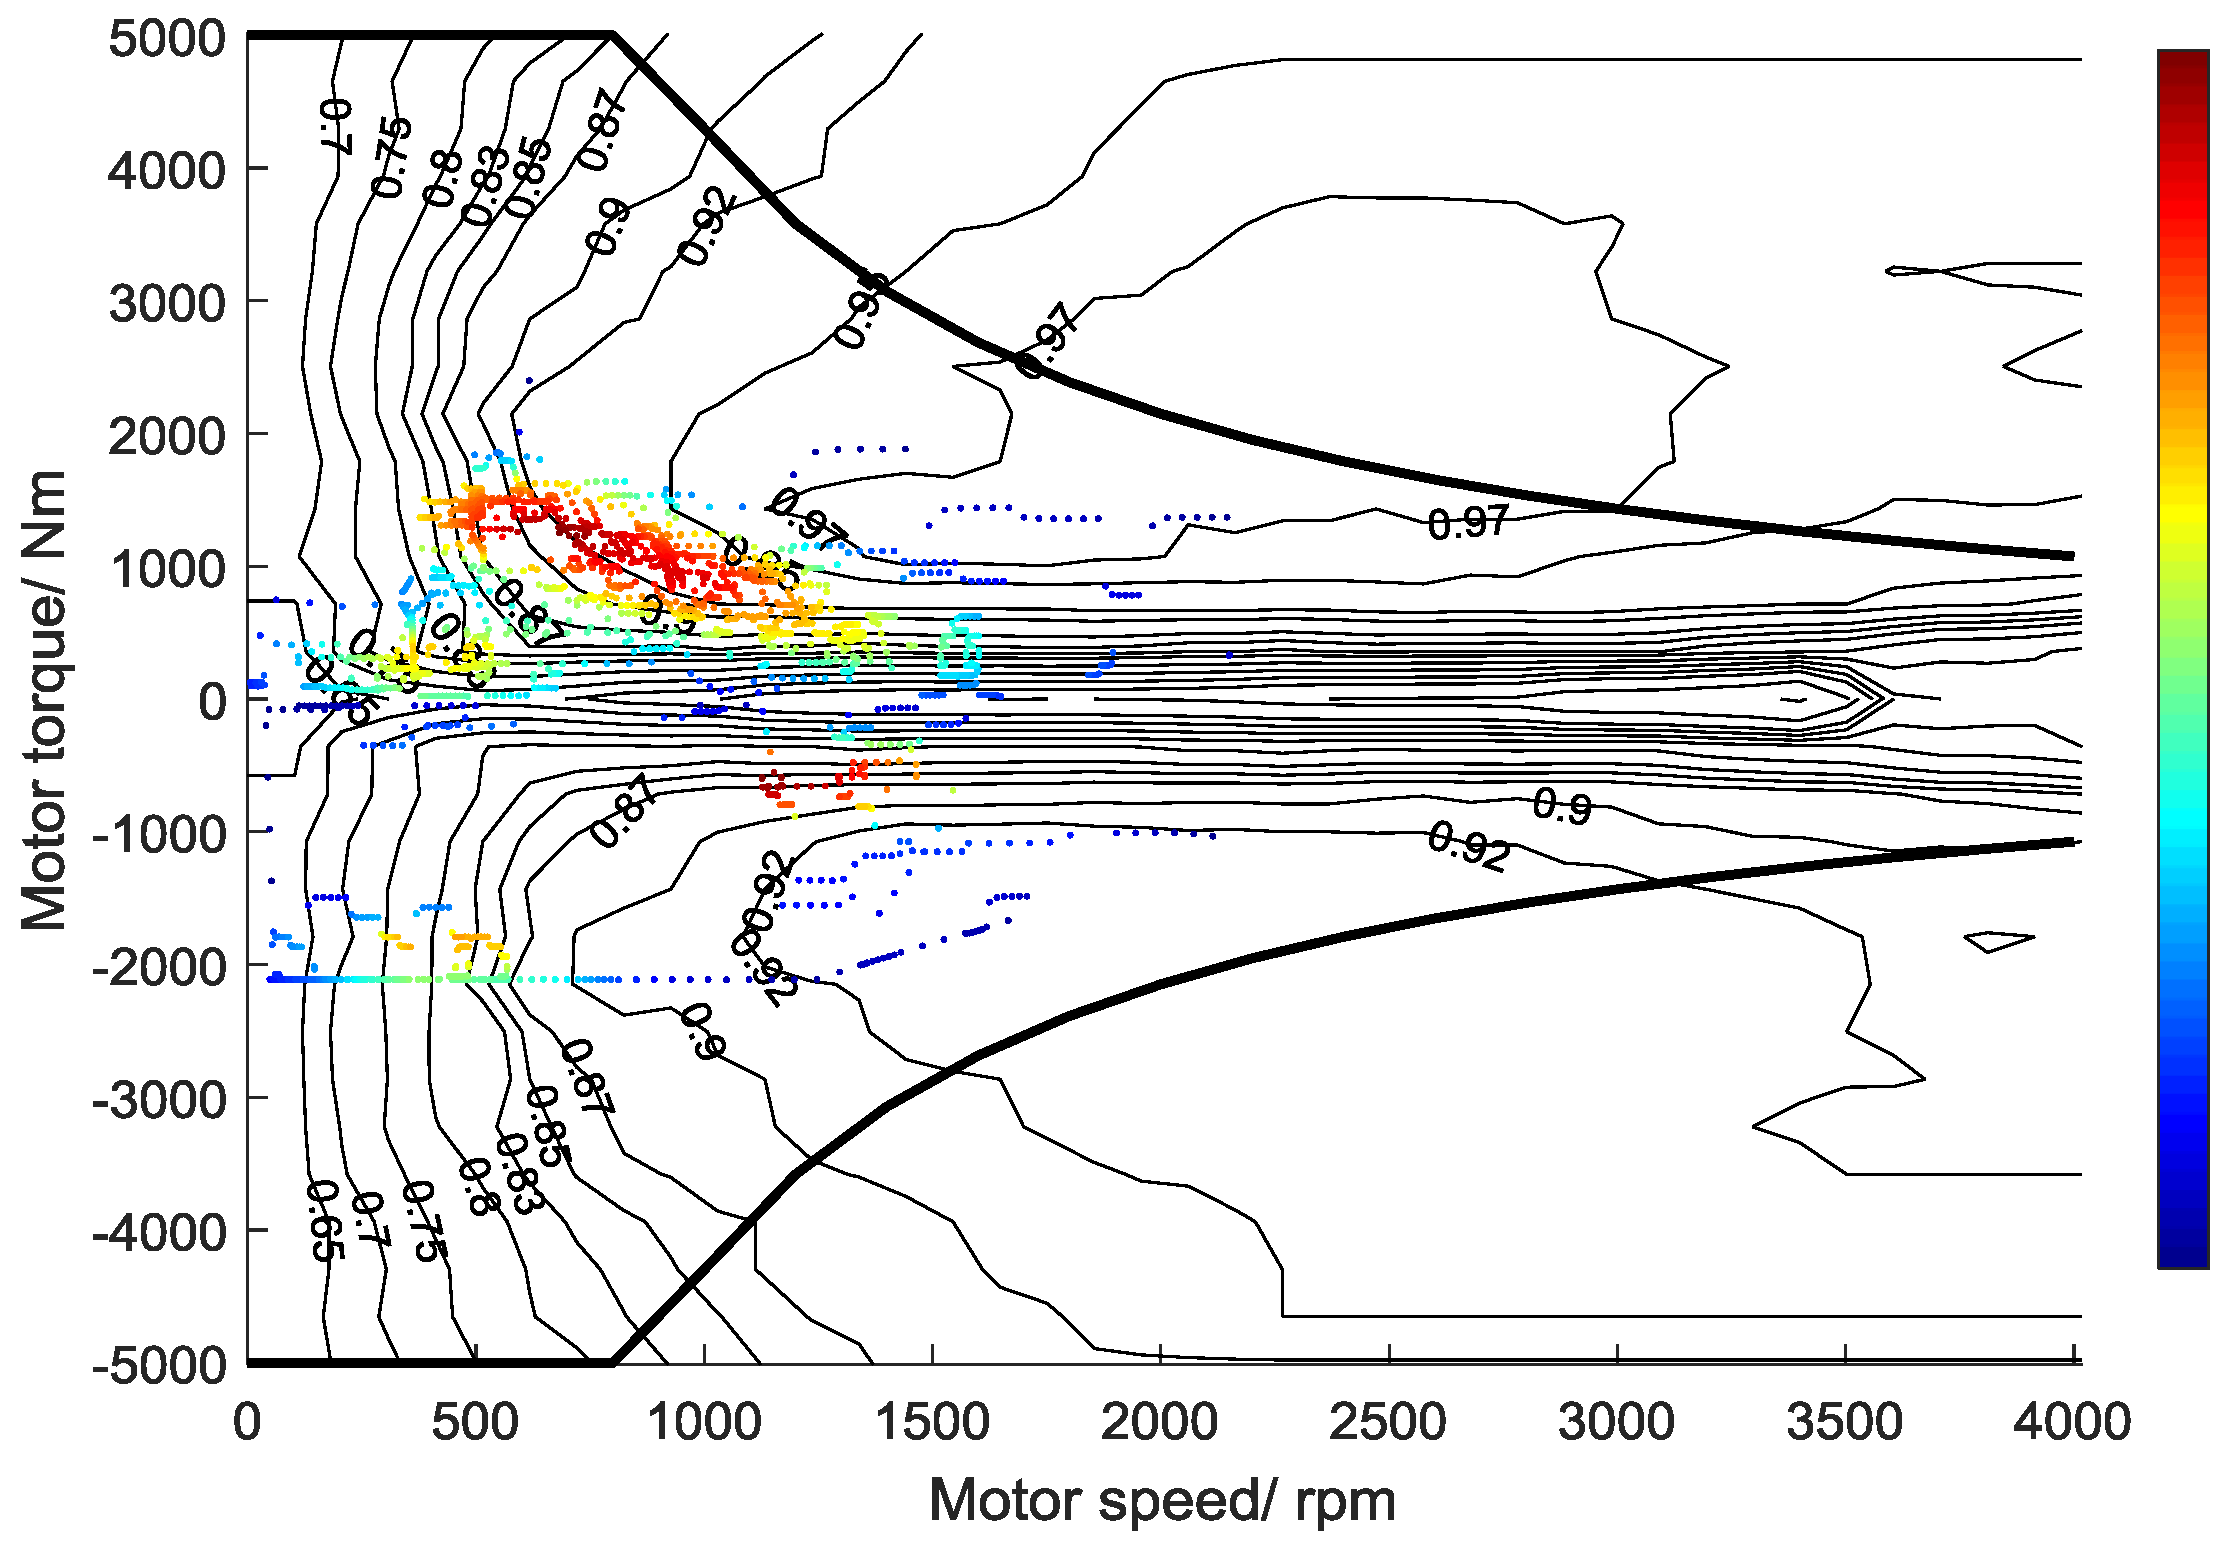
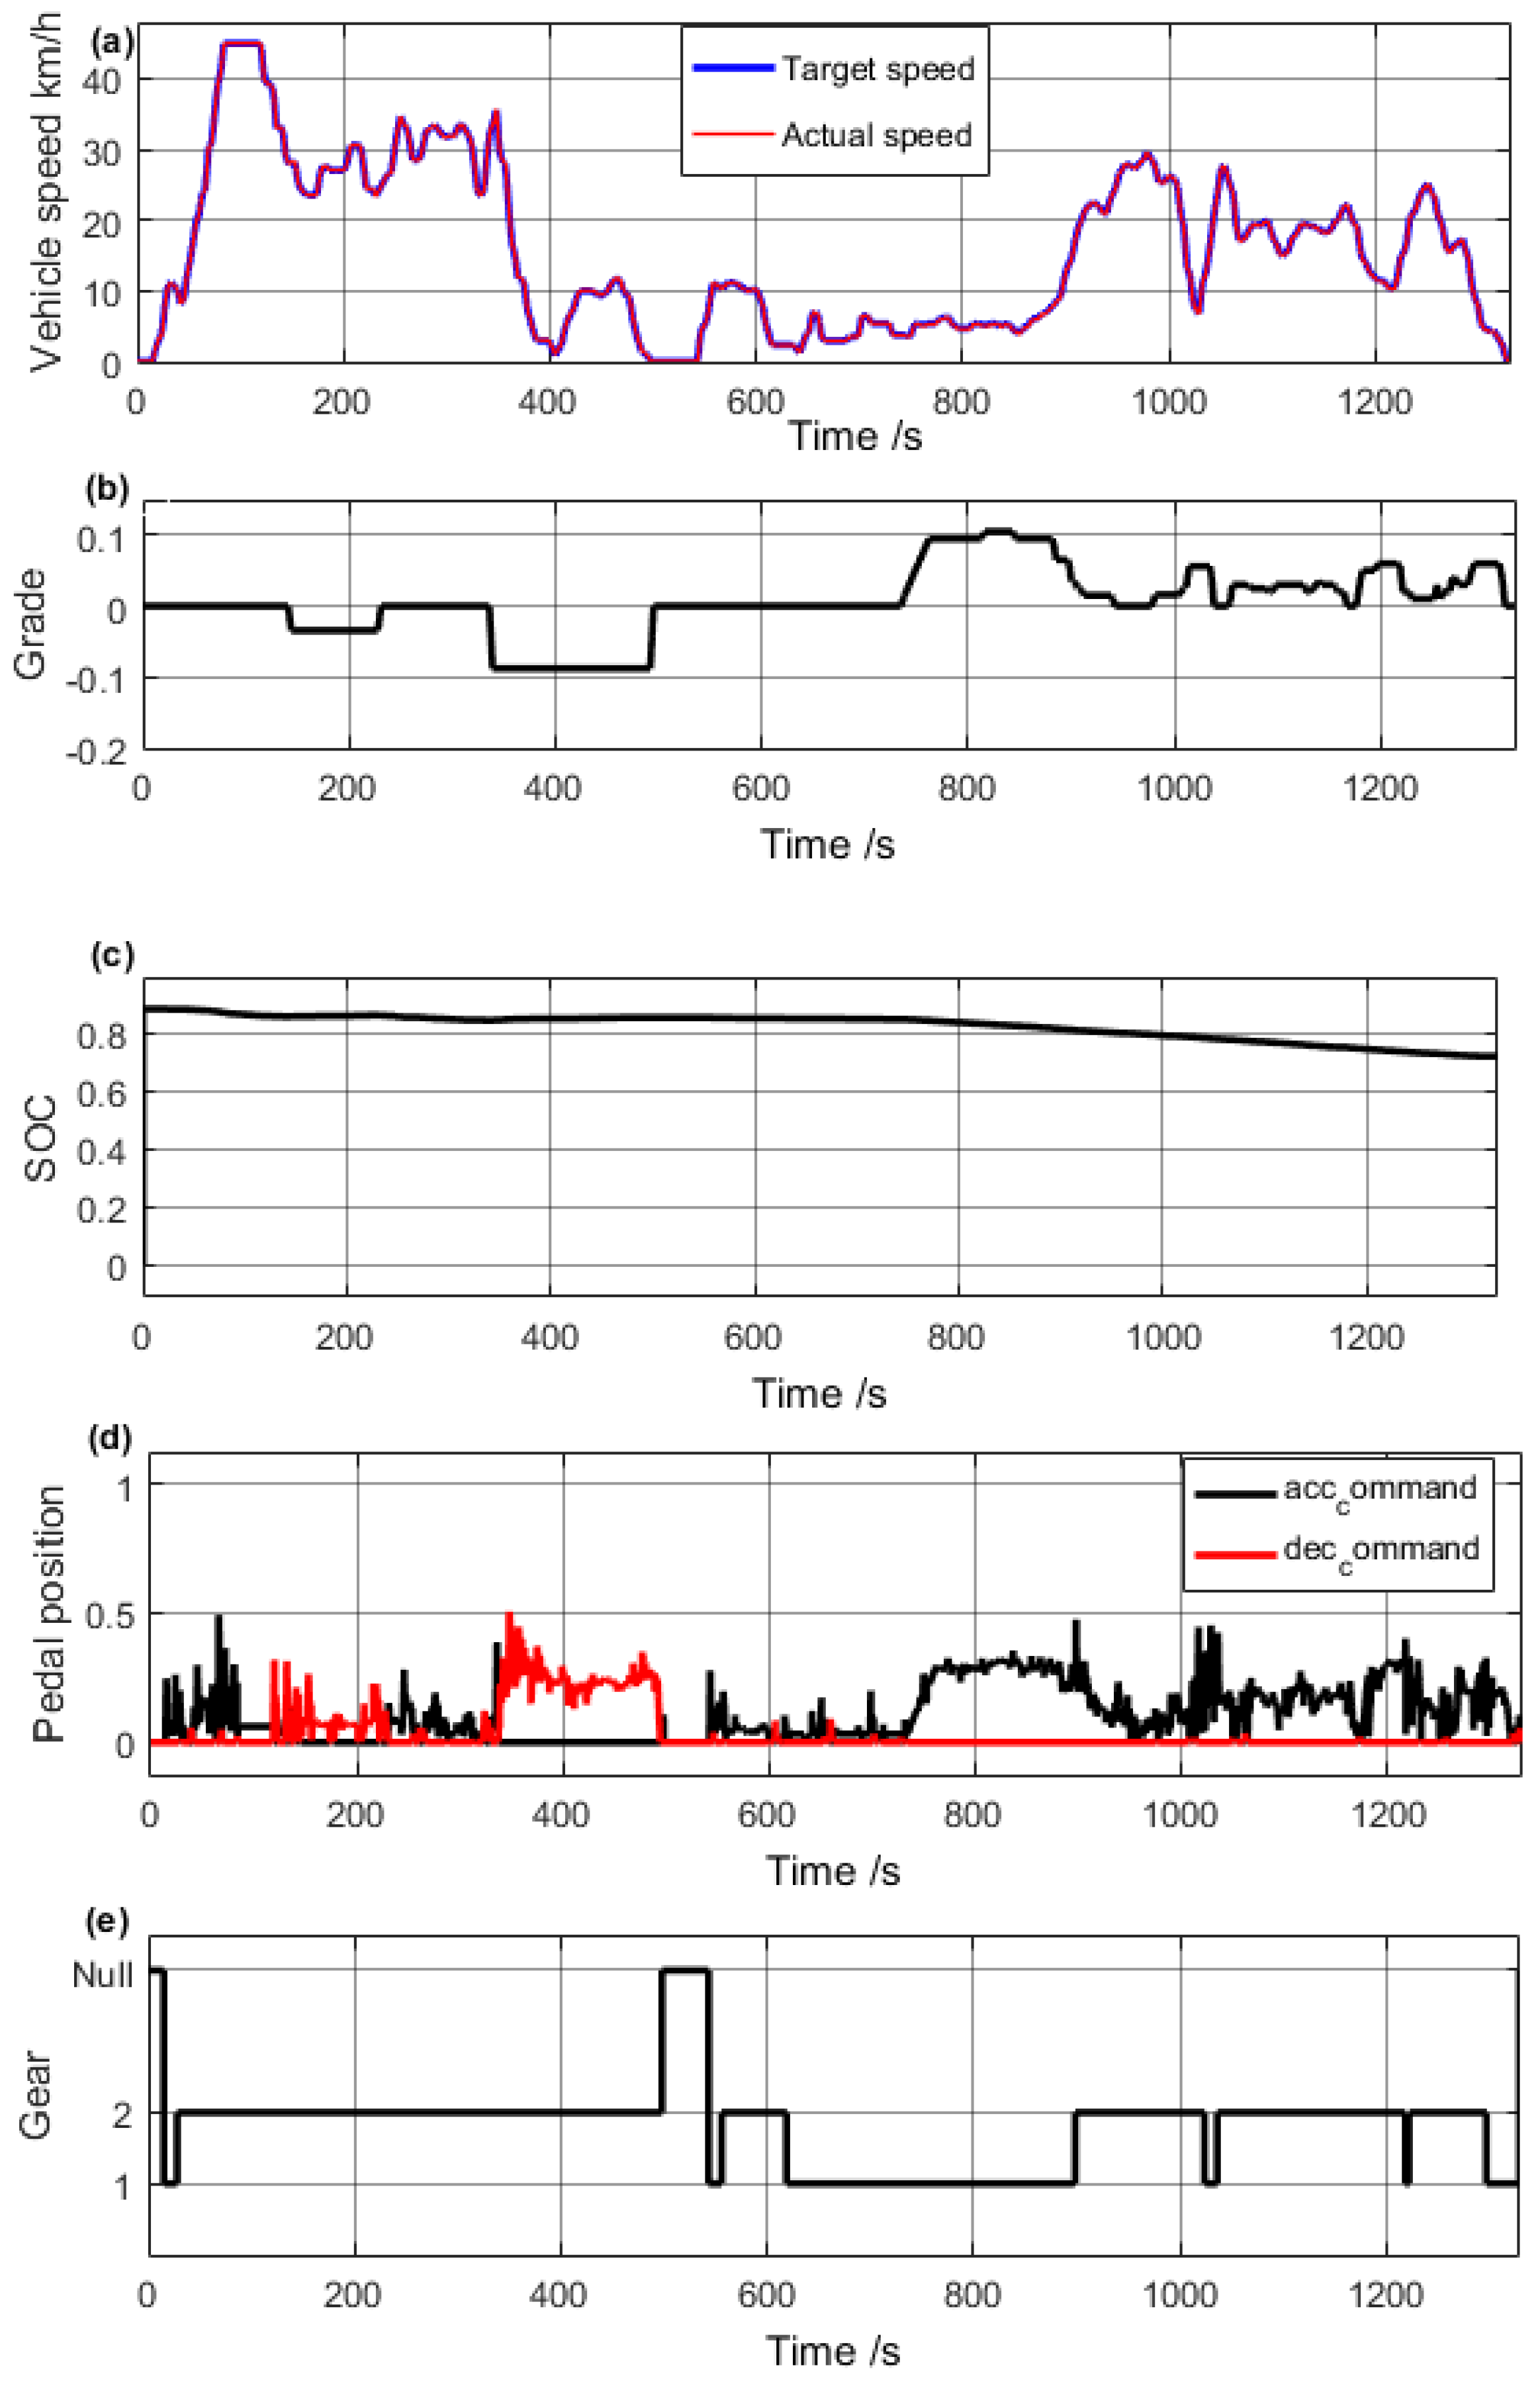
4.3. Performance Analysis
The simulation results of EDT with optimal multi-speed transmission are shown in Figure 14. Figure 14a shows that the actual speed can follow the demand speed almost all the time; that is, the optimal ratio can meet the dynamic demand of the designed working condition. The battery SOC variation tendency is illustrated in Figure 14c. There are some tiny fluctuations in SOC, where it is charging as the braking energy recovery system intervenes during the downhill situation. The gear control sequence is shown in Figure 14e indicating that the shift schedule is reasonable and there is no frequent shifting or error gear situation.
Figure 14.
Simulation results: (a) velocity comparison; (b) road grade; (c) SOC curve; (d) pedal position of acceleration and brake; and (e) gear control sequence.
To verify the effect of the optimal ratio, the simulation results are compared with the battery electric dump truck equipped with a single gear transmission, , for both economic and dynamic performances. Figure 15 shows the comparison of the acceleration time from 0 to 50 km/h in full load condition. As shown, the acceleration ability increases when compared to EDT with a single speed transmission. The increment is related to the weighting coefficient of the objective function. The energy consumption comparison is shown in Figure 16. The initial value of SOC is 0.88 in the simulation, supposing that the energy recovery efficiency is 30%. The final values of SOC are 0.717 and 0.727, respectively, which means that the energy consumption has been reduced by 6.1% in relation to the application of the two-speed transmission. In combination with the velocity curve, we can see that between the two transmissions, there is little difference in the energy consumption in low speed operating areas. Meanwhile, the gap tends to be obvious after 80 s when the EDT speeds up to a high speed running state. Following this, the change of SOC tends to synchronize during 300 s to 700 s as the truck slows down. The disparity becomes further obvious as the truck accelerates after 700 s. Thus, the two-speed transmission improves the energy utilization efficiency in high speed operating areas, mainly because the overtop speed leads to lower motor efficiency.
Figure 15.
Acceleration time comparison.
Figure 16.
SOC comparison.
Figure 17 and Figure 18 show a more intuitive explanation of the reasons for the difference in energy consumption. Figure 17 reveals the operation point distribution on the motor efficiency map of the single-speed transmission. Figure 18 shows the distribution of the two-speed transmission. The red areas represent the most concentrated areas of the operating points while the blue represents the relatively sparse areas. Cooperating with the single-speed transmission, the motor operates in a large range of speed with most of the operating points distributed in the efficiency range of 80% to 92%. The distribution of the operating point with a two–speed transmission is more concentrative in comparison. Most of the points are located in the efficiency range of 92% to 95%. This is because the motor with a single-speed transmission needs a larger speed range to follow the required velocity during the cycle, while overlapping areas of the operating points can be found when the motor is equipped with the two-speed transmission which concentrated more operation points within the high-efficiency area of the motor map. This means that the motor efficiency is not necessarily sacrificed to achieve high speed. It should also be noted that the overall efficiency of the driving system has been improved.
Figure 17.
Operating point distribution on the motor efficiency map of the EDT with a single speed transmission.
Figure 18.
Operating point distribution on the motor efficiency map of the EDT with a two-speed transmission.
5. Conclusions
This paper presents shift schedule design and a gear ratio optimization algorithm for a novel multi-speed transmission of the electric dump truck on a structure route. The mathematical model of the novel transmission is established based on the d’Alembert principle. Following this, a general and useful shift schedule are proposed. Moreover, the confirmation of the available gear ratio regions is based on the dynamic performance and planetary structure. The ratio optimization is then carried out via the improved PSO algorithm to find the optimal ratio for a better economic and dynamic performance. The iteration result demonstrates that the best ratio for first gear is 4.65 and the best ratio for second gear is 2.21.
The energy consumption has been calculated based on a typical mine working cycle, which is obtained from the road condition of some iron mines in China. The simulation models of the dump truck allocated with a single-speed transmission and two-speed transmission are constructed based on vehicle dynamics in a Matlab/SIMULINK environment. The dynamic performance and energy consumption of the electric dump truck are analyzed via simulation models. The simulation results indicate that the truck equipped with a two-speed transmission can improve its acceleration ability and reduce its energy consumption by 6.1%. This illustrates that the presented optimization algorithm and simulation method for electric dump trucks can be applied for feasibility studies to improve the economic performance of electric dump trucks, which provides the basis for further applications of the electric unmanned dump truck.
Author Contributions
J.Y. and W.Z. conceived and designed the experiments; J.Y. and S.T. performed the experiments; S.T. and T.H. analyzed the data; J.Y. and X.Z. contributed analysis tools; and J.Y. and S.T. wrote the paper. All authors were involved in the discussion of the results and manuscript.
Funding
This research was funded by the Ministry of Science and Technology of China (No. 2013BAB02B00).
Conflicts of Interest
The authors declare no conflict of interest.
References
- Mahmoudzadeh Andwari, A.; Pesiridis, A.; Rajoo, S.; Martinez-Botas, R.; Esfahanian, V. A review of Battery Electric Vehicle technology and readiness levels. Renew. Sustain. Energy Rev. 2017, 78, 414–430. [Google Scholar] [CrossRef]
- Wu, G.; Zhang, X.; Dong, Z. Powertrain architectures of electrified vehicles: Review, classification and comparison. J. Frankl. Inst. 2015, 352, 425–448. [Google Scholar] [CrossRef]
- Ruan, J.; Walker, P.; Zhang, N. A comparative study energy consumption and costs of battery electric vehicle transmissions. Appl. Energy 2016, 165, 119–134. [Google Scholar] [CrossRef]
- Jayakumar, A.; Chalmers, A.; Lie, T.T. Review of prospects for adoption of fuel cell electric vehicles in New Zealand. IET Electr. Syst. Transp. 2017, 7, 259–266. [Google Scholar] [CrossRef]
- Sahoo, L.; Bandyopadhyay, S.; Banerjee, R. Energy Performance of Dump Trucks in Opencast Mine. In Proceedings of the 23th International Conference on Efficiency, Costs, Optimization, Simulation and Environmental Impact of Energy Systems ECOS 2010, Lausanne, Switzerland, 14–17 June 2010; pp. 1–8. [Google Scholar]
- Feng, Y.; Dong, Z.; Yang, J.; Cheng, R. Performance Modeling and Cost-benefit Analysis of Hybrid Electric Mining Trucks. In Proceedings of the 2016 12th IEEE/ASME International Conference on Mechatronic and Embedded Systems and Applications (MESA), Auckland, New Zealand, 29–31 August 2016; pp. 1–6. [Google Scholar]
- Ballantyne, G.R.; Powell, M.S. Benchmarking comminution energy consumption for the processing of copper and gold ores. Miner. Eng. 2014, 65, 109–114. [Google Scholar] [CrossRef]
- Sahoo, L.K.; Bandyopadhyay, S.; Banerjee, R. Benchmarking energy consumption for dump trucks in mines. Appl. Energy 2014, 113, 1382–1396. [Google Scholar] [CrossRef]
- Oh, K.; Yun, S.; Ko, K.; Ha, S.; Kim, P.; Seo, J.; Yi, K. Gear ratio and shift schedule optimization of wheel loader transmission for performance and energy efficiency. Autom. Constr. 2016, 69, 89–101. [Google Scholar] [CrossRef]
- Yang, W.; Liang, J.; Yang, J.; Zhang, N. Investigation of a novel coaxial power-split hybrid powertrain for mining trucks. Energies 2018, 11, 172. [Google Scholar] [CrossRef]
- Zhu, X.; Zhang, H.; Xi, J.; Wang, J.; Fang, Z. Optimal speed synchronization control for clutchless AMT systems in electric vehicles with preview actions. In Proceedings of the American Control Conference (ACC), Portland, OR, USA, 4–6 June 2014; pp. 4611–4616. [Google Scholar] [CrossRef]
- Walker, P.; Zhu, B.; Zhang, N. Powertrain dynamics and control of a two speed dual clutch transmission for electric vehicles. Mech. Syst. Signal Process. 2017, 85, 1–15. [Google Scholar] [CrossRef]
- Roozegar, M.; Setiawan, Y.D.; Angeles, J. Design, modelling and estimation of a novel modular multi-speed transmission system for electric vehicles. Mechatronics 2017, 45, 119–129. [Google Scholar] [CrossRef]
- Sorniotti, A.; Holdstock, T.; Everitt, M.; Fracchia, M.; Viotto, F.; Cavallino, C.; Bertolotto, S. A novel clutchless multiple-speed transmission for electric axles. Int. J. Powertrains 2013, 2, 103–131. [Google Scholar] [CrossRef]
- Qin, D.; Wang, Y.; Hu, M. Powertrain parameter design for the electric vehicle considering driving cycle. J. Chongqing Univ. 2014, 37, 7–14. [Google Scholar] [CrossRef]
- Wu, G.; Zhang, X.; Dong, Z. Impacts of Two-Speed Gearbox on Electric Vehicle’s Fuel Economy and Performance. SAE Tech. Pap. 2013, 2. [Google Scholar] [CrossRef]
- Sorniotti, A.; Subramanyan, S.; Turner, A.; Cavallino, C.; Viotto, F.; Bertolotto, S. Selection of the Optimal Gearbox Layout for an Electric Vehicle. SAE Int. J. Engines 2011, 4, 1267–1280. [Google Scholar] [CrossRef]
- Morozov, A.; Humphries, K.; Zou, T.; Martins, S.; Angeles, J. Design and optimization of a drivetrain with two-speed transmission for electric delivery step van. In Proceedings of the 2014 IEEE International Electric Vehicle Conference (IEVC), Florence, Italy, 17–19 December 2014. [Google Scholar] [CrossRef]
- Gao, B.; Liang, Q.; Xiang, Y.; Guo, L.; Chen, H. Gear ratio optimization and shift control of 2-speed I-AMT in electric vehicle. Mech. Syst. Signal Process. 2015, 50–51, 615–631. [Google Scholar] [CrossRef]
- Inalpolat, M.; Kahraman, A. Dynamic modelling of planetary gears of automatic transmissions. Proc. Inst. Mech. Eng. Part K J. Multi-Body Dyn. 2008, 222, 229–242. [Google Scholar] [CrossRef]
- Jiao, W.; Yang, J.; Ma, F.; Zhang, W. Equal strength optimal design of planetary gear transmission. Nongye Jixie Xuebao/Trans. Chin. Soc. Agric. Mach. 2015, 46, 1–7. [Google Scholar]
- Wei, X.L.; Wang, G.Q.; Feng, S.L. Aerodynamic characteristics about mining dump truck and the improvement of head shape. J. Hydrodyn. 2008, 20, 713–718. [Google Scholar] [CrossRef]
- Kahraman, A. Planetary gear train dynamics. J. Mech. Des. 1994, 11, 713–720. [Google Scholar] [CrossRef]
- Greenwood, D.T. Principles of Dynamics; Prentice Hall: Upper Saddle River, NJ, USA, 1965. [Google Scholar]
- Johnson, V. Battery performance models in ADVISOR. J. Power Sources 2002, 110, 321–329. [Google Scholar] [CrossRef]
- Szumanowski, A.; Yuhua, C. Battery management system based on battery nonlinear dynamics modeling. IEEE Trans. Veh. Technol. 2008, 57, 1425–1432. [Google Scholar] [CrossRef]
- Tsang, K.M.; Sun, L.; Chan, W.L. Identification and modelling of Lithium ion battery. Energy Convers. Manag. 2010, 51, 2857–2862. [Google Scholar] [CrossRef]
- Chen, T.Y.; Chi, T.M. On the improvements of the particle swarm optimization algorithm. Adv. Eng. Softw. 2010, 41, 229–239. [Google Scholar] [CrossRef]
- Abido, M.A. Optimal power flow using particle swarm optimization. Int. J. Electr. Power Energy Syst. 2002, 24, 563–571. [Google Scholar] [CrossRef]
© 2018 by the authors. Licensee MDPI, Basel, Switzerland. This article is an open access article distributed under the terms and conditions of the Creative Commons Attribution (CC BY) license (http://creativecommons.org/licenses/by/4.0/).