Solar Radiation Estimation Algorithm and Field Verification in Taiwan


Abstract
:1. Introduction
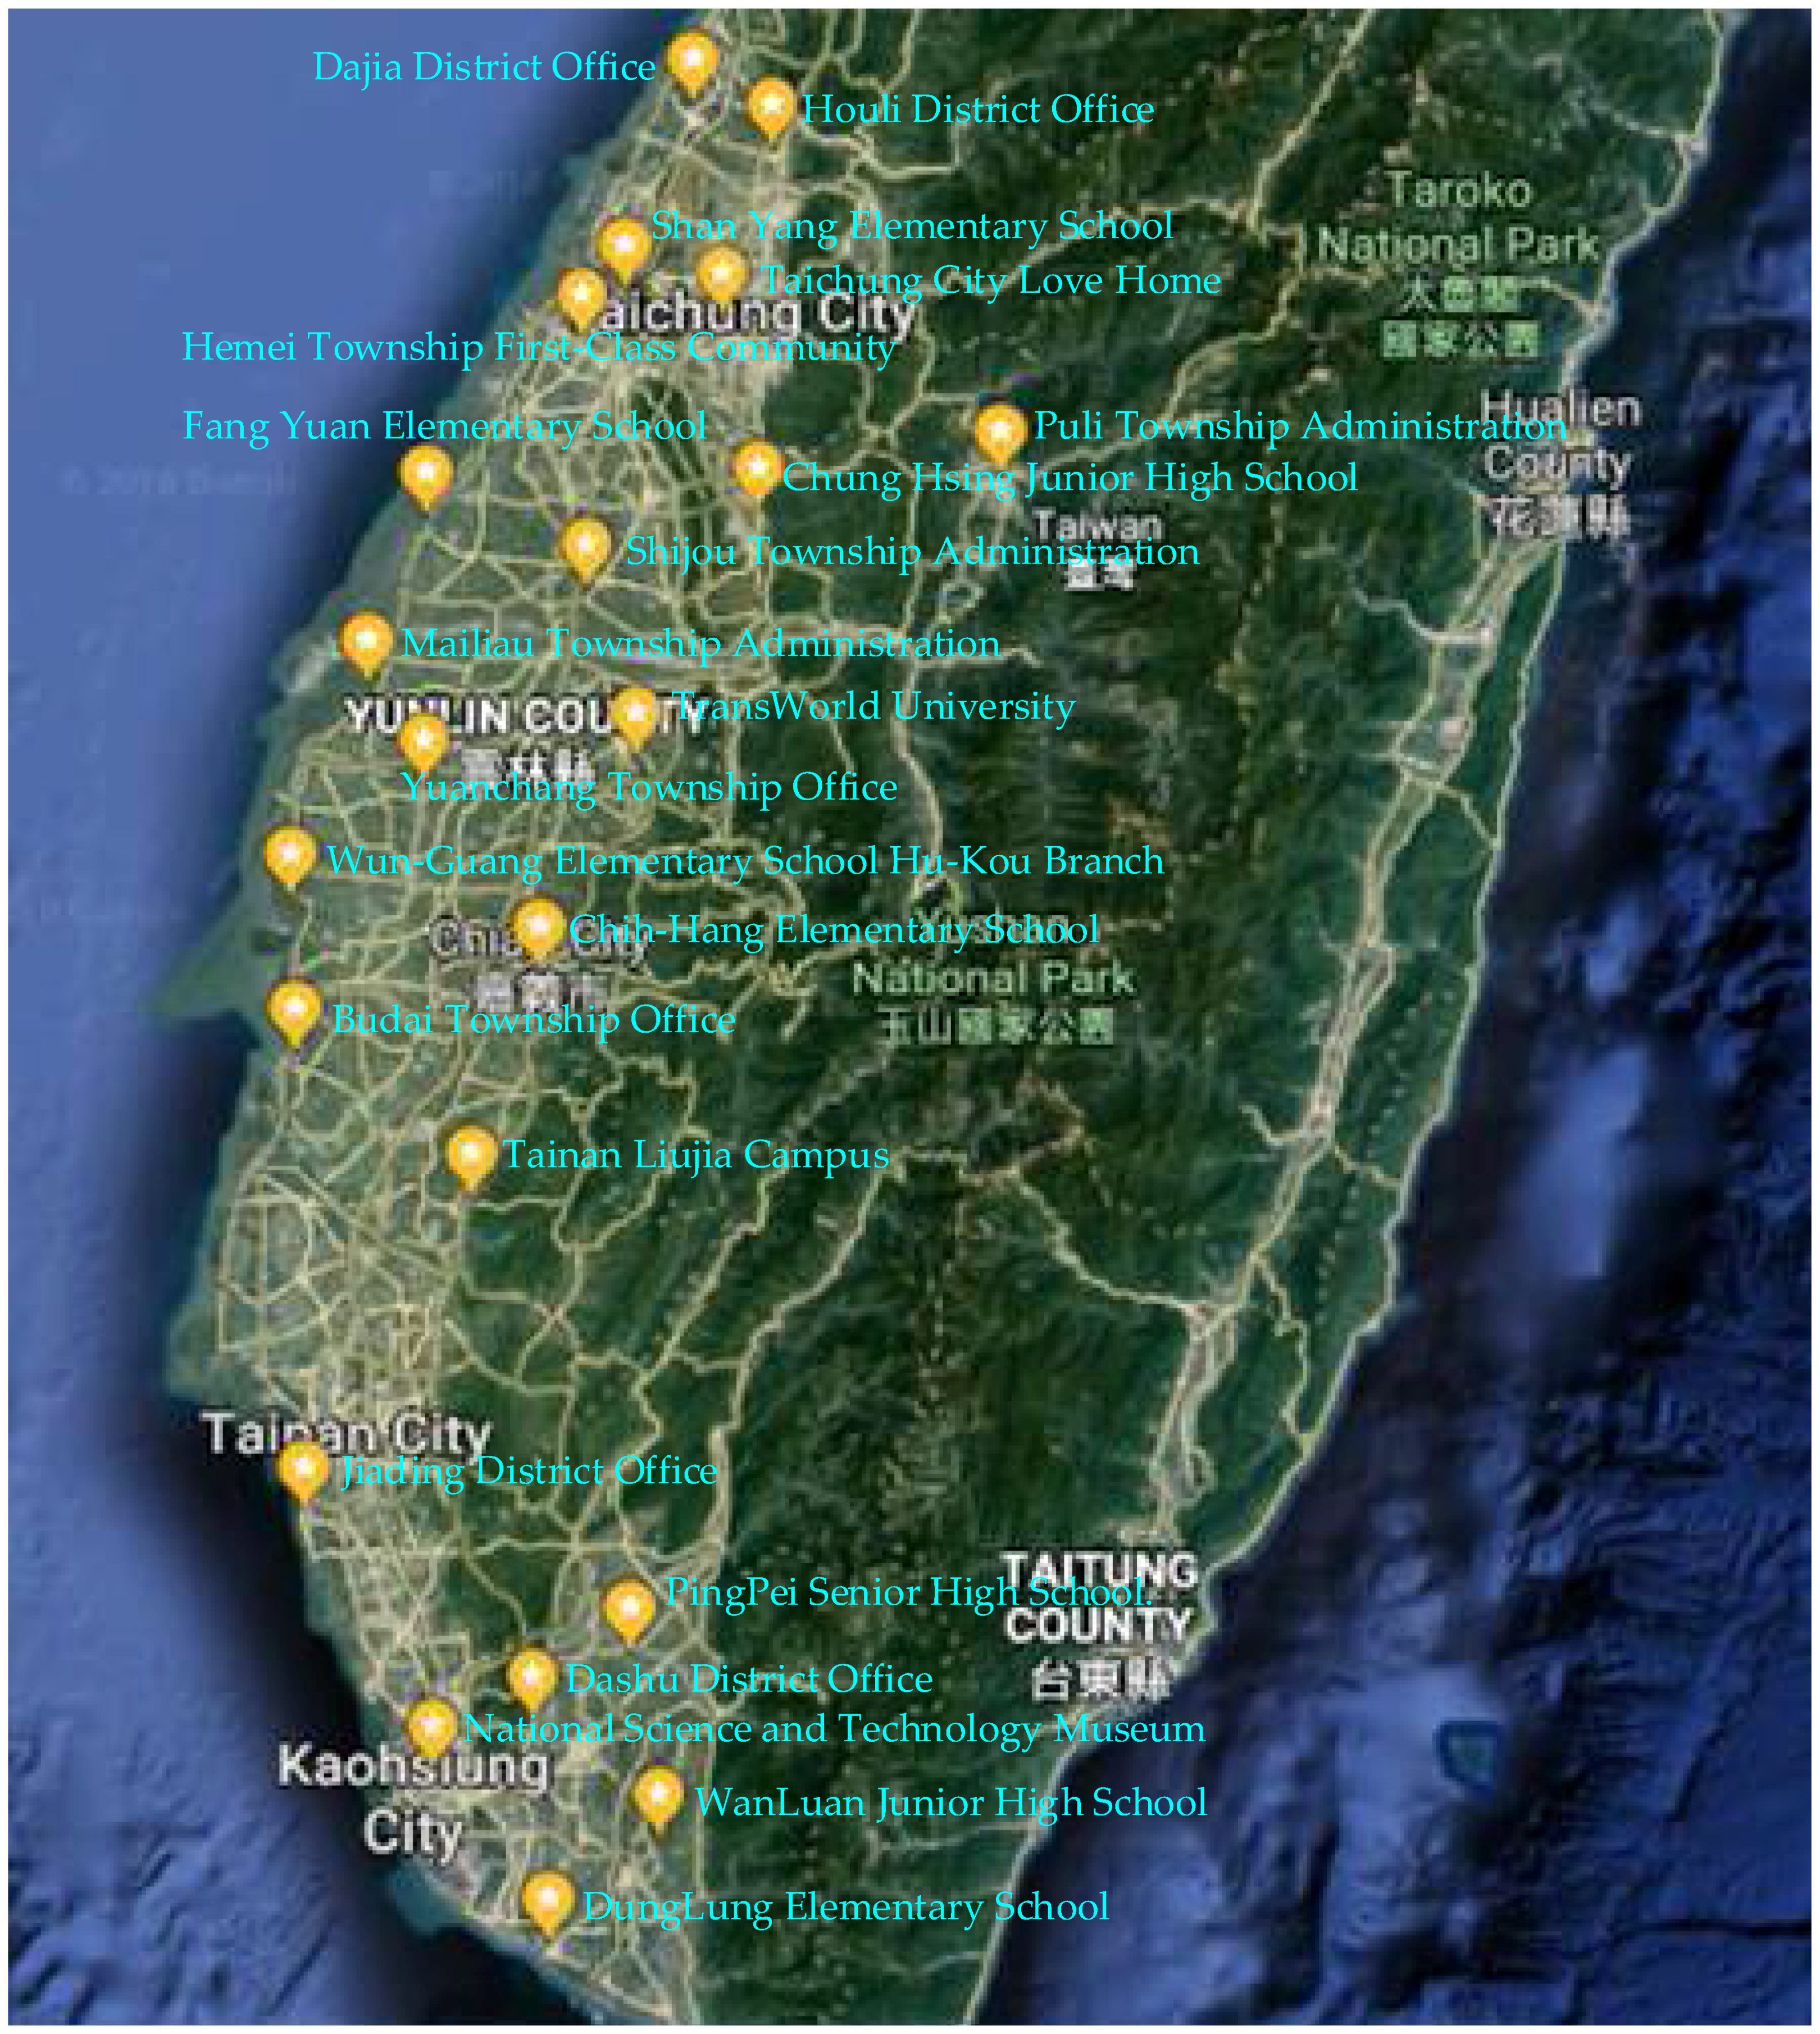
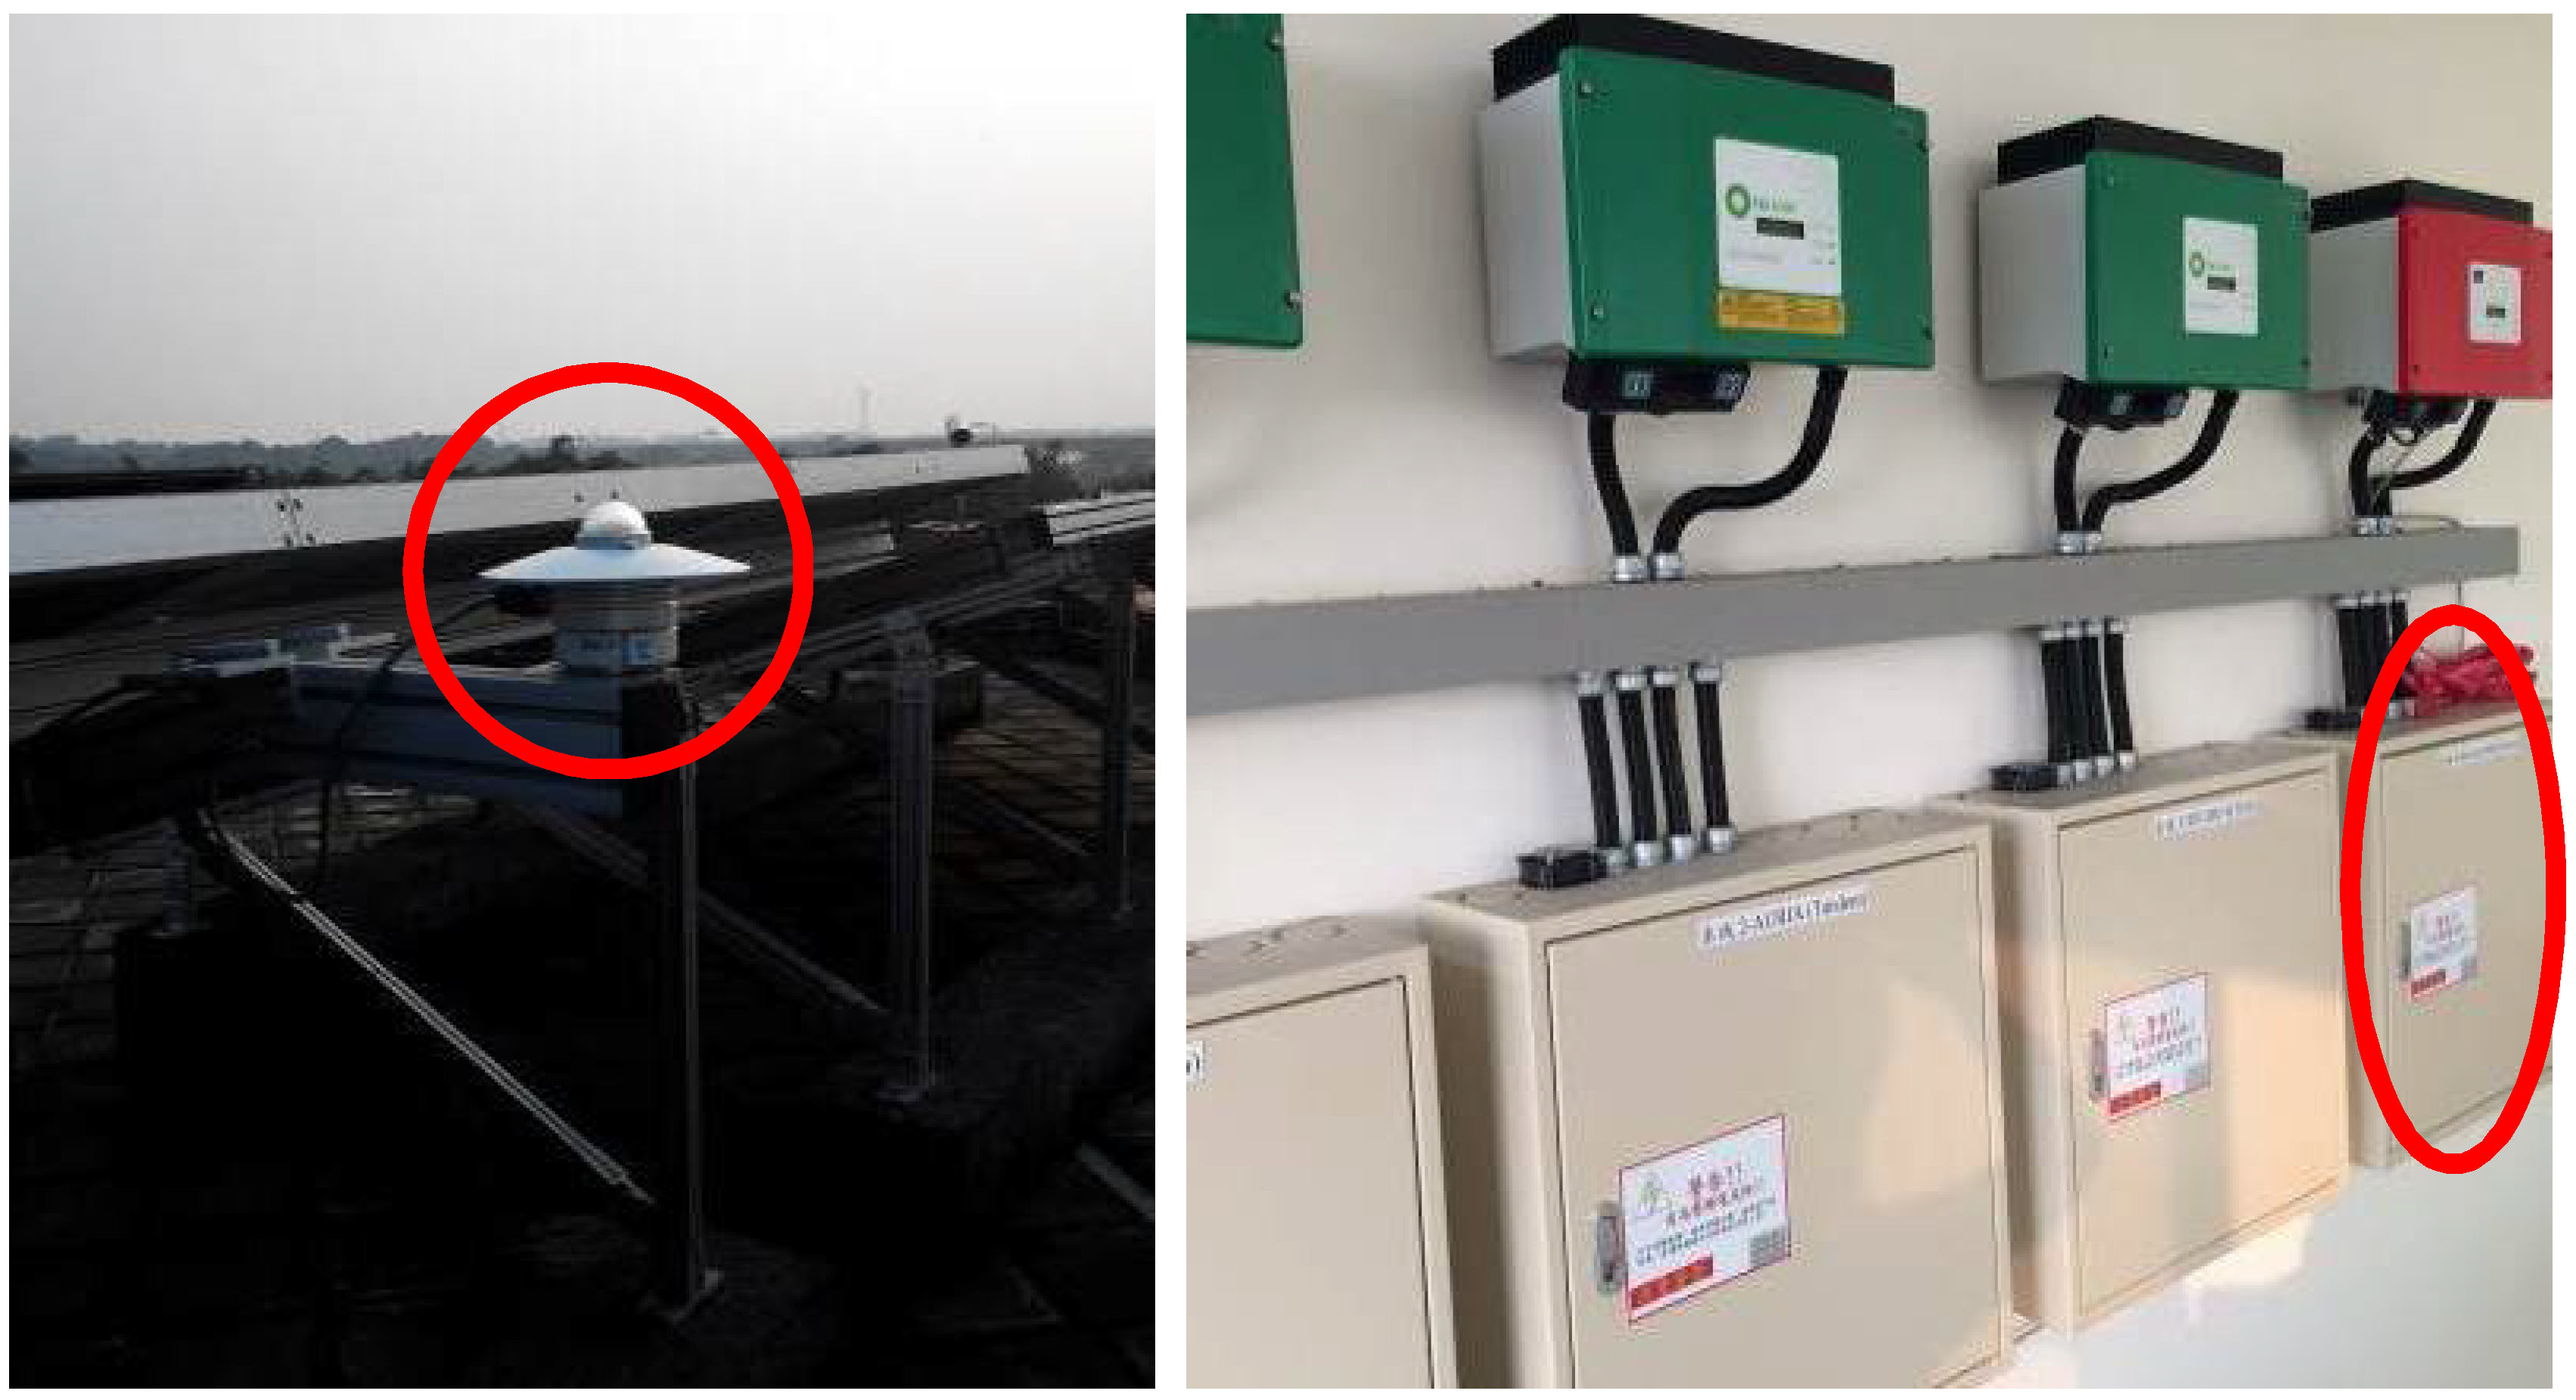
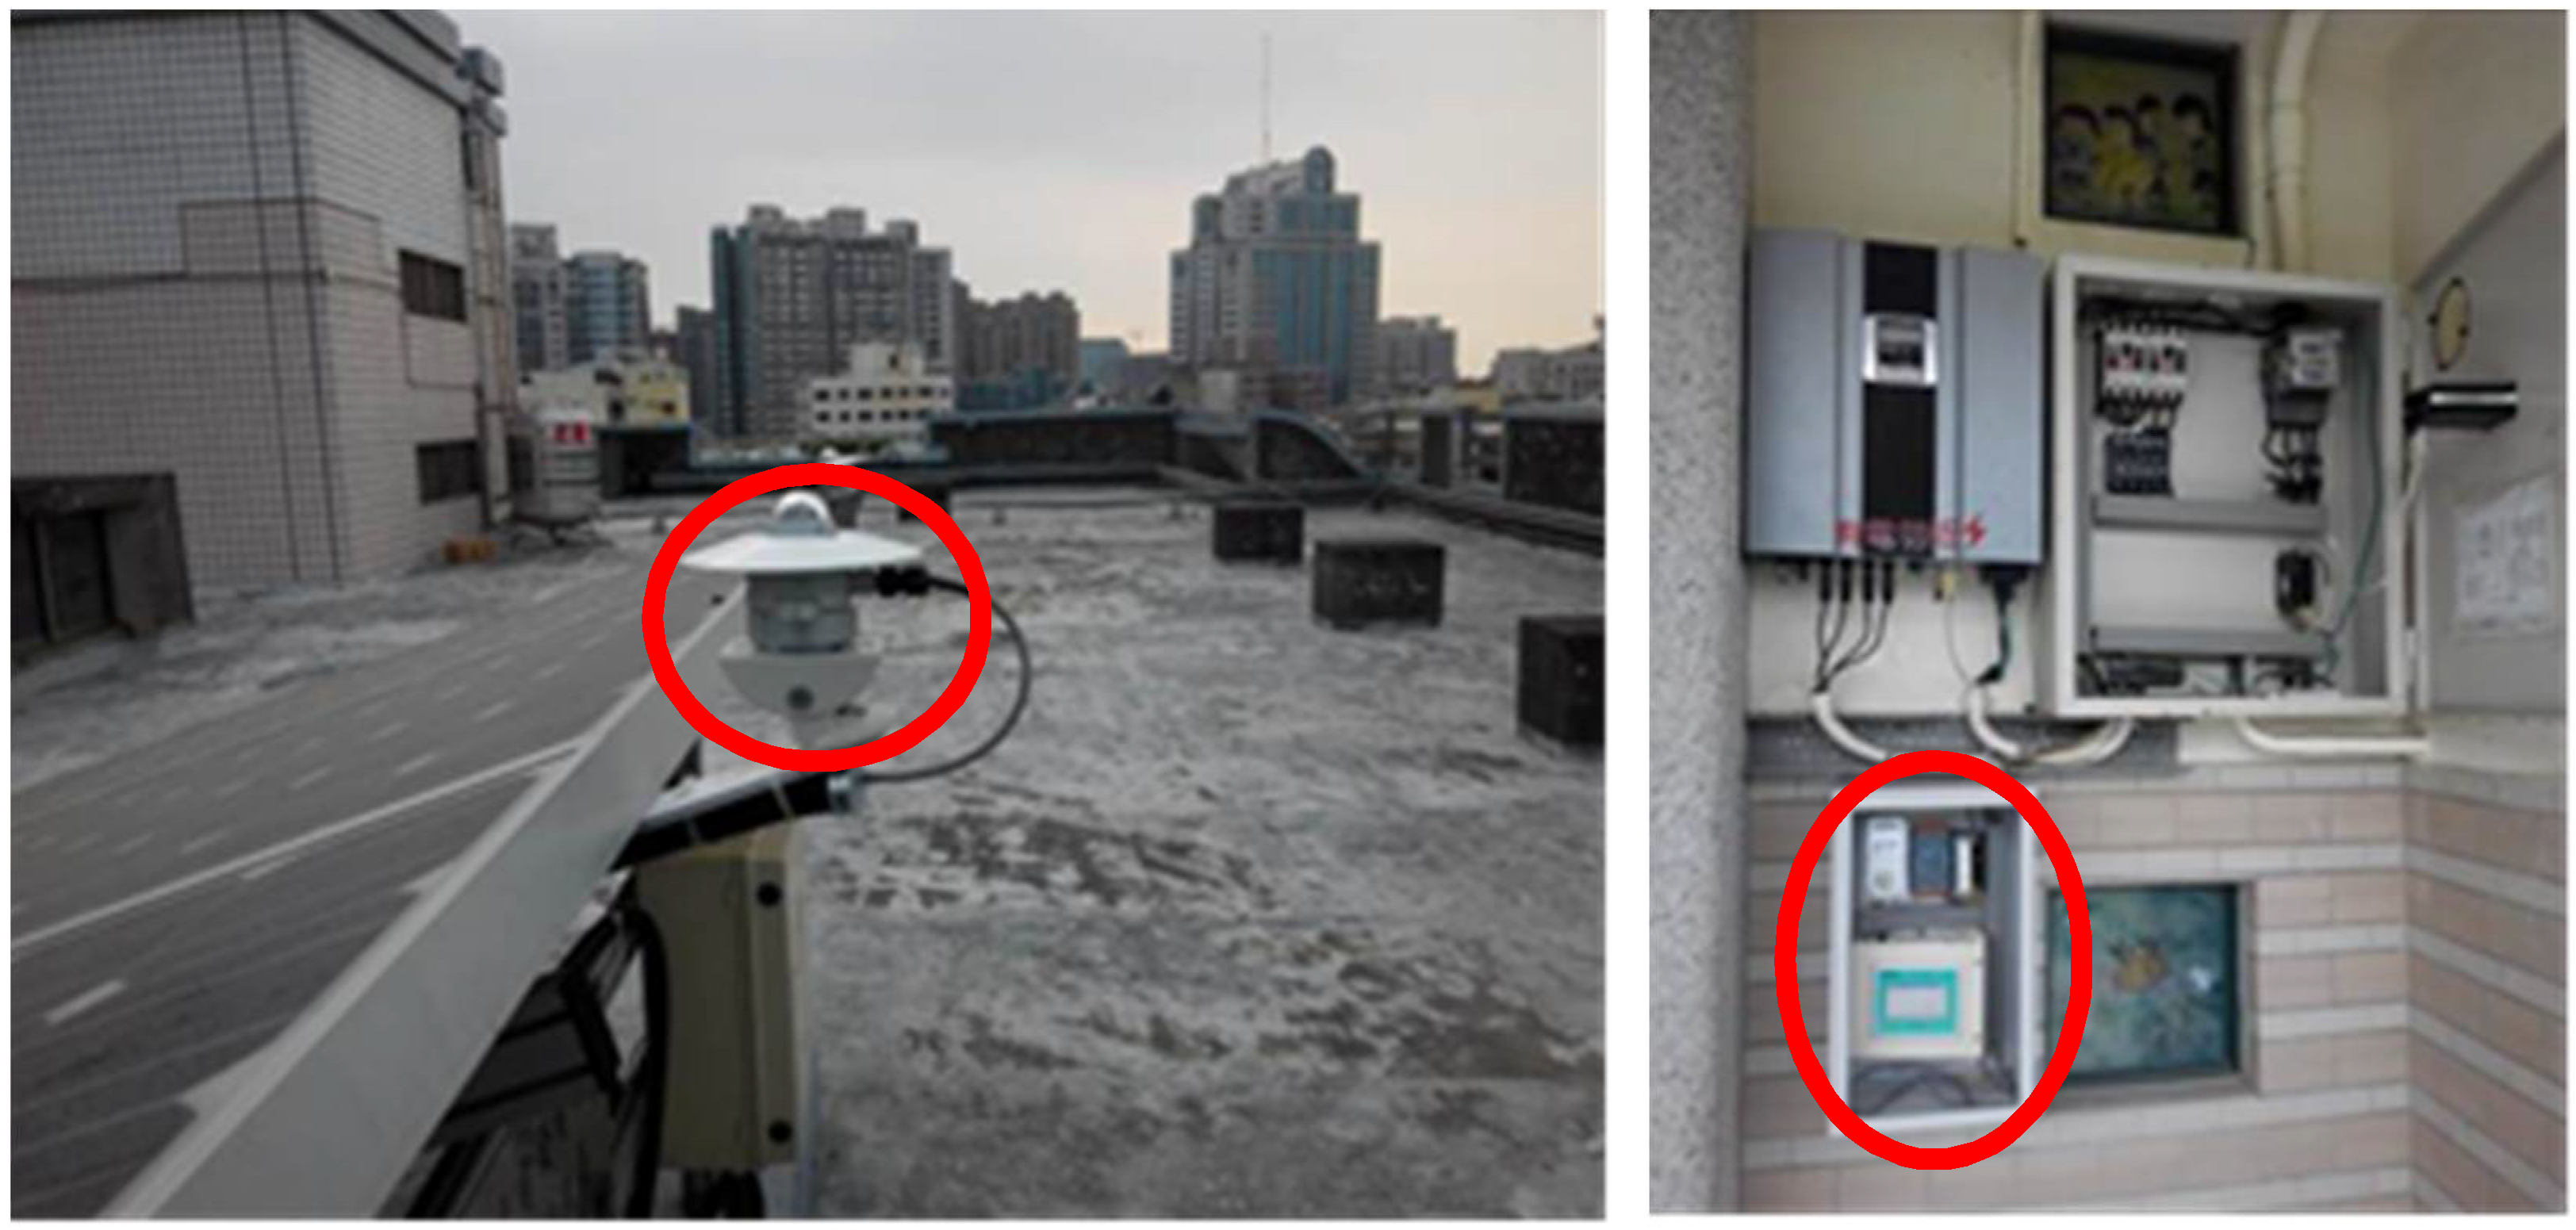
2. Horizontal Solar Radiation Monitoring Sites
3. Inverse Distance Weighting Algorithm
4. Verification Results
5. Discussion
6. Conclusions
Author Contributions
Acknowledgments
Conflicts of Interest
Appendix A

| No. | Location Name | Longitude and Latitude | No. | Location Name | Longitude and Latitude |
|---|---|---|---|---|---|
| 1 | Taichung City Love Home | 24.131594, 120.653725 | 12 | Wun-Guang Elementary School Hu-Kou Branch | 23.534850, 120.165990 |
| 2 | Dajia District Office | 24.349143, 120.622465 | 13 | Budai Township Office | 23.376099, 120.169879 |
| 3 | Houli District Office | 24.304839, 120.710660 | 14 | Chih-Hang Elementary School | 23.462219, 120.445861 |
| 4 | Shan Yang Elementary School | 24.159267, 120.544885 | 15 | Jiading District Office | 22.905872, 120.180293 |
| 5 | Hemei Township First-Class Community | 24.105946, 120.497144 | 16 | National Science and Technology Museum | 22.641431, 120.322551 |
| 6 | Shijou Township Administration | 23.851281, 120.499099 | 17 | Dashu District Office | 22.693476, 120.432831 |
| 7 | Fang Yuan Elementary School | 23.924819, 120.319233 | 18 | PingPei Senior High School. | 22.759382, 120.543578 |
| 8 | Chung Hsing Junior High School | 23.931503, 120.693683 | 19 | WanLuan Junior High School | 22.571429, 120.574788 |
| 9 | Puli Township Administration | 23.966574, 120.969214 | 20 | DungLung Elementary School | 22.464138, 120.451289 |
| 10 | Mailiau Township Administration | 23.753435, 120.252098 | 21 | Yuanchang Township Office | 23.649667, 120.314859 |
| 11 | TransWorld University | 23.680371, 120.555737 | 22 | Tainan Liujia Campus | 23.225857, 120.366523 |
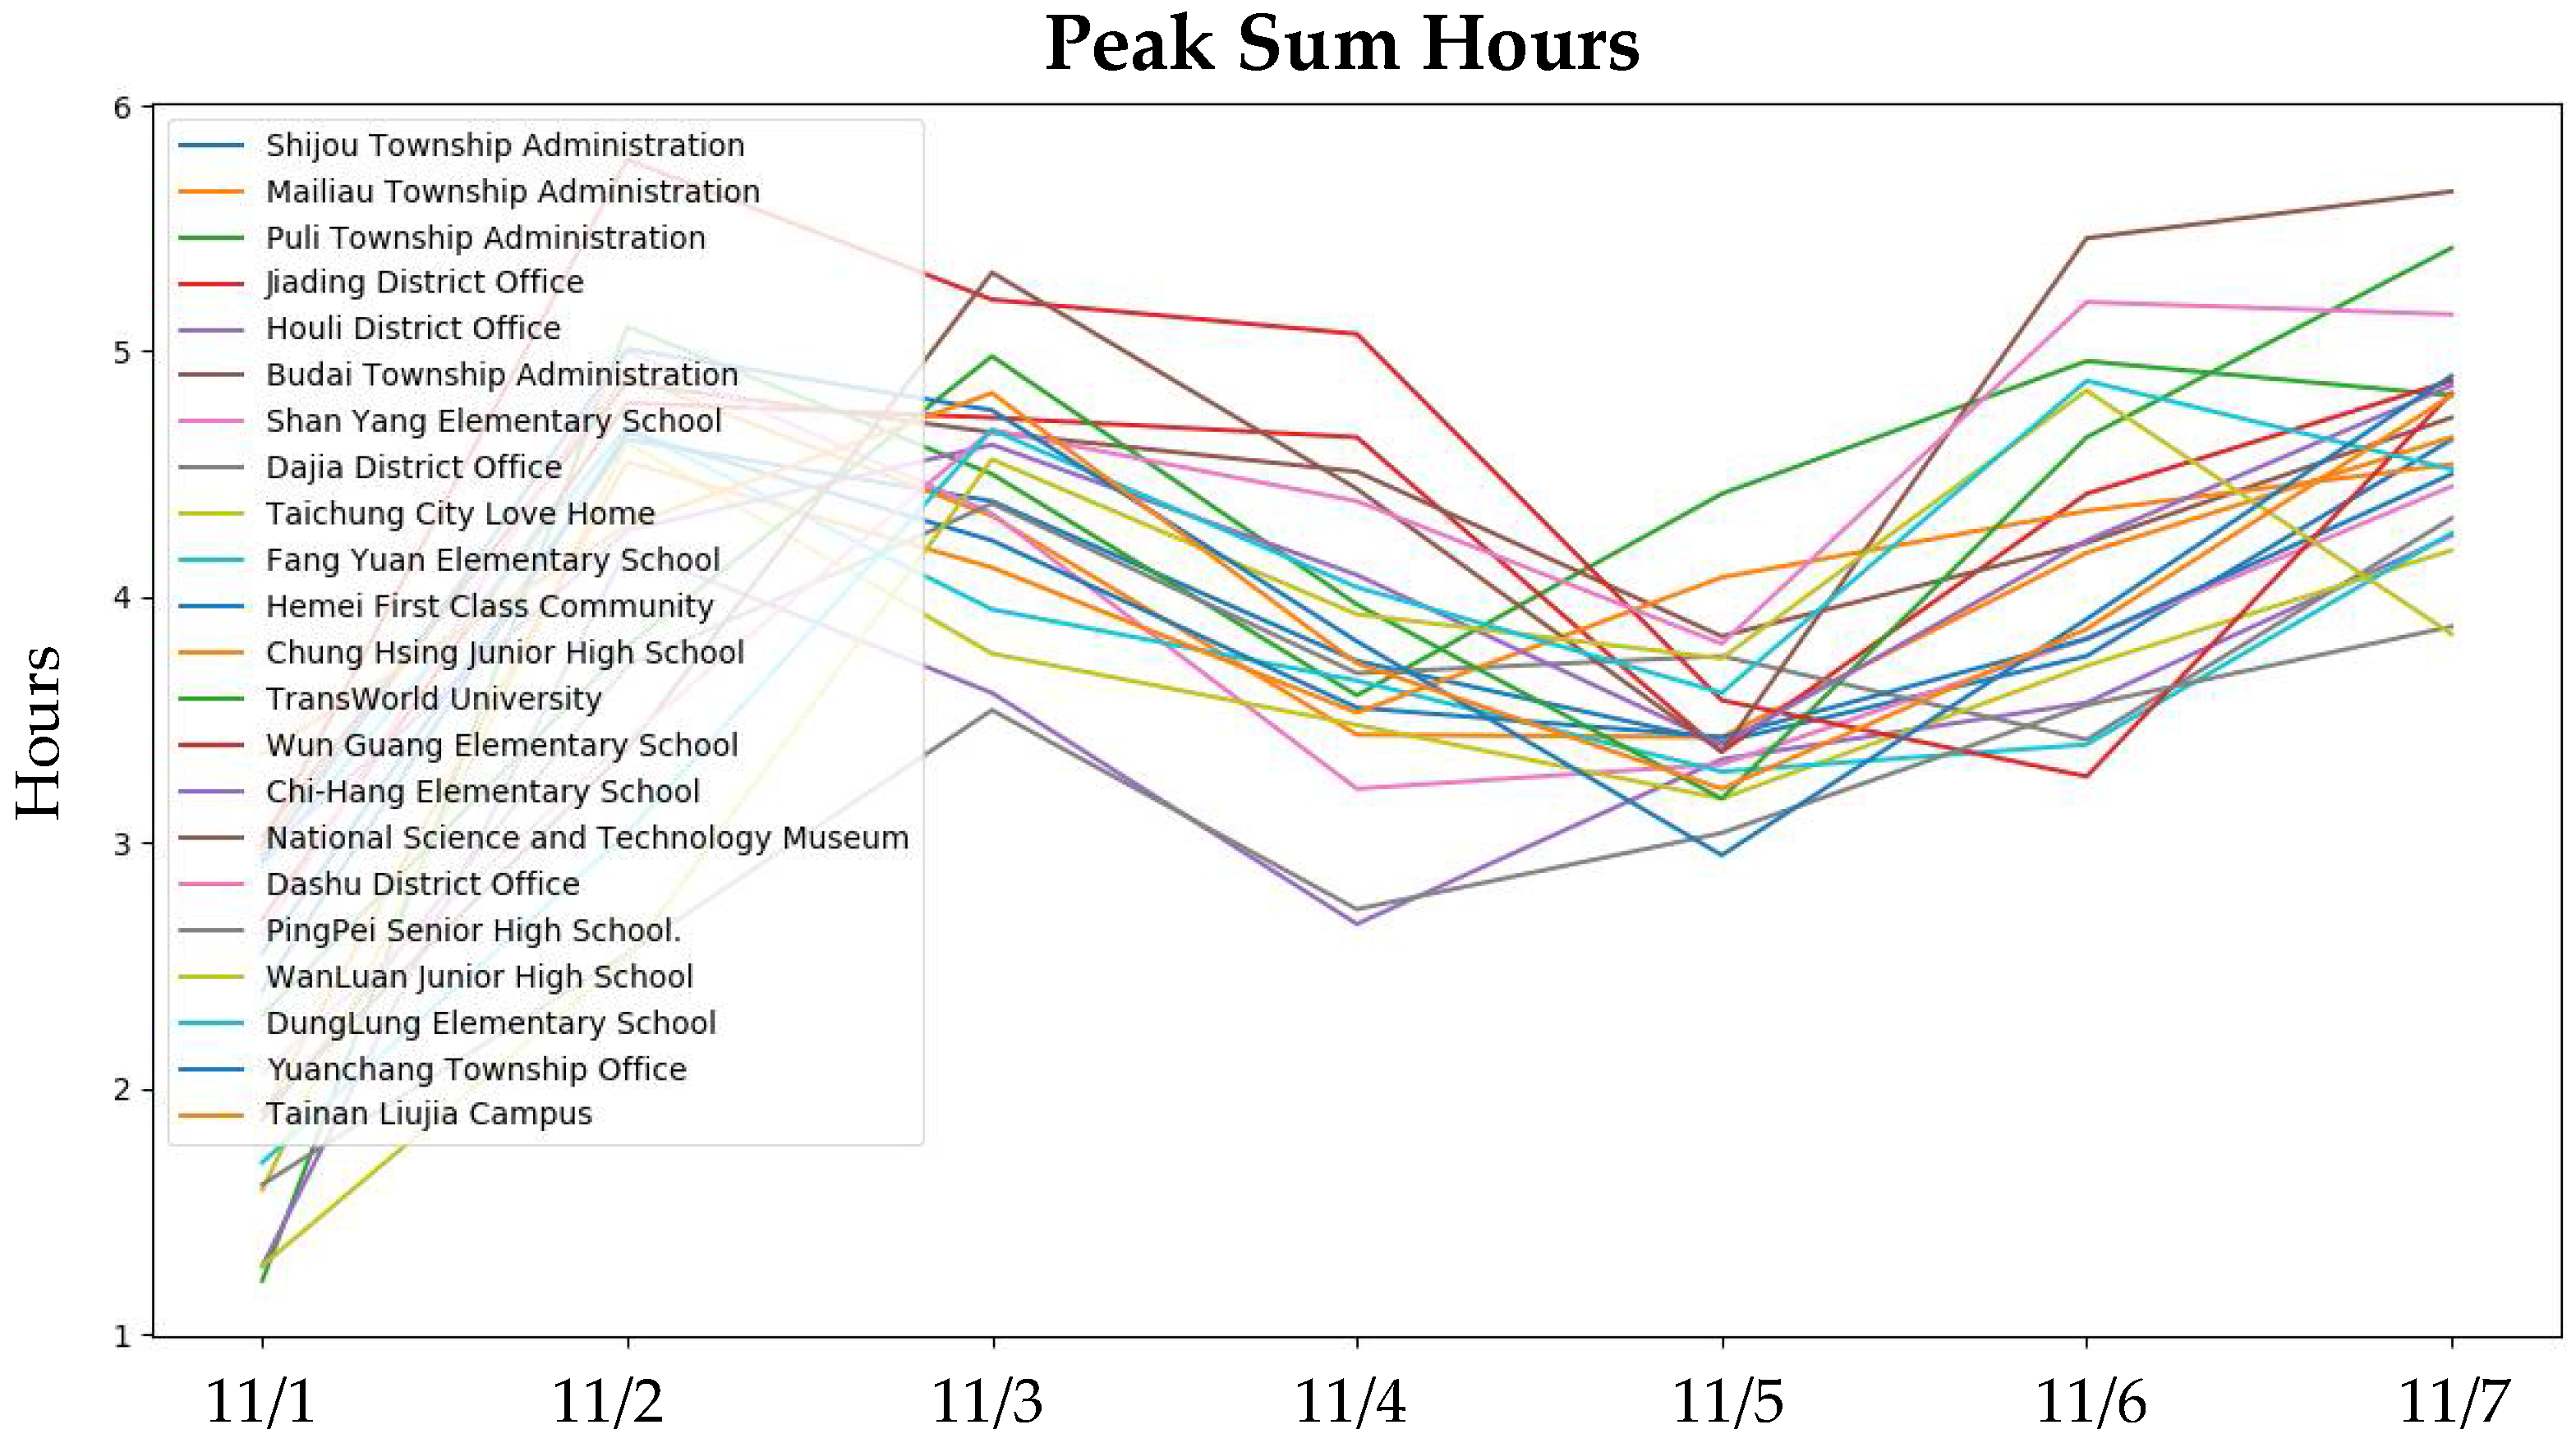
| No. | Station Name | PSH (Unit: Hours) | ||||||
|---|---|---|---|---|---|---|---|---|
| 11/1 | 11/2 | 11/3 | 11/4 | 11/5 | 11/6 | 11/7 | ||
| 1 | Shijou Township Administration | 2.55 | 4.64 | 4.39 | 3.74 | 3.41 | 3.76 | 4.64 |
| 2 | Mailiau Township Administration | 2.98 | 4.90 | 4.33 | 3.44 | 3.43 | 4.18 | 4.65 |
| 3 | Puli Township Administration | 1.22 | 5.10 | 4.50 | 3.60 | 4.42 | 4.96 | 4.82 |
| 4 | Jiading District Office | 2.69 | 4.79 | 4.73 | 4.65 | 3.37 | 4.42 | 4.88 |
| 5 | Houli District Office | 1.28 | 4.20 | 3.61 | 2.67 | 3.34 | 3.57 | 4.25 |
| 6 | Budai Township Administration | 3.03 | 4.87 | 4.67 | 4.51 | 3.84 | 4.22 | 4.73 |
| 7 | Shan Yang Elementary School | 2.63 | 5.00 | 4.34 | 3.22 | 3.32 | 3.83 | 4.45 |
| 8 | Dajia District Office | 1.87 | 3.72 | 4.38 | 3.69 | 3.76 | 3.42 | 4.32 |
| 9 | Taichung City Love Home | 1.59 | 4.63 | 3.77 | 3.48 | 3.18 | 3.72 | 4.19 |
| 10 | Fang Yuan Elementary School | 2.91 | 4.69 | 3.95 | 3.66 | 3.29 | 3.40 | 4.26 |
| 11 | Hemei First Class Community | 2.40 | 4.67 | 4.23 | 3.55 | 3.43 | 3.83 | 4.50 |
| 12 | Chung Hsing Junior High School | 1.89 | 4.55 | 4.12 | 3.53 | 4.08 | 4.35 | 4.54 |
| 13 | TransWorld University | 2.30 | 3.80 | 4.98 | 3.97 | 3.18 | 4.65 | 5.42 |
| 14 | Wun Guang Elementary School | 2.99 | 5.78 | 5.21 | 5.07 | 3.58 | 3.27 | 4.83 |
| 15 | Chi-Hang Elementary School | 2.95 | 4.27 | 4.62 | 4.09 | 3.40 | 4.23 | 4.86 |
| 16 | National Science and Technology Museum | 1.91 | 3.38 | 5.32 | 4.44 | 3.37 | 5.46 | 5.65 |
| 17 | Dashu District Office | 2.06 | 3.42 | 4.68 | 4.39 | 3.81 | 5.20 | 5.15 |
| 18 | PingPei Senior High School. | 1.61 | 2.55 | 3.54 | 2.73 | 3.04 | 3.56 | 3.88 |
| 19 | WanLuan Junior High School | 1.28 | 2.53 | 4.56 | 3.93 | 3.75 | 4.84 | 3.85 |
| 20 | DungLung Elementary School | 1.70 | 3.04 | 4.68 | 4.04 | 3.61 | 4.88 | 4.52 |
| 21 | Yuanchang Township Office | 2.93 | 5.01 | 4.76 | 3.82 | 2.95 | 3.91 | 4.90 |
| 22 | Tainan Liujia Campus | 3.36 | 4.29 | 4.83 | 3.73 | 3.22 | 3.87 | 4.82 |
| Full Name | Acronyms |
|---|---|
| Artificial Neural Network | ANN |
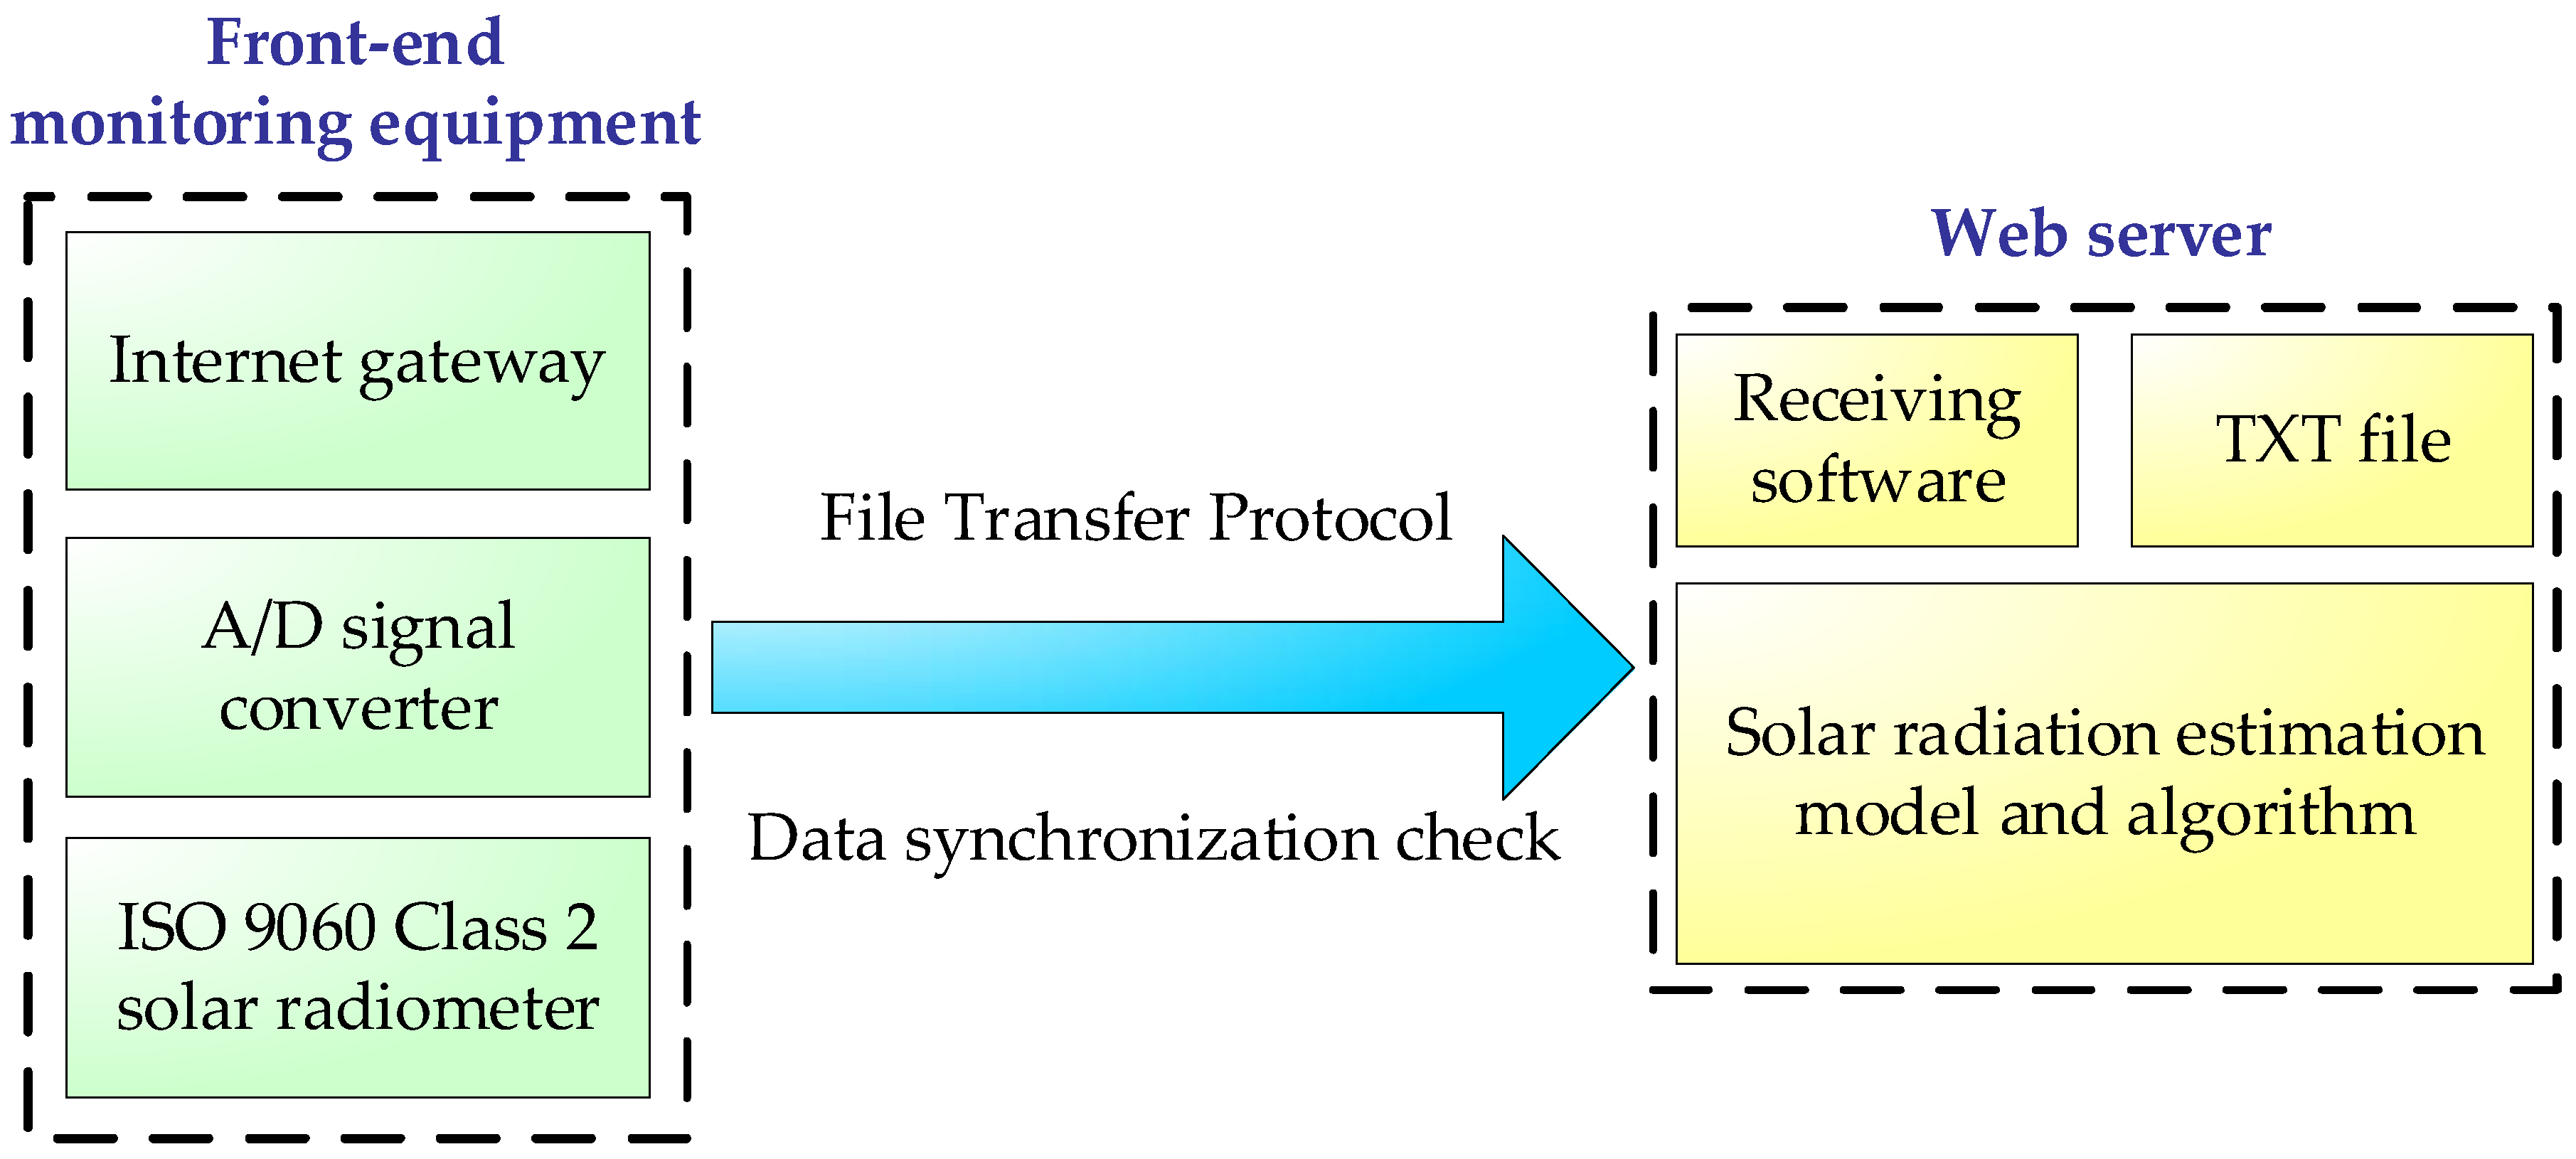
| File Transfer Protocol | FTP |
| Inverse Distance Weighting | IDW |
| Mean Absolute Percentage Error | MAPE |
| Monthly Average Daily Solar Radiation | MADSR |
| Ordinary Kriging | OK |
| Particle Swarm Optimization Neural Network | PSO-NN |
| Peak Sum Hours | PHS |
| Root-Mean-Square Deviation | RMSD |
| Root-Mean-Square Error | RMSE |
| Solar Photovoltaic | PV |
References
- SolarPower EuropeGlobal Market Outlook for Solar Power 2015-2019. Glob. Mark. Outlook 2014, 32. [CrossRef]
- Renewable, I.; Agency, E. Renewable Capacity Statistics 2017; IRENA: Masdar City, United Arab Emirates, 2017; ISBN 978-92-9260-018-1. [Google Scholar]
- Jurasz, J.; Ciapała, B. Integrating photovoltaics into energy systems by using a run-off-river power plant with pondage to smooth energy exchange with the power gird. Appl. Energy 2017, 198, 21–35. [Google Scholar] [CrossRef]
- Ming, B.; Liu, P.; Guo, S.; Zhang, X.; Feng, M.; Wang, X. Optimizing utility-scale photovoltaic power generation for integration into a hydropower reservoir by incorporating long- and short-term operational decisions. Appl. Energy 2017, 204, 432–445. [Google Scholar] [CrossRef]
- Oh, Y.; Park, S. Modeling and parameterization of fuel economy in Heavy Duty Vehicles (HDVs). Energies 2014, 7, 5177–5200. [Google Scholar] [CrossRef]
- Kim, E.; Ra, I.; Rhee, K.H.; Kim, C.S. Estimation of real-time flood risk on roads based on rainfall calculated by the revised method of missing rainfall. Sustainability 2014, 6, 6418–6431. [Google Scholar] [CrossRef]
- Alshuwaikhat, H.M.; Abubakar, I.R.; Aina, Y.A.; Adenle, Y.A.; Umair, M. The development of a GIS-based model for campus environmental sustainability assessment. Sustainability 2017, 9, 439. [Google Scholar] [CrossRef]
- Jin, X.; Li, Y.; Zhang, J.; Zheng, J.; Liu, H. An approach to evaluating light pollution in residential zones: A case study of Beijing. Sustainability 2017, 9, 652. [Google Scholar] [CrossRef]
- Wang, Z.; Nie, K. Measuring Spatial Distribution Characteristics of Heavy Metal Contaminations in a Network-Constrained Environment: A Case Study in River Network of Daye, China. Sustainability 2017, 9, 986. [Google Scholar] [CrossRef]
- Madhloom, H.M.; Al-Ansari, N.; Laue, J.; Chabuk, A. Modeling spatial distribution of some contamination within the lower reaches of Diyala river using IDW interpolation. Sustainability 2017, 10. [Google Scholar] [CrossRef]
- Hohn, M.E. An Introduction to applied geostatistics. Comput. Geosci. 1991, 17, 471–473. [Google Scholar] [CrossRef]
- Cressie, N. The origins of kriging. Math. Geol. 1990, 22, 239–252. [Google Scholar] [CrossRef]
- Trnka, M.; Žalud, Z.; Eitzinger, J.; Dubrovský, M. Global solar radiation in Central European lowlands estimated by various empirical formulae. Agric. For. Meteorol. 2005, 131, 54–76. [Google Scholar] [CrossRef]
- Almorox, J.; Hontoria, C. Global solar radiation estimation using sunshine duration in Spain. Energy Convers. Manag. 2004, 45, 1529–1535. [Google Scholar] [CrossRef]
- Li, M.F.; Fan, L.; Liu, H.B.; Wu, W.; Chen, J.L. Impact of time interval on the ångström-Prescott coefficients and their interchangeability in estimating radiation. Renew. Energy 2012, 44, 431–438. [Google Scholar] [CrossRef]
- Behrang, M.A.; Assareh, E.; Ghanbarzadeh, A.; Noghrehabadi, A.R. The potential of different artificial neural network (ANN) techniques in daily global solar radiation modeling based on meteorological data. Sol. Energy 2010, 84, 1468–1480. [Google Scholar] [CrossRef]
- Rumbayan, M.; Abudureyimu, A.; Nagasaka, K. Mapping of solar energy potential in Indonesia using artificial neural network and geographical information system. Renew. Sustain. Energy Rev. 2012, 16, 1437–1449. [Google Scholar] [CrossRef]
- Mohandes, M.A. Modeling global solar radiation using Particle Swarm Optimization (PSO). Sol. Energy 2012, 86, 3137–3145. [Google Scholar] [CrossRef]
- Janjai, S.; Pankaew, P.; Laksanaboonsong, J.; Kitichantaropas, P. Estimation of solar radiation over Cambodia from long-term satellite data. Renew. Energy 2011, 36, 1214–1220. [Google Scholar] [CrossRef]
- Wu, W.; Liu, H.-B. Assessment of monthly solar radiation estimates using support vector machines and air temperatures. Int. J. Climatol. 2012, 32, 274–285. [Google Scholar] [CrossRef]


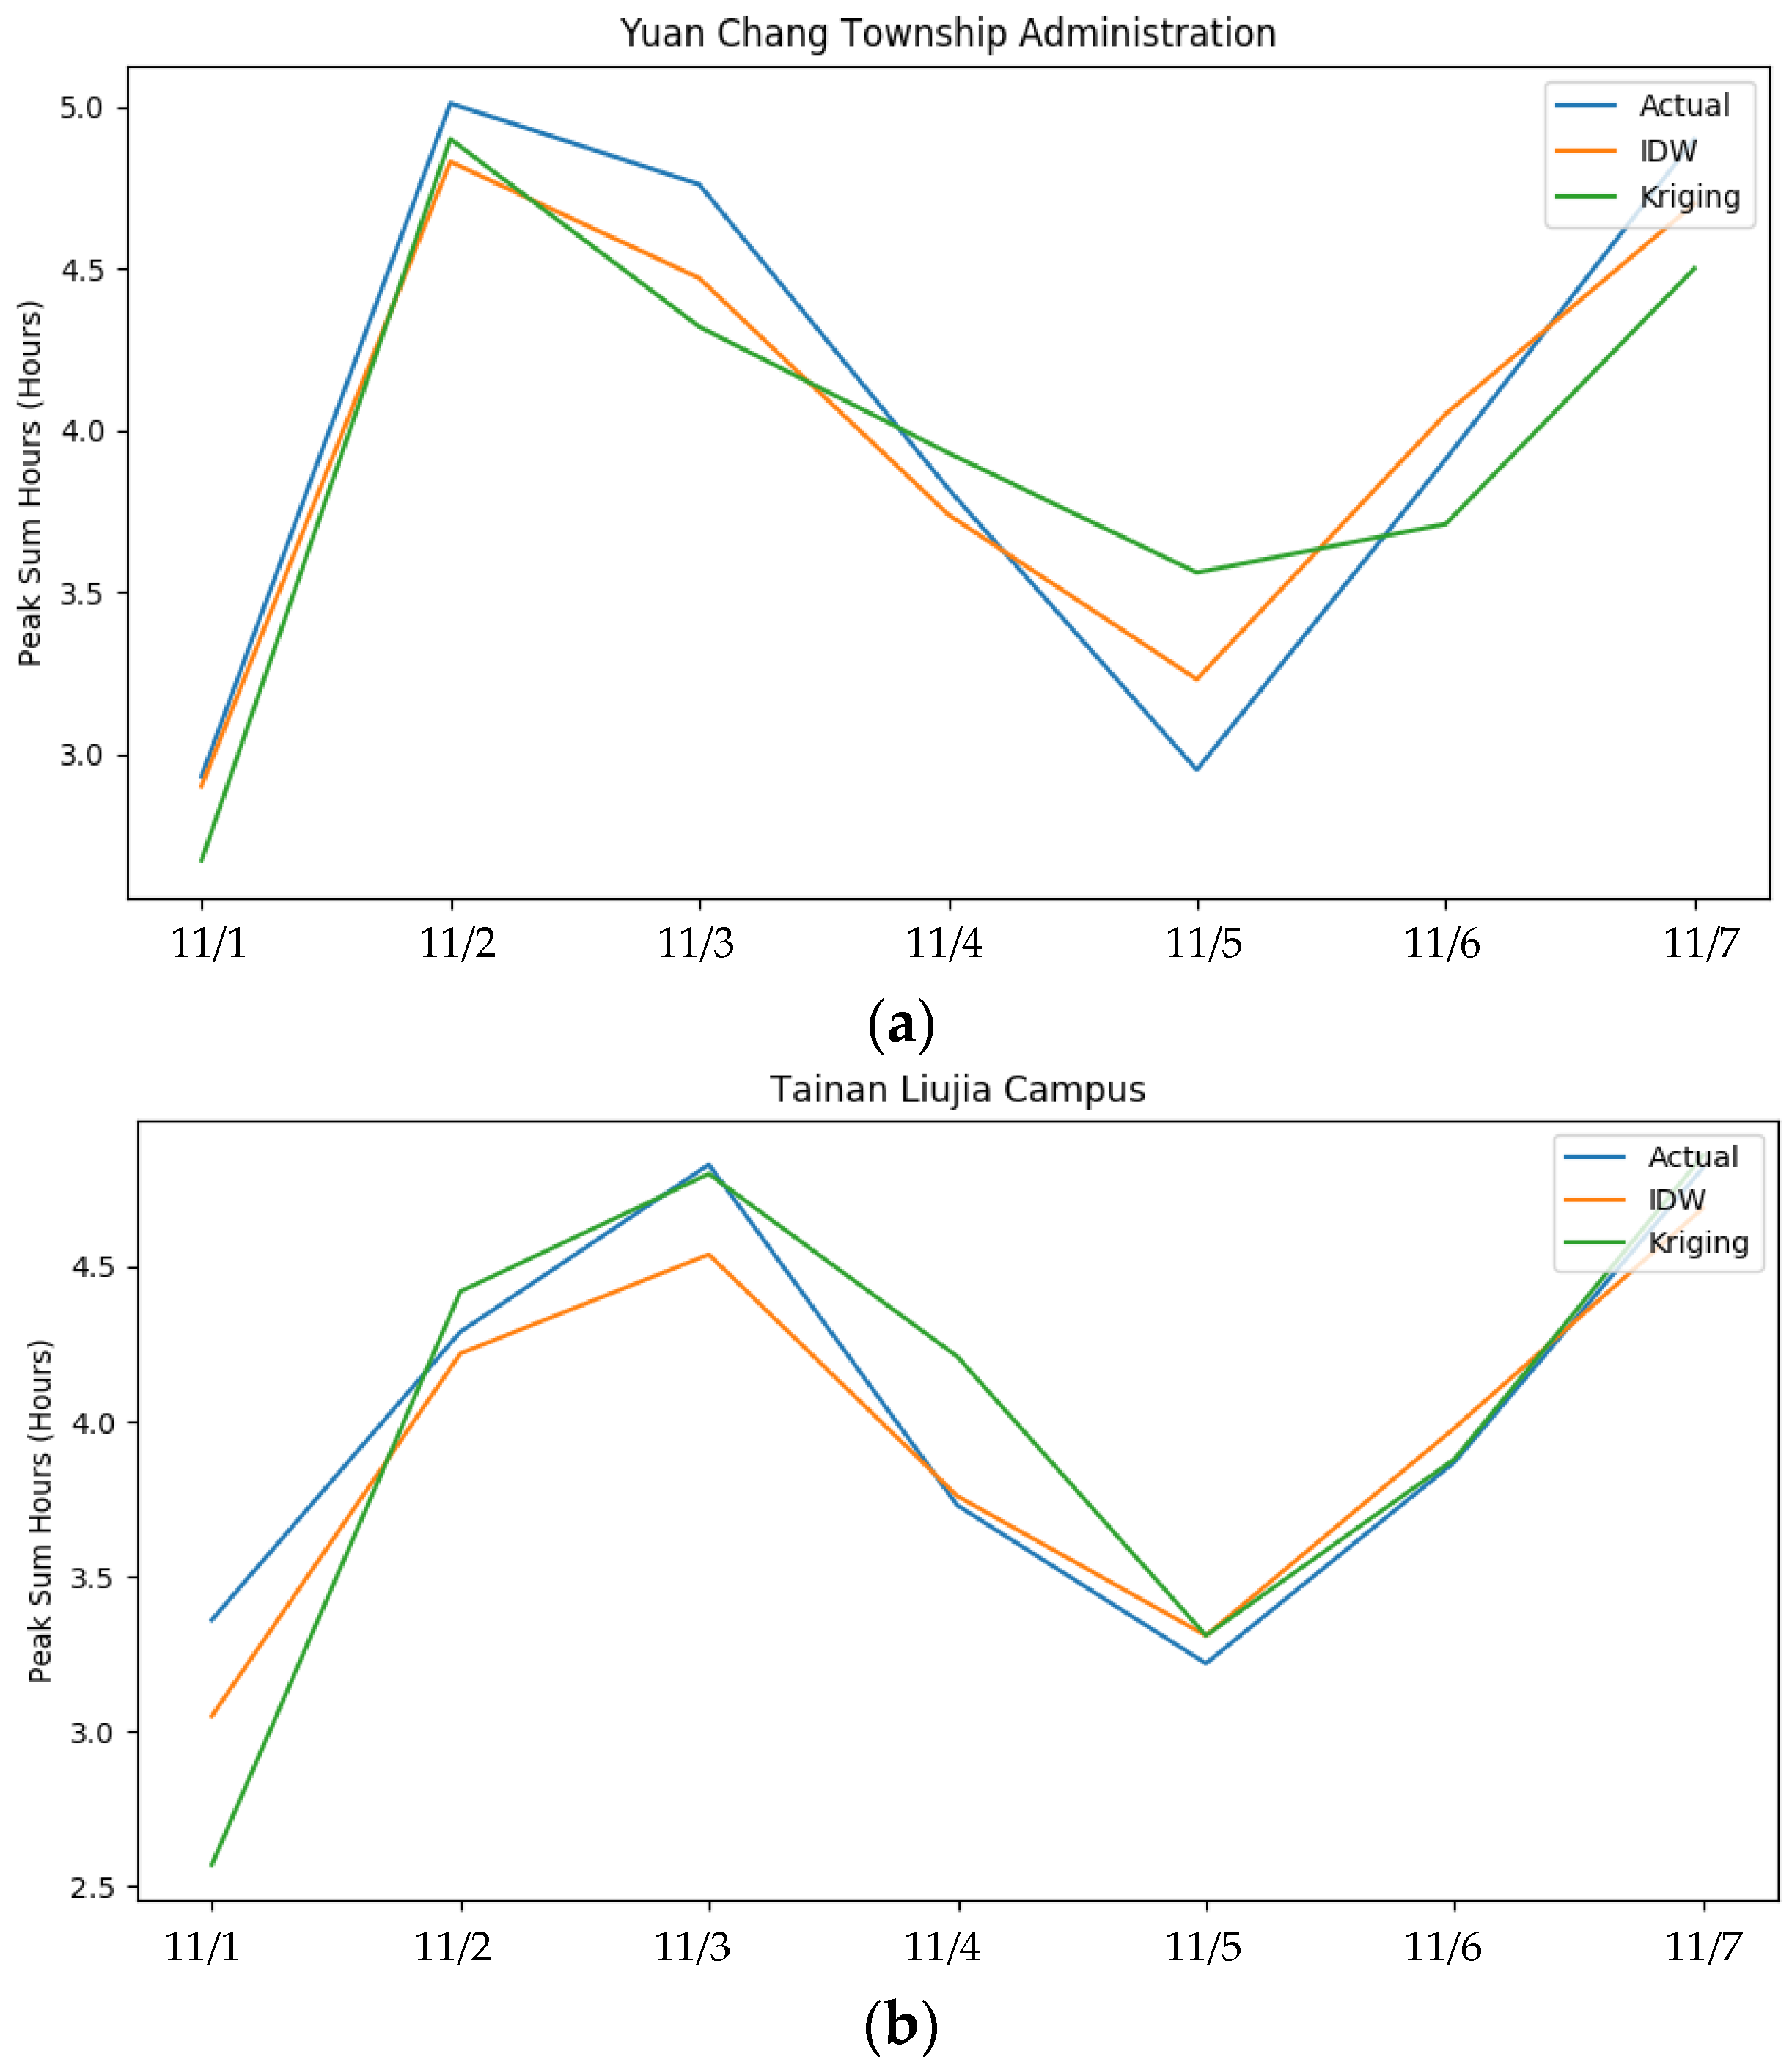
| Date | Actual Value | Estimated Value (IDW) | MAPE (IDW) | Estimated Value (OK) | MAPE (OK) |
|---|---|---|---|---|---|
| 11/1 | 2.93 | 2.90 | 1.15% | 2.67 | 8.79% |
| 11/2 | 5.01 | 4.83 | 3.53% | 4.90 | 2.17% |
| 11/3 | 4.76 | 4.47 | 6.17% | 4.32 | 9.03% |
| 11/4 | 3.82 | 3.74 | 2.01% | 3.93 | 2.94% |
| 11/5 | 2.95 | 3.23 | 9.50% | 3.56 | 20.7% |
| 11/6 | 3.91 | 4.05 | 3.65% | 3.71 | 5.02% |
| 11/7 | 4.90 | 4.70 | 4.04% | 4.50 | 8.03% |
| Average | 3.78 | 3.99 | 4.30% | 3.94 | 8.10% |
| Date | Actual Value | Estimated Value (IDW) | MAPE (IDW) | Estimated Value (OK) | MAPE (OK) |
|---|---|---|---|---|---|
| 11/1 | 3.36 | 3.05 | 9.26% | 2.57 | 23.28% |
| 11/2 | 4.29 | 4.22 | 1.63% | 4.42 | 3.24% |
| 11/3 | 4.83 | 4.54 | 6.06% | 4.80 | 0.42% |
| 11/4 | 3.73 | 3.76 | 0.72% | 4.21 | 13.00% |
| 11/5 | 3.22 | 3.31 | 2.65% | 3.31 | 2.94% |
| 11/6 | 3.87 | 3.98 | 2.88% | 3.88 | 0.38% |
| 11/7 | 4.82 | 4.69 | 2.76% | 4.86 | 1.01% |
| Average | 4.02 | 3.94 | 3.71% | 4.01 | 6.32% |
| MAPE Value | Model Accuracy |
|---|---|
| MAPE < 10% | Very Good (The closer to 0 the better) |
| 10% < MAPE < 20% | Good |
| 20% < MAPE < 50% | Reasonable |
| 50% < MAPE | False |
© 2018 by the authors. Licensee MDPI, Basel, Switzerland. This article is an open access article distributed under the terms and conditions of the Creative Commons Attribution (CC BY) license (http://creativecommons.org/licenses/by/4.0/).
Share and Cite
Kuo, P.-H.; Chen, H.-C.; Huang, C.-J. Solar Radiation Estimation Algorithm and Field Verification in Taiwan. Energies 2018, 11, 1374. https://doi.org/10.3390/en11061374
Kuo P-H, Chen H-C, Huang C-J. Solar Radiation Estimation Algorithm and Field Verification in Taiwan. Energies. 2018; 11(6):1374. https://doi.org/10.3390/en11061374
Chicago/Turabian StyleKuo, Ping-Huan, Hsin-Chuan Chen, and Chiou-Jye Huang. 2018. "Solar Radiation Estimation Algorithm and Field Verification in Taiwan" Energies 11, no. 6: 1374. https://doi.org/10.3390/en11061374
APA StyleKuo, P.-H., Chen, H.-C., & Huang, C.-J. (2018). Solar Radiation Estimation Algorithm and Field Verification in Taiwan. Energies, 11(6), 1374. https://doi.org/10.3390/en11061374