Approaches to Methods of Risk Analysis and Assessment Regarding the Gas Supply to a City


Abstract
1. Introduction
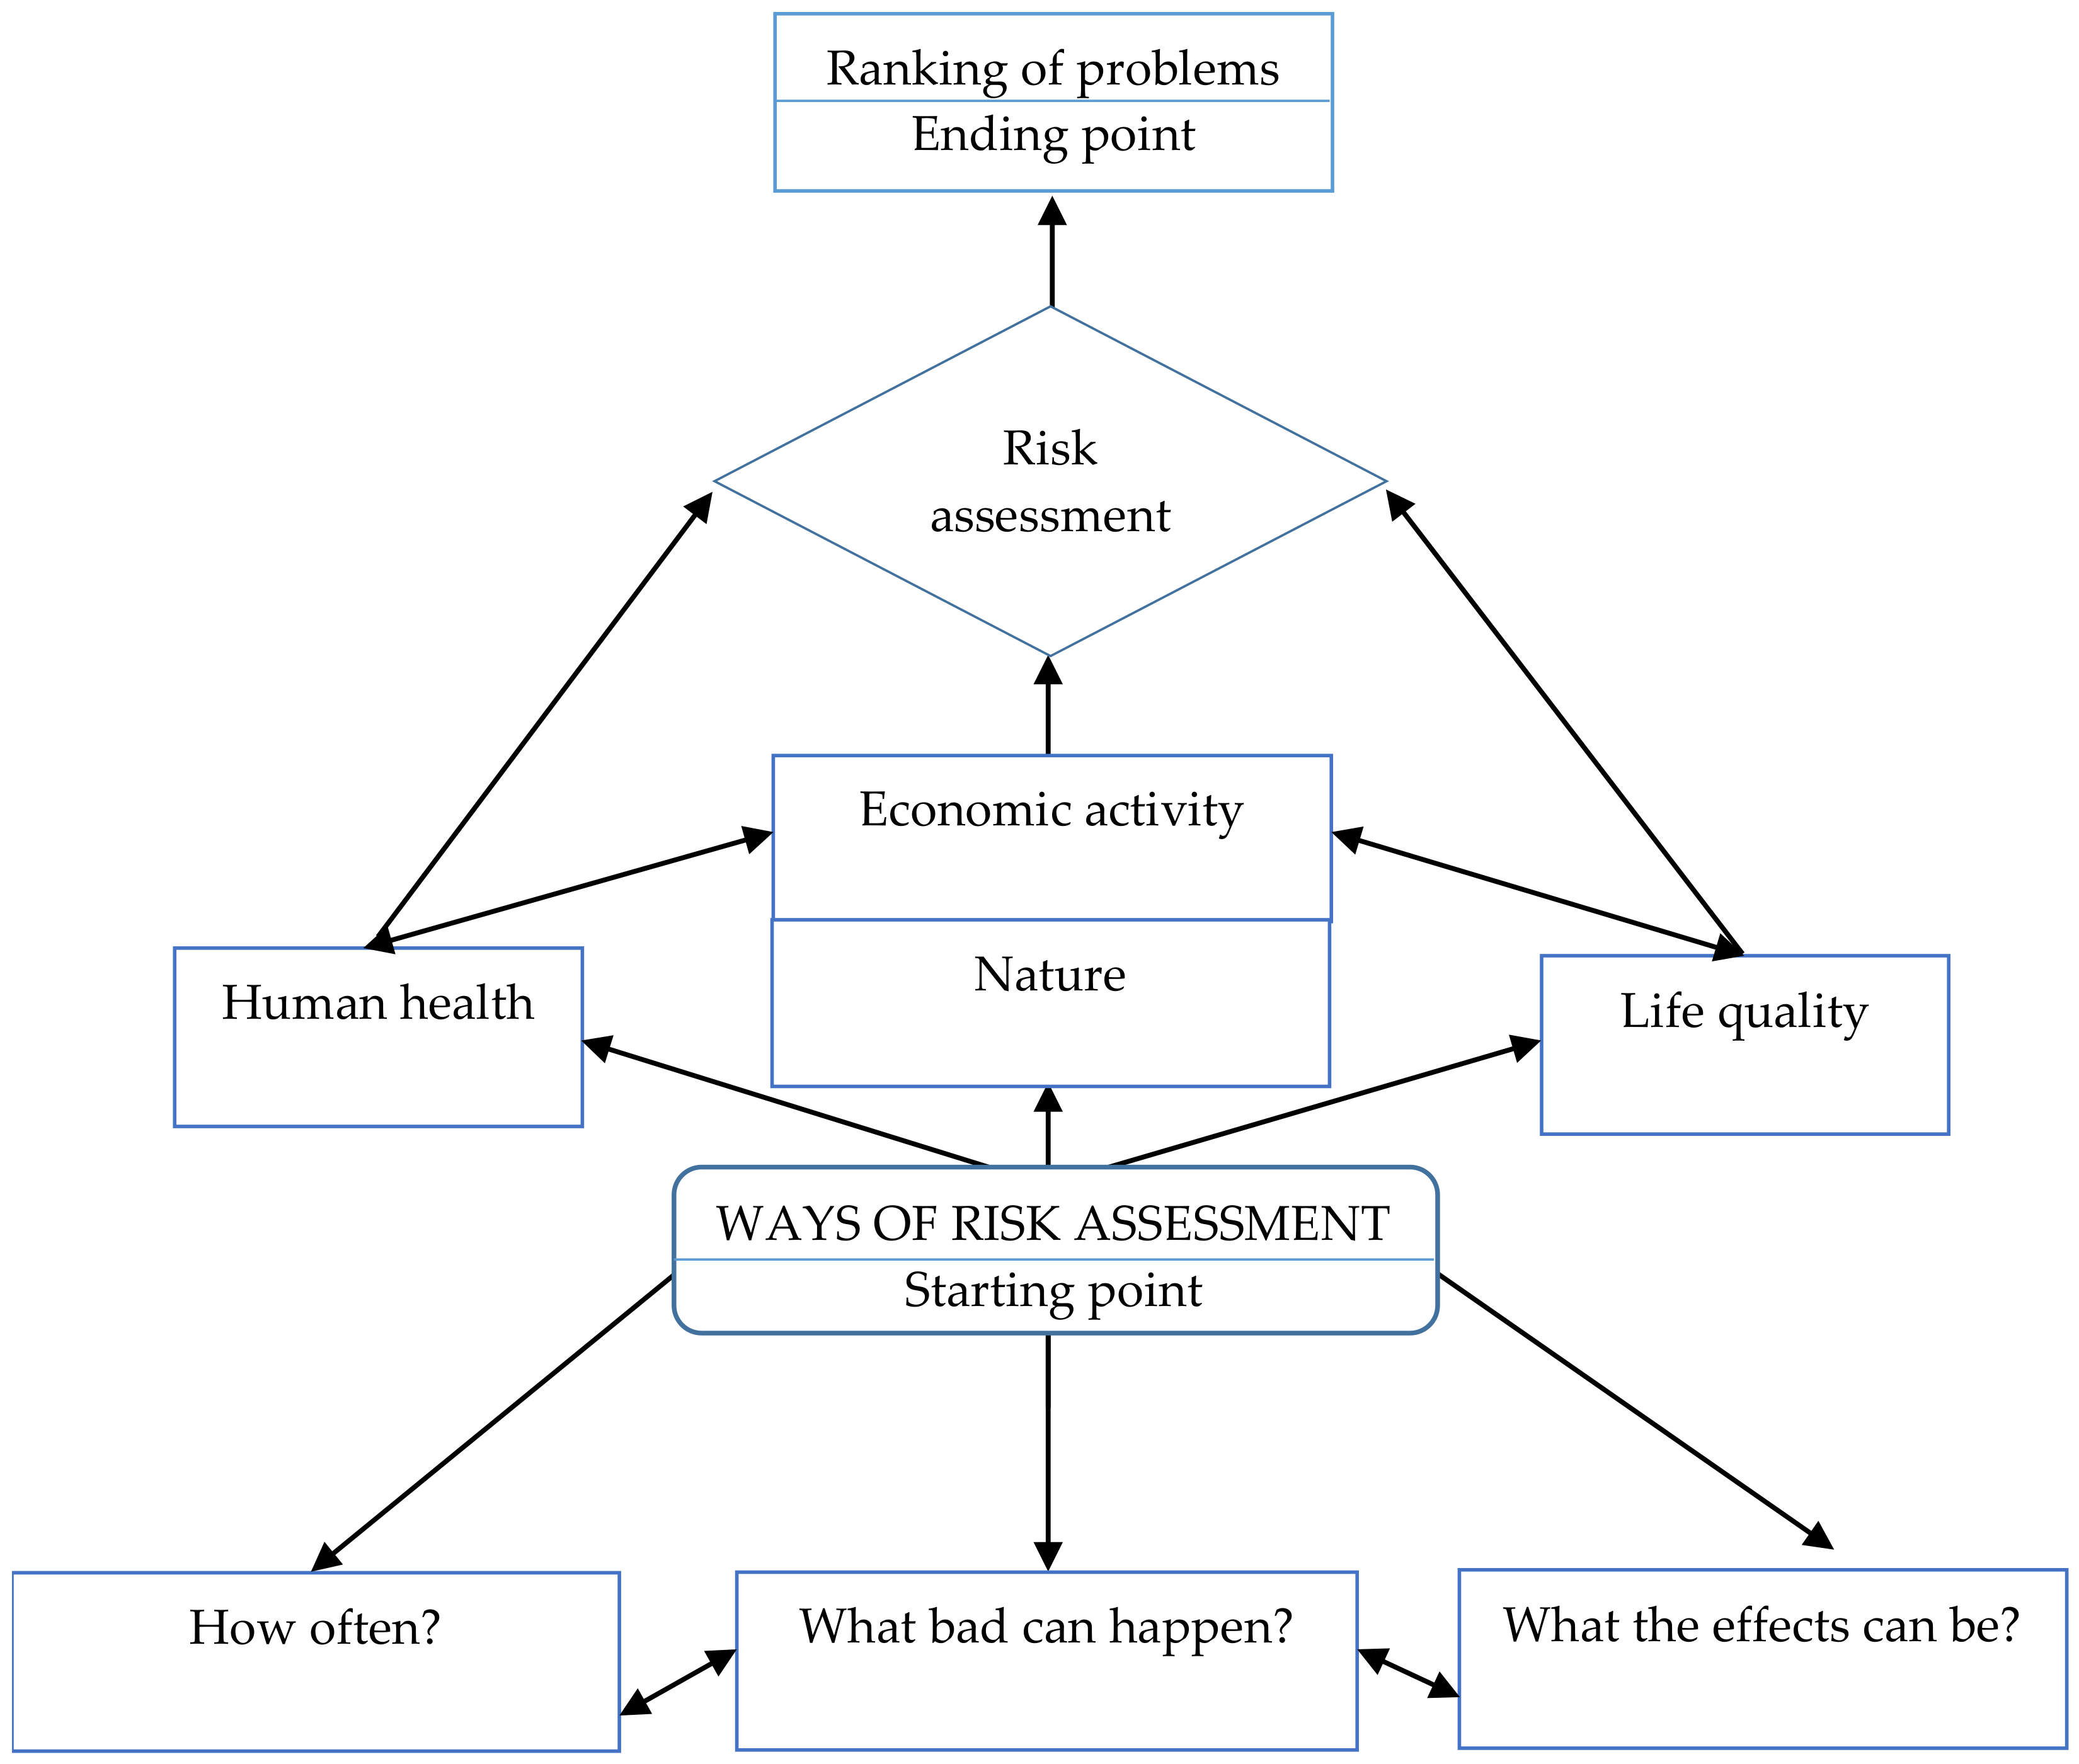
- Safety—i.e., the probability that losses (e.g., to health and human life) will not arise as a result of, and in connection with, undesirable events.
- Risk—i.e., the probability of negative consequences [6], as often understood in terms of the possibility of occurrence of accidents, failures, or disasters that bring different kinds of losses (health, financial, or even cultural).
- Ecological risk—i.e., the likelihood of negative consequences arising in the ecosystem, with a key phase here entailing estimation of the time needed for the ecosystem to achieve a rebalancing following eliminating of the given harmful factor [6].
- The threat to human health—as determined by reference to the likelihood that health or life will be affected [4].
- Negative events being identified (i.e., with both causes of occurrence and consequences determined);
- Probability of occurrence of events being determined;
- The damage caused when undesirable events occur being assessed.
- Variables characterising the probability of losses, and
- Variables characterising the magnitude or impact of losses.
2. Losses Arising from Failures in the Natural Gas Supply Subsystem
3. Methods
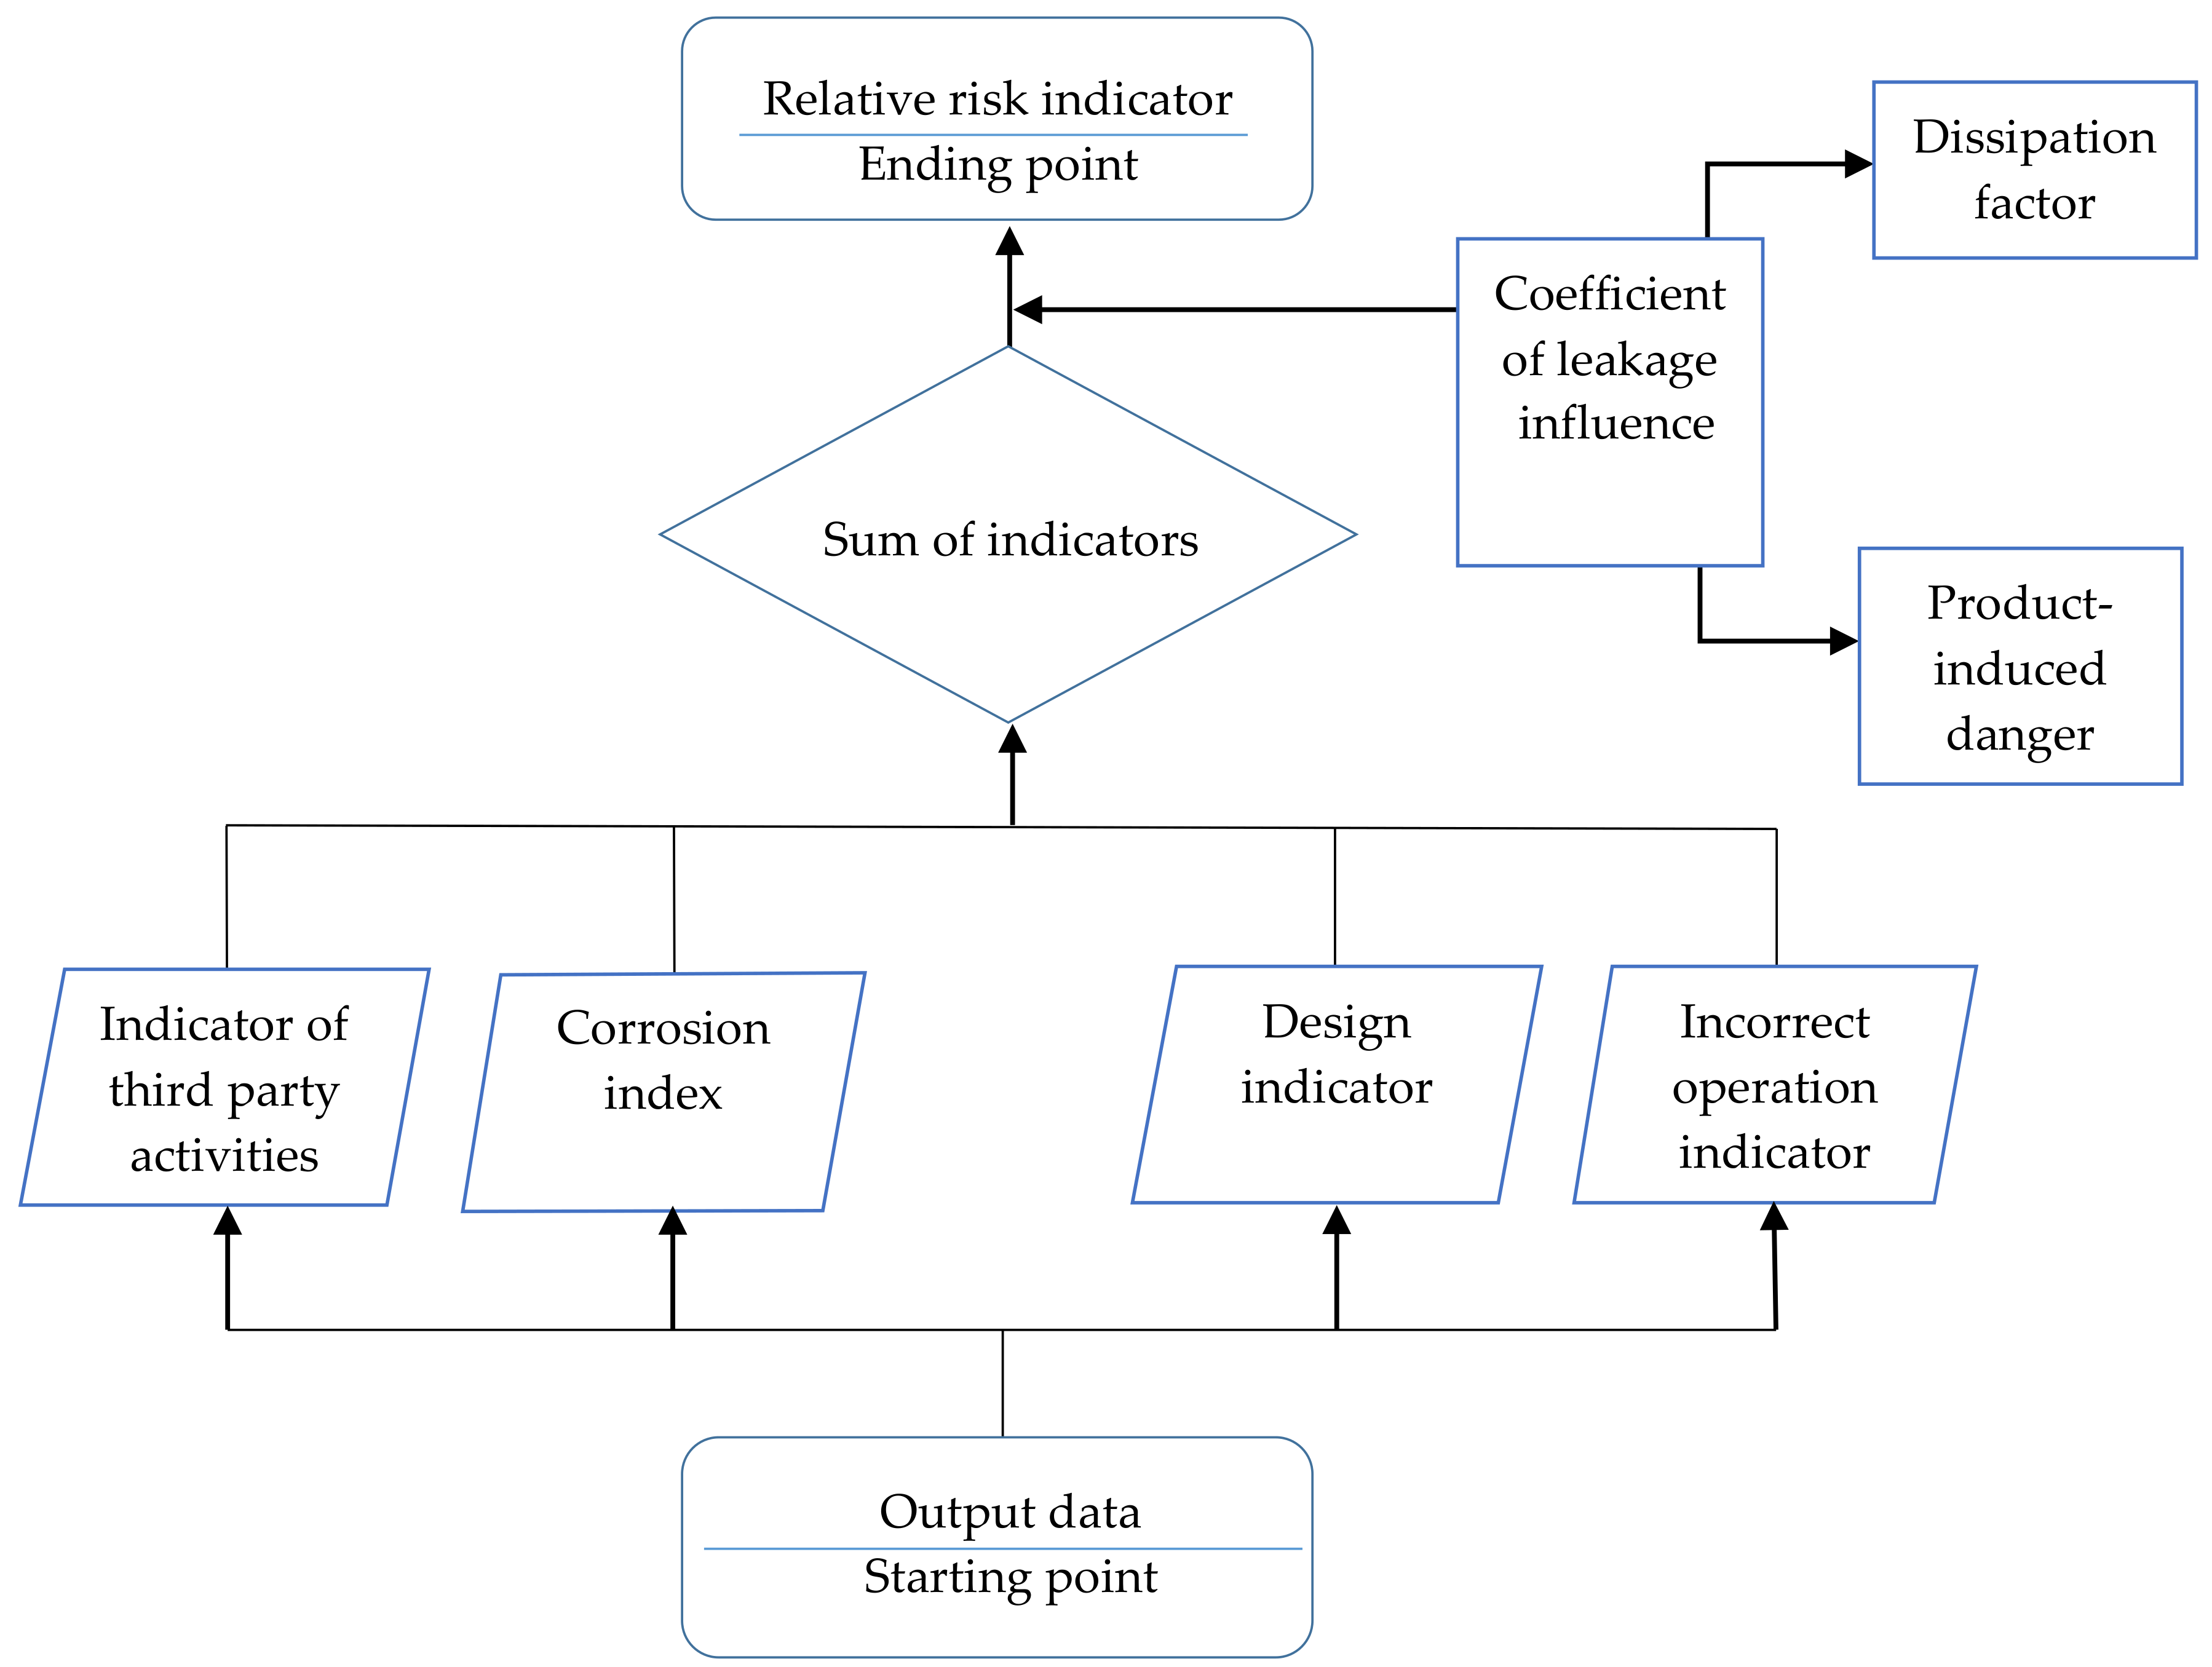
Preliminary Analysis of Risk
- Design indicators (e.g., the safety factor for a pipe as the ratio of wall thickness to required thickness, or as designed pressure set against existing pressure, or as tightness of the installation);
- Indicators of improper operation (relating to safety systems, supervision, network operation and maintenance);
- A corrosion index (relating to pipe insulation, external influences, and anti-corrosion measures);
- A third-party activity index (minimum coverage of the gas pipeline, population density, the regularity with which work on the network is carried out).
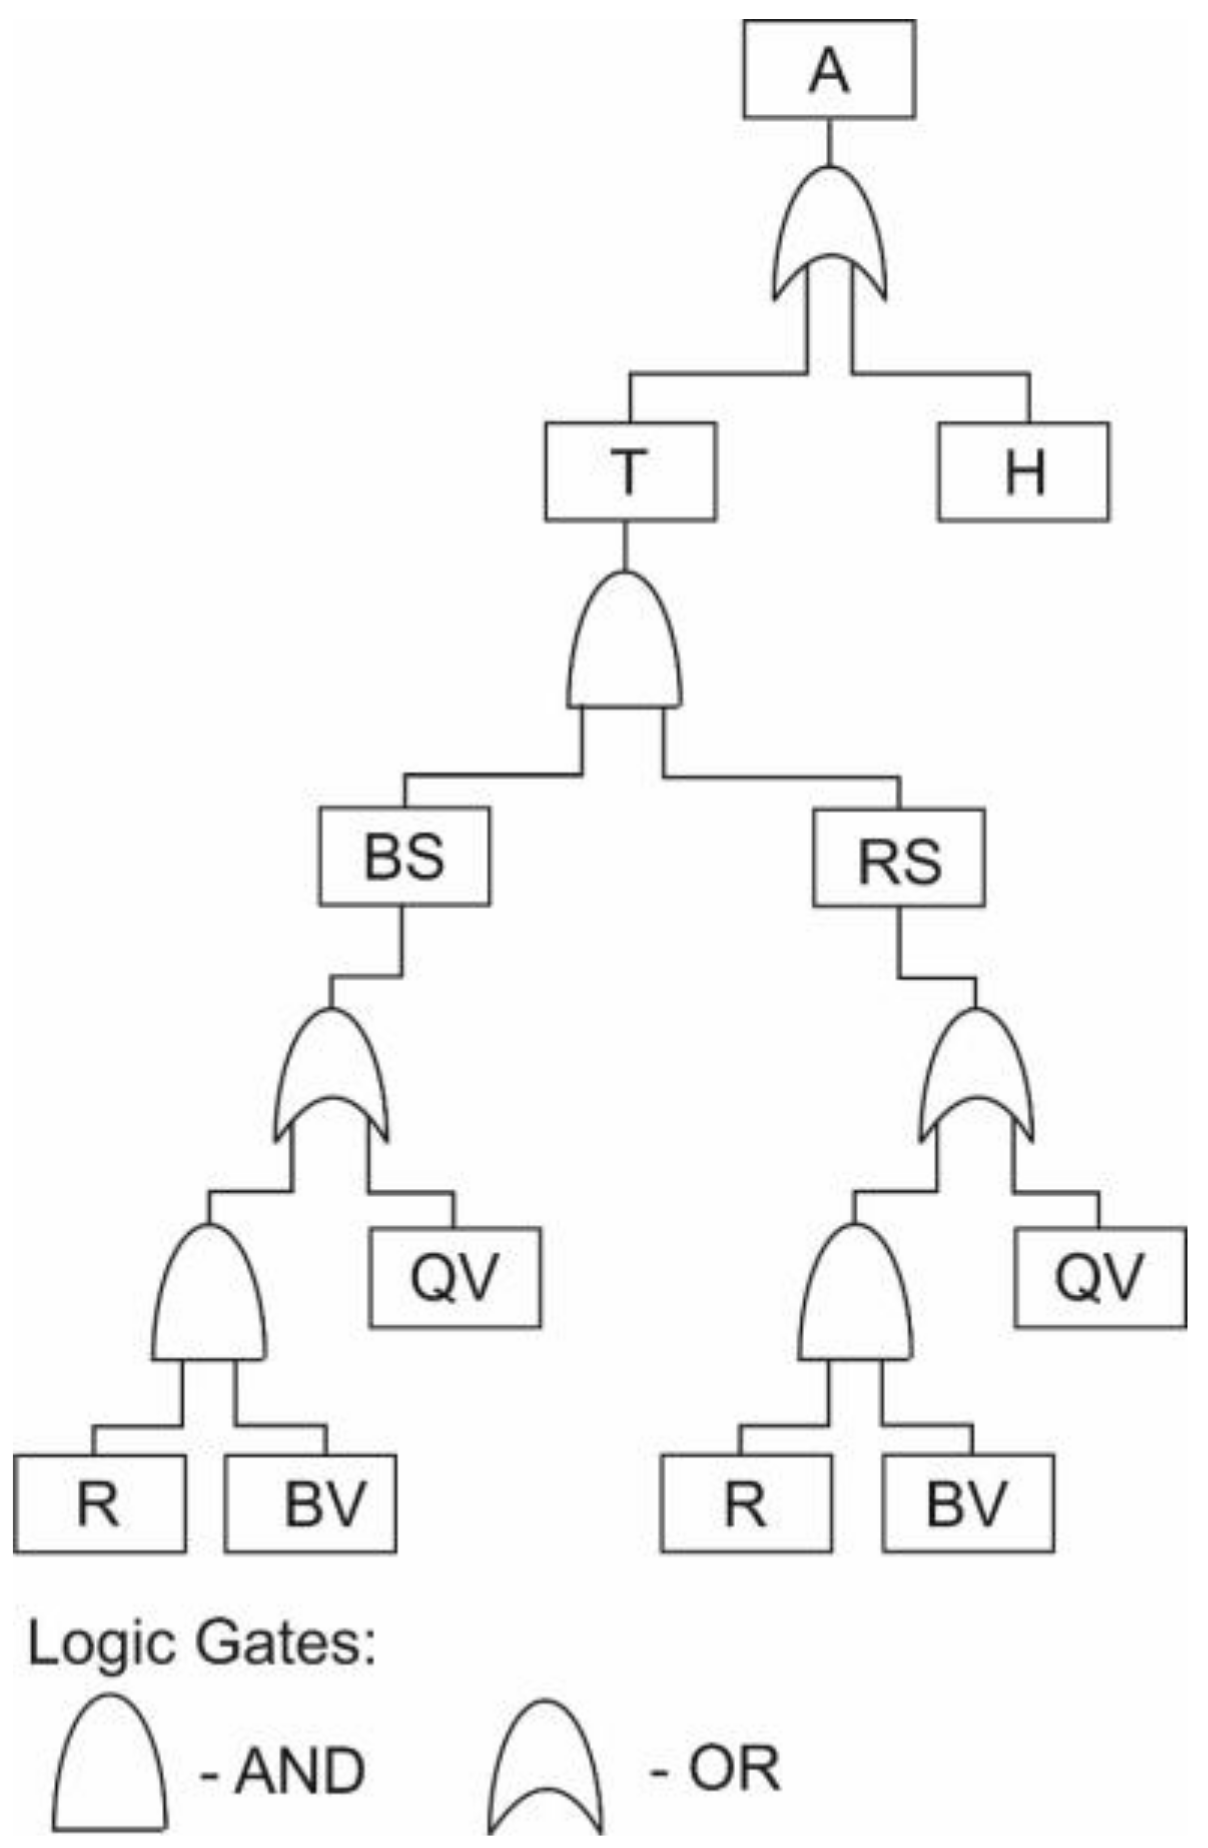
- The technology fails or there is human failure, gate OR:where U(T) is the unreliability of the technology and U(H) is human unreliability.U = U(T) + U(H)
- Failure of the basic and reserve sequences, gate AND:where U(BS) is the failure of the basic sequence, and U(RS) is the unreliability of the reserve sequence.U(T) = U(BS) · U(RS)
- Failure of a reducer and blow-off valve or a quick-closing valve:where U(R) is a failure of the reducer (no reduction), U(BV) is a failure of the blow-off valve (no blow out of excess gas or too little capacity), and U(QV) is a failure of the quick-closing valve (unfounded closure).U(BS) = U(RS) = U(R) · U(BV) + U(QV)
4. Analysis of the Risk that a Supply of Natural Gas will be Lacking
5. Application Example
6. Conclusions
Author Contributions
Funding
Conflicts of Interest
References
- Majid, Z.A.; Mohsin, R.; Yusof, M.Z. Experimental and computational failure analysis of natural gas pipe. Eng. Fail. Anal. 2012, 19, 32–42. [Google Scholar] [CrossRef]
- Mohsin, R.; Majid, Z.A. Erosive failure of natural gas pipes. J. Pipeline Syst. Eng. 2014, 5, 818–837. [Google Scholar] [CrossRef]
- Shalaby, H.M.; Riad, W.T.; Alhazza, A.A.; Behbehani, M.H. Failure analysis of fuel supply pipeline. Eng. Fail. Anal. 2006, 13, 789–796. [Google Scholar] [CrossRef]
- Rak, J.R. Methods of Reliability Index Determination Concerning Municipal Water Quality. J. Konbin 2008, 5, 157–173. [Google Scholar] [CrossRef]
- Rak, J.; Tchórzewska-Cieślak, B. The Possible Use of the FMEA Method to Ensure Health Safety of Municipal Water. J. Konbin 2010, 3, 143–154. [Google Scholar] [CrossRef]
- Rak, J.R. Some aspects of risk management in waterworks. Ochr. Srod. 2007, 29, 61–64. [Google Scholar]
- Dröge, M.T.; Kenter, R. European Gas pipeline Incident Data Group (EGIG). In 9th Reports of the European Gas Pipeline Incident Data Group (Period 1970–2013); Doc. No EGIG 14.R.0403; European Gas pipeline Incident Data Group (EGIG): Amsterdam, The Netherlands, 2015; Available online: https://www.egig.eu/startpagina/$61/$156 (accessed on 12 July 2017).
- Fernandes, M.P.; Viegas, J.L.; Vieira, S.M. Segmentation of Residential Gas Consumers Using Clustering Analysis. Energies 2017, 10, 2047. [Google Scholar] [CrossRef]
- Muhlbauer, K.W. Pipeline Risk Management; Gulf Publishing Company: London, UK, 1992. [Google Scholar]
- Potocnik, P.; Govekar, E.; Grabec, I. Short-term natural gas consumption forecasting. In Proceedings of the 16th Iasted International Conference on Applied Simulation and Modelling, Palma de Mallorca, Spain, 29–31 August 2007; DeFelice, F., Ed.; pp. 353–357. [Google Scholar]
- Brown, N.; Crate, J.M. Analysis of a failure in a polyethylene gas pipe caused by squeeze off resulting in an explosion. J. Fail. Anal. Prev. 2012, 12, 30–36. [Google Scholar] [CrossRef]
- Fu, X.; Zhang, X. Failure probability estimation of gas supply using the central moment method in an integrated energy system. Appl. Energy 2018, 219, 1–10. [Google Scholar] [CrossRef]
- Lu, W.; Su, M.; Fath, B.D. A systematic method of evaluation of the Chinese natural gas supply security. Appl. Energy 2016, 165, 858–867. [Google Scholar] [CrossRef]
- Majid, Z.A.; Mohsin, R.; Yaacob, Z.; Hassan, Z. Failure analysis of natural gas pipes. Eng. Fail. Anal. 2010, 17, 818–837. [Google Scholar] [CrossRef]
- Martini, A.; Troncossi, M.; Rivola, A. Automatic Leak Detection in Buried Plastic Pipes of Water Supply Networks by Means of Vibration Measurements. Shock Vib. 2015, 2015, 16530. [Google Scholar] [CrossRef]
- Ondrejka Harbulakova, V.; Estokova, A.; Stevulova, N.; Luptakova, A. Different aggressive media influence related to selected characteristics of concrete composites investigation. Int. J. Energy Environ. Eng. 2014, 5, 1–6. [Google Scholar] [CrossRef]
- Zimoch, I. Computer simulation as a tool assisting in the operation of a water supply system. Ochr. Sr. 2008, 30, 31–35. [Google Scholar]
- Zimoch, I. Pressure control as part of risk management for a water-pipe network in service. Ochr. Sr. 2012, 34, 57–62. [Google Scholar]
- Kolowrocki, K.; Soszynska-Budny, J. Modeling Complex Technical Systems Operation Processes. Reliab. Saf. Complex Tech. Syst. Process. Model. Identif. Predict. Optim. 2011, 53–78. [Google Scholar] [CrossRef]
- Królikowska, J. Application of PHA method for assessing risk of failure on the example of sewage system in the city of Krakow. Ann. Set Environ. Prot. 2011, 13, 693–710. [Google Scholar]
- Flouri, M.; Karakosta, C.; Kladouchou, C. How does a natural gas supply interruption affect the EU gas security? A Monte Carlo simulation. Renew. Sustain. Energy Rev. 2015, 44, 785–796. [Google Scholar] [CrossRef]
- Geng, J.B.; Ji, Q.; Fan, Y. A dynamic analysis on global natural gas trade network. Appl. Energy 2014, 132, 23–33. [Google Scholar] [CrossRef]
- Hao, Y.-M.; Zhang, C.-S.; Shao, H.; Wang, M.-T. Bayes network quantitative risk analysis for failure of natural gas pipelines. J. Northeast. Univ. 2011, 32, 321–325. [Google Scholar]
- Abada, I.; Massol, O. Security of supply and retail competition in the European gas market. Some model based insights. Energy Policy 2011, 39, 4077–4088. [Google Scholar] [CrossRef]
- Costantini, V.; Gracceva, F.; Markandya, A. Security of energy supply: Comparing scenarios from a European perspective. Energy Policy 2007, 35, 210–226. [Google Scholar] [CrossRef]
- Directive 2009/73/EC of the European Parliament and of the Council of 13 July 2009 Concerning Common Rules for the Internal Market in Natural Gas and Repealing Directive 2003/55/EC. Available online: https://eur-lex.europa.eu/legal-content/EN/ALL/?uri=CELEX%3A32009L0073 (accessed on 12 March 2018).
- International Association of Oil & Gas Producers (OGP). Operating Management System Framework for Controlling Risk and Delivering High Performance in the Oil and Gas Industry; International Association of Oil & Gas Producers (OGP): London, UK, 2014. [Google Scholar]
- Tchórzewska-Cieślak, B.; Pietrucha-Urbanik, K.; Urbanik, M. Analysis of the gas network failure prediction using the Monte Carlo simulation method. Eksploat. Niezawodn. 2016, 18, 254–259. [Google Scholar] [CrossRef]
- Urbanik, M.; Tchórzewska-Cieślak, B. Ecological aspects of the natural gas use. JCEEA 2015, 62, 409–417. [Google Scholar] [CrossRef]
- Biresselioglu, M.E.; Yelkenci, T.; Oz, I.O. Investigating the natural gas supply security: A new perspective. Energy 2015, 80, 168–176. [Google Scholar] [CrossRef]
- Tchórzewska-Cieślak, B.; Pietrucha-Urbanik, K.; Urbanik, M.; Rak, J.R. Approaches for Safety Analysis of Gas-Pipeline Functionality in Terms of Failure Occurrence: A Case Study. Energies 2018, 11, 1589. [Google Scholar] [CrossRef]
- Lee, H.-C.; Lee, E.B.; Alleman, D. Schedule Modeling to Estimate Typical Construction Durations and Areas of Risk for 1000 MW Ultra-Critical Coal-Fired Power Plants. Energies 2018, 11, 2850. [Google Scholar] [CrossRef]
- Zelenakova, M.; Harbul’akova, V.O.; Olejnik, A. Using of Multicriteria Method for Choosing the Best Alternative of the Heating Power Plant. Sel. Sci. Pap. J. Civ. Eng. 2017, 12, 47–56. [Google Scholar]
- Ondrejka Harbulakova, V.; Zelenakova, M.; Purcz, P.; Olejnik, A. Selection of the Best Alternative of Heating System by Environmental Impact Assessment—Case Study. Environments 2018, 5, 19. [Google Scholar] [CrossRef]
- Wang, L.; Watanabe, T.; Xu, Z. Monetization of External Costs Using Lifecycle Analysis—A Comparative Case Study of Coal-Fired and Biomass Power Plants in Northeast China. Energies 2015, 8, 1440–1467. [Google Scholar] [CrossRef]
- Tchórzewska-Cieślak, B. Reliability of Selected Elements of the Natural Gas Supply Subsystem. Ph.D. Dissertation, Krakow University of Technology, Krakow, Poland, 2002. [Google Scholar]
- Iwanejko, R.; Bajer, J. Determination of the optimum number of repair units for water distribution systems. Arch. Civ. Eng. 2009, 55, 87–101. [Google Scholar]
- Xiangpeng, L.; Shunli, L.; Jianfeng, S.; Xiang, L.; Jinyang, Z. Numerical simulation of strength failure of buried polyethylene pipe under foundation settlement. Eng. Fail. Anal. 2015, 48, 144–152. [Google Scholar] [CrossRef]
- Rak, J. Safety of Water Supply System; Polish Academy of Science: Warsaw, Poland, 2009. [Google Scholar]
- Wieczysty, A. Reliability of Water and Wastewater Systems I and II; Publishing House of Krakow University of Technology: Kraków, Poland, 1990. [Google Scholar]
- Wieczysty, A.; Iwanejko, R.; Lubowiecka, T. Increasing the Reliability of Municipal Water Supply Systems; Monographs of the Environmental Engineering Committee of the Polish Academy of Sciences: Krakow, Poland, 2001. [Google Scholar]
- Piegdon, I.; Tchórzewska-Cieślak, B.; Eid, M. Managing the risk of failure of the water supply network using the mass service system. Eksploat. Niezawodn. 2018, 2, 284–291. [Google Scholar] [CrossRef]
- Pluvinage, G.; Capelle, J.; Schmitt, C.; Mouwakeh, M. Domain failure assessment diagrams for defect assessment of gas pipes. In Proceedings of the 19th European Conference on Fracture: Fracture Mechanics for Durability, Reliability and Safety, Kazan, Russia, 26–31 August 2012. [Google Scholar]
- Mohsin, R.; Majid, Z.A.; Yusof, M.Z. Multiple failures of API 5L X42 natural gas pipe: Experimental and computational analysis. Eng. Fail. Anal. 2013, 34, 10–23. [Google Scholar] [CrossRef]
- Kowalski, D.; Kowalska, B.; Kwietniewski, M. Monitoring of water distribution system effectiveness using fractal geometry. Bull. Pol. Acad. Sci. 2015, 63, 155–161. [Google Scholar] [CrossRef]
- Tchórzewska-Cieślak, B.; Boryczko, K.; Eid, M. Failure scenarios in water supply system by means of fault tree analysis. In Advances in Safety, Reliability and Risk Management; Taylor & Francis Group: Abingdon, UK, 2012; pp. 2492–2499. [Google Scholar]
- Li, J.; Yan, M.; Yu, J. Evaluation on gas supply reliability of urban gas pipeline network. Maint. Reliab. 2018, 20, 471–477. [Google Scholar] [CrossRef]


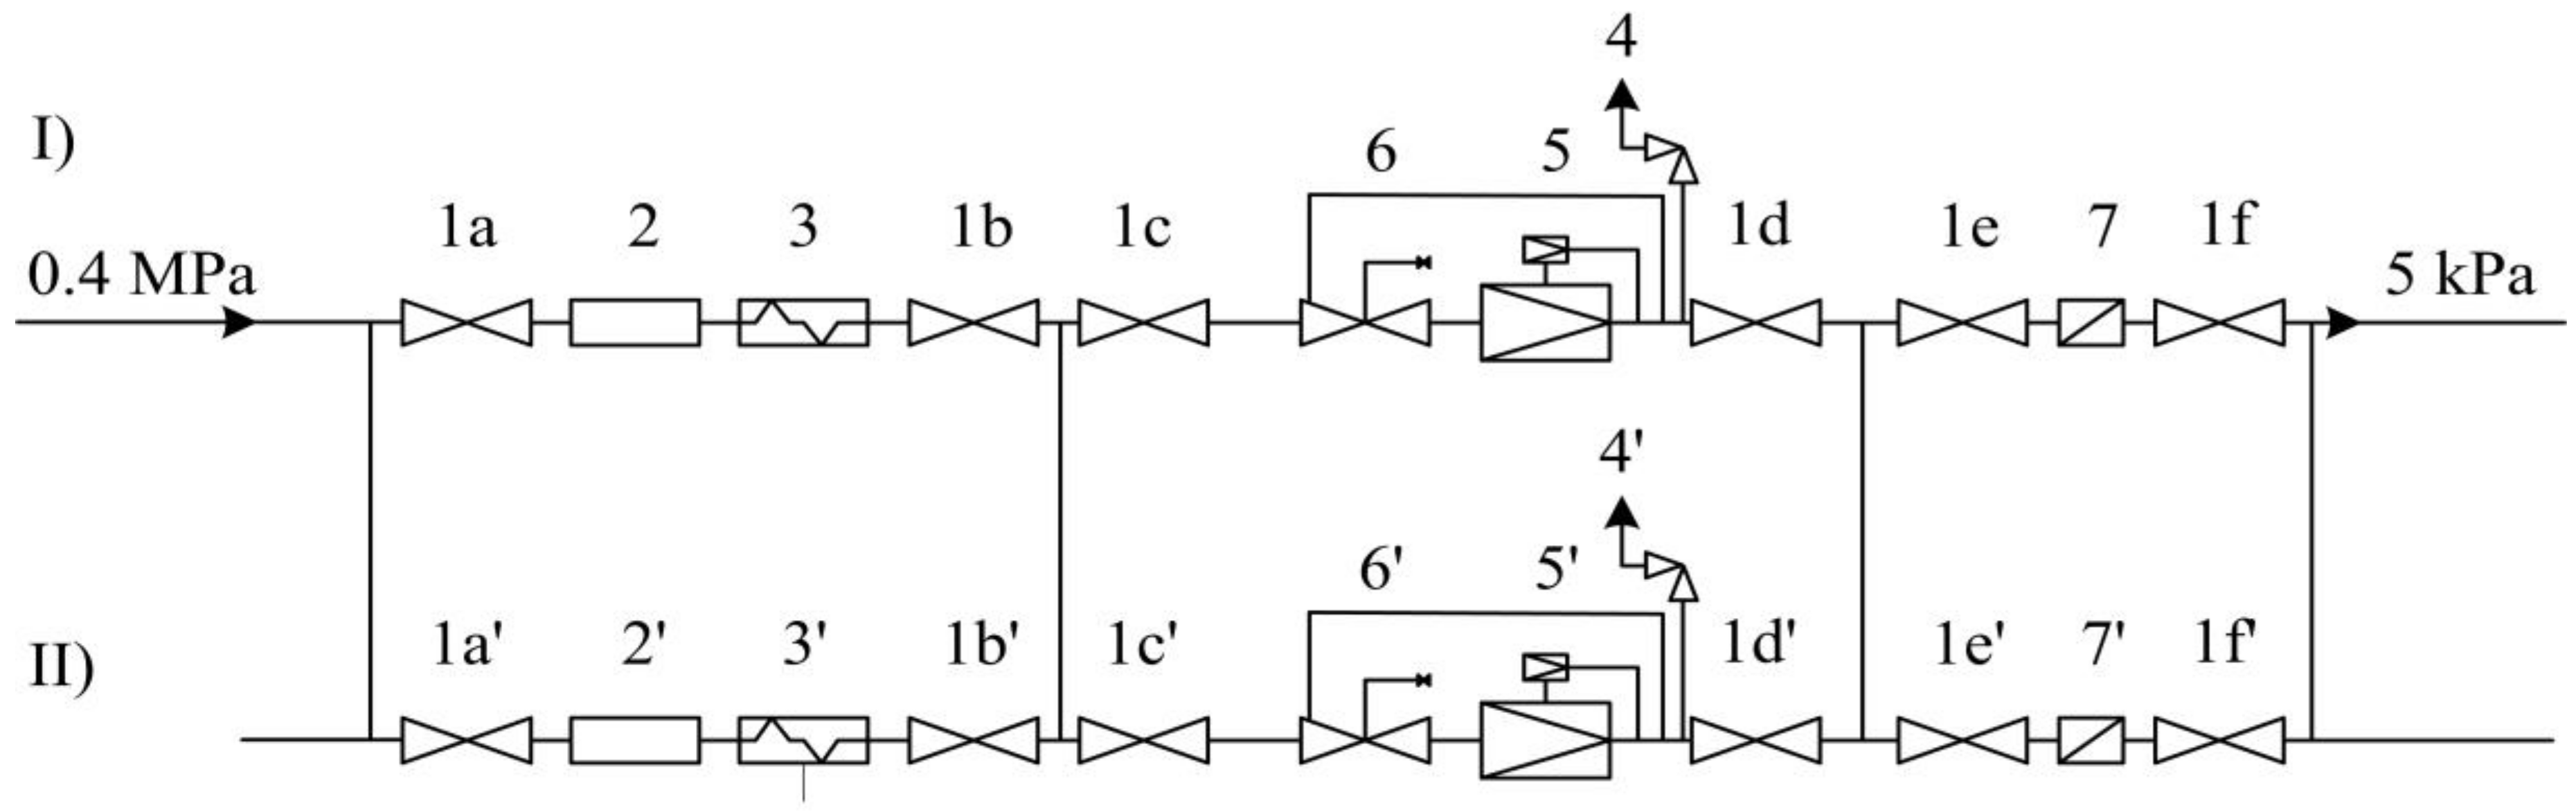
| Station Type 1st Degree | Capacity Q, m3/h | Inlet Pressure/Outlet Pressure, MPa |
|---|---|---|
| I | 25,000 | 6.4/0.4 |
| II | 15,000 | 6.4/0.4 |
| III | 3000 | 5.5/0.4 |
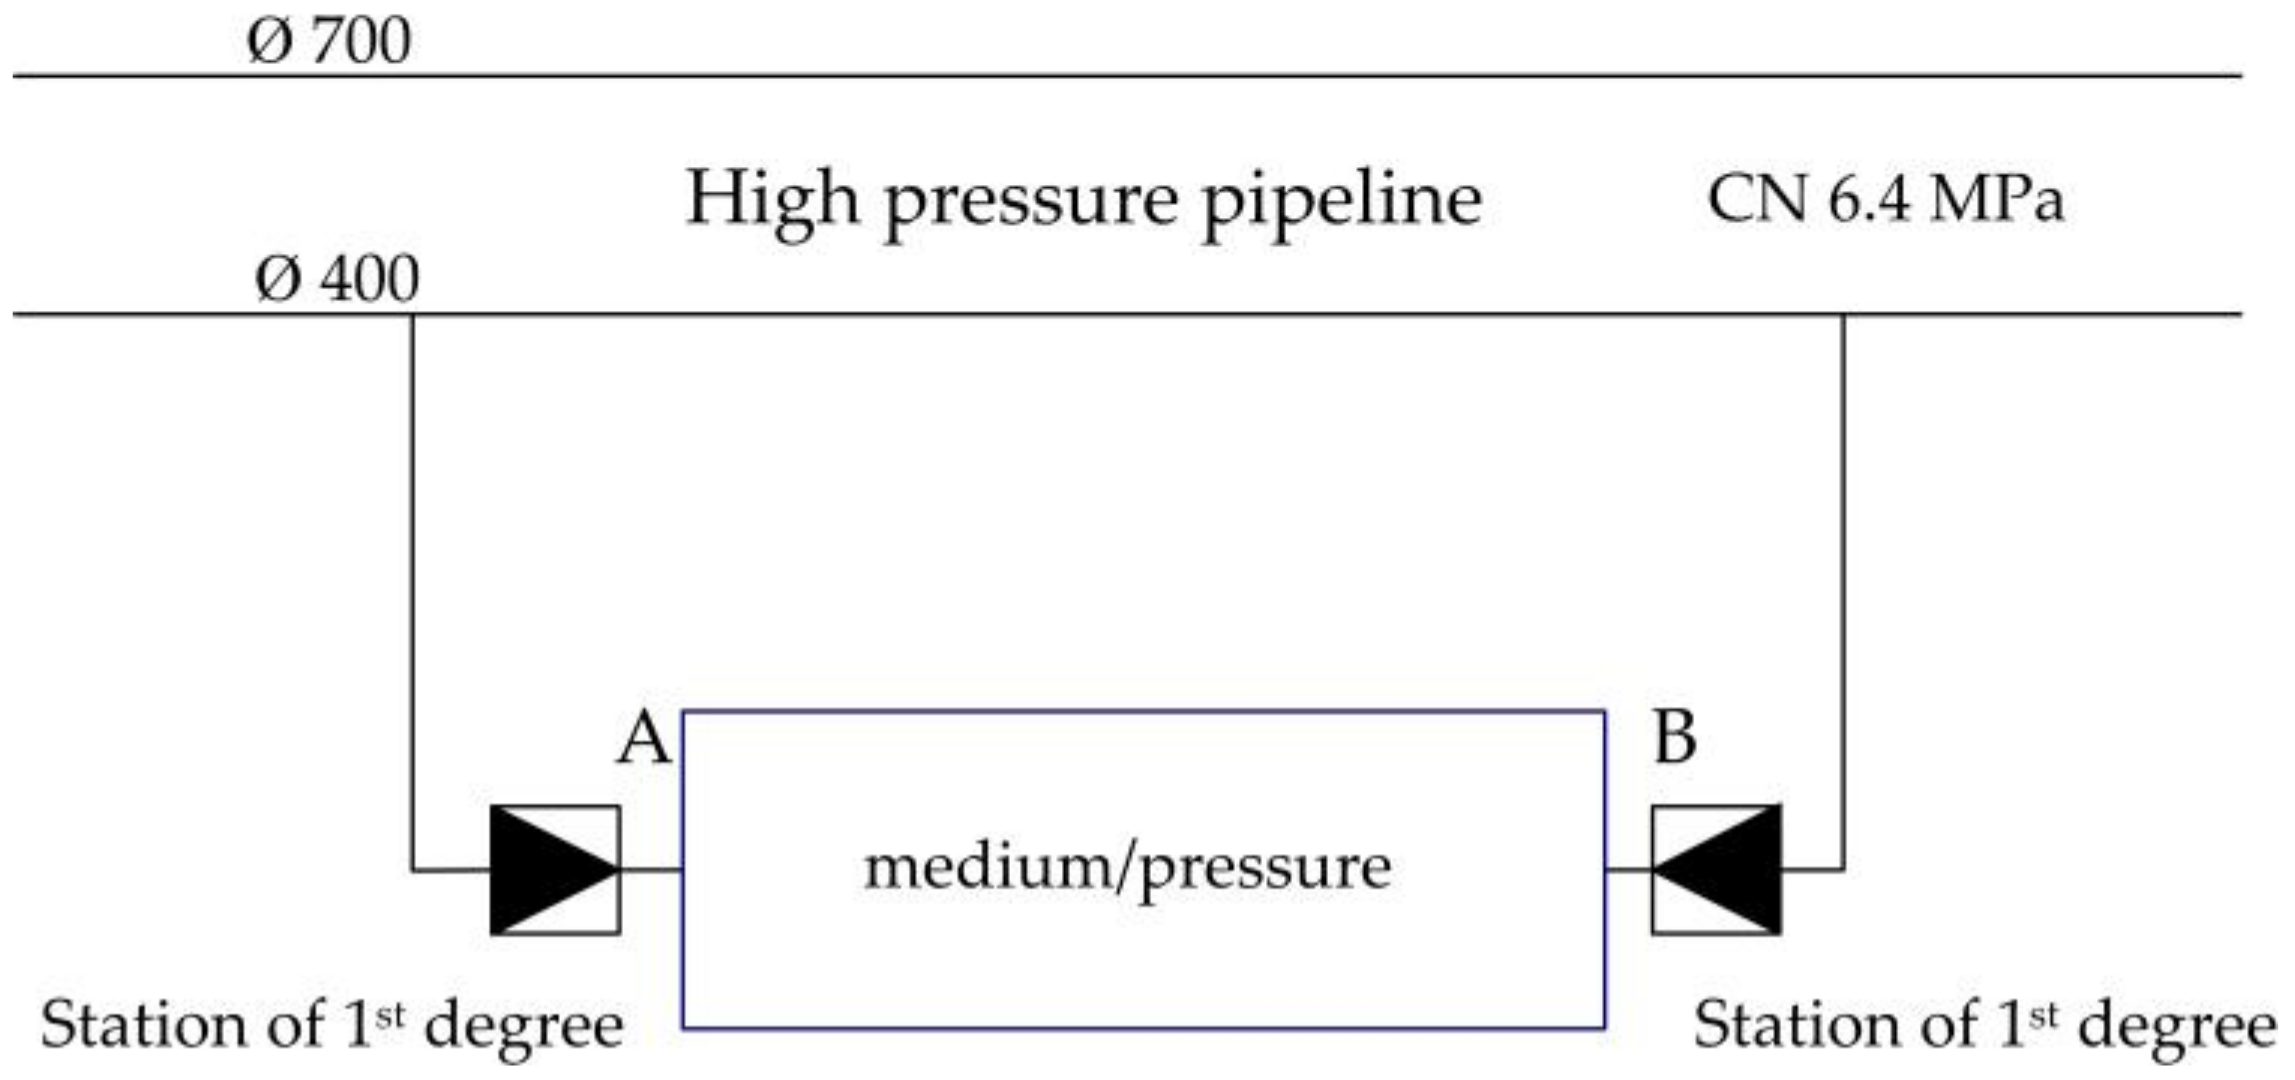
| i | Station of 1st Degree A | Station of 1st Degree B | Pi | Reliability State |
|---|---|---|---|---|
| 1 | 1 | 1 | K1 · K2 | work |
| 2 | 0 | 1 | (1 − K1) · K2 | work |
| 3 | 1 | 0 | K1 · (1 − K2) | work |
| 4 | 0 | 0 | (1 − K1) · (1 − K2) | failure |
| i | Station of 1st Degree A | Station of 1st Degree B | ki | Pi | ∑Qik | ΔQi | ΔQi ·Pi |
|---|---|---|---|---|---|---|---|
| 1 | 1 | 1 | 0 | 0.9974 | 1.6 Qn | 0 | 0 |
| 2 | 0 | 1 | 1 | 0.00009975 | 0.9 Qn | 0.1 Qn | 0.000009975 Qn |
| 3 | 1 | 0 | 1 | 0.002499 | 0.7 Qn | 0.3 Qn | 0.0007499 Qn |
| 4 | 0 | 0 | 2 | 0.00000025 | 0 | 1.0 Qn | 0.00000025 Qn |
| ∑ | 1 | - | - | 0.00076 Qn | |||
© 2018 by the authors. Licensee MDPI, Basel, Switzerland. This article is an open access article distributed under the terms and conditions of the Creative Commons Attribution (CC BY) license (http://creativecommons.org/licenses/by/4.0/).
Share and Cite
Tchórzewska-Cieślak, B.; Pietrucha-Urbanik, K. Approaches to Methods of Risk Analysis and Assessment Regarding the Gas Supply to a City. Energies 2018, 11, 3304. https://doi.org/10.3390/en11123304
Tchórzewska-Cieślak B, Pietrucha-Urbanik K. Approaches to Methods of Risk Analysis and Assessment Regarding the Gas Supply to a City. Energies. 2018; 11(12):3304. https://doi.org/10.3390/en11123304
Chicago/Turabian StyleTchórzewska-Cieślak, Barbara, and Katarzyna Pietrucha-Urbanik. 2018. "Approaches to Methods of Risk Analysis and Assessment Regarding the Gas Supply to a City" Energies 11, no. 12: 3304. https://doi.org/10.3390/en11123304
APA StyleTchórzewska-Cieślak, B., & Pietrucha-Urbanik, K. (2018). Approaches to Methods of Risk Analysis and Assessment Regarding the Gas Supply to a City. Energies, 11(12), 3304. https://doi.org/10.3390/en11123304