Article

Evaluating Harmonic Distortions on Grid Voltages Due to Multiple Nonlinear Loads Using Artificial Neural Networks

Electrical Engineering Faculty, Institute of Technology, Federal University of Pará, Belém PA 66075-110, Brazil
*
Author to whom correspondence should be addressed.
Energies 2018, 11(12), 3303; https://doi.org/10.3390/en11123303
Submission received: 12 October 2018 / Revised: 16 November 2018 / Accepted: 21 November 2018 / Published: 26 November 2018
(This article belongs to the Section F: Electrical Engineering)

Abstract

:
This paper presents a procedure to estimate the impacts on voltage harmonic distortion at a point of interest due to multiple nonlinear loads in the electrical network. Despite artificial neural networks (ANN) being a widely used technique for the solution of a large amount and variety of issues in electric power systems, including harmonics modeling, its utilization to establish relationships among the harmonic voltage at a point of interest in the electric grid and the corresponding harmonic currents generated by nonlinear loads was not found in the literature, thus this innovative procedure is considered in this article. A simultaneous measurement campaign must be carried out in all nonlinear loads and at the point of interest for data acquisition to train and test the ANN model. A sensitivity analysis is proposed to establish the percent contribution of load currents on the observed voltage distortion, which constitutes an original definition presented in this paper. Initially, alternative transient program (ATP) simulations are used to calculate harmonic voltages at points of interest in an industrial test system due to nonlinear loads whose harmonic currents are known. The resulting impacts on voltage harmonic distortions obtained by the ATP simulations are taken as reference values to compare with those obtained by using the proposed procedure based on ANN. By comparing ATP results with those obtained by the ANN model, it is observed that the proposed methodology is able to classify correctly the impact degree of nonlinear load currents on voltage harmonic distortions at points of interest, as proposed in this paper.

1. Introduction

The increasing utilization of nonlinear loads in electrical systems is significantly producing harmonic distortions on voltage and currents, which are impacting electrical grid power quality. It is the utility’s concern to continuously monitor its electrical grid, aiming at detecting suspicious loads that may be contributing to the voltage harmonic distortion above specified limits, observed at some specific locations of interest. So, procedures that could identify which customers’ loads are more significant to the increase of voltage harmonic distortion at specific locations in the grid are important to implement a differenced treatment to these customers, aiming at taking remedial actions to mitigate the possible harmonic distortion transgressions.
Currently, a problem of concern that is not completely solved by power quality norms in all countries is to attribute responsibility to customers due to harmonic distortions observed in the electric network. To illustrate the complexity of this analysis, suppose four industrial customers are being supplied by the same feeder, and the grid voltage harmonic distortion is within the specified limits. Considering this scenario, let us suppose a new customer is connected to the same feeder as the four former ones. After the new customer connection, it was observed that the harmonic voltage distortion in the grid has violated recommended limits [1,2,3]. Does this mean the new connected customer is the only one responsible for the transgressions? Certainly, the answer is not trivial. It is necessary to carry out another joint analysis to determine the new impacts of each customer in this new scenario.
Considering multiple customers simultaneously, the one who individually has the highest harmonic current distortion level may not necessarily be the most impacting on the voltage harmonic distortion at the point of interest, because it must be taken into consideration the electrical network harmonic impedance between the customer’s load and the point of interest. Besides, delta windings of transformers connected between the customer’s load and the point of interest will behave as filters for triplen harmonics. That is, a customer’s installation, which is generating a high third harmonic order component, may produce little impact at the point of interest due to the delta winding attenuation at the transformer. So, it is not necessarily a customer’s load that generates the most harmonic current that can be automatically addressed as the culprit. So, the proposed methodology in this paper is to contribute to the analysis of this type of problem; that is, the identification of which customers’ load most impacts the voltage harmonic distortion, using an artificial neural network (ANN) to model the correlation between the load harmonic current and the voltage harmonic distortion at the point of interest.
With respect to the specific question of attributing responsibilities among consumers and utilities, it can be said that there is no consolidated methodologies that are widely accepted to estimate the contribution of harmonic generating loads on the observed harmonic distortions on grid voltages, since this is not a trivial task. This is mainly due to the interaction of multiple loads, which can be canceled or be added, depending on the harmonic profiles of these nonlinear loads and the electrical grid harmonic impedances.
Today, two main approaches can be found in the technical literature to treat this problem. The first one seeks to determine, at the point of common coupling (PCC), the harmonic distortion contribution due to customers and utilities using circuit analysis theorems (Norton, Thévenin, and Superposition Theorems) [4,5,6,7,8,9,10,11,12,13]. In reference [5], for example, the electrical utility grid and the customer’s load installation at the PCC are modeled through a Norton equivalent circuit and the superposition theorem is used to identify the contribution of each side on the voltage harmonic distortion. A difficulty in this method is related to the determination of the customer’s equivalent impedance. To overcome this difficulty, the authors proposed the allocation of shunt passive filters at the PCC with dominant impedance. So, the contribution of each side can be calculated considering the current flowing through the filter. In [8], the authors also proposed a Norton equivalent, however, unlike [5], the customer is represented by an RLC circuit while the electric utility is represented by a current source and its short circuit impedance. The attraction in this method is that the harmonic distortion, both in the customer side as in the utility side, is identified using only measured values of voltage and current at the PCC.
Another approach, held also at PCC, consists in measurement analysis for the inference of harmonic contribution, using cause-and-effect relationships that exist among the variables of interest, and avoiding difficulties with respect to methods based on equivalent circuit models, such as data acquisition needed for construction of these models. Some of these approaches based on measurements can be found in [14,15,16], where in [14], the authors used a fuzzy system for determining the harmonic contribution at PCC. In this paper, the authors claimed to have achieved a good performance for the solution of the problem, except for the third and ninth harmonic orders, which need further work to improve the method. In [15], a clustering procedure was carried out to determine the harmonic contribution, with the consideration of a time varying background being the key differentiator in this work.
Different from the previous approaches that consider the PCC as the point of interest, the second approach to treat this problem, found in references [17,18,19,20,21], developed data-based methodologies to determine the harmonic distortion contribution of multiple individual loads at a specific location in the electrical grid, not necessary the PCC. In [18,19], the impact estimate over the harmonic voltage distortion due to a specific harmonic load current is obtained from a linear regression model, supposing that, during the period of analysis, only one load current is varying while the other harmonic load currents, defined as background harmonic sources, are considered constant. To overcome this limitation, in [21], a non-parametric linear regression model is used in which all load currents can vary simultaneously, but the linear regression model is maintained between two successive data measurements.
With respect to applying artificial neural networks to the problem of identifying the contribution of load currents in the voltage harmonic distortion at a point of interest, few works have been reported [22,23], with the ANN use more targeted to estimate the harmonic distortion content of a specific nonlinear load [22] and identification of harmonic sources, as in [22]. In [24], the authors used the same methodology developed in [21], however, the effectiveness of different types of neural networks, such as the multilayer perceptron network (MLP), recurrent neural network (RNN), and echo state network (ESN) were tested. In this study, it was found that for small size training data, the ESN offers better results than the others.
Differently from [18,19,21], what is intended in this paper is to develop a new analysis methodology, based on the ANN model, which can be applied to extract dominant patterns embedded in voltage and current measurement campaign data with the purpose of classifying the correlation degree existing among simultaneously measured harmonic load currents and voltage in the electric grid. By using the ANN model, it is possible to determine the harmonic impact that each nonlinear load has on the voltage harmonic distortion, using a sensitivity analysis that is carried out after the ANN has been adequately trained with the measurement campaign data. The sensitivity analysis, as proposed in this paper, is the key point for the application of the ANN model for the problem of identifying the more impacting harmonic sources in the voltage harmonic distortion at a point of interest of the electric grid.
A unique feature of the proposed methodology consists in the simultaneous consideration of all the nonlinear loads throughout the entire measurement period, which was not considered in [18], where it was necessary to choose a specific period where only one load can vary at a time to apply the linear regression model in this specific period. This problem was also treated in [21], where it the entire measurement period was considered. However, the analysis was performed for each load individually. This fact will not occur in the proposed methodology, since in addition to considering the entire measurement period all nonlinear loads are also considered simultaneously in the study. Therefore, the neural network takes into account the interactions of all loads during the model construction. Additionally, the use of neural networks obtains a non-parametric model for systems with intrinsic nonlinear characteristics, for which linear regression techniques lose accuracy, which is the case of harmonic analysis in electrical networks.
The structure of this paper is as follows: In Section 2, the mathematical model of the electrical network is formulated, the artificial neural network model is presented, and the proposed methodology to estimate the harmonic contribution of multiple harmonic-producing loads is formulated; in Section 3, this methodology is applied as case studies in an industrial electrical test system; in Section 4, the results are discussed; and, in Section 5, the main conclusions of this work are presented.

2. Materials and Methods

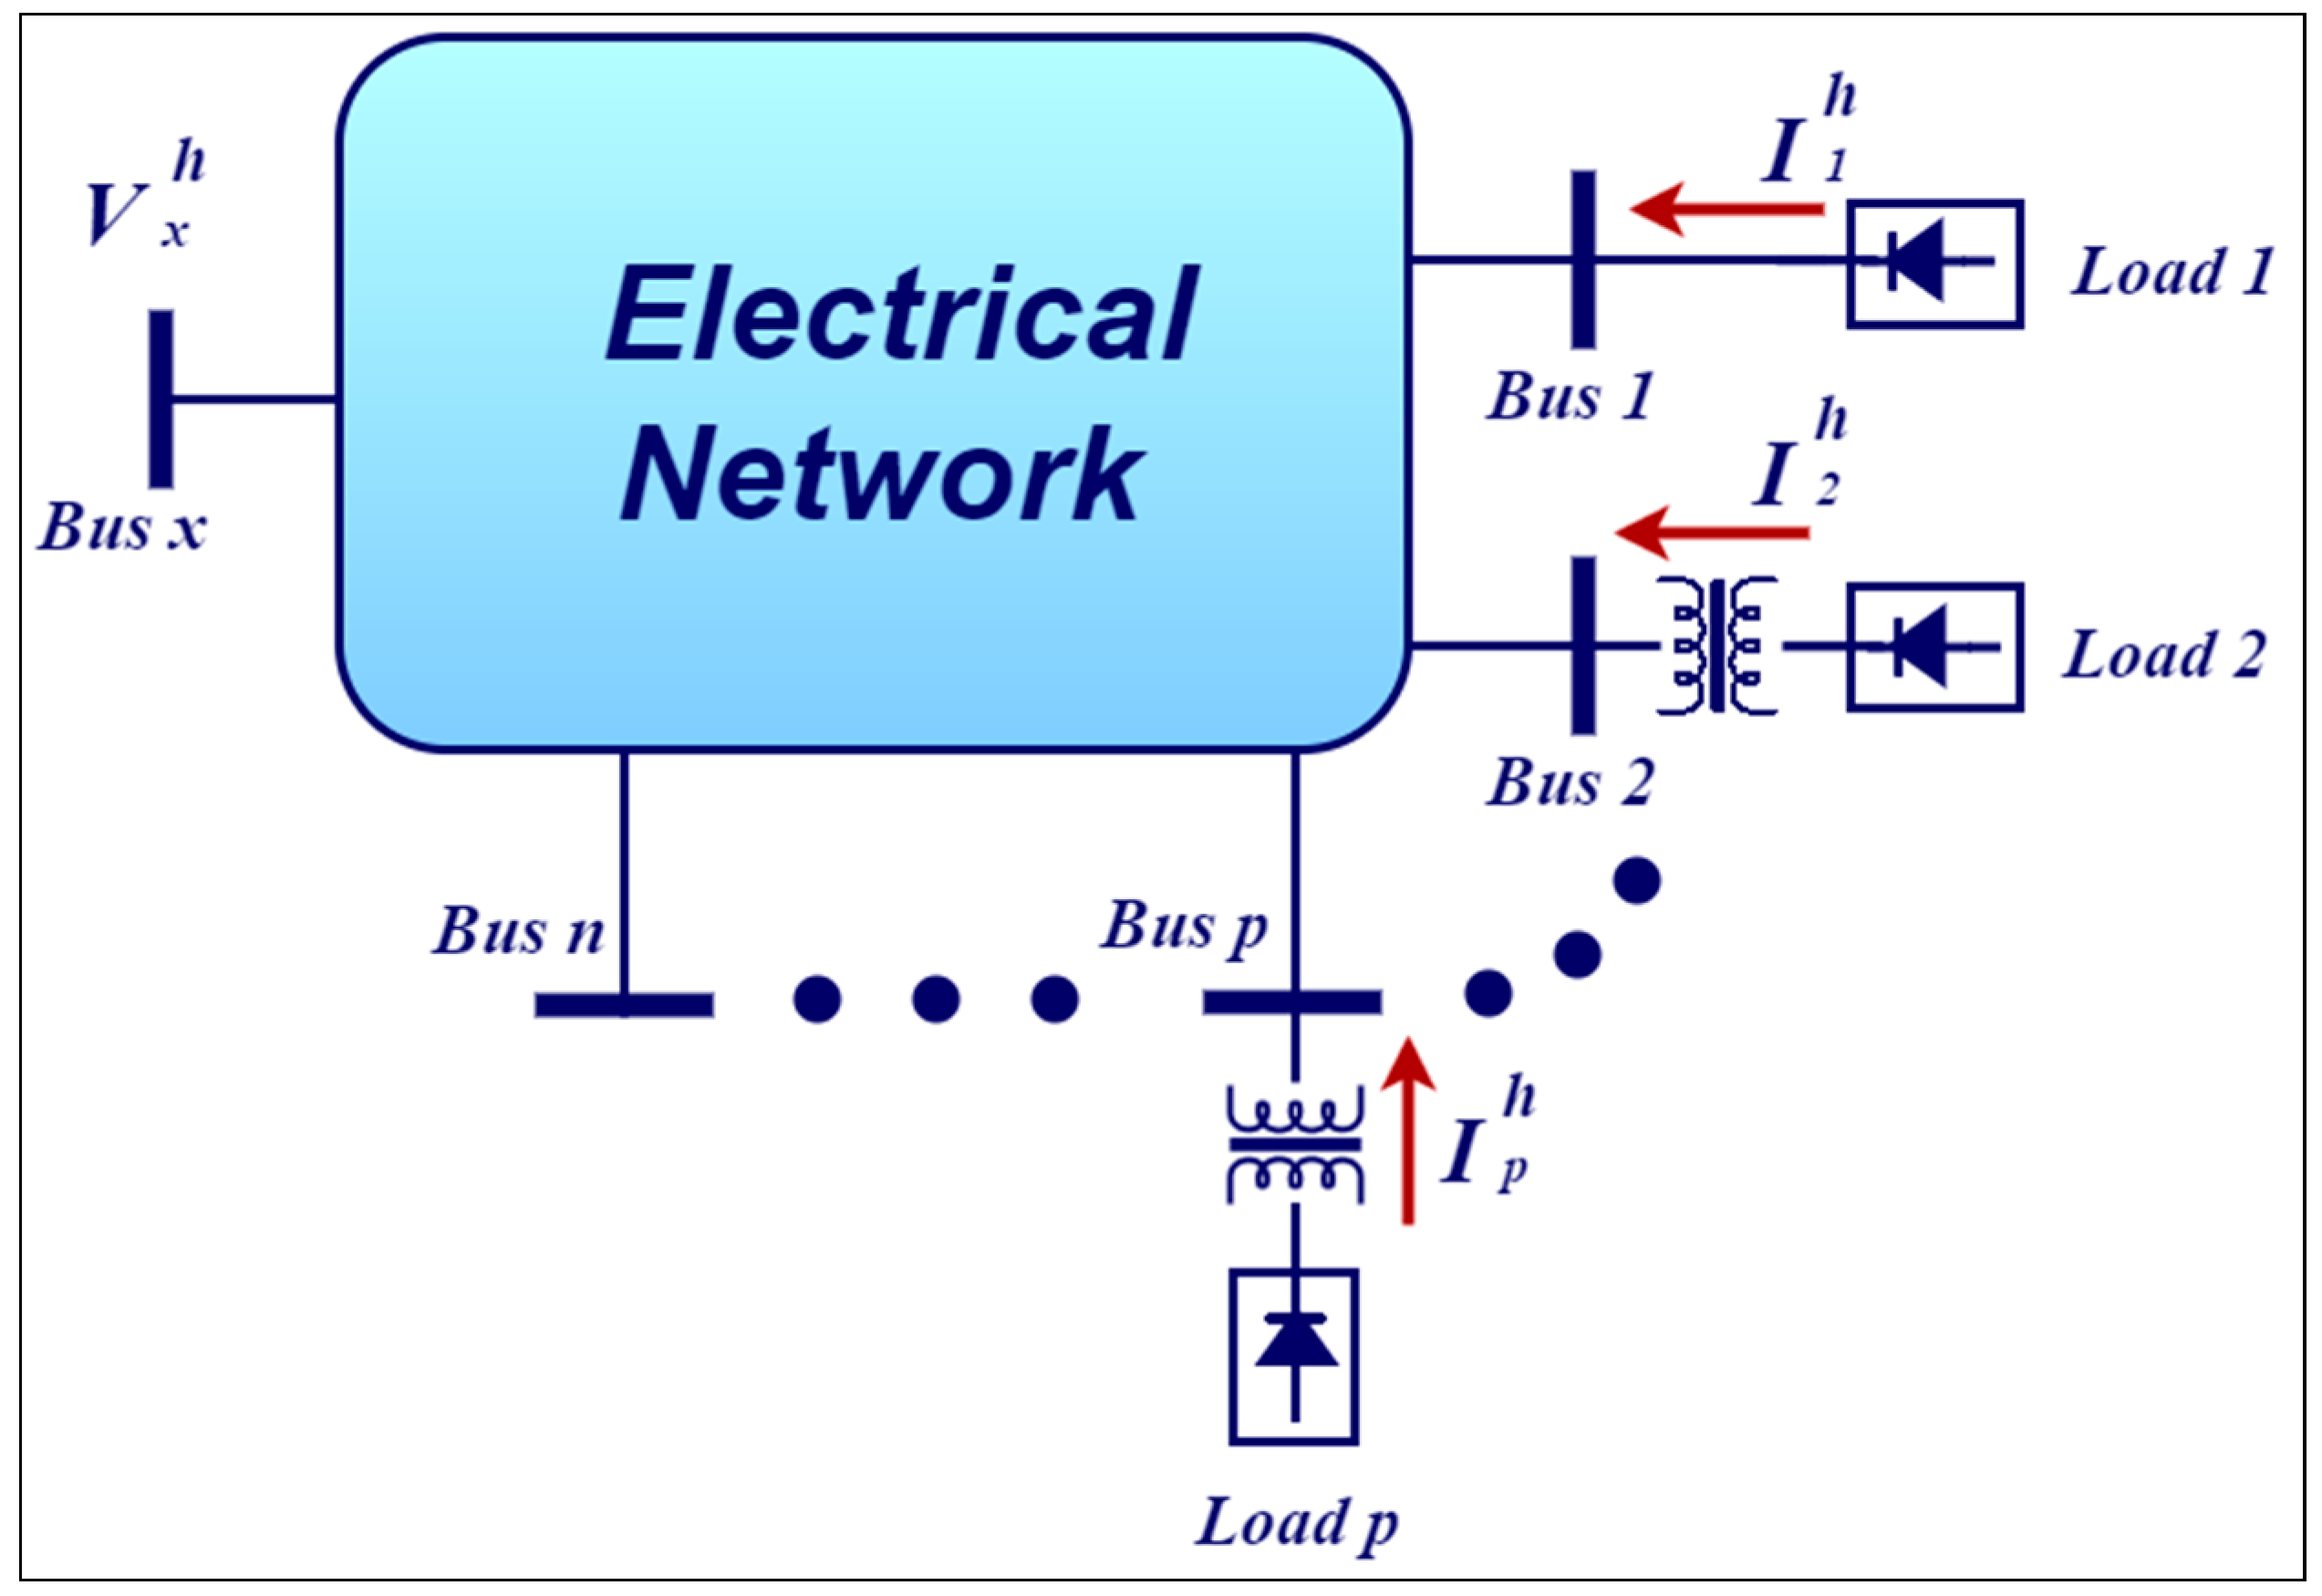
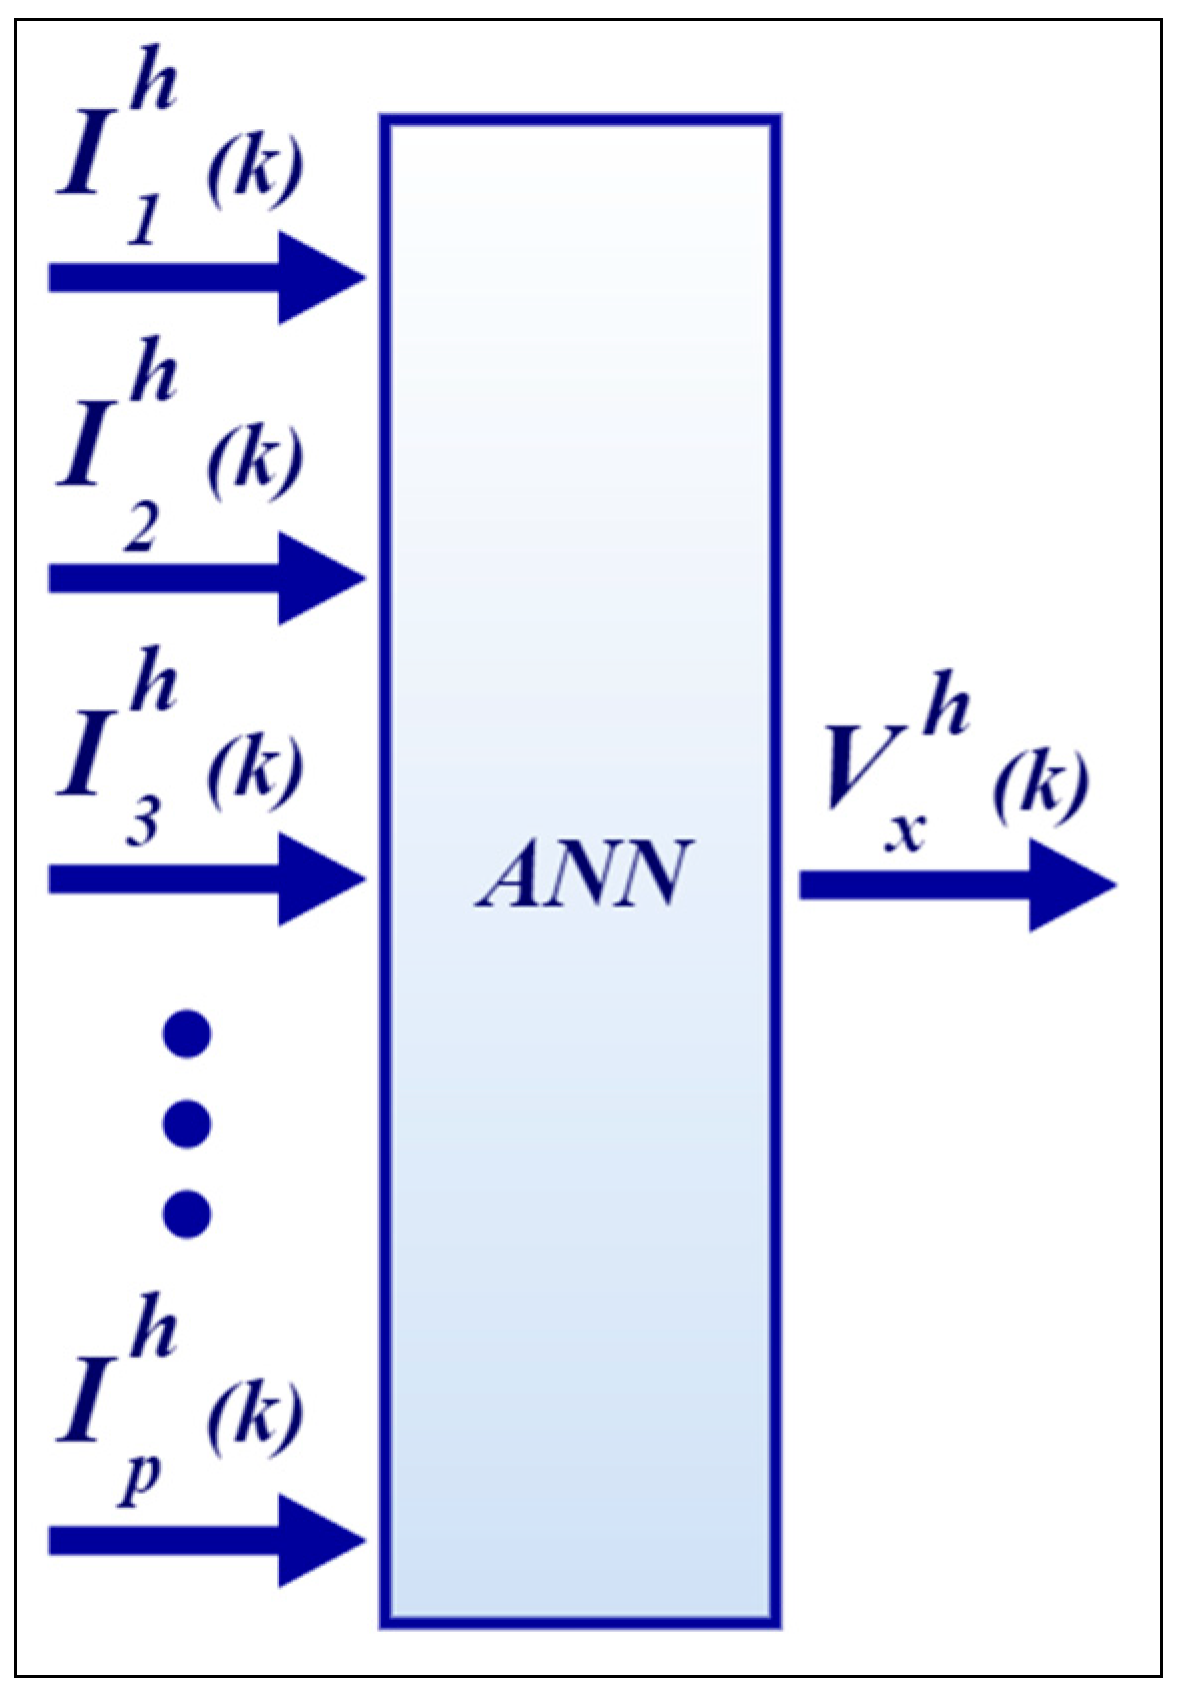
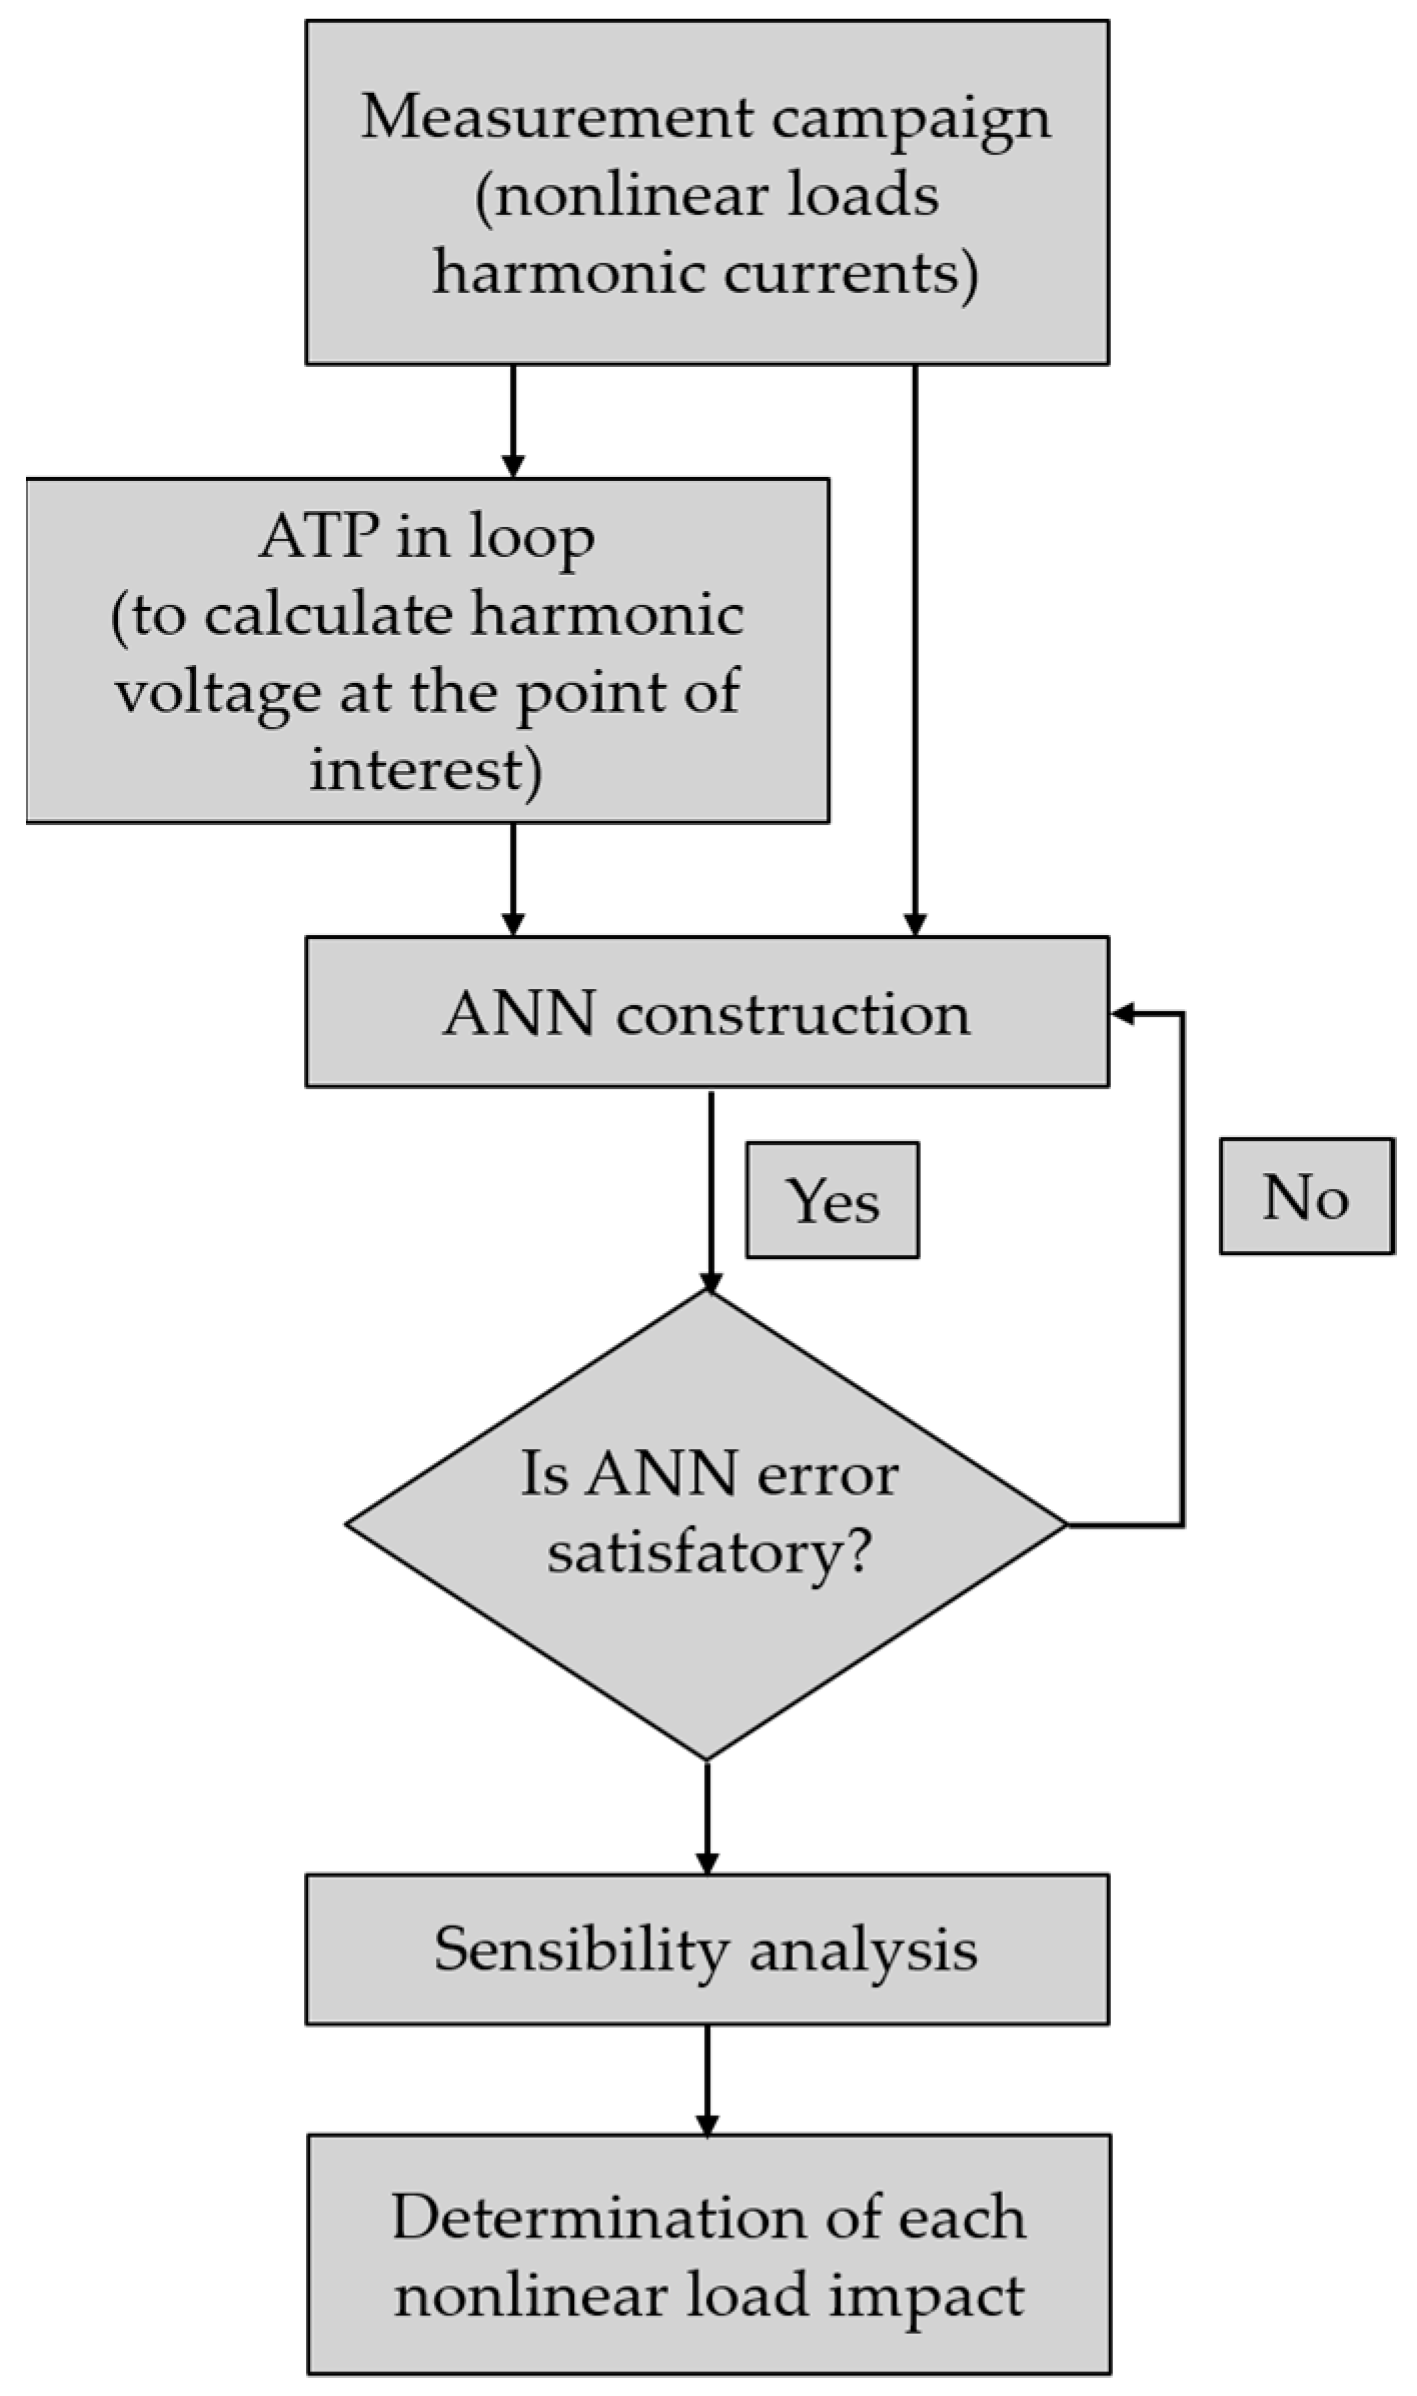
2.1. The Proposed Methodology

Figure 1 illustrates a generic electrical system network, representing, schematically, a distribution or transmission grid, four electrical buses, and p nonlinear loads.
In this formulation bus, x is selected as the interest bus at which it is desired to determine how each nonlinear load is affecting the respective voltage harmonic distortion of order, h. For this purpose, an ANN model is proposed to capture and reproduce the intrinsic characteristics of the electrical system under analysis. More specifically, the identified ANN model will represent relationships among the nonlinear loads’ harmonic currents and the harmonic voltage at the point of interest, as schematically illustrated by Figure 2. These relationships are similar to harmonic transfer impedances among the output harmonic voltage, Vxh, and the input harmonic currents, Ijh, where h denotes the harmonic order of interest [21].
As stated previously, the load currents and the voltage at the bus of interest, as presented in Figure 2, represent time series formed by simultaneous measurements, which are obtained from a measurement campaign, usually carried over a week with data acquisition at each 10 min integration interval, as stated in Brazilian and international standards [1,3]. A 10 min integration interval means that a sample of the measured variables, for example, voltage or current, is stored in the measurement database. As the ANN output reference is well known, the input-output relationship can be adequately modeled by a Multilayer Perceptron ANN, whose learning process is achieved by comparing the ANN output with the reference or desired output in each iteration until the convergence tolerance criteria are met. It is worth mentioning that, for each harmonic frequency of interest, a specific ANN must be trained to accomplish the desired input-output estimation.
In a real electrical system, it is intuitive to understand that it is extremely complex to identify precisely all possible harmonic sources that can be contributing to the harmonic distortions of grid voltages at specific points of interest. So, the configuration presented in Figure 2 must be understood as a set of suspicious harmonic sources that must be analyzed to discover which ones are impacting more with respect to the harmonic distortions on the voltage of interest. So, among all the input nonlinear loads currents, it is intended to determine those that may deserve special attention of the distribution utility.

Characterizing the Individual Loads’ Harmonic Impacts

Consider A as the input matrix containing the time series of measured rms values of harmonic currents of bus j, at each specific harmonic order, h; that is, Ijh, for j = 1, 2, …, p, and h = 1, 2, 3, …, m. Also, consider C as the ANN output vector containing the time series of measured rms values of the harmonic voltage at the bus of interest, Vxh. Both values for Ijh and Vxh represent simultaneous measurements time series for the period, T, of the measurement campaign. For a specific harmonic order, h, A and C can be written according to Equations (1) and (2):
A = [ I 1 h ( 1 ) I 1 h ( 2 ) I 1 h ( T ) I 2 h ( 1 ) I 2 h ( 2 ) I 2 h ( T ) I p h ( 1 ) I p h ( 2 ) I p h ( T ) ]
C = [ V x h ( 1 ) V x h ( 2 ) V x h ( T ) ]
Once the ANN is well trained, it can be used to estimate the output voltage, Vxh, with an acceptable accuracy for any input vector belonging to the test dataset; that is, input current measurement data that were not used in the ANN training, which result in estimated voltages, Vxeh, for measured voltages, Vxh.
To determine which individual nonlinear loads are impacting more on the harmonic voltage distortion, the trained ANN is now submitted to new input vectors, which are modified to include small variations in the harmonic currents with respect to the measured values. The objective is to determine how the ANN output voltage is sensitive to the variation of each load current individually. This way, maintaining the other load currents as unchanged, each harmonic load current time series is varied, at a time, by the same amount, ΔI%, and the corresponding resulting harmonic voltage is estimated by the ANN. In doing so, a sensitivity factor can be defined to express the variability of the harmonic voltage with respect to load currents individually. Mathematically, this procedure can be expressed according to Equations (3)–(5):
I j h n e w ( k ) = ( Δ I + 1 ) I j h ( k )
A j n e w = [ I 1 h ( k ) I 2 h ( k ) I j h n e w ( k ) I p h ( k ) ]
C j n e w = [ V x j h n e w ( k ) ]
where,
  • Ajnew—New input matrix having all current time series unchanged except the one corresponding to Ijhnew;
  • Vxjhnew(k)—New output voltage time series estimated by the ANN with Ajnew as input.
Comparing Vxjhnew(k) with Vxeh(k), it can be determined that the Vxjhnew(k) response presents the biggest variation with respect to the estimated time series, Vxeh(k), and, consequently, the nonlinear load current associated with this response can be classified as the most impacting one among the loads considered in the analysis, with respect to the voltage harmonic distortion at the point of interest.
To measure the relative contribution of each nonlinear load to the harmonic voltage distortion, a percent impacting factor, IFVIjh (%), is proposed, as presented in Equation (7). These impacting factors may be interpreted as relative percent values that are calculated for each current individually, for the set of nonlinear loads considered in the analysis.
To obtain the percent impacting factor, the mean absolute error (MAE) [25] is calculated between the initial estimated voltage time series and the estimated voltage time series when each current is varied at a time, as presented in Equation (6). Other metrics as root mean square error (RMSE), and Euclidian distance (ED), for example, could be used. Using the MAE formulation, it can be written that:
M A E j n e w h = k = 1 T | V x j n e w h ( k ) V x e h ( k ) | T
And:
I F V I j h ( % ) = M A E j n e w h j = 1 p M A E j n e w h × 100
According to the impact factors definition in Equation (7), they sum 100%, as shown in Equation (8):
I F V I 1 h ( % ) + I F V I 2 h ( % ) + + I F V I p h ( % ) = 100 %
Figure 3 presents a simplified flowchart diagram describing the main processing tasks involved in the proposed methodology.

2.2. Validating the Proposed Methodology

The methodology validation consists in the comparison of the results obtained by the ANN model with reference values calculated by a harmonic load flow program. The alternative transient program (ATP) software [26] was used in this work to validate the methodology, with its built-in Harmonic Frequency Scan (HFS) method chosen for the calculation of harmonic load flows for the harmonic frequencies of interest. The ATP software is a widely used simulation environment in the area of electric power systems, which offers well elaborated and validated models to represent the electric network and its components, as well as numeric and analytical built-in tools for the problem’s solutions.
Figure 4 shows the simulation diagram built by ATP Draw for the IEEE 13-bus industrial distribution system used in this work for the methodology validation [27]. In this system, four nonlinear loads were specified, which are located at buses B11, B29, B49, and B51. It is worth noting that the methodology also applies to other types of systems, such as transmission and distribution systems. The nonlinear loads are represented by current harmonic sources, power transformers are represented by models with saturation, and linear loads are represented by impedances.

Database Creation

The database is built from simulation of the time series representing load curves for the nonlinear loads obtaining the respective harmonic voltages. With this procedure, it is intended to simulate in a computer environment (ATP) the measurement campaign that would be performed in the real system by means of synchronized measurements of harmonic currents in each nonlinear load and harmonic voltage at a given bus of interest. As the computing application is a controlled simulation environment, it is possible to calculate accurately the impacts of each nonlinear load on the harmonic voltage distortion at the bus of interest.
The phase angles of currents representing the nonlinear loads were calculated from a load flow study on fundamental frequency. The nonlinear loads’ harmonic currents’ magnitudes were obtained simultaneously by a measurement campaign in a real distribution system in the metropolitan area of Manaus City (AM), Brazil, for a period of a week with 1-min integration intervals, summing up 10,080 samples.
These measurement data were inserted to represent the nonlinear loads in the IEEE 13-bus system with the purpose of reflecting a real harmonic generating profile in the simulation studies to calculate the harmonic voltages of interest. It should be noted that these currents form the array expressed in Equation (1) to be used in ATP simulation to obtain the array C expressed in Equation (2), which emulates the simultaneous harmonic voltages measurements at the point of interest.
A harmonic load flow is run to each of the 10,080. ATP files in the harmonic frequency of interest to obtain the corresponding harmonic voltage magnitudes at the bus of interest. Finally, the harmonic voltages’ magnitudes calculated in successive simulations are extracted from the harmonic load flow results as .LIS files.
It is worth mentioning that this whole process is carried out automatically by means of auxiliary programs developed in java, allowing performance of various ATP simulations in loop, providing a faster way to build the database.

3. Results

For designing the ANN model, the database was divided into a training set, validation set, and test set, with 20% of samples used for testing, and 80% for the ANN training/validation step, which is divided into 80% for training and 20% for validation. Cross-validation was used in the training/validation step to avoid overfitting. During the ANN training step, it the cross-validation method was used, with the Levenberg-Maquardt algorithm chosen for training the MLP type ANN.

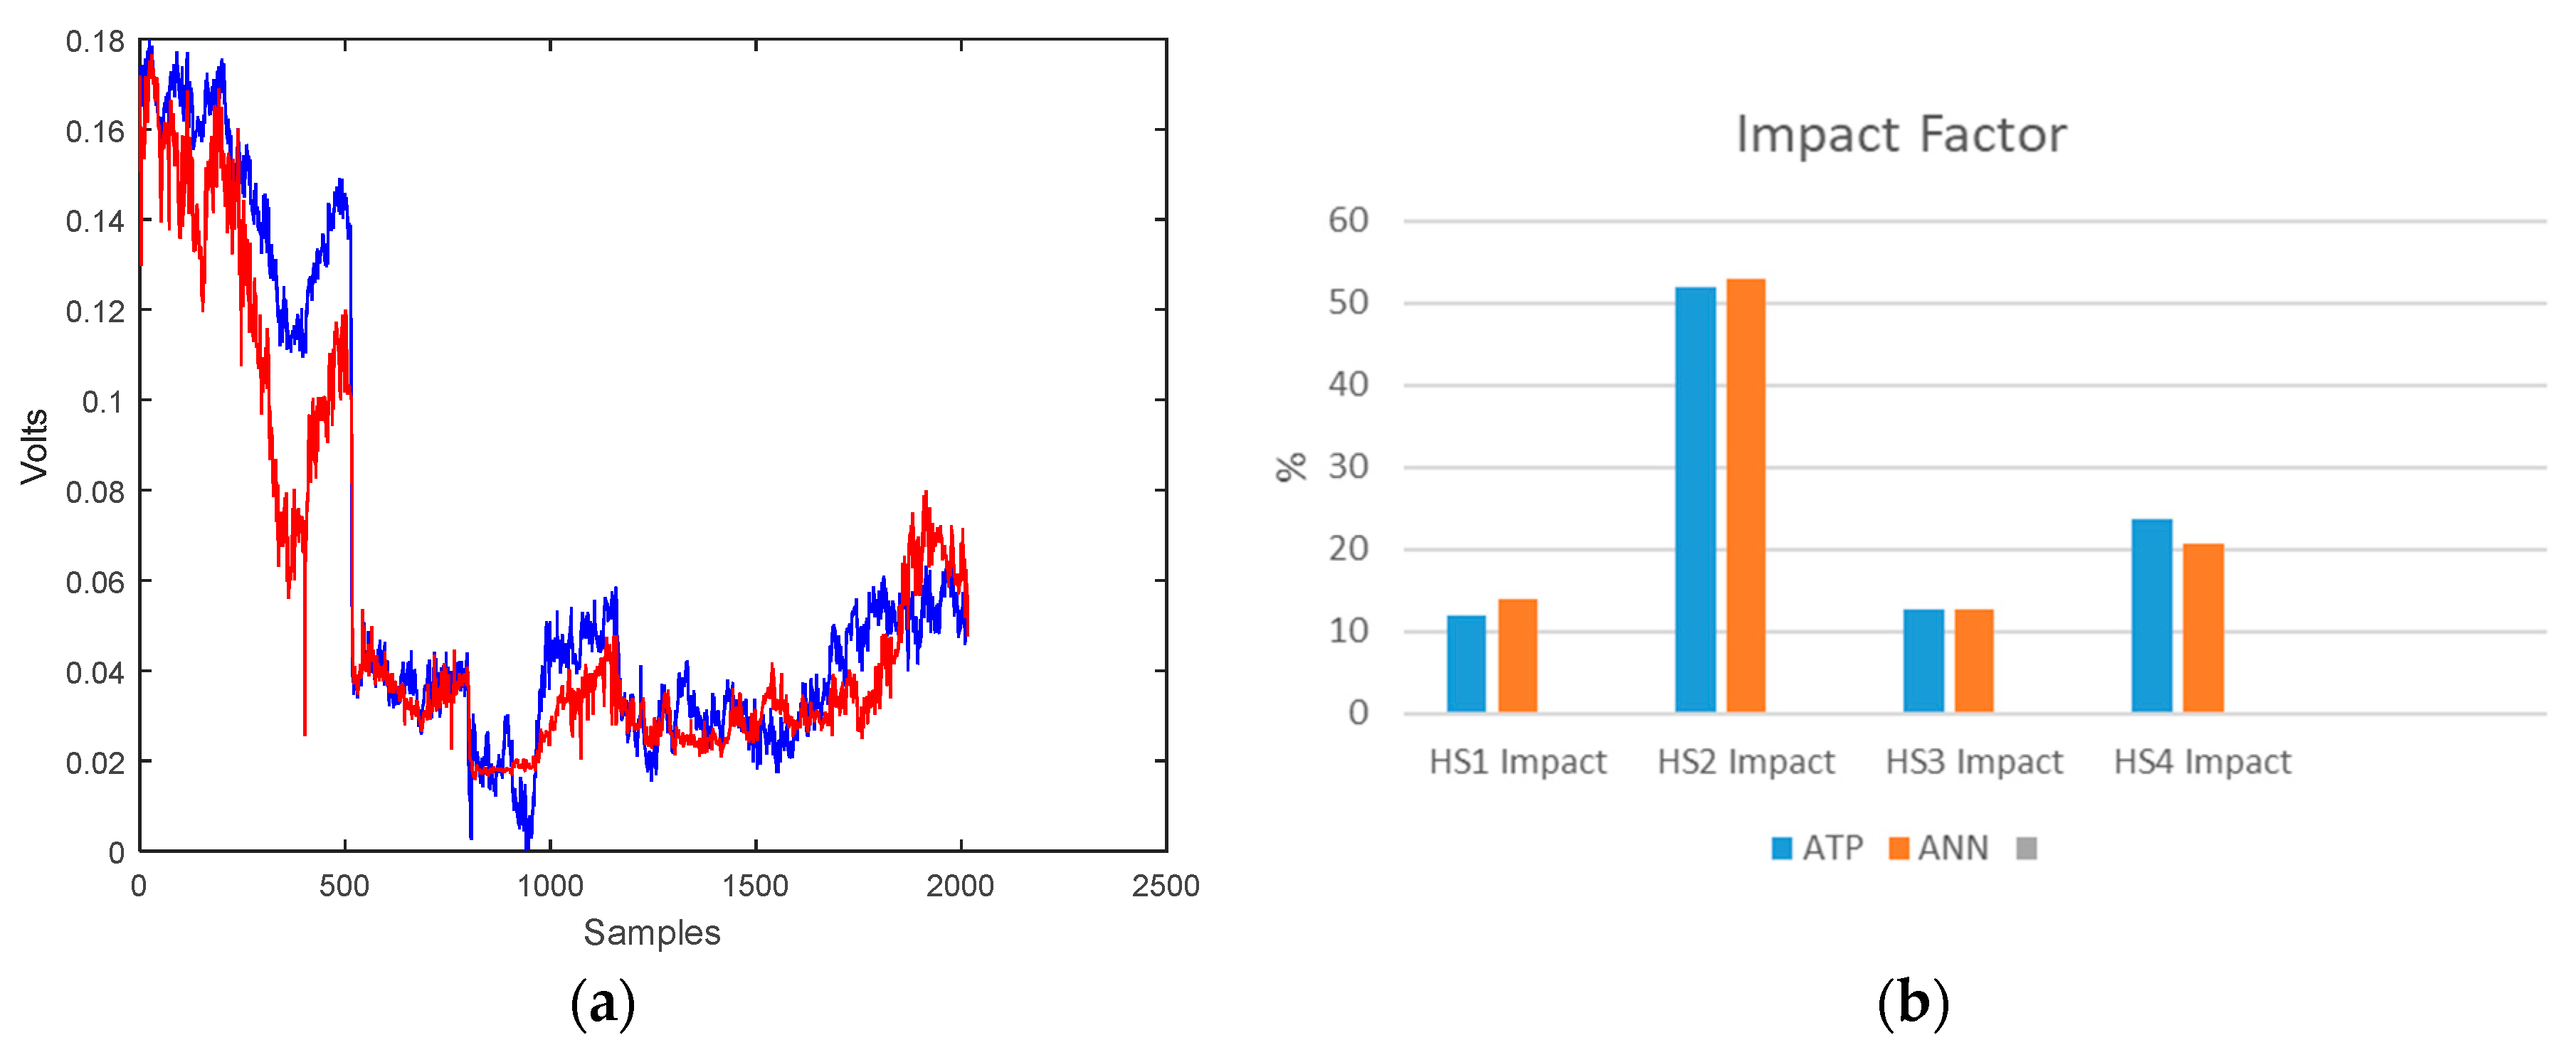
3.1. Case Study Considering All Four Nonlinear Loads

The ANN designed for this case study consists of four neurons in the input layer, representing the four nonlinear loads’ harmonic currents, a hidden layer containing five neurons and one neuron in the output layer, representing the harmonic voltage at the bus of interest, that, in this case study, is Bus 03 (B03). It is worth noting that the ANN structure was obtained by an experimental procedure, with the ANN structure that presented the smallest error chosen. Table 1 shows the ANN results for several ANN configurations, where it can be seen that the lowest average absolute error was achieved using five neurons in the hidden layer. Table 2 presents the activation functions and the ANN training parameters as found in the MatLab, where mu is an adaptive value to assist in the calculation of the ANN performance.
Figure 5a presents the fifth harmonic voltages magnitudes calculated by the ATP simulation, which are considered as reference values, and those calculated by the designed ANN.
These results correspond to the test set only, which contains 2016 voltages samples, and demonstrate that the ANN response tracks fairly well the ATP results as presented in Figure 5a. Also, in Figure 5b, the percent impacts calculated by the proposed methodology compared with reference values obtained by ATP are presented. It can be seen in Figure 5b that the ANN calculated impact factors (IFVIjh (%)) are good estimates for the exact values calculated by ATP. A more detailed description as to how well the ANN model fits the ATP reference model is presented in Table 3 for each nonlinear load or harmonic source (HS1, HS2, HS3, HS4). It is observed that the impact factors calculated by the ANN model are good estimates of the reference values calculated by ATP.
Table 3 also presents an Impact Strength Classification (ISC), which denotes the relative importance of each nonlinear load on the harmonic voltage distortion. That is, the bigger the impact factor, is the more the respective nonlinear load contributes to the voltage harmonic distortion at the point of interest. ATP classified load 2 (HS2) as the most impacting, load 4 (HS4) as second, load 3 (HS3) as third, and load 1 (HS1) as the least impacting. The ANN classification obtained the same results as ATP for HS2 and HS4, but has classified HS1 as third and HS3 as fourth. It can also be noted that the ATP’s calculated impact factors for HS1 and HS3 are very similar, which indicates they have almost the same impact on the voltage harmonic distortion, which for practical applications, validates the ANN classification.

3.2. Case Study Considering Only Three Nonlinear Loads Measured Simultaneously

In this study, it is supposed that only three nonlinear loads from the four system loads will be measured simultaneously with the voltage at the point of interest (B03). The results of impact factors calculated by ATP for the four system loads will be kept as a reference, i.e., one wishes to evaluate if the ANN model identifies correctly the most impacting source (HS2), even when measurement data from some harmonic sources are missing. Different combinations of the three harmonic sources, including source HS2, will be simulated as follows:
Case 1
Nonlinear loads HS1-HS2-HS3;
Case 2
Nonlinear loads HS1-HS2-HS4; and
Case 3
Nonlinear loads HS2-HS3-HS4.
According to the results depicted in Table 4, the ANN model has succeeded in all cases analyzed, classifying correctly HS2 as the most impacting harmonic source. It is worth mentioning that as only three harmonic sources are considered, their relative percent participations sum up 100%.

3.3. Case Study Considering Only Two Nonlinear Loads Measured Simultaneously

It is supposed now that only two nonlinear loads will have simultaneous measurements with voltage at the point of interest (B03). The results of impacts calculated by ATP for the four system loads are kept as a reference for comparison with the ANN model results. Again, one wishes to evaluate the ANN model performance in classifying the most impacting harmonic source to voltage harmonic distortion in a point of interest, now using the smallest simultaneous measurement data set, which corresponds to two nonlinear loads measurements. The following combinations of two loads, including HS2, will be analyzed:
Case 4
Nonlinear loads HS1–HS2;
Case 5
Nonlinear loads HS2–HS3; and
Case 6
Nonlinear loads HS2–HS4.
In all cases analyzed in Table 5, the ANN model confirmed HS2 as the most impacting harmonic source for voltage distortions at bus B03. Again, as only two loads are analyzed at a time, their relative percent impacts sum up 100%.

4. Discussion

The results presented in Section 3 have shown clearly that the proposed ANN technique is an appropriate tool for identifying the contribution that multiple nonlinear loads have on voltage harmonic distortion at points of interest in the electric grid. The controlled simulation environment, created by the ATP, was a key point to calculate the values of harmonic voltages at the point of interest, and thus obtain the harmonic impacts (exact values), caused by nonlinear loads, HS1, HS2, HS3, and HS4.
In a real electric system operation environment, it is normal to have many nonlinear loads, which makes it very difficult to carry out a simultaneous measurement campaign in all these loads. So, it is very common to have situations in which only a few loads are measured simultaneously. In these cases, with incomplete measurement, it is important to assess whether the ANN is still classifying correctly the most impacting load. This situation was considered in case studies (Section 3.2 and Section 3.3), Section 3, demonstrating the ANN model efficacy, which ranked correctly load HS2 as most impacting, which agrees with the classification of case study (Section 3.1), corresponding to the complete measuring system.
The good performance shown by the ANN model in this specific problem makes it a good alternative analysis tool, even when compared to the analytical approach via the harmonic load flow solution, because in this case, it is necessary to model the electric network harmonic impedances, which is not always a simple task. Also, it is expected that future work be done to compare the ANN technique performance to other potential techniques, such as linear multiple regression, regression trees, and others, applied to this specific problem.

5. Conclusions

This paper presented a practical method to analyze the influence of multiple nonlinear loads over the harmonic distortion measured at points of interest in the electrical grid. The methodology is based on simultaneous measurements of voltage and current, and the application of artificial neural networks models to express the correlation between measured voltage at the grid and the corresponding nonlinear load current at the customer’s installation.
A real electrical system was used to apply the proposed procedure, and the obtained results have demonstrated that the ANN model is capable of presenting very satisfactory indication with respect to which nonlinear loads have a greater influence over the observed voltage harmonic distortion. This is a relative classification that satisfies completely the purpose of the analysis, once electric utilities, at a first stage, are interested to detect which loads in the electrical grid may deserve attention with respect to the problem of harmonic distortions on grid voltages, and this way, pay attention to them due to any violation of harmonics limits observed in the grid. The adoption of the proposed methodology is of easy implementation in the operation and planning environments of electric utilities, and may support decisively the adoption of measures to ensure the power quality of the energy supplied to consumers, and also reconciling conflicts of responsibility attribution between consumers and the electric utilities regarding the harmonic distortions. Also, the methodology can assist in the creation of specific regulatory documents with respect to the voltage harmonic distortion in the electric grid provoked by connected customers.
Also, the proposed procedure is very attractive for electrical utilities since it does not demand high technology measuring devices, such as phasor measurement techniques, being sufficient to use conventional power quality analyzers that measures only root mean values (rms) of voltage and current.

Author Contributions

Conceptualization, A.M., U.B., M.T. and T.S.; Data curation, A.M.; Formal analysis, A.M., U.B., E.M., C.C. and T.S.; Investigation, M.T.; Methodology, A.M. and U.B.; Project administration, U.B. and M.T.; Software, A.M., E.M. and T.S.; Supervision, U.B. and M.T.; Validation, A.M., U.B., E.M., C.C. and T.S.; Visualization, A.M. and U.B.; Writing—original draft, A.M., U.B., M.T., E.M., C.C. and T.S.

Funding

This research received no external funding.

Acknowledgments

This research was supported by CEAMAZON—Center of Excellence on Energy Efficiency in the Amazon.

Conflicts of Interest

The authors declare no conflict of interest.

References

  1. IEEE Recommended Practices and Requirements for Harmonic Control in Electric Power Systems; IEEE Std 519-1992; Institute of Electrical and Electronics Engineers, Inc.: Piscataway, NJ, USA, 1992.
  2. Electromagnectic Compactibility (EMC)—Part-3-6: Limits-Assessment of Emission Limits for the Connection of Distorting Installations to MV, HV and EHV Power Systems, 2nd ed.; IEC 61000-3-6; International Electrotechnical Commission: Geneva, Switzerland, 2008.
  3. ANEEL. Módulo 8—Procedimentos de Distribuição de Energia Elétrica no Sistema Elétrico Nacional—PRODIST; ANEEL: Brasília, Brasil, 2007. [Google Scholar]
  4. Xu, W.; Liu, Y. A method for determining customer and utility harmonic contribution at the point of common coupling. IEEE Trans. Power Deliv. 2000, 15, 804–811. [Google Scholar]
  5. Santos, I.N.; Oliveira, J.C. Critical Analysis of the Current and Voltage Superposition Approaches at Sharing Harmonic Distortion Responsibility. IEEE Latin Am. Trans. 2011, 9, 516–521. [Google Scholar] [CrossRef]
  6. Hamzah, N.; Mohamed, A.; Hussanin, A. Methods for determining utility and customer harmonic contributions at the point of common coupling. In Proceedings of the 2003 National Power and Energy Conference (PECon), Bangi, Malaysia, 15–16 December 2003. [Google Scholar]
  7. Chandra, A.; Mbang, B.; Srinivasan, K.; Singh, B.N.; Rastgoufard, P. A method of implementation of separating customer and supply side harmonic contributions using an active filter. In Proceedings of the Electrical and Computer Engineering, Montreal, QC, Canada, 4–7 May 2003. [Google Scholar]
  8. Farhoodnea, M.; Mohamed, A.; Shareef, H. Novel method for determining the contribution of utility and customer harmonic distortion in distribution systems. In Proceedings of the 4th International Power Engineering and Optimization Conference (PEOCO2010), Shah Alam, Selangor, Malaysia, 23–24 June 2010. [Google Scholar]
  9. Xiangyu, D.; Lijun, T.; Daozhu, M.; Yu, C. Determination of harmonic source’s total harmonic contributions in distribution network and its realization on platform of LabVIEW. In Proceedings of the IEEE PES Asia-Pacific Power and Energy Engineering Conference (APPEEC), Brisbane, QLD, Australia, 15–18 November 2015. [Google Scholar]
  10. Sezgin, E.; Göl, M.; Salor, O. Determination of harmonic current contributions of plants supplied from PCC based on state estimation. In Proceedings of the 23nd Signal Processing and Communications Applications Conference (SIU), Malatya, Turkey, 16–19 May 2015. [Google Scholar]
  11. Xiao, C.; Qiu, Z.; Ding, S.; Xu, C.; Zhiqi, W.; Yue, L. Effectiveness analysis of determining the main harmonic source by harmonic active power direction method. In Proceedings of the IEEE International Conference on Power and Renewable Energy, Shanghai, China, 21–23 October 2016. [Google Scholar]
  12. Liu, Y.; Wang, L.; Xiao, X.; Wang, Y.; Chen, F. Complex blind source separation based harmonic contribution assessment. In Proceedings of the 17th International Conference on Harmonics and Quality of Power (ICHQP), Belo Horizonte, Brazil, 16–19 October 2016. [Google Scholar]
  13. Špelko, A.; Papič, I.; Djokic, S.Z. A voltage-only method for assessing harmonic contribution from a customer installation. In Proceedings of the 18th International Conference on Harmonics and Quality of Power (ICHQP), Ljubljana, Slovenia, 13–16 May 2018. [Google Scholar]
  14. Silva, C.B.S.; Silva, I.N.; Aravechia, J.V.P.; Fernandes, R.A.S. A fuzzy-based approach for harmonic contribution determination at points of common coupling. In Proceedings of the IEEE Eindhover Power Tech, Eindhoven, The Netherlands, 29 June–2 July 2015. [Google Scholar]
  15. Yang, J.; Yang, Y.; Chen, J.; Fu, L.; He, Z. Determining the harmonic contributions of multiple harmonic sources using data clustering analysis. In Proceedings of the International Symposium on Smart Electric Distribution Systems and Technologies (EDST), Vienna, Austria, 8–11 September 2015. [Google Scholar]
  16. Mazin, H.E.; Nino, E.E.; Xu, W.; Yong, J. A Study on the Harmonic Contributions of Residential Loads. IEEE Trans. Power Deliv. 2011, 26, 1592–1599. [Google Scholar] [CrossRef]
  17. Kandev, N.P.; Chenard, S. Method for determining customer contribution to harmonic variations in a large power network. In Proceedings of the Proceedings of 14th International Conference on Harmonics and Quality of Power (ICHQP), Bergamo, Italy, 26–29 September 2010. [Google Scholar]
  18. Mazin, H.E.; Xu, W.; Huang, B. Determining the harmonic impacts of multiple harmonic-producing loads. IEEE Trans. Power Deliv. 2011, 26, 1187–1195. [Google Scholar] [CrossRef]
  19. Hua, H.; Jia, X.; Cao, D.; Zhao, C. Practical method to determine the harmonic contribution of a specific harmonic load. In Proceedings of the ICHQP-International Conference on Harmonics and Quality of Power, Hong Kong, China, 17–20 June 2012; pp. 769–773. [Google Scholar]
  20. He, Z.; Chen, J. Harmonic contribution assessment on the condition of background harmonic fluctuations. In Proceedings of the International Symposium on Smart Electric Distribution Systems and Technologies (EDST), Vienna, Austria, 8–11 September 2015. [Google Scholar]
  21. De Matos, E.O.; Soares, T.M.; Bezerra, U.H.; de Tostes, M.E.L.; Manito, A.R.A.; Costa, B.C., Jr. Using linear and non-parametric regression models to describe the contribution of nonlinear loads on the voltage harmonic distortions in the electrical grid. IET Gener. Transm. Distrib. 2016, 10, 1825–1832. [Google Scholar] [CrossRef]
  22. Mazumdar, J.; Harley, R.G. Recurrent neural networks trained with backpropagation through time algorithm to estimate nonlinear load harmonic currents. IEEE Trans. Ind. Electron. 2008, 55, 3484–3491. [Google Scholar] [CrossRef]
  23. Janani, K.; Himavathi, S. Non-intrusive harmonic source identification using neural networks. In Proceedings of the International Conference on Computation of Power, Energy, Information and Communication (ICCPEIC), Chennai, India, 17–18 April 2013. [Google Scholar]
  24. Dai, J.; Zhang, P.; Mazumdar, J.; Harley, R.G.; Venayagamoorthy, G.K. A Comparison of MLP, RNN and ESN in Determining Harmonic Contributions from Nonlinear Loads. In Proceedings of the 34th Annual Conference of IEEE Industrial Electronics, Orlando, FL, USA, 10–13 November 2008. [Google Scholar]
  25. Chai, T.; Draxler, R.R. Root mean square error (RMSE) or mean absolute error (MAE)?—Arguments against avoiding RMSE in the literature. Geosci. Model Dev. 2014, 7, 1247–1250. [Google Scholar] [CrossRef]
  26. ALTERNATIVE TRANSIENTE PROGRAM-ATP (ATP Draw); User’s Manual Version 5.6. [S.1]; Norwegian University of Technology Trondheim: Trondheim, Norwegian, 2009.
  27. Test Systems for Harmonics Modeling and Simulation. IEEE Trans. Power Deliv. 1999, 14, 579–587. [CrossRef]
Figure 1. A generic electrical power system, adapted from [18].
Energies 11 03303 g001
Figure 2. General representation of the ANN input-output relationship.
Energies 11 03303 g002
Figure 3. Simplified flowchart diagram.
Energies 11 03303 g003
Figure 4. IEEE 13-bus industrial distribution electrical system ATPDraw diagram, adapted from [27].
Energies 11 03303 g004
Figure 5. (a) Comparing ATP calculated fifth harmonic voltage magnitudes (in blue) at bus B03 with their estimates obtained by the ANN using the test set (in red); (b) comparing percent impacts obtained by ATP and ANN.
Energies 11 03303 g005
Table 1. Results for different ANN structures.
MLP Artificial Neural NetworkMLP Structure: Number of NeuronsMAE
Input LayerHidden LayerOutput Layer
ANN14110.0118
ANN24210.0113
ANN34310.0115
ANN44410.0113
ANN54510.0107
ANN64610.0124
Table 2. ANN training parameters.
Parameters NameParameters Values
Hidden layer activation functionSigmoid
Output layer activation functionLinear
net.trainparam.epochs1000
net.trainparam.goal0
net.trainparam.max_fail6
net.trainparam.min_grad1 × 10−7
net.trainparam.mu0.001
net.trainparam.mu_dec0.1
net.trainparam.mu_inc10
net.trainparam.mu_max1 × 1010
Table 3. Percent impacts on voltage harmonic distortions due to harmonic sources, HS1, HS2, HS3, and HS4, and respective impact strength classification.
Harmonic SourcesHS1 (%)HS2 (%)HS3 (%)HS4 (%)
ATP Calculated Impact (Reference Values)11.8351.8212.6823.67
RNA Calculated Impact13.8352.8312.7320.61
Impact Strength Classification (ATP)FourthFirstThirdSecond
Impact Strength Classification (RNA)ThirdFirstFourthSecond
Table 4. Percent impacts on voltage harmonic distortions due to combinations of three harmonic sources and respective impact strength classification.
Harmonic SourcesHS1HS2HS3HS4
Impact Strength Classification (ATP)FourthFirstThirdSecond
(11.83%)(51.82%)(12.68%)(23.67%)
ANN Classification—Case 1 (HS1, HS2, HS3)ThirdFirstSecond
19.78%58.14%22.09%
ANN Classification—Case 2 (HS1, HS2, HS4)ThirdFirst Second
16.11%58.62%25.27%
ANN Classification—Case 3 (HS2, HS3, HS4) FirstThirdSecond
64.95%14.68%20.36%
Table 5. Percent impacts on voltage harmonic distortions due to combinations of two harmonic sources and respective impact strength classification.
Harmonic SourcesHS1HS2HS3HS4
Impact Strength Classification (ATP)FourthFirstThirdSecond
(11.83%)(51.82%)(12.68%)(23.67%)
ANN Classification—Case 1 (HS1, HS2)SecondFirst
(18.07%)(81.93%)
ANN Classification—Case 4 (HS2, HS3) FirstSecond
(79.86%)(20.14%)
ANN Classification—Case 5 (HS2, HS4) First Second
(79.08%) (32.02%)

