1. Introduction
As the demand for energy increases, and the world seeks more environmentally friendly solutions, efforts are being made to improve the power generating efficiencies and performance. These efficiencies are particularly pressing in South Korea which is experiencing significant increases in energy pricing due to both increased demands and the reliance on imports for most of its primary energy resources. As such, this study analyzes the life cycle costing and energy/environmental efficiency of one potential solution, off-gas power plants. Off-gas power plants are powered by a steel plant by-product during production. Presented within this paper is an optimal performance of off-gas power plants utilizing the steel plant byproduct with an associated life-cycle cost analysis (LCCA).
Although the renewable energy revolution is decades old, Korea has historically focused on non-renewable power generation, namely, nuclear and coal fired power plants. However, at the 21st Conference of the Parties to the United Nations Framework Convention on Climate Change held in Paris, France, South Korea submitted a goal of reducing its greenhouse gas emissions by 37% by 2030 [
1]. Furthermore, the international community has been reducing their financial support of coal thermal power plants significantly, as depicted through:
The World Bank not supporting a coal power plant since the South Africa Coal Power Plant Project in 2010 [
2];
US announcing a Climate Action Plan to limit support for overseas coal power plants limiting public export support for coal power plants that generate 700 g CO
2/kWh or more [
3];
European Investment Bank establishing new Emissions Performance Standards, no longer supporting coal fired thermal power plant projects that emit 550 g CO
2/kWh or more though still supporting those that are modified to become multi-fuel power plant projects, cogeneration, or carbon capture and storage [
3];
US, Denmark, Finland, Iceland, Norway, and Sweden, along with the European Bank for Reconstruction and Development, all choosing to discontinue funding support for global coal thermal power plants [
3]; and
As of 2012, 76 financial institutions worldwide, including three Japanese banks and one Chinese bank, have voluntarily agreed to follow the Equator Principles for project financing and stop financing large-scale development projects that cause environmental damage, which includes traditional coal thermal power plants) [
3].
With the increase of limits on financing for high carbon emitting power projects, Korean power generating domestic company project sponsors are expected to suffer considerable losses [
3,
4]. Therefore, a plan to manage electricity supply suitable for trends in domestic energy consumption, and a plan to reduce greenhouse gases, are urgently needed. One such plan is to convert coal power plants to power plants generating power using off-gas which reduces carbon emissions by recycling exhaust gas from steel mills to produce electricity.
Recycling exhaust gas has been found to improve the energy efficiency of the entire steel works industry. Thus, reducing the carbon dioxide emissions from burning coal aids in mitigating global warming [
4]. This study investigates the efficiency of said process, developing a power generation and power plant performance simulation of data collected from an operational steel plant, analyzed by the thermodynamic software PEPSE (version 77). The operational validity of the off-gas power plant is also examined using economic analysis tools such as the net present value (NPV), internal rate of return (IRR), and discounted payback period (DPP). The variability of the IRR is predicted according to the changes in fuel cost and unit price of power production. Through these results, an LCCA of the off-gas power plant is also performed.
The modeling methodology presented in this paper will contribute to improving the performance of the off-gas power generation process and equipment. It is expected that this work will be useful as reference material for future construction feasibility analyses of new off-gas power plants. Furthermore, it will aid in the steel works industry’s understanding and acceptance of the performance analysis, processing, and principles of the off-gas power plant. This study verifies the potential facility efficiency of off-gas power generation and aids in the discussion of future required changes for South Korea to operate energy-recycling power plant facilities.
2. Steel Plants’ Basic Operation and Byproducts
To operate steel plants, energy is produced internally through coal, oil, and natural gas and externally purchased from power plants. The by-products of these energy-producing processes are off-gas and steam. Off-gas includes mixed blast furnace gas (BFG), coke oven gas (COG), and linz donawitz gas (LDG). Using these off-gases as an energy sources is an untapped potential of integrated steel plants. The off-gas can be used as a fuel source for the iron manufacturing process, for hot and cold roll products in downstream steel making processes, and/or in the operations of an off-gas power plant [
5].
Concerning the process of using off-gas byproducts as a power source, steam generated from sintering and coke waste is used to generate power, operate the furnace, and in the steelmaking process including coke and cold rolling. After the steam is used in these processes, the remaining low pressure and temperature steam is used for heating, showers, and heat insulation. The energy center in a steel plant controls the demand/supply and ensures both rational and economical optimum distribution and use of energy. The efficiency of energy use is enhanced by planning for energy supply and demand, controlling operations, and using the process computer in the energy center to measure, transfer, control, and monitor various signals [
6].
BFGs, one of the main off-gases, are generated from furnace processes that produce pig iron from iron ore. Some of these BFGs are consumed in the furnace process itself. The remainder are stored and used as fuel. Fifty percent (50%) of the BFGs generated are consumed immediately in furnace and coke factories. As such, an assessment of the stable, regular operations is required to reliably predict the remaining quantity. BFG surpluses are stored in tanks for use in an off-gas power plant [
6]. Alternatively, COGs are high-calorie off-gases generated from the process of mixing and carbonizing bituminous coal. The amount generated varies by the number of coke factories in operation, their capacity, and the mixing ratio of the bituminous coal. About 33% of the COGs are regularly consumed in the furnace and coke factories. However, approximately 18% of it is consumed in the hot rolling factory, where consumption patterns are irregular, which makes the amount of COG difficult to predict [
6]. Finally, LDG is generated from operation of the basic oxygen furnace. To use it as an energy source, gases that do not meet recovery conditions are discarded through emission stacks. The basic oxygen furnace operation is a batch process, which is irregular and makes it difficult to predict the amount of gas generated. LDG is supplied to the low-pressure boiler at a constant rate, with the remainder consumed by controls in the hot rolling facility [
6].
The efficient use of off-gas reduces various energy uses, leading to CO
2 emission reduction. The main off-gas is the BFG. Because it has a low heat rate of 3345 kJ/m
3·N, it is mixed with the COG with a heat rate of 21,000 kJ/ m
3·N. The mixed gas then has a heat rate 4606 kJ/m
3·N and is used as fuel. In a combined off-gas power plant, which includes both the steam and gas cycles, impurities such as dust are removed through a fuel gas filter to the produce the clean fuel that is sent to the gas turbine. In an off-gas power plant that uses only the steam cycle, however, the gas is directly fed to the boiler with no filtering [
6]. The heat rate and quality of the BFG-COG gas vary widely, equating to variable power output. Stable operation is required and achieved by developing materials that can endure the steam condition of high temperature and high pressure, optimizing the steam cycle, and using advanced operation technology. This study investigates the effects of the steam condition, the quality and quantity of feed water heaters, and reheating on performance of an off-gas power plant.
3. Existing Literature: Power Plant Efficiencies and Life Cycle Costing
This study investigates both the technical and economic feasibility of using steel plant off-gas to produce power. A few studies have focused on increasing power production efficiency through the use of off-gas. Early studies show an improved conversion efficiency of up to 65.4% with a similar cost per kWh of traditional power generation cycles [
7]. Later studies found a 36.6% cycle efficiency with an overall efficiency of 53.5% [
8]. These works focus on the power plant itself, not on off-gas from steel plants, did not perform PEPSE simulations, and only contained basic economic analysis at best.
Studies have also investigated the regasification of boil-off-gas from offshore liquified natural gas plants. These studies present optimization of this process [
9] and the advantages and disadvantages of the process [
10]. The core ideas otomaximize the efficacy of the compression of the boil-off-gas to reduce loss while still satisfying conditions including safety, power consumption, process requirements, and many other constraints are used as a basis of this research [
11]. However, even if the basic scheme for using boil-off-gas as a byproduct is similar to off-gas self-generation, the processes and operational philosophies of the two are completely different.
There have also been studies exploring the recycling of off-gas from steel plants to aid in plant efficiency [
12] and how to control the fuel levels and distribution for supply in the process [
13]. Furthermore, a case study was performed on using off-gas from steel plants to increase plant efficiency resulting in optimal solutions in terms of saving costs, sustaining normal levels, and maximizing fuel use efficiency [
14]. The conceptual idea of this research was motivated by these studies. However, they were not linked to using the byproduct gases to generate electricity to feed into the power grid. Also, all of the above studies lacked a full LCCA.
There have been several life cycle studies on power generation, though none on specifically generating power from the steel plant’s byproducts. Life cycle cost analyses have been performed to increase the Singapore power generation’s economic and environmental efficiency [
15,
16,
17], assess coal fired power plant’s life cycle costing [
18], life cycle environmental impacts of fuel selection in Taiwan [
19], and power generation on life cycle carbon emissions of nuclear energy power plants [
20]. These are only the most pertinent of the life-cycle studies for power creation’s economic and environmental impacts. Although more studies exist, none have performed an LCCA on the use of steel plants’ off-gas as a fuel source for power generation.
4. Research Methods
To achieve an optimization and perform an LCCA on the use of off-gas from steel plants to produce power, this study took a 4-step research approach, as follows:
Data Acquisition: All steel production data and characteristics were obtained from the Krakatau Steel plants located in Banten, Indonesia.
Steel Plant Operation Optimization: using the thermodynamic software application PEPSE (version 77), this study simulates power generation and analyze power plant performance based on Spencer and Cotton’s [
21] theory of steam turbine performance prediction. The program allows modeling of the turbine steam cycle, coal fueled boiler process, the combined cycle, and heat recovery equipment functionality. PEPSE allows discussions on the performance of individual components of the equipment; the effects of changing equipment, operating conditions, and design; and calculating efficiency, optimization, and sensitivity. Please note, the PEPSE outputs were verified using thermodynamic steam tables (for more detailed information, see [
22]).
Power Generation Efficiency: using the findings from step 2, the power generation is calculated with and without the use of off-gas for power production. This is described in greater detail below.
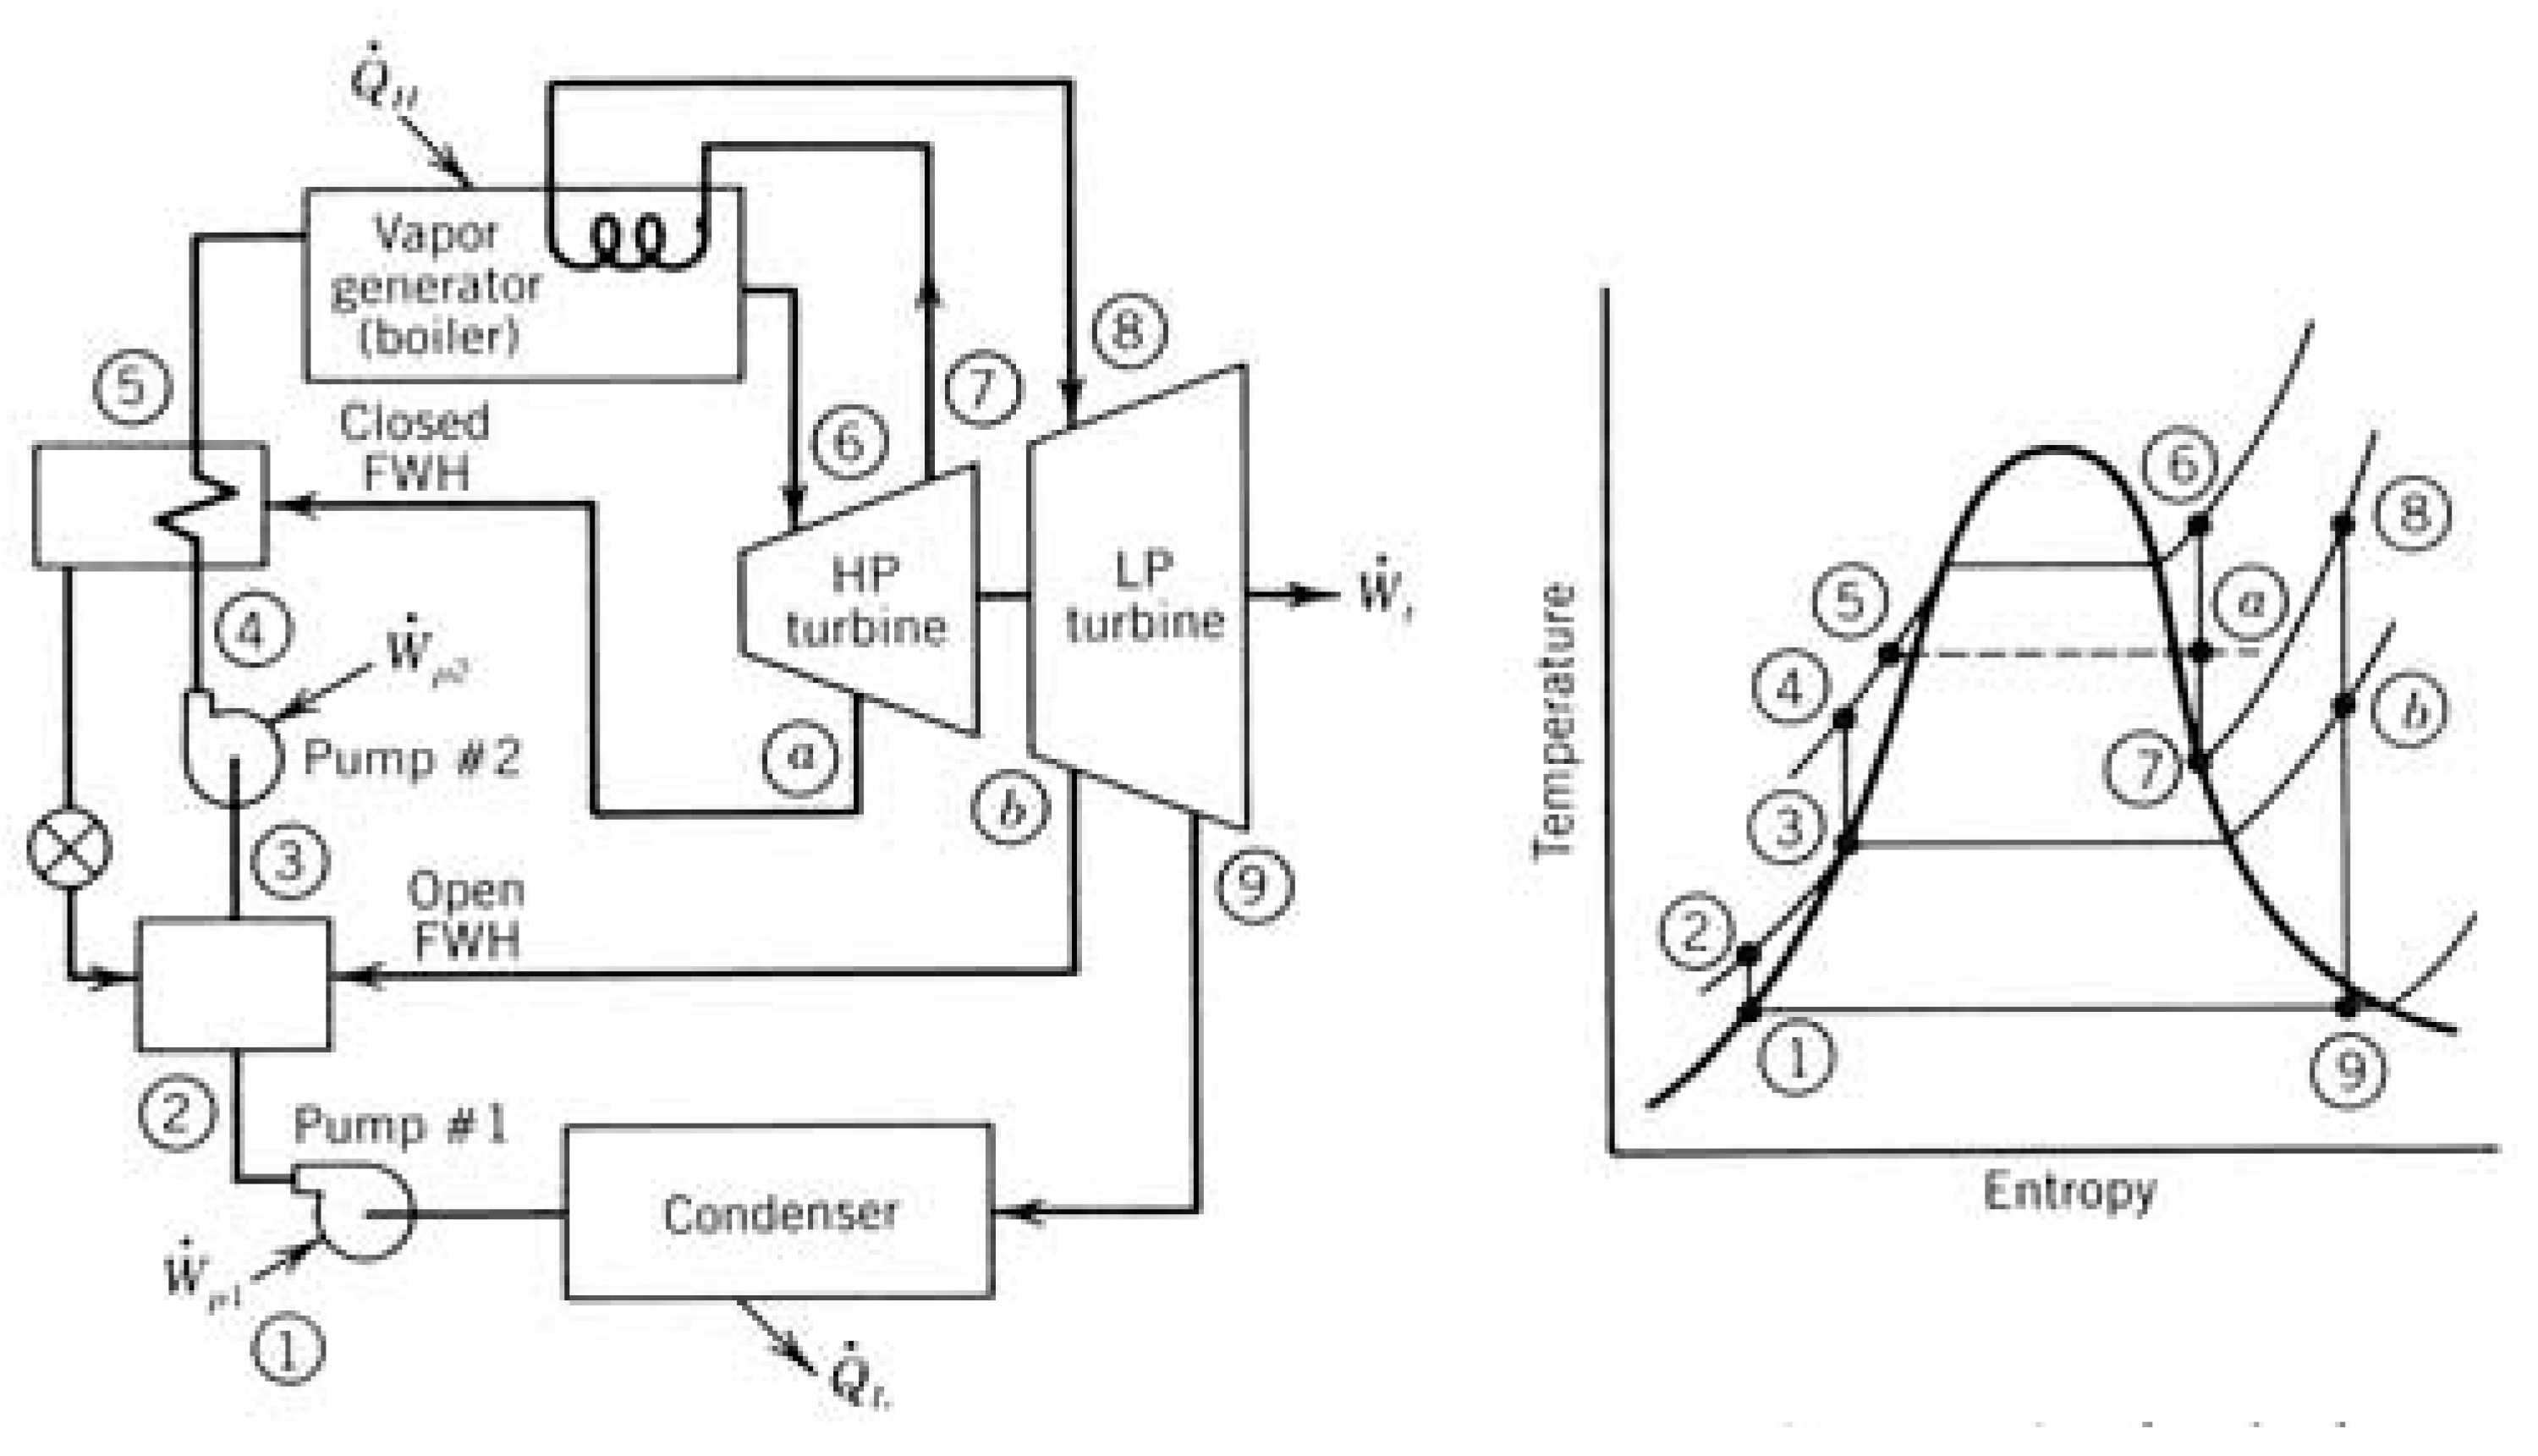
Power generation efficiency depends on the rate of system input and output. As per a Rankine cycle in
Figure 1, an idealized thermodynamic model of a heat engine that converts heat into mechanical work, a model used to predict the performance of steam turbine systems, the four processes are identified by numbers in the
Figure 1 temperature and entropy (T-S) diagram [
23].
Figure 2 depicts the plant cycle used for this paper. Illustrated below are nine states of the steam power generating process and their associated temperature-entropy diagram, described above in
Figure 1. A common issue decreasing power generation efficiency is the degradation of turbine blades via wet steam. To reduce this impact, operations often produce drier steam conditions through state 5 to 6 and 7 to 8 by superheating and reheating, respectively. Furthermore, operations often increase the cycle heat input temperature through the use of feed-water heating systems, shown as state 1 to 2 and 3 to 4. These solutions increase the efficiency of the cycle through what is commonly referred to as ‘reheat’ and ‘regenerative’ work, illustrated below in
Figure 2 [
24].
In order to analyze the performance of the power plant, operating conditions of HP, intermediate pressure (IP), and LP turbines, this paper uses the operating conditions shown in
Table 1. The performance is then calculated the Steam Table.
Table 1 depicts parameters such as the efficiency of Boiler (85.17%), the efficiency of Generator (95%), and the annual operation time (8000 h) which were assumptions made by the authors from common operating conditions to calculate the power generation efficiency. Scenario B operating conditions would mirror scenario A but are not shown because it is only simulated by PEPSE. The main steam flow rate, pressure, and heat; reheat steam temperature and pressure; and heat rate are calculated by PEPSE, as summarized in
Section 5.3 (Power Generation Efficiency) later.
- 4.
Life-Cycle Cost Analysis: Using industry-accepted LCCA practices, NPV, IRR, and DPP are calculated and the life-cycle cost is presented for the use of off-gas for power production. As a result, the approximate optimal range of investment cost (capital and operational expenditures, respectively) for the off-gas power plants is determined.
An overview of these research methods is also depicted
Figure 3.
In this paper, a total of three scenarios are compared and the characteristics of the off-gas power plant will be studied. Scenario A is modeled for the currently operating plant and scenario B is an optimization of scenario B model through PEPSE simulation. Scenario C is a cogeneration model that can additionally produce steam in model of scenario A. Scenario C off-gas data are based on the characteristics of an off-gas power plant where additional fueling could occur depending on the situation of the blast furnace in the steelworks. Scenario C was modeled through hand calculations. Project profitability was observed by economic analysis through the LCCA method for each of these three scenarios. The economics analysis assumes that two models of type corresponding to each scenario are built, by constructing 2 × 100 MW power plants. In this paper, the profit and loss for the investment are calculated, and the appropriate investment cost for the profit and the optimal fuel cost for the BFG and COG gas are estimated.
5. Findings
5.1. Data Acquisition: Krakatau Steel Plant Characteristics
The research methodology and approach used in this paper are based on a thermodynamic simulation model developed using the heat balance diagram and basic data for an off-gas power plant currently under commercial operation by Krakatau Steel in Indonesia (Krakatau POSCO, Krakatau, Indonesia). Krakatau POSCO, which started operation in December 2013, is the first integrated steel mill in Southeast Asia with a production capacity of 3,000,000 tons/year. POSCO and Krakatau Steel, Indonesia’s state-owned steelmakers, consist of the project sponsors, investing 70% and 30%, respectively, in the mill. The basic simulation model used in the optimum performance analysis in this study was an operational 100 MW-class off-gas power plant.
Using data from the Krakatau steel plant and applying it to a target power plant size of 100 MW, plant characteristics were developed. The plant consisted of high-, intermediate-, and low-pressure turbines, operating at 3600 rpm in a tandem compound structure. It also had a single-step reheating type condensing cooling cycle and was equipped with three low-pressure and two high-pressure feed-water heaters. The plant had a main steam pressure of 125.53 bar, temperature of 538 °C, a reheat steam temperature of 538 °C, and a designed plant efficiency of 36.47%. These conditions equate to a subcritical steam cycle.
Using these data, in tandem with PEPSE v. 77 simulation, a total of two scenarios were examined. One scenario produces only electricity and the other produces power and steam at the same time. The blast furnace of a steel mill has characteristics that fuel composition and fuel amount vary depending on the internal environment. As a result, the amount of fuel in an off-gas power plant performance varies and plants must produce additional power or steam for production using the remaining fuel. Thus, it is necessary to optimize both a base scenario A (optimization of scenario A is scenario B) and a scenario C which includes steam extraction at the power plant.
Both scenarios produce 100 MW of electricity, with steam parameters shown in
Table 2 below. The model was based on the heat balance diagram of the maximum guaranteed rating state, acceptable per steam power generation engineering best practices. The reheat steam pressure was found to be 36.2 and 34.5 bar, the main steam flow rate 86 and 94 kg/s, and the heat rate 8317 and 7876 kJ/kWh for scenarios A and C, respectively. This is depicted in
Table 2 and is used in the below analyses.
5.2. Steel Plant Operation Optimization
The first step towards optimizing the steam cycle of the subcritical power plant is raising the main steam pressure. Using the computational model as the baseline for scenario A illustrated in
Figure 4, the temperature at the main steam control valve inlet and the reheat steam temperature were maintained at 538 °C. The pressure drop rate in each pipe, and the bowl flow coefficient of each turbine, were maintained at the pre-existing settings. During the simulation, the pressure was increased from 125.53 bar to 225 bar in a step by step manner. With each step, the changes in major variables, such as specific heat consumption, total output of the turbine steam cycle, turbine efficiency, and outlet humidity of the last LP turbine, were observed. The results follow below in
Figure 5,
Figure 6,
Figure 7 and
Figure 8.
Figure 5 shows the change in the heat rate (the energy required to produce one kWh) and the total output power of the main steam caused by increases in the pressure of the main steam. As the pressure increases, the heat rate tends to decrease gradually. Thus, if the pressure of the inlet steam of the high-pressure turbine increases without a rise in temperature, the output increases and the heat consumption rate decreases. However, the power is not expected to increase by more than 170 bar, and the heat consumption rate did not decrease after the pressure increased by more than 181 bar.
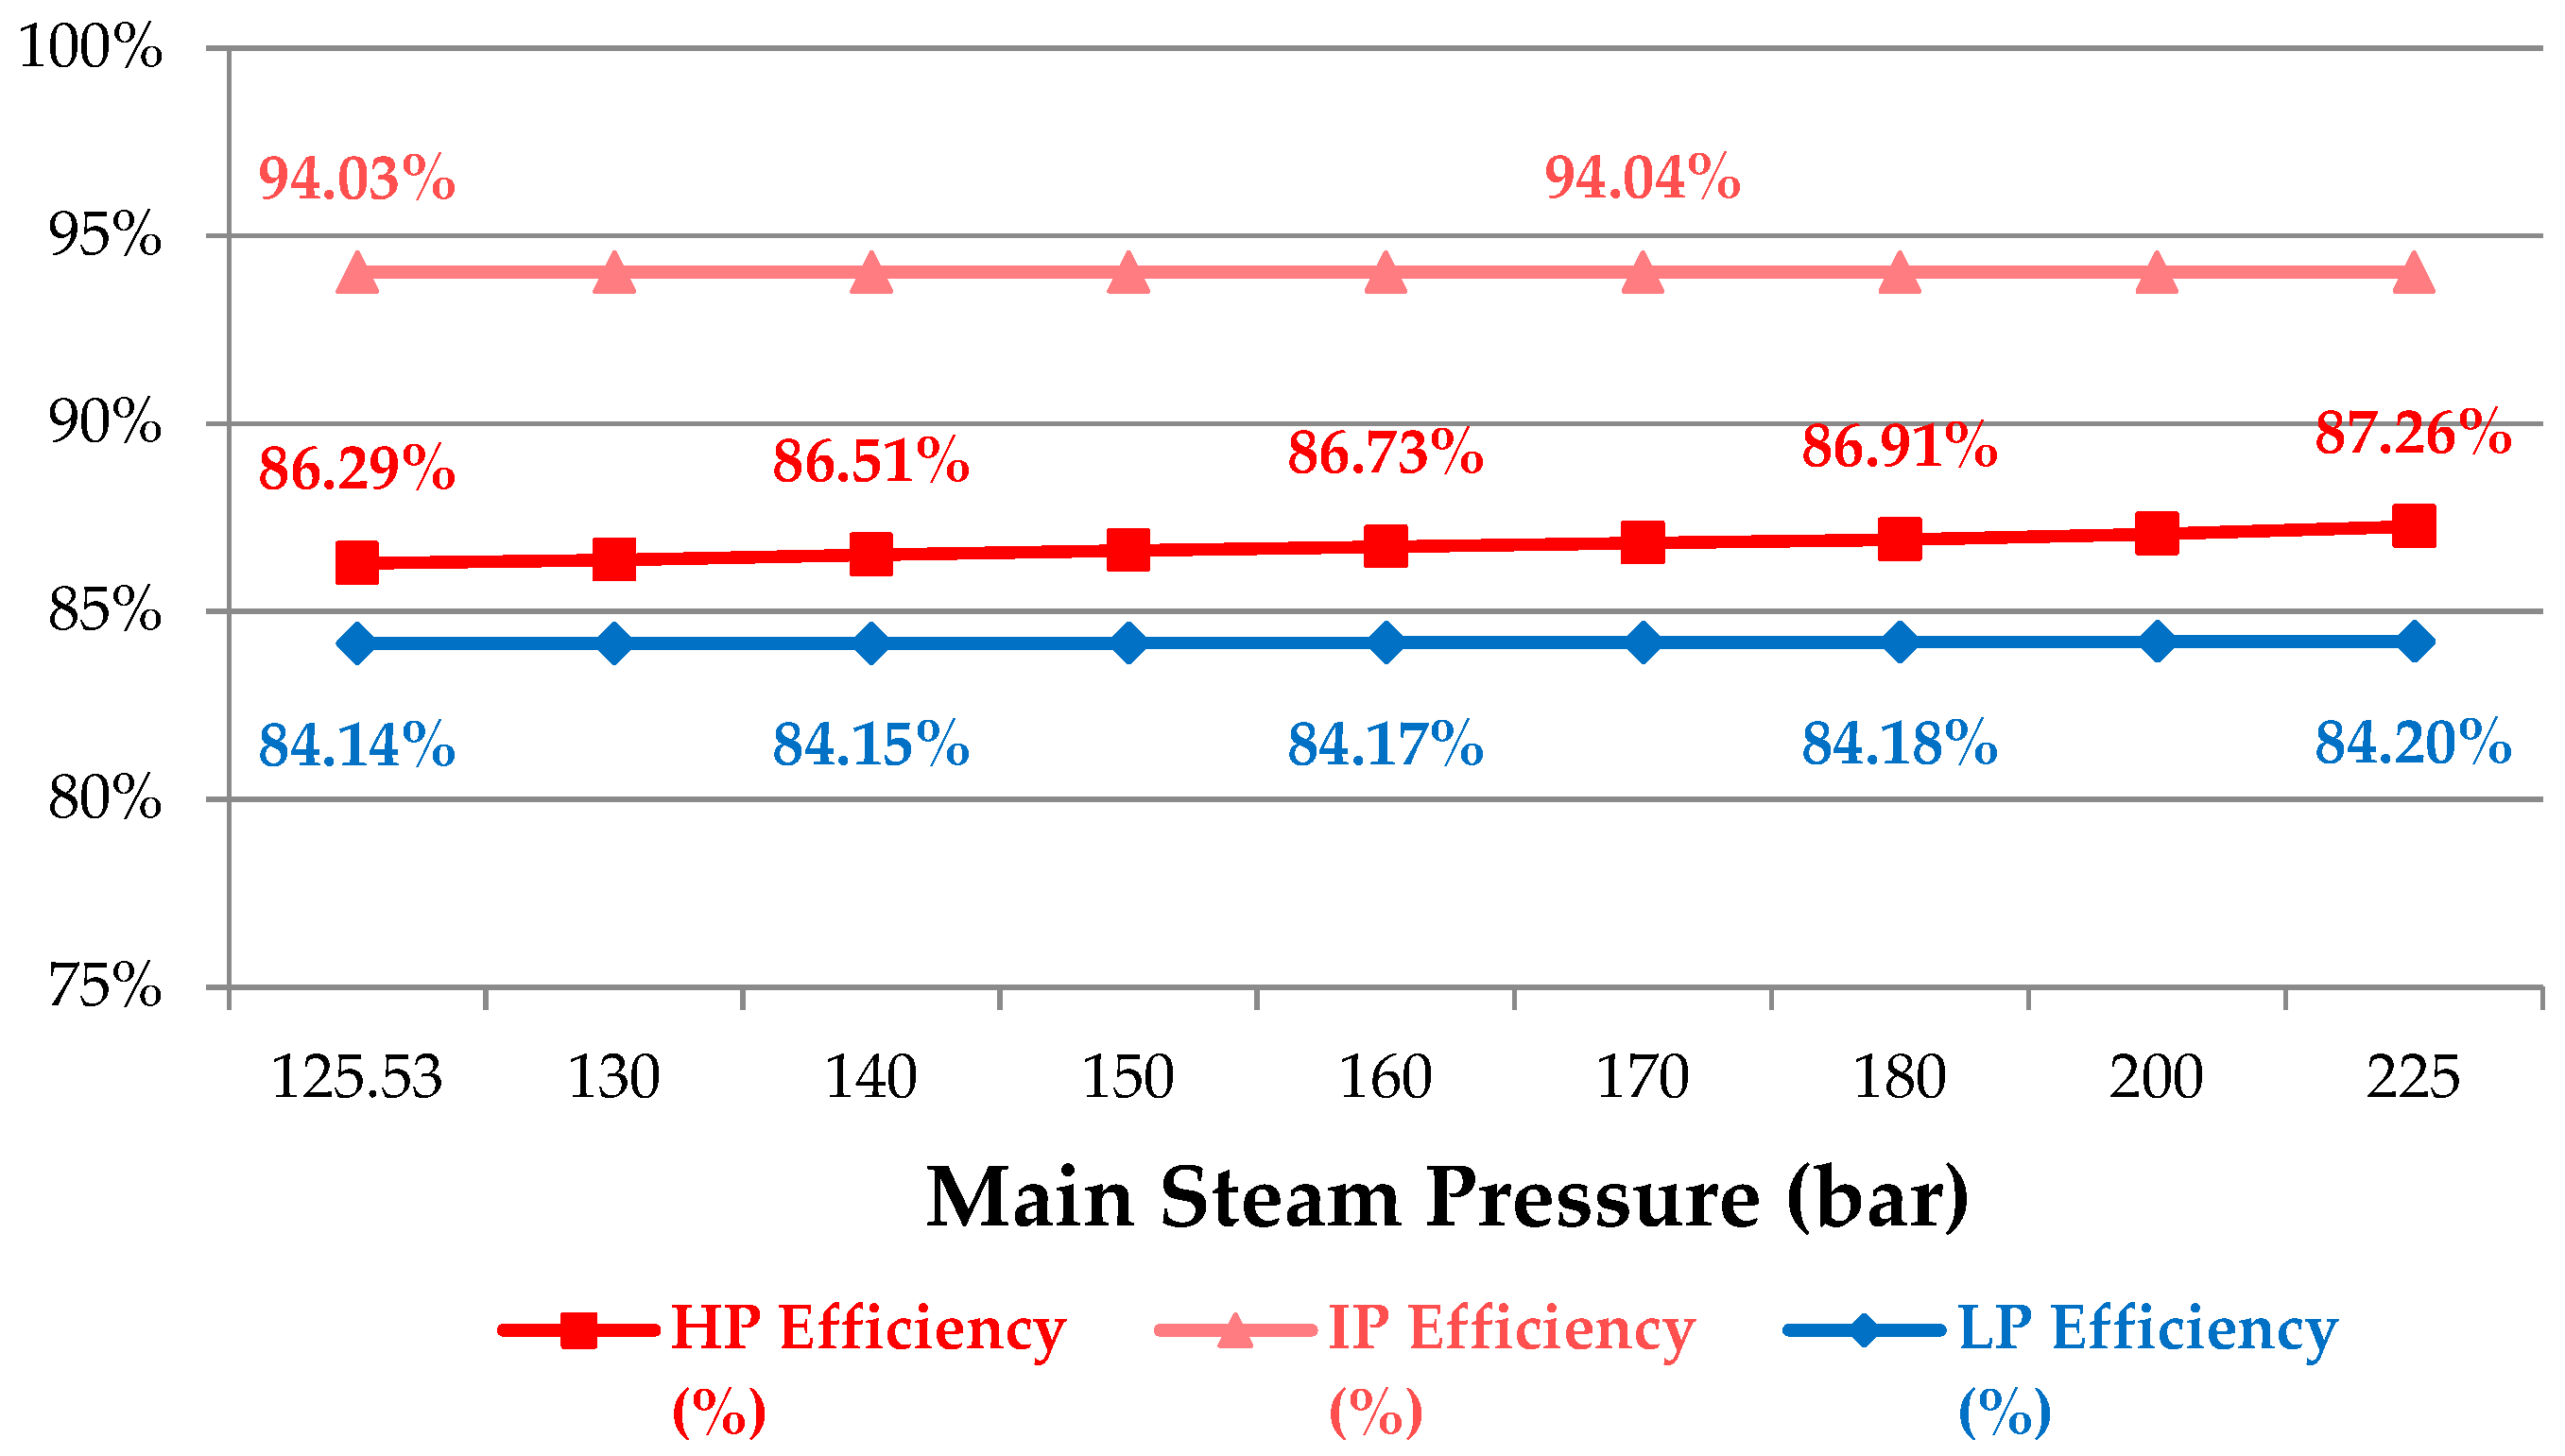
Figure 6 shows the turbine efficiency of the LP, IP, and HP turbine cycles. As can be seen, the LP, HP, and IP efficiencies remain ostensibly constant at 84%, ~87%, and 94% as the main steam pressure is increased from 125.53 to 225 bar.
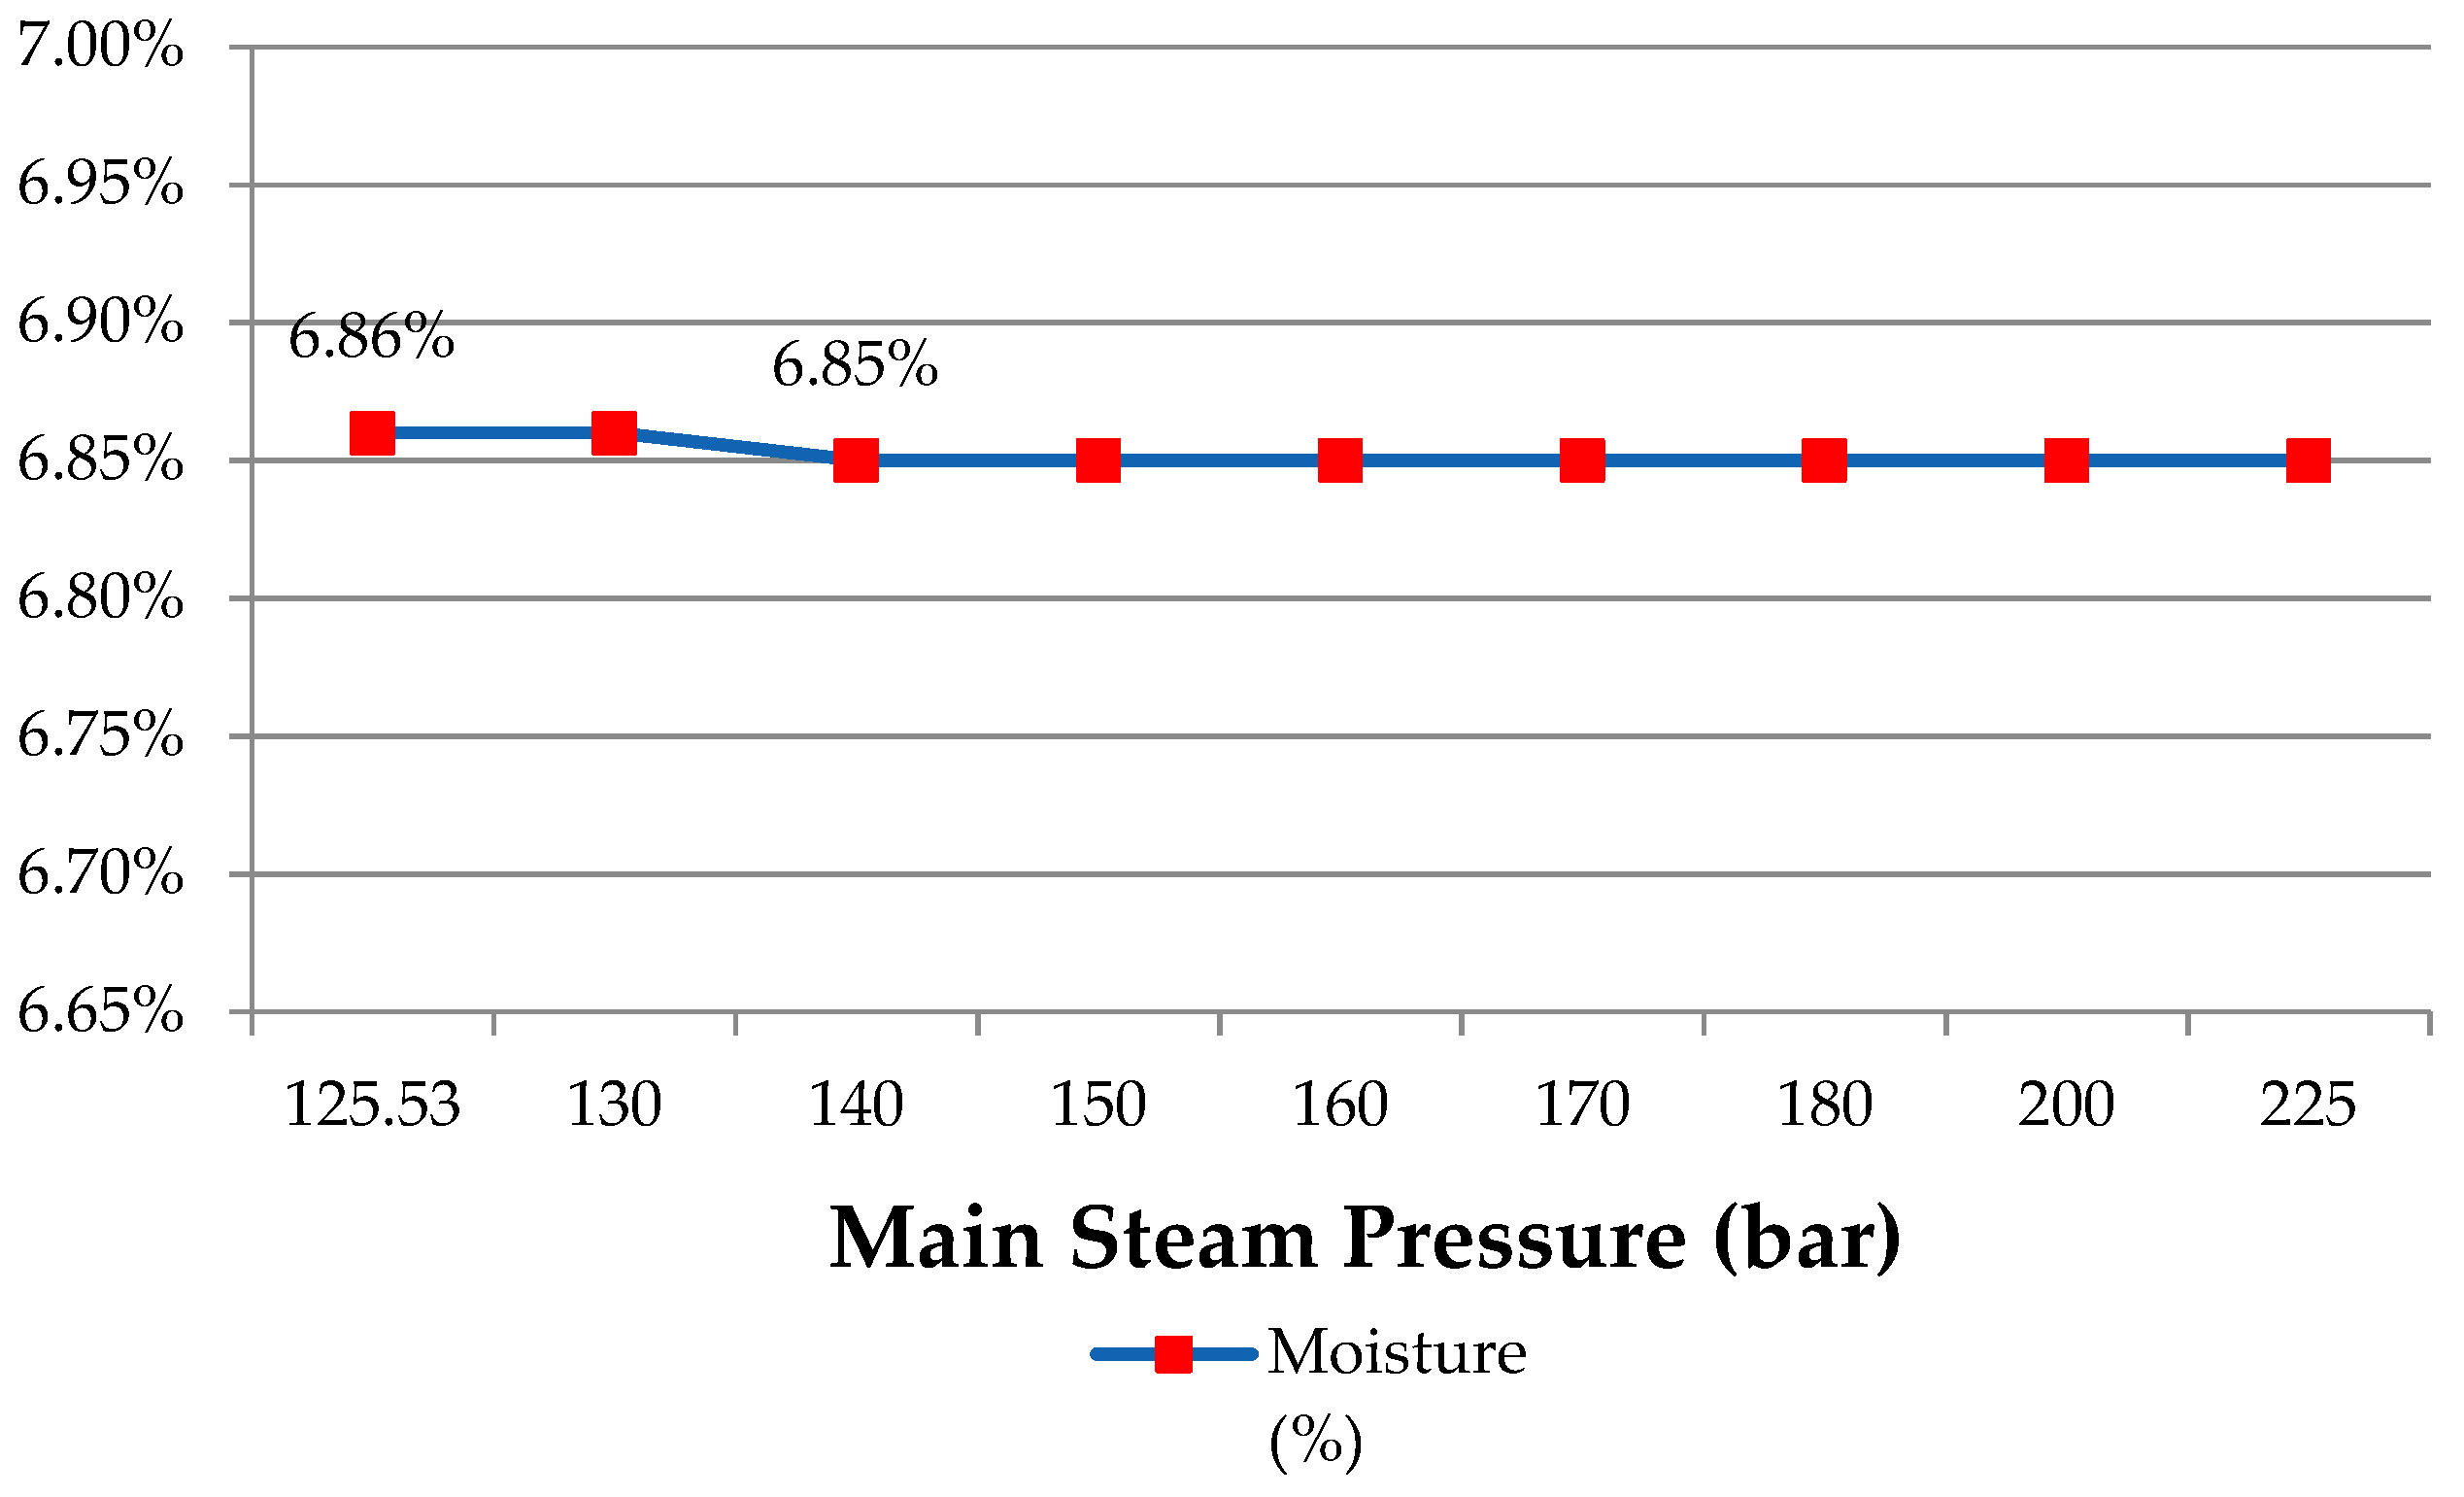
Figure 7 depicts the effects of the main stream pressure on moisture at the end of the process, the LP turbine cycle. Theoretically, when the pressure increases, the moisture at the end of the LP turbine cycle should increase. However,
Figure 7 it shows only a slight decrease.
Figure 6 shows the efficiencies of each process as the pressure increases in a perfect system.
Figure 7 depicts the simulation results which show the pressure is reduced after going through the IP cycle.
As can be seen, the pressure increase at the constant inlet temperature of the HP turbine does not relate to a pressure increase of the system. The enthalpy of the steam passing through the HP turbine therefore decreases. More steam must be extracted to satisfy the terminal temperature difference of the HP feed-water heater. This process of reheating steam pressure increases the efficiency of the IP turbine and the LP turbine slightly. The HP efficiency will also increase slightly as the inlet/outlet pressure ratio of the turbine increases with the reheating of steam pressure. Next, the simulation showed the effects of gradually increasing the temperature of the main steam reheating steam from 538 to 570 °C in scenario A.
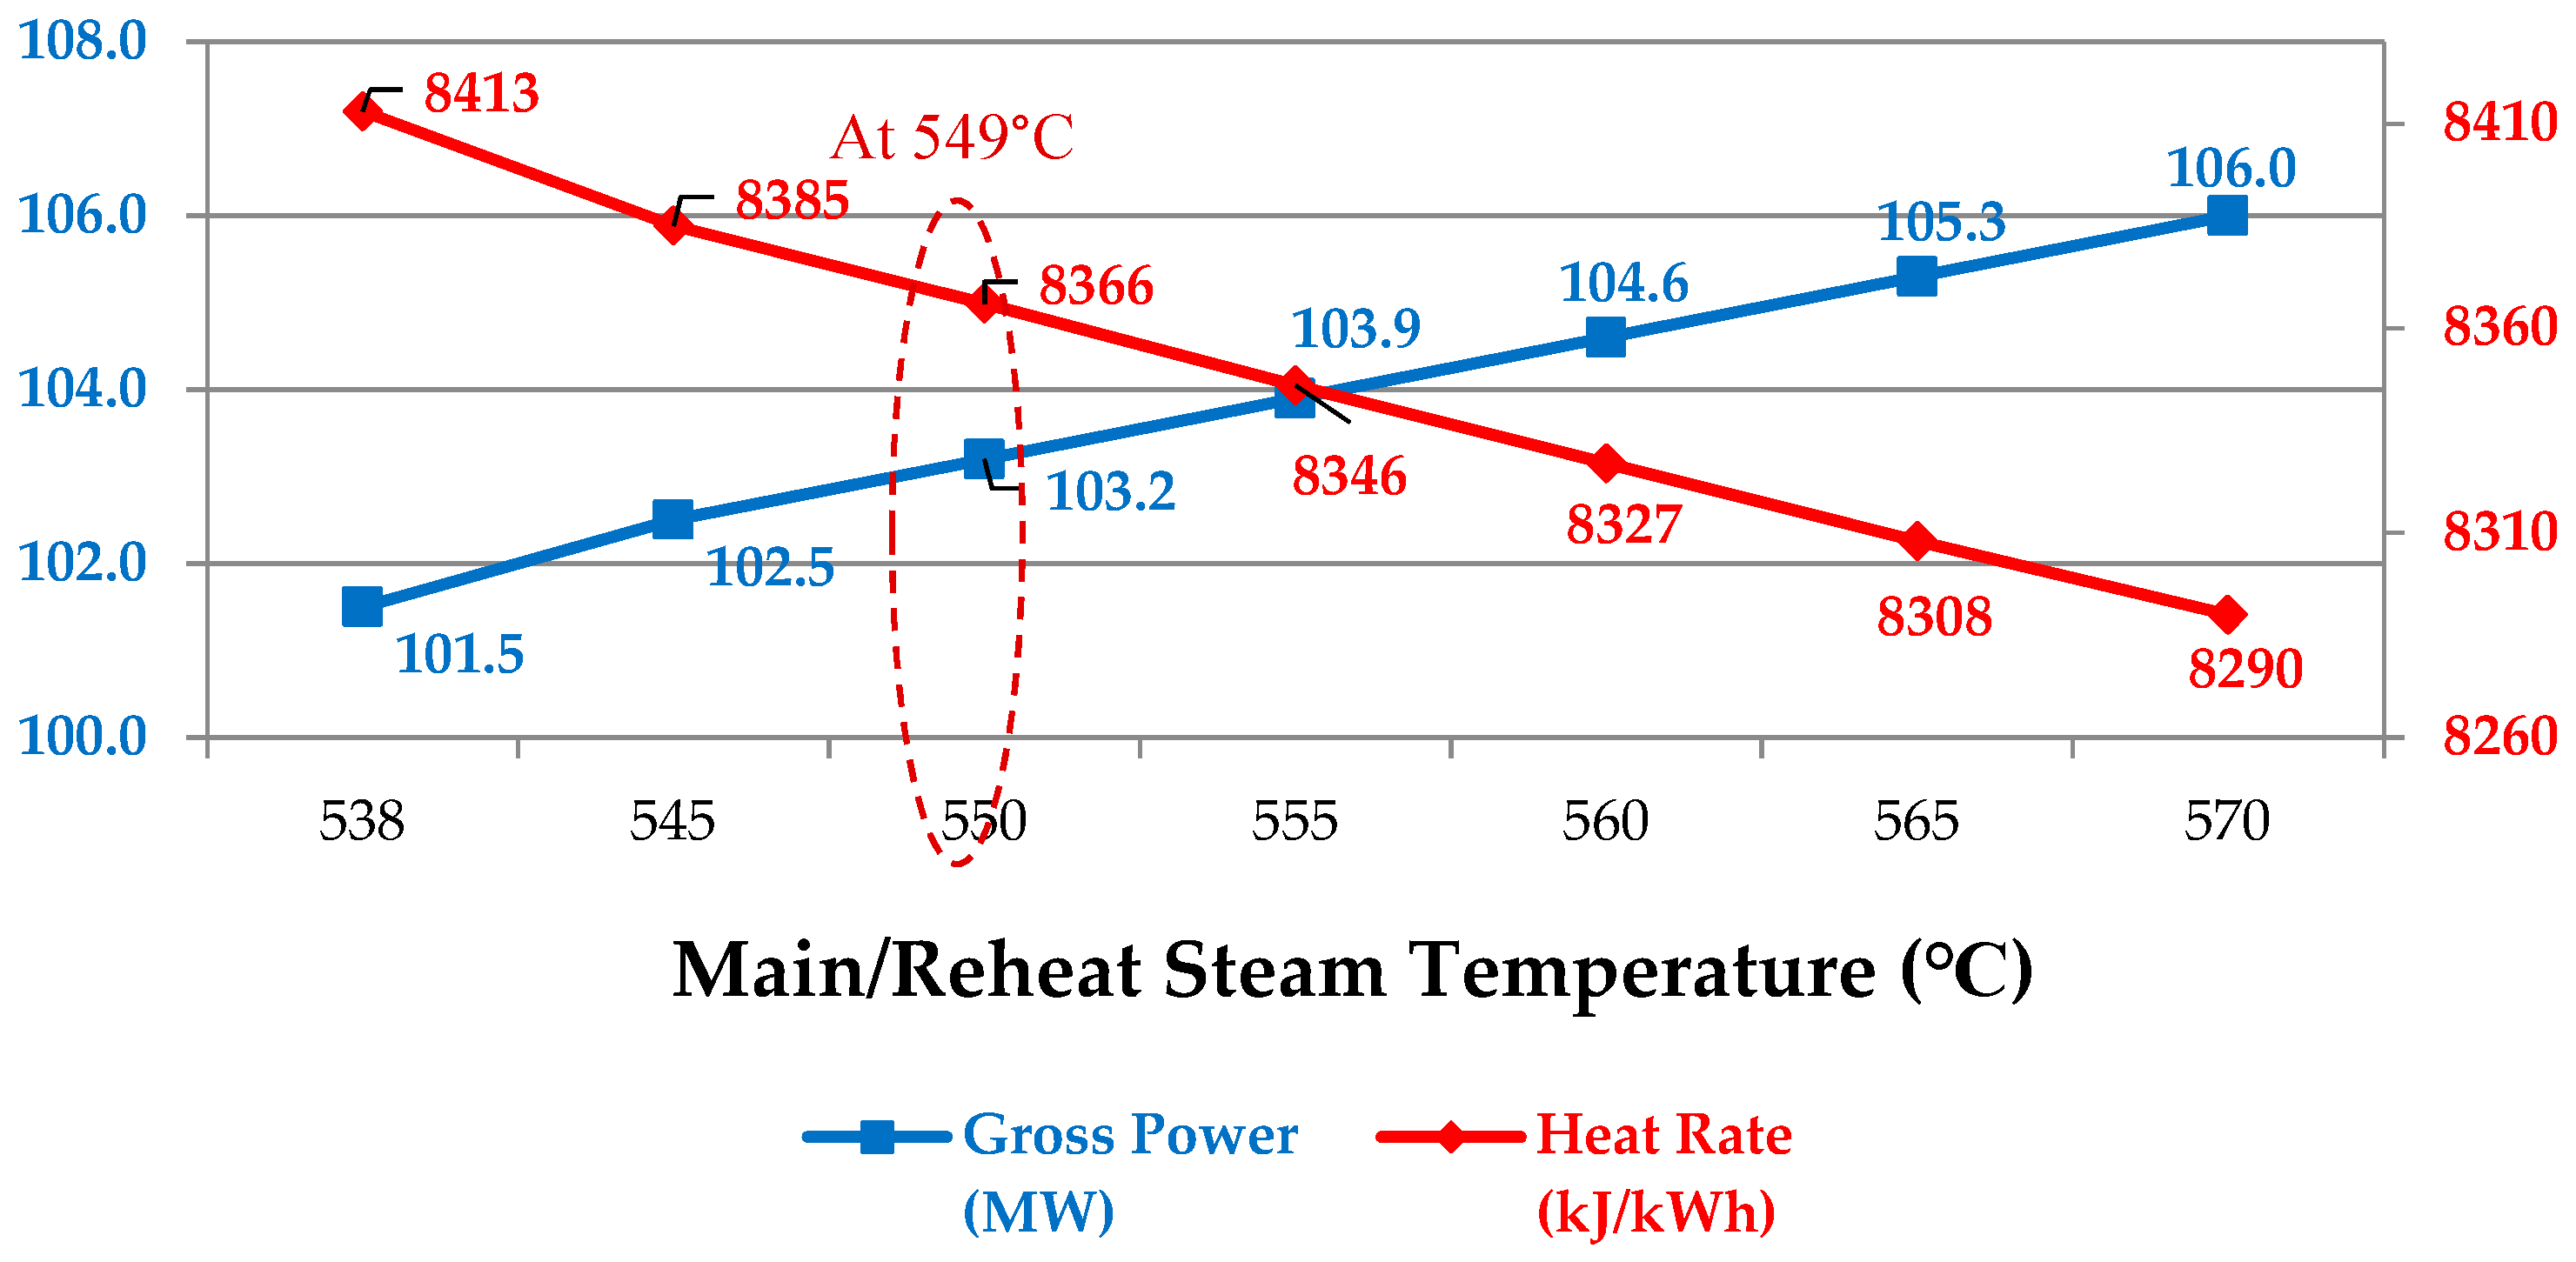
Figure 8 shows the changes in the heat rate and power output according to the increasing steam temperature. As can be seen, with an increase in heat, each variable improves.
The steam flow rate at the end of the HP turbine increased as less steam was required to be extracted and the steam has an increase in enthalpy. Furthermore, the volumetric flow increased due to increases in the steam temperature, which slightly increased the overall internal efficiency of the turbine. This is shown in
Figure 9 below.
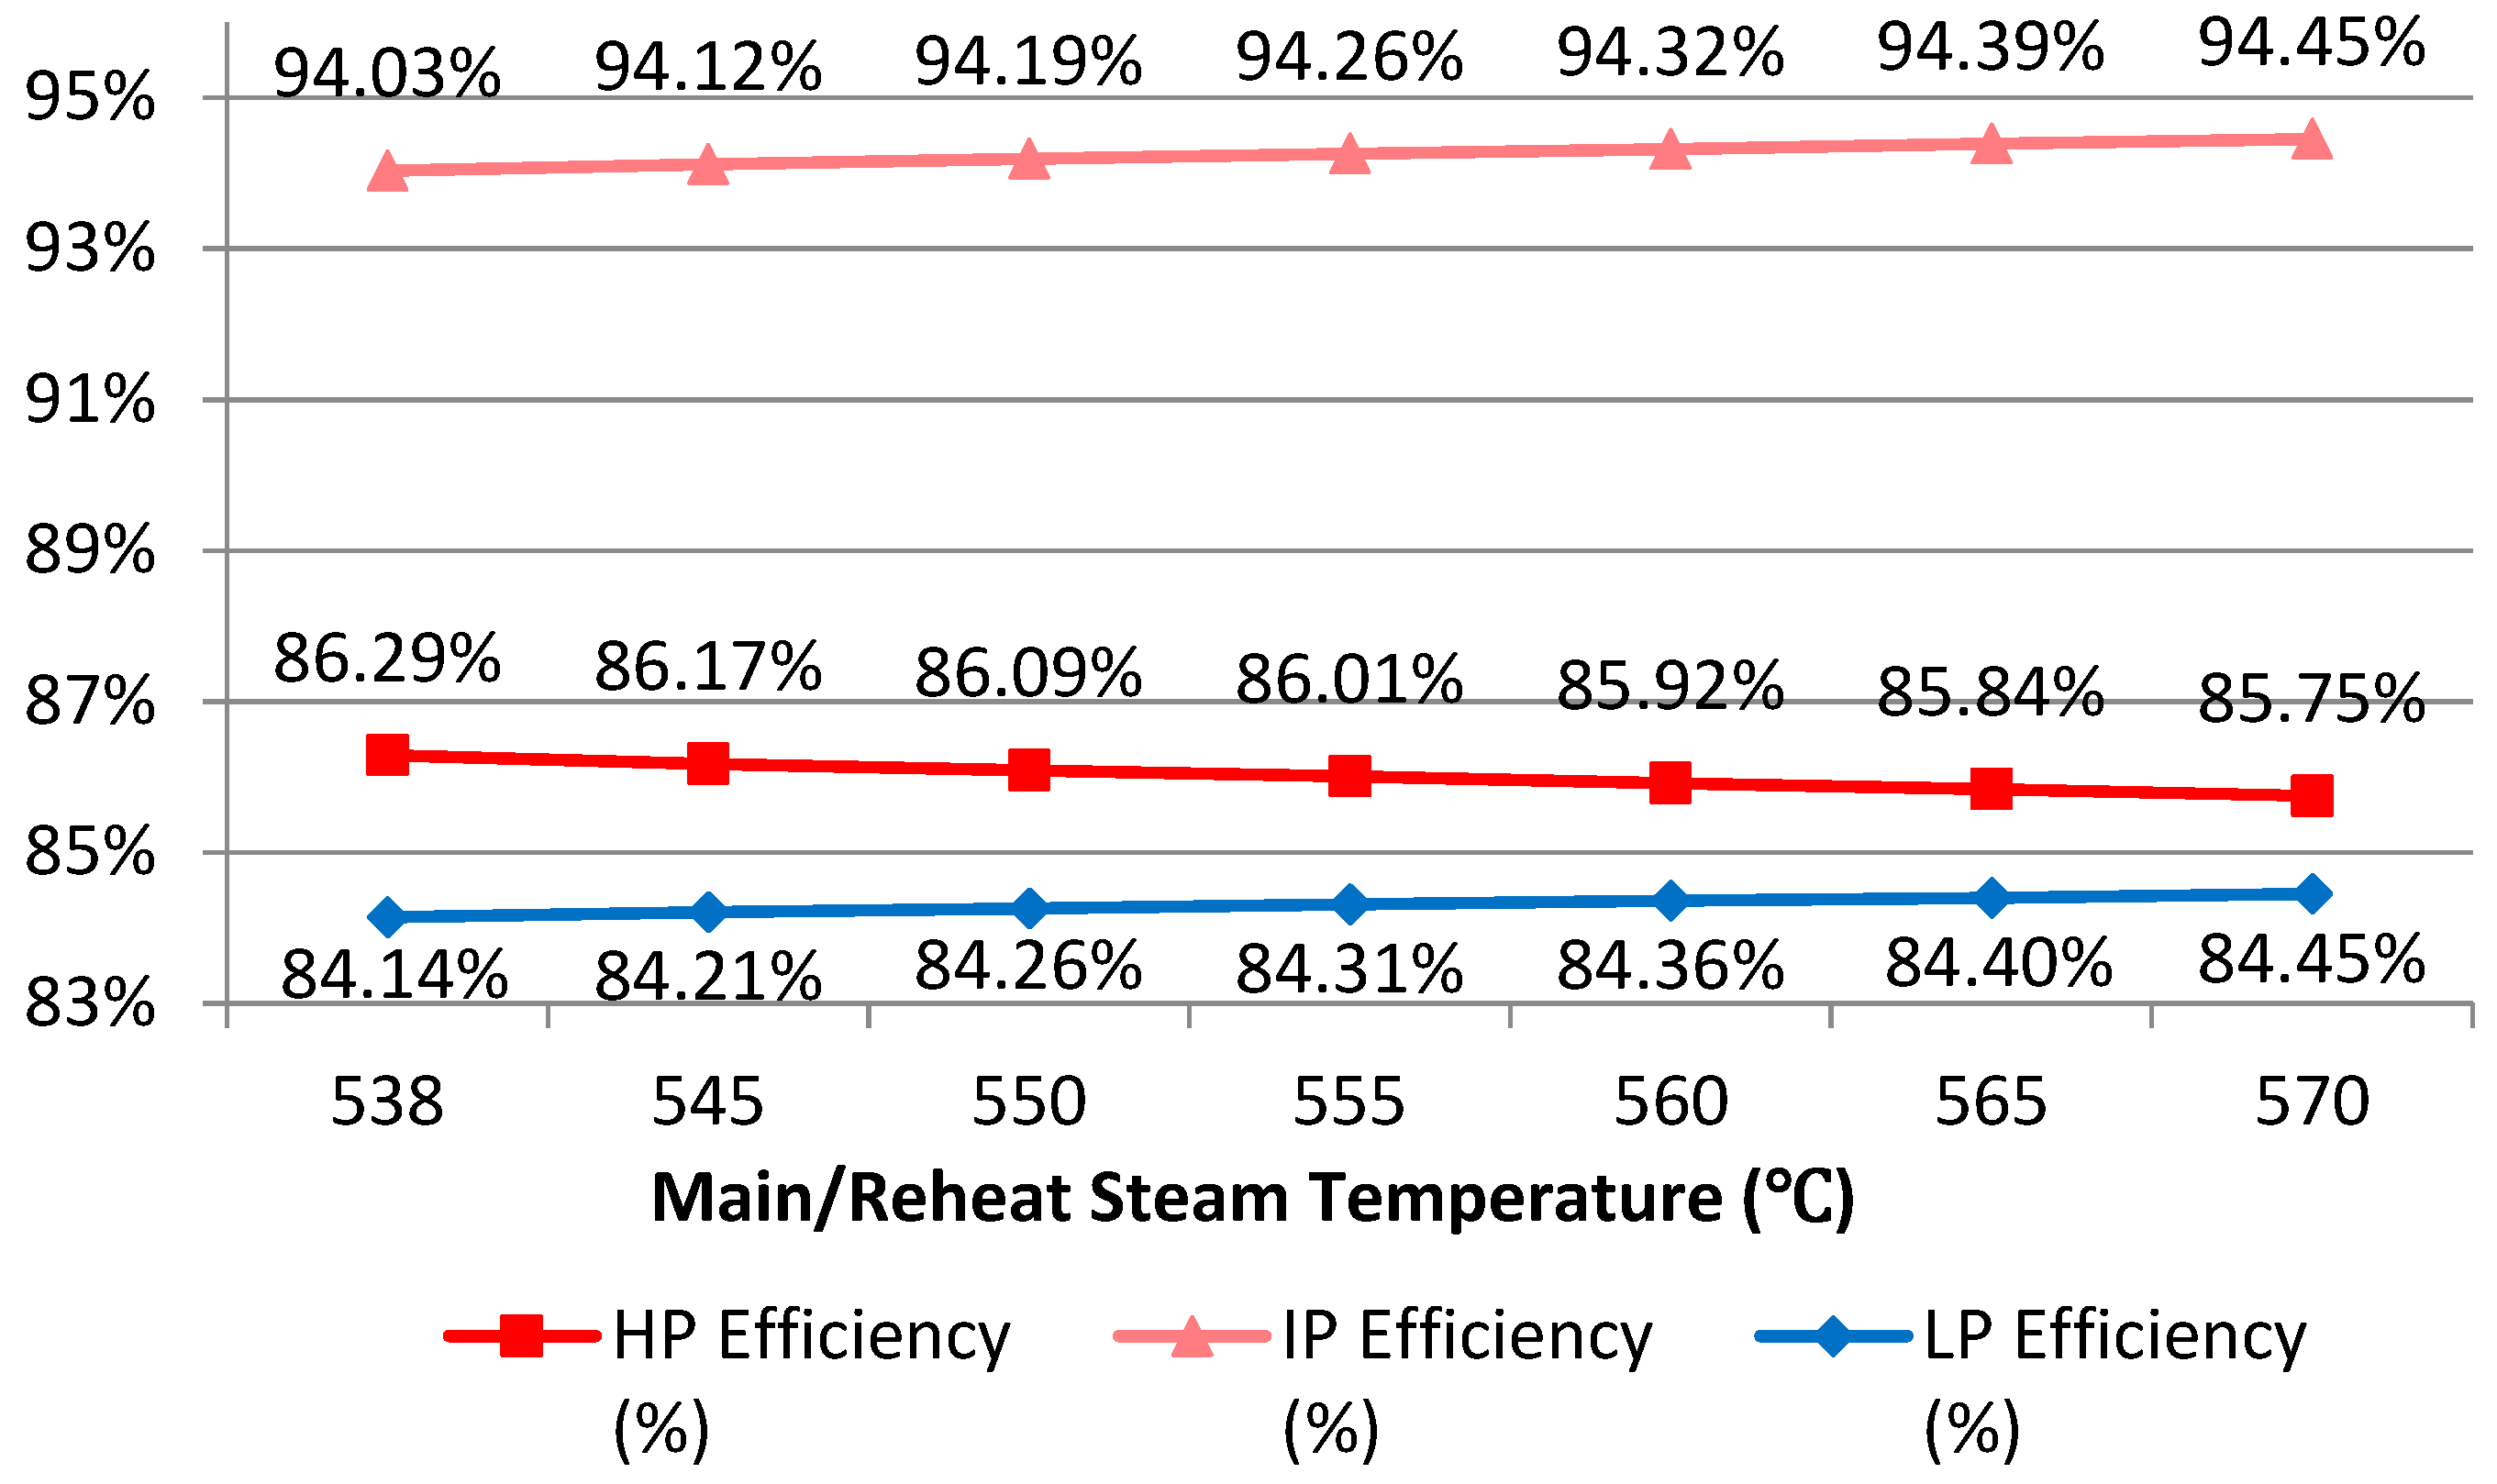
The increase in efficiencies of the IP and LP cycles, shown in
Figure 9, resulted from the decreased loss of moisture, shown in
Figure 10.
As the steam temperature increased, the exhaust loss from the LP turbine increased slightly from 11.3 kcal/kg to 11.8 kcal/kg. This is due to the increased flow of steam to the LP turbine, decreased moisture of the steam in the last stage of the turbine, and increased volumetric flow of steam. However, the increased enthalpy at the LP turbine outlet, which was caused by the increased exhaust loss, did not have much effect on the specific heat consumption. The summary of the results, optimum pressure and temperature, is shown in
Table 3. This scenario, applying the optimized temperature and pressure, is not possible in the turbines and a boiler currently in use. The design schematics of the turbine used in the Krakatau POSCO power plant allows a maximum pressure of 151.7 bar and maximum temperature of 549 °C.
Figure 5 and
Figure 8 depict that gross power optimization can realistically be performed up to approximately 103.2 MW. This represents scenario B and is shown in
Table 3, below.
Using the findings of optimum pressure and temperature, this study investigates the power generation efficiency of using off-gas for power production. In the next section, the power generation efficiencies of scenario A, B, and C are compared in detail.
5.3. Power Generation Efficiency
The previous findings depict the optimum pressure and temperature to be used for power plants utilizing any BFGs. This will ensure the plants are operating at maximum efficiency. Next, this paper investigates how the power generation efficiency is impacted by using the off-gases to produce power, scenario C. In scenario C, the cost of steam must be considered along with the production of power when energy is calculated by the cogeneration method using steam bleeding (i.e., steam extraction). The fuel cost required to produce heat with the steam extraction also needs to be considered to verify the efficiency of the method in terms of the total amount of energy reduced.
The main steam flow rate, pressure, and heat; reheat steam temperature and pressure; and heat rate are calculated through PEPSE simulation for scenario A and C generating 100 MW of power, as mentioned in
Section 4 (Research Methods) above. The steam parameters results are shown in
Table 4.
In comparing scenario A and scenario C, it should be noted that steam is a heat source that can be used for various processes and utilities. The steam can be used to generate profits by methods apart from power production. These scenarios, in which the steam is used in other processes, fall between scenario A and scenario C. Therefore, power and heat production will be considered together here when their overall effects and efficiency are examined. The differences in total amount of energy consumed can be determined by calculating the annual fuel consumption considering the annual operation time and load factor in the cogeneration method, comparing it to fuel consumption when power and heat are produced together in each system. As can be seen in
Table 4, scenario C’s required flow rate is as much as 94.186 kg/s to produce 100 MW of power. This results in scenario C consuming 143,215 Gcal more fuel in a year (calculated below) and is less energy efficient. In other words, scenario C (power generation + heat production) involves a ~10% increase in consumption cost compared to scenario A.
However, there exists savings in using the steam for the power generation. In scenario A, the increased fuel consumption to produce steam from separate system is 203,196 Gcal/yr. Thus:
Using a 17,000 KRW (South Korean won) per Gcal of coal as reported by the case study (unable to price off-gas so coal price is used), an annual fueling savings of
$1 M USD is experienced for scenario C in comparison to scenario A, shown below.
5.4. Life Cycle Cost Analysis
The LCCA method is considered an appropriate method for the economic analysis of power plants, including new off-gas power plants. For this analysis, the authors assumed that two off-gas (BFG and COG) thermal power plants with 100 MW capacity were constructed, and that the rules and conditions of the energy market in South Korea applied in their operation. The authors of this study have estimated the appropriate profitable investment cost and the appropriate fuel costs for BFG and COG based on the investment plans for previous similar studies [
25,
26,
27], although these have not yet been formally and publicly defined in the South Korean energy market.
This study uses the NPV, IRR, and DPP as methods of economic analysis. The NPV is the difference between the present value (PV) of the cash inflow expected from the investment plan and the PV of the investment (I), which can be said to be economical if it is greater than zero. This would indicate that the investment plan would result in the generation of profit [
25,
28]. The IRR is also referred to as the time-adjusted rate of return, which is the discount rate that equalizes the PV of the investment and the cash flow. This is the discount rate that results in an NPV of zero. Therefore, an investment plan is selected if the IRR is greater than the hurdle rate for foreign corporate investors in independent power producers, and it is rejected otherwise. The time value of the currency can be considered using the DPP [
25,
28].
Table 5 shows the coefficients for major input parameters required for the economic analysis. In determining the revenue from electricity, the average settlement price per unit of bituminous coal in the Korean electricity market in 2013 was the cost to which the profit correction factor was applied. Fuel, which accounts for most of the costs, was calculated by applying the average price of bituminous coal in 2013 per unit heat. Maintenance costs were determined using the sum of the unit prices for labor, repairs, and expenses in the total costs of a Korean power company in 2013. A discount rate of 8–10% has conventionally been applied in South Korea. However, recently, the Korea Development Institute (KDI) has suggested 5.5% as the discount rate for public investment projects, which was used in this study. An equipment lifespan of 25 years was set, and the depreciation cost was calculated using the fixed amount method, assuming a useful life of 20 years. The latter is based on Korean accounting regulations for domestic power generation companies and the Korean Internal Revenue Service. A corporate tax of 24.2% including resident tax was also applied [
5,
25,
26].
Using the values from
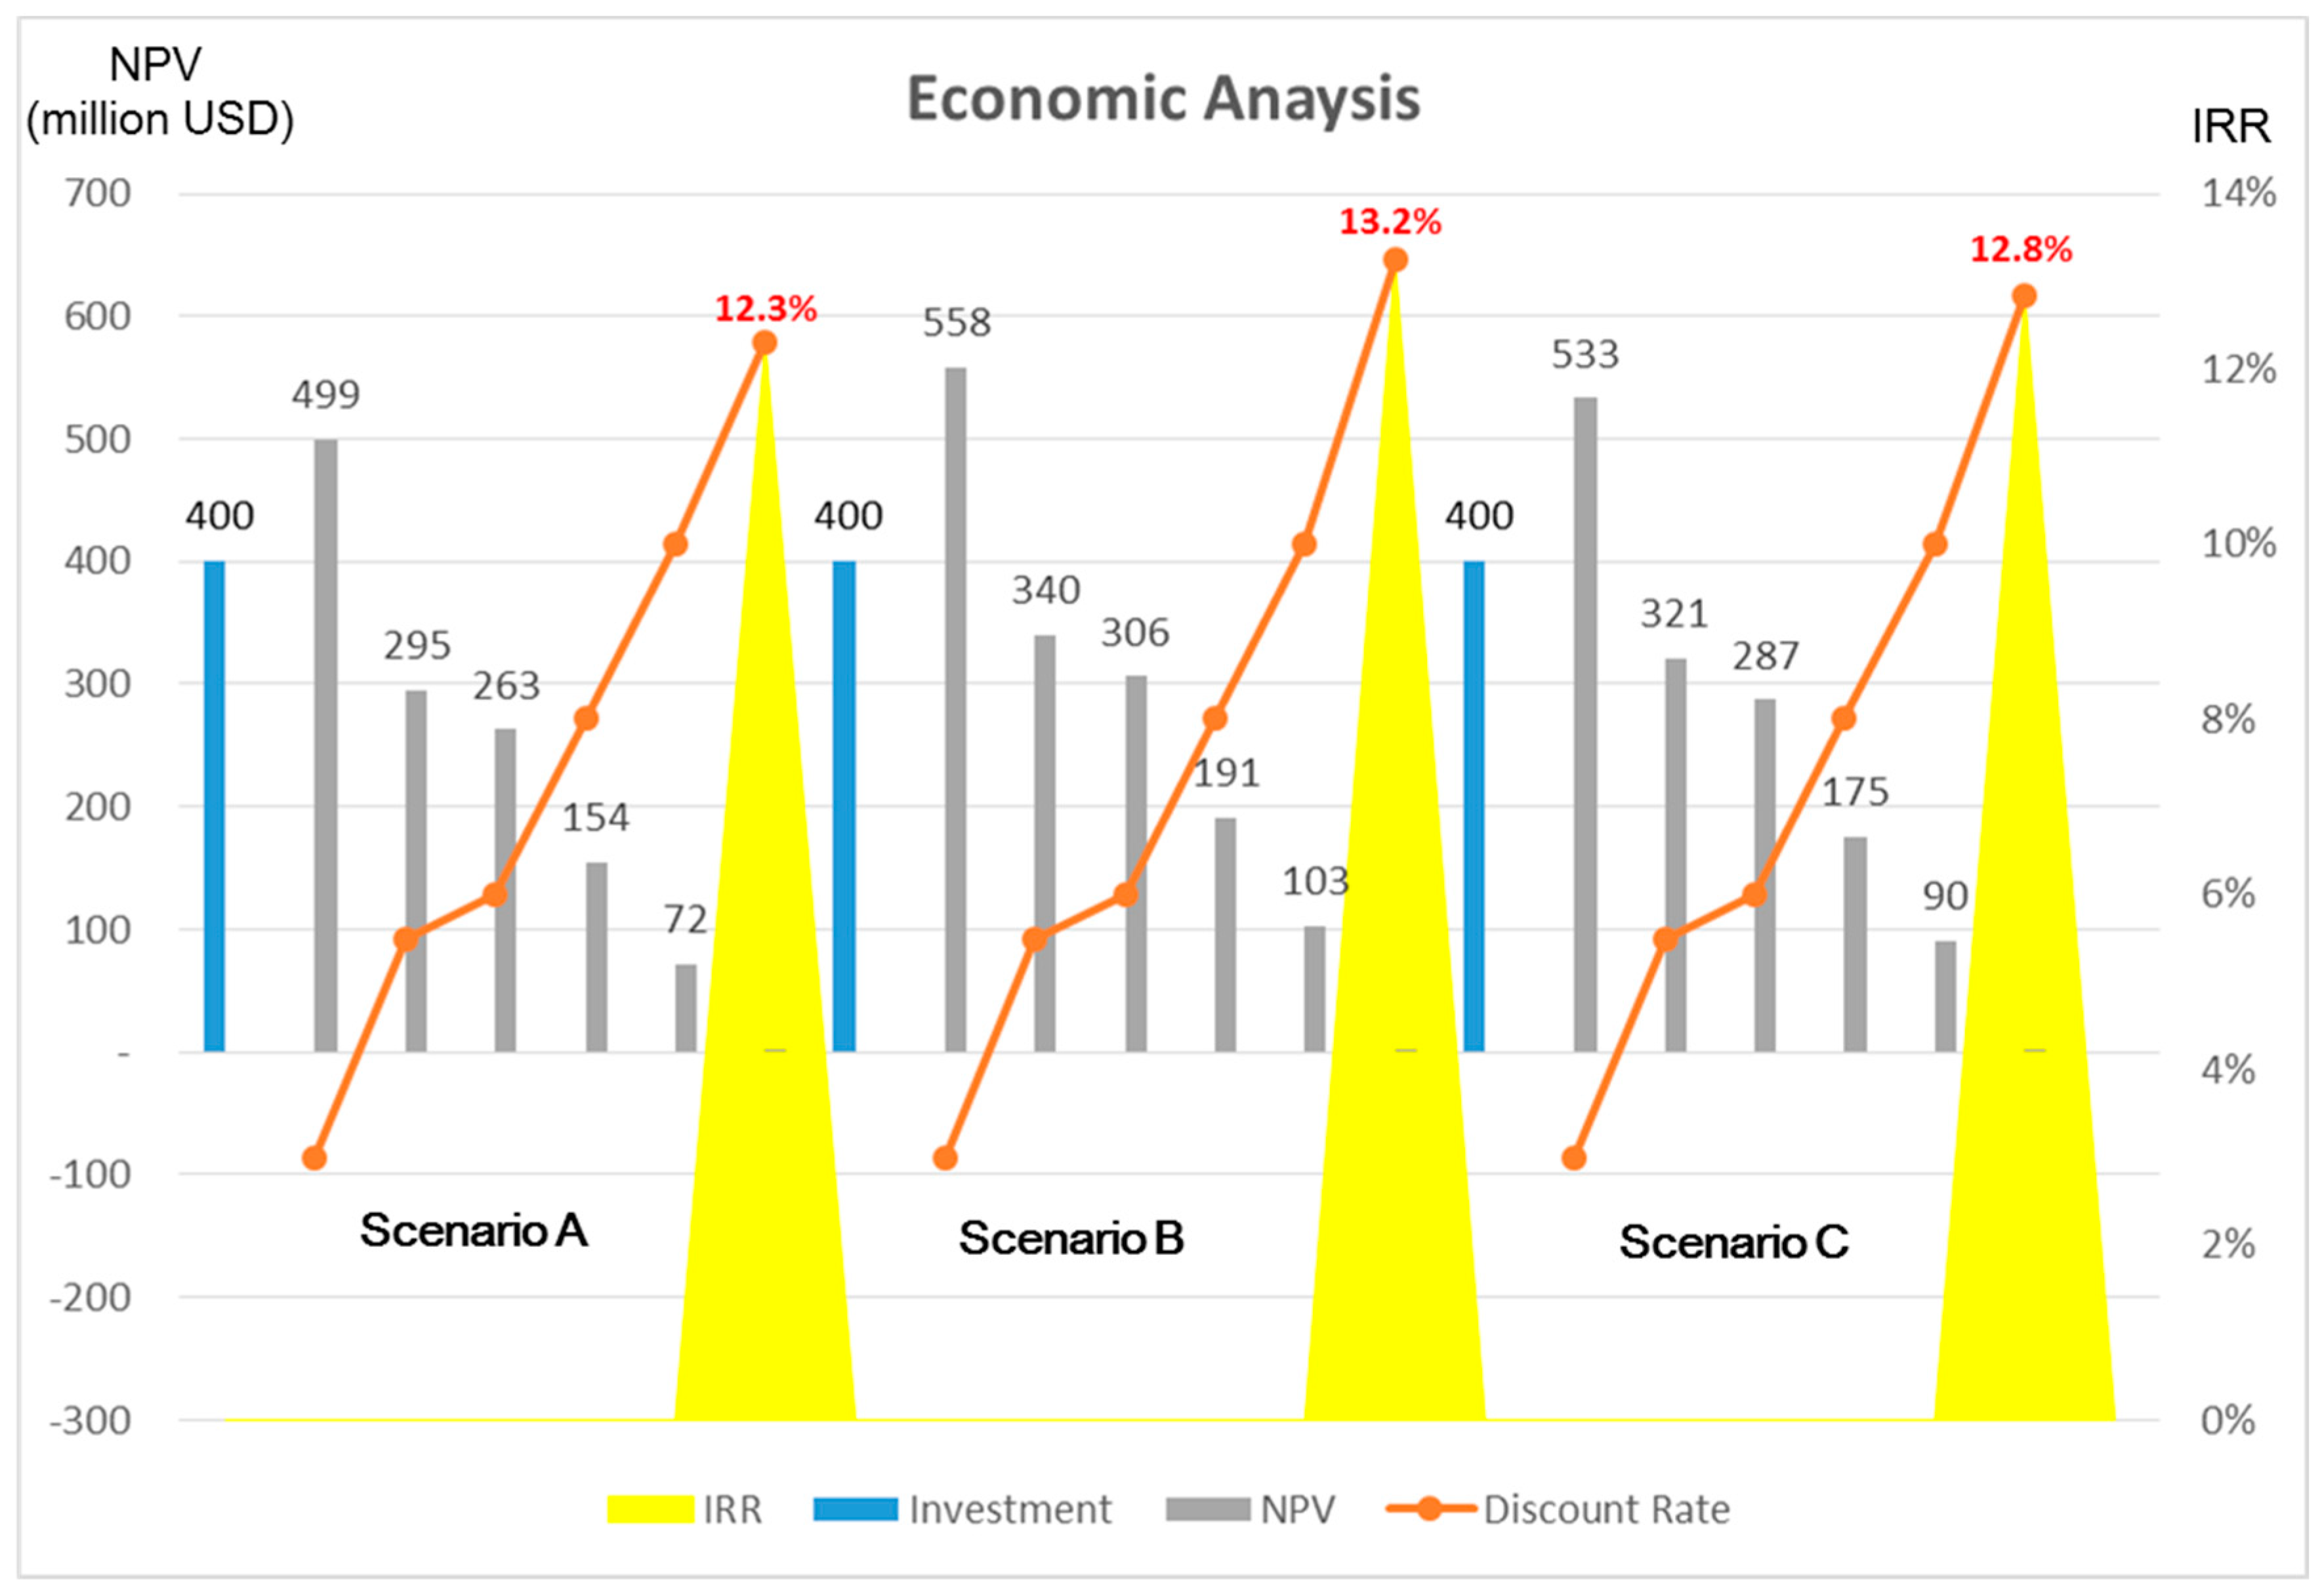
Table 5, an LCCA is performed for all three scenarios, assuming a 25-year expected lifespan. The results of this analysis are depicted in
Figure 11, an NPV-discount rate curve graphic for all three scenarios. From the figure, it is shown how changes in the discount rate used for the economic analysis impact the NPV of each scenario. The discount rates shown range from 3% to 10%, which encompass the South Korean suggested a range of 8–10% and KDI suggested 5.5%. While all NPVs are shown, this paper’s LCCA comparison focuses on the NPV values of the KDI suggested 5.5%
Using the discount rate of 5.5% and investment cost of 400 M USD, there can be seen a difference amongst the LCCA of each scenario. At the 25-year mark, the base case, scenario A, achieved an NPV of
$294 M USD with an IRR of 12.3%. In scenario B, it was assumed that there would be no changes in equipment or operations cost when they were operated at the optimal temperature of 549 °C because a substantial prediction is difficult practically. The optimal temperature results in an increase in power generation capacity to 103.2 per power plant, relating to an optimal NPV of
$339 M and IRR of 13.2%. Finally, in scenario C, the production of 45-ton steam is added for the process. This equates to a difference in the amount of feed-water required. As was described above, although there is an increase of 143,215 Gcal of fuel consumption per year, using the off-gas steam equates to an overall 4% energy savings in comparison to scenario A. This was reflected in economic analysis as a fuel cost saving. Through this, it can be seen in
Figure 11 that scenario C performs better than scenario A but worse than scenario B with an
$320 M USD NPV and an IRR of 12.8%.
The economic analysis shows us that the IRR is the highest for scenario B at 13.2% (power generation only with optimum model). Furthermore, the model shows that using off-gas-fired self-generation provides project savings through a reduction in fuel costs. From these findings, it is likely that an optimized plant which utilizes off-gas-fired self-generated power would provide project sponsors the greatest fiscal efficiency.
6. Conclusions
This study sought to investigate ways to improve the carbon emission-heavy coal fired power production industry. One proposed solution has been to use blast furnace gases, common byproducts of steel industry’s process. Therefore, this study aimed to both optimize the current blast furnace gas power production process and prove that using off-gases from the steel industry was financially viable. Using the PEPSE simulation model, and data from the currently operational Krakatau steel plant in Indonesia, this paper found 100 MW off-gas power plants run optimally at 103.2 MW at the maximum temperature of 549 °C. In comparing this optimal running temperature to typical operational temperatures, there was a 0.9% increase (12.3% vs. 13.2%) in the internal rate of return. This paper also studied the economic efficiency of using the off-gas byproduct as a power source. Assuming a 100 MW off-gas power plant used 45 tons of extracted steam for power production, there was a 0.5% increase (12.8% to 12.3%) in comparison to not using the off-gas byproduct. Finally, the optimization of the off-gas power plant and use of steam extraction was found to have a $45 M and $26 M USD savings in comparison to the base power plant, assuming a 5.5% discount rate and 400 Million USD capital expenditure.
The energy market in Korea is facing difficulties with both a continual decline in system marginal pricing and a worldwide consensus to discontinue coal-fired power plant funding. Any innovations in lowering the environmental impact and any increases in profit are necessary for the survival of these power plants.
7. Limitations and Future Research
There are limitations associated with the analysis and comparison of this paper. The blast furnace gases, which are generated from steel plants, have large fluctuations in their compositions. Also, their generation amount often varies according to the internal situation of the furnace. Due to the scope and data restrictions, the values applied in this study’s simulation and calculations are assumed to be constant in terms of composition and fuel amount.
The PEPSE simulation model, while evolving over the last 30 years, is still limited in its output data and accuracy. To enhance the application of the PEPSE, the authors believe that the simulation should be expanded to a steam cycle including all main equipment, especially the boiler. This study assumed that the boiler efficiency was constant because the simulation focused on improving the efficiency of the turbine steam cycle. However, additional boiler computation models should be developed because they are able to analyze the combined effects of the fuel characteristics and the steam generation efficiency inside the boiler. The simulations using PEPSE also need to be performed in a design mode instead of a performance mode. The performance mode assumes that source parameters such as boiler design are set constant since they are incorporated in the design information for the feed-water. The assumptions of terminal temperature difference and drain cooler approach are is not realistic for operational power plants.
To reflect the actual performance analysis model in operation, simulations should be conducted in the design-mode that reflects the detailed design data of the feed-water heaters. In addition, the steam extraction point needs to be optimized because it improves the condition of the steam cycle. In particular, the quantity of steam extraction by a high-pressure turbine has great effects on downstream of the intermediate and low-pressure turbines and extracts a greater quantity of steam. Therefore, a structure that can minimize the internal loss of steam in the turbine and position the steam extracting point appropriately should be selected to maximize performance, given the balance of the overall system. Concerning the fiscal performance, to calculate the capital expenditures more accurately, further systematic research is required, e.g., focusing on piping and instrumentation diagrams, heat balance, detailed estimation of the main equipment, and the balance of all processes, should be examined according to the changes in the steam conditions.


