Article

Carbon Mitigation Pathway Evaluation and Environmental Benefit Analysis of Mitigation Technologies in China’s Petrochemical and Chemical Industry

1
Academy of Chinese Energy Strategy, China University of Petroleum, Beijing 102240, China
2
Policy Research Center for Environment and Economy of the Ministry of Environmental Protection, Beijing 100029, China
*
Author to whom correspondence should be addressed.
Energies 2018, 11(12), 3331; https://doi.org/10.3390/en11123331
Submission received: 1 October 2018 / Revised: 27 November 2018 / Accepted: 27 November 2018 / Published: 29 November 2018
(This article belongs to the Special Issue Energy and Environment)

Abstract

:
The co-benefits of mitigation technology in China’s petrochemical and chemical industry have not been evaluated, although they are deemed valuable for the cost-benefit analysis of carbon mitigation. On this basis, this study evaluates the carbon mitigation effects and environmental co-benefits of mitigation technologies that have been long ignored in China’s petrochemical and chemical industry. In addition, this study also fills the gap of provincial research in chemical industry. A bottom-up energy model and marginal abatement cost curves are constructed for each sector. The study is based on national and provincial levels to provide quantitative reference for the mitigation technologies. Results show that, among 18 technologies in the chemical industry, waste heat utilization and technological process transformation technologies have the highest marginal abatement benefits. Technologies in the petrochemical industry with the largest marginal abatement social benefit typically exists in three categories: efficiency improvement technology, waste heat utilization technology, and coating technology. At the national level, 8039 and 5105 premature deaths are effectively avoided by the promotion of chemical and petrochemical mitigation technologies, respectively. Monetary value of health impact in these two industries are 7.0 billion and 5.5 billion RMB, respectively. At the provincial level, coal gasification multi-generation gas turbine power generation technology, a technological process transformation technology, performs well in Shaanxi province with 122 million RMB of total social benefit.

1. Introduction

China is facing environmental challenges, such as the global effects of curbing CO2 emissions and local air pollution and public health [1,2,3]. Environmental problems are a hot issue concerning the whole region, with specific industrial characteristics [4]. Focusing on the environmental impact and social cost of technology promotion will promote the progress of the industrial emission roadmap. To tackle the complicated environmental problem, academia has done great efforts. Some scholars have analyzed correlations between CO2 and other local pollutants, such as SO2, soot, and particulate matter (PM). On the basis of factor demand theory in economics, Li et al. [5] (2017) discovered that co-benefits would achieve a co-control policy in the mitigation of local pollutants and CO2 emission. Yang et al. [6] calculated CO2 and PM2.5 emissions and discovered positive correlations between consumption-based and production-based perspectives. In view of the positive correlation between CO2 and SO2 or PM, Zeng et al. [3] constructed a systemic framework for a co-control plan. They found that the reduction gains in Urumqi were 930 tons of SO2, 3170 tons of NOx, 5296 tons of PM10, and cost savings of 6.7 billion RMB per year [3]. Liu et al. and Jiang et al. [7,8] emphasized the significance of regional governmental cooperation in conducting a co-control policy. Furthermore, Dong et al. [2] discovered that the real co-benefits of emission reductions for SO2, NOx, and PM2.5 will reach 2.4, 2.1, and 0.3 Mt in 2020, respectively.
Past co-benefit studies have shown that the environmental co-benefits should be analyzed for whole sectors at the activity level, or focused on one specific sector on a technological levels. Peng et al. [4] analyzed the air quality and climate impacts in four sectors. They concluded that the industry sector benefits most from technology upgrades and fuel switching strategies, with a reduction of air-pollution-related death of 2.8% [4]. Yang et al. [9] found that in the building sector, the GDP losses saved from health benefits in 2020, 2030, and 2050 will reach 0.13%, 0.16%, and 0.23%, respectively, in co-control scenarios compared with reference scenarios. Xie et al. [10] found that 0.79% of GDP investment in PM2.5 control would yield 1.17% of GDP benefits. Yang et al. [11] found that the carbon mitigation cost can be compensated by environmental benefits, thereby resulting in net benefit of 0.06% of the GDP. Gao et al. [12] calculated the GDP losses in Beijing due to PM2.5 pollution in 2011 and obtained a result of 0.17–0.33% of GDP.
Besides power-generation and transportation sectors, industry sectors account largely for local pollutant emissions. Regarding industry sub-sectors, scholars have focused on the cement sector and iron and steel sector. In a study of the cement sector, Yang et al. [13] incorporated environmental co-benefits into marginal abatement cost, and suggested policy-makers integrate co-benefits into decision-making. Zhang et al. [14] discovered that energy efficiency measures would result in a 20% decline of the marginal cost; moreover, they analyzed the co-benefits at the provincial level and demonstrated the significance of integrating the energy efficiency and air quality policies [15]. Li et al. [16] emphasized the substantial role played by carbon taxes in the cement sector. On the basis of the national China-TIMES Model, Ma et al. [17] investigated the declining trends of local pollutants and GHG from iron and steel production, and calculated the co-benefits of the reduction measures; the results were 45.7–91.6 Mt of CO2, 114.5–256.4 Kt of SO2, and 20.2–49.9 Kt of PM2.5. Zhang et al. [18] estimated the co-benefits of implementing an energy efficiency policy and end-of-pipe emission policy in the iron and steel industry simultaneously, and found that large co-benefits exist, wherein emission mitigation of GHGs and air pollutants were 463 Mt of CO2eq, 253 Kt of PM, and 1392 Kt of SO2 [18].
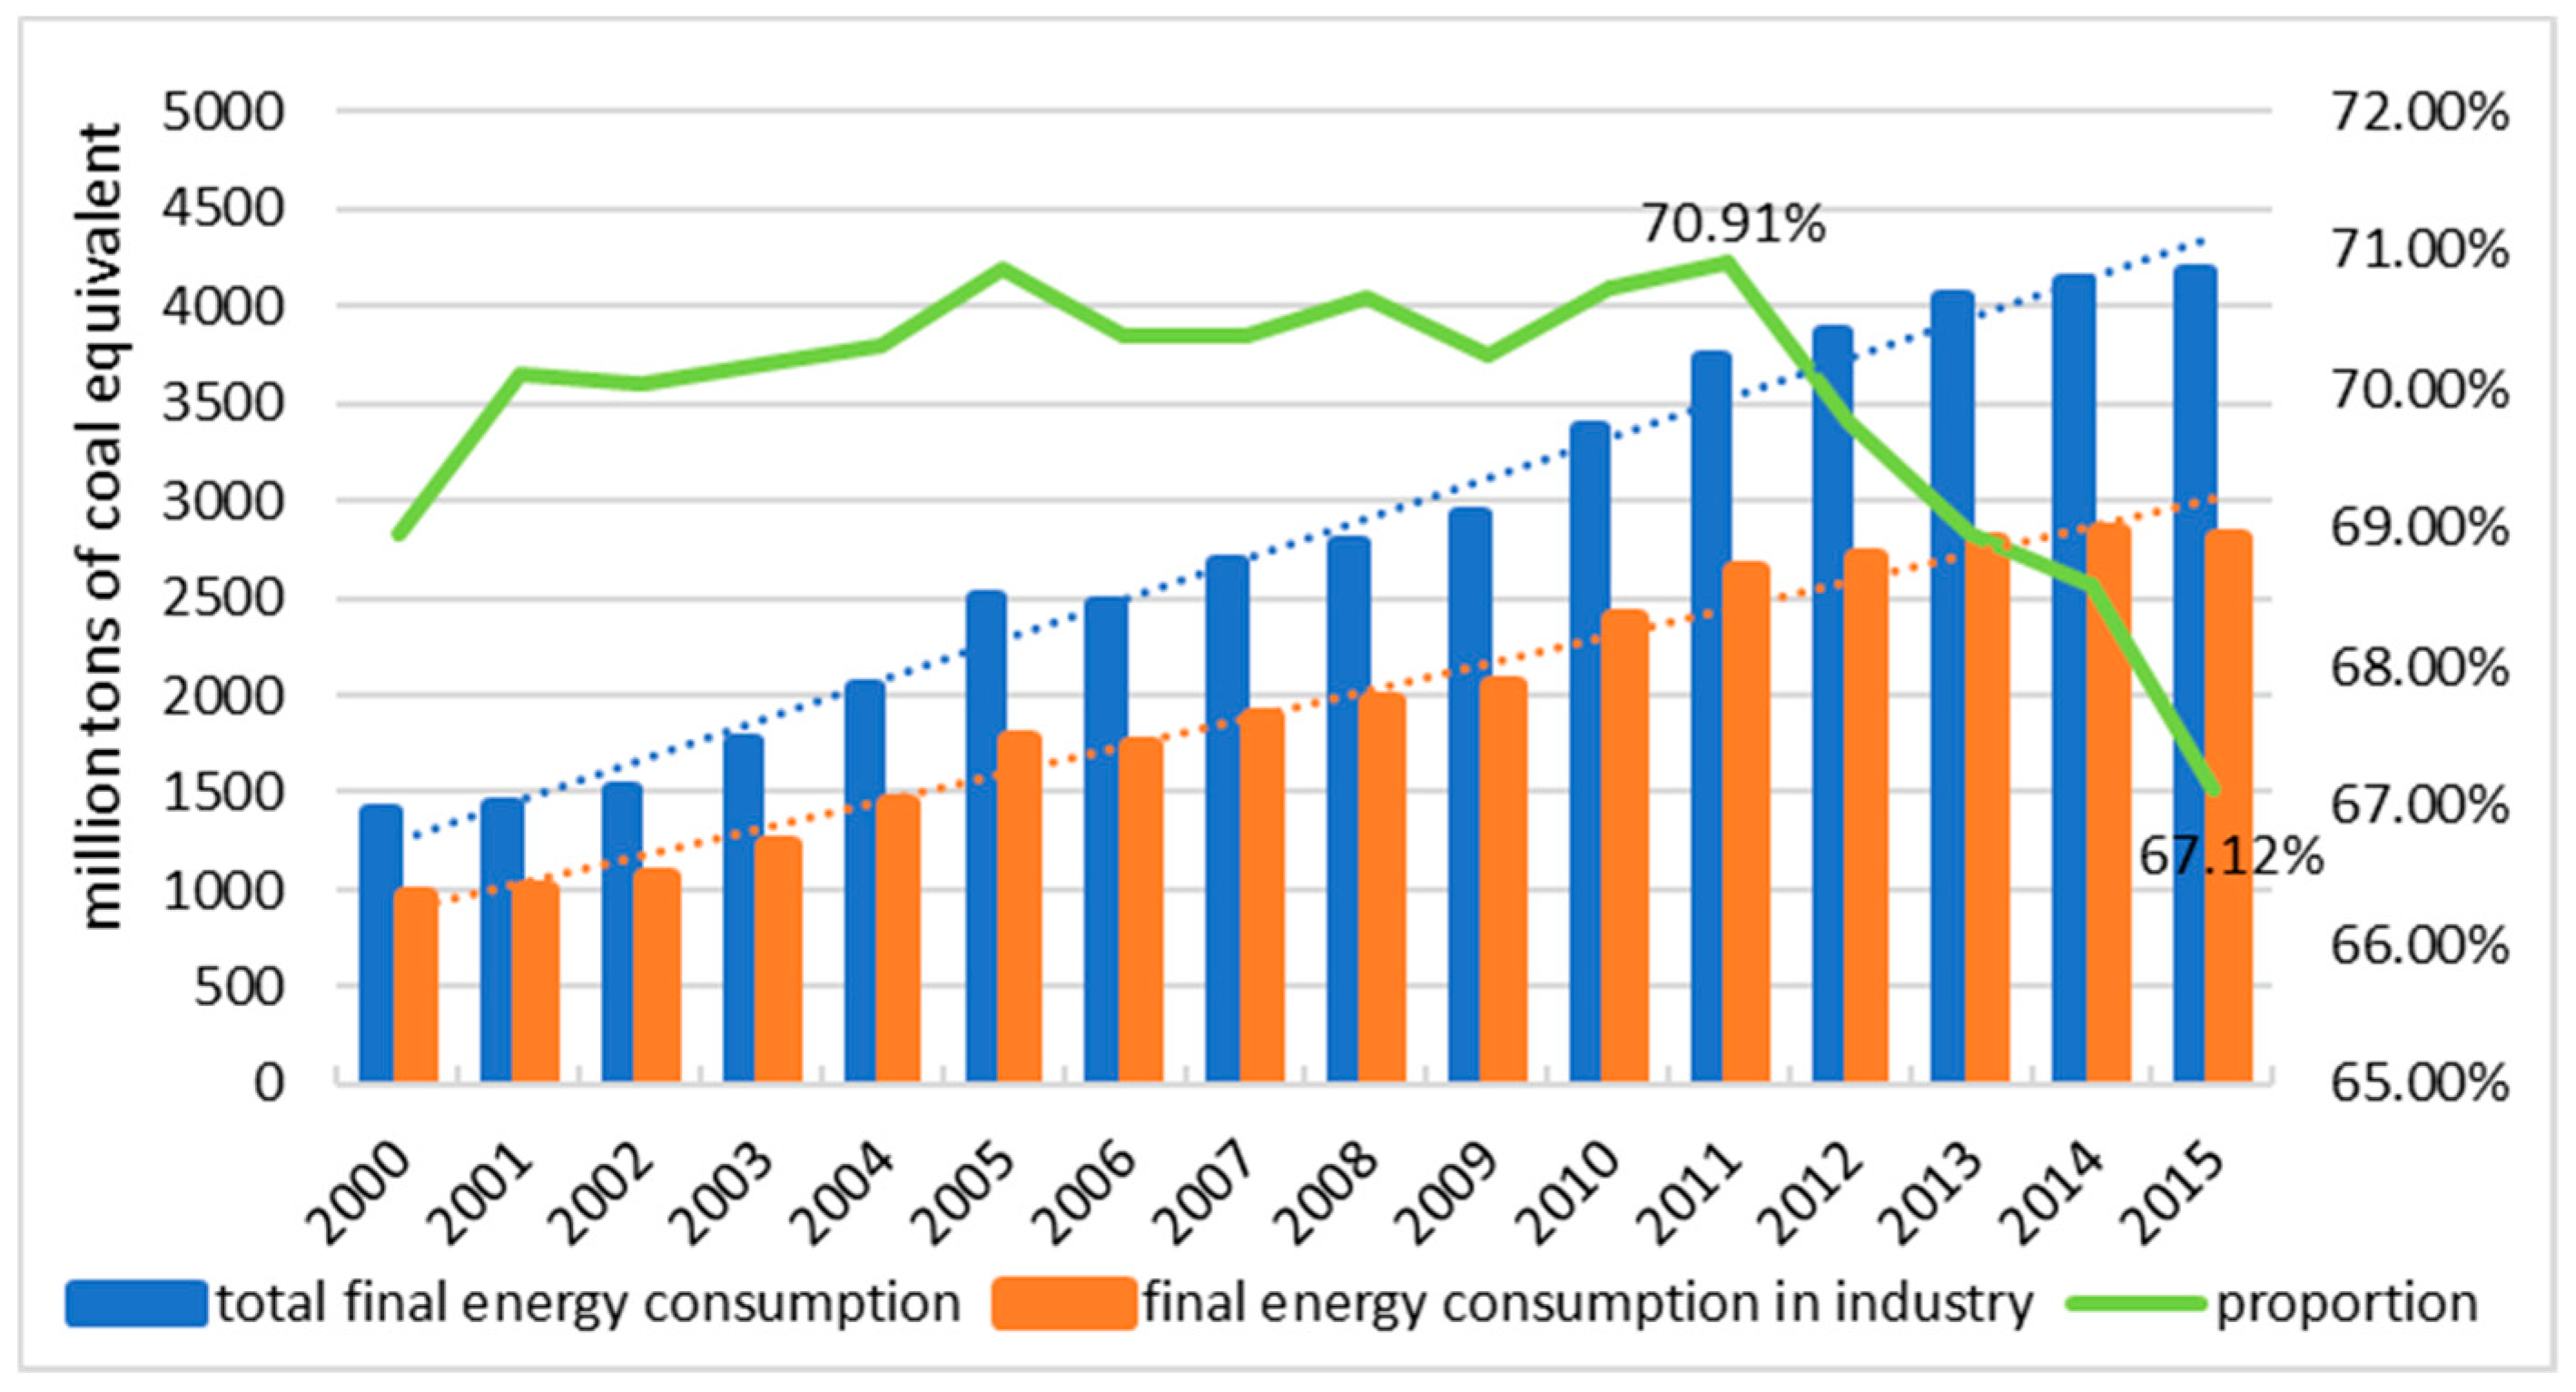
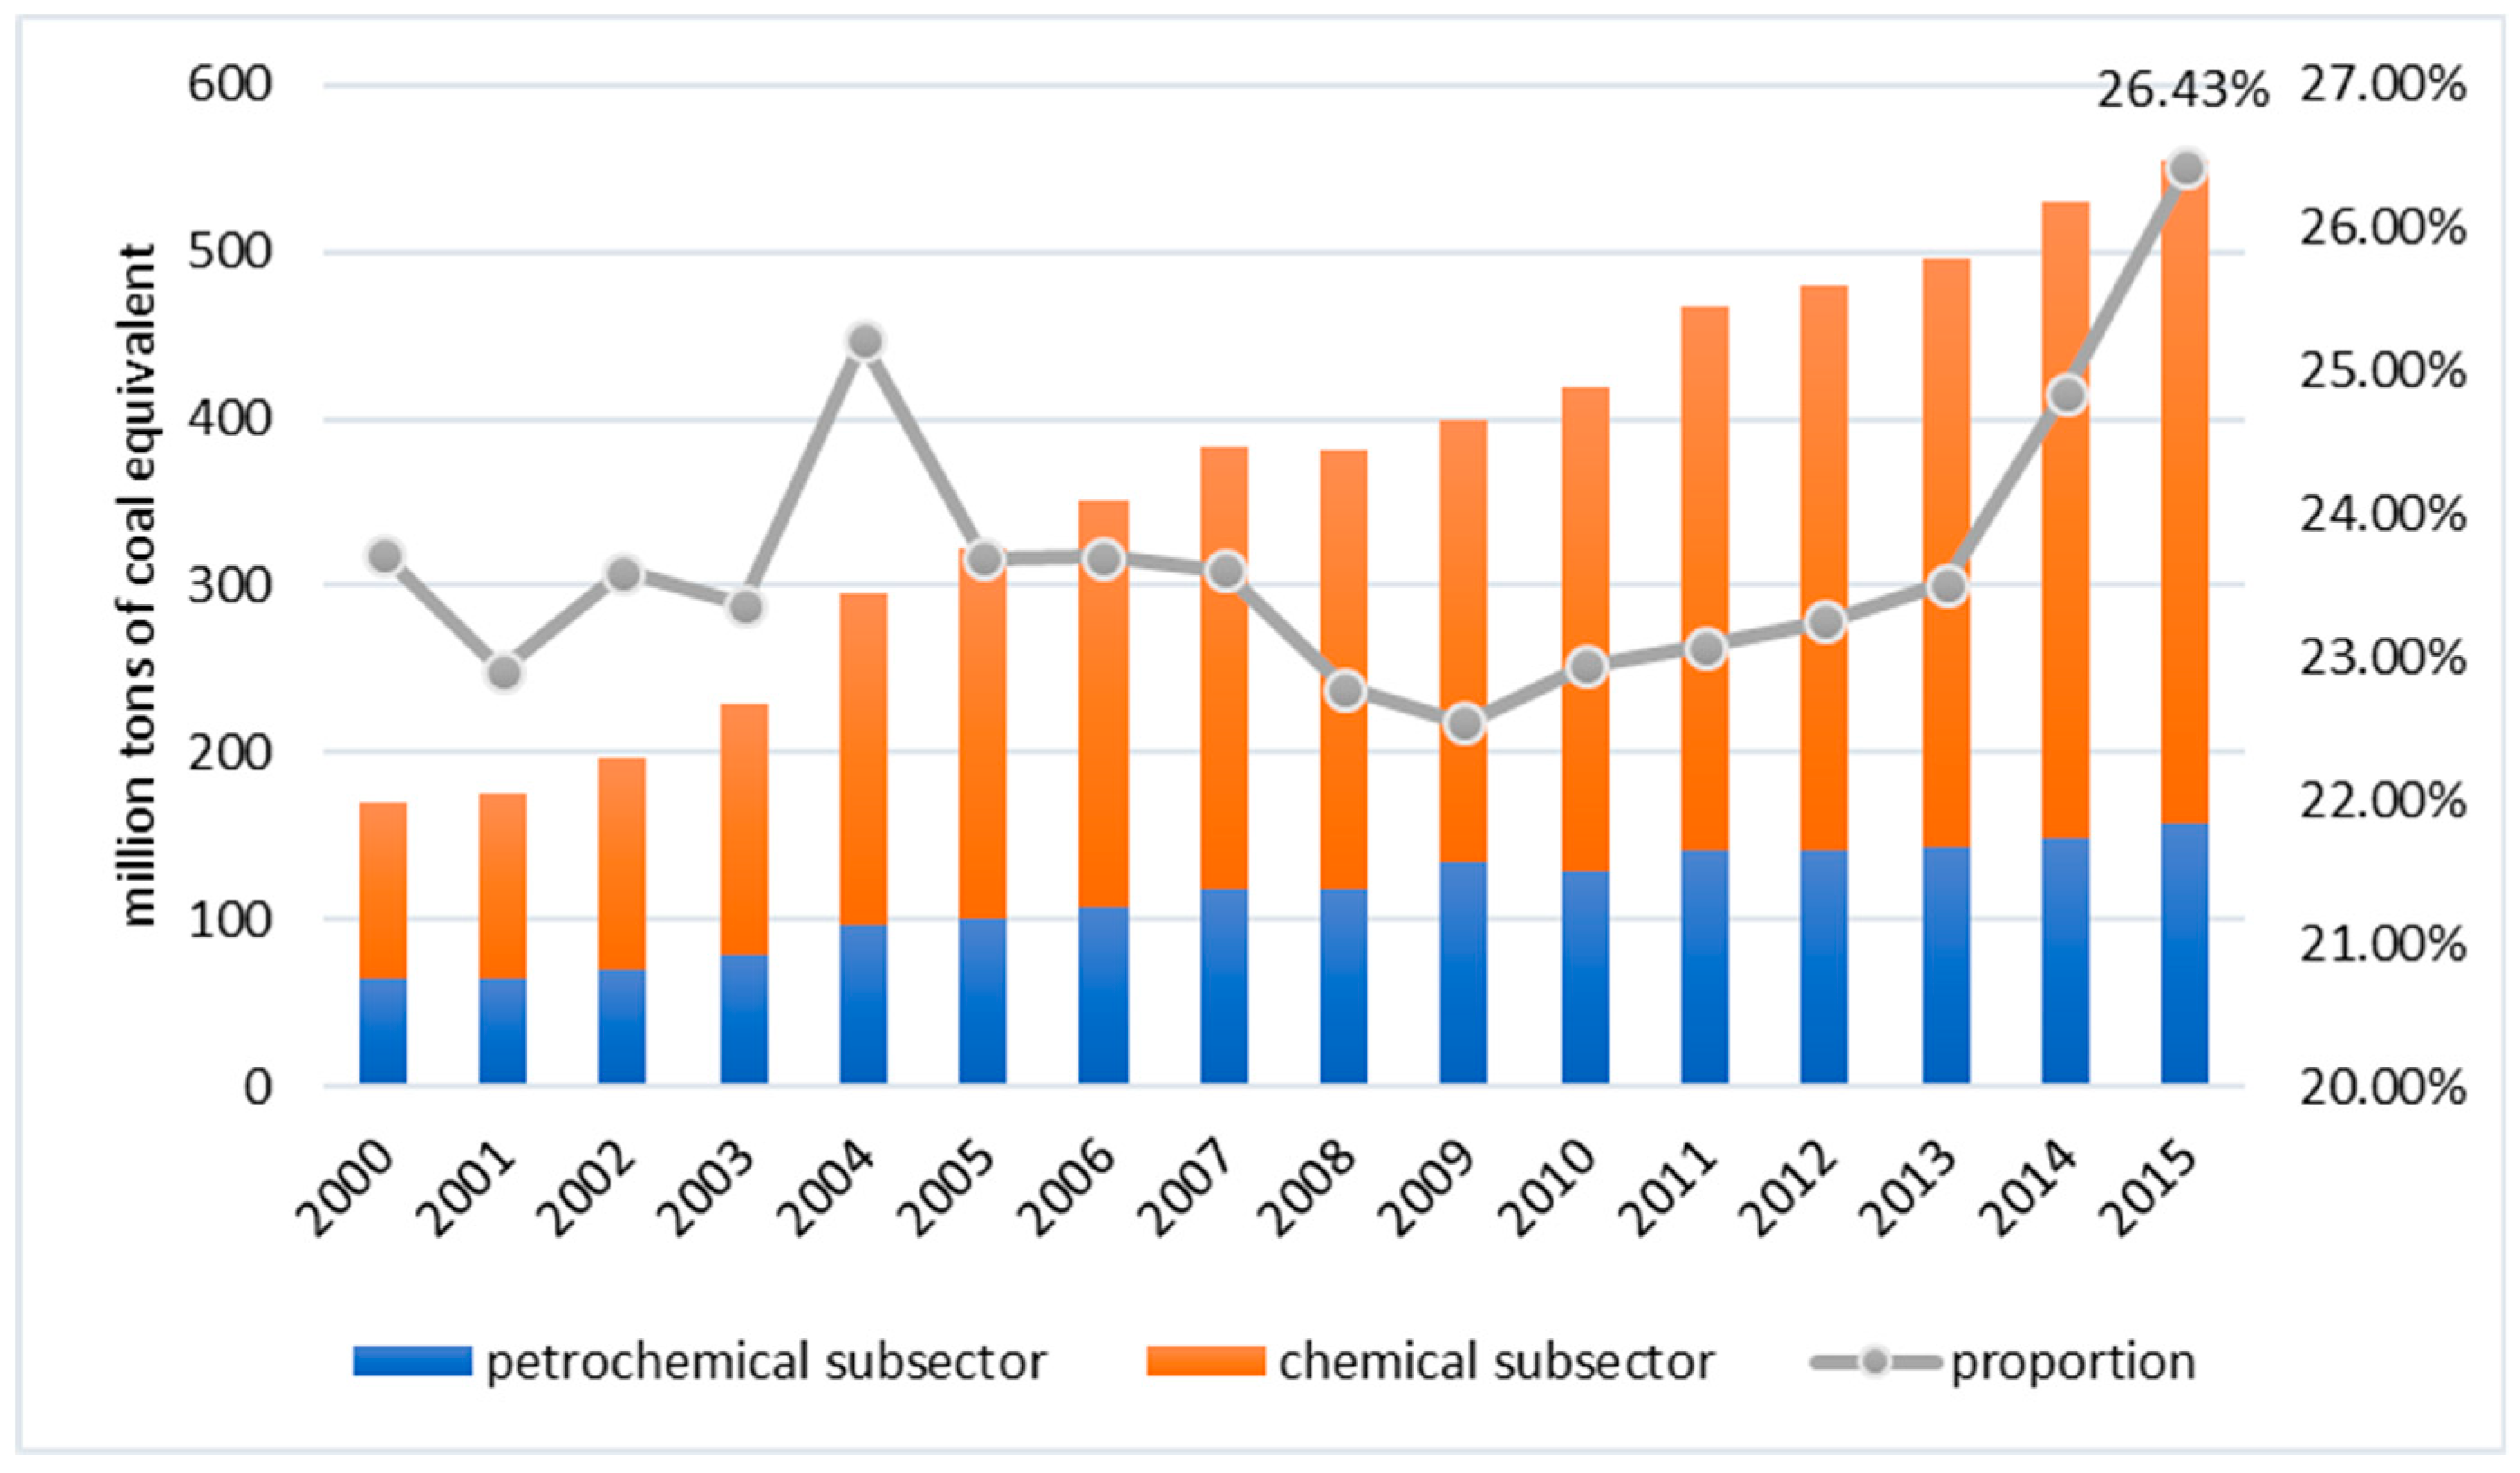
In the co-benefit studies in the industry sector, most of the studies have focused on the cement and iron and steel sectors. However, studies on the co-benefit effect of chemical sector, as the second largest energy-consuming sector in industry [19], are scarce. Nevertheless, the study of the chemical sector is important in energy systems. Fossil fuels, such as coal, oil, and gas, remain dominant in the chemical and petrochemical industry, although their consumption are decreasing in other industries. Moreover, fossil fuels, especially coal and oil, are expected to keep decreasing in world energy demand. According to the world energy outlook reported by IEA, the proportion of fuel energy consumption will greatly decline [20] with the promotion of renewable energy in the power sector and of electric vehicles in the transportation sector. Additionally, reduction of fossil fuel consumption will help in the deep carbon reduction by China. However, in China, fossil fuels still dominate the industry; for example, coal and oil take a large proportion in energy consumption in the energy-intensive chemical industry at present and are expected to be the same in the near future. Specifically, the chemical industry with added-value of 8325.638 billion RMB accounts for 35% of total industry value added [21]. The chemical industry, considering petrochemical industry, has consumed 168.55 million tons of coal equivalent (tce) coal, as well as 168.08 million tce oil and 28.88 million tce gas in 2015; the emission of CO2 is 1479.4 million tons in 2015, which is approximately 22% of the total emissions [22]. Therefore, the energy saving and emission reduction technology development in these two sectors will be substantial for carbon abatement and pollution reduction efforts.
Research in the chemical industry has concentrated on energy-saving amounts and emission reduction. Lin et al. [19] found that a average energy efficiency is 68.9% in the chemical industry, with 89.42 Mtce energy saved from 2005–2011. Zhou et al. [23] indicated that in the ammonia industry in China, the fuel-switching and technology improving strategies caused a 23.5% CO2 emission decrease from 2005–2015. Chen et al. [24] compared three ethylene production routes, and discovered that natural gas to ethylene (NTO) is the most eco-efficient. Liu et al. [25] discovered that current technologies in the petroleum-refining process can maintain the average energy consumption within 57 kgoe/t-feed. Moreover, a further reduction of up to 10% can be achieved under a cap-and-trade scheme [25]. Xie et al. [26] found that industrial activity, industrial scale, and energy intensity are three factors in the CO2 emissions in the petroleum-refining and coking industry. Given the complexity in the petrochemical process, scholars such as Weng et al. [27], Han et al. [28], Geng et al. [29] and Chen et al. [30] have proposed improving the current model to quantify and predict the energy consumption and CO2 emissions well [20].
In conclusion, there have been many studies about the co-benefits from carbon abatement at the while sector level or in industrial subsectors like cement manufacture, but research on the petrochemical and chemical industries has focused on their energy-saving potential and CO2 emission mitigation, however, it rarely discusses the public health co-benefits and existing co-benefit analyses are seldom focused on the petrochemical and chemical industries. Hence, analysis and research in the co-benefits in the petrochemical as well as chemical industry are substantial. In addition, fossil fuels, such as coal, oil, and gas, are becoming less dominant in other sectors. Therefore, studies in the fuel energy-intensive industry, namely, chemical and petrochemical industry, is remarkable. On this basis, the present study focuses on the environmental health impact of chemical industry. A series of energy saving and emission reduction technologies are analyzed. This study aims to evaluate the health benefit of these technologies and revise the marginal abatement costs for showing the economy and feasibility of the promotion of energy saving and remission reduction technologies in the chemical industry.

2. Overview of Energy Intensive Chemical Industry

2.1. Total Final Energy Consumption and Energy Intensity

The industrial sector ranks first in China’s final energy consumption, accounting for 67.12% of total energy consumption in 2015 [31] (Figure 1). Historical trends indicate that total final energy consumption of the industrial sector has been experiencing sustainable growth in the last decade, which corresponds to the upward trend of the entire industry.
However, the rate of rapid growth has slowed down in recent years. In addition, the proportion of total industrial final energy consumption is between 60% and 70%, and has experienced a general constant decline since 2011 [31]. The energy consumption structure of the industrial sector includes coal, oil, natural gas, electricity, heat and other energy sources, accounting for 56%, 11%, 5%, 23% and 5%, respectively, in 2015 [32], close to the corresponding proportion of the country, with coal always being the dominant fuel in the industrial sector. The petrochemical and chemical industries are energy-intensive industries, consuming over 20% of the total industrial energy, where the proportion of petrochemical industry and chemical industry is 7.52% and 18.91%, respectively [32] (Figure 2). This figure has been rising in recent years up to a historic peak of 26.43% in 2015. In view of the high proportion, it is vital to improve the energy efficiency and optimize energy consumption structure in these two subsectors that would contribute to mitigation of the whole industry.
Energy intensity, which refers to energy consumption per GDP, has constantly been decreasing since 2000 (1.47) but reached its historic lowest point (0.62) in 2015 [31] (Figure 3).
In contrast, the industrial energy intensity—energy consumption per industrial added-value—is rather higher. Although experiencing a decrease from 2.58 in 2000 to 1.24 in 2015, it is still nearly twice as high as the overall figure [31]. Historical statistics show that industrial sector consumed 60–70% of the total energy while its added-value only remained at 40% [31]. This unpromising situation indicates the urgency in pushing the industrial sector to improve its energy efficiency. Energy intensity of petrochemical and chemical industry has decreased by years and maintained around 0.5 in the Twelfth Five Year Period. Specifically, energy intensity of petrochemical industry has declined from 1.64 (2000) to 0.67 (2015) and that of the chemical sector has also decreased from 2.56 (2000) to 0.58 (2015) [31]. Considering its energy consumption has been slightly increasing year by year, this low indicator implied substantial increases in production value.

2.2. Emissions

Emissions of CO2 have been rising for a long time, while just the single industrial sector has emitted nearly 60% of total CO2 (Figure 4). Taking the relationship of added-value and CO2 emissions into consideration, historical statistics show CO2 emissions per 10,000 GDP is declining year by year, and especially since 2005 this figure has decreased from above 4 tons to 2 tons or so [31,32,33,34] (Figure 5). Although the CO2 emissions per industrial added-value had a fluctuating decrease, it’s still higher than the overall level. In addition, the petrochemical and chemical subsector deserve to be observed due to their high energy-intensive production. The total amount of CO2 emissions in these two subsectors increases every year, accounting for almost 20% of the whole industry emissions, where the petrochemical subsector represented up nearly 6% and the chemical subsector produced 15% or so. Meanwhile, CO2 emissions per added-value in the petrochemical and chemical subsectors also declined, at 1.09 and 1.32 in 2015, respectively [31,32,33,34]. All the figures indicate that improving the energy utilization efficiency in these two subsectors would make remarkable contributions to carbon abatement.
According to the China Environmental Statistical Yearbook (2003-2015) [35], normal pollutants mainly include sulfur dioxide, nitrogen oxides and soot. Among these pollutants, SO2, NOx, and soot have been fluctuating. Especially in the Twelfth Five Year Plan period SO2 decreased by 16% and NOx decreased by 21%. Soot emissions increased slightly in recent years [35].
The petrochemical industry’s SO2 emissions ranged from 0.6 to 0.8 million tons, while that of the chemical industry’s emissions ranged from 0.9 to 1.3 million tons [35] (Figure 6). The proportion of SO2 emission in the petrochemical and chemical industry has been increasing and in 2014 it reached its historic peak (13.45%). The nitrogen oxides emissions in the petrochemical industry range from 350 to 400 thousand tons, while those in the chemical industry are fairly steady at 500 thousand tons. Emissions of the two subsectors represent 5–7% of the total industry’s emission, and this proportion has been constantly rising in recent years, reaching 7.52% in 2014 [35]. Soot emissions in the petrochemical and chemical industry changed irregularly. Soot emissions in the petrochemical industry ranged from 400 to 600 thousand tons while those of the chemical sector were between 500 to 700 thousand tons [35]. The historic peak of soot emissions of the petrochemical and chemical industry appeared in 2011, and was 10.85% of total industrial soot emissions.

2.3. National Program for Industrial Energy Conservation and Emission Mitigation

Requests for energy conservation and emission mitigation in all the industries are clearly listed in the Integrated Work Plan for Energy Conserve and Emission Mitigation During the Thirteenth Five Year Period [36]. In the energy saving part, total energy consumption is required to be limited within 5 billion tce and the energy intensity is expected to decrease by 15% compared to that of 2015. Besides, the consumption of coal in the whole energy consumption should be below 58% and non-fossil fuels’ proportion should increase to 15%. The policy also puts forward the energy conservation and emission mitigation target for the different regions. In addition, CO2 emission per GDP is required to decline 18% in the five years [37]. Technical requirements are given in Development Program for the energy conservation and environment protection industries during the 13th Five Year Period [38]. The detailed requirements about industrial sectors are elaborately listed in the Industrial Green Development Program (2016-2020) [39], which requires the energy intensity, CO2 emissions per added-value and pollutant emissions in those focused industries declining 18%, 22% and 20% by 2020, respectively. Besides, the proportion of green and low-carbon energy should increase from 12% to 15%. In the Development Program for Petrochemical and Chemical Industries (2016-2020) [40], an elaborate mitigation plan is conducted to promote these sectors’ green development. The main targets are shown in Table 1.

3. Methodology

A total of 40 energy saving and emission reduction technologies in the petrochemical and chemical industry, recommended by National Development and Reform Commission, are assessed in this paper. The health impact and marginal abatement cost of these technologies are evaluated. Health impact assessment methods [41] assess the number of premature deaths and the resulting economic losses of air pollution. The promotion of these technologies reduces the pollutant concentration. Hence, it can also avoid some premature deaths caused by air pollution. The avoided premature deaths are health benefits. Finally, health benefits are further integrated into the marginal abatement cost curves (MACCs) of the technologies.

3.1. Main Parameters about Mitigation Technologies

To promote energy conservation and emission reduction in the industrial sector, the National Development and Reform Commission issued a series of detailed technical indicators [42]; in which the petrochemical sector has 22 technologies, whereas the chemical sector has 18 technologies, as shown in Table A1 and Table 2, respectively. When handling application rates in different provinces, production quantity and proportion of relevant products of the technologies are considered.
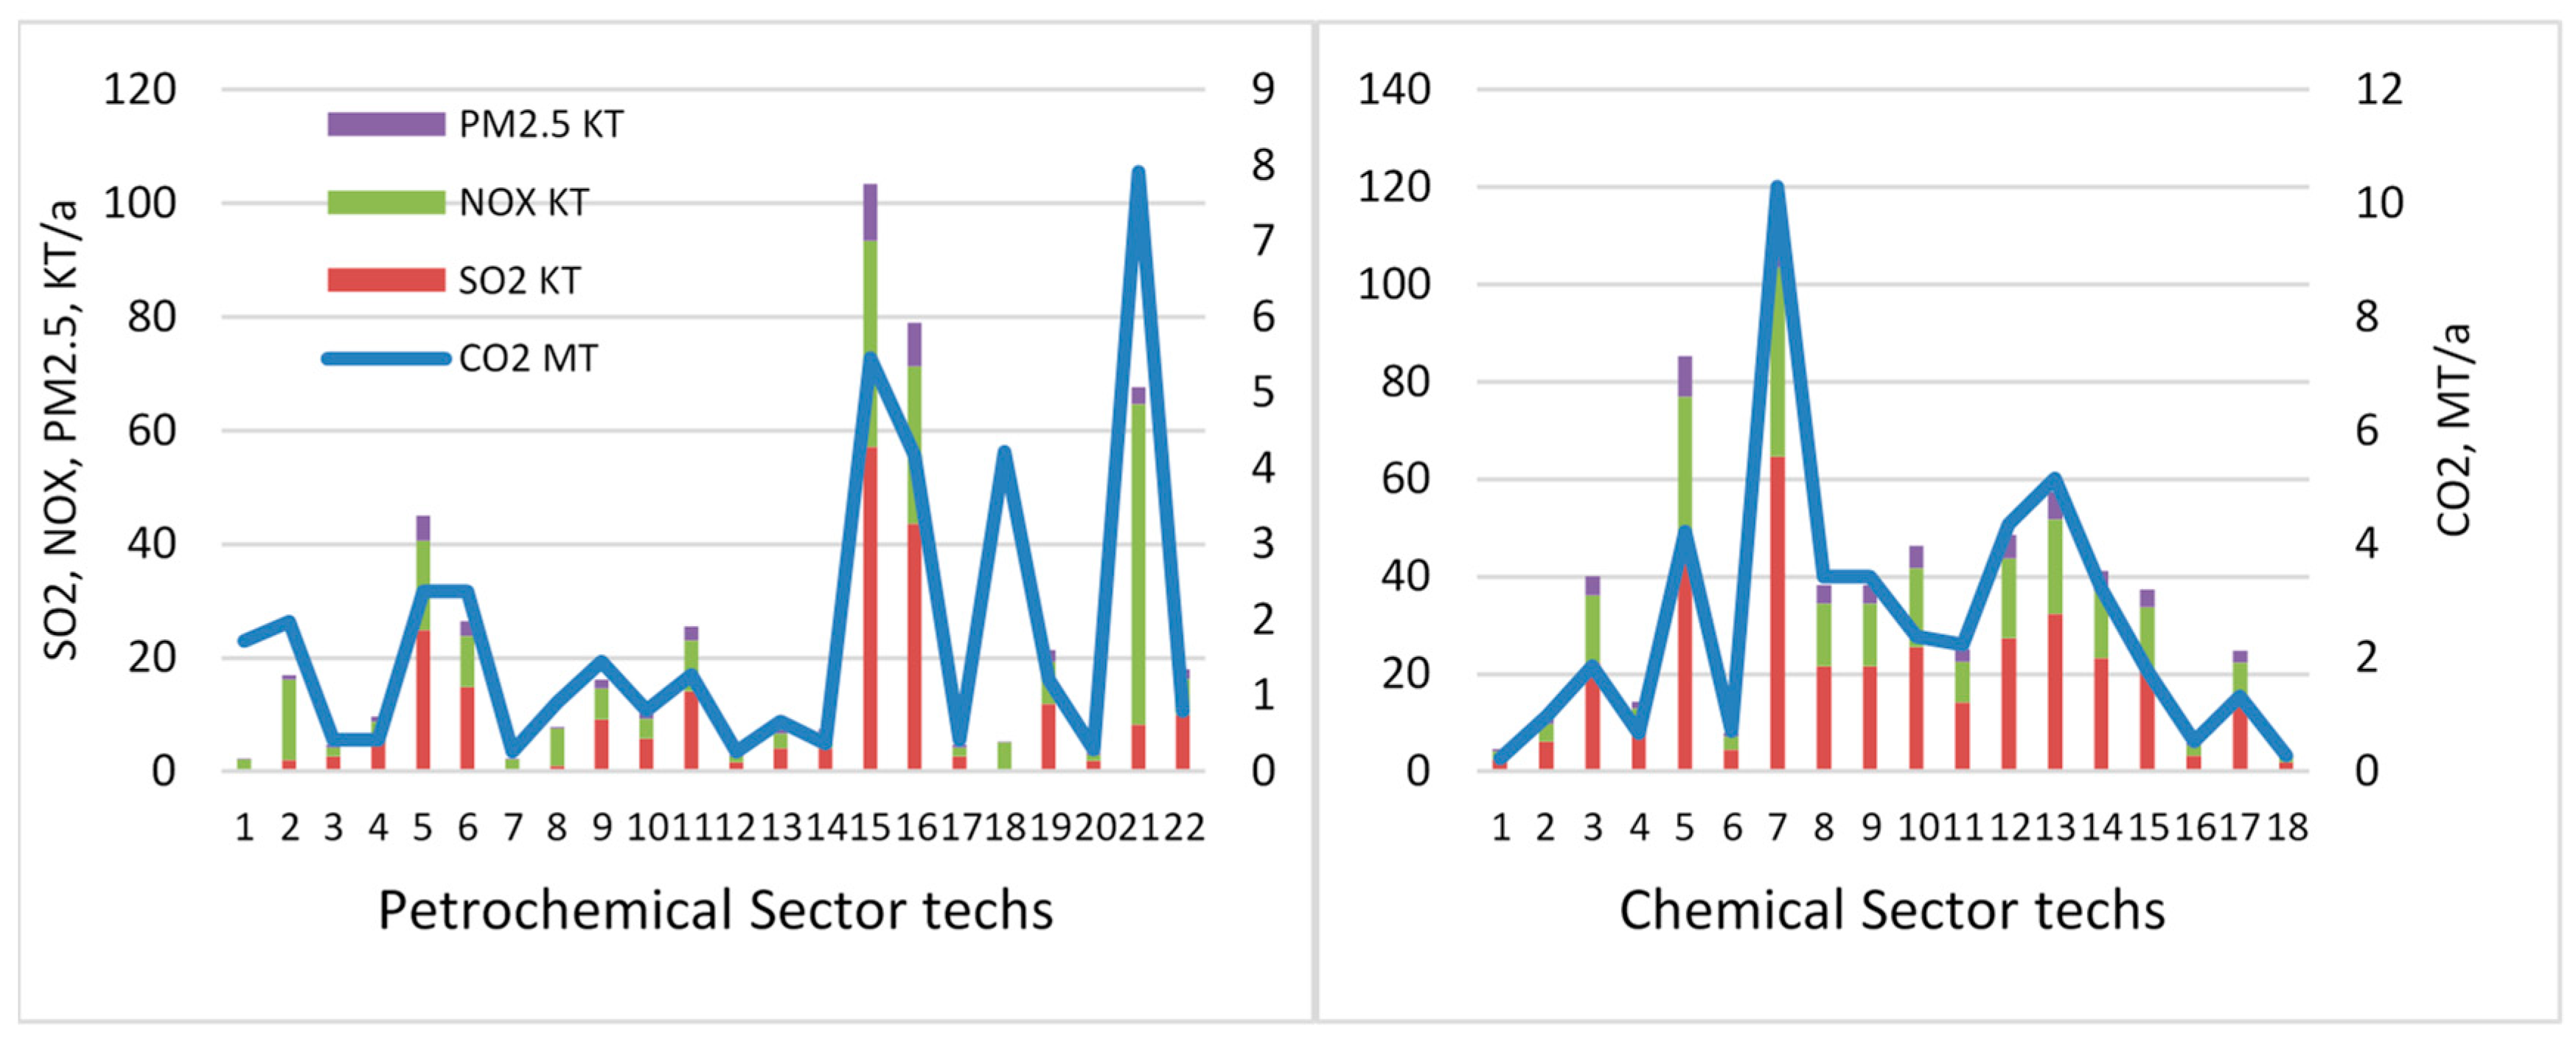
To assess the health impact of specific industrial technologies, 40 technologies are discussed in detail. The 40 technologies comprise 22 technologies in petrochemical department and 18 technologies in chemical department. Table 2 display the economic and environmental parameters of these technologies. Petrochemical department technologies are divided into five groups, which are named Category A–E, on the basis of their mode of energy conservation.
Category A covers seven technologies that can save energy through efficiency improvement. By reducing the per unit energy utilization and CO2 emissions, these technologies can reduce the total air pollution and CO2 emissions. For example, tech21 may achieve 3000 Ktce energy saving and 7.92 Mt CO2 abatement per year, with an expected 5-year total investment of 1000 million RMB. Category B contains three heat exchanger technologies. Heat exchangers are important pieces of equipment in industrial production. The improvement of heat exchangers can save a considerable amount of energy.
Category C collects technologies that focus on waste heat utilization. Six technologies are included in this category. Recycling waste heat and applying it into industrial process can improve energy efficiency and reduce energy amount needed for industrial production. Category D has three coating technologies. After adding specific coating on equipment, the heat absorption rate or heat transfer rate can be improved to decrease energy utilization. Three technologies in Category E are system optimization technologies, which use energy system models to minimize the energy consumption under necessary constrains.
The chemical department has four categories from F to I. These categories focus on technological process, waste heat utilization, equipment modification, and fuel improvement. Each technology improves one section of industrial production process. Hence, these technologies have a total expectation of 18.01 million tce energy saving capacity per year. Specifically, Category F has five technologies that change the steps of industrial process to reduce energy waste. The other three categories, namely, G, F, and I, include 6, 2, and 5 technologies, respectively.

3.2. Model Assumptions

The health impact evaluation is one module of China-Multi-pollutant Abatement Planning and Long-term benefit Evaluation model (China-MAPLE), which is a bottoms-up model developed to optimize system cost and energy structure on the basis of constraints of mitigation policies and technology [9,11,43]. The social-economic assumptions in this paper are consistent with the China-MAPLE model. In China-MAPLE, the GDP growths are assumed to be 6.2%, 4.1%, and 3.2% in the periods of 2020–2030, 2030–2040, and 2040–2050, respectively [11,44]. The base year is set to be 2015. The social-economic parameters, such as population and value of statistical life (VSL), are calibrated to base year. The VSL used in this paper and the sources are listed in Table 3.
VSL is a statistical conception. The most popular way to get the VSL in one area is by a contingent valuation method. Researchers usually need to construct many questionnaires. The surveys are aimed to understand local people’s willingness to pay (WTP) to improve their environmental conditions for a long life span. The survey results reveal people’s preferences for different attributes. The results can also be influenced by some other factors, such as questionnaire design, survey method, and information exchange between investigators and respondents [45]. People in different regions have different perceptions, and the WTP can change over time. Therefore, the VSLs for different regions in different periods usually have obvious differences. The VSLs used in this paper are the latest research results for those areas. They are converted to base year using consumer price index. Some studies have been conducted approximately 10 years ago. As such, the VSLs should be updated. Nevertheless, the VSLs obtained from local surveys for individual areas are still the most appropriate for studying local air pollution health impact.

3.3. Health Benefit Evaluation

The reduced air pollutant emissions have some contributions to improve local air quality. Among numerous air pollutants, SO2, NOX, and PM2.5 are the most harmful to human beings. Hence, they are estimated in this paper. The health impact evaluation method consists of three steps [41]. First, we use emission amount and intake fraction to estimate concentration change. On this basis, we evaluate the relative risk of premature death. Last, we get the statistical value of economic loss caused by air pollution. The intake fractions mean the ratio of pollutant inhaled by human beings to the pollutant emission amount [51,52]. The intake fractions in this study for SO2, NOx, and PM2.5 are 0.89, 0.18, and 44.10 ppm, respectively. On the basis of the reduced emissions at the provincial level [41,53], the concentration change due to emission reduction can be estimated by Equation (1):
Δ C = ( E M × i F ) / ( P × B R )
where ∆C is the concentration change of air pollutants, EM is the emission reduction amount, iF is the intake fraction in ppm, P is the population, and BR is the breathing rate in m3/day.
We use the exposure-response coefficient (ERC) to denote the correlation between PM2.5 concentration and health impact. ERC is usually derived from a regression model called proportional hazards survival model [54,55,56]. The ERC used in this paper is 5.37 from the study of Nanjing University; hence, per 10 μg/m3 increase in PM2.5 concentration will cause the premature death to increase by 5.37 percent [56,57].
The relative risk (RR) means the ratio between the mortality risks under two different exposure conditions. Given other conditions unchanged, when concentration is higher, RR becomes higher [53]. The ERC is transformed to RR using Equation (2):
R R = e x p ( E R C × Δ C )
where RR is relative risk, ERC is the exposure-response coefficient and ∆C is the PM2.5 concentration increment.
The premature death caused by a PM2.5 concentration increment is calculated with the RR and the total mortality rate, as shown in the formulas below. The total premature death, I, equals the baseline premature death, I0, multiplied to the relative risk, RR, as shown in Equations (3)–(5). Moreover, the premature death attributed to the incremented air pollution is the difference between the total premature death and the baseline premature death [56]. Besides, data about premature death are collected from the Chinese Center for Disease Control and Prevention and the Global Status Report on Noncommunicable Diseases 2010 [58] from World Health Organization:
I = I 0 × R R
I 0 = I / R R
Δ I = I × [ 1 ( 1 / R R ) ]
where I is the real premature mortality, I0 is the premature mortality under the baseline exposure condition, and ∆I is the premature death attributed to the incremented air pollution.
To evaluate the monetary value of health impact, VSL is used for estimating the monetary value of each case of premature death caused by air pollution [59,60]. In this study, we use specific VSLs for different provinces from domestic WTP survey studies [46,47,48,49,50]. We use Equation (6) to calculate the monetary value of health impact:
H I = Δ I × V S L
where HI is the monetary value of health impact, and VSL is the value of statistical life.
We use local VSLs [46,47,48,49,50] to monetize health benefits. For comparing MAC curves, another series of VSLs are also used. The other VSLs are converted from the VSL of the United States of 7.4 million USD [41]. The conversion of VSL from one area to another is based on income ratio. In this paper, the income ratios are calculated between provinces of China and the US, and elasticity is 1.5 [61].

3.4. MACC Construction

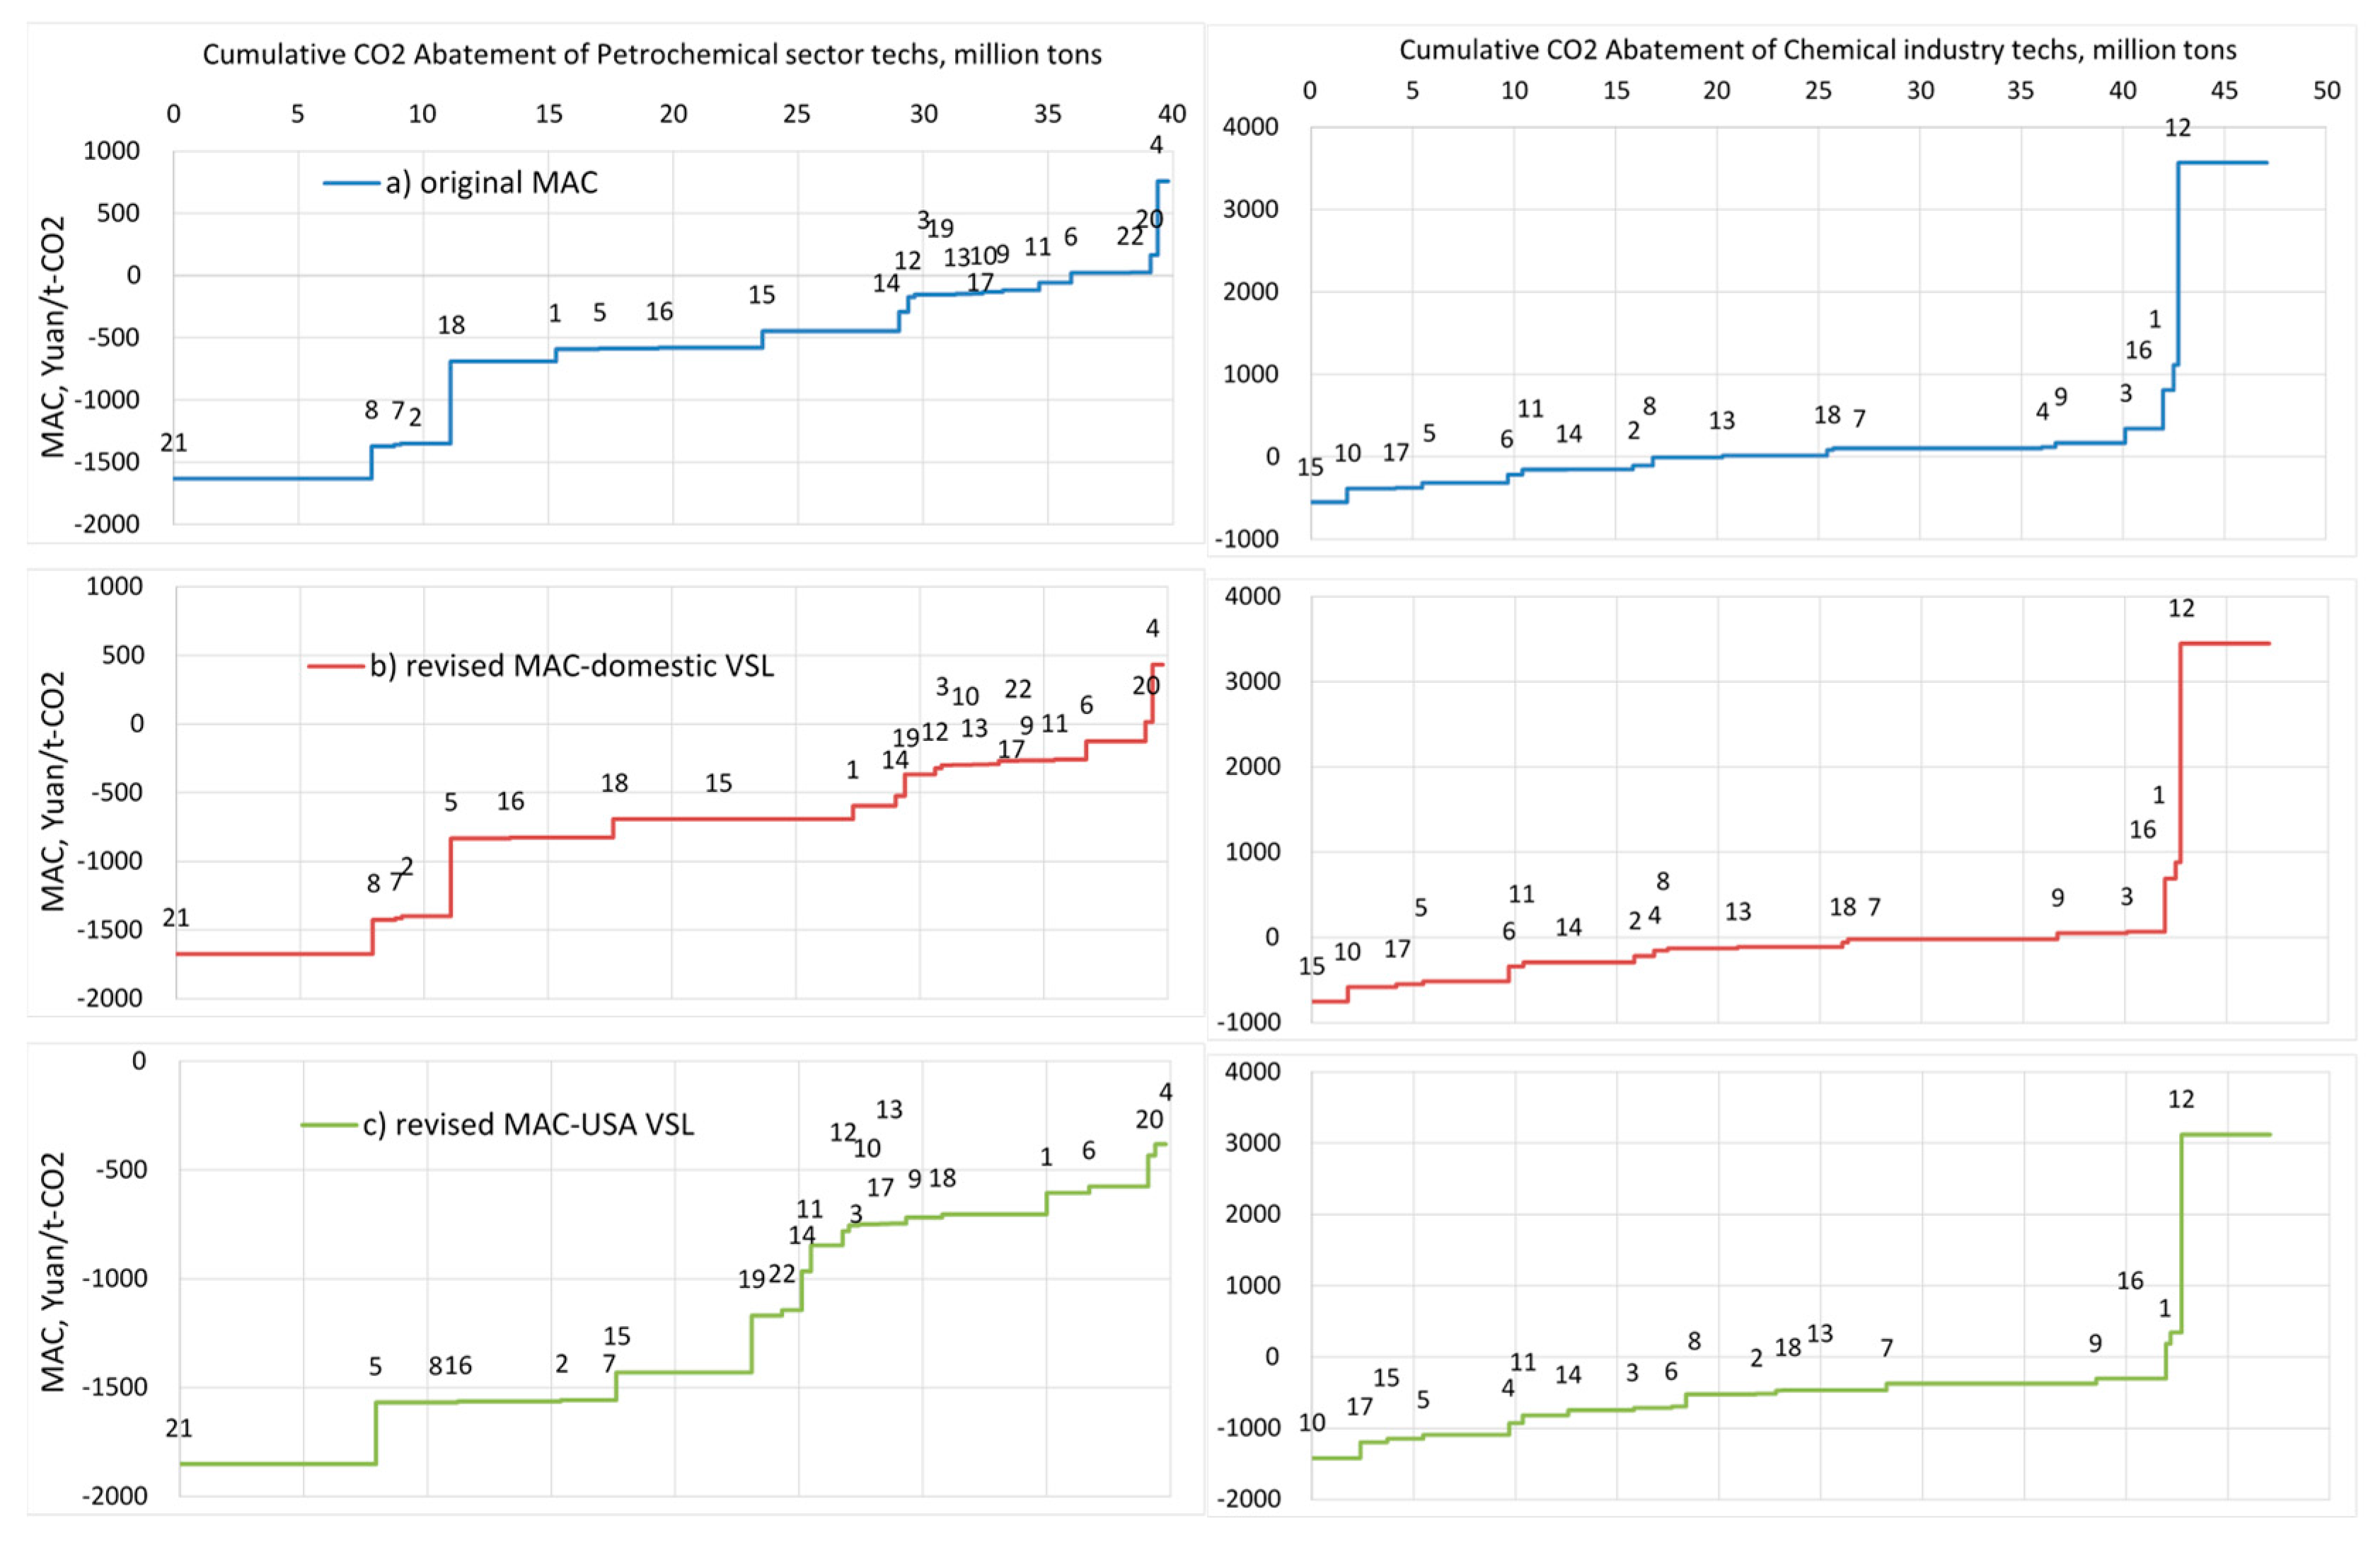
In this study, we introduce marginal abatement cost curves (MACCs) to analyze the effect of mitigation technologies. The MACCs show the ladder-type relation between carbon abatement amount and the marginal cost of a group of technologies. In these curves, the lowest-cost technology is placed in the first place in x-axis; then, the second-lowest-cost technology is placed in the second place, and so on; the y-axis displays the unit carbon abatement cost of each technology [62]. In the original MACCs, only economic costs are considered as the difference between the investment and the saved energy fee.
Regarding economy, investment minus energy fee does not cover all the costs because of externality. Energy uses have negative externality, because the air pollution caused by energy consumption has health impact on human beings. Furthermore, the reduction of energy use can also provide some positive social benefits. Considering the externality, the cost of carbon abatement of promoted technologies becomes low. The MACCs are also revised when health benefit is removed from the original marginal abatement cost. As such, we derive the revised MACCs. The new MACCs curve are more accurate than the original ones are. Moreover, they move down compared with the original MACCs. Two revised MACCs based on the two group of VSLs for China’s provinces are generated. Then, they are compared with each other.

4. Abatement Cost Considering Environmental Health Impact

4.1. Abatement Potantial of Mitigation Technologies

The mitigation technologies have different effects on carbon emission and local pollutant abatement potential. Considering the CO2 abatement potential in the chemical sector, Tech7 (pulverized coal pressure gasification technology), Tech13 (modular cascade heat recovery clean coal gasification technology), and Tech12 (overhead multi-nozzle coal pressure gasification furnace technology) rank top three with amounts of 10.3, 5.16, and 4.36 Mt, respectively. Tech7, Tech13, and Tech12 belong to coal chemical technology. The coal chemical is an important part of the chemical sector, especially for the cement sector [63]. Coal, as raw material, is used via gasification; moreover, approximately half of the coal gasification products go to chemical production [63]. As shown in Figure 7, these three technologies also rank top four in the emission reduction potential of SO2, NOX, and PM2.5. On the contrary, Tech1 (conversion gas to alkali and new process technology for its cleaning), Tech18 (horizontal belt type vacuum filter alkali energy saving technology, and Tech16 (isothermal transformation energy-saving technology based on phase shift heat transfer have the smallest emission reduction potential for CO2 as well as SO2, NOX, and PM2.5. The high correlation between the emission reduction potential of CO2 and air pollutants reflects the homogeneity between CO2 and air pollutants. Hence, carbon abatement technologies have synergies of simultaneously reducing air pollutants.
The emission reduction potential of 22 technologies in the petrochemical industry are shown in Figure 7. The technologies with the largest CO2 abatement potential are tech21 (clean and efficiency technology of vehicle fuel) with CO2 abatement potential of 7.9 million tons, tech15 (energy-saving optimization technology of industrial cooling circulating water system) of 5.5 million tons, and tech16 (optimization of steam system operation and energy-saving technology) of 4.2 million tons, respectively. Also, the top three NOx emission reduction technologies are the same ones as those of CO2, with potentials of 56, 36, and 28 Kt, respectively. With regard to SO2 and PM2.5, the technologies rank a little bit different in the emission reduction potential; the highest reductions are 57 Kt SO2 and 10 Kt PM2.5 by tech15, 44 Kt SO2 and 8 Kt PM2.5 by tech16, and 25 Kt SO2 and 4 Kt PM2.5 by tech5 (energy-saving technology of thermal superconducting ceramic coating).
A small number of technologies exists with high CO2 emission reduction potential but low potential for air pollutants. Nonetheless, most of the technologies have the same trend of reduction potential for CO2 and air pollutions, whether high for both or low for both. Overall, a strong correlation between CO2 and air pollutants, namely, SO2, NOX, and PM2.5, is observed. The exception goes to tech1 (liquefied natural gas recovery and liquefaction engineering for oil field machinery) and tech18 (energy balance and optimal dispatching technology in petrochemical enterprises), whose SO2 emission reduction potential is almost as low as 0. The sound explanation for this result is that the energy type saved by these technologies is natural gas. Furthermore, the use of natural gas emits little SO2.

4.2. MACCs of Mitigation Technologies Considering Co-Benefits

As shown in Table 4 and Figure 8, half of the technologies in the chemical industry have unit carbon abatement costs lower than 0. Therefore, the economic gain brought by energy savings is higher than the investment cost. The most outstanding performance comes from tech15 (waste heat utilization and tail gas power generation (heating) technology in yellow phosphorus production), which reduces energy consumption by recycling waste heat from yellow phosphorus production. Besides, the absolute value of tech15’s negative MAC is 552 RMB/tCO2. After reducing the health benefit from economic costs, the MACC moves downwards. Moreover, the economic performance of all technologies become better. Some of the technologies whose unit abatement cost is larger than 0 become lower than 0 rendering them economical feasible. Examples of these technologies are tech7, tech13, and tech18 in both revised MACCs as well as tech3 and tech9 in revised MACC with US converted VSL. In addition, ranking of the economic performance also changes considering externality. For example, tech4 raises from 13th to 9th in revised MACC with domestic VSL, whereas tech15 falls to 3rd from 1st in revised MACC with US converted VSL because of relatively low health benefit.
Among the 22 technologies in the petrochemical industry, as shown in Table 5 and Figure 8, four have positive abatements costs, whereas 18 have negative abatement costs. The 18 technologies already have economic feasibility when only investment and energy fee are included. Taking tech21 for example, per ton of CO2 abated, 1632 RMB economic gain can be obtained. Moreover, tech6 and tech22 originally have positive costs, however, when domestic VSL is used to evaluate the externality, they have negative costs. When USA-converted VSL are used, other technologies, namely, tech4 and tech20, become cost effective; and also all technologies become cost effective. Furthermore, ranking of economic performance of petrochemical technologies also changes. Some technologies, such as tech5, tech10, tech16 and tech22, become economically feasible, whereas some other technologies, such as tech1, tech13, and tech18, fall behind.
The construction of MACCs has relatively high uncertainty. However the MACCs constructed based on bottom-up study or expert-based study, which analyze the technology mix, are more robust than system model-based MACCs are [64]. Nonetheless, the key parameters, such as cost of investment and energy saving and mitigation potentials, still have influence on the results that should not be ignored [65]. To reduce the uncertainty, key parameters are considered in this paper. First, the energy consumption in each province has its own price, thereby making the economic benefit of promoting the energy saving technologies accurate. Second, the national social benefits of these technologies are summed up by the benefits of provinces. Moreover, the environmental issues usually have regional characteristics. As such, the benefits obtained from the regional level are more reliable than those from the national level. Third, when adding the social benefits into the MACCs, two groups of VSLs are introduced: one from local surveys and another from the conversion of USA survey results. Thus, two revised MACCs are shown in the figure above. The differences between the two revised MACCs indicate that the VSL has remarkable influences on the MAC curve constructions.

4.3. Health Impact Evaluation

Promoting technologies can provide some economic benefits for society after comprehensively analyzing economic and external costs. As shown in Figure 9, economic cost, externality, and total social benefits are grouped for comparison; the total social benefit is the difference of health benefit and economic cost. As seen in the figure, comparing the chemical sector technologies, the social benefits of tech5, tech10, and tech15 with negative economic costs and high health benefits rank top three. In addition, tech5 has social benefit as high as 2183 million RMB. On the contrary, some technologies with high economic costs or relatively low health benefits result in low total benefit or even negative total social benefits. For example, tech7 has the highest health benefit but also the second largest economic cost; it results in a positive total social benefit that is not considerable. Therefore, in the analysis of the economic feasibility, ignoring economic cost or externality would lead to bias on the results.
The petrochemical tech group has two subgroups: one with high total social benefits and another with low or negative social benefits. As shown in Figure 9, the two subgroups are separated on tech1 and tech19. The technologies with total social benefit higher than tech1 have high negative economic costs and positive health benefits. Moreover, the sum of the two technologies result in this group of technologies having total social benefits much higher than another group has. Tech21 has the highest total social benefit with 13,259 million RMB, whereas tech15 takes second place with 3780 million RMB. Tech19 and the technologies with total social benefits lower than that of tech19 have health benefits much lower than the top8 technologies have.
The evaluation of health benefits of the chemical industry technologies varies considerably, as shown in Figure 10. Tech7, tech5, and tech13 have high health benefits at the national level. For example, tech7 and tech5 has a potential of 1230 million and 854 million RMB, respectively. Some technologies, such as tech18 with 39 million RMB, tech1 with 53 million RMB, and tech16 with 63 million RMB, have low externality.
Many factors result in the differences in health benefits among the technologies. The most important factor is the air pollutant emission reduction potential. Given that other conditions are unchanged, the more emissions are reduced, the higher the health benefit is. For example, tech7 has the highest PM2.5 reduction potential of 11,357 ton, which is approximately 18% of all chemical technologies; it is also the technology with the highest health benefit. Another important factor is the distribution of technologies. If the technologies are distributed in provinces with a high population density, high VSL, or high total mortality, the health impact of air pollutant emission reduction will be higher than that distributed in other provinces.
Several petrochemical technologies perform well in the analysis. As shown in Figure 10, tech15, tech16, and tech5 have high health benefit of 1348 million, 1029 million, and 586 million RMB, respectively. This result is much higher than that of other technologies. The health benefits of the remaining 19 technologies are evenly distributed in the range of 7 million–352 million RMB. Among these technologies, tech1, tech7, and tech18 have the lowest health benefits of 7 million, 15 million, and 15 million RMB, respectively. The differences are due to the differences of emission reduction.

5. Discussion on Regional Level

5.1. Difference of Industrial Products and the Promotion of Technologies among Provinces

The expected energy saving capacity, CO
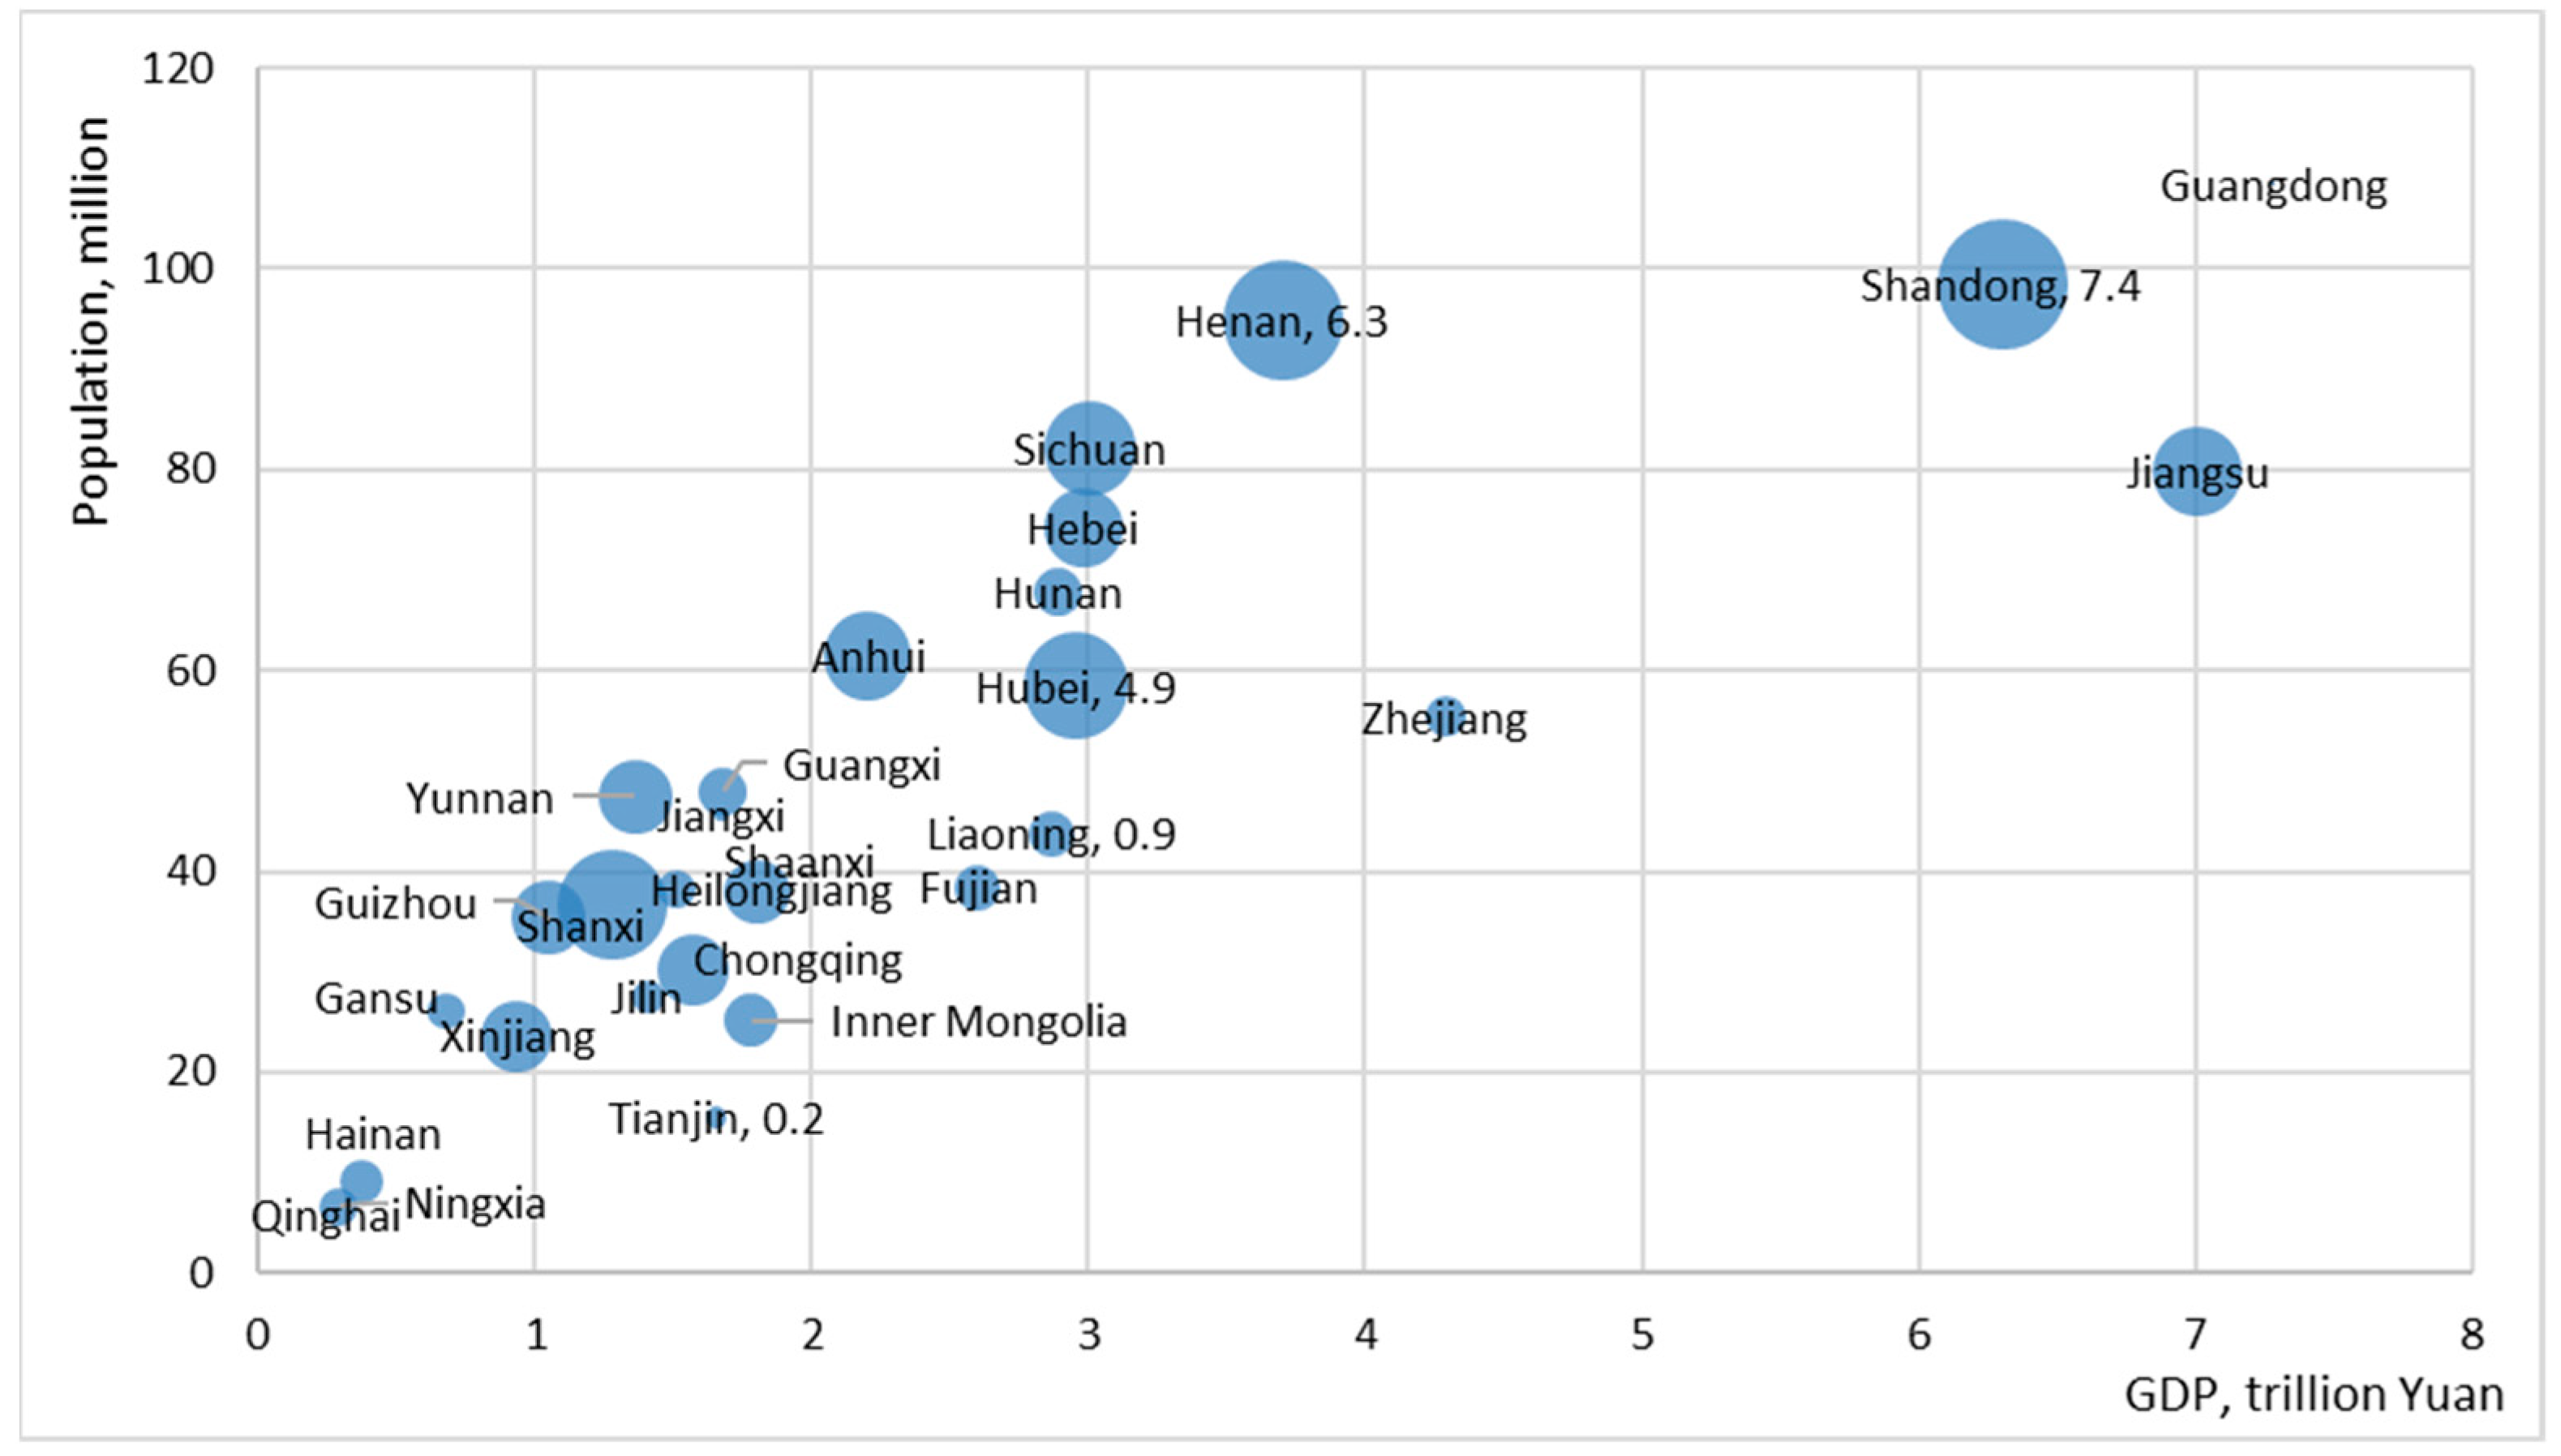
2 emission reduction capacity, and investment are further divided into provinces on the basis of corresponding production. For example, the proportion of chemical tech5, as distribution reference, takes the production share of synthetic ammonia in 31 provinces in 2015, as shown in Figure 11. We use emission factors at the provincial level to calculate the reduced air pollution emissions on the basis of provincial energy saving capacity. The saved energy also reduces energy fee, which is also calculated at the provincial level.

5.2. Chemical Sector Health Impacts and Social-Environmental-Economic Analysis in Provincial Level

As shown in 
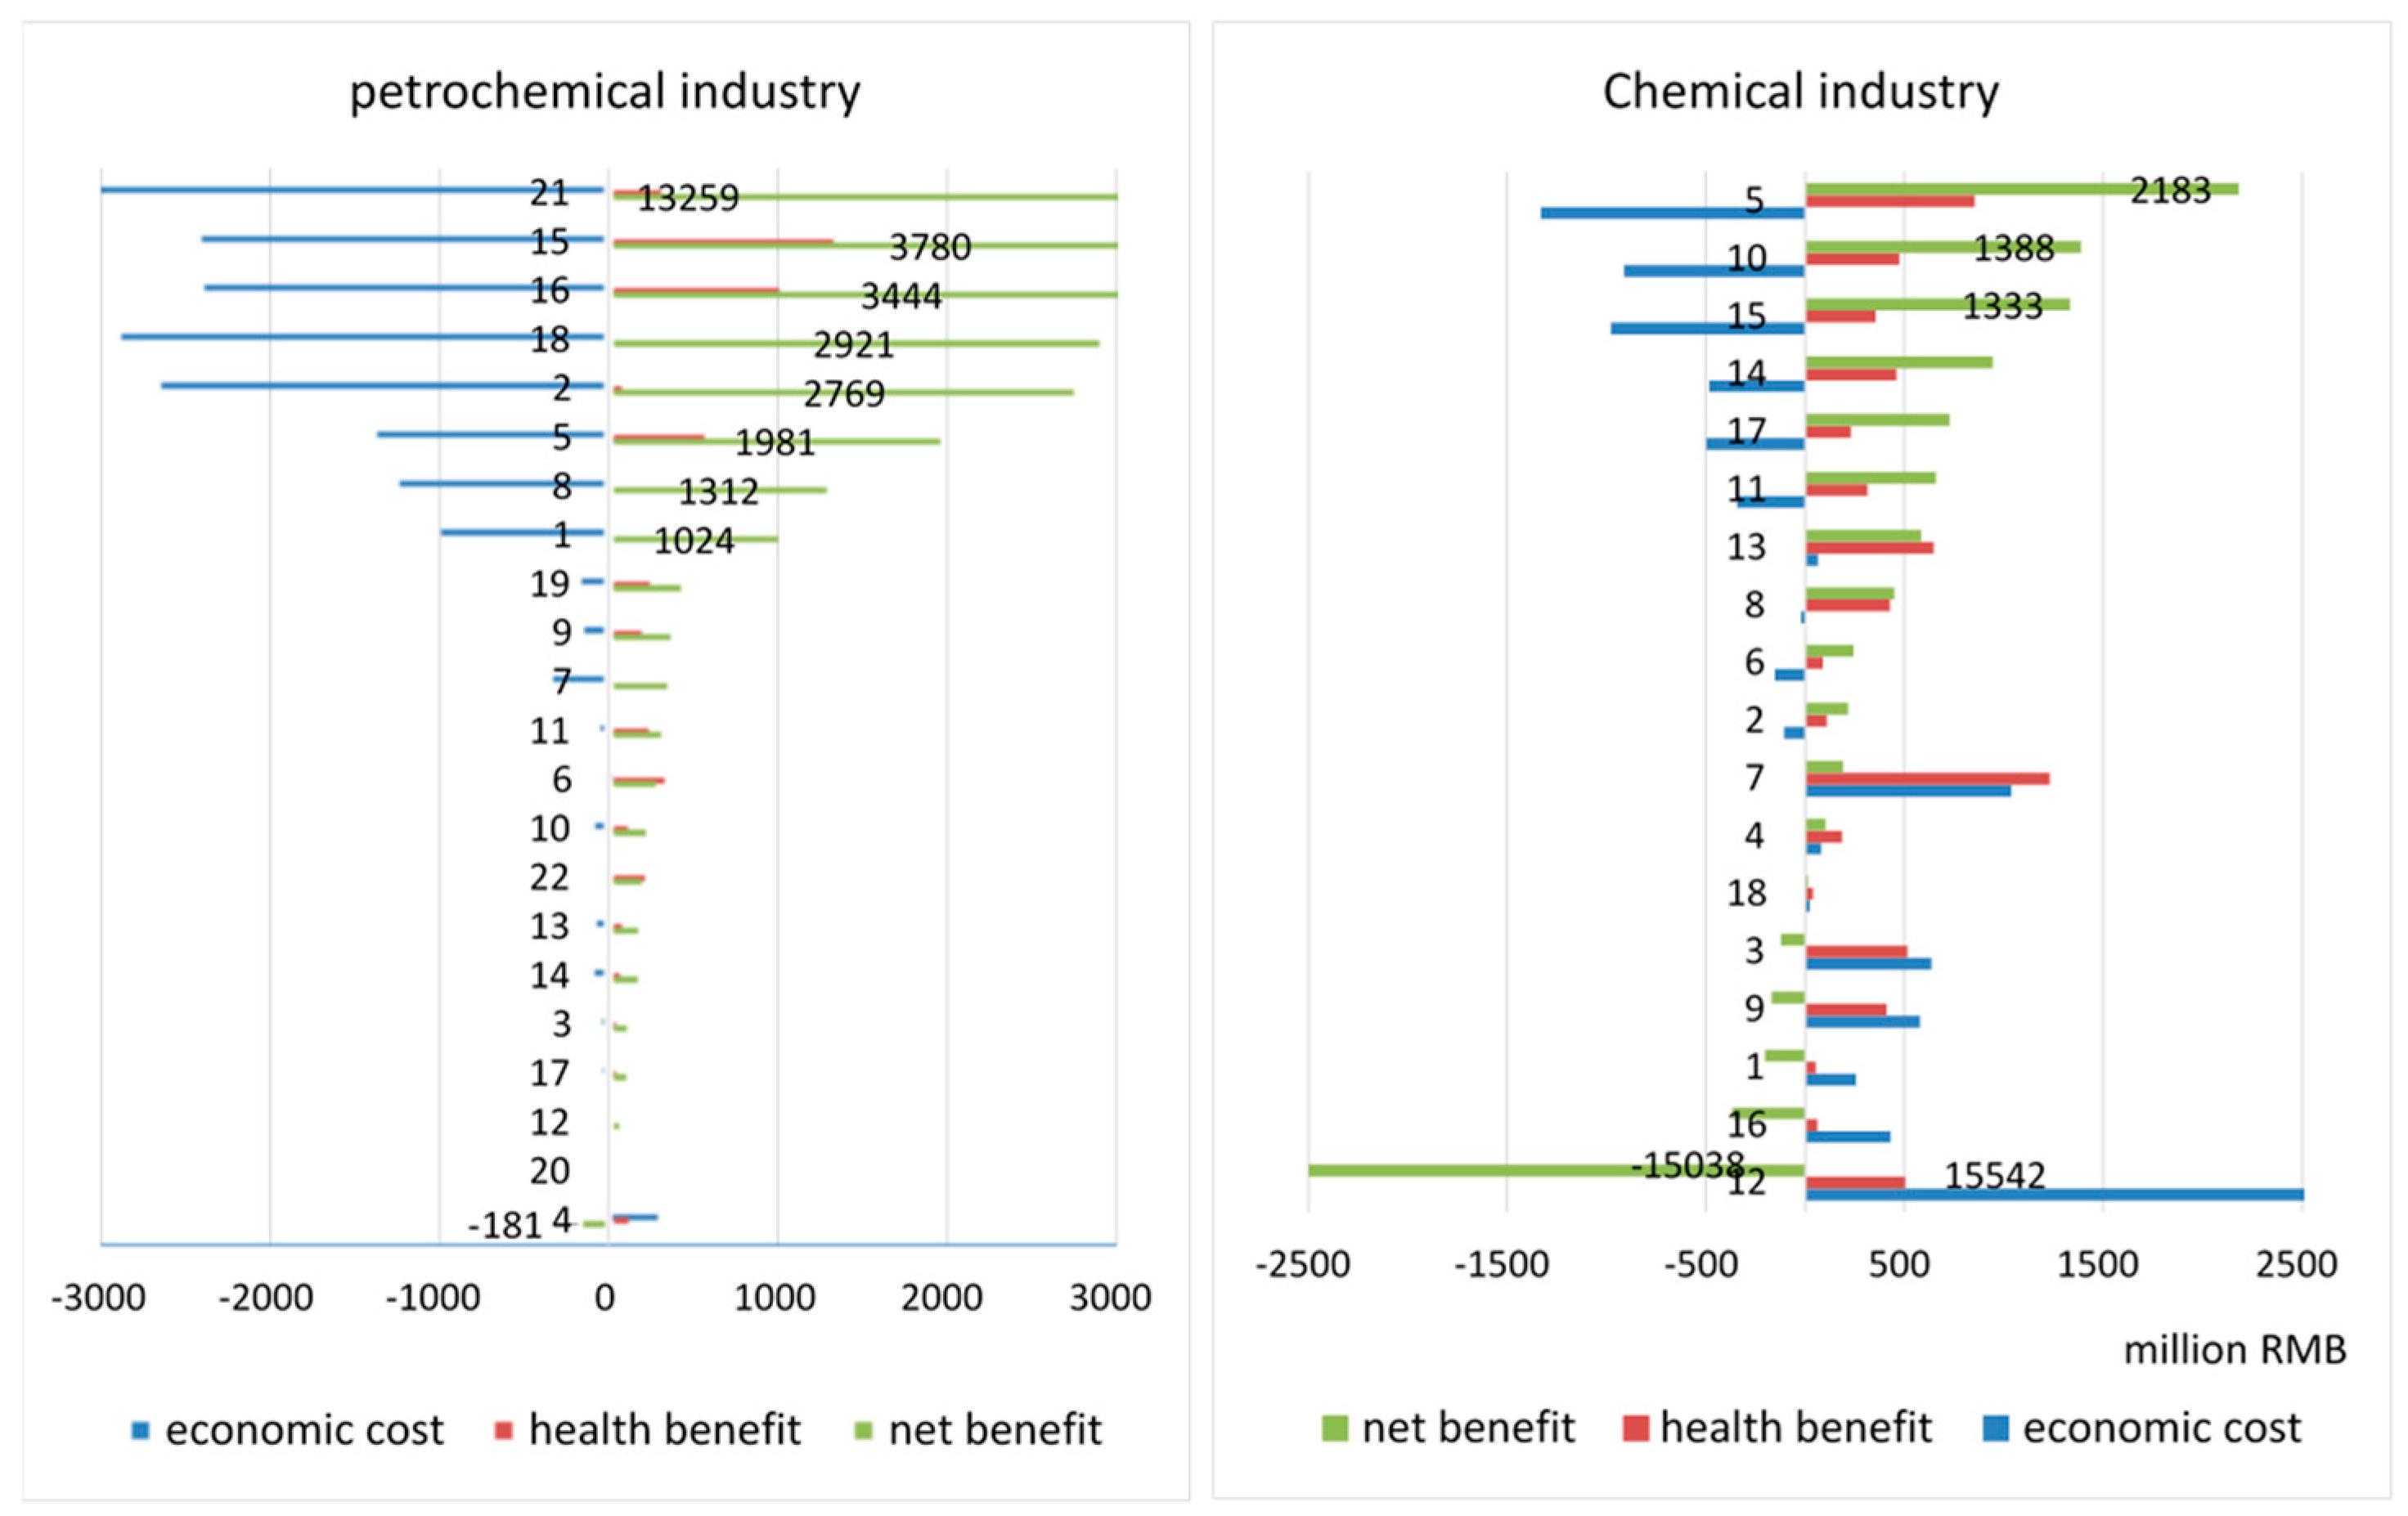
Table 6, health benefits of the energy saving and emission reduction technologies in the chemical industry brought to the 31 provinces vary considerably. Among all provinces, Henan, Hubei, Xinjiang, Shaanxi, and Shandong provinces have large health benefits. Typically, Henan province ranks first, and Hubei ranks second with health benefits of 929 million and 834 million RMB, respectively.
The output of most chemical-related products in Shandong, Henan, Shaanxi, and Hubei province are relatively higher than that in other provinces. Therefore, the emission reduction of air pollutants brought by technology promotion is accordingly higher. For example, the proportions of several technologies in Xinjiang, such as technology 3 and Technology 4 accounting for nearly 22%, are high, thereby resulting in the high health benefit in Xinjiang. In addition, the total population or the total number of premature deaths in these provinces is relatively high. Hence, premature deaths due to air pollution may be higher. The resulting health benefits are relatively high due to the technology promotion for improving air quality.
VSL is also an important influencing factor. The number of premature deaths reduced due to the technology promotion in Shandong is as high as 959. This number is the highest in all provinces and almost twice that of Hubei. However, the VSL in Shandong is only 0.54 million RMB. The VSL in Hubei is 1.68 million RMB, which is more than thrice that of Shandong VSL. The difference between the number of premature deaths and the VSL value results that Shandong’s health benefit is only two-thirds of that in Hubei and is the fifth highest among provinces. Hubei Province, although ranking third in emission reductions, ranks second in health benefits due to its high VSL value.
We then simultaneously compare economic costs, health benefits, and total social benefits. The total economic cost of the 18 technologies is only negative in Guangdong, Shanghai, and Beijing. In other provinces, the reduction of energy costs cannot offset the high investment costs. In most provinces, even the sum of health benefits and saved energy costs is less than the investment costs. At the provincial level, the promotion of the 18 technologies in the chemical sector only has positive total social benefits in a few provinces due to high economic costs. In eight provinces, such as Guangdong, Ningxia, and Hubei, the total social benefits of these technologies are positive, which is economically feasible. However, in other provinces, the total social benefits are negative.

5.3. Petrochemical Industry Health Impacts and Other Social-Environmental-Economic Parameters in Provincial Level

Table 7 shows that the petrochemical industry technologies can bring different health benefits to different provinces. Liaoning, Guangdong, Shandong, Xinjiang, and Shaanxi have the highest health benefits; among these provinces, Liaoning has the highest health benefits of 895 million RMB; Guangdong has the second highest of 841 million RMB.
Liaoning, Guangdong, Shandong, Xinjiang, and Shaanxi are major provinces with developed petrochemical industry. The output of petrochemical products is relatively high in these provinces. Therefore, the emission reduction of air pollutants brought by technology promotion in these provinces is higher than that in others. In addition, these provinces also have high population density, thereby leading to high premature mortality rate caused by air pollution. Thus, the health benefits of air pollutant reduction are relatively high. VSL is also important, as reflected in Guangdong. Guangdong’s VSL value is as high as 2.54 million RMB, thereby making Guangdong the second largest province in terms of health benefits.
Table 7 shows the economic costs, health benefits, and total social benefits of the 31 provinces in promoting the 22 technologies. All provinces have positive total social benefits as well as negative economic costs. Hence, the energy costs saved due to energy saving can offset the investment costs. Considering health benefits, the overall social benefits become high.

5.4. Analysis of Typical Provinces

In the analysis of one specific province, the performance of individual technology can be displayed clearly. For the chemical industry, Shaanxi province is taken as an example. Most chemical industry technologies perform quite well in Shaanxi; especially, tech14 has 122 million RMB of total social benefit. However, some technologies, such as tech12, have negative total social benefit because of its high investment cost.
For petrochemical industry, Guangdong province is taken as an example. Some technologies have quite high health benefit; for example, tech21 has 1148 million RMB net benefit, and tech15 has 461 million RMB of total social benefit. Almost all petrochemical technologies in this paper have positive social payoff in Guangdong.

5.5. Suggested Technologies

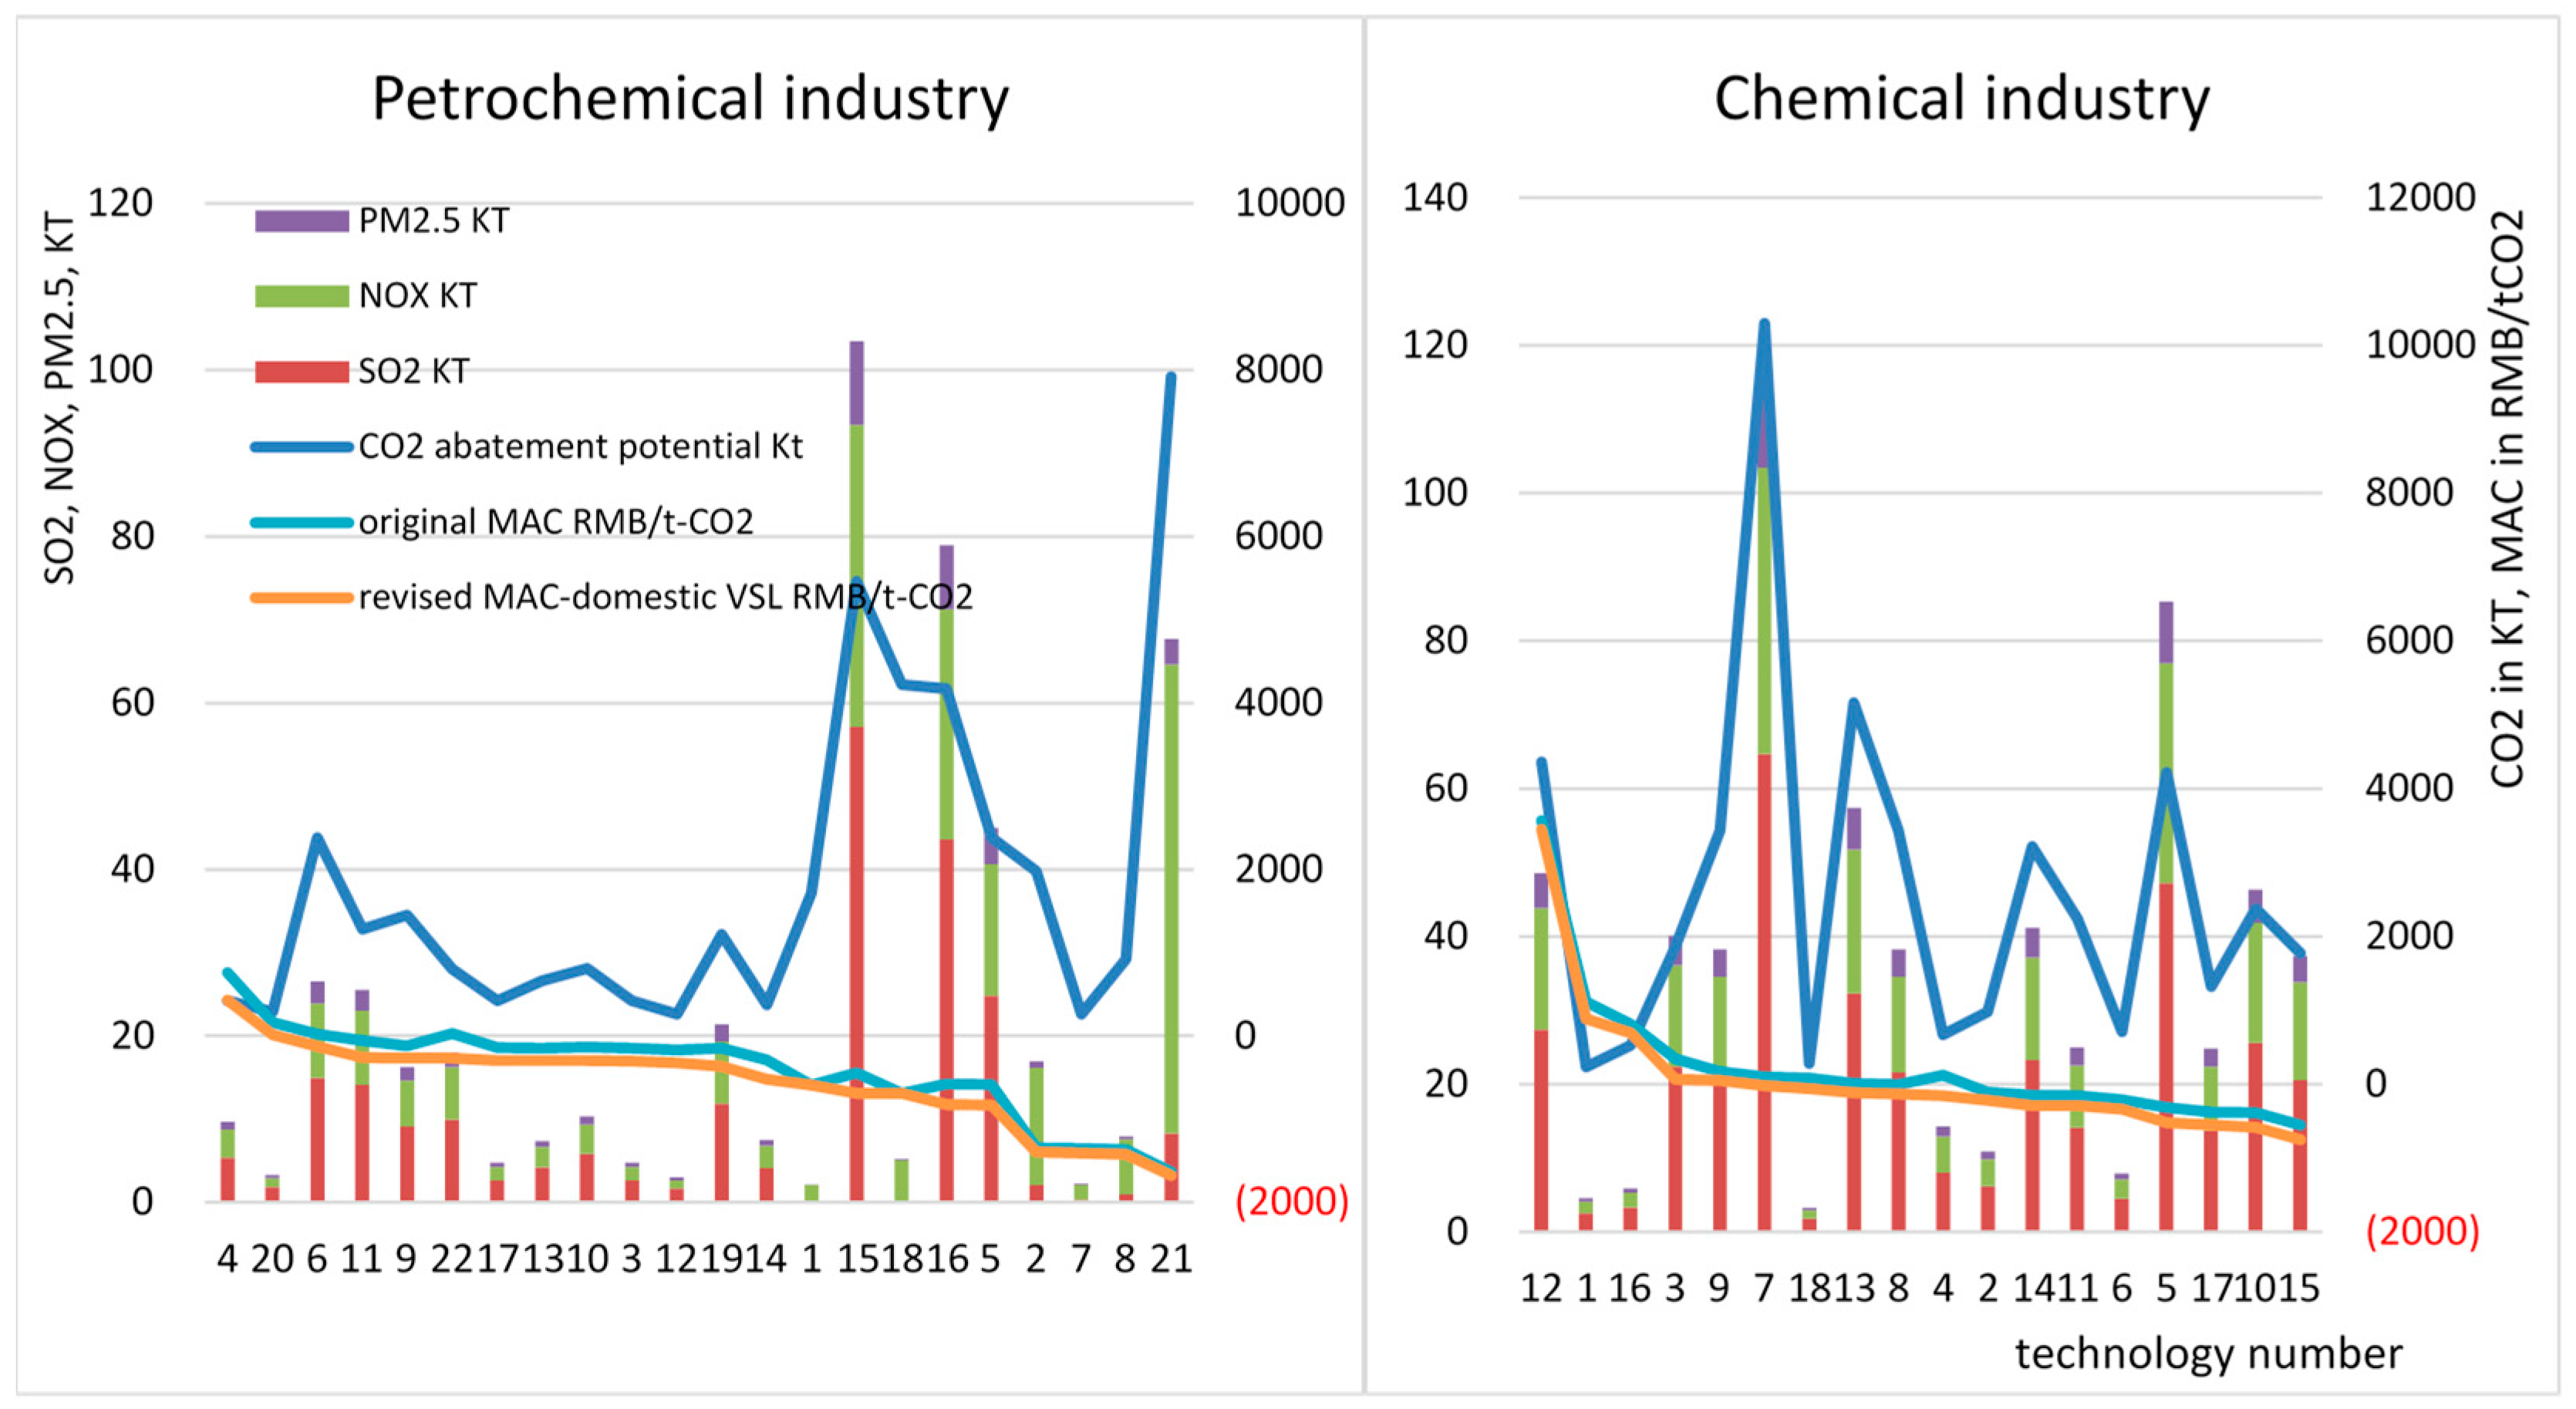
On the basis of the revised MACCs after considering the environmental health impact of air pollutants, the sequence of chemical industry technologies is shown in Figure 12. Tech15, tech10, and tech17 of the chemical sector are the top three technologies with the highest marginal social benefits. Hence, they are the most recommended for promoting in the chemical sector. Then, they are followed by tech5, tech6, tech11, and so on, successively. Figure 12 also shows the sequence of technologies in the petrochemical industry. Tech21, tech8, and tech7 have the highest marginal social benefit potential. Furthermore, the higher the air pollutant emission reduction potential is, the higher carbon abatement will be, and the higher social benefit will be.
At the provincial level, the sequence of technologies is different from that at the national level, and each province has its own special sequence. For the chemical industry technologies in Shaanxi, the sequence with highest marginal social benefit is tech15, tech10, tech17, tech5, tech6, tech14, and so on. The sequence of the technologies of petrochemical industry in Guangdong is similar with the national sequence. In Guangdong, tech21, tech8, tech7, tech2, tech5, tech16, and tech15 are the most recommended petrochemical industry technologies with the highest marginal social benefit and high air pollutant reduction potential.

6. Conclusions

This paper is a national and provincial level study. This study is focused on the carbon mitigation effect and the environmental benefit of the mitigation technologies in China’s petrochemical and chemical industry. In this study, MACCs are constructed. When considering the ignored health co-benefit, the original MACCs moves downward with reduction in cost. Health impact is calculated as avoided premature death and is monetized on the basis of the VSL. Instead of policy scenario analysis, this study focused on the mitigation technologies. Moreover, it aims to propose suggestions about ranking and promoting these technologies.
Compared with previous studies, the results of this study are reasonable. First, the emission reduction amounts of CO2 and air pollutants of the chemical and petrochemical industry are in reasonable ranges. Taking the study results of the steel and iron industry as example, Ma et al. [17] concluded the reduction of CO2 45.7–91.6 Mt, SO2 114.5–256.4 Kt, and PM2.5 20.2–49.9 Kt with reduction measures. Zhang et al. [18] found that emissions mitigation of GHGs and air pollutants would be 463 Mt of CO2eq, 253 Kt of PM, and 1392 Kt of SO2. The results of the present study for the chemical sector are CO2 47 Mt, SO2 361 Kt, NOx 220 Kt, and PM2.5 63 Kt.; for the petrochemical industry, the results are CO2 40 Mt, SO2 225 Kt, NOx 220 Kt, and PM2.5 42Kt. The ratios among the CO2 abatement and the air pollutant reduction are consistent with previous studies. Second, the health impact, which is the avoided premature death in this paper, is also consistent with other studies. The health impact is 8039 and 5105 in the chemical industry and the petrochemical industry, respectively, compared with 10,000 in the cement sector by Zhang et al. [15]. Third, the marginal health benefit of CO2 abatement of the chemical industry technologies is in the range of 111–277 RMB/t-CO2, whereas that of the petrochemical industry it is 4–327 RMB/t-CO2; basically, the results coincide with the range of 3–39 USD/t-CO2 in the cement sector [1]. Given the few studies about the chemical sector, the comparison between the results from this study and studies about other sectors can offer some reference for the rationality of study results.
The sequence of marginal abatement cost shows the result of comparing the economic feasibility of technologies. Among the 18 technologies in the chemical industry, waste heat utilization and technological process transformation technologies have the highest marginal abatement benefits. Specifically, the waste heat utilization and tail gas power generation (heat supply) technology in yellow phosphorus production process, new high-efficiency energy-saving membrane pole distance membrane electrolysis technology, and nitric acid production reaction waste heat residual pressure utilization technology are the top three technologies in marginal abatement social benefit. Besides, in the comparison of petrochemical technologies, efficiency improvement technology named clean and efficiency technology of vehicle fuel, waste heat utilization technology named comprehensive utilization technology of waste heat from oilfield production, and coating technology named Coating technology of nano-ceramic multi-space particle adiabatic energy-saving material are the top three for marginal abatement social benefit.
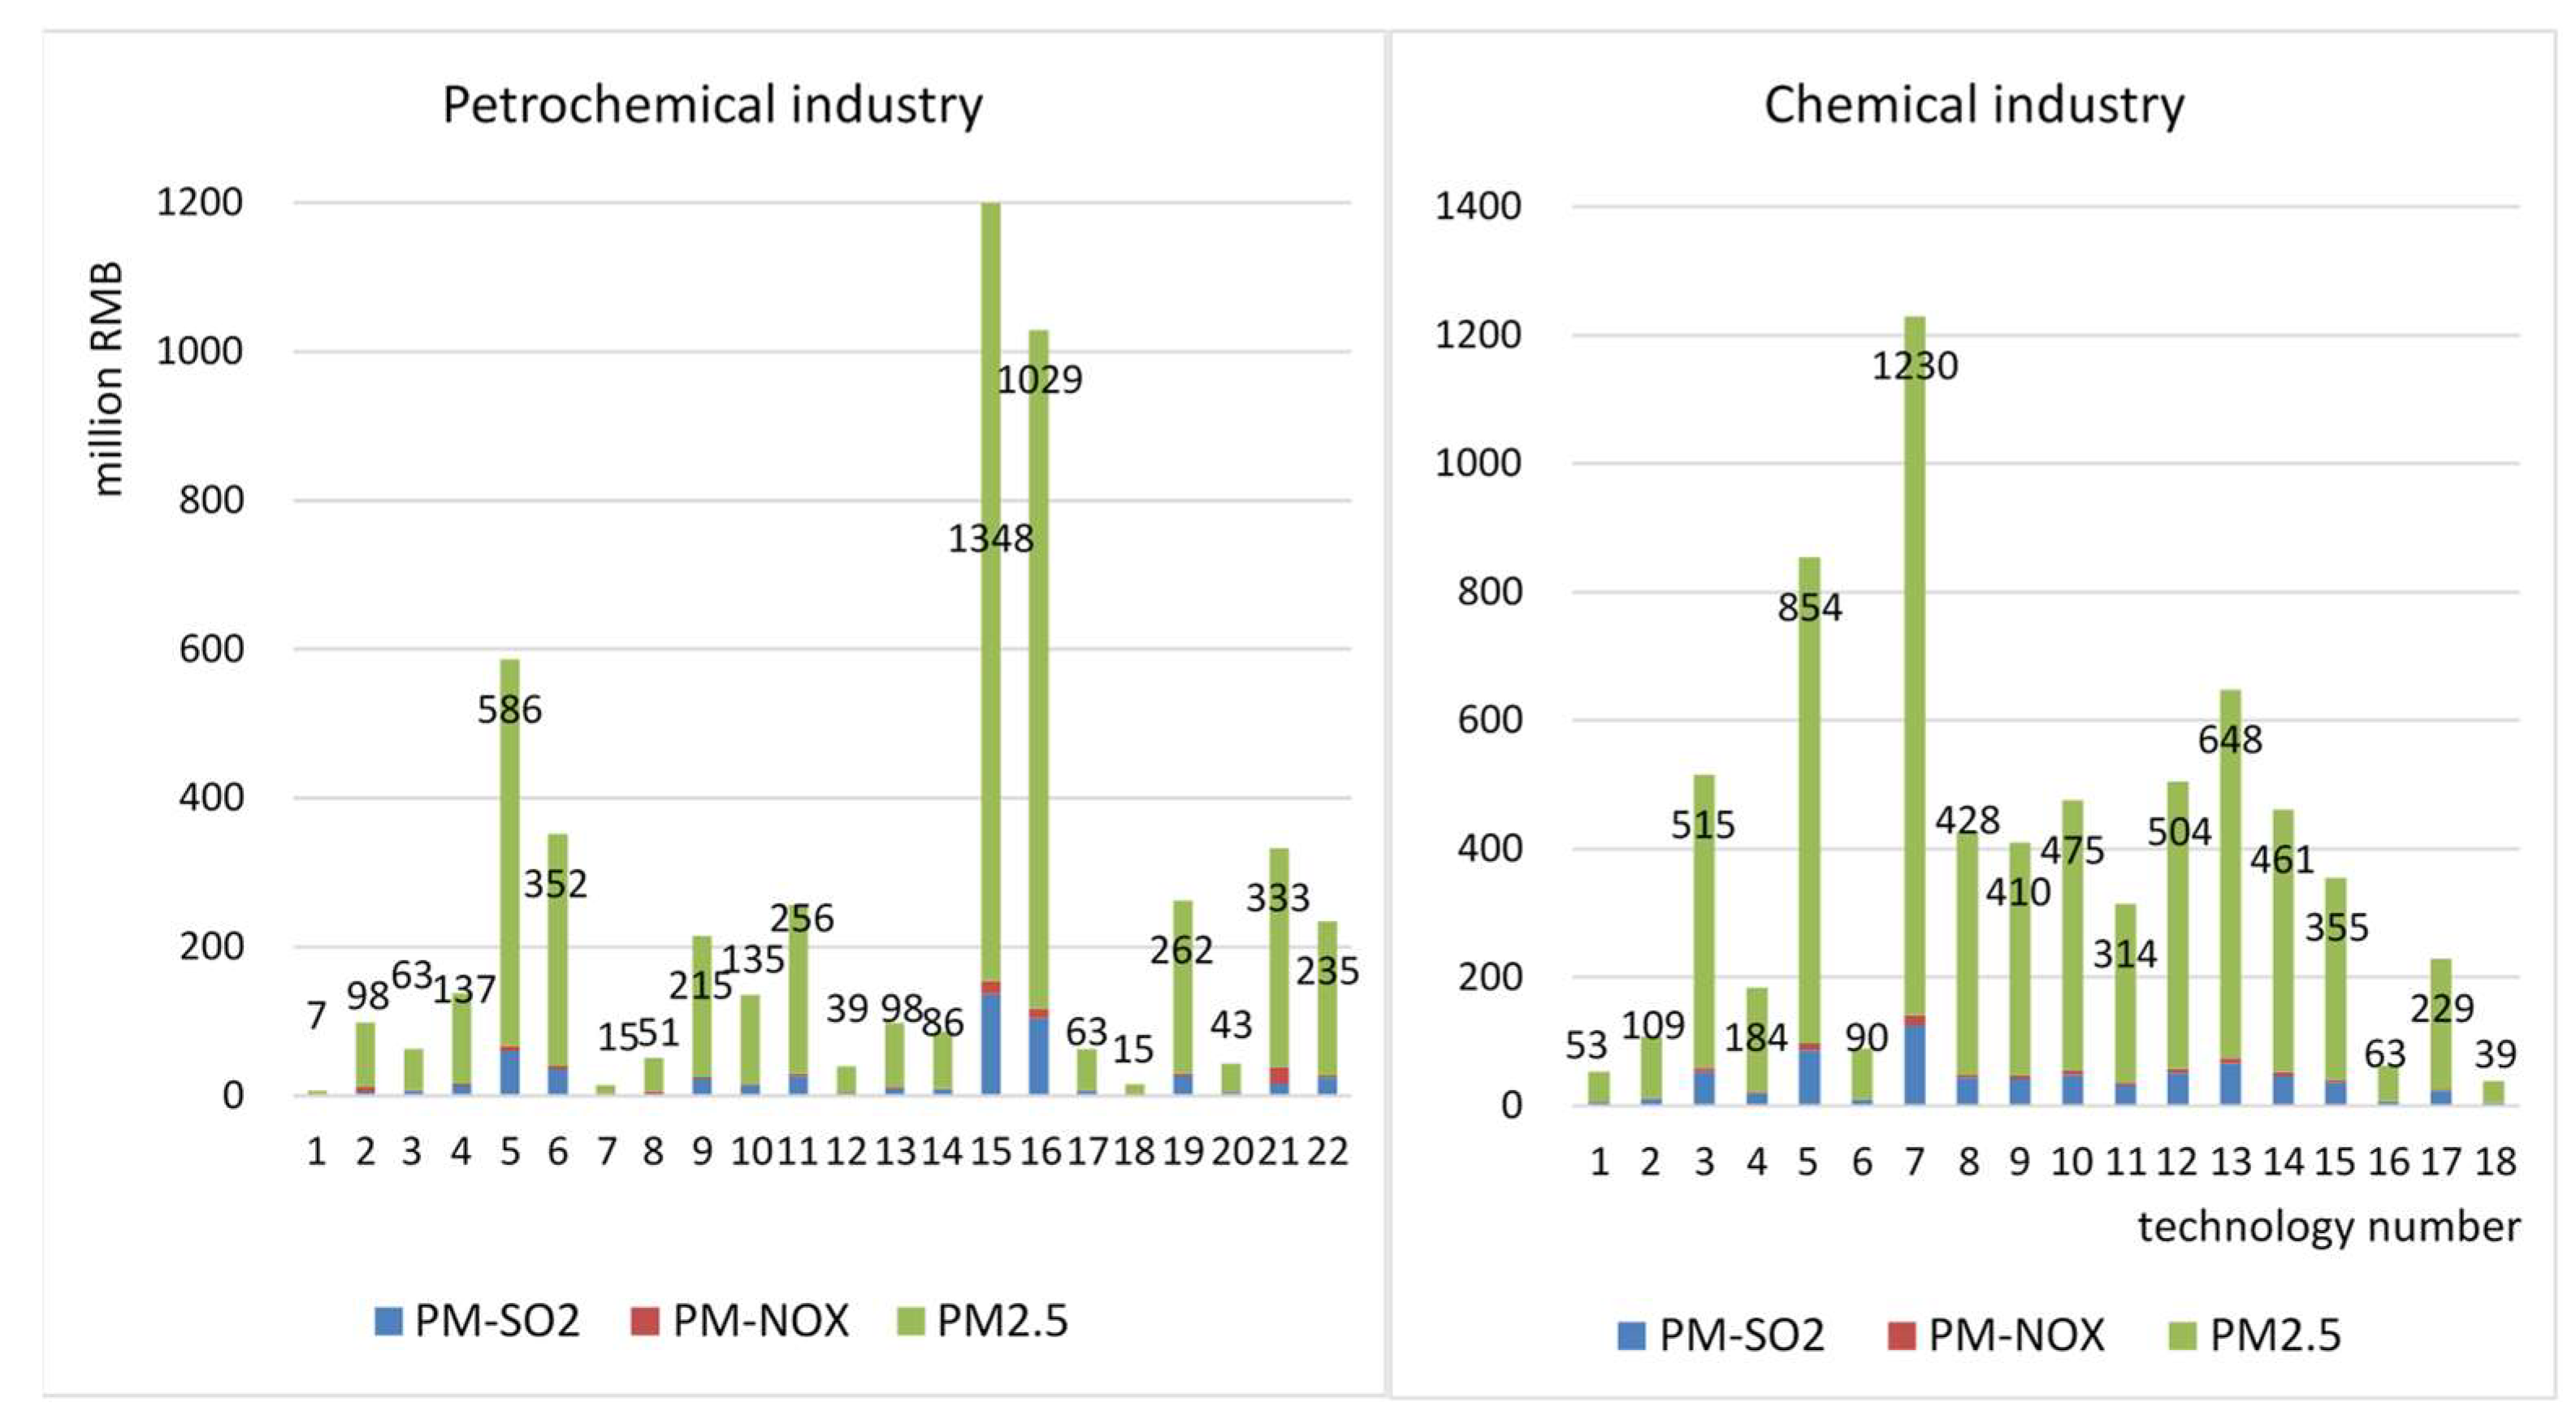
The carbon abatement and the air pollutant reduction show strong homology. High carbon abatements usually have large air pollutant reduction results too. Nationally, 8039 and 5105 premature deaths have been avoided by the promotion of chemical mitigation technologies and petrochemical mitigation technologies, respectively. The monetary value of health impact in these two sectors are 7.0 billion and 5.5 billion RMB, respectively.
The technology effect is further distributed to the provinces. In the chemical industry, Henan, Hubei, Xinjiang, Shaanxi, and Shandong achieve the largest health benefits. Henan province has 929 million RMB health benefit. For promoting petrochemical industry technologies, Liaoning, Guangdong, and Shandong provinces are the top three in evaluating health impact. Liaoning province has the highest health impact of 895 million RMB. Moreover, in analyzing typical provinces, one technological process transformation technology, which is named coal gasification multi-generation gas turbine power generation technology, performs quite well in Shaanxi with 122 million RMB of total social benefit. Almost all of the petrochemical technologies have positive social payoff in Guangdong. Examples of these technologies are clean and efficiency technology of vehicle fuel with 1148 million RMB net benefit and energy-saving optimization technology of industrial cooling circulating water system technology with 461 million RMB of total social benefit.
Technologies with the highest marginal abatement social benefits are recommended for priority promotion. In the chemical industry, the waste heat utilization and tail gas power generation (heat supply) technology in yellow phosphorus production process, new high-efficiency energy-saving membrane pole distance membrane electrolysis technology, and nitric acid production reaction waste heat residual pressure utilization technology are initially recommended. They are noted as tech15, tech10, and tech17, respectively. Also, in the petrochemical industry, clean and efficiency technology of vehicle fuel, comprehensive utilization technology of waste heat from oilfield production, and coating technology of nanoceramic multi-space particle adiabatic energy-saving material are mostly recommended to be promoted first. They are numbered tech21, tech8, and tech7, respectively.
The co-benefit evaluation has some uncertainties. Furthermore, the discussion at the provincial level increases the difficulties of handling these uncertainties. To reduce the uncertainties, the key parameters are considered in this paper. For example, different VSLs are used for each province, and two groups of VSLs are introduced and compared. Simultaneously, the uncertainty for exposure response coefficient poses a large challenge for the co-benefit studies. However, the study provides a good reference for other developing countries that are facing similar challenges. These countries include India, where oil demand in the petrochemical sector will increase from 0.4 to 1 million barrels per day from 2017 to 2040; and also, that in China increases from 1.8 to 2.7 million barrels per day, as forecasted by OPEC [66]. The recommended mitigation technologies, such as clean and efficiency technology of vehicle fuel, can have obvious co-benefit to help reduce the cost in the petrochemical industry. Moreover, the 11.2 tons SO2 reduction per kilotons of CO2 reduction in the chemical sector is also encouraging for other countries. When governments and enterprises pay the cost to reduce carbon dioxide emissions, air quality and residents’ health can be improved. This research can be a remarkable reference for such developing countries.

Author Contributions

Conceptualization, X.Y.; Data curation, X.Y., X.X. and S.G.; Formal analysis, X.Y., X.X. and S.G.; Funding acquisition, X.Y.; Investigation, X.Y., X.X., S.G., W.L. and X.F.; Methodology, X.Y. and X.X.; Project administration, X.Y.; Resources, X.F.; Software, X.Y. and X.X.; Supervision, X.Y.; Validation, X.Y. and X.X.; Visualization, X.X., S.G. and W.L.; Writing—Original draft, X.Y., X.X. and S.G.; Writing—Review & editing, X.Y., X.X. and W.L.

Funding

This research was funded by National Natural Science Foundation of China grant number 71704187, the Beijing Social Science Fund Grant number 17GLC045, and the fund of China University of Petroleum, Beijing grant number 2462016YJRC008.

Acknowledgments

The authors gratefully acknowledge the financial support from the National Natural Science Foundation of China (Grant no. 71704187), the Beijing Social Science Fund (Grant no. 17GLC045), and the fund of China University of Petroleum, Beijing (No. 2462016YJRC008).

Conflicts of Interest

The authors declare no conflict of interest.

Nomenclature

MACCMarginal abatement cost curves
China-MAPLEChina-Multi-pollutant Abatement Planning and Long-term benefit Evaluation Model
CBACost–benefit analysis
VSLthe value of statistical life
CVMContingent valuation method
WTPWillingness to pay
iFIntake fraction
ERCExposure-response coefficient
RRRelative risk

Appendix A

Table A1. Technology name and promotion rate.
NoTechnology NameCurrent Promotion Proportion, %
Petrochemical industry
1Liquefied natural gas recovery and liquefaction engineering for oil field machinery50
2Large-scale high-parameter plate-shell heat transfer technology40
3Heat recovery technology of glass plate heat exchanger<1
4Energy saving technology of closed linear long stroke pumping unit<1
5Energy-saving technology of thermal superconducting ceramic coating<1
6Closed-loop heat recovery technology of exhausted steam and condensate water10
7Coating technology of nano-ceramic multi-space particle adiabatic energy-saving material12
8Comprehensive utilization technology of waste heat from oilfield production2
9Ultrasonic on-line anti-fouling technology of heat exchanging equipment<1
10Waste heat utilization technology of hydrogen chloride synthesis1
11Energy-saving Urea production technology5
12A new type of absorption thermal converter technology<5
13High efficiency compound evaporative cooling (condensate) technology30
14Refining industrial phosphoric acid by solvent extraction5
15Energy-saving optimization technology of industrial cooling circulating water system<7
16Optimization of steam system operation and energy-saving technology30
17High radiation cladding Technology0.1
18Energy balance and optimal dispatching technology in petrochemical enterprises10
19Low temperature heat recovery power generation technology for aromatic plant4
20Heat transfer technology of high pressure and high efficiency winding tube15
21Clean and efficiency technology of vehicle fuel<1
22Flow stepless regulation technology of large reciprocating compressors5
Chemical industry
1Production of caustic soda by conversion gas and new cleaning technology 20
2Acid and low temperature heat recovery technology of ore or smelter gas 5
340.5MVA environmental protection and energy saving closed carbide production25
463MVA environmental protection and energy saving closed carbide production4
5Comprehensive technology of energy saving for ammonia synthesis 50
6Energy saving technology for catalytic combustion of coal <1
7Pulverized coal pressurized gasification technology 15
8Non slag molten slag coal water slurry staged gasification technology 15
9Multi nozzle opposed coal water slurry gasification technology 15
10New high-efficiency energy-saving membrane pole distance membrane electrolysis technology25
11Carbon black production process waste heat utilization and tail gas power (heating) generation50
12Top mounted multi nozzle pulverized coal pressurized gasifier technology 5
13Modular cascade regenerative clean coal gasification technology 1
14Coal gasification multi-generation gas turbine power generation technology<5
15Waste heat utilization and tail gas power (heat) generation in yellow phosphorus production 5
16Energy saving technology of isothermal transformation based on phase change heat transfer 1
17Nitric acid production reaction residual heat and pressure utilization technology50
18Energy saving technology of horizontal belt vacuum filtration 5

References

  1. Yang, X.; Teng, F.; Wang, G. Incorporating environmental co-benefits into climate policies: A regional study of the cement industry in China. Appl. Energy 2013, 112, 1446–1453. [Google Scholar] [CrossRef]
  2. Dong, H.; Dai, H.; Dong, L.; Fujita, T.; Geng, Y.; Klimont, Z.; Inoue, T.; Bunya, S.; Fujii, M.; Masui, T. Pursuing air pollutant co-benefits of CO2 mitigation in China: A provincial leveled analysis. Appl. Energy 2015, 144, 165–174. [Google Scholar] [CrossRef]
  3. Zeng, A.; Mao, X.; Hu, T.; Xing, Y.; Gao, Y.; Zhou, J.; Qian, Y. Regional co-control plan for local air pollutants and CO2 reduction: Method and practice. J. Clean. Prod. 2017, 140, 1226–1235. [Google Scholar] [CrossRef]
  4. Peng, W.; Yang, J.; Wagner, F.; Mauzerall, D.L. Substantial air quality and climate co-benefits achievable now with sectoral mitigation strategies in China. Sci. Total Environ. 2017, 598, 1076–1084. [Google Scholar] [CrossRef] [PubMed]
  5. Li, X.; Qiao, Y.; Shi, L. The aggregate effect of air pollution regulation on CO2 mitigation in China’s manufacturing industry: An econometric analysis. J. Clean. Prod. 2017, 142, 976–984. [Google Scholar] [CrossRef]
  6. Yang, S.; Chen, B.; Ulgiati, S. Co-benefits of CO2 and PM2.5 Emission Reduction. Energy Procedia 2016, 104, 92–97. [Google Scholar] [CrossRef]
  7. Liu, G.; Yang, Z.; Chen, B.; Zhang, Y.; Su, M.; Ulgiati, S. Prevention and control policy analysis for energy-related regional pollution management in China. Appl. Energy 2016, 166, 292–300. [Google Scholar] [CrossRef]
  8. Jiang, P.; Chen, Y.; Geng, Y.; Dong, W.; Xue, B.; Xu, B.; Li, W. Analysis of the co-benefits of climate change mitigation and air pollution reduction in China. J. Clean. Prod. 2013, 58, 130–137. [Google Scholar] [CrossRef]
  9. Yang, X.; Xi, X.; Lin, W.; Guo, S.; Feng, X.; Gilmore, E. Evaluation of environmental health benefits of China’s building energy conservation policies: An integrated assessment on national and provincial levels. Int. J. Environ. Health Res. 2018, 28:3, 215–239. [Google Scholar] [CrossRef] [PubMed]
  10. Xie, Y.; Dai, H.; Dong, H.; Hanaoka, T.; Masui, T. Economic Impacts from PM2.5 Pollution-Related Health Effects in China: A Provincial-Level Analysis. Environ. Sci. Technol. 2016, 50, 4836–4843. [Google Scholar] [CrossRef] [PubMed]
  11. Yang, X.; Teng, F.; Xi, X.; Khayrullin, E.; Zhang, Q. Cost–benefit analysis of China’s Intended Nationally Determined Contributions based on carbon marginal cost curves. Appl. Energy 2018, 227, 415–425. [Google Scholar] [CrossRef]
  12. Gao, T.; Li, G.; Xu, M.; Wang, X.; Liang, F.; Zeng, Q.; Pan, X. Health economic loss evaluation of ambient PM2.5 pollution based on willingness to pay. J. Environ. Health 2015, 8, 697–700. (In Chinese) [Google Scholar]
  13. Xi, Y.; Fei, T.; Gehua, W. Quantifying co-benefit potentials in the Chinese cement sector during 12th Five Year Plan: An analysis based on marginal abatement cost with monetized environmental effect. J. Clean. Prod. 2013, 58, 102–111. [Google Scholar] [CrossRef]
  14. Zhang, S.; Worrell, E.; Crijns-Graus, W. Evaluating co-benefits of energy efficiency and air pollution abatement in China’s cement industry. Appl. Energy 2015, 147, 192–213. [Google Scholar] [CrossRef]
  15. Zhang, S.; Worrell, E.; Crijns-Graus, W.; Krol, M.; de Bruine, M.; Geng, G.; Wagner, F.; Cofala, J. Modeling energy efficiency to improve air quality and health effects of China’s cement industry. Appl. Energy 2016, 184, 574–593. [Google Scholar] [CrossRef]
  16. Li, N.; Ma, D.; Chen, W. Quantifying the impacts of decarbonisation in China’s cement sector: A perspective from an integrated assessment approach. Appl. Energy 2017, 185, 1840–1848. [Google Scholar] [CrossRef]
  17. Ma, D.; Wang, L.; Yin, X.; Chen, W. Co-benefits of Reducing Carbon Emissions in China’s Iron and Steel Industry. Energy Procedia 2014, 61, 1557–1560. [Google Scholar] [CrossRef]
  18. Zhang, S.; Worrell, E.; Crijns-Graus, W.; Wagner, F.; Cofala, J. Co-benefits of energy efficiency improvement and air pollution abatement in the Chinese iron and steel industry. Energy 2014, 78, 333–345. [Google Scholar] [CrossRef]
  19. Lin, B.; Long, H. A stochastic frontier analysis of energy efficiency of China’s chemical industry. J. Clean. Prod. 2015, 87, 235–244. [Google Scholar] [CrossRef]
  20. WEO. 2017. Available online: https://www.iea.org/weo2017/#section-4 (accessed on 21 June 2018).
  21. Industry Statistics Division. China Industrial Statistics Yearbook 2016; China Statistics Press: Beijing, China, 2016; ISBN 978-7-5037-7964-0.
  22. Energy Statistics Division, National Bureau of Statistics. China Energy Statistics Yearbook 2016; China Statistics Press: Beijing, China, 2016.
  23. Zhou, W.; Zhu, B.; Li, Q.; Ma, T.; Hu, S.; Griffy-Brown, C. CO2 emissions and mitigation potential in China’s ammonia industry. Energy Policy 2010, 38, 3701–3709. [Google Scholar] [CrossRef]
  24. Chen, Q.; Lv, M.; Wang, D.; Tang, Z.; Wei, W.; Sun, Y. Eco-efficiency assessment for global warming potential of ethylene production processes: A case study of China. J. Clean. Prod. 2017, 142, 3109–3116. [Google Scholar] [CrossRef]
  25. Liu, X.; Chen, D.; Zhang, W.; Qin, W.; Zhou, W.; Qiu, T.; Zhu, B. An assessment of the energy-saving potential in China’s petroleum refining industry from a technical perspective. Energy 2013, 59, 38–49. [Google Scholar] [CrossRef]
  26. Xie, X.; Shao, S.; Lin, B. Exploring the driving forces and mitigation pathways of CO2 emissions in China’s petroleum refining and coking industry: 1995–2031. Appl. Energy 2016, 184, 1004–1015. [Google Scholar] [CrossRef]
  27. Weng, Y.; Yan, G.; Li, Y.; Guo, S. Integrated substance and energy flow analysis towards CO2 emission evaluation of gasoline & diesel production in Chinese fuel-refinery. J. Clean. Prod. 2016, 112, 4107–4113. [Google Scholar] [CrossRef]
  28. Han, Y.; Zhu, Q.; Geng, Z.; Xu, Y. Energy and carbon emissions analysis and prediction of complex petrochemical systems based on an improved extreme learning machine integrated interpretative structural model. Appl. Therm. Eng. 2017, 115, 280–291. [Google Scholar] [CrossRef]
  29. Geng, Z.; Dong, J.; Han, Y.; Zhu, Q. Energy and environment efficiency analysis based on an improved environment DEA cross-model: Case study of complex chemical processes. Appl. Energy 2017, 205, 465–476. [Google Scholar] [CrossRef]
  30. Chen, Y.; Han, Y.; Zhu, Q. Energy and environmental efficiency evaluation based on a novel data envelopment analysis: An application in petrochemical industries. Appl. Therm. Eng. 2017, 119, 156–164. [Google Scholar] [CrossRef]
  31. National Bureau of Statistics of China. Annual Data. Available online: http://www.stats.gov.cn/tjsj/ndsj/ (accessed on 4 September 2017).
  32. Energy Statistics Division, National Bureau of Statistics. China Energy Statistics Yearbook 2000–2016; China Statistics Press: Beijing, China, 2016.
  33. Natonal Standards |GB/T 2589-2008 n.d. Available online: http://www.gb688.cn/bzgk/gb/newGbInfo?hcno=F2113A2857611297ECF9A1683BE77F15 (accessed on 4 September 2017).
  34. 2015 Energy Statistics n.d. Available online: https://wenku.baidu.com/view/54dfe3fdbcd126fff6050b2a.html (accessed on 23 July 2018).
  35. National Bureau of Statistics of China. Environmental Statistics. Available online: http://www.stats.gov.cn/ztjc/ztsj/hjtjzl/ (accessed on 4 September 2017).
  36. Integrated Work Plan for Energy Conserve and Emission Mitigation During the Thirteenth Five Year Period (Guofa(2016)74). Available online: http://www.ndrc.gov.cn/gzdt/201701/t20170105_834501.html (accessed on 23 July 2018).
  37. Work Plan for Control the Green House Gas Emission During the Thirteenth Five Year Period. Available online: http://www.gov.cn/zhengce/content/2016-11/04/content_5128619.htm (accessed on 23 July 2018).
  38. Development Program for the Energy Conservation and Environment Protection Industries during the Thirteenth Five Year Period. Available online: http://hzs.ndrc.gov.cn/newzwxx/201612/t20161226_832641.html (accessed on 23 July 2018).
  39. Industrial Green Development Program (2016–2020). Available online: http://ghs.ndrc.gov.cn/ghwb/gjjgh/201706/t20170621_851924.html (accessed on 23 July 2018).
  40. Development Program for Petrochemical and Chemical Industries (2016–2020). Available online: http://ghs.ndrc.gov.cn/ghwb/gjjgh/201706/t20170622_852133.html (accessed on 23 July 2018).
  41. Gilmore, E.A.; Patwardhan, A. Passenger vehicles that minimize the costs of ownership and environmental damages in the Indian market. Appl. Energy 2016, 184, 863–872. [Google Scholar] [CrossRef]
  42. National Development and Reform Commission. Directory of National Key Energy Saving and Low Carbon Technology Promotion (2016, Energy Saving Part). Available online: http://www.ndrc.gov.cn/zcfb/zcfbgg/201701/t20170119_835577.html (accessed on 29 October 2018).
  43. Yang, X.; Teng, F. The air quality co-benefit of coal control strategy in China. Resour. Conserv. Recycl. 2018, 129, 373–382. [Google Scholar] [CrossRef]
  44. The New Climate Economy. Better Growth Better Climate. The New Climate Economy. Available online: https://newclimateeconomy.report/2014/ (accessed on 29 October 2018).
  45. Cai, C.; Chen, C.; Qiao, X.; Zheng, X. Application of Contingent Valuation Method to Estimate Health Economic Loss Caused by Environmental Pollution. J. Environ. Health 2007, 4, 265–267. (In Chinese) [Google Scholar]
  46. Ting, G.; Guoxing, L.; Meimei, X.; Xuying, W.; Fengchao, L.; Qiang, Z.; Xiaochuan, P. Evaluation of Atmospheric PM2.5 Health Economic Loss Based on Willingness to Pay. J. Environ. Health 2015, 32, 697–700. [Google Scholar]
  47. Wang, P. Study on Economic Loss of Atmospheric Particle Pollution Harm in Harbin; Harbin University of Science and Technology: Harbin, China, 2015. [Google Scholar]
  48. Zeng, X.; Yan, J. Statistical Life Value Assessment in Air Pollution Health Loss. China Environ. Sci. 2010, 30, 284–288. [Google Scholar]
  49. Wang, H.; Mullahy, J. Willingness to pay for reducing fatal risk by improving air quality: A contingent valuation study in Chongqing, China. Sci. Total Environ. 2006, 367, 50–57. [Google Scholar] [CrossRef] [PubMed]
  50. Xu, X.; Chen, R.; Kan, H.D.; Ying, X. Meta-analysis of statistical life value related to air pollution in China. Chin. Health Resour. 2013, 1, 64–67. (In Chinese) [Google Scholar]
  51. Apte, J.S.; Bombrun, E.; Marshall, J.D.; Nazaroff, W.W. Global intraurban intake fractions for primary air pollutants from vehicles and other distributed sources. Environ. Sci. Technol. 2012, 46, 3415–3423. [Google Scholar] [CrossRef] [PubMed]
  52. Humbert, S.; D Marshall, J.; Shaked, S.; Spadaro, J.; Nishioka, Y.; Preiss, P.; E McKone, T.; Horvath, A.; Jolliet, O. Intake Fraction for Particulate Matter: Recommendations for Life Cycle Impact Assessment. Environ. Sci. Technol. 2011, 45, 4808–4816. [Google Scholar] [CrossRef] [PubMed]
  53. Greco, S.L.; Belova, A.; Huang, J. Benefits of Decreased Mortality Risk from Reductions in Primary Mobile Source Fine Particulate Matter: A Limited Data Approach for Urban Areas Worldwide. Risk Anal. 2016, 36, 1783–1802. [Google Scholar] [CrossRef] [PubMed]
  54. Pope, C.A., III. Lung Cancer, Cardiopulmonary Mortality, and Long-term Exposure to Fine Particulate Air Pollution. JAMA 2002, 287, 1132. [Google Scholar] [CrossRef] [PubMed] [Green Version]
  55. Cao, J.; Yang, C.; Li, J.; Chen, R.; Chen, B.; Gu, D.; Kan, H. Association between long-term exposure to outdoor air pollution and mortality in China: A cohort study. J. Hazard. Mater. 2011, 186, 1594–1600. [Google Scholar] [CrossRef] [PubMed]
  56. Fang, D.; Wang, Q.; Li, H.; Yu, Y.; Lu, Y.; Qian, X. Mortality effects assessment of ambient PM2.5 pollution in the 74 leading cities of China. Sci. Total Environ. 2016, 569–570, 1545–1552. [Google Scholar] [CrossRef] [PubMed]
  57. Die, F. Study on the impact of air pollution on population health in major cities in China. Master’s Thesis, Nanjing University, Nanjing, China, 2014. [Google Scholar]
  58. World Health Organization. WHO|Global Status Report on Noncommunicable Diseases 2010; World Health Organization: Geneva, Switzerland, 2011. [Google Scholar]
  59. ExternE: Externalities of Energy; Methodology 2005 Update; Bickel, P.; Kommission, E. (Eds.) EUR; Office for Official Publications of the European Communities: Luxembourg, 2005; ISBN 978-92-79-00423-0. [Google Scholar]
  60. Rabl, A.; Spadaro, J.V.; Holland, M. How Much Is Clean Air Worth? Calculating the Benefits of Pollution Control. Available online: /core/books/how-much-is-clean-air-worth/51E232ACA023DADF7286088BC7AB9B7E (accessed on 28 Febuary 2018).
  61. Hammitt, J.K.; Zhou, Y. The Economic Value of Air-Pollution-Related Health Risks in China: A Contingent Valuation Study. Environ Resource Econ 2006, 33, 399–423. [Google Scholar] [CrossRef]
  62. Kesicki, F.; Strachan, N. Marginal abatement cost (MAC) curves: Confronting theory and practice. Environ. Sci. Policy 2011, 14, 1195–1204. [Google Scholar] [CrossRef]
  63. Chen, Q.; Lv, M.; Gu, Y.; Yang, X.; Tang, Z.; Sun, Y.; Jiang, M. Hybrid Energy System for a Coal-Based Chemical Industry. Joule 2018, 2, 607–620. [Google Scholar] [CrossRef]
  64. Chen, W. The costs of mitigating carbon emissions in China: Findings from China MARKAL-MACRO modeling. Energy Policy 2005, 33, 885–896. [Google Scholar] [CrossRef]
  65. Wächter, P. The usefulness of marginal CO2-e abatement cost curves in Austria. Energy Policy 2013, 61, 1116–1126. [Google Scholar] [CrossRef]
  66. Organization of the Petroleum Exporting Countries. World Oil Outlook 2040. Organization of the Petroleum Exporting Countries. 2018. Available online: https://woo.opec.org/index.html (accessed on 23 October 2018).
Figure 1. Historical final energy consumption. Final energy consumption in industry has been going up as the total final energy consumption increased in the past fifteen years, and the proportion has decreased sharply in the 12th year plan. Source: State Statistics Bureau—China Statistical Year Book (2000–2016) [31].
Energies 11 03331 g001
Figure 2. Final energy consumption in the petrochemical and chemical subsector. Final energy consumption in the petrochemical and chemical industry has a stable increase in recent years and the total proportion in the whole industry energy consumption is 26.43% in 2015. Source: China Energy Statistical Yearbook (2000–2016) [32].
Energies 11 03331 g002
Figure 3. Energy intensity. Energy intensity of petrochemical and chemical industry has been decreasing with the decrease of the whole industry, and the rate of decent has become stable since 2010. Source: State Statistics Bureau—China Statistical Year Book (2000–2016) [31].
Energies 11 03331 g003
Figure 4. Historical CO2 emissions and proportions. Total amount of CO2 emission is over 6 billion tons in the petrochemical and chemical industry, a proportion of nearly 60% of the whole industry emissions. Source: China Statistical Yearbook (2000–2016), China Energy Statistical Year book (2000–2016), National Standard GB/T2589-2008, 2015 Energy Statistics [31,32,33,34].
Energies 11 03331 g004
Figure 5. CO2 emissions per 10,000 Value. CO2 emissions per 10,000 value-added has been decreasing since 2000, and the rate of decline in the petrochemical and chemical industry is faster than the whole industry. Source: China Statistical Yearbook (2000–2016), China Energy Statistical Yearbook (2000–2016) [31,32].
Energies 11 03331 g005
Figure 6. Industrial waste gas emissions. Source: China Environmental Statistical Yearbook (2003–2015) [35].
Energies 11 03331 g006
Figure 7. Annual emission reduction potential of CO2 and air pollutants.
Energies 11 03331 g007
Figure 8. MACC in petrochemical and chemical industry.
Energies 11 03331 g008
Figure 9. Economic cost, health benefit and net benefit.
Energies 11 03331 g009
Figure 10. Health benefits from technologies.
Energies 11 03331 g010
Figure 11. Synthetic ammonia production shares of provinces in China, million tons.
Energies 11 03331 g011
Figure 12. Technical sequencing of technologies.
Energies 11 03331 g012
Table 1. National Programs of mitigation for certain industries.
SectorEnergy Consumption per GDPCO2 Emission per GDPChemical Oxygen DemandAmmonia NitrogenSO2NO2VOC
All industries15%18%10%10%15%15%Over 10%
Industry (tons/year)18%22%500,00050,000500,0001,800,000--
Petrochemical and chemical18%18%10%10%15%15%Over 30%
Sources: The Integrated Work Plan for Energy Conserve and Emission Mitigation During the Thirteenth Five Year Period; Work Plan for Control the Green House Gas Emission During the Thirteenth Five Year Period; Industrial Green Development Program (2016–2020); Development Program for Petrochemical and Chemical Industries (2016–2020) [36,37,39,40].
Table 2. Main parameters of mitigation technologies.
CategoryTechnical TypeTechnoPromotion Potential in 5 YearsExpected 5-year Total InvestmentExpected Energy Saving Capacity Expected CO2 Emission Reduction Capacity
%M RMBKtce/aMtCO2/a
Petrochemical industry
AEfficiency improvements16010256501.72
4530001800.42
114033754701.28
13702502500.66
14506001400.37
218100030007.92
225030003600.8
BHeat exchanger technology28030007501.98
9407605501.45
20355601100.29
CWaste heat utilization technology3201501600.42
65029009002.38
83012703500.92
1020506.83500.81
1210701000.26
194027004601.22
DCoating technology7304001000.26
532709002.38
17101651600.42
ESystem optimization1520450020705.46
165064015804.17
1830225016004.22
Chemical industry
FTechnological process Transformation1352000900.23
125082,50016504.36
1420120014003.22
162527002000.53
105026009002.38
GWaste heat utilization technology2306003700.98
570623716004.22
118010208502.24
135600019505.16
15503606701.77
177017005001.32
HEquipment modification3408211.27001.86
18304201100.28
IFuel Improvement4122199.842500.67
63272700.71
76016,000390010.3
830325013003.43
930650013003.43
Table 3. The domestic VSL studies and the base year value.
RegionVSL and Study YearVSL of Year 2015Referred Study
Beijing 0.667~1.33 million RMB, 20140.679~1.357 million RMBGao et al. [46]
Heilongjiang 1 million RMB, 20131.026 million RMBWang [47]
Shanghai 0.80~1.20 million RMB, 20100.931~1.396 million RMBZeng and Jiang [48]
Guangxi 0.80~1.20 million RMB, 20100.926~1.389 million RMBZeng and Jiang [48]
Chongqing 0.286 million RMB, 19980.385 million RMBWang and Mullahy [49]
National average0.32~1.59 million RMB, 20080.377~1.872 million RMBXu et al. [50]
Table 4. Chemical sector CO2 marginal abatement cost (MAC).
ItemsTechs123456789101112131415161718
CO2 abatement potentialKt2309801860670422071010,300343034302380224043605160322017705301320280
original MACRMB/t-CO21114−109343121−315−214101−6169−383−153356512−150−552810−37781
original sequence178151345129142618107116311
revised MAC-domestic VSLRMB/t-CO2883−22065−154−517−340−19−13149−583−2943449−113−293−753692−550−57
revised sequence178159451310142618117116312
revised MAC-USA VSLRMB/t-CO2186−513−717−931−1094−697−374−526−306−1418−8183121−468−746−1151344−1194−474
revised sequence161185491410151618137317212
Table 5. Petrochemical industry CO2 marginal abatement cost (MAC).
ItemsTechs12345678910111213141516171819202122
CO2 abatement Kt17201980420420238023802609201450810128026066037054604170420422012202907920800
original MACRMB/t-CO2−591−1349−152759−58622−1357−1370−118−131−58−172−146−291−445−579−145−689−152164−163226
original sequence64122271932171618111410981551321120
revised MAC1RMB/t-CO2−595−1399−301432−832−126−1413−1426−266−298−258−322−294−524−692−826−294−692−36715−1674−267
revised sequence94132252032181419121510861671121117
revised MAC2RMB/t-CO2−605−1557−754−381−1569−576−1557−1568−717−749−846−780−745−966−1430−1564−747−703−1169−433−1852−1144
revised sequence19513222206317141112161074151882119
Table 6. Chemical industry provincial data.
RegionsSO2 ReducedNOX ReducedPM2.5 ReducedPremature DeathVSLHealth BenefitsInvestmentEnergy Fee SavedTotal Social Benefits
tontontonpersonmillion RMBmillion RMBmillion RMBmillion RMBmillion RMB
Beijing5513309791.361291619
Tianjin22811396401360.802913094−6
Hebei13,233829923323190.421331254512−609
Shanxi20,72612,52136424380.411792217716−1321
Inner Mongolia33,09320,00758157830.5341917721088−265
Liaoning505131078891131.43162423189−71
Jilin28251702496631.036522098−57
Heilongjiang37172235653871.0389292126−77
Shanghai31201921549441.406294135103
Jiangsu19,52511,92234343600.7426816011045−288
Zhejiang611037131074920.938639533526
Anhui15,119927526603300.421391456721−596
Fujian39572398696850.6253383174−157
Jiangxi20431245359430.4218928411
Shandong43,44826,63976439590.5452135081956−1032
Henan28,65917,44350396691.3992928271090−809
Hubei22,67814,74040074981.688341964120070
Hunan5792353210181271.60203485269−13
Guangdong46252783812902.54228119194303
Guangxi442727297791091.39151438213−74
Hainan45012719791851.60136390203−51
Chongqing12,154733621362690.381031015515−396
Sichuan15,550941027333630.321161593718−759
Guizhou13,568819323843500.2485962599−277
Yunnan15,622972327513610.28991010607−304
Xizang00000.210000
Shaanxi18,56211,20232613941.415571273661−55
Gansu524031569211201.04125380215−41
Qinghai18251105321541.2668123582
Ningxia16,75510,05729433601.41506889487104
Xinjiang15,763961027724301.365861392561−245
Total360,519220,44963,40680391.87696128,70514,880−6864
Table 7. Petrochemical industry provincial data.
RegionsSO2 ReducedNOX ReducedPM2.5 ReducedPremature DeathVSLHealth BenefitsInvest-mentEnergy Fee SavedTotal Social Benefits
tontontonpersonmillion RMBmillion RMBmillion RMBmillion RMBmillion RMB
Beijing22322024410381.365274322300
Tianjin6159604011471040.80833041028808
Hebei6488779712521720.427118712711155
Shanxi19051170335400.4117808420
Inner Mongolia35452501633850.534693231184
Liaoning26,74223,53649096241.4389558632373546
Jilin38083442702891.0392102507497
Heilongjiang8352841915642091.0321433614081286
Shanghai7872691214411161.40162220858799
Jiangsu11,49314,97122572370.7417633227612605
Zhejiang8830866516501420.9313225514491325
Anhui34522450616770.423292294234
Fujian8376755115441880.6211726312411095
Jiangxi28942072517620.422671258214
Shandong43,73152,769845810610.54576108891278616
Henan476542688781171.39162171589579
Hubei6992537712581561.68262188626699
Hunan31722824583731.6011669421468
Guangdong15,94316,31229973322.5484146530073384
Guangxi5668460310281431.39199134697762
Hainan37613302690741.60118122600597
Chongqing585358103130.385212711
Sichuan5458476810021330.3243149661555
Guizhou1148695202300.247375323
Yunnan1118712197260.287324318
Xizang00000.210000
Shaanxi10,952971120122431.4134439813901336
Gansu5661436710221331.04139125542556
Qinghai756705140241.2630309494
Ningxia27372469505621.418756314346
Xinjiang10,617946819523031.3641339711811197
total225,21322,025842,00451051.875465647834,32333,310

