
Hydrogen Storage Capacity of Tetrahydrofuran and Tetra-N-Butylammonium Bromide Hydrates Under Favorable Thermodynamic Conditions

Abstract
:1. Introduction
2. Materials and Methods
2.1. Materials
2.2. Methods
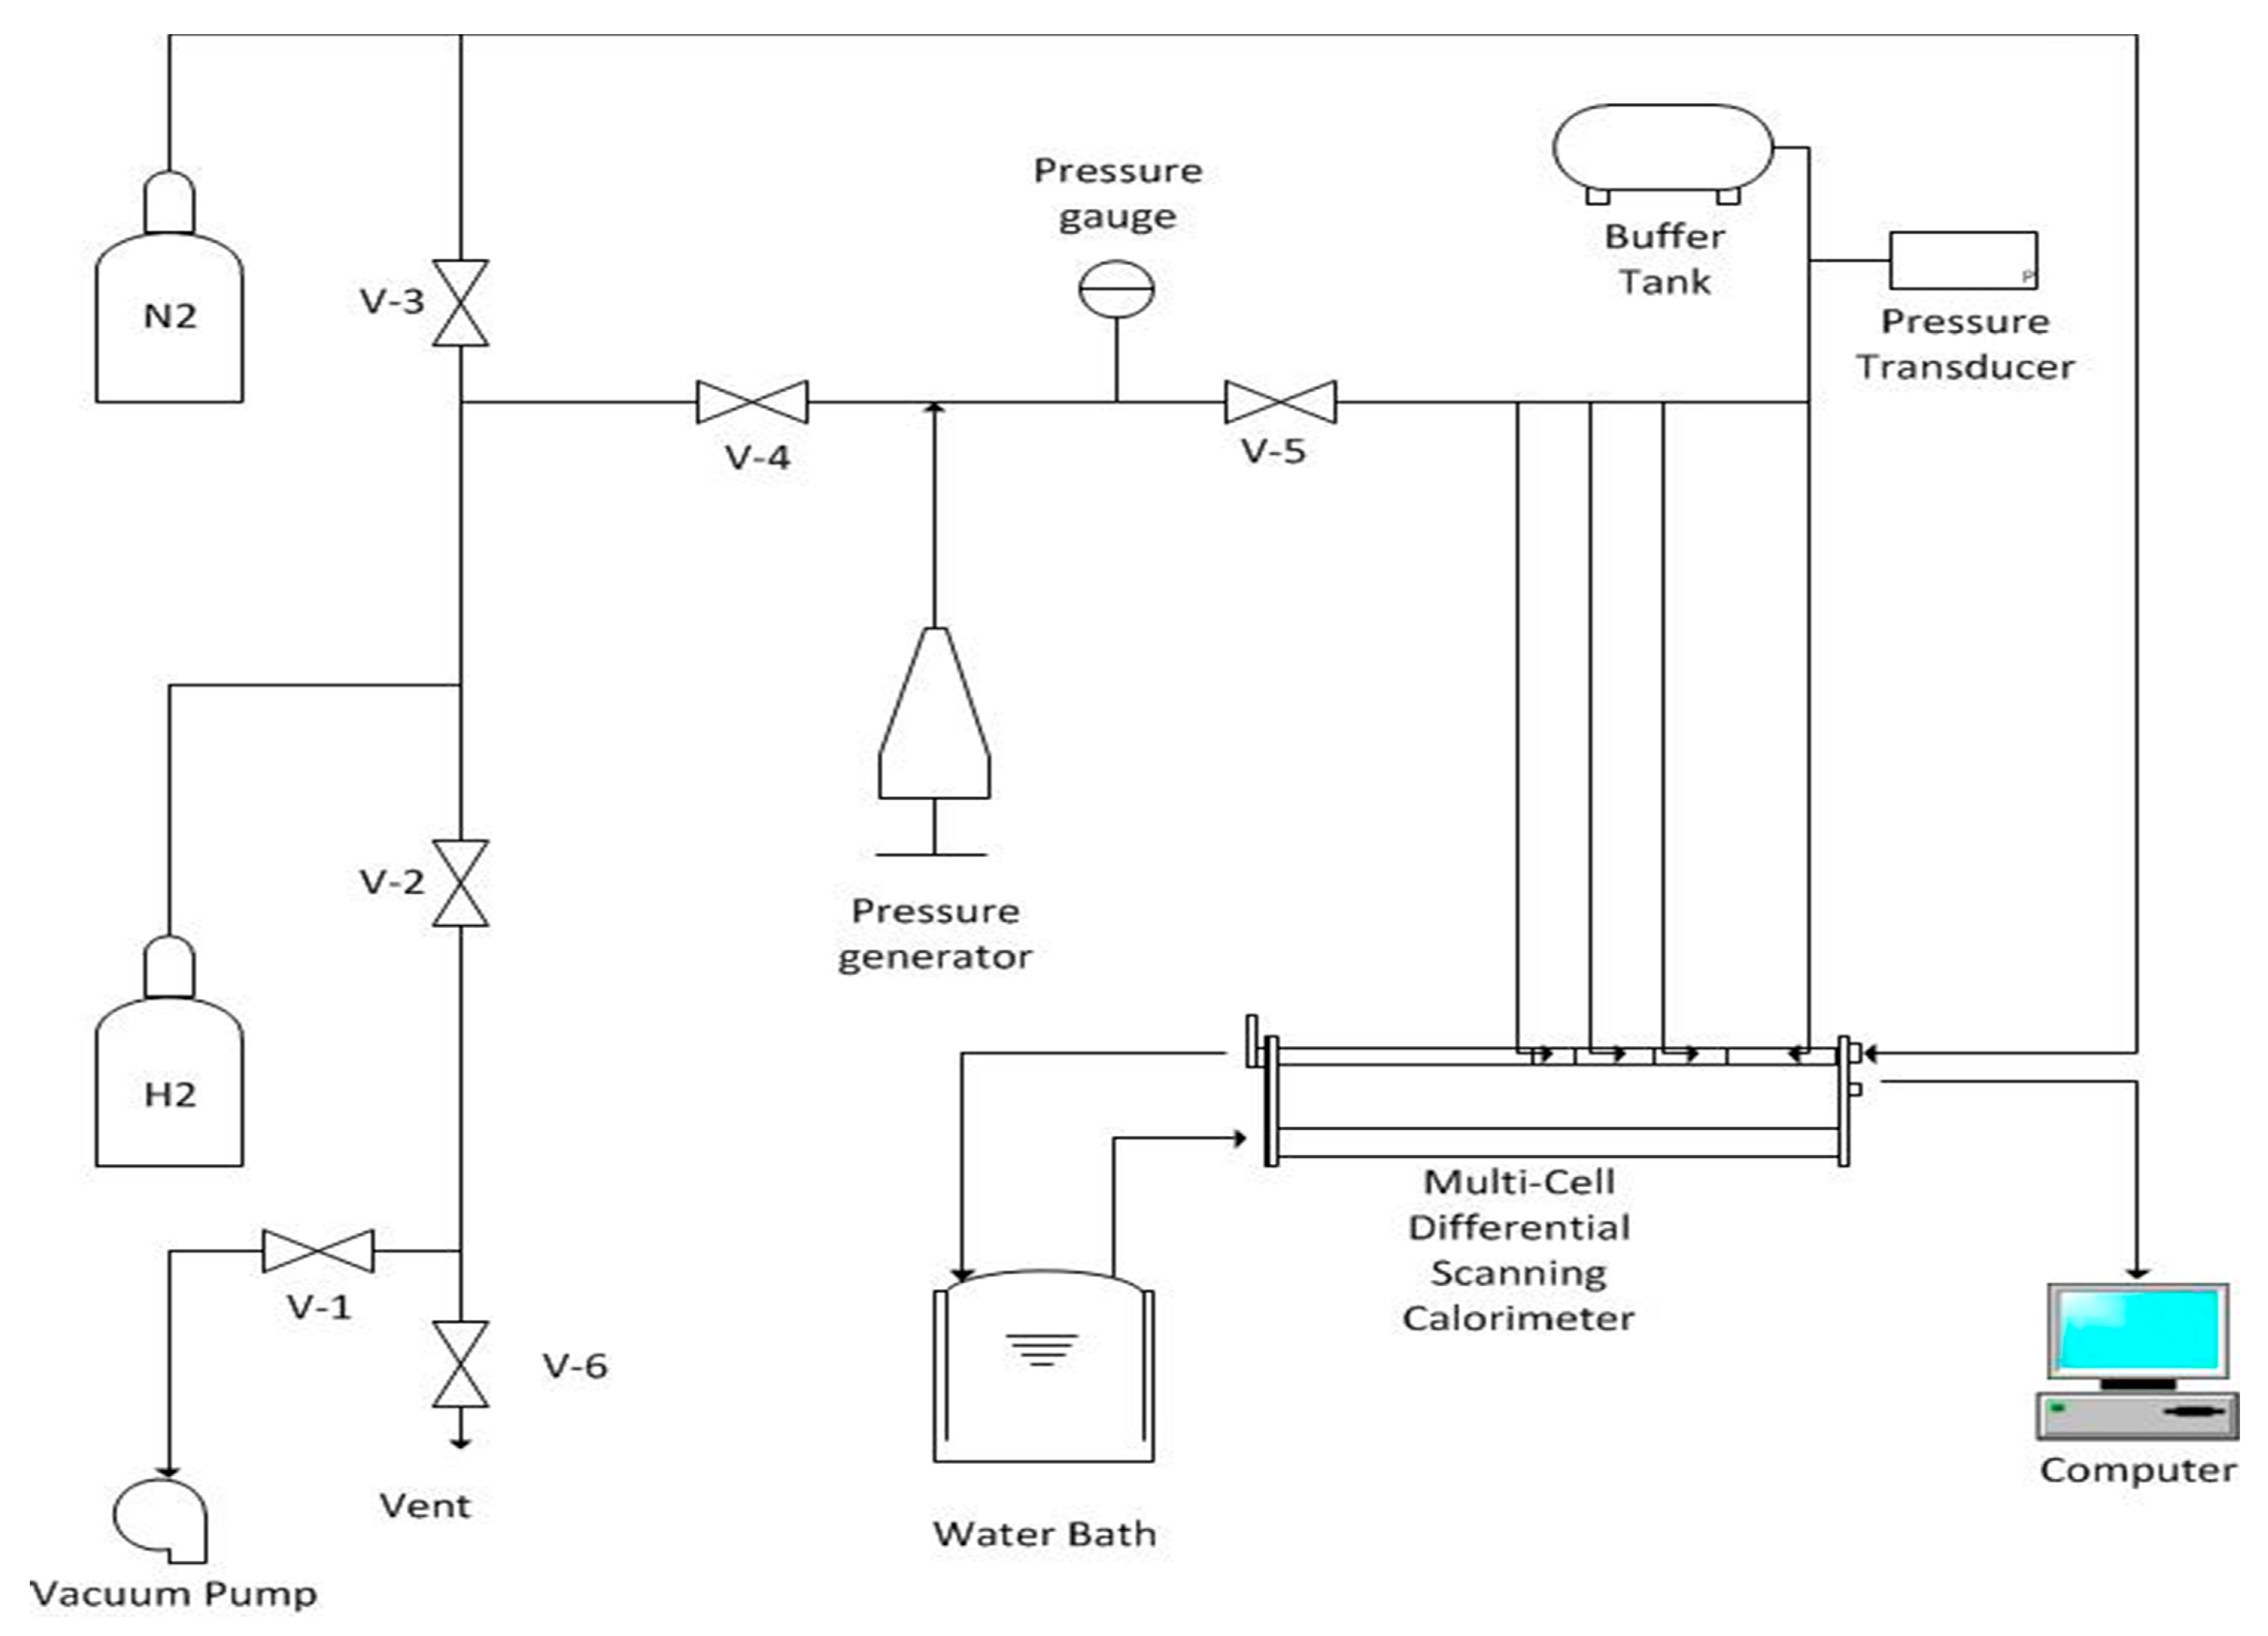
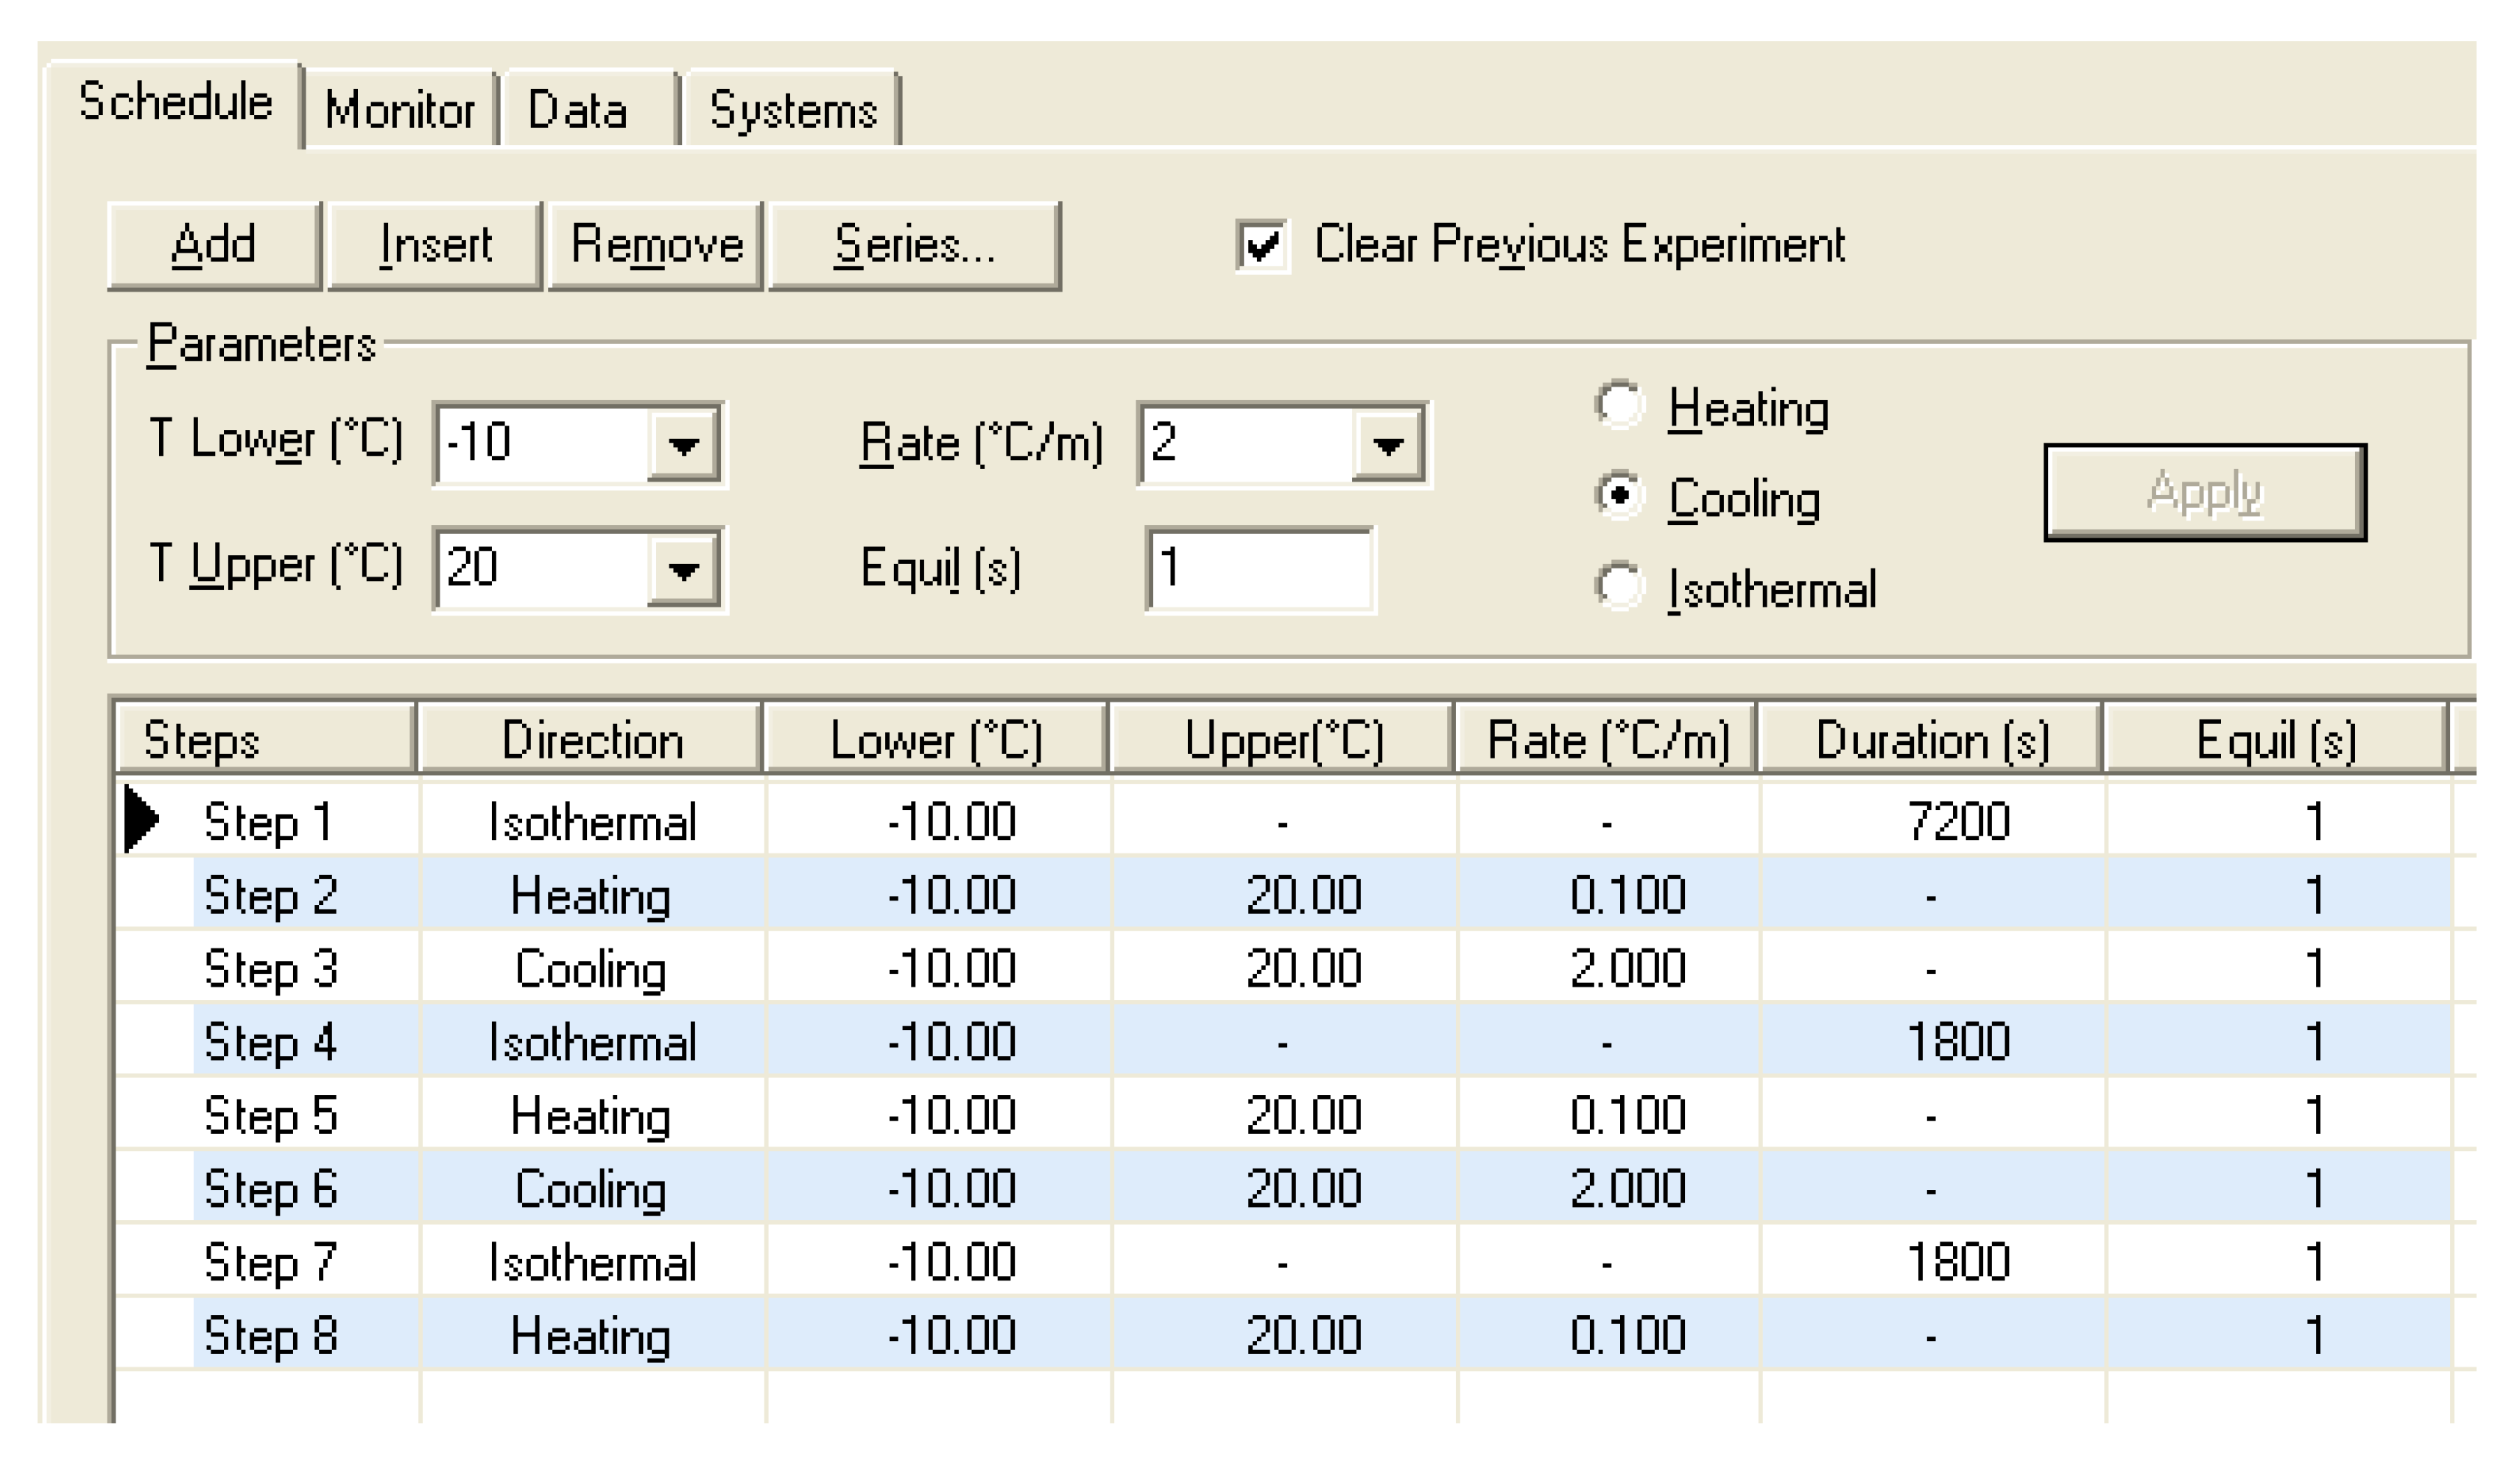
2.2.1. MCDSC Experiments
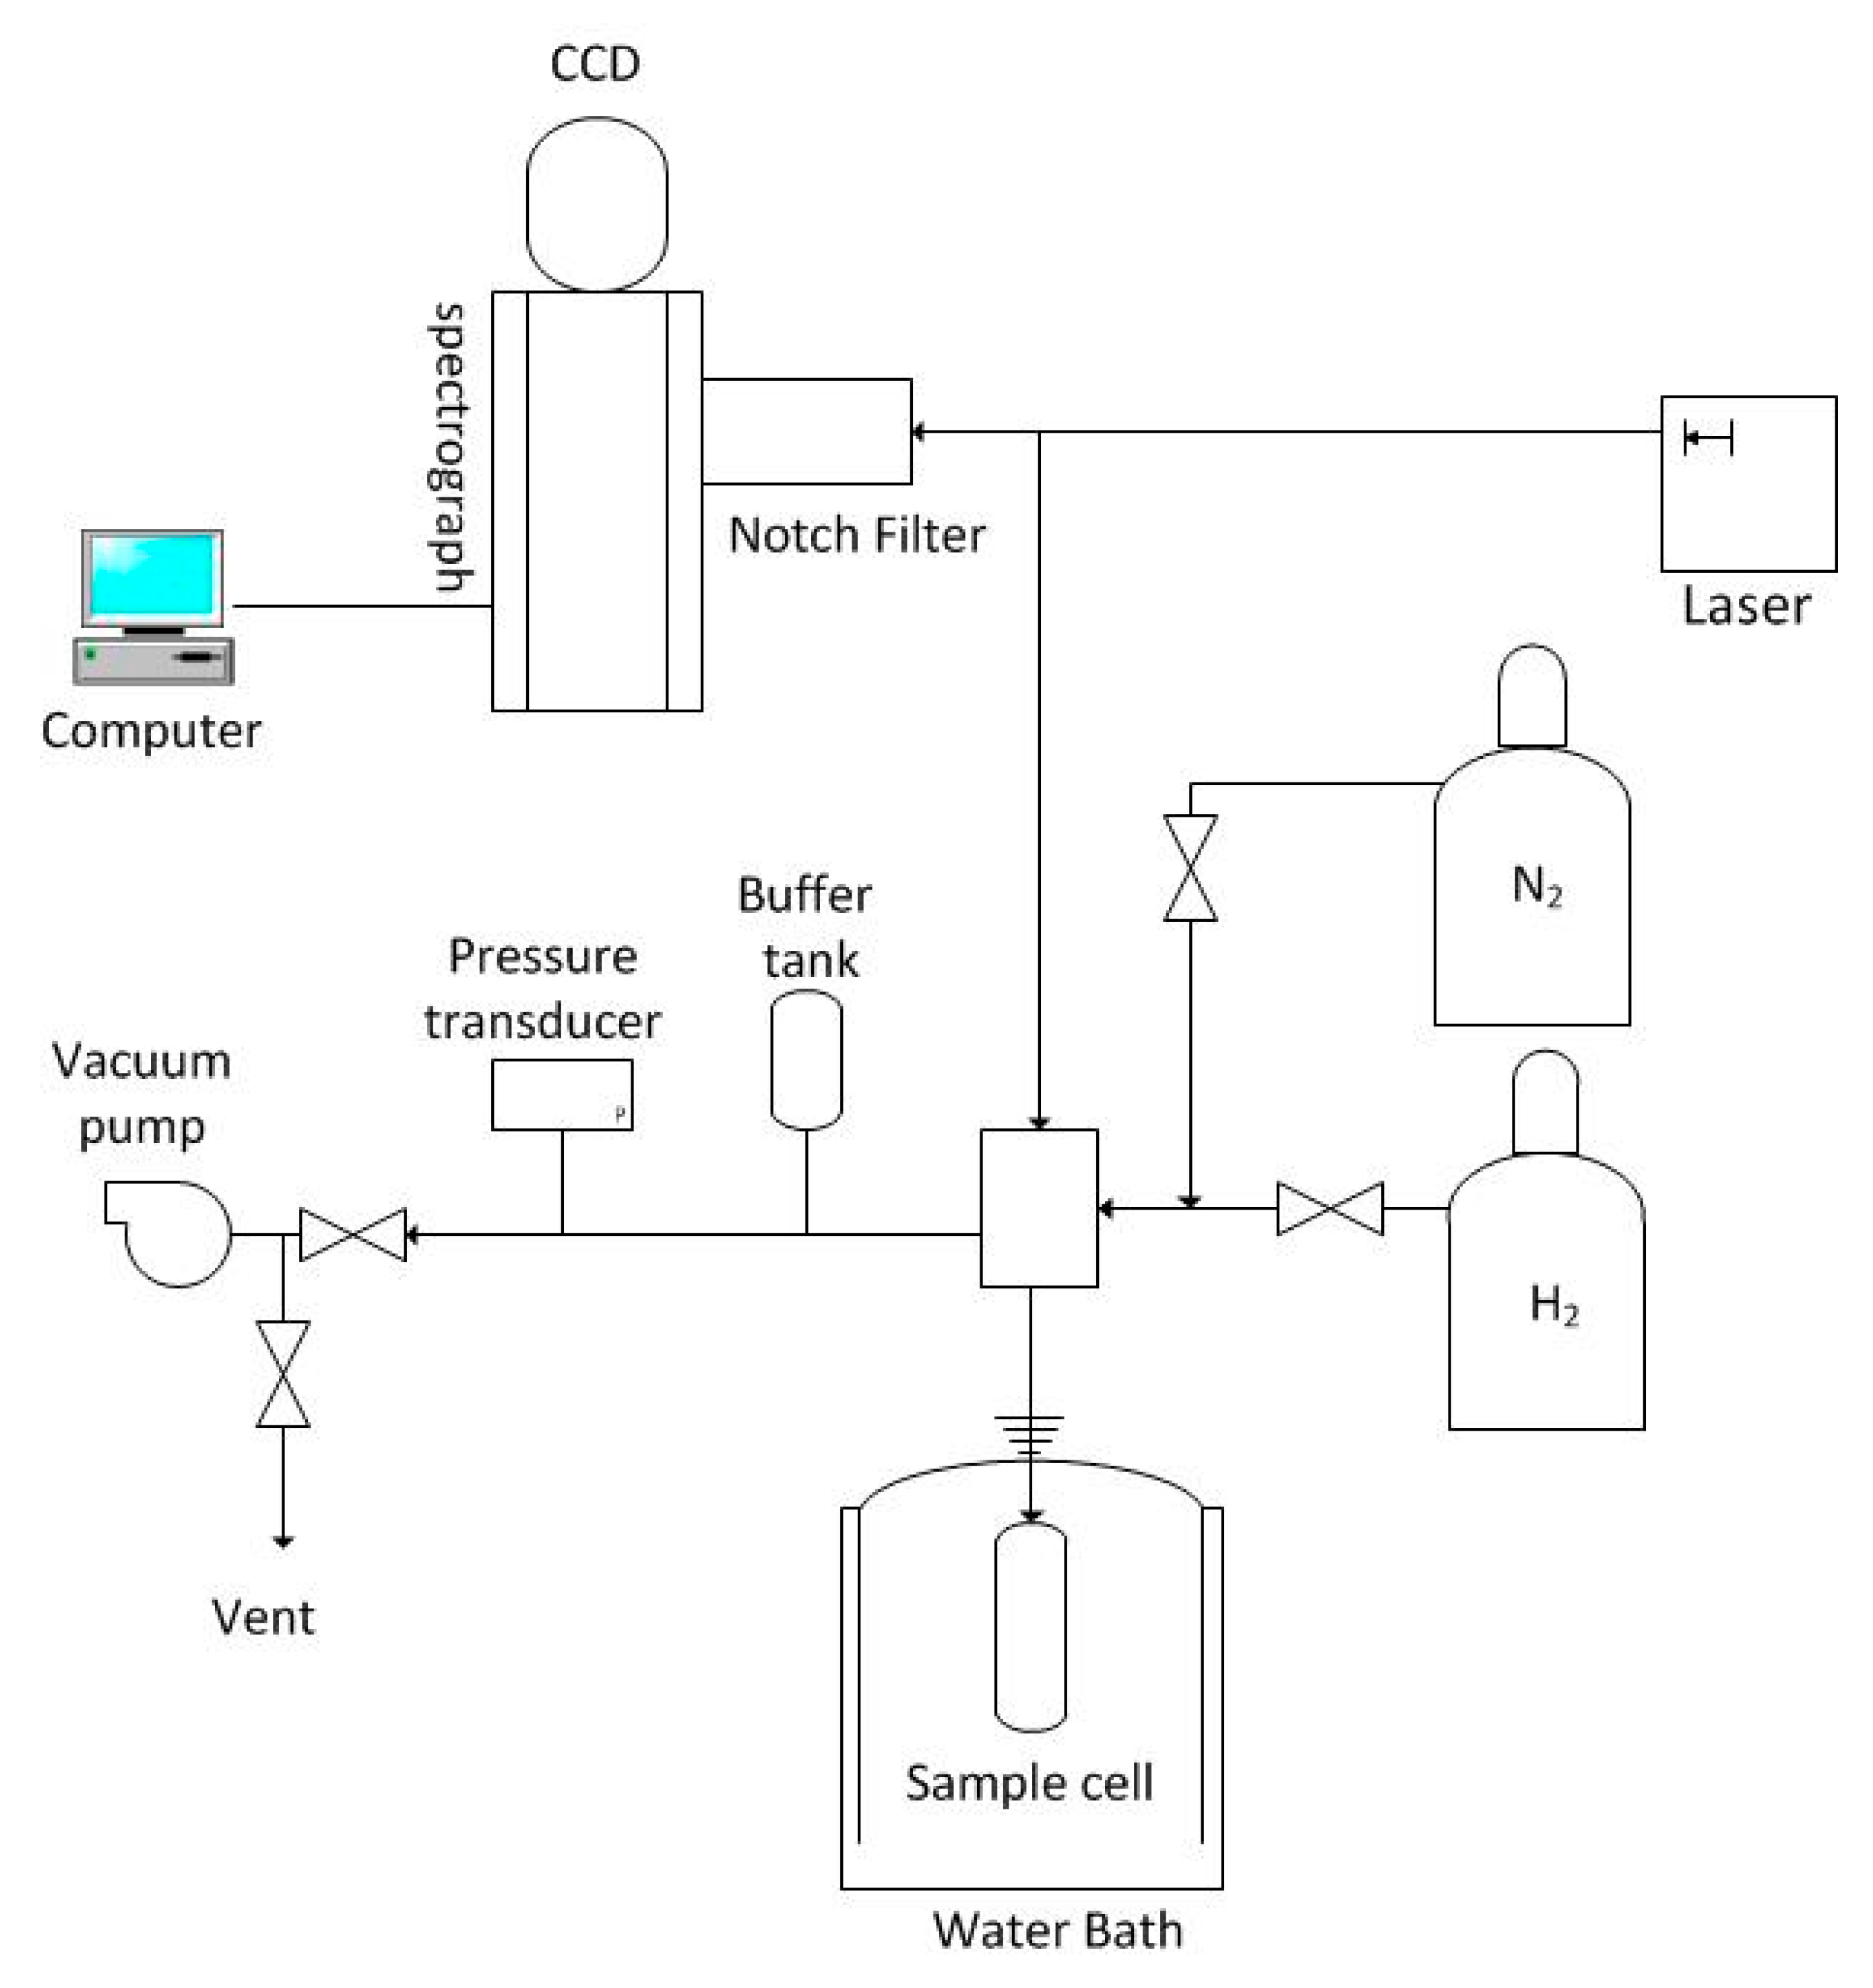
2.2.2. Confirmation of Binary H2 Hydrate by Raman Spectroscopy
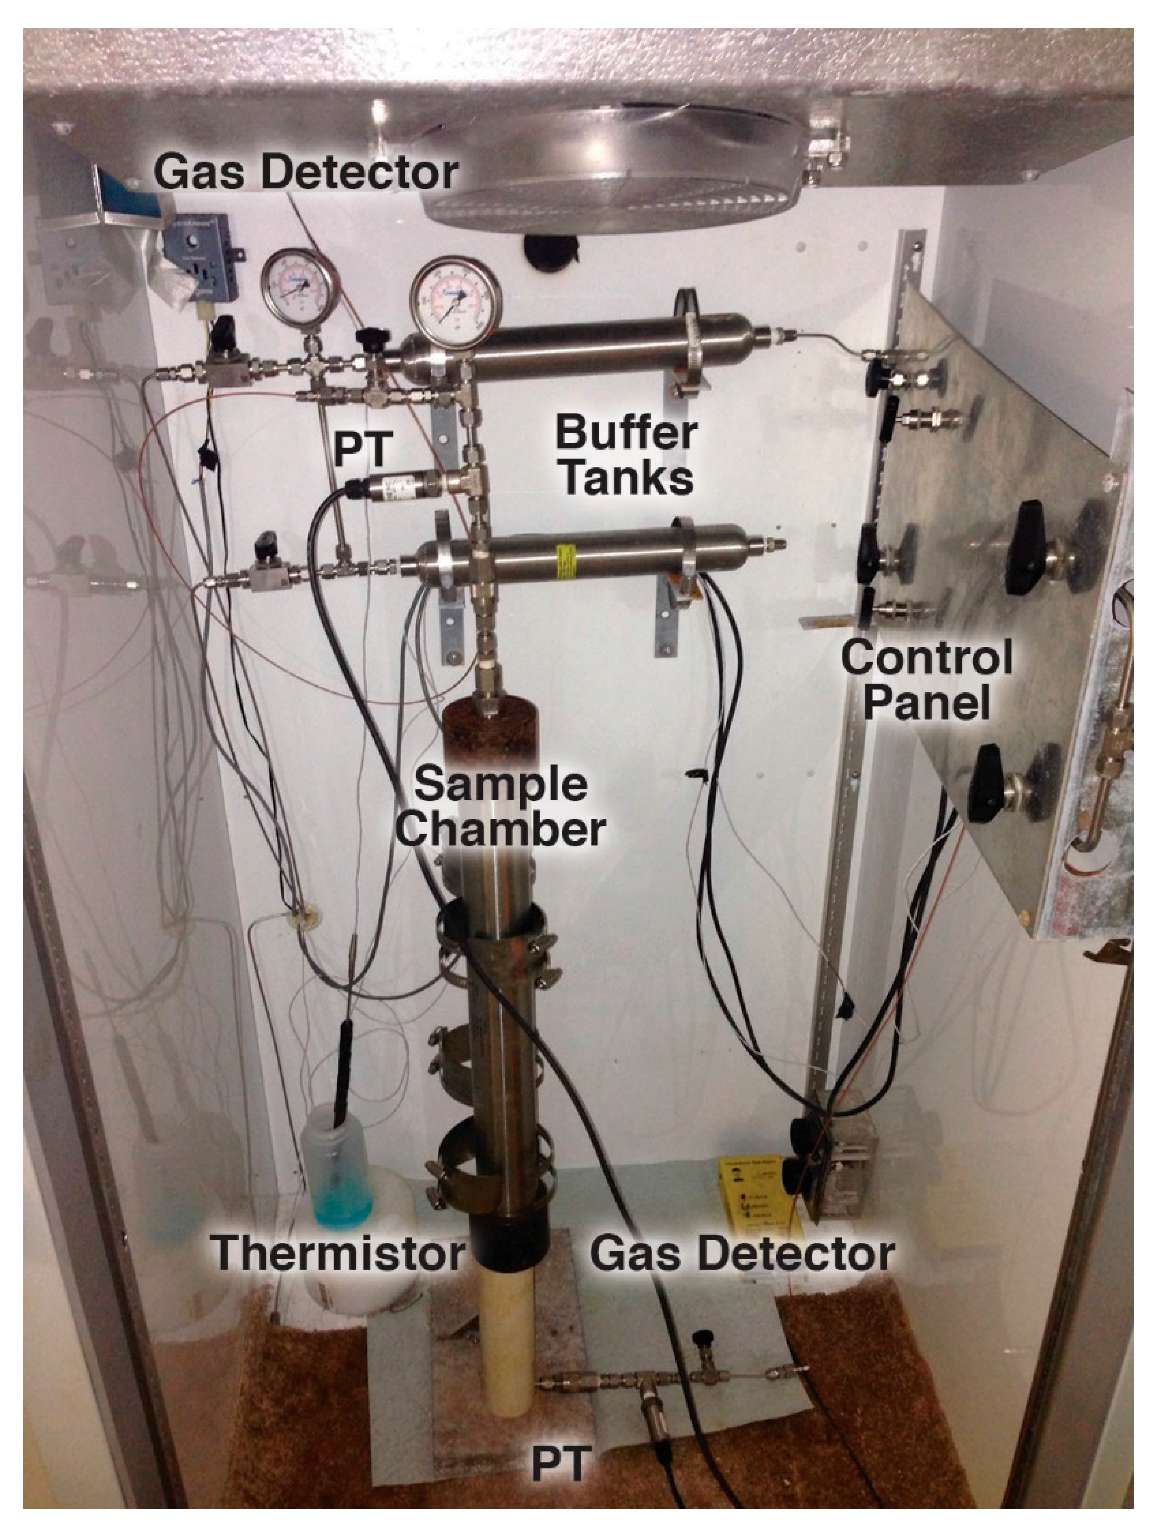
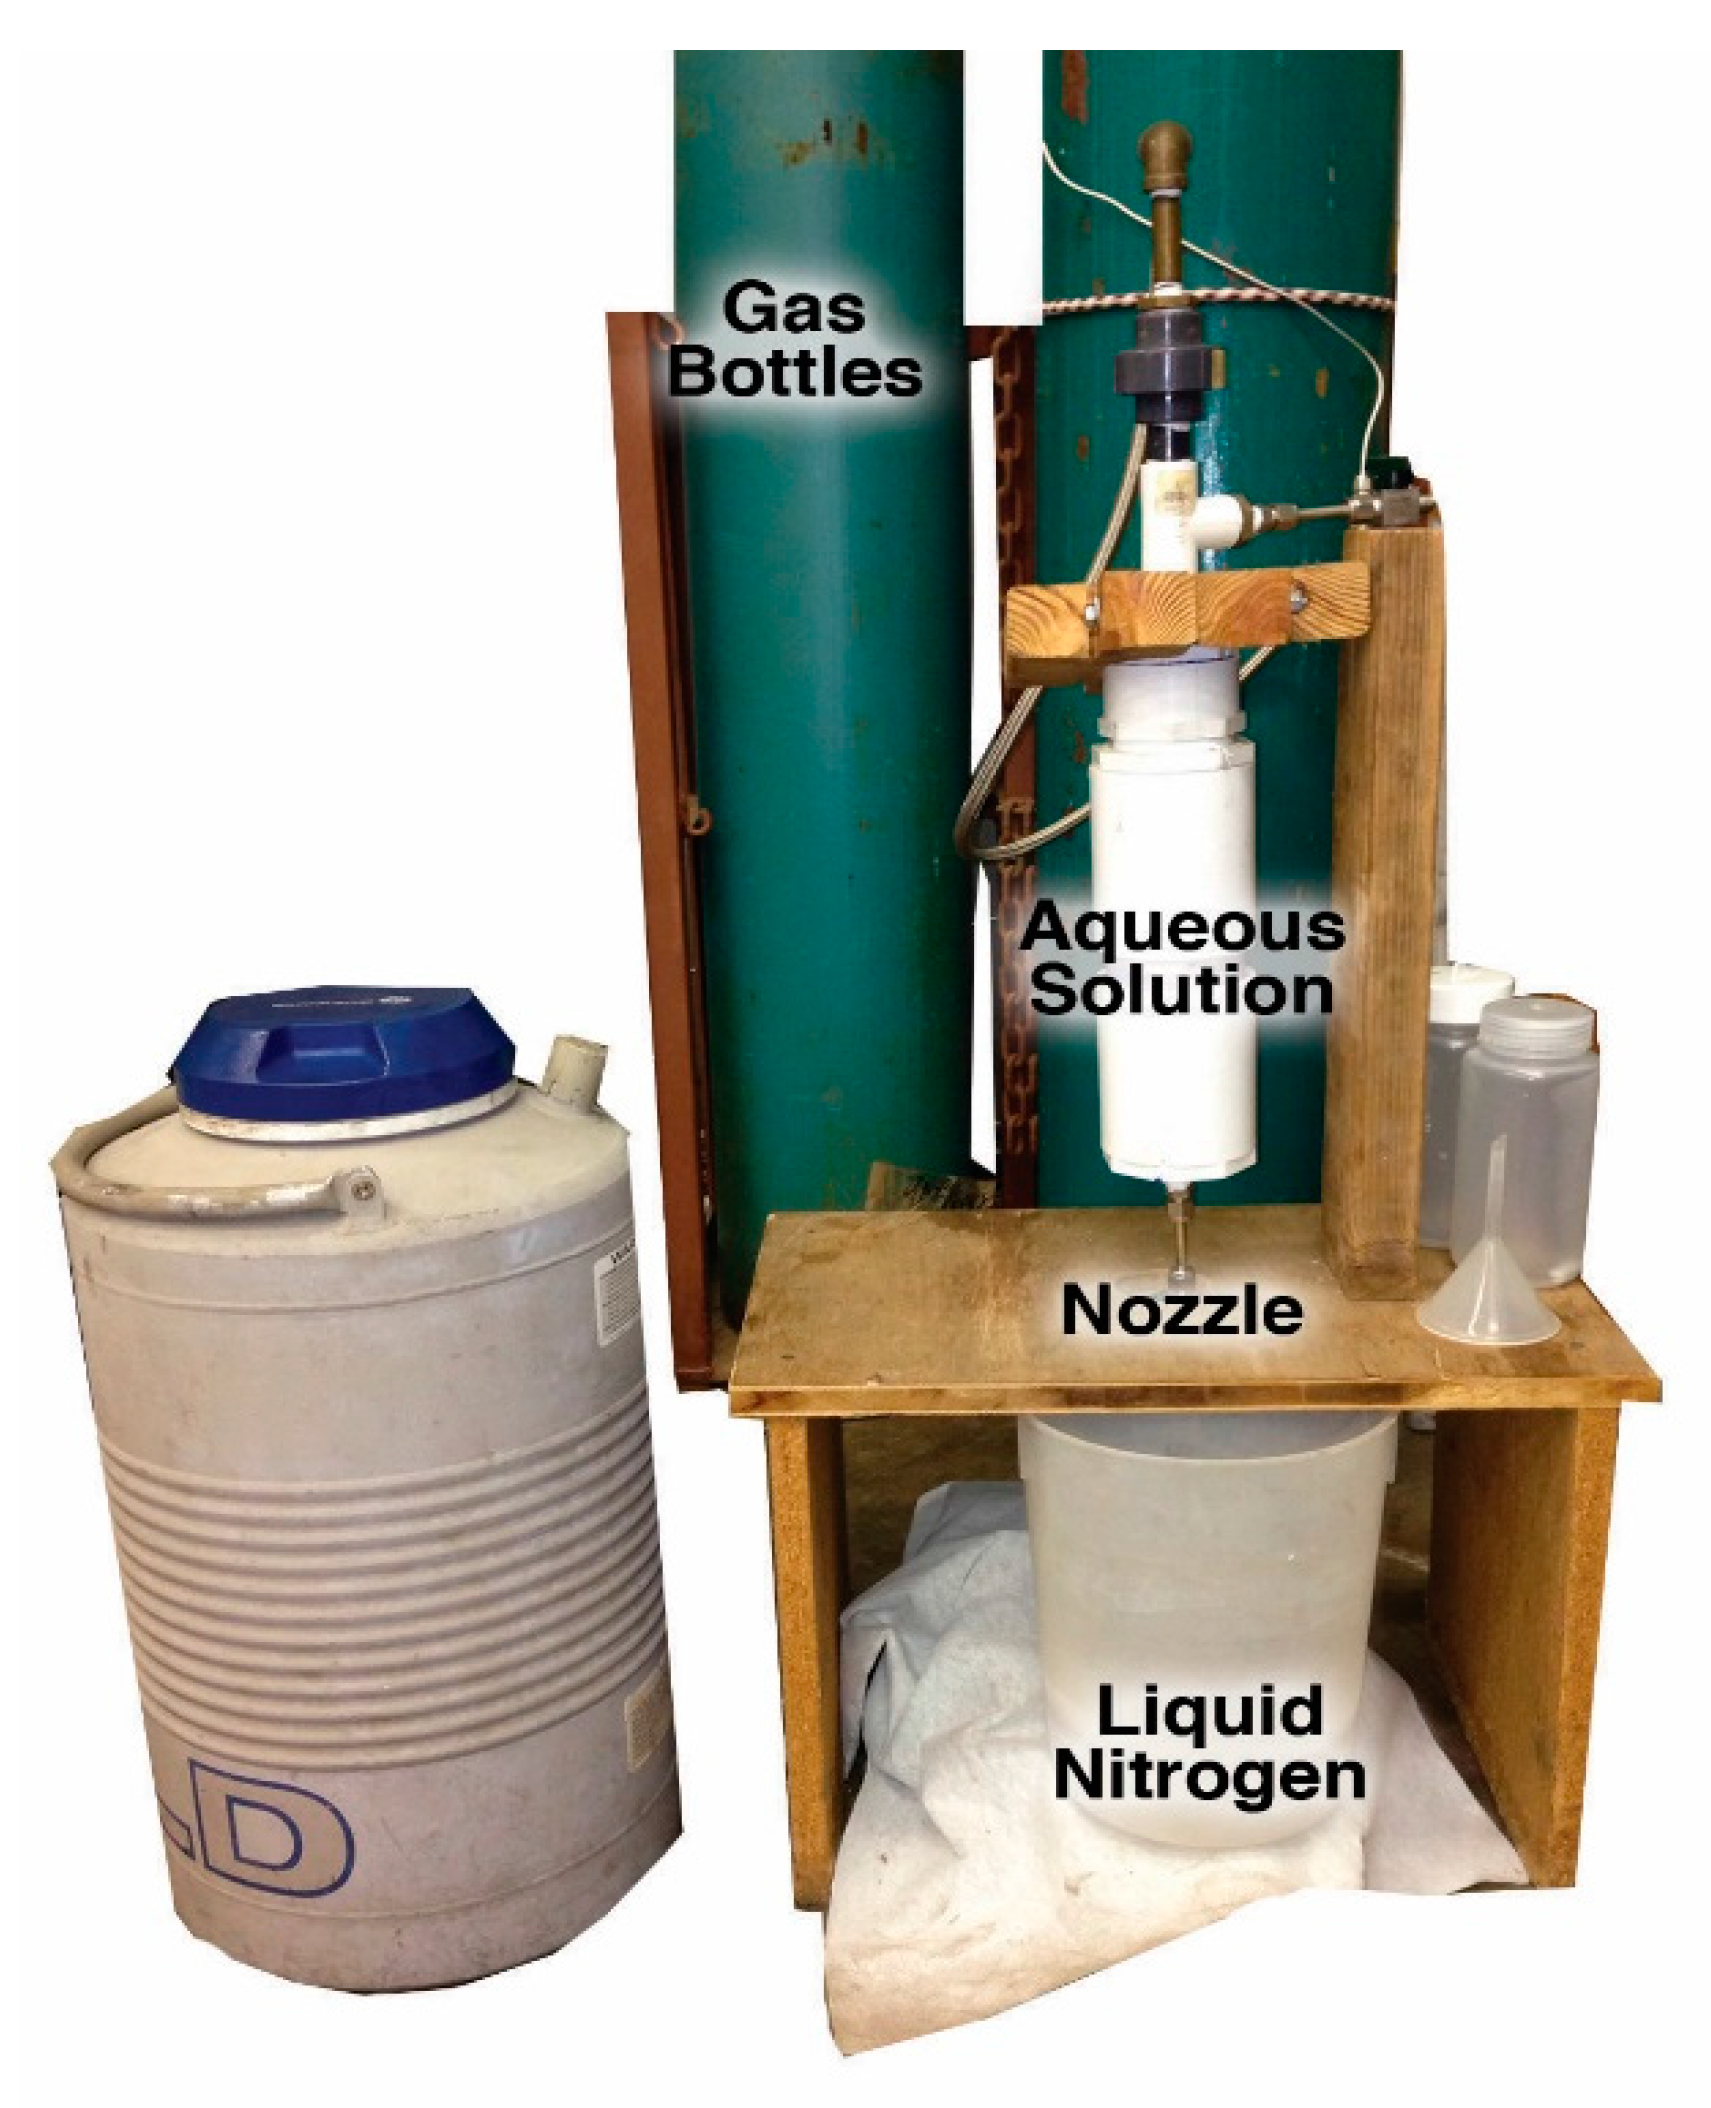
2.2.3. Scale-Up Experiments
3. Results
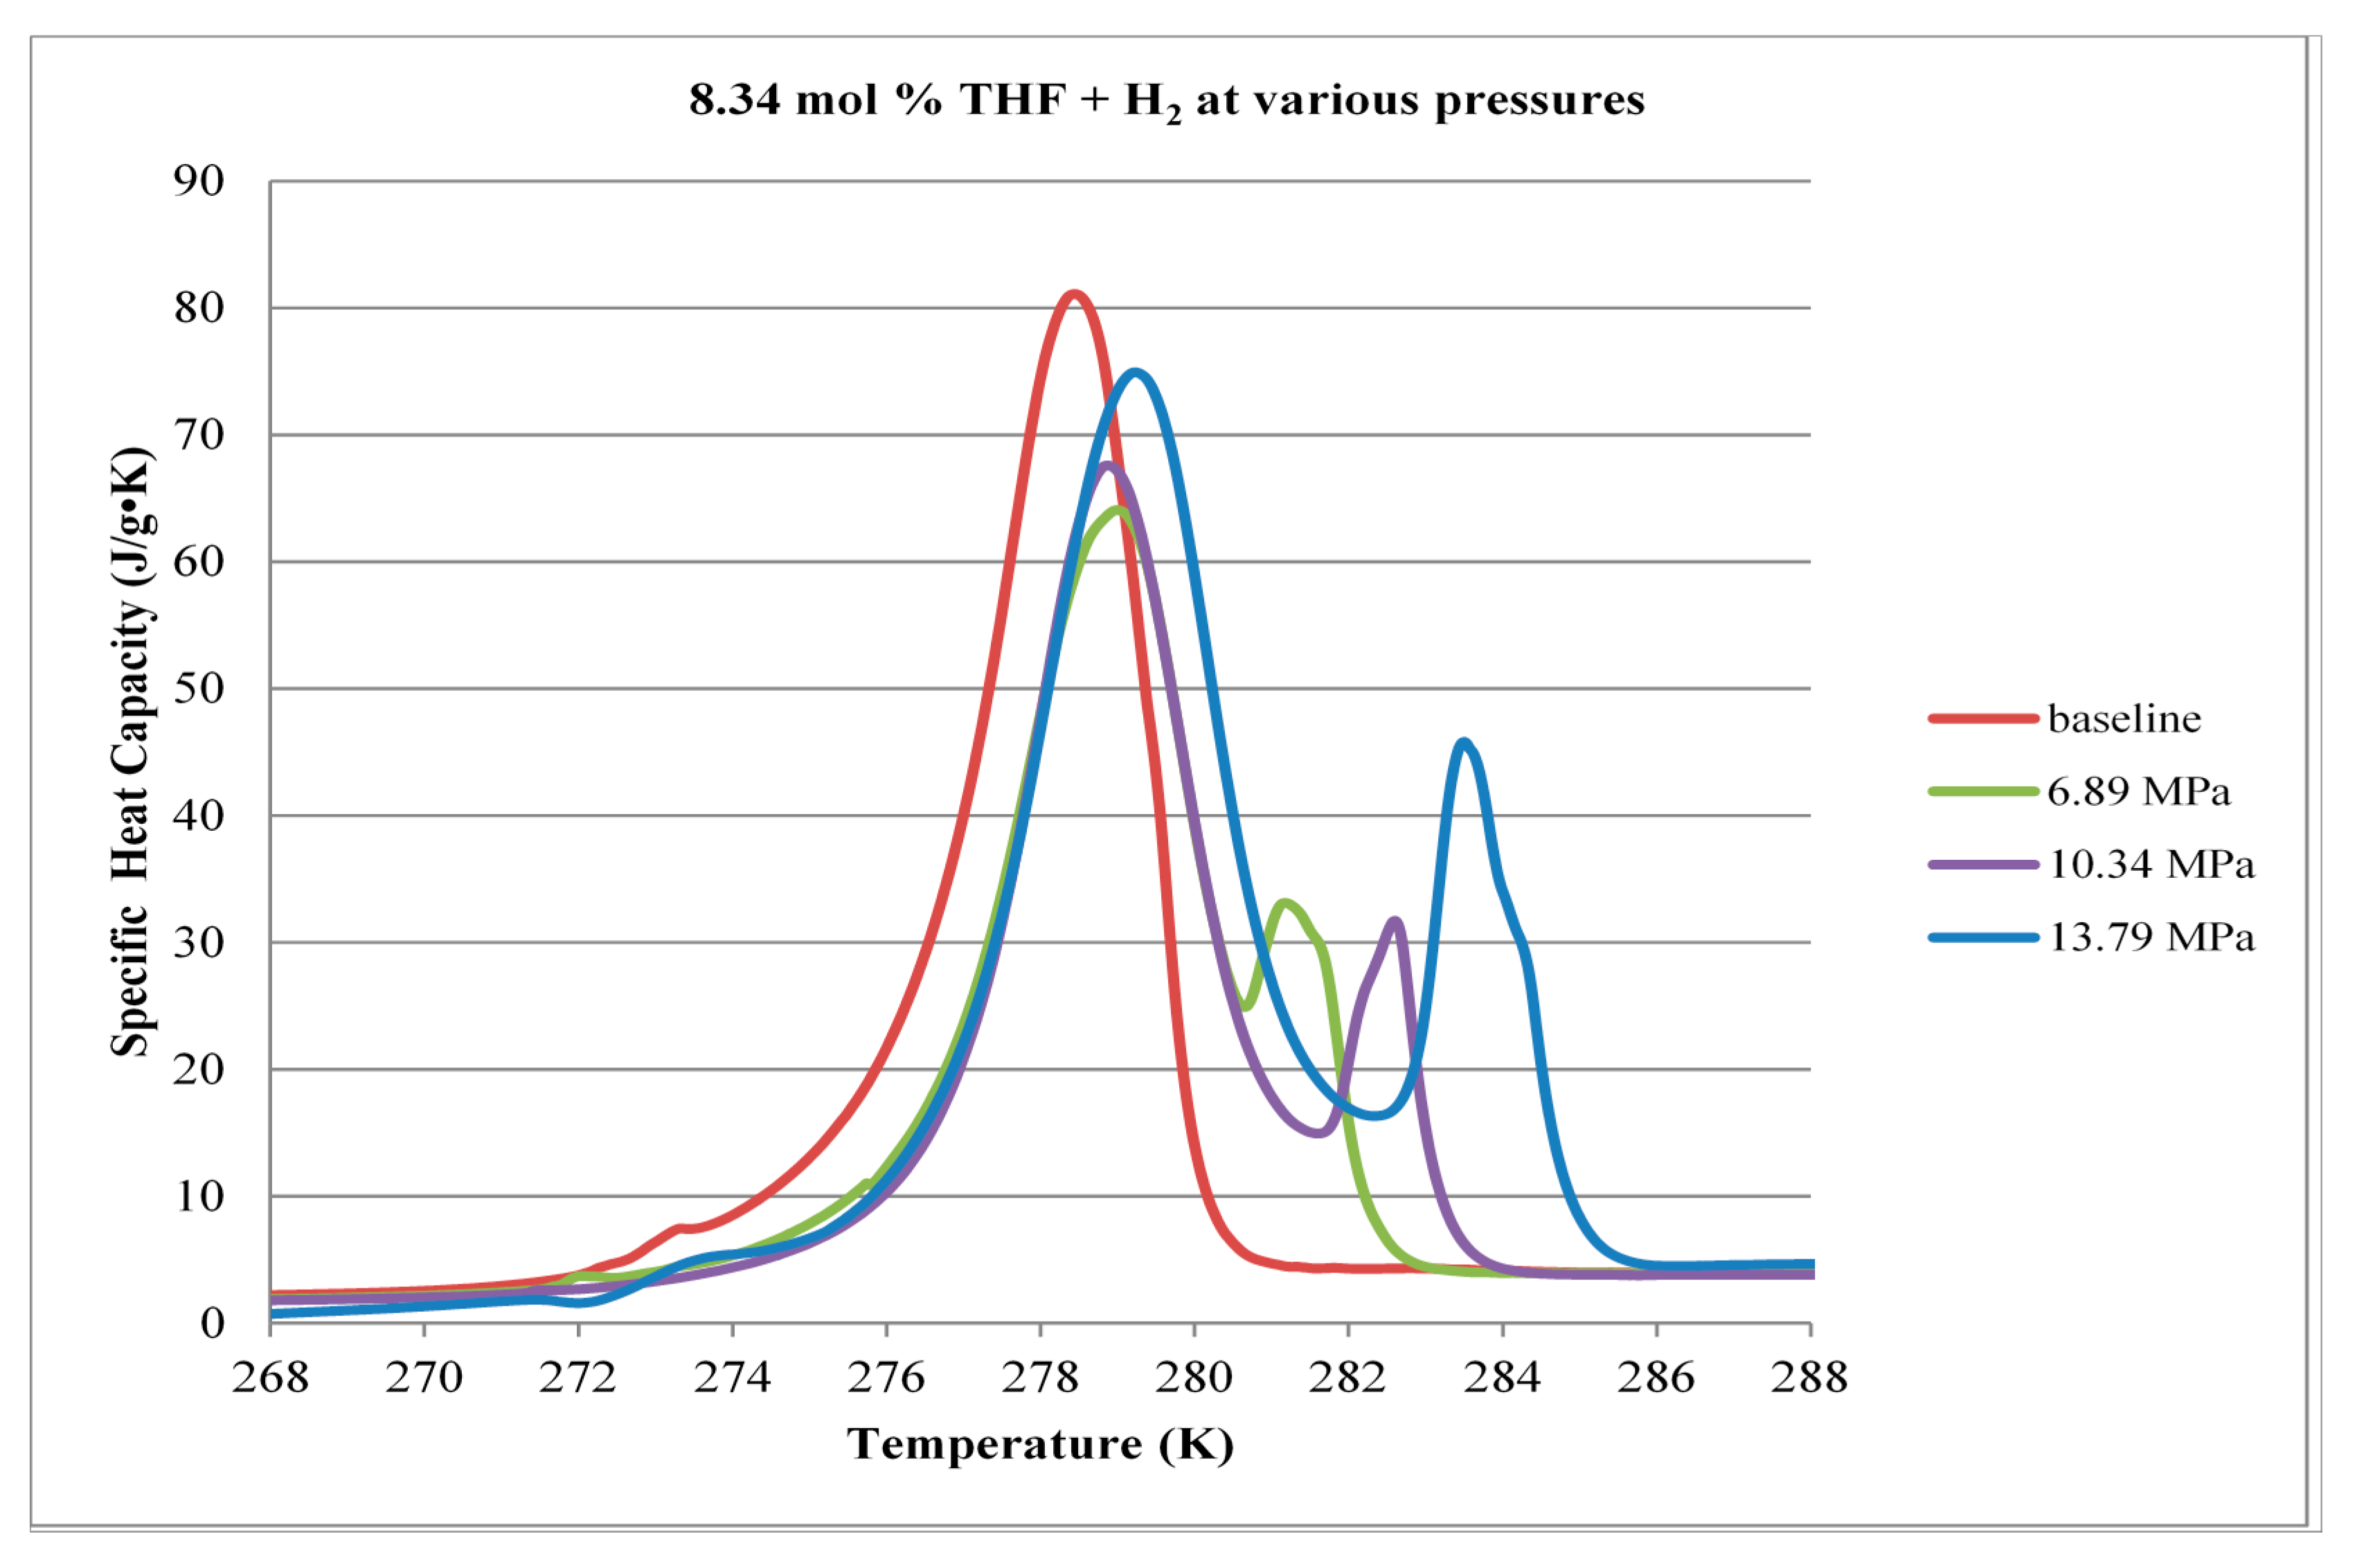
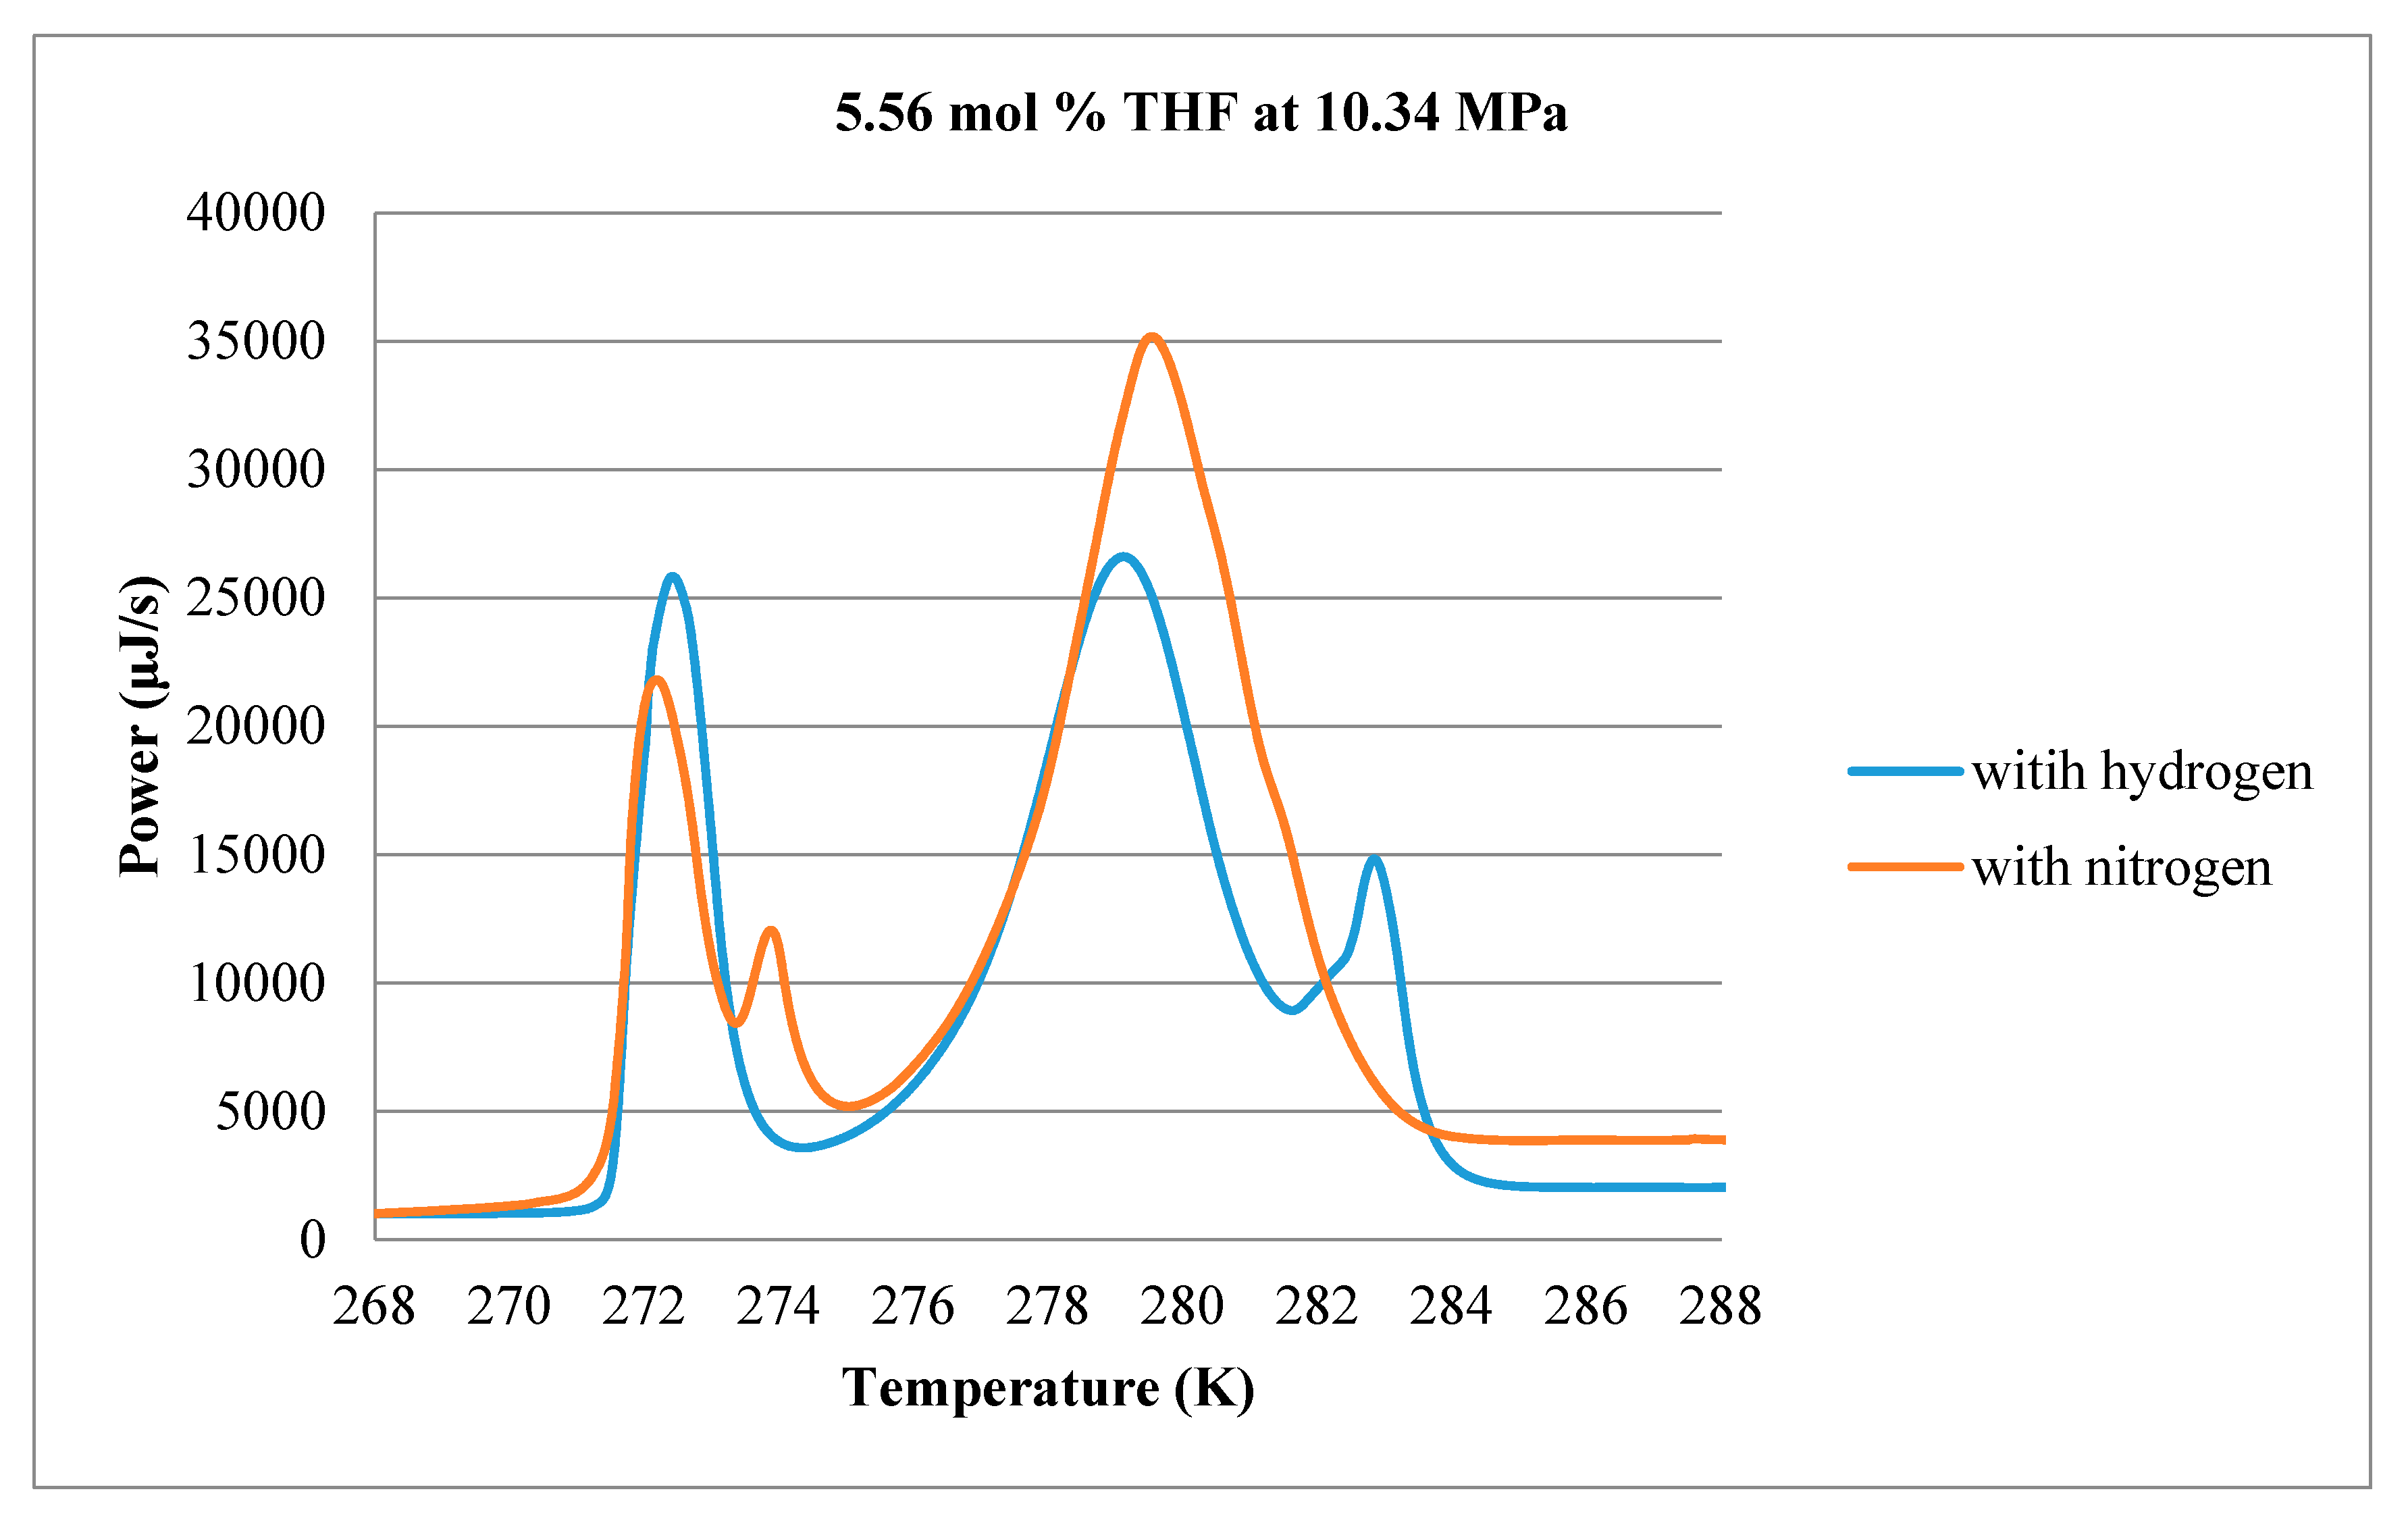
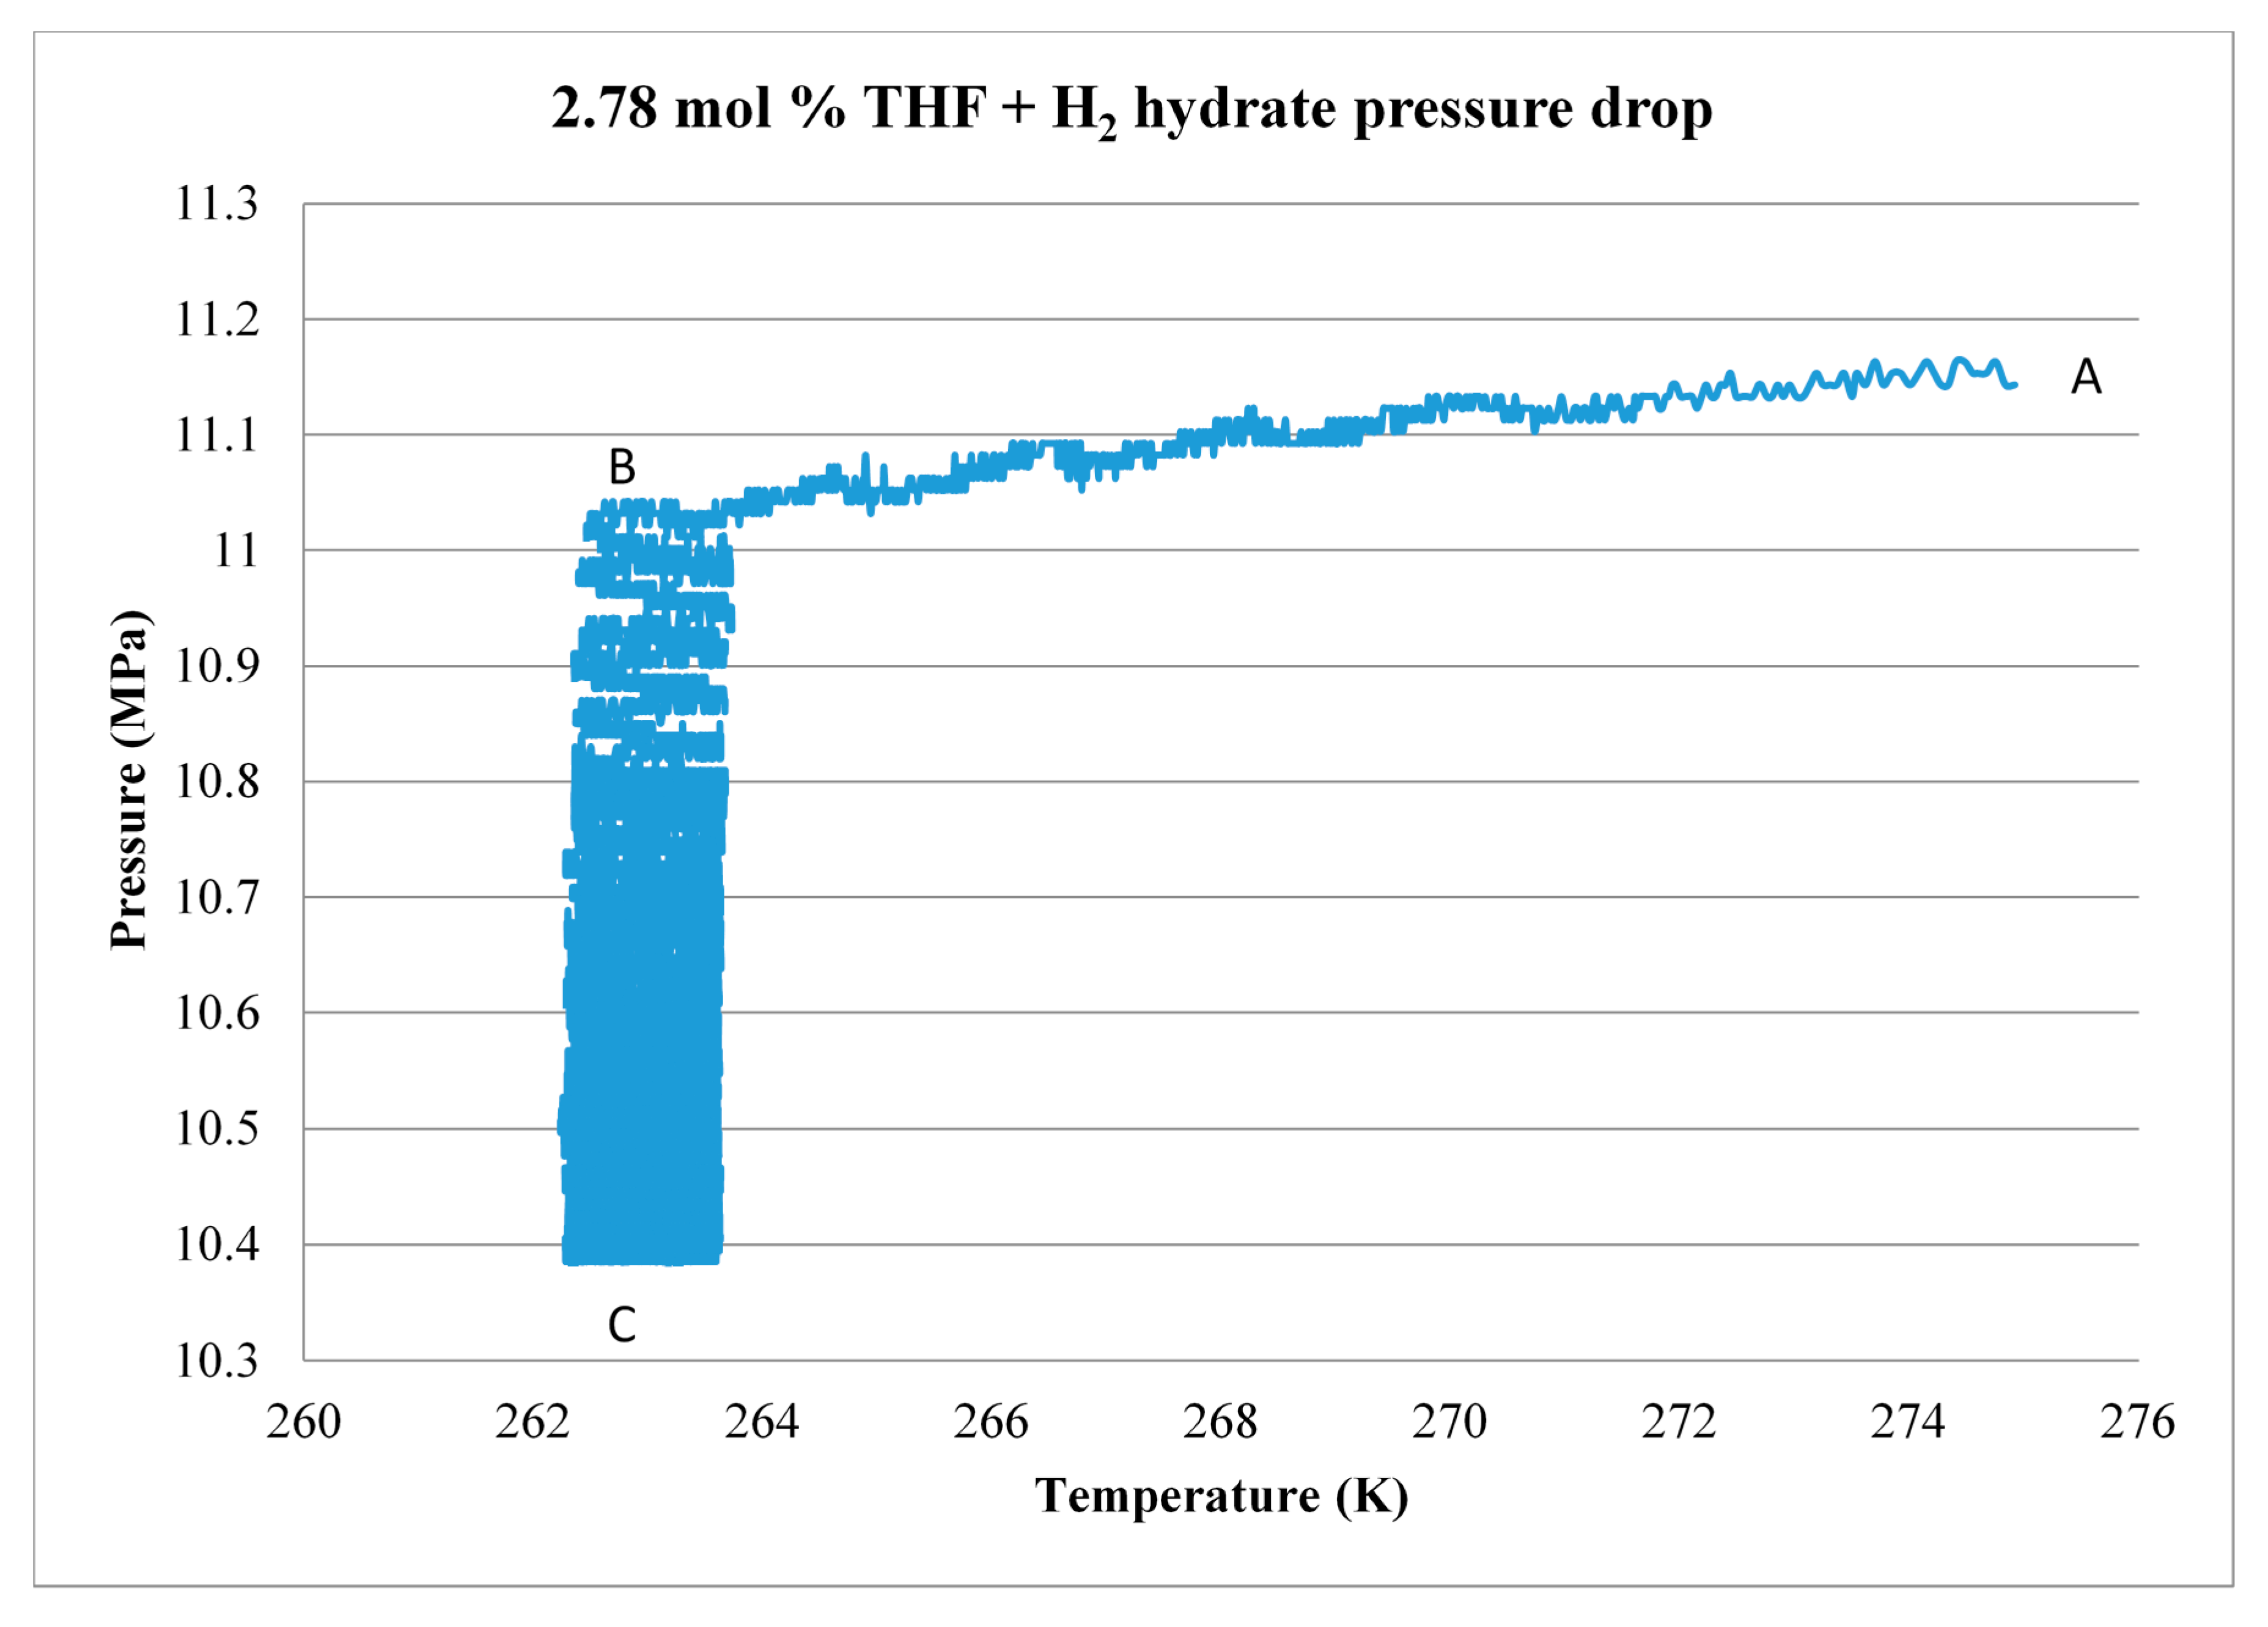
3.1. Calorimetry
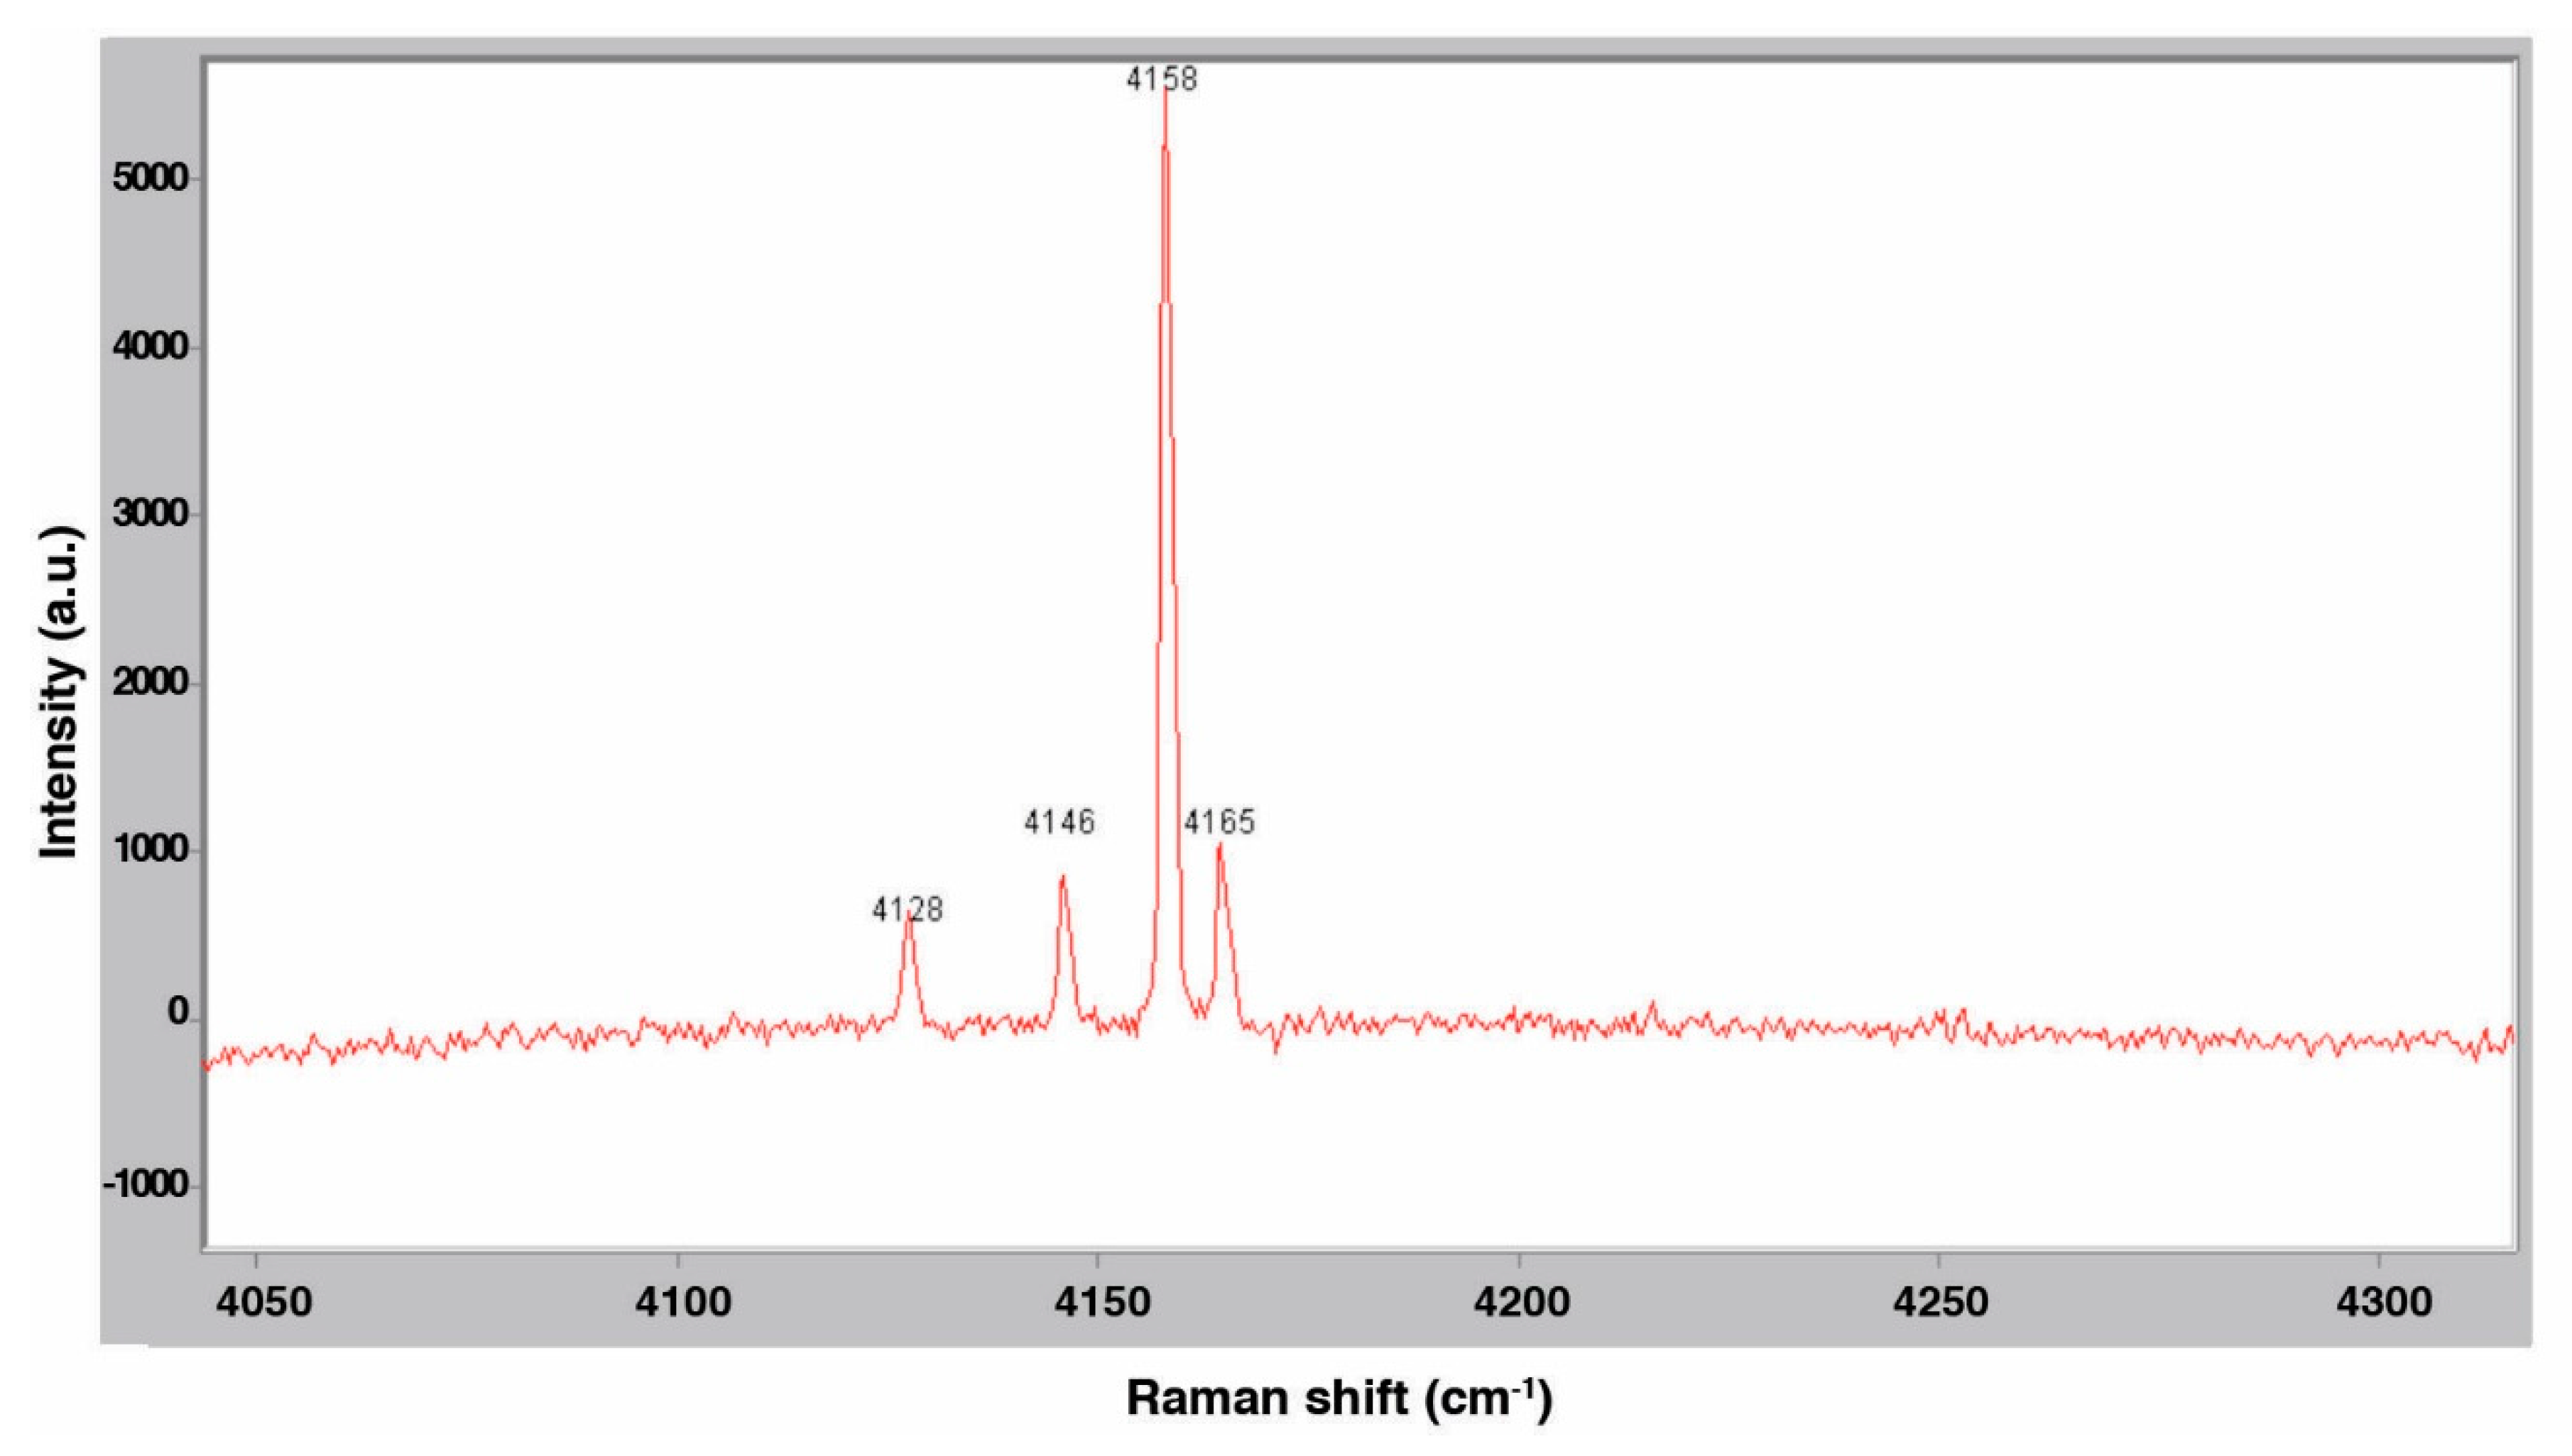
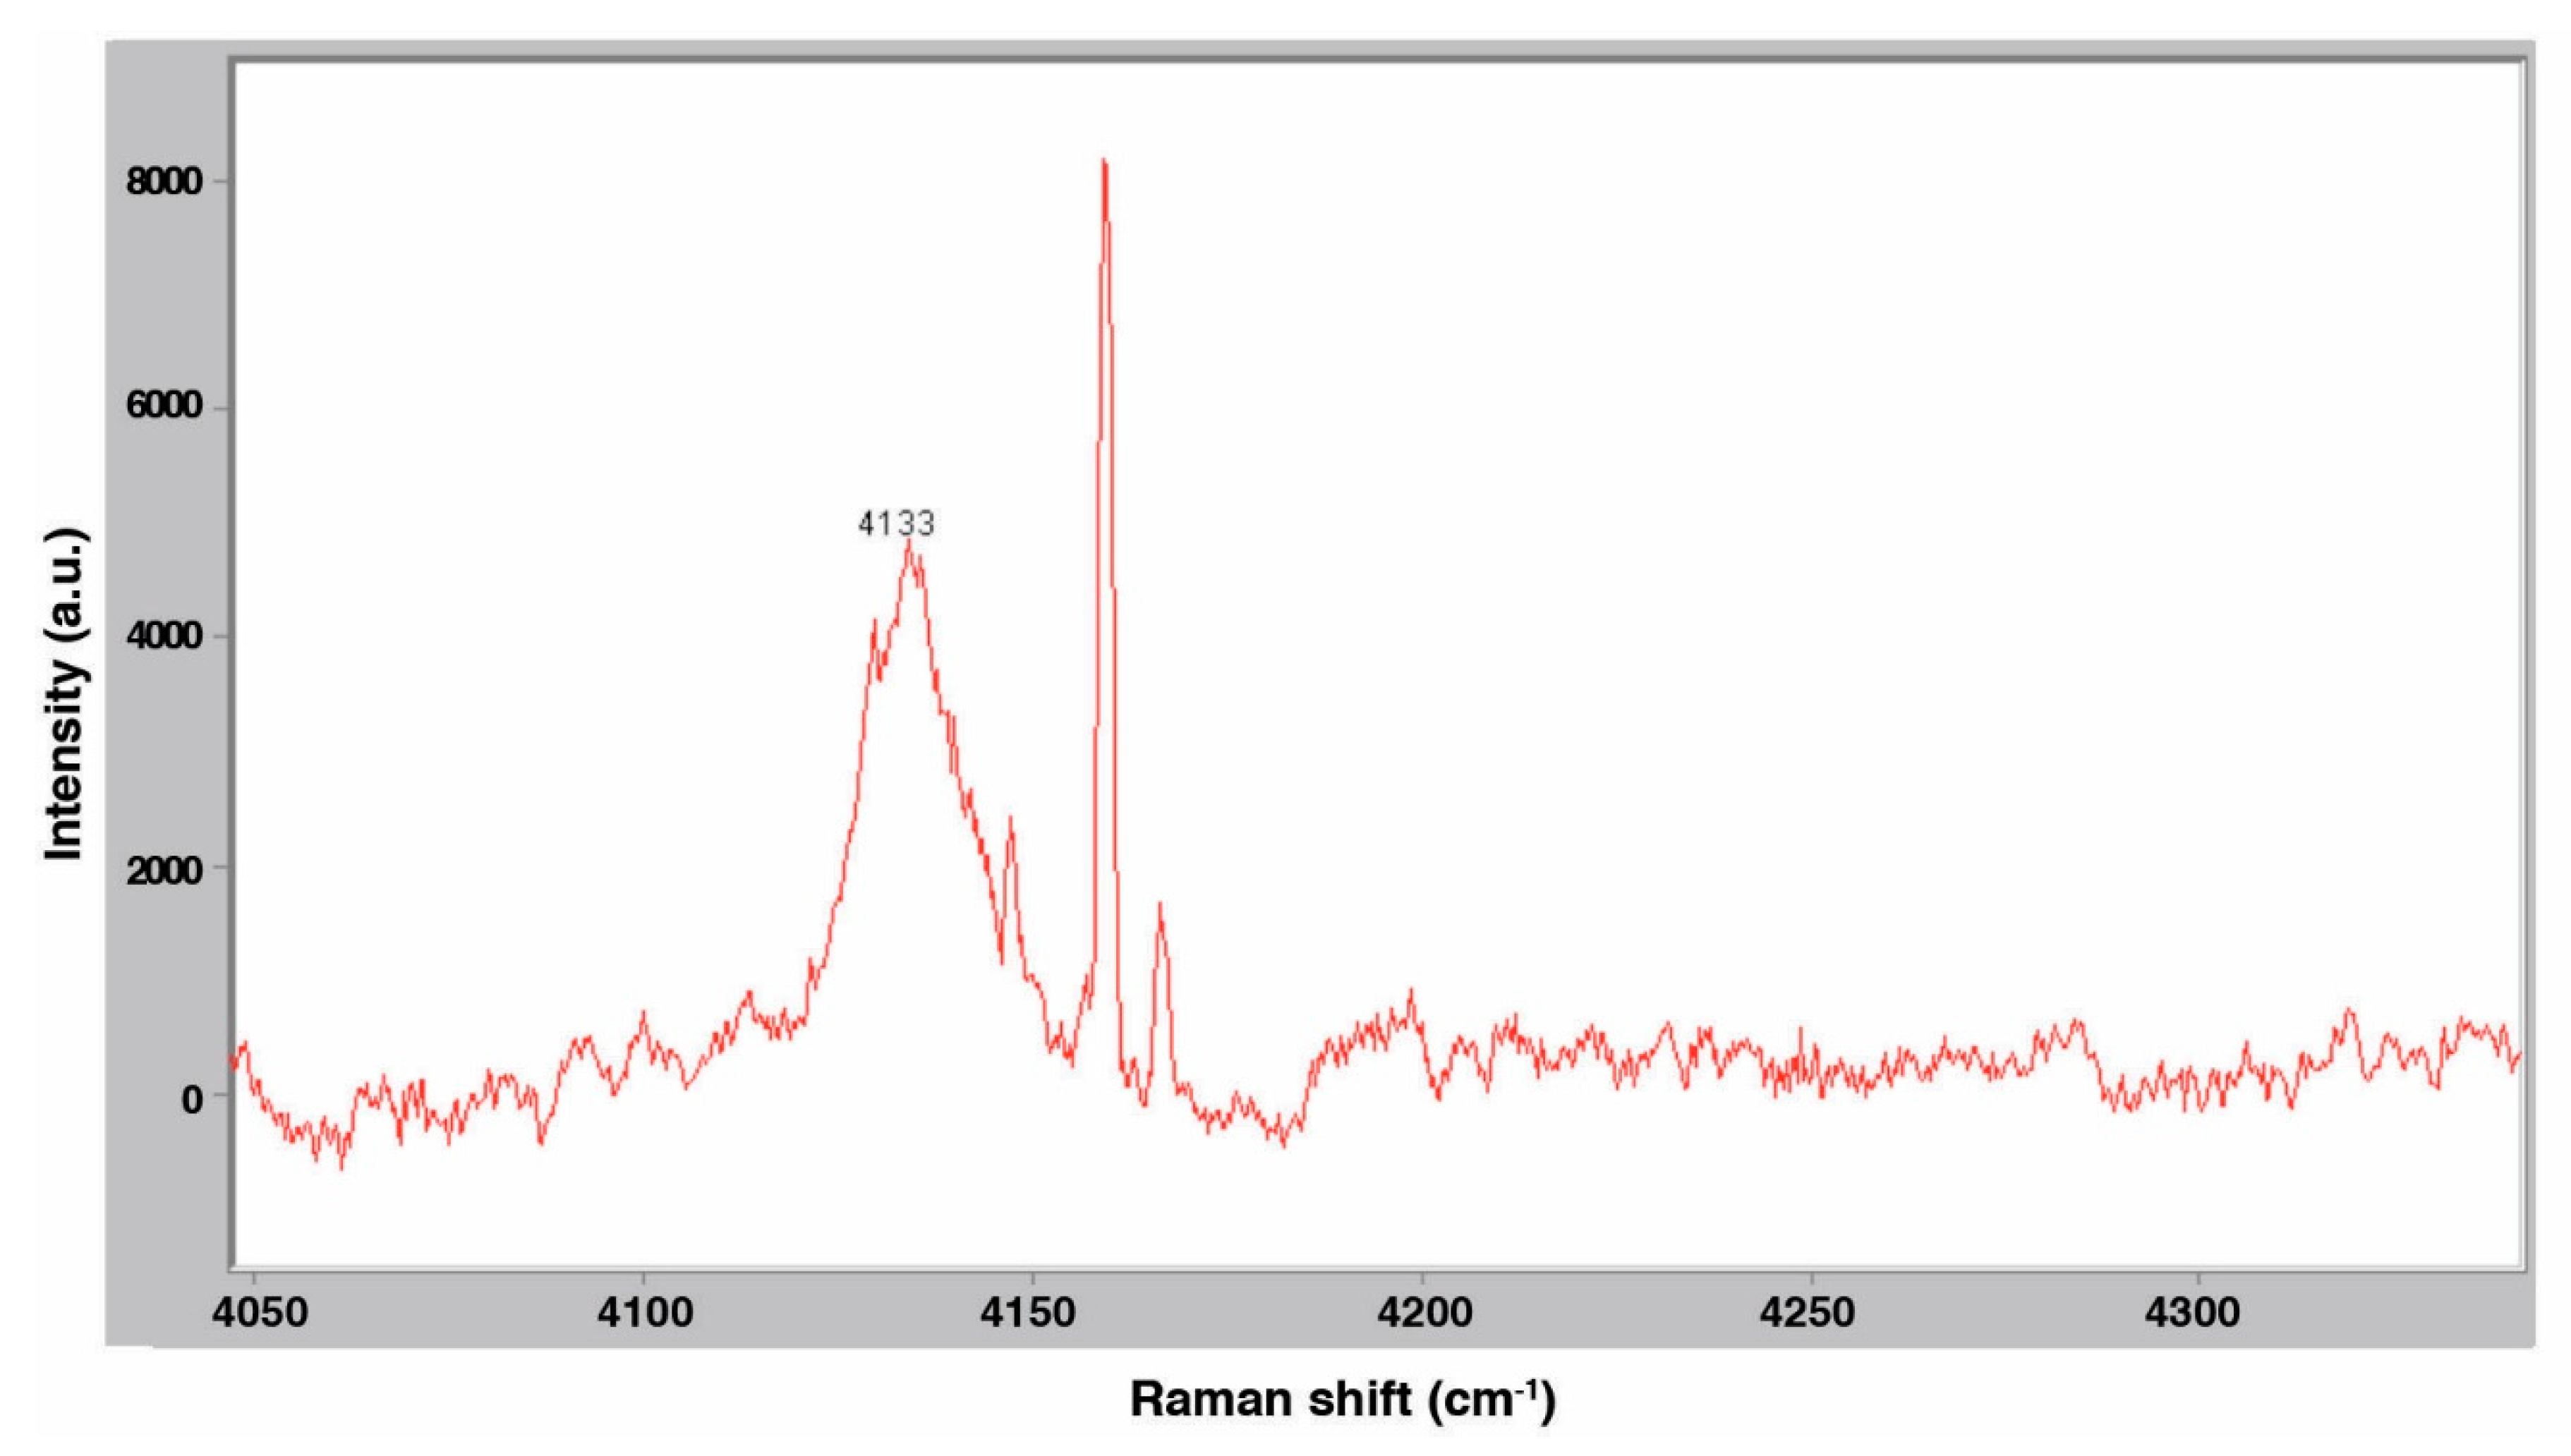
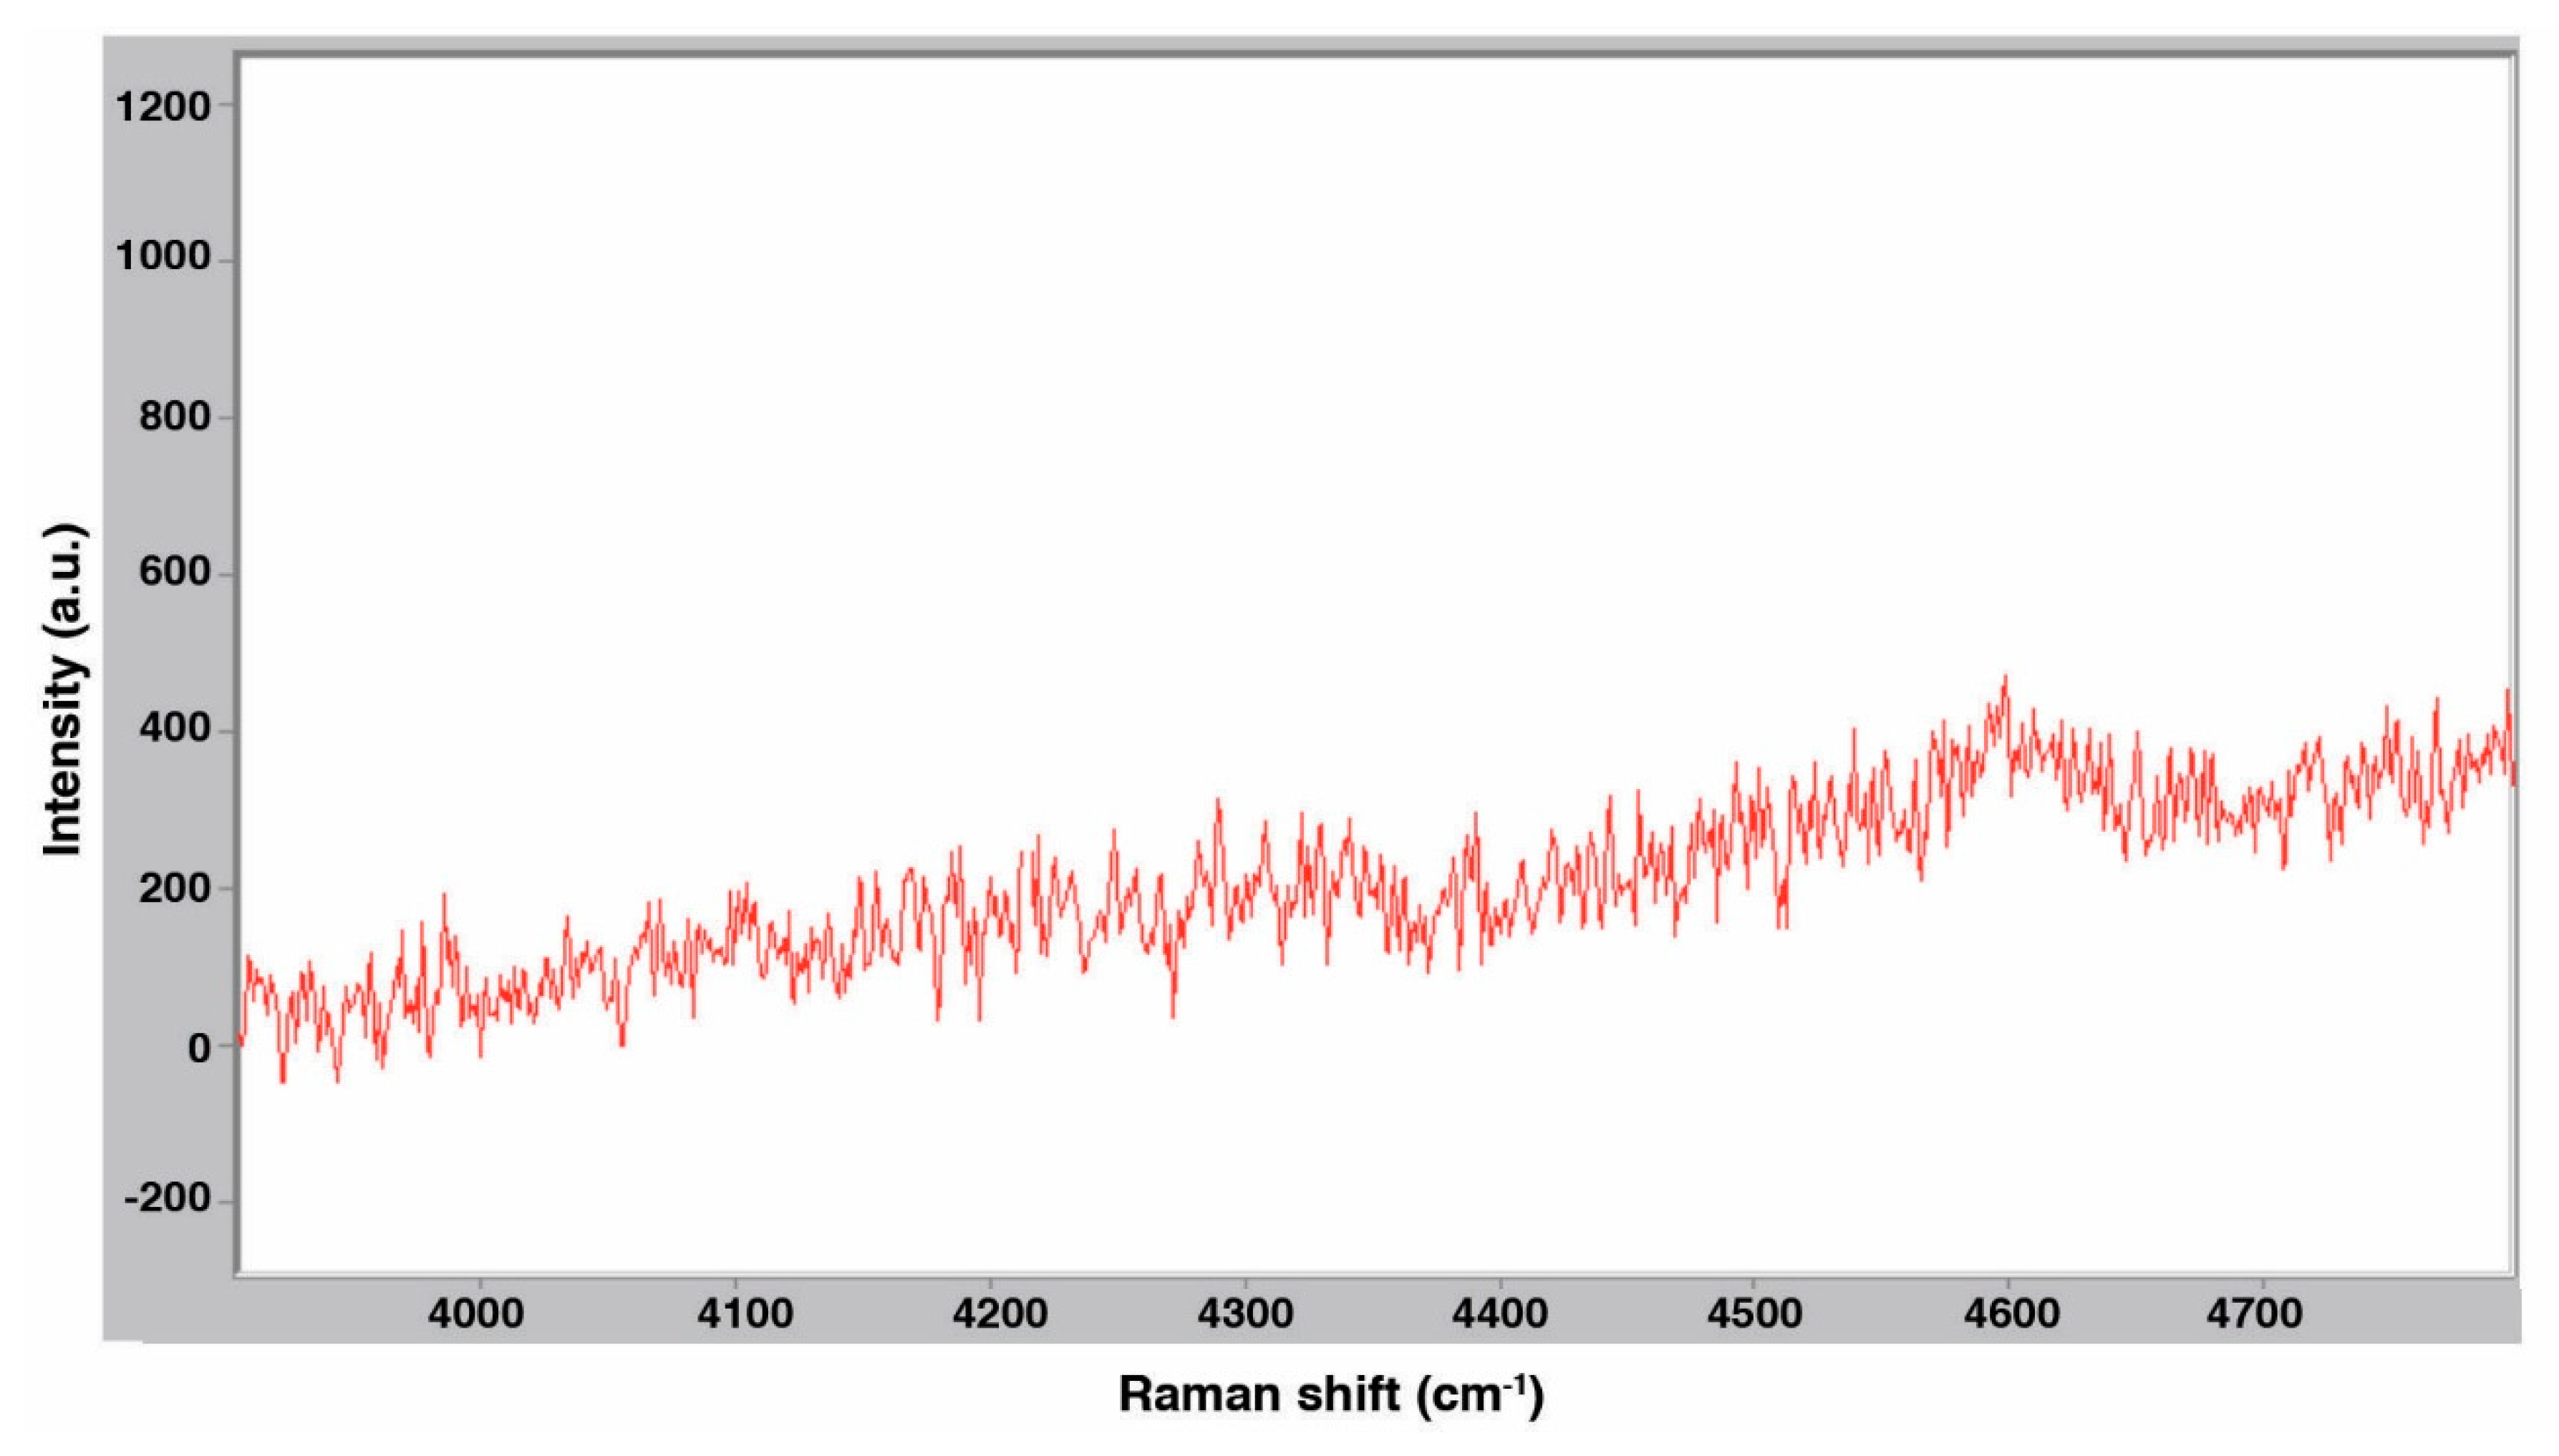
3.2. Raman Spectroscopy
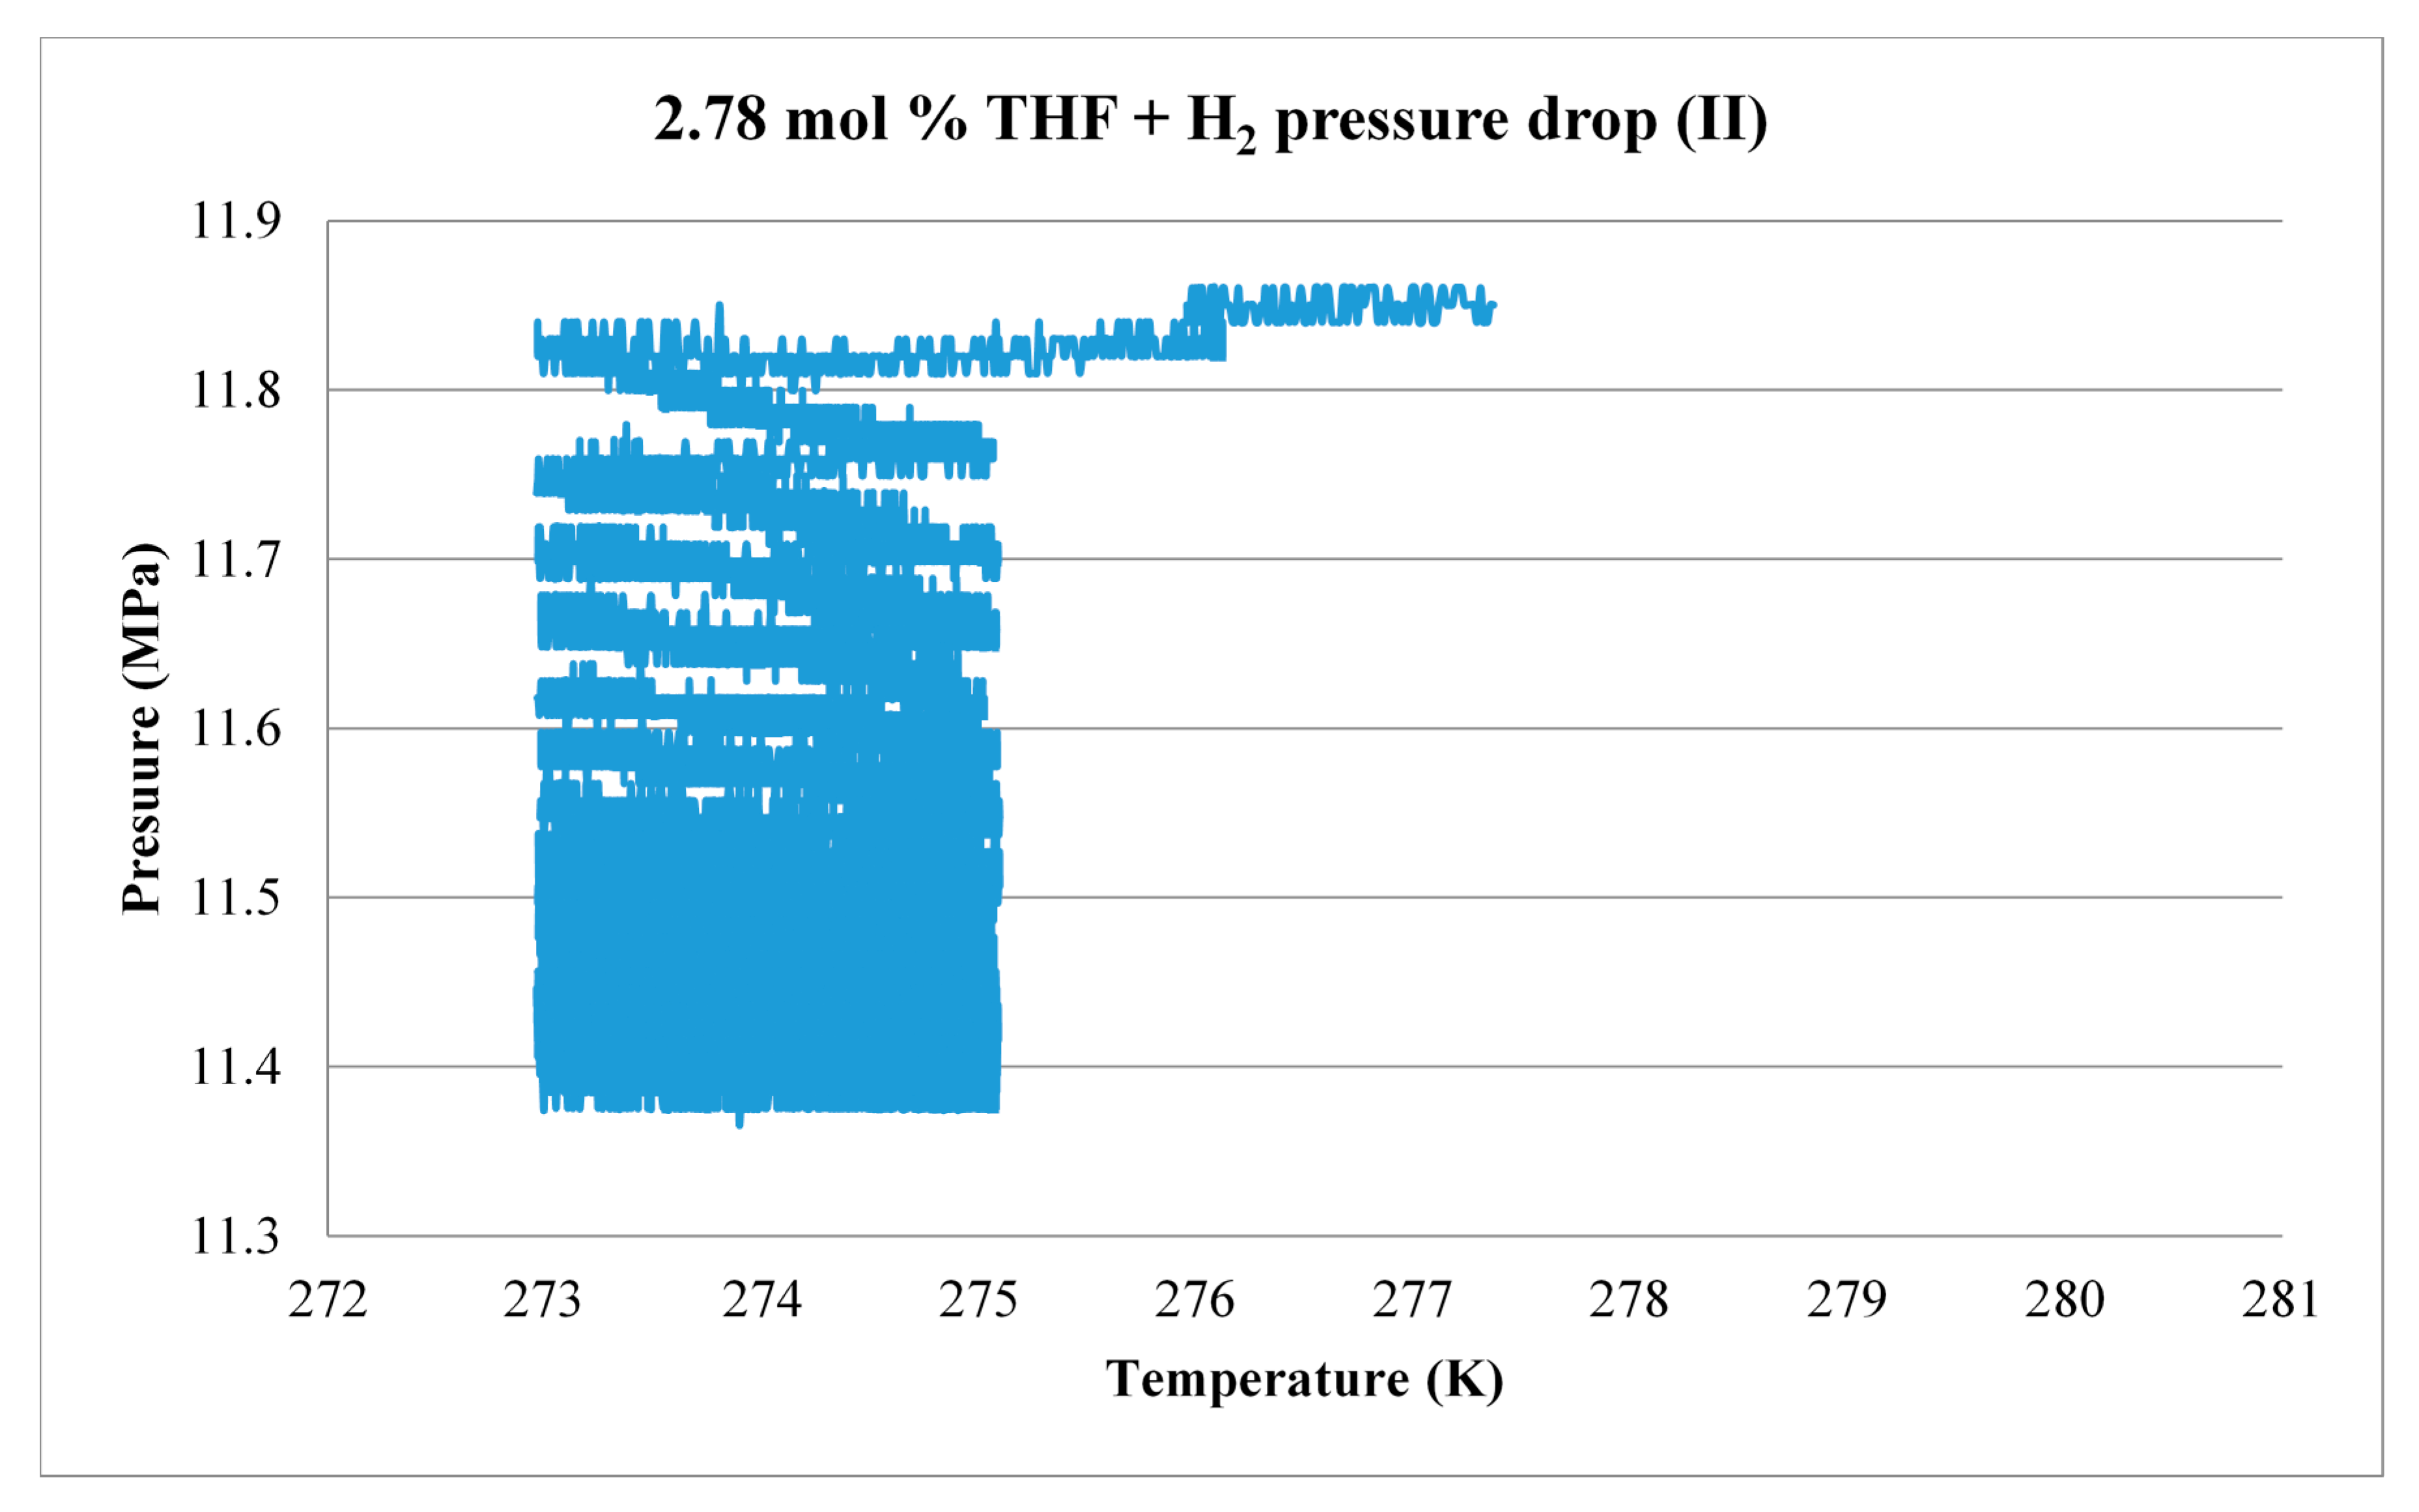
3.3. Scale-Up
4. Conclusions
- Add surfactants to the solutions, since recent studies have shown that surfactants can promote the formation kinetics of binary hydrates.
- Conduct extended scale-up experiments that include multiple formation and dissociation cycles and longer hold times to overcome kinetic limitations.
- Conduct scale-up tests with TBAB solutions.
Acknowledgments
Author Contributions
Conflicts of Interest
References
- Schüth, F. Technology: Hydrogen and hydrates. Nature 2005, 434, 712–713. [Google Scholar] [CrossRef] [PubMed]
- Shariati, A.; Raeissi, S.; Peters, C.J. Clathrate Hydrates, Chapter 3. In Handbook of Hydrogen Storage: New Materials for Future Energy Storage, 1st ed.; Hirscher, M., Ed.; Wiley VCH: Weinheim, Germany, 2010; pp. 63–79. ISBN 978-3-527-32273-2. [Google Scholar]
- Hu, Y.H.; Ruckenstein, E. Clathrate hydrogen hydrate-a promising material for hydrogen storage. Angew. Chem. Int. Ed. 2006, 45, 2011–2013. [Google Scholar] [CrossRef] [PubMed]
- Veluswamy, H.P.; Kumar, R.; Linga, P. Hydrogen storage in clathrate hydrates: Current state of the art and future directions. Appl. Energy 2014, 122, 112–132. [Google Scholar] [CrossRef]
- Florusse, L.J.; Peters, C.J.; Schoonman, J.; Hester, K.C.; Koh, C.A.; Dec, S.F.; Marsh, K.N.; Sloan, E.D. Stable low-pressure hydrogen clusters stored in a binary clathrate. Science 2004, 306, 469–471. [Google Scholar] [CrossRef] [PubMed]
- Hashimoto, S.; Sugahara, T.; Moritoki, M.; Sato, H.; Ohgaki, K. Thermodynamic stability of H2+tetra-n-butyl ammonium bromide mixed gas hydrate in nonstoichiometric aqueous solutions. Chem. Eng. Sci. 2008, 63, 1092–1097. [Google Scholar] [CrossRef]
- Shimada, W.; Shiro, M.; Kondo, H.; Takeya, S.; Oyama, H.; Ebinuma, T.; Narita, H. Tetra-n-butylammonium bromide-water. ACTA Crystollogr. C 2005, 61 (Pt 2), o65–o66. [Google Scholar] [CrossRef] [PubMed]
- Lee, H.; Lee, J.W.; Kim, D.Y.; Park, J.; Seo, Y.T.; Zeng, H.; Moudrakovski, I.L.; Ratcliffe, C.I.; Ripmeester, J.A. Tuning clathrate hydrates for hydrogen storage. Nature 2005, 434, 743–746. [Google Scholar] [CrossRef] [PubMed]
- Strobel, T.A.; Taylor, C.J.; Hester, K.C.; Dec, S.F.; Koh, C.A.; Miller, K.T.; Sloan, E.D. Molecular hydrogen storage in binary THF-H2 clathrate hydrates. J. Phys. Chem. B 2006, 110, 17121–17125. [Google Scholar] [CrossRef] [PubMed]
- Hester, K.C.; Strobel, T.A.; Sloan, E.D.; Koh, C.A.; Huq, A.; Schultz, A.J. Molecular hydrogen occupancy in binary THF-H2 clathrate hydrates by high resolution neutron diffraction. J. Phys. Chem. B 2006, 110, 14024–14027. [Google Scholar] [CrossRef] [PubMed]
- Hawkins, R.E.; Davidson, D.W. Dielectric relaxation in the clathrate hydrate of some cyclic ethers. J. Phys. Chem. 1966, 70, 1889–1894. [Google Scholar] [CrossRef]
- Gough, S.R.; Davidson, D.W. Composition of tetrahydrofuran hydrate and the effect of pressure on the decomposition. Can. J. Chem. 1971, 49, 2691–2699. [Google Scholar] [CrossRef]
- Ogata, K.; Hashimoto, S.; Sugahara, T.; Moritoki, M.; Sato, H.; Ohgaki, K. Storage capacity of hydrogen in tetrahydrofuran hydrate. Chem. Eng. Sci. 2008, 63, 5714–5718. [Google Scholar] [CrossRef]
- Dyer, C.K. Fuel cells for portable applications. Fuel Cells Bull. 2002, 2002, 8–9. [Google Scholar] [CrossRef]
- Cheng, X.; Shi, Z.; Glass, N.; Zhang, L.; Zhang, J.; Song, D.; Liu, Z.-S.; Wang, H.; Shen, J. A review of PEM hydrogen fuel cell contamination: Impacts, mechanisms, and mitigation. J. Power Sources 2007, 165, 739–756. [Google Scholar] [CrossRef]
- Schlapbach, L.; Züttel, A. Hydrogen-storage materials for mobile applications. Nature 2001, 414, 353–358. [Google Scholar] [CrossRef] [PubMed]
- Mao, W.L.; Koh, C.A.; Sloan, E.D. Clathrate, hydrates under pressure. Phys. Today 2007, 60, 42–47. [Google Scholar] [CrossRef]
- U.S. Department of Energy, Office of Energy Efficiency and Renewable Energy. Available online: http://www1.eere.energy.gov/hydrogenandfuelcells/storage/pdfs/targets_onboard_hydro_storage_explanation.pdf (accessed on 31 December 2009).
- Willow, S.Y.; Xanheas, S.S. Enhancement of hydrogen storage capacity in hydrate lattices. Chem. Phys. Lett. 2012, 525–526, 13–18. [Google Scholar] [CrossRef]
- Weissman, J.T. Hydrogen Storage Capacity of Tetrahydrofuran and Tetra-N-Butylammonium Bromide Hydrates at Favorable Thermodynamic Conditions. Master’s Thesis, University of Hawaii, Honolulu, HI, USA, May 2014. [Google Scholar]
- Du, J.; Wang, L.; Liang, W.; Li, D. Phase equilibria and dissociation enthalpies of hydrogen semi-clathrate hydrate with tetrabutyl ammonium nitrate. J. Chem. Eng. Data 2011, 57, 603–609. [Google Scholar] [CrossRef]
- Kim, D.; Park, Y.; Lee, H. Tuning clathrate hydrates: Application to hydrogen storage. Catal. Today 2007, 120, 257–261. [Google Scholar] [CrossRef]
- Sloan, E.D.; Koh, C.A. Clathrate Hydrates of Natural Gases, 3rd ed.; CRC Press: Boca Raton, FL, USA, 2008; ISBN 9780849390784. [Google Scholar]
- Mulder, F.M.; Wagemaker, M.; van Eijck, L.; Kearley, G.J. Hydrogen in porous tetrahydrofuran clathrate hydrate. ChemPhysChem 2008, 9, 1331–1337. [Google Scholar] [CrossRef] [PubMed]
- Papadimitriou, N.I.; Tsimpanogiannis, I.N.; Economou, I.G.; Stubos, A.K. Storage of H2 in clathrate hydrates: Evaluation of different force-fields used in Monte Carlo simulations. Mol. Phys. 2017, 115, 1274–1285. [Google Scholar] [CrossRef]
- Hashimoto, S.; Sugahara, T.; Sato, H.; Ohgaki, K. Thermodynamic stability of H2+Tetrahydrofuran mixed gas hydrate in nonstoichiometric aqueous solutions. J. Chem. Eng. Data 2007, 52, 517–520. [Google Scholar] [CrossRef]
- Anderson, R.; Chapoy, A.; Tohidi, B. Phase relations and binary clathrate hydrate formation in the system H2−THF−H2O. Langmuir 2007, 23, 3440–3444. [Google Scholar] [CrossRef] [PubMed]


| THF Concentration (mol %) | Sample Size (g) | ∆n (mol) | H2 (g) | Storage Capacity (wt %) |
|---|---|---|---|---|
| 2.78 | 165 | 0.041 | 0.083 | 0.050 |
| 5.56 | 166 | 0.022 | 0.045 | 0.027 |
| 8.34 | 168 | 0.022 | 0.045 | 0.027 |
| THF Concentration (mol %) | Sample Size (g) | Gas Sampling Results | Gas Pressure Drop Results | ||
|---|---|---|---|---|---|
| H2 (g) | Storage Capacity (wt %) | H2 (g) | Storage Capacity (wt %) | ||
| 2.78 | 165 | 0.083 | 0.050 | 0.096 | 0.058 |
| 5.56 | 166 | 0.045 | 0.027 | 0.076 | 0.046 |
| 8.34 | 168 | 0.045 | 0.027 | 0.064 | 0.038 |
© 2017 by the authors. Licensee MDPI, Basel, Switzerland. This article is an open access article distributed under the terms and conditions of the Creative Commons Attribution (CC BY) license (http://creativecommons.org/licenses/by/4.0/).
Share and Cite
Weissman, J.T.; Masutani, S.M. Hydrogen Storage Capacity of Tetrahydrofuran and Tetra-N-Butylammonium Bromide Hydrates Under Favorable Thermodynamic Conditions. Energies 2017, 10, 1225. https://doi.org/10.3390/en10081225
Weissman JT, Masutani SM. Hydrogen Storage Capacity of Tetrahydrofuran and Tetra-N-Butylammonium Bromide Hydrates Under Favorable Thermodynamic Conditions. Energies. 2017; 10(8):1225. https://doi.org/10.3390/en10081225
Chicago/Turabian StyleWeissman, Joshua T., and Stephen M. Masutani. 2017. "Hydrogen Storage Capacity of Tetrahydrofuran and Tetra-N-Butylammonium Bromide Hydrates Under Favorable Thermodynamic Conditions" Energies 10, no. 8: 1225. https://doi.org/10.3390/en10081225
APA StyleWeissman, J. T., & Masutani, S. M. (2017). Hydrogen Storage Capacity of Tetrahydrofuran and Tetra-N-Butylammonium Bromide Hydrates Under Favorable Thermodynamic Conditions. Energies, 10(8), 1225. https://doi.org/10.3390/en10081225