Article

Techno-Economic Investigation of Solar Powered Electric Auto-Rickshaw for a Sustainable Transport System

1
Heat Transfer and Thermal Power Laboratory, Department of Mechanical Engineering, Indian Institute of Technology Madras, Chennai 600036, India
2
Environment and Sustainability Institute, University of Exeter, Penryn Campus, Penryn, Cornwall TR10 9FE, UK
*
Authors to whom correspondence should be addressed.
Energies 2017, 10(6), 754; https://doi.org/10.3390/en10060754
Submission received: 4 April 2017 / Revised: 4 May 2017 / Accepted: 24 May 2017 / Published: 28 May 2017

Abstract

:
Technologies influencing alternative means of transportation have been expanding in recent years due to increasing urbanization and motorization. In this paper, a solar powered electric auto-rickshaw (SPEA) is designed and developed for Indian conditions. The vehicle developed is comprehensively analyzed techno-economically for its viability in the Indian market. The performance analysis of SPEA results in an optimal charging rate of 2 kWh per day with an average solar irradiance of 325 W/m2 on a typical sunny day. The discharging characteristics are studied based on different loading conditions. The vehicle achieved a maximum speed of 21.69 km/h with battery discharge rate of 296 W at 90 kg load and also reached a maximum discharge rate of 540 W at 390 kg loading with a maximum speed of 12.11 km/h. Environmental analysis of SPEA indicated that the yearly CO2 emissions of 1777 kg, 1987 kg and 1938 kg from using Compressed Natural Gas, Liquefied Petroleum Gas and gasoline engines respectively can be mitigated using SPEA. The financial analysis of SPEA concluded that the investor’s payback duration is 24.44% less compared to a gasoline-run vehicle. Socio-Economic analysis of SPEA discussed its significant advantages and showed 15.74% and 0.85% increase in yearly income over gasoline driven and battery driven vehicles.

1. Introduction

The global dependence on fossil fuels is increasing day by day, predominantly in the automobile sector, and they are expected to dominate till 2040 [1]. The prime causes of this dependence are people’s economic transition, rapid growth in vehicle ownership and changes in activity patterns of the people. This dependence has resulted in the pollution of the environment by increased carbon emissions.

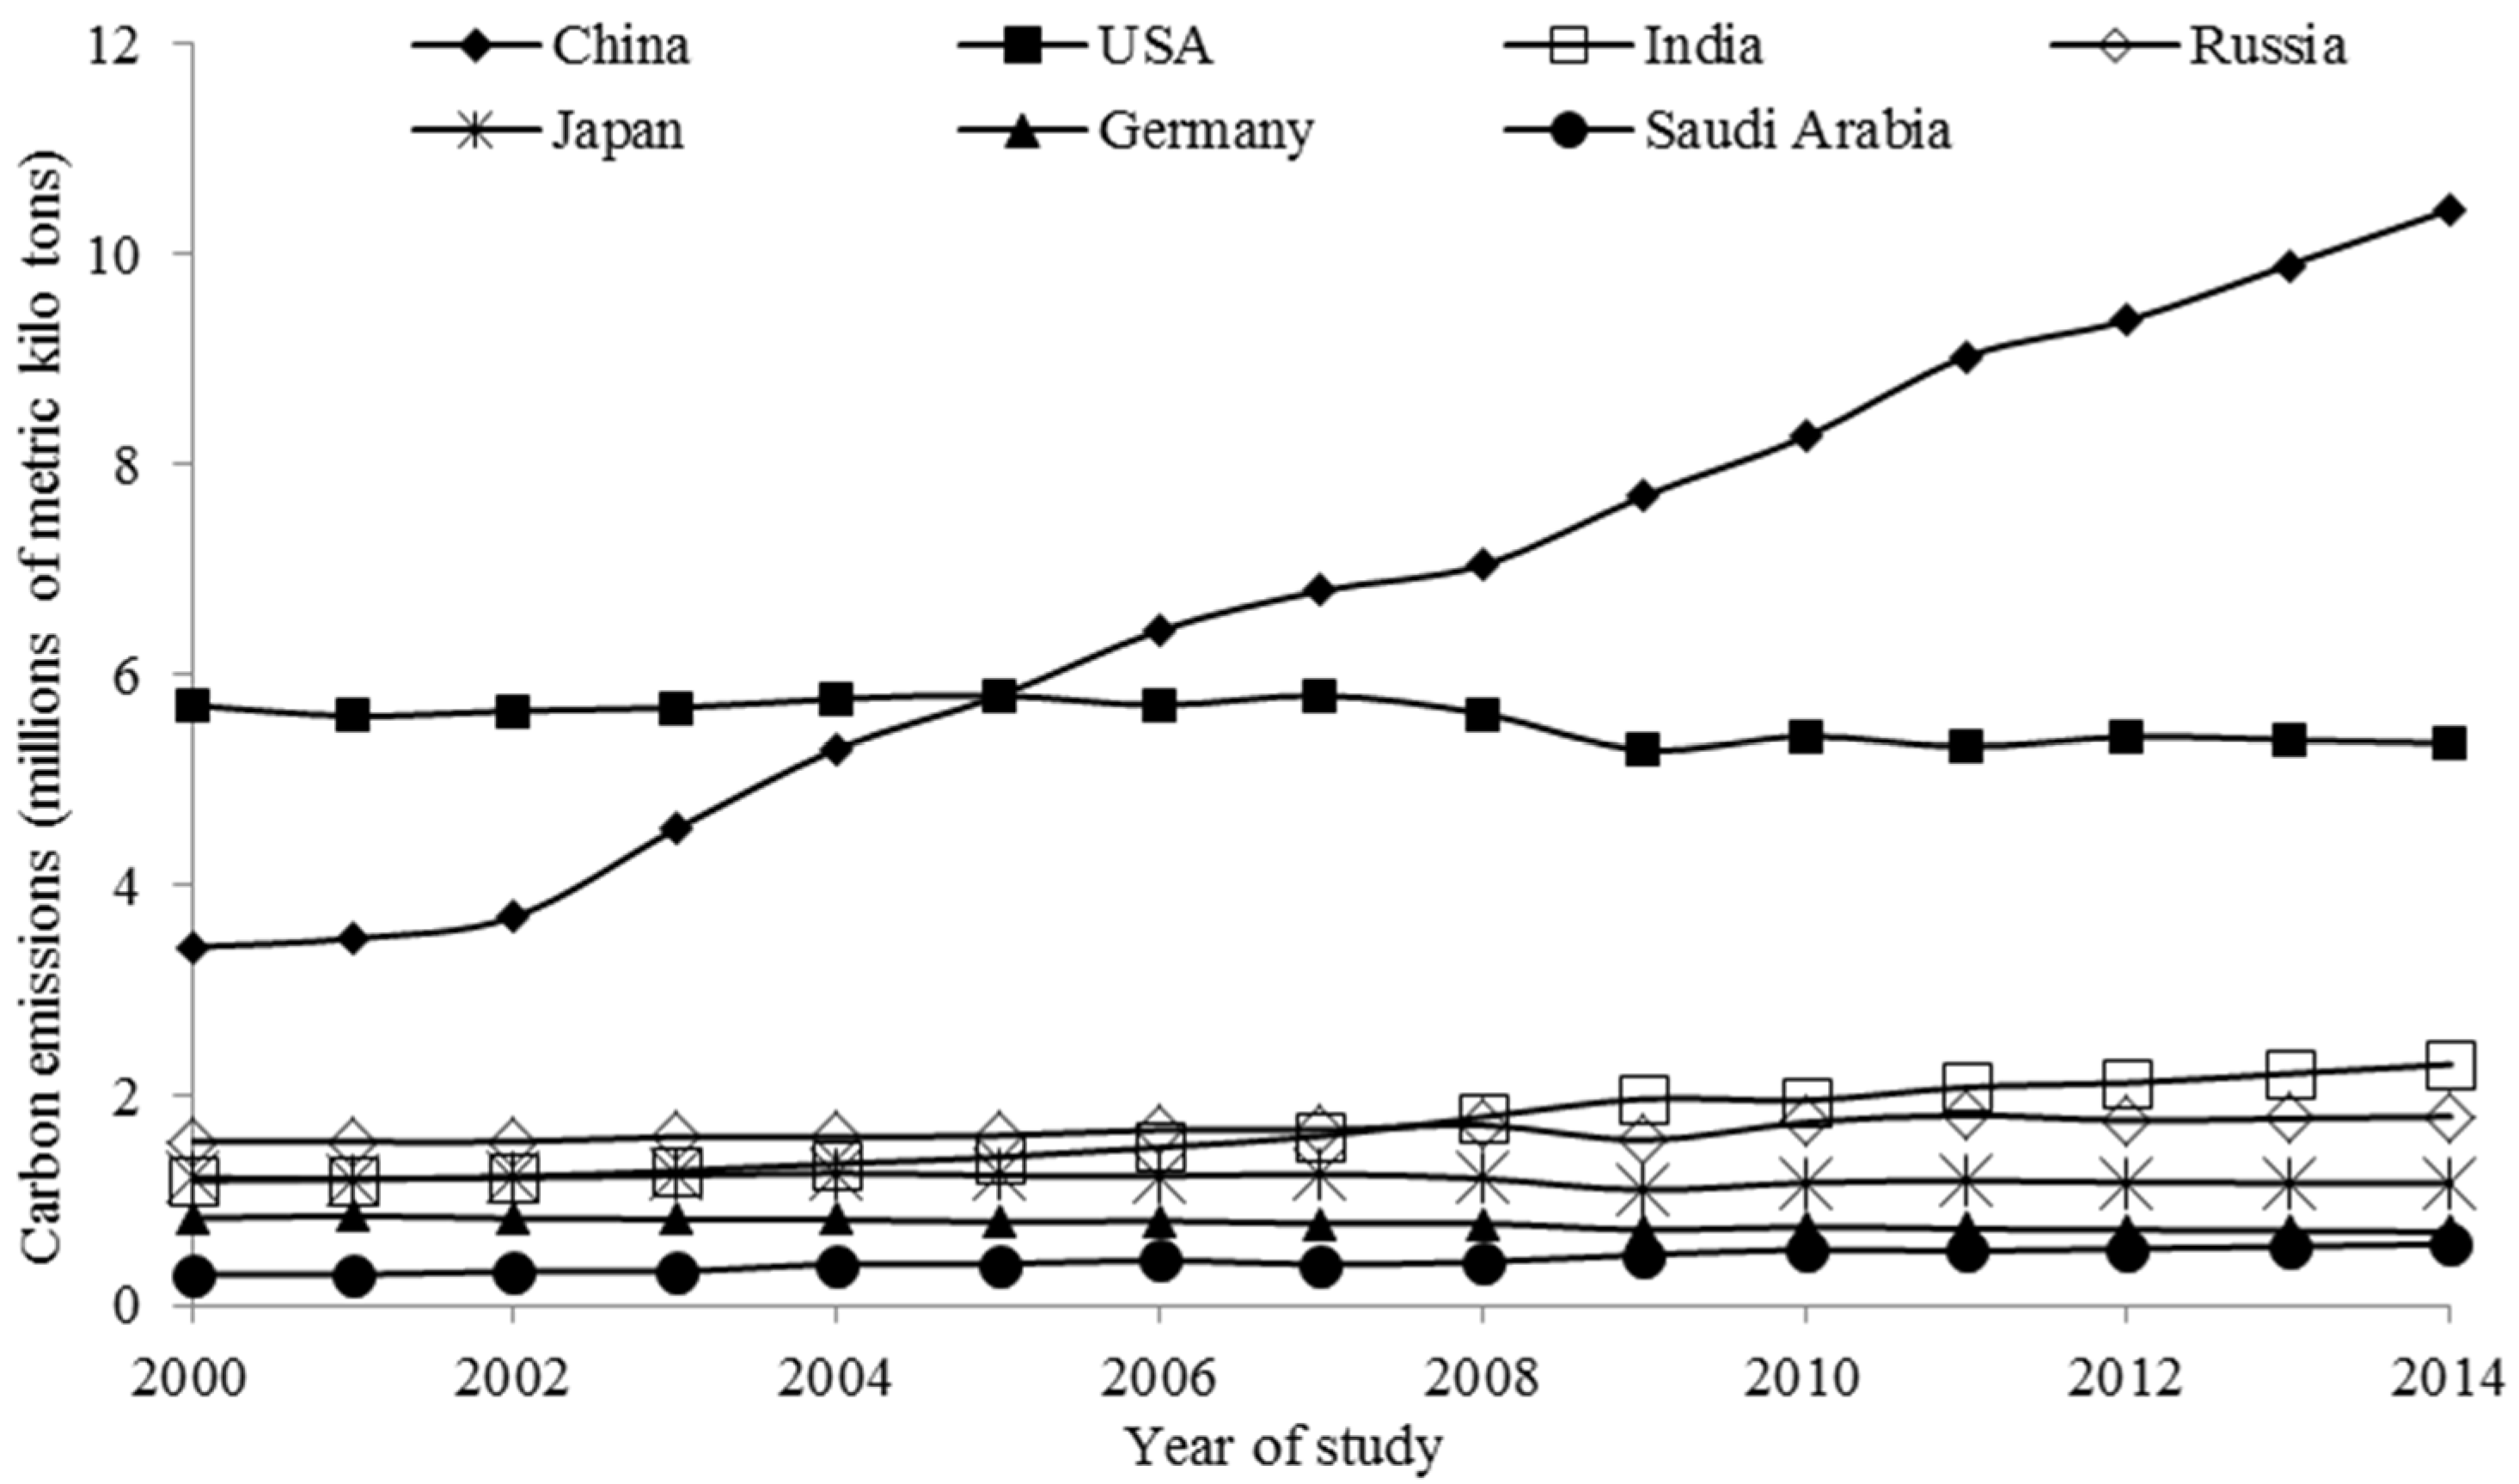
1.1. Current Status of Carbon Emission in Transport Sector

The statistics on country-wise petroleum consumption during the years 2000–2014 [2] shows India as the third largest consumer of petroleum, consuming about 3.9% of world’s petroleum reserves. Combustion of these fuels in automobiles generates gases like CO2 which enhance global warming. The CO2 measurement system developed by Earth System Research Laboratory, Colorado observed an increase of 11.5% in global atmospheric CO2 in the past decade [3]. A report on country-wise carbon emissions in the automobile sector by the World Bank [4] over the years 2000–2014, as depicted in Figure 1, displays India as one of the major contributors of carbon emissions, accounting 5.9% of world’s CO2 emission.
The complication associated with conventional transport systems can be addressed by the development of alternative transport systems such as solar powered electric vehicles, which are gaining importance in transforming automobile sector. India, a country near to the equator, is bestowed with vast solar energy potential with annual solar radiation ranging from 1600–2200 kWh/m2 [5]. India is a home to more than 2.5 million auto-rickshaws (three-wheelers) [6] and the yearly report by the National Data Sharing and Accessibility Policy (NDSAP) [7] shows an increasing trend in the registration of new auto rickshaws every year over a decade. This rising trend confirms rickshaws are a suitable vehicle for electrification because of their low-speed application and use as local transportation.

1.2. Literature Review

Discussions on the present and future potential for electric vehicles (EV) give an explicit awareness of the technological advancements carried out in this particular field. EV, in upcoming years, are predicted to increase global energy consumption by 30% and reduce harmful carbon emissions by 25–60% [8]. Several energy consumption algorithms and vehicle operation models have been analyzed and validated by various authors which help us in optimizing the vehicle charging and discharging characteristics [9,10]. Case studies of EV usage patterns observed in Northern Europe [11] and Lisbon [12] help us to understand their energy consumption characteristics, usage patterns and environmental impacts.
The emphasis on charging EV using photovoltaic (PV) technology is up-and-coming due to a continuous decrease in the price of PV modules, concerns over the effects of greenhouse gases, global energy policies and an increase in procurement of EV. Over the years, numerous methods of charging EV using PV technology have been proposed [13,14]. The idea of developing off-grid recharging stations (using solar and wind energy) for charging EV during day time in vehicle parking locations [15] not only impacts the energy economy but also evidently helps to reduce the carbon footprint.
The idea of incorporating solar PV modules into passenger vehicles has been prototyped by some of the top automobile companies as it lessens gasoline dependence and significantly cuts down fuel expenses, while also reducing carbon emission levels. The Japanese companies [16] Mazda and Toyota are the front runners in transforming this concept into reality. In the early 2000s Mazda’s 929 luxury sedan came up with an optional solar roof to power their air-conditioning system. Toyota redesigned its model Prius Prime to accommodate a 180 W solar panel to charge the batteries and power the car accessories. Ford Motor Company [17] developed a product “C-MAX Solar Energi” with an off-vehicle solar concentrator made up of a special Fresnel lens to direct sunlight to the rooftop solar cells while enhancing the solar radiation to harness more power from highly efficient solar cells.
This paper deals with the development of solar powered electric auto-rickshaws (SPEA) as an alternate to conventional auto rickshaws. Thus the study on the usage pattern of a conventional auto rickshaw in Indian cities paves a way to understand the economics of its usage and helps in sizing the PV/battery for the proposed system [18]. The performance of a solar vehicle is governed mainly by the solar PV efficiency [19], selection of motor [20] and battery system [21]. Alongside the development of solar electric vehicles, hybridizing conventional vehicles with solar energy [22,23] proves to be energy efficient and also partly lessens the carbon emissions. The studies by Mani and Kreutzmann [24] and Hannan et al. [25] lay the foundation for this present work by highlighting the importance of sustainable transportation and discussing the important design and performance parameters associated with solar powered electric auto-rickshaws.
Thus, from the literature review, it is implicit that an outright solar powered vehicle has not yet been developed for public commuting, though some plug-in hybrid car models that incorporate solar PV panels for charging the battery and powering accessories are available. The literature discussed above has helped to define and discuss the problem effectively and also guided us to address the knowledge gap between the work carried out in recent past and present work. The optimization of SPEA and its techno-economic analysis has been carried out to study the feasibility of the system for Indian conditions and compared with existing conventional vehicles. This paper focuses on charging existing electric vehicles using solar PV technology. In detail, the charging and discharging patterns of batteries, economic analysis of vehicles and mitigation of CO2 on implementing SPEA has also been discussed. This paper is further organized as follows. Section 2 explains the design and development of SPEA, Section 3 communicates the performance analysis of SPEA, furthermore Section 4 and Section 5 enlighten the environmental and economic analysis of SPEA respectively.

2. Design and Development of the Solar Powered Electric Auto-Rickshaw (SPEA)

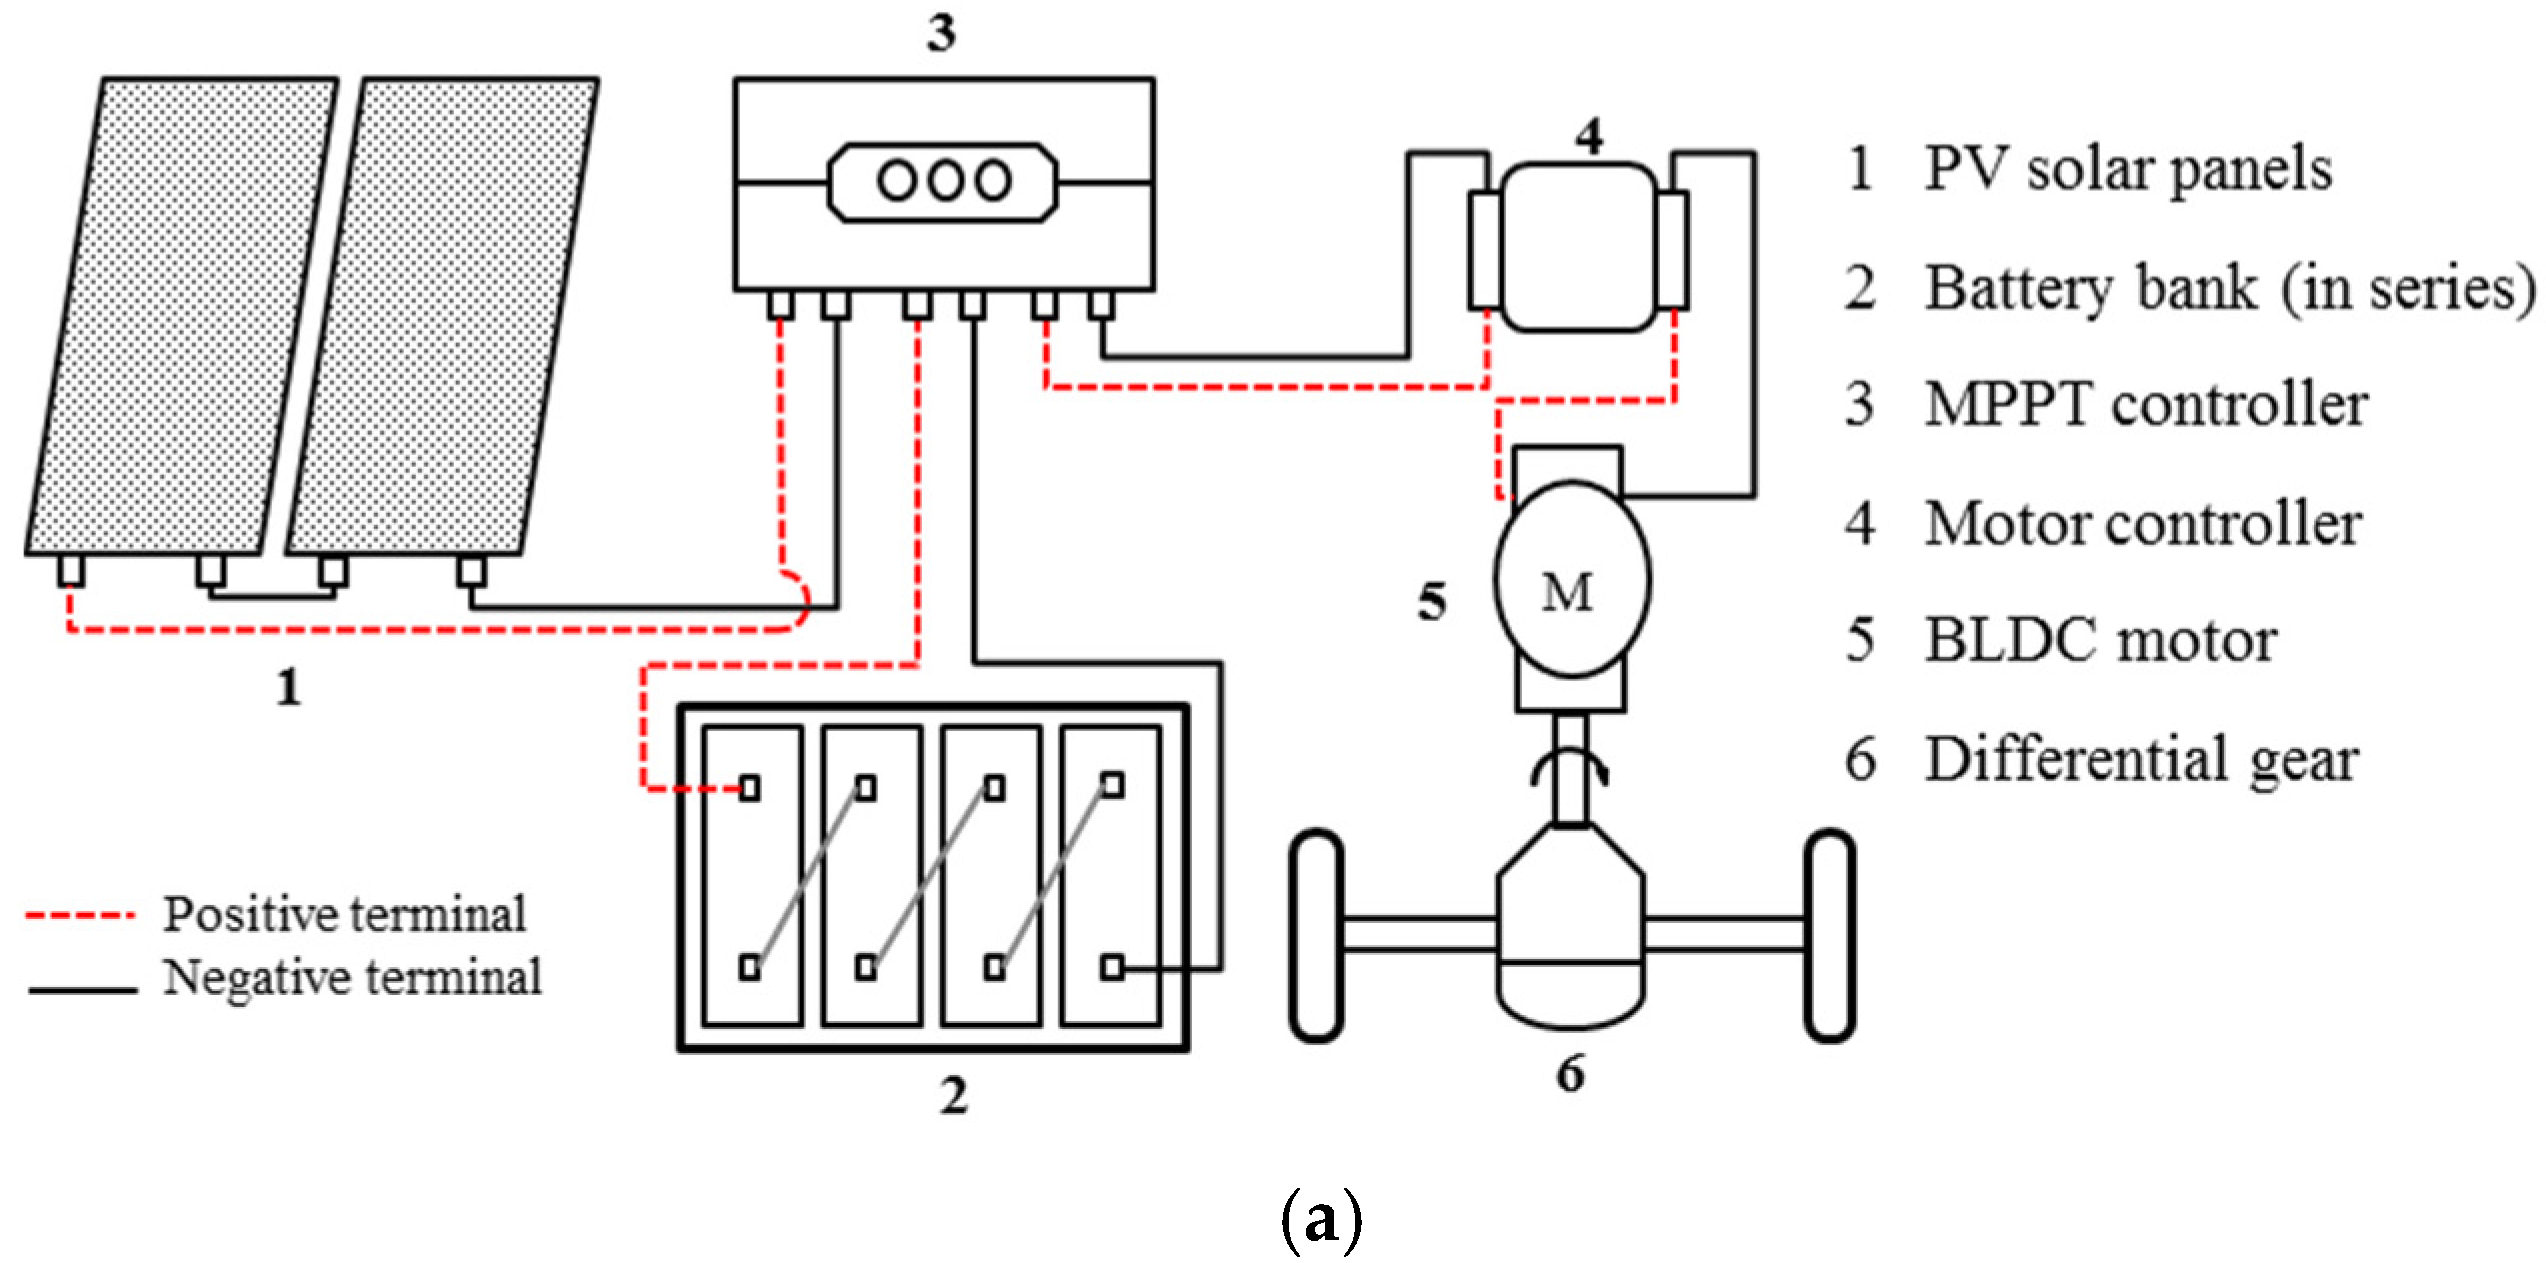
2.1. Principle and Operation

The operating principle of the proposed solar vehicle is briefly explained in Figure 2a. Solar PV panels are fixed on the vehicle roof, which convert the sun’s energy directly into electrical energy. The maximum power point tracking (MPPT) controller is incorporated to extract the maximum power out of solar panels for charging the lead-acid automotive batteries. The Brushless Direct Current (BLDC) electric motor is employed to convert the battery power into mechanical drive energy. BLDC motors are reliable, safe to handle and operate with minimum noise with less frictional losses. The motor controller provided along with the motor senses the position of the stator and energizes the rotor accordingly using the Hall Effect sensor. Power from the motor is transmitted to the wheels through differential gears. The modified vehicle with solar PV panels is depicted in Figure 2b,c.

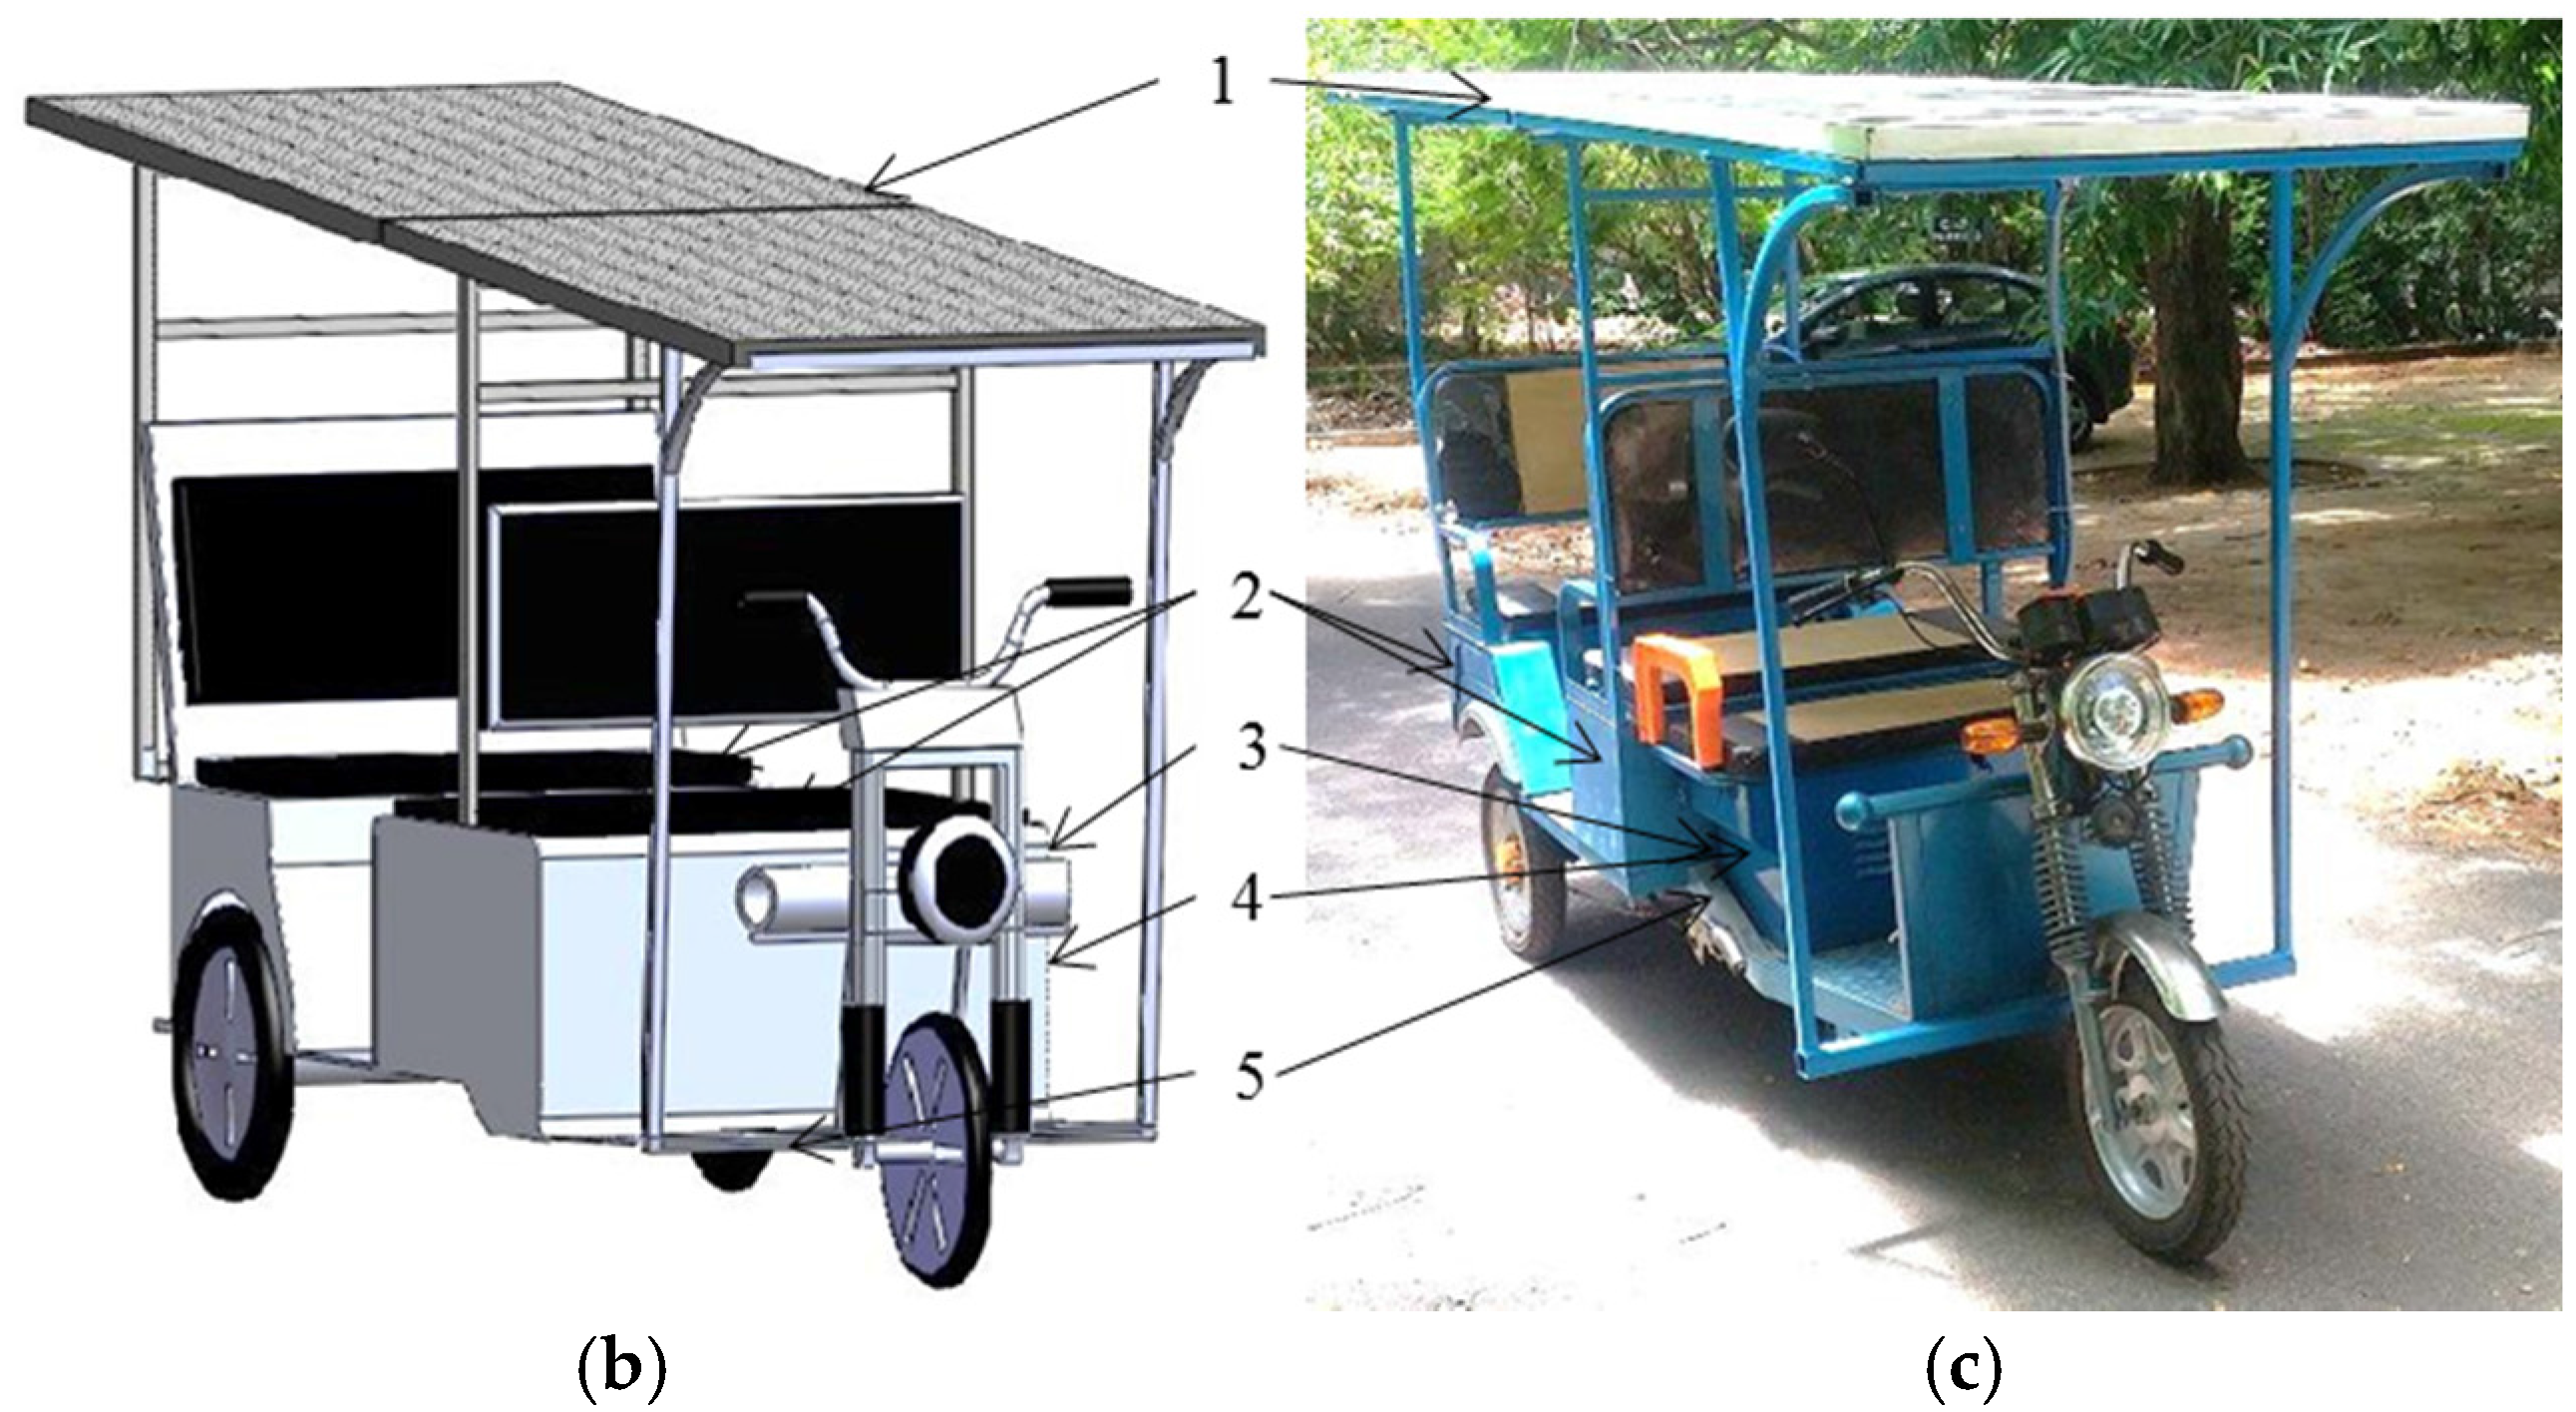
2.2. Design and Development of SPEA

The three-wheeler SPEA developed for this research was assembled and tested at Indian Institute of Technology-Madras, India (12.9908° N, 80.2357° E). As the electric auto rickshaw is already available, the specifications are to accommodate solar panels and supporting equipment on the existing vehicle. The parameters related to this research have been derived from various studies and are discussed in detail below.
(1) Maximum solar radiation available on the vehicle sloped surface
The maximum incident radiation on the solar panel for the given location is found out using the following expression:
S module   =   S incident   sin ( [ 90 φ   +   δ ]   +   β )
where S module is solar radiation incident on the solar module in watt per square meter, S incident is solar radiation measured perpendicular to the sun in watt per square meter, φ is the latitude of the considered location in degrees, δ is declination angle in degrees and β is tilt angle of the module measured from the horizontal in degrees.
The expression for declination angle δ is given by:
δ =   23.45   ×   sin [ 360 / 365   ×   ( 284   +   d ) ]
where d is the day of the year.
(2) Height of center of gravity calculation
The height of center of gravity determines the stability of the vehicle considering its total weight and wheelbase distance. It is significant to determine the load transfer between the front and rear wheels. Height of center of gravity ( h CG ) is found out by [26]:
h CG   =   wheelbase   distance   ×   difference   in   vehicle   weight Total   weight   of   vehicle   x   tan   of   slope   of   track   =   W b   ( W FR W F ) m v   tan θ
The approximate height of center of gravity ( h CG ) computed using this formula is 834 mm considering the vehicle mass ( m v ) as 330 kg, wheelbase distance ( W b ) as 1022 mm, θ as 2 degrees whereas W FR   &   W F are the weight of front tires while rear wheel of the vehicle is raised and kept horizontally level respectively. The difference in weight W FR W F is found to be 9.4 kg. The position of the centre of gravity is also influenced by the number of passengers riding in the vehicle.
(3) Wind load calculation
Wind load primarily affects the support structure design as it exerts stress on the structure externally. It is a function of the velocity of the vehicle, as the wind load varies with velocity of the vehicle exponentially. Wind load is expressed as [24]:
F w   =   0.613 ( A   C D V 2 )
The wind load F w depends on the drag co-efficient ( C D ) , vehicle frontal area ( A ) and velocity of the vehicle ( V ) . F w is calculated to be 6 kg by assuming C D as 1.05 (drag co-efficient of a cube), V as 30 km/h and A as 1.30 sq. m.
(4) Power requirement and selection of motor
The power requirement to propel SPEA should be enough overcome wind drag, gravitational force and rolling resistance. Aerodynamics involved in the design of a vehicle will have a significant impact on its performance. Generally, the aerodynamic drag increases gradually with an increase in vehicle speed, but at higher speeds the drag becomes proportional to the square of speed, thus increasing the drag. The Rolling resistance of a body is proportional to the weight of the body normal to the surface of travel (W). Power requirement is computed by [24].
Required power ( P r ) ≥ wind drag + rolling resistance + gravitational force:
P r   0.5 ρ C D AV 2   +   W ( C r cos θ   +   sin θ ) V
where P r is Power required in Watts, ρ is air density in kg/m3, C D is drag coefficient, A is vehicle frontal area in sq. m, V is vehicle speed in m/s, W is vehicle mass in kg, C r is Co-efficient of rolling resistance and θ is slope of track in degrees.
(5) Battery bank capacity
Battery bank capacity is selected based on the total power needed for the required duration in a day and the battery efficiency. Battery bank will act as a secondary or backup power source for the vehicle during cloudy or rainy days. The weight of battery also concerns the traveling performance of the vehicle. Thus choosing the capacity of the battery bank is a critical part of designing a solar powered system.
Battery bank capacity is selected using the following relation:
P b   =   power   required   ×   operating   duration battery   efficiency   ×   battery   voltage   ×   maximum   DOD   ×   days   of   autonomy   =   P r   t η b V b ( DOD ) n
The capacity of battery ( P b ) is found out to be 425 Ah considering required power ( P r ) as 3 kW, operating duration ( t ) as 8 h per day and 1 day of autonomy (n). The parameters associated with the battery such as battery efficiency ( η b ), depth of discharge (DOD) and battery voltage ( V b ) are considered as per available battery specifications [27]. The complete hardware related to the solar electric vehicle is presented in Table 1. Of the batteries used for solar applications, the lead acid batteries are largely used in India because of their moderate price tag and robust usage. Thus from a commercialization and economic point of view, the authors wish to consider lead acid batteries for this analysis.
(6) Travelling distance
The maximum distance that a SPEA of specific weight could travel is calculated by [21]:
D vehicle   =   energy   conversion   efficiency   ×   Energy   from   solar   panels Vehicle   tractive   force   =   η E s T f
The distance travelled by SPEA is defined as the ratio of product of electric vehicle energy conversion efficiency ( η ), energy from solar panels ( E s ) and the vehicle tractive force ( T f ).
As discussed above, the calculation of solar radiation available on the vehicle surface forms the foundation of the design process. Based on the available solar radiation, the power required for the vehicle, capacity of batteries and travelling distance are found out. In order to accompany solar PV panels, the steel structures are designed and assembled with the help of height of the center of gravity and wind load calculations.

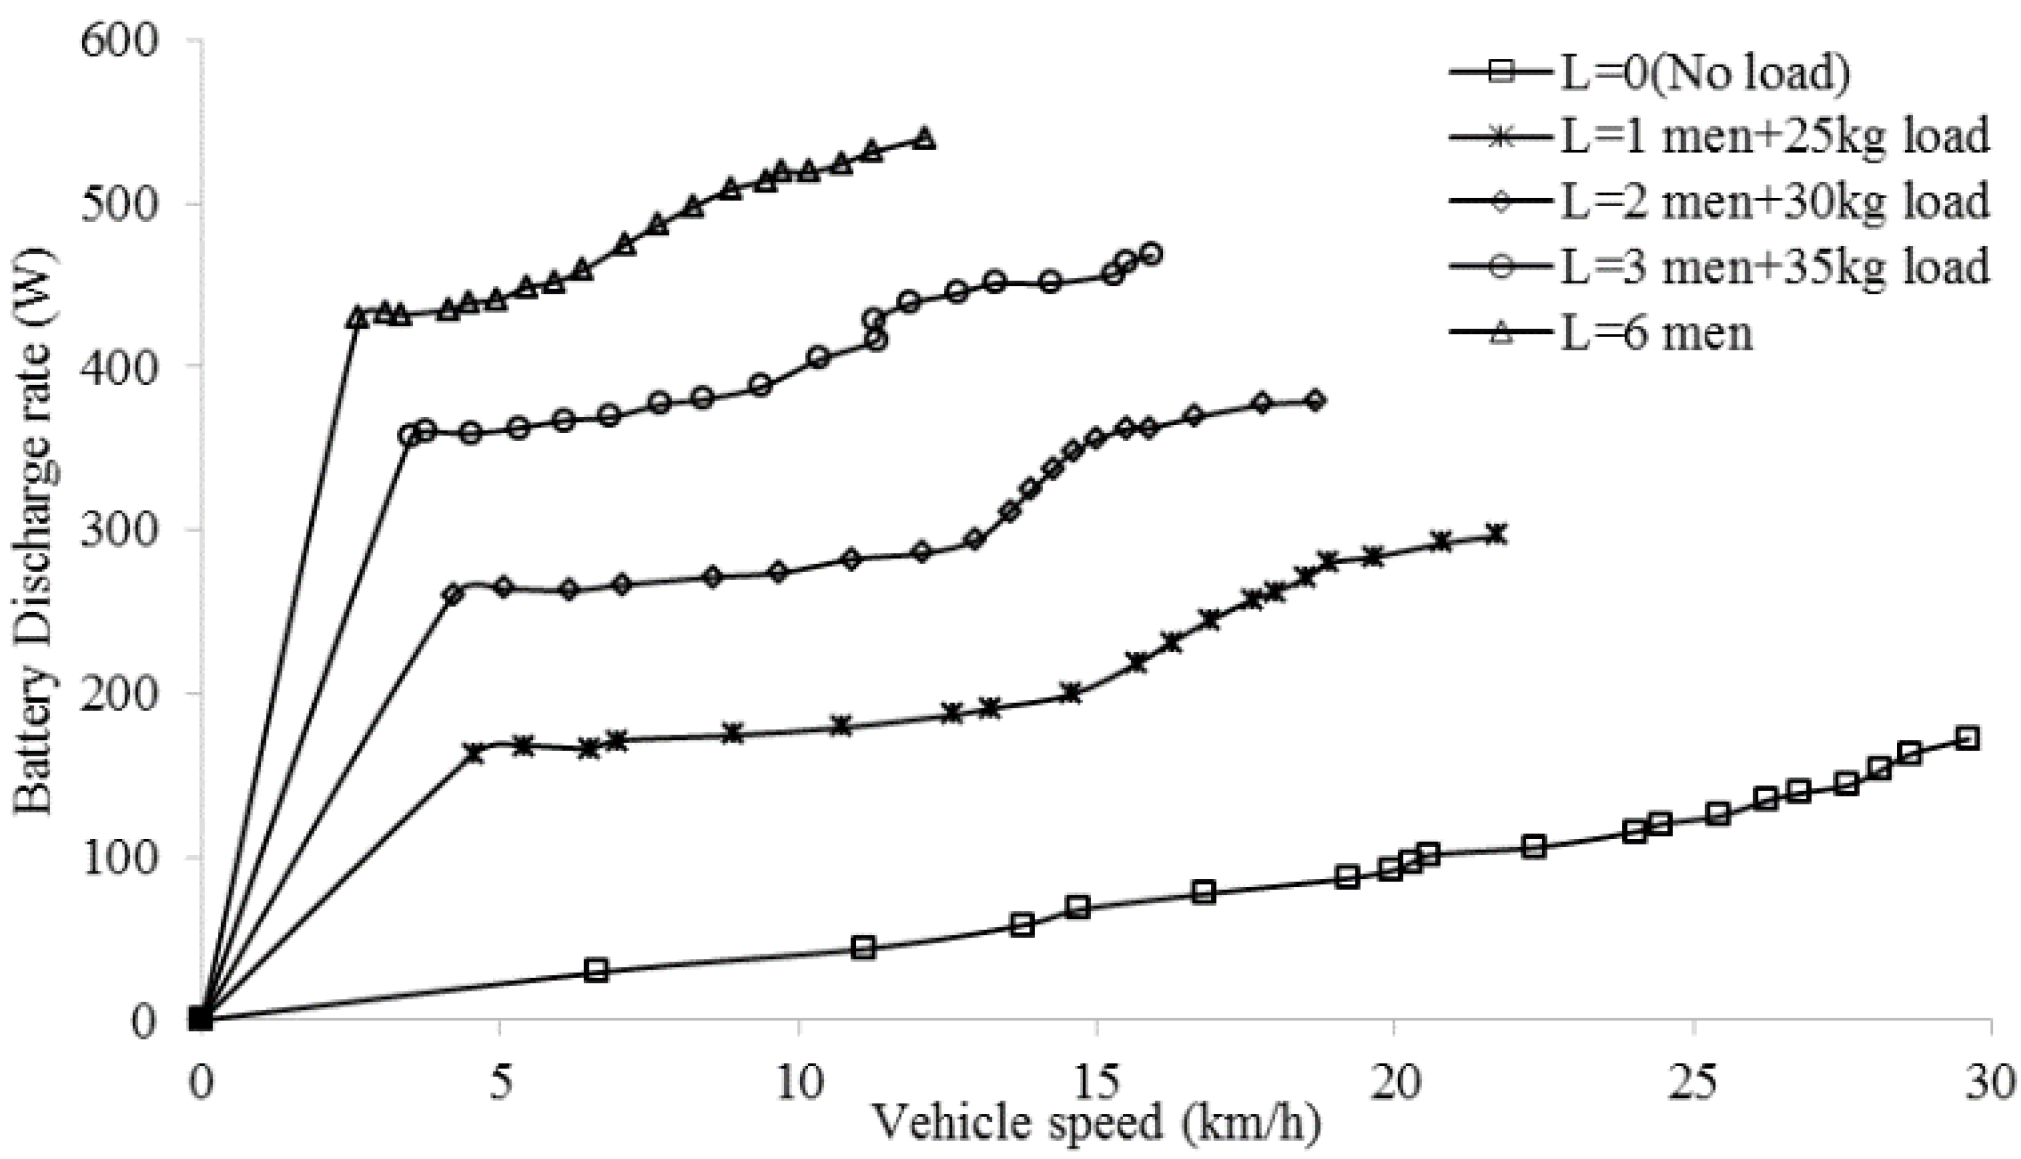
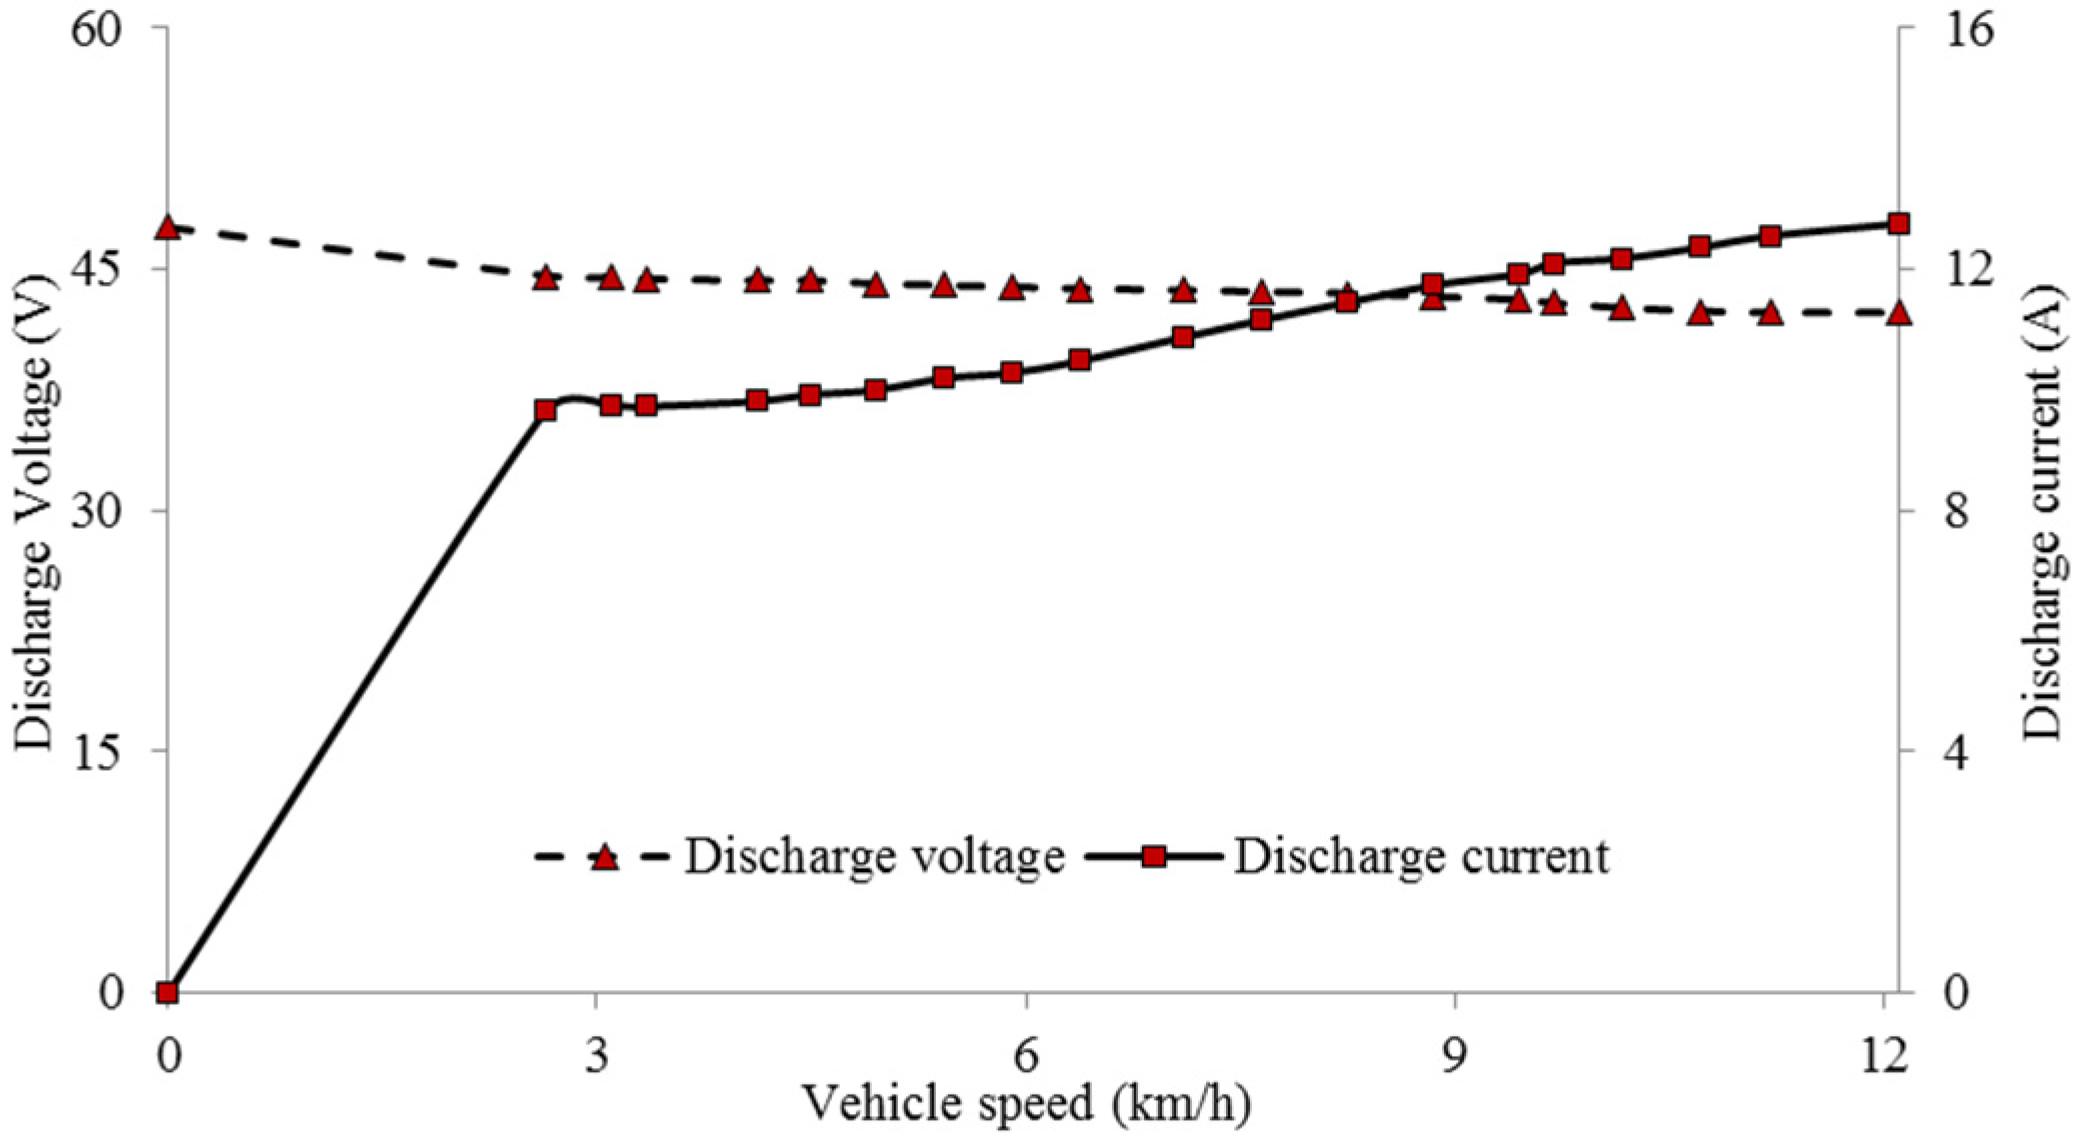
3. Performance Analysis of SPEA

The performance analysis is basically executed to test the charging and discharging characteristics of the solar vehicle. The battery placed in the solar vehicle was charged using PV panels placed on top of the vehicle. The charging and discharging characteristics were separately tested and explained in this section. The experiments were carried out to analyze the performance of the vehicle on a typical sunny day. The DC voltage and current were measured using MASTECH (Taipei, Taiwan) [31] make digital multi-meter and instantaneous solar irradiance was measured using PMA 2144 class II pyranometer (Solar Light Company, Inc., Glenside, PA, USA) [32]. The accuracies of measuring instruments associated with the measurement of parameters such as vehicle speed, DC voltage, DC current and irradiance were found out to be ±4.0%, ±1.0%, ±1.5% and ±2.5% respectively.
The irradiance incident on the panels and the electrical output from PV panels over a day is shown in Figure 3. As discussed, the charging characteristics of the vehicle purely depend on the irradiance and the photovoltaic panel specifications. The PV panel output followed the same pattern as radiation intensity over the day. It reached the peak value during the noon period (11 a.m. to 2 p.m.). The overall rated power output of the panels as mentioned in Table 1 is 490 W (2 panels of 245 W) but for the measured average irradiance per day of 325 W/m2 on the tilted PV panel surface, the power output was around 250 W. Thus, a day-long charge should yield about 2 units i.e., 2 kWh of power.
The relation between vehicle speed and discharge rate is illustrated in Figure 4. This test was conducted with a variable load ranging from no load (only the vehicle’s weight) to 400 kg which was the maximum weight the vehicle can hold. The weight of the vehicle in this context refers to the summation of the vehicle’s weight, the weight of solar panels, support structure and batteries and also the driver’s weight. The maximum speeds achieved at the loads 0 kg (no load), 90 kg, 160 kg, 230 kg and 390 kg were 29.6 km/h, 21.69 km/h, 18.69 km/h, 15.92 km/h and 12.11 km/h respectively. The maximum speed at each loading condition directly depends on the pulling capability of the motor. The discharge voltage and current trends are depicted in Figure 5 for the 390 kg load. The maximum discharged rate achieved was 540 W with a load of 390 kg moving at a speed of 12.11 km/h. This performance test is carried out on a straight flat track of 1.56 km distance for each loading case. From the graph, it could be understood that the battery discharge rate increases initially with respect to vehicle speed and tends to be unchanged up to a certain range of vehicle speed (15 km/h). Once the vehicle speeds up further, there was a sudden increase in discharge rate noted in all loading scenarios.

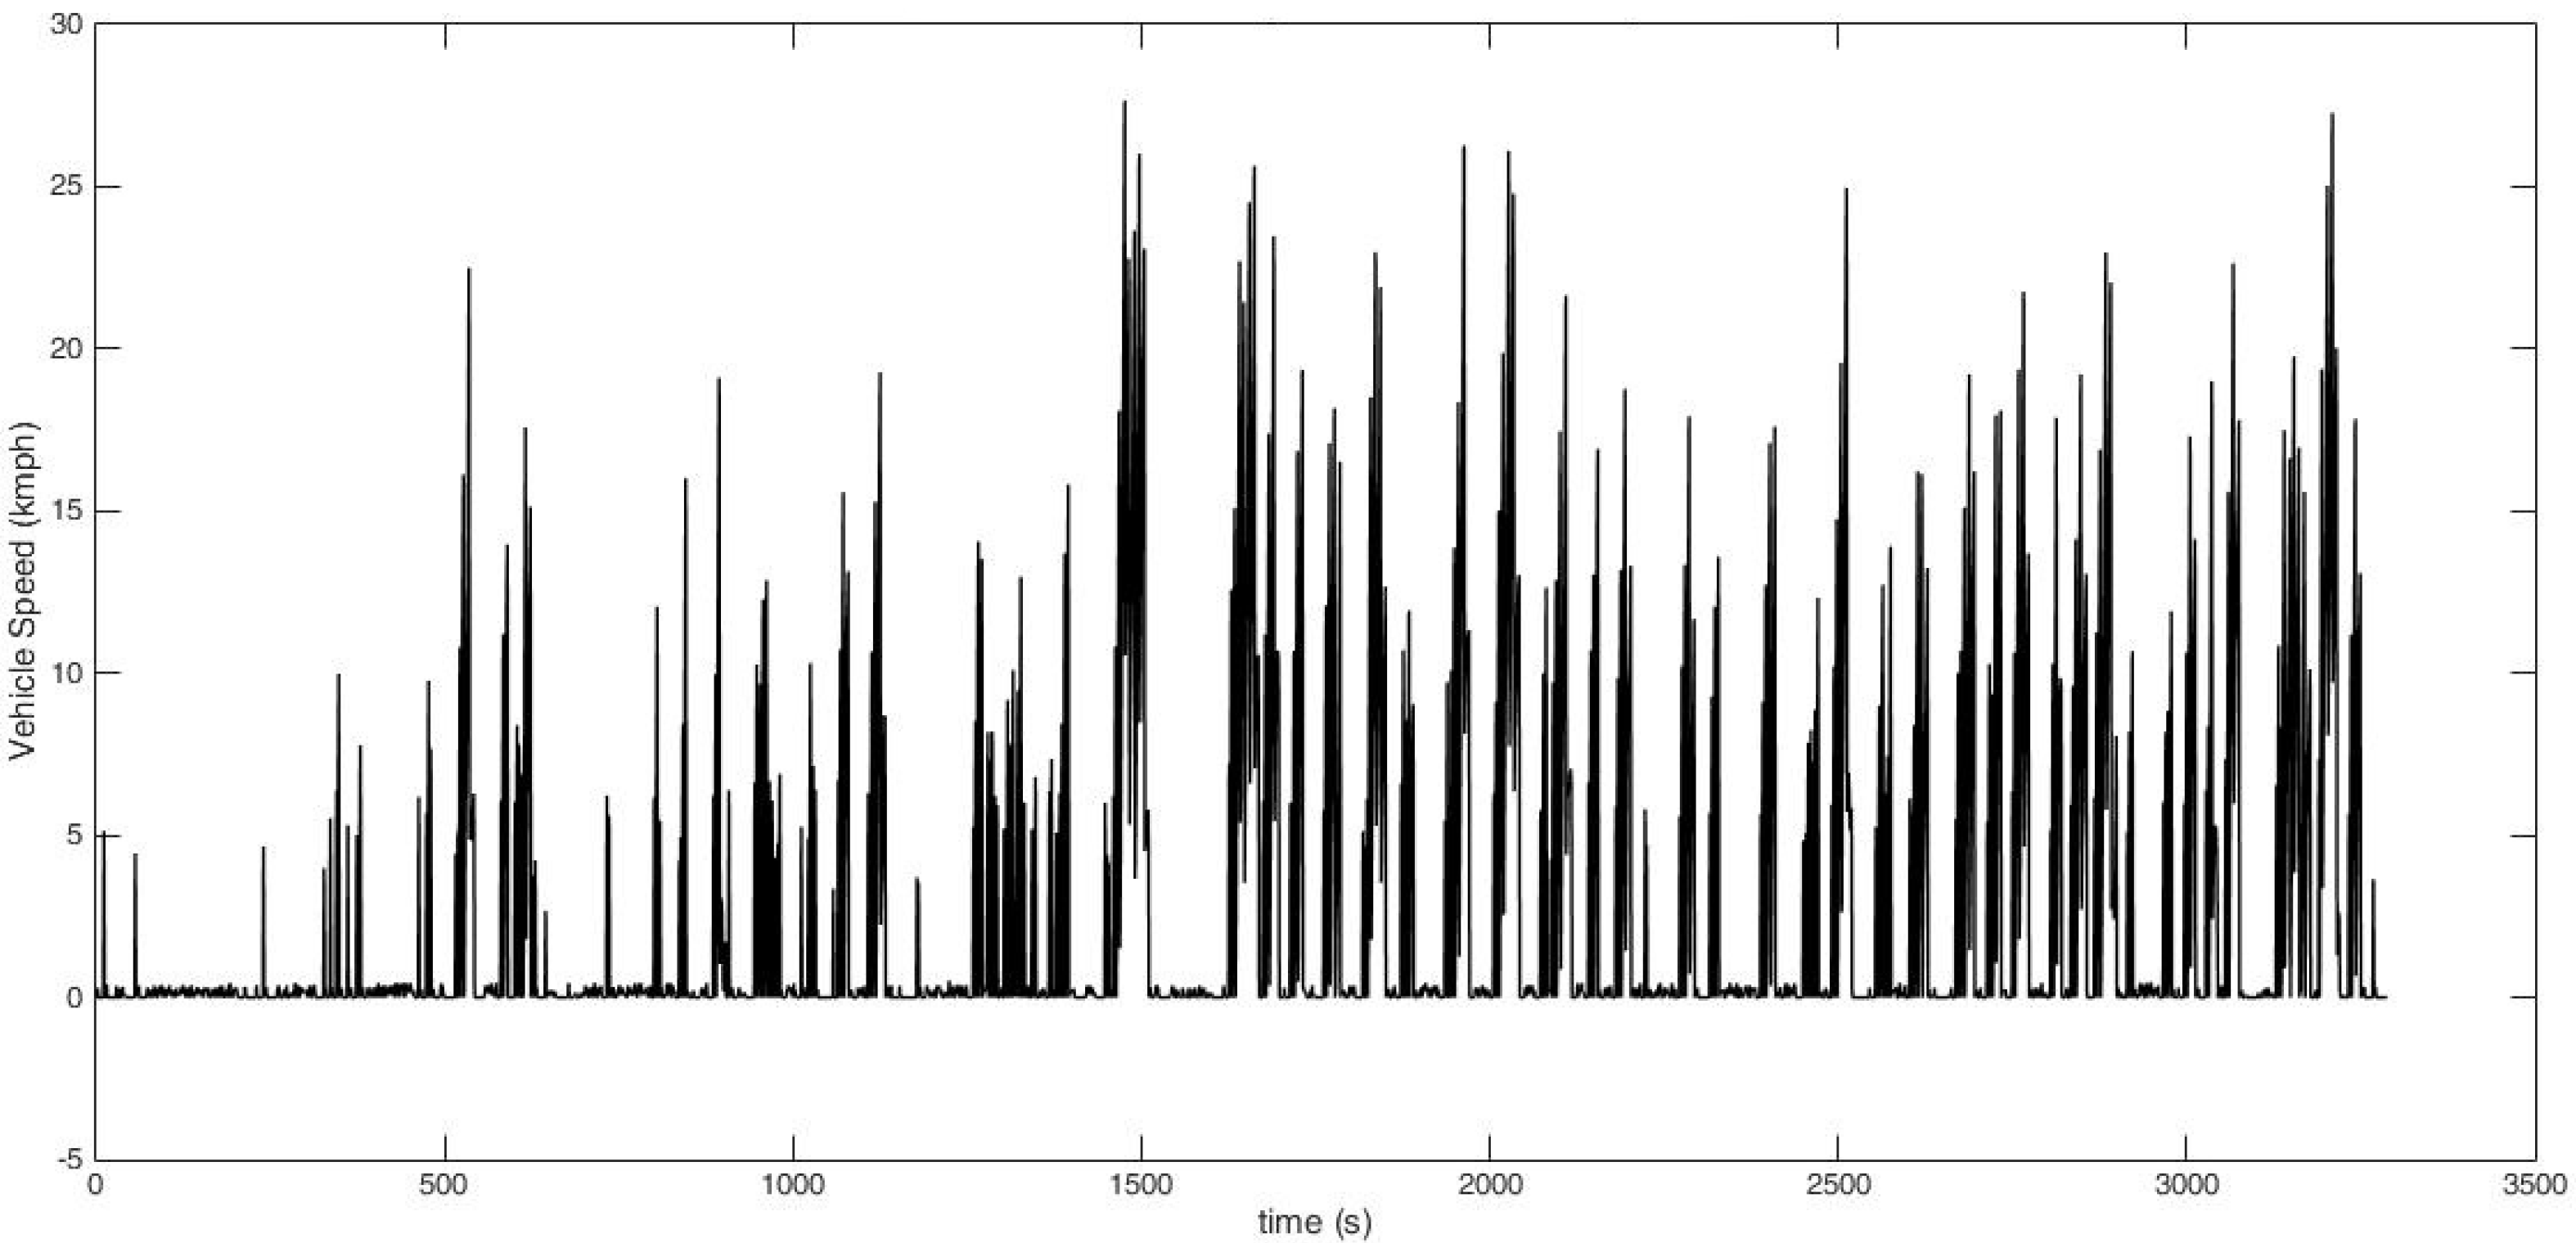
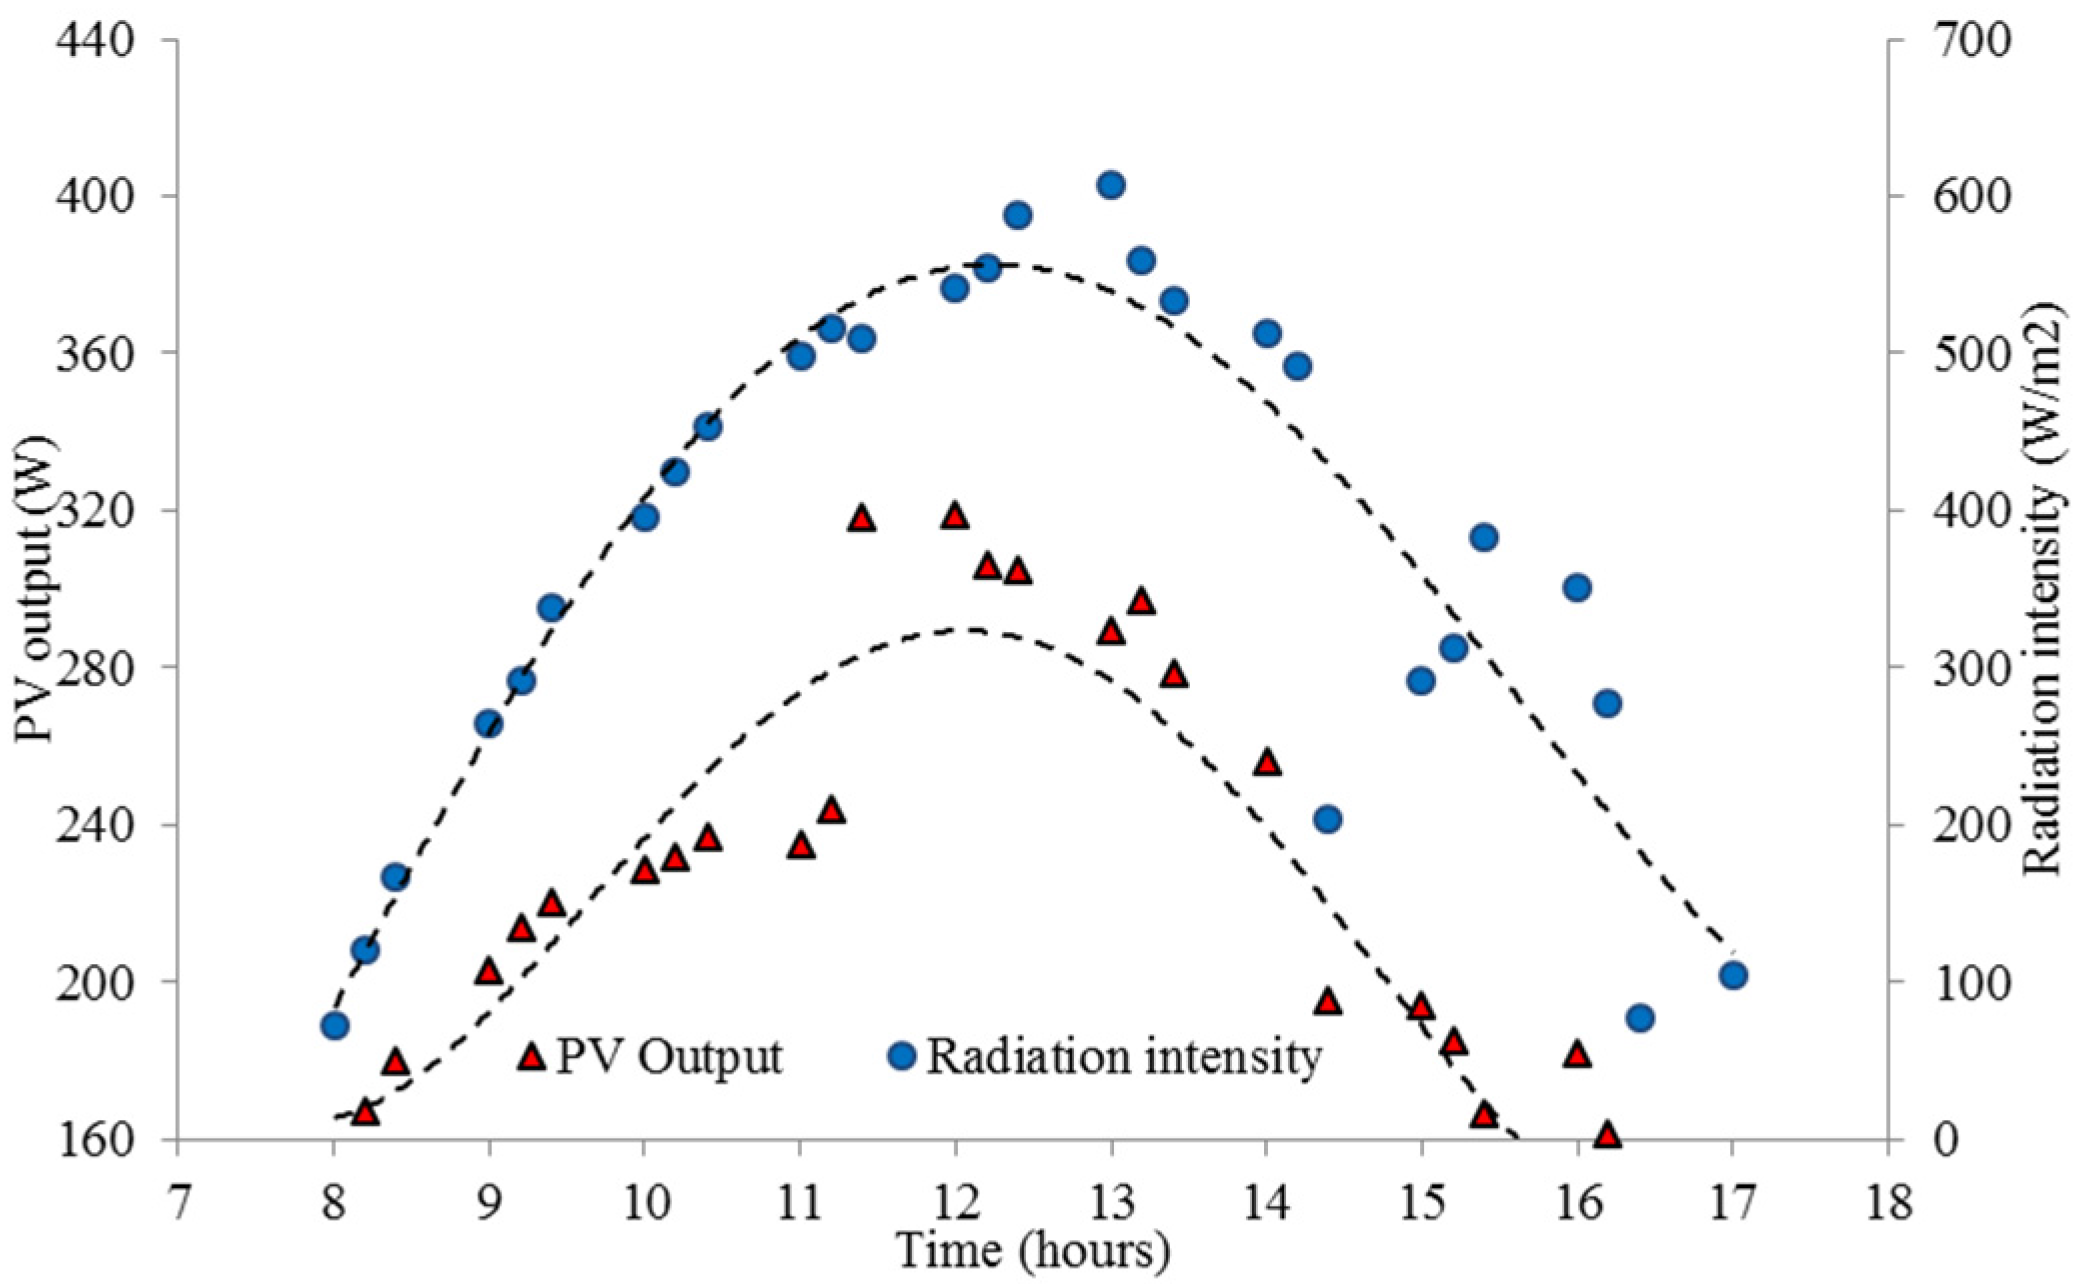
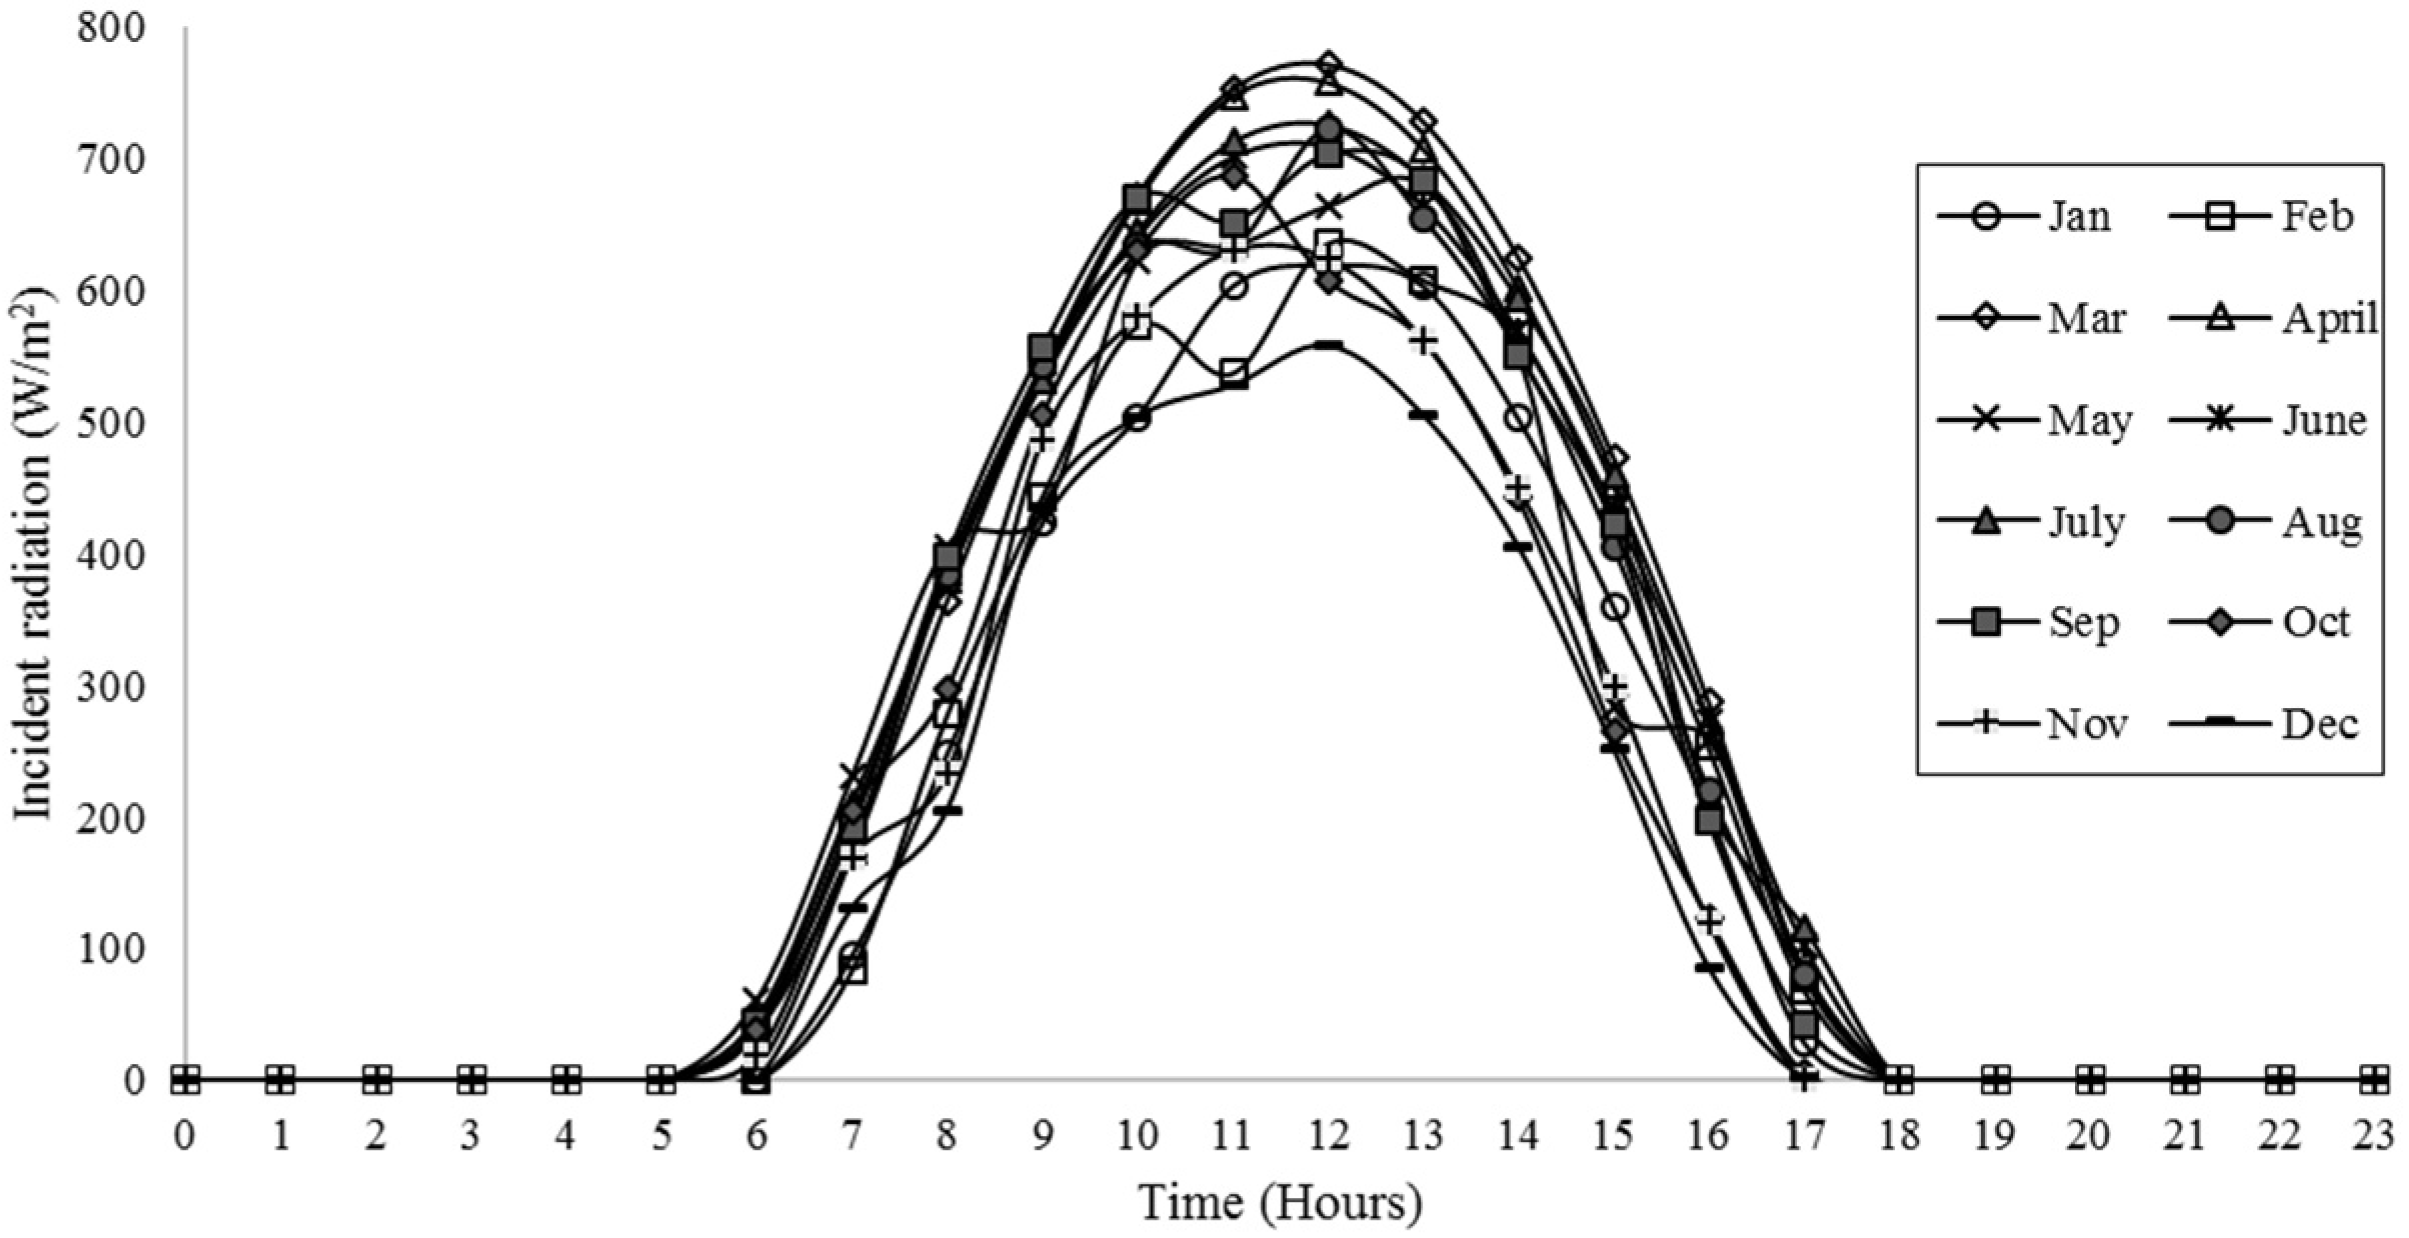
3.1. Hourly Solar Availability and Mobility Patterns

The mobility pattern of the vehicle is influenced by the insolation rate during sunshine hours. The yearly solar resource for this particular location was collected from the Indian Meteorological Department (IMD) solar radiation database and NREL’s National Solar Radiation Database (NSRDB) [33]. The month-wise solar radiation profile on the tilted surface is calculated and presented in Figure 6.
The typical mobility pattern was designed based on the standardized driving cycle. The driving cycle for low load vehicles followed in India is based on the European Urban Driving Cycle (EUDC). From Table 2, it is evident that the acceleration and deceleration limits and top speed are mismatched in the vehicle under study. Thus, a new driving cycle developed by Lukic et al. [14] for auto rickshaws was used for this study. The driving cycle was designed using the tool Advanced Vehicle Simulator (ADVISOR) [34]. The data such as maximum speed, acceleration and deceleration were the input parameters of this study. The driving cycle thus developed is shown in Figure 7.

3.2. Impact of the Monsoon Season on the Performance of the Vehicle

In a South Asian country like India, the influence of monsoon season on the performance of the vehicle is significant due to profuse cloud cover and ineffective solar radiation. The location (IIT Madras, Chennai, India) considered for the study, is particularly affected by the northeast monsoon during November and December. This issue was managed in the developed vehicle by providing a DC electric port along with AC-DC adapter for charging the batteries using grid supply. It was estimated that the average speed of the vehicle reduces by 3–13% during this time of the year [35] due to poor visibility issues. It was also concluded that the power required to cruise the vehicle would be 6% to 16% more during rains because of broken down roads and traffic amid rains. During this monsoon, 3 kWh/day of electricity from the grid was used for charging the vehicle. The environmental and economic impact of the monsoon on the vehicle is discussed in the forthcoming sections in detail.

4. Environmental and Economic Analysis of SPEA

Though the structural and performance analysis of SPEA gives an overall picture of the feasibility of SPEA for Indian conditions, it is essential to evaluate SPEA from a social, environmental and economic point of view. This section presents a detailed analysis of the vehicle from carbon mitigation, financial and socio-economic perspectives.

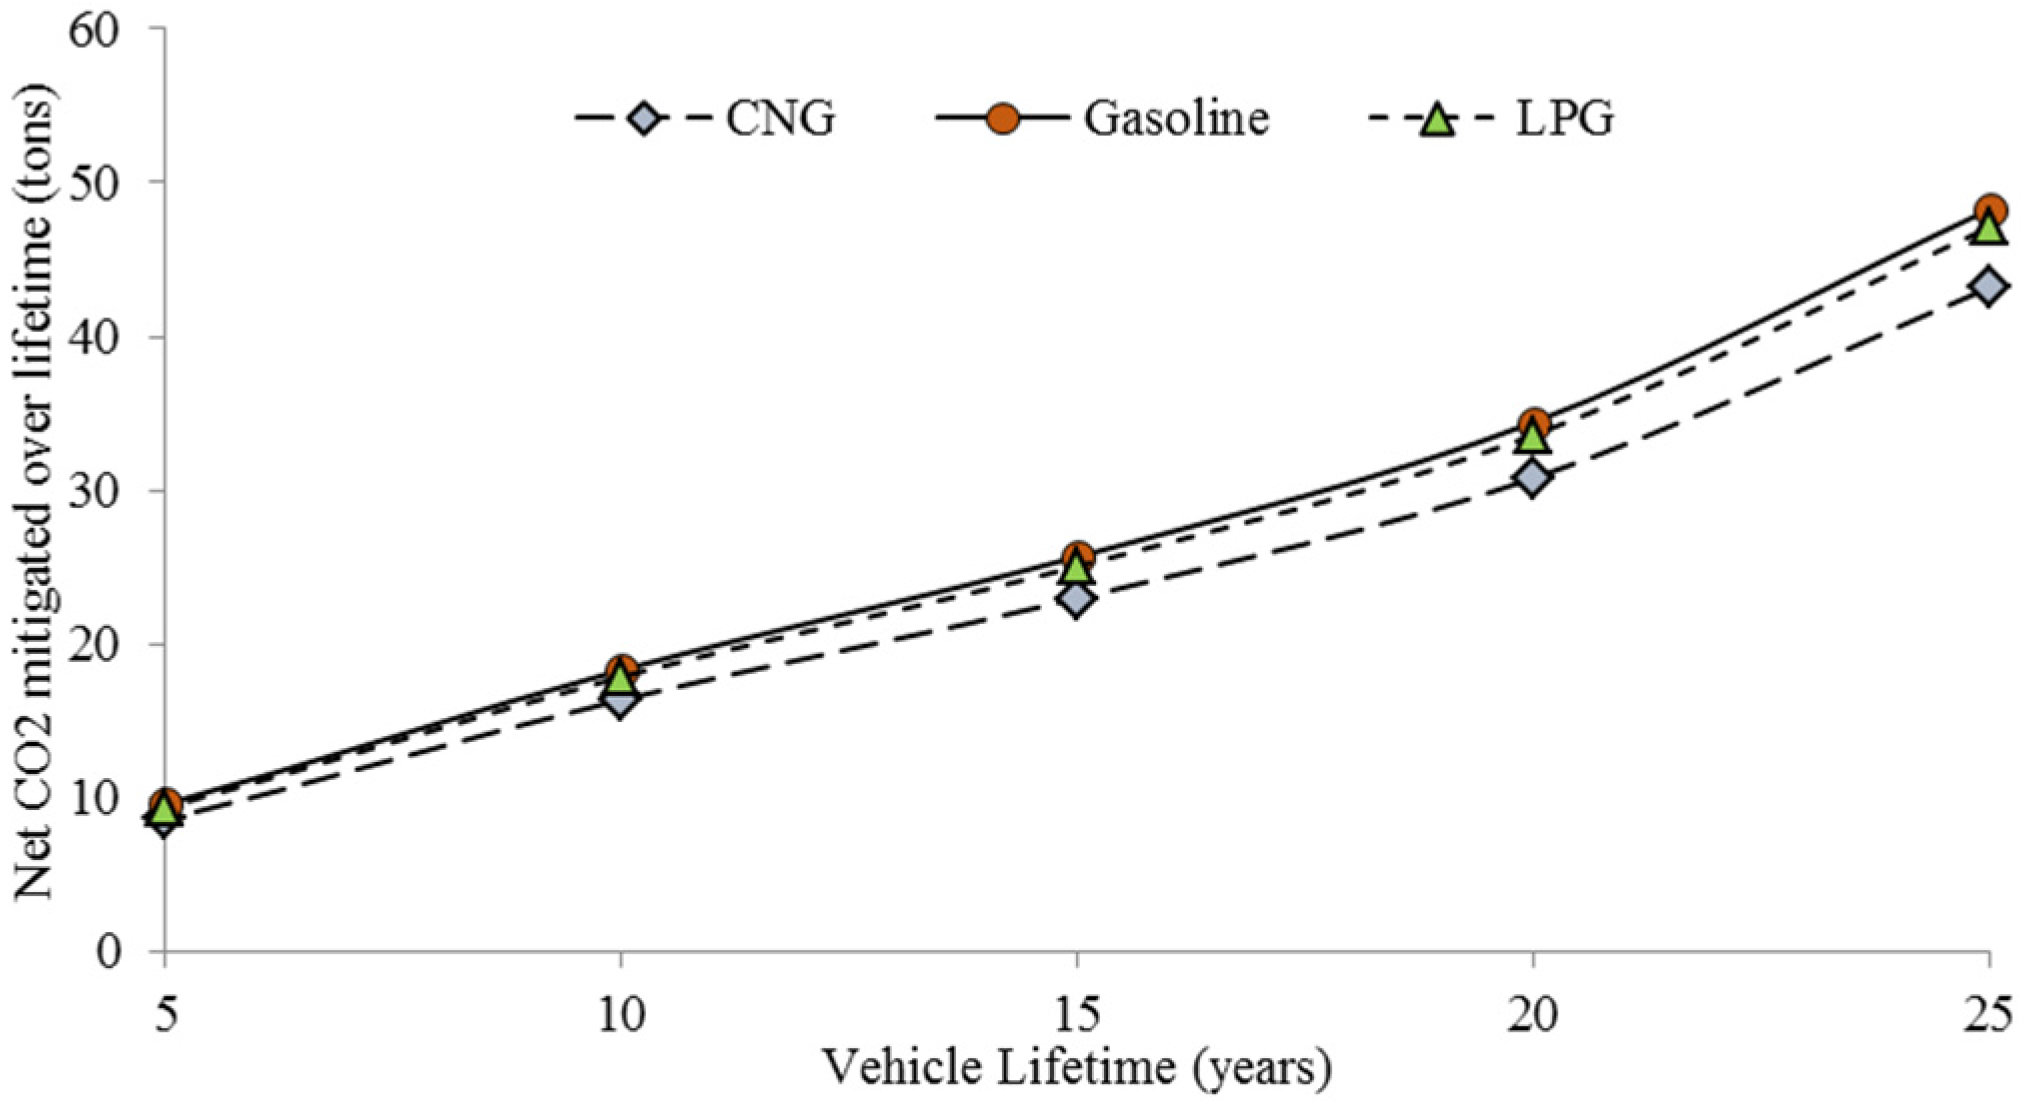
4.1. Mitigation of CO2 Emission

Vehicles fueled by petroleum-based fuels such as gasoline, Liquefied Petroleum Gas (LPG) and Compressed Natural Gas (CNG) contribute to CO2 emissions. The carbon emission that can be mitigated by using a solar powered electric vehicle instead of a petroleum-fueled vehicle over a period of 25 years (considered as the vehicle lifetime) is studied in this section. Any hydrocarbon on stoichiometric combustion will produce CO2 and H2O. The amount of CO2 discharged during stoichiometric combustion of gasoline (Equation (8)), LPG (Equation (9)) and CNG (Equation (10)) by balancing the chemical equations was found out to be 3.09 kg, 3 kg and 2.75 kg respectively for unit weight (kg) of fuel and in terms of per liter of fuel, 2.296 kg, 2.983 kg and 2.35 kg of CO2 was emitted respectively. Then, CO2 emission in kg/km of fuel was calculated by assuming the vehicle runs about 25 km per liter of fuel. If the vehicle’s mileage was about 15,000 km per year i.e., 50 km per day for 300 sunny days [5], then, 1776.6 kg of CO2 was emitted using CNG engine, 1986.6 of kg CO2 was emitted using gasoline engine, 1938.3 kg of CO2 was emitted using LPG engine for a duration of a year. Thus, the amount of CO2 mitigated for 25 years was calculated and the results are depicted in Figure 8.
2 C 8 H 18 +   25 O 2 16 C O 2 +   18 H 2 O   +   energy
C 3 H 8 +   5 O 2 3 C O 2 +   4 H 2 O   +   energy
C H 4 +   2 O 2 C O 2 +   2 H 2 O   +   energy
The amount of CO2 mitigated mentioned above assumes the vehicle is completely served by solar power throughout its lifetime, but in reality the vehicle is also charged using the grid during the rainy season.
The amount of CO2 produced using the grid is expressed as:
Net   C O 2   from   grid   =   0.85 ( Grid   power   ( in   kWh / day )   ×   No .   of   days   per   year )
The amount of CO2 mitigated per year was found to be 153 kg by considering 3 kWh/day of electricity from the grid consumed for 60 rainy days in a year (Average rainy days in Chennai [36]).

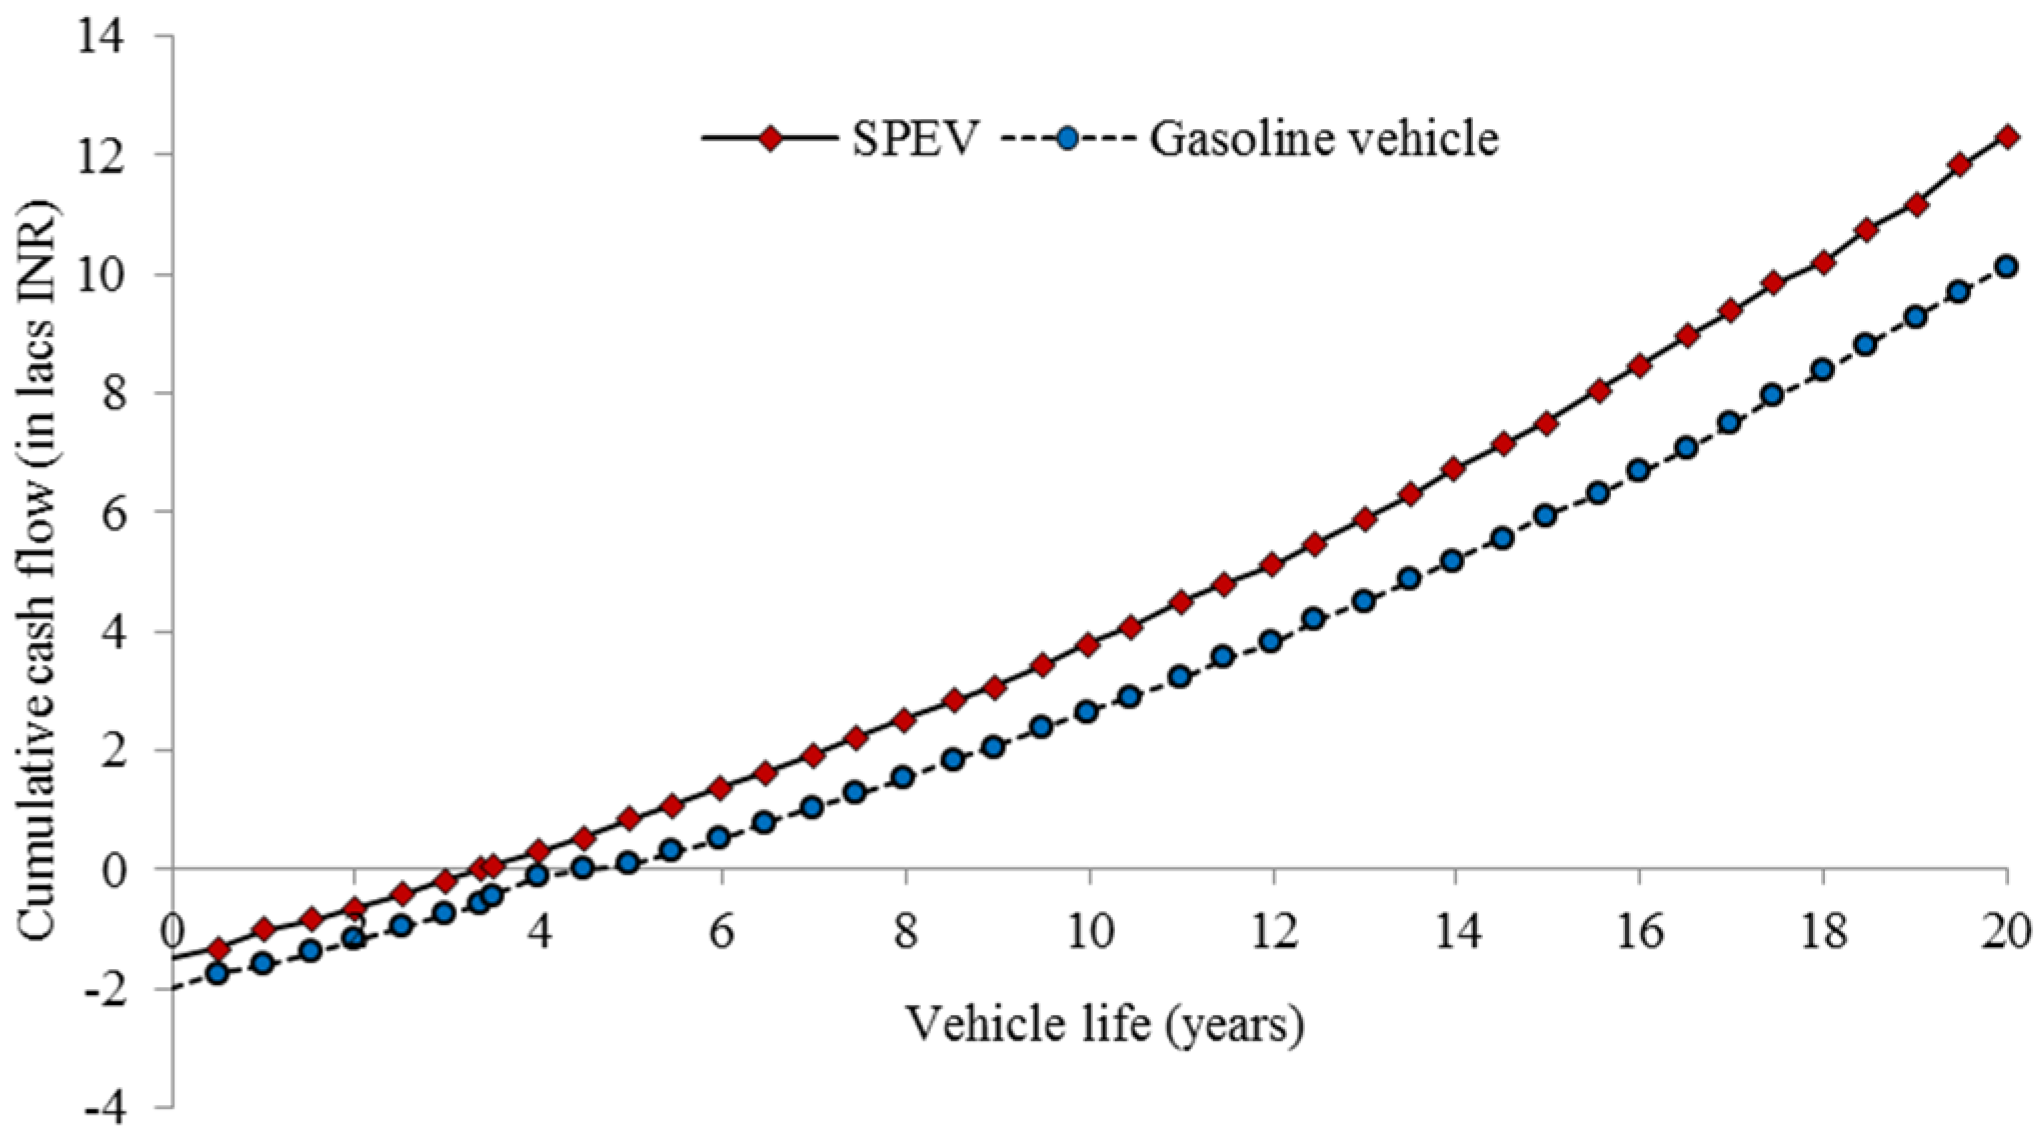
4.2. Financial Analysis of SPEA Using RETScreen

Financial analysis of SPEA was carried using RETScreen v4 [37], a software package developed by the Canadian government to analyze the financial viability of renewable energy systems and compare with available conventional systems. Cash flow analysis is used to predict the payback period of the system. The rate of interest for payback ( I r ) was calculated using:
I r   =   1   +   discount   rate 1   +   inflation   rate 1
The payback interest rate was found out to be 4%. The important parameters associated with this analysis are presented in Table 3. The vehicle life represents the duration of vehicle usage when it can be utilized in an efficient and economical way. The life of vehicle considered for analysis was 25 years.
The inflation rate is defined as the rate at which the price of the vehicle is expected to reach based on the country’s economy. It was assumed as 3.65%. Capital cost refers to the cost of the vehicle and other costs which are accountable during delivery of the vehicle. These also include registration charges and other taxes which were incurred for a passenger vehicle. Annual operation and maintenance cost were the costs that are incurred for the operation, maintenance, preservation, and protection of the vehicle on an annual basis. Lastly, the payback period was the time required for a person or a company to recover its complete investment in buying the vehicle.
Based on the input parameters, the payback period was found out to be 4.5 years for gasoline run vehicles and 3.4 years for SPEA and the resulting trends are plotted in Figure 9. The graph starts from the negative side of cash flow stating that an investment of particular capital is spent towards the vehicle purchase. As the years progress, the payback adds up and progresses towards the positive side of cumulative cash flow. Thus SPEA is benefiting the investor as its payback duration is 24.44% less than the gasoline run vehicle.

4.3. Socio-Economic Analysis of SPEA

Socio-economic analysis of gasoline driven, battery driven and solar powered electric vehicles was performed in order to differentiate and showcase their respective impacts on society.
(1) Comparative feature study
The vehicles taken for study differ by their basic operational features. Table 4 explains the features of vehicles in detail. The important parameters such as energy source, prime mover and the other accessories involved in the vehicles were studied and compared.
(2) Comparative study on social aspects
The social considerations involved in the vehicles are very important as they reflect the impact of the vehicle on the environment. Some of the social considerations of prime importance are safety aspects involved in the vehicle, fuel usage, vehicle mileage and harmful discharge of emissions to the environment. These considerations are compared in Table 5 for the vehicles taken for study.
(3) Economic study
The economic study of vehicles considered for the study is tabulated in Table 6. The preliminary economic study on these vehicles was carried out with some assumptions which are pointed out below.
  • The distance covered by the vehicle per day was assumed to be 50 km (10 trips of 5 km).
  • The auto fare has been calculated as per Tamilnadu passenger auto rickshaw fare norms [39] i.e., INR 25 for first 2 km and INR 15 for the rest of distance covered per trip.
  • The charges such as lifetime tax, vehicle registration charges, driver fitness certificate charges etc. were included in the overall vehicle cost.
  • Petroleum fuel cost was assumed based on the price details mentioned by Indian oil corporation limited [40] and battery charging cost was assumed to be INR 10 per kWh.
  • This study was assumed for the Chennai urban conditions. So the gasoline run vehicle’s mileage was assumed to be 20 km/L.
The operational and maintenance (I&M) cost is a variable parameter which increases with vehicle mileage and depends on driving patterns. The I&M cost for EV and SPEA was assumed as INR 15,000 and INR 26,000. The I&M cost, which accounts up to 4.5% of its annual income, includes the cost of routine maintenance on the vehicle, wear and tear of machinery, and component replacement costs. Both in EV and SPEA, the component which has to be replaced periodically is the battery. The battery’s life is determined by its number of charge cycles. Since both these vehicles use batteries as the power source, it was assumed to be replaced every 4 years. The maintenance cost of SPEA was higher as the solar PV panels incorporated were subjected to timely maintenance. The fuel cost for EV and SPEA was assumed as INR 20,000 and INR 6000. The fuel cost for EV was more than SPEA as it utilizes grid power for charging batteries whereas SPEA was charged mostly using solar energy. The SPEA was found to be an economically viable solution with 15.74% and 0.85% profitable than gasoline operated and electric vehicle respectively.
As far as the economics of this vehicle are concerned, the calculations based on Chennai are presented. This calculation can be generalized and applied all over India as the auto rickshaw tariff and the prices of gasoline don’t change drastically from place to place, as shown in Table 7.

5. Conclusions

The solar powered electric vehicle (SPEA) was designed, optimized and tested effectively for Indian conditions in this research article. The performance analysis of the vehicle demonstrated the charging and discharging characteristics of the battery at varied load conditions. The solar PV output followed the same trend as radiation intensity over a day and experienced a maximum charging rate of 250 W. A day-long charging of batteries on a typical sunny day yielded 2 units (2 kWh) of power. The battery discharging characteristics were studied at variable loading (number of passengers) conditions. The maximum discharge of 540 W was recorded at 390 kg load when the vehicle was moving at a speed of 12.11 km/h. The maximum vehicle speed of 21.7 km/h was achieved at a discharge of 296 W when it was loaded with 90 kg. The environmental analysis of SPEA assessed the yearly CO2 emissions that could be mitigated using SPEA. The results displayed CO2 emissions of 1777 kg, 1987 kg and 1938 kg from using CNG, LPG and gasoline engines respectively, which can certainly be mitigated by using SPEA instead of conventional vehicles for the period of 25 years. The financial analysis of SPEA identified a payback duration 24.44% less compared to a gasoline-run vehicle. Socio-economic analysis of SPEA discussed its significant benefits and showed 15.74% and 0.85% rise in yearly income over gasoline driven and battery-driven electric vehicles. With these outcomes of the analyses discussed, the developed SPEA could be a suitable alternative for local and low-speed transit. SPEA not only mitigates carbon emissions but also progresses the livelihood of mankind in terms of economy and sustainability.

Acknowledgments

The financial support provided by the Department of Science and Technology (DST), Government of India through the research project No. DST/SEED/INDO-UK/002/2011 is duly acknowledged.

Author Contributions

K.S. Reddy and S. Aravindhan designed the experiments; S. Aravindhan performed the experiments whereas K.S. Reddy analyzed the data and designed the outline of this paper; with the guidance of K.S. Reddy and Tapas K. Mallick, the paper has been incepted by S. Aravindhan.

Conflicts of Interest

The authors declare no conflict of interest.

References

  1. International Energy Outlook 2016—Transportation Sector Energy Consumption—Energy Information Administration. Available online: https://www.eia.gov/outlooks/ieo/transportation.cfm (accessed on 25 April 2017).
  2. International Energy Statistics. Available online: https://www.eia.gov/cfapps/ipdbproject/IEDIndex3.cfm?tid=5&pid=5&aid=2 (accessed on 22 April 2017).
  3. U.S. Department of Commerce, N.E.S.R.L. ESRL Global Monitoring Division—Global Greenhouse Gas Reference Network. Available online: https://www.esrl.noaa.gov/gmd/ccgg/insitu/ (accessed on 26 May 2017).
  4. CO2 Emissions from Transport (% of Total Fuel Combustion)|Data. Available online: http://data.worldbank.org/indicator/EN.CO2.TRAN.ZS (accessed on 22 April 2017).
  5. Ministry of New and Renewable Energy—Solar RPO. Available online: http://mnre.gov.in/information/solar-rpo/ (accessed on 22 April 2017).
  6. Mulhall, P.; Naviwala, M.; Lukic, S.M.; Braband, J.; Emadi, A. Entrepreneurial Projects Program at Illinois Institute of Technology: Solar/Battery Hybrid Three-Wheel Auto Rickshaw for India. In Proceedings of the 2007 IEEE Vehicle Power and Propulsion Conference (VPPC), Arlington, TX, USA, 9–12 September 2007; pp. 682–689. [Google Scholar]
  7. Total Number of Registered Motor Vehicles in India|Open Government Data (OGD) Platform India. Available online: https://data.gov.in/catalog/total-number-registered-motor-vehicles-india (accessed on 22 April 2017).
  8. Brouwer, A.S.; Kuramochi, T.; Van Den Broek, M.; Faaij, A. Fulfilling the electricity demand of electric vehicles in the long term future: An evaluation of centralized and decentralized power supply systems. Appl. Energy 2013, 107, 33–51. [Google Scholar] [CrossRef]
  9. Hannan, M.A.; Azidin, F.A.; Mohamed, A. Multi-sources model and control algorithm of an energy management system for light electric vehicles. Energy Convers. Manag. 2012, 62, 123–130. [Google Scholar] [CrossRef]
  10. Fiori, C.; Ahn, K.; Rakha, H.A. Power-based electric vehicle energy consumption model: Model development and validation. Appl. Energy 2016, 168, 257–268. [Google Scholar] [CrossRef]
  11. Juul, N.; Meibom, P. Road transport and power system scenarios for Northern Europe in 2030. Appl. Energy 2012, 92, 573–582. [Google Scholar] [CrossRef]
  12. Baptista, P.; Duarte, G.; Goncalves, G.; Farias, T. Evaluation of low power electric vehicles in demanding urban conditions: An application to Lisbon. In Proceedings of the 2013 World Electric Vehicle Symposium and Exhibition (EVS27), Barcelona, Spain, 17–20 November 2013; pp. 1–10. [Google Scholar]
  13. Lukic, S.; Mulhall, P.; Emadi, A. Energy Autonomous Solar/battery Auto Rickshaw. J. Asian Electr. Veh. 2008, 6, 1135–1143. [Google Scholar] [CrossRef]
  14. Nunes, P.; Farias, T.; Brito, M.C. Day charging electric vehicles with excess solar electricity for a sustainable energy system. Energy 2015, 80, 263–274. [Google Scholar] [CrossRef]
  15. Capasso, C.; Veneri, O. Experimental study of a DC charging station for full electric and plug in hybrid vehicles. Appl. Energy 2015, 152, 131–142. [Google Scholar] [CrossRef]
  16. Solar Roof for Toyota Prius Plug-in—Autoblog. Available online: http://www.autoblog.com/2017/02/28/panasonic-toyota-prius-roof-solar-panel/ (accessed on 24 April 2017).
  17. Ford C-MAX Solar Energi Concept. Available online: https://media.ford.com/content/fordmedia/fna/us/en/news/2014/01/02/let-the-sun-in--ford-c-max-solar-energi-concept-goes-off-the-gri.html (accessed on 24 April 2017).
  18. Lukic, S.M.; Mulhall, P.; Choi, G.; Naviwala, M.; Nimmagadda, S.; Emadi, A. Usage Pattern Development for Three-Wheel Auto Rickshaw Taxis in India. In Proceedings of the 2007 IEEE Vehicle Power and Propulsion Conference, Arlington, TX, USA, 9–12 September 2007; pp. 610–616. [Google Scholar]
  19. Giannouli, M.; Yianoulis, P. Study on the incorporation of photovoltaic systems as an auxiliary power source for hybrid and electric vehicles. Sol. Energy 2012, 86, 441–451. [Google Scholar] [CrossRef]
  20. Mulhall, P.; Emadi, A. Comprehensive simulations and comparative analysis of the electric propulsion motor for a solar/battery electric auto rickshaw three-wheeler. In Proceedings of the 2009 35th Annual Conference of IEEE Industrial Electronics, Porto, Portugal, 3–5 November 2009; pp. 3785–3790. [Google Scholar]
  21. Lujano-rojas, J.M.; Dufo-lópez, R.; Atencio-guerra, J.L.; Rodrigues, E.M.G.; Bernal-agustín, J.L.; Catalão, J.P.S. Operating conditions of lead-acid batteries in the optimization of hybrid energy systems and microgrids. Appl. Energy 2016, 179, 590–600. [Google Scholar] [CrossRef]
  22. Sasaki, K.; Yokota, M.; Nagayoshi, H.; Kamisako, K. Evaluation of electric motor and gasoline engine hybrid car using solar cells. Sol. Energy Mater. Sol. Cells 1997, 47, 259–263. [Google Scholar] [CrossRef]
  23. Prabhu, V.N.; Manigandan, N. Design and Fabrication of Solar Transport Vehicle. OSR J. Mech. Civ. Eng. 2014, 11, 14–19. [Google Scholar]
  24. Mani, A.; Kreutzmann, P. Design and performance analysis of a hybrid solar tricycle for a sustainable local commute. Renew. Sustain. Energy Rev. 2015, 41, 473–482. [Google Scholar]
  25. Hannan, M.A.; Azidin, F.A.; Mohamed, A. Hybrid electric vehicles and their challenges: A review. Renew. Sustain. Energy Rev. 2014, 29, 135–150. [Google Scholar] [CrossRef]
  26. Center of Gravity Height Calculation|Technical Article. Available online: http://www.longacreracing.com/technical-articles.aspx?item=42586 (accessed on 22 April 2017).
  27. Tubular Inverter Battery Specification|Exide Industries Limited. Available online: http://www.exideindustries.com/products/inverter-batteries/tubular-inverter-batteries.aspx (accessed on 22 April 2017).
  28. Properties of Bosch Solar Module c-Si M 60. Available online: http://www.bosch-solarenergy.com/media/bosch_se_serviceorganisation/product/datenblaetter_2/kristtalin/eu_2/m_60_s_eu56117_1/Bosch_Solar_Module_c_Si_M_60_S_EU56117_en_europe.pdf (accessed on 22 April 2017).
  29. Data Sheet of MPPT Charge Controller CX48 V Series. Available online: http://www.phocos.com/products/charge-controllers/mppt-charge-controllers/ (accessed on 22 April 2017).
  30. Motor Specification of E Rickshaw. Available online: http://www.gemev.com/products/prince-e-rickshaw/ (accessed on 22 April 2017).
  31. MASTECH Digital Multi-Meter|Product Specification. Available online: http://www.p-mastech.com/product/detail/461 (accessed on 22 April 2017).
  32. PMA Second Class Pyranometer|Data Sheet. Available online: http://solarlight.com/product/pma-2144-class-ii-pyranometer/ (accessed on 22 April 2017).
  33. IMD and NSRDB|Radiation Data. Available online: http://www.imdaws.com/viewradiationdata.aspx (accessed on 22 April 2017).
  34. Markel, T.; Brooker, A.; Hendricks, T.; Johnson, V.; Kelly, K.; Kramer, B.; O’Keefe, M.; Sprik, S.; Wipke, K. ADVISOR: A system analysis tool for advanced vehicle modeling. J. Power Sources 2002, 110, 255–266. [Google Scholar] [CrossRef]
  35. How do Weather Events Impact Roads?—FHWA Road Weather Management. Available online: https://ops.fhwa.dot.gov/weather/q1_roadimpact.htm (accessed on 22 April 2017).
  36. Rainfall Data for India. Available online: http://www.rainwaterharvesting.org/rainfall_index.htm# (accessed on 27 April 2017).
  37. RETScreen|Natural Resources Canada. Available online: http://www.nrcan.gc.ca/energy/software-tools/7465 (accessed on 22 April 2017).
  38. Bajaj RE Compact|Technical Specification. Available online: http://www.bajajauto.com/bajajre/re-compact-tech-specs.html# (accessed on 22 April 2017).
  39. Auto Fare Calculator|India. Available online: http://www.taxiautofare.com/Default.aspx (accessed on 24 April 2017).
  40. Petrol and LPG Prices|Indian Oil Corporation Limited. Available online: https://www.iocl.com/TotalProductList.aspx (accessed on 22 April 2017).
Figure 1. Country wise carbon emissions (metric kilotons) in transportation sector.
Energies 10 00754 g001
Figure 2. (a) Line diagram of solar powered electric auto-rickshaw (SPEA) operation; (b) SPEA model developed in Solid Works; and (c) Fabricated SPEA at IIT Madras.
Energies 10 00754 g002aEnergies 10 00754 g002b
Figure 3. Variation of measured solar irradiance and photovoltaic (PV) panel output over a day.
Energies 10 00754 g003
Figure 4. Impact of discharge rate on vehicle speed.
Energies 10 00754 g004
Figure 5. Discharge voltage and current trends at 390 kg load.
Energies 10 00754 g005
Figure 6. Incident radiation profile for location considered (IIT Madras).
Energies 10 00754 g006
Figure 7. Vehicle speed variation with respect to time.
Energies 10 00754 g007
Figure 8. Mitigation of carbon-dioxide emission over SPEA lifetime.
Energies 10 00754 g008
Figure 9. Cumulative cash flow analysis over SPEA lifetime.
Energies 10 00754 g009
Table 1. Hardware specification of the SPEA designed.
S. No.ParticularsSpecifications
1Solar Panels [28] Bosch Solar Module c-Si M 60
Rated Output245 W each
Dimensions1660 × 990 × 50 mm
No. of cells per panel60× mono-crystalline solar cells
Efficiency17.6–18%
2MPPT Controller [29]Phocos CX48
System voltage24/48 V auto recognition
Max charge/load current40 A
Efficiency96–98%
3Battery bank [27]Exide Invaplus Tubular battery
Rated Output100 Ah, 12 V (4 no. in series)
Depth of discharge80% (First 1500 cycles)
Overall efficiency60%
4Motor [30] Brushless DC motor
Rated Output1000 W
Motor controller output1000 W
5Dimensions of SPEA (L × B × H)2600 × 950 × 1200 mm
6Wheelbase and wheel size800 mm & 3–12
7Load capacity & no. of passengers330 kg & 6 + 1 passengers
8Clearance and frontal area180 mm & 1.3 m2
Table 2. Comparison of standard driving cycle and driving cycle considered for this study.
ParameterStandard Indian Driving CycleCycle Considered for This Study
Time (s)12443300
Distance (km)10.612.8
Max Speed (km/h)9029.6
Ave Speed (km/h)31.111.12
Max Accel (m/s2)0.61.31
Max Decel (m/s2)−1.4−0.4
Ave Accel (m/s2)0.60.33
Ave Decel (m/s2)−0.8−0.4
Idle Time (s)38883
No of Stops1379
Table 3. Assumptions in cash flow analysis of SPEA and gasoline vehicle.
S. No.ParametersSPEAGasoline Vehicle
1Vehicle life25 years25 years
2Inflation rate3.65%3.65%
3Discount rate7.75%7.75%
4Capital costsINR 130,000
(USD * 1950)
INR 175,000
(USD 2625)
5Annual O&M costs INR 5000
(USD 75)
INR 10,000
(USD 150)
* 1 INR = 0.015 USD as on March 2017.
Table 4. Comparison of Vehicle features.
S. No.ParametersGasoline Driven Vehicle
(GDV) [38]
Electric Vehicle
(EV) [30]
SPEA
1Energy sourceGasoline/LPG Grid/BatteriesSolar panels
2Energy storageFuel tankBatteriesBatteries
3Extraction of energy (energy source)Crude oil (Non-renewable)Wide variety of sources (Both renewable and non-renewable)Solar energy
4Prime moverInternal Combustion Engine (ICE)AC/DC motorBrushless DC motor (BLDC)
5Speed controlVariable speed gearbox (Manual/Automatic)Motor controllerMotor controller
6Prime mover power6.6 kW at 5000 rpm 1 kW1 kW
7Braking systemSingle control, foot operated hydraulic brakesMechanical Drum brakesMechanical Drum brakes
8Front and Rear SuspensionHelical coil spring and hydraulic double acting shock absorberFront: Helical coil spring and hydraulic shock absorberFront: Helical coil spring and hydraulic shock absorber
Rear: Leaf Spring (double-eye with U-Bolts)Rear: Leaf Spring (double-eye with U-Bolts)
Table 5. Comparison of social consideration involved in vehicles.
S. No.ParametersGDVEVSPEA
1EmissionsNOx, CO, HC and CO2No tail pipe emissionsNo tail pipe emissions
2Maximum speed range50 to 60 km/h [28]25–30 km/h [22]25–30 km/h
3Mileage18 to 20 km/L (City)Battery capacity: 70–80 km80 km per complete charging
25 km/L (Highway)
Table 6. Economic analysis the vehicles involved in the study.
S. No.ParametersGDVEVSPEA
1Vehicle overall costINR 150,000
(USD * 2315)
(approx.)
(incl. of vehicle cost, cost of registration etc.)
INR 110,000
(USD 1650)
(approx.)
(incl. of vehicle cost, battery bank cost, etc.,)
INR 165,000
(USD 1950)
(approx.)
(vehicle cost = INR 110,000; battery bank cost = INR 20,000; solar panel cost = INR 26,000; Panel mounting frame = INR 9000)
2Yearly revenue (based on assumptions)INR 390,000INR 390,000INR 390,000
(USD 5850)(USD 5850)(USD 5850)
3Inspection and maintenance (I &M)INR 20,000INR 15,000INR 26,000
(USD 300)(USD 225)(USD 390)
4Fuel cost/charging costINR 60,000INR 20,000INR 6,000
(USD 900)(USD 300)(USD 90)
5Taxes and other documentation charges (Depreciation, Insurance)INR 5000INR 5000INR 5000
(USD 75)(USD 75)(USD 75)
6Yearly expenditureINR 85,000INR 40,000INR 37,000
(USD 1275)(USD 600)(USD 555)
7Yearly incomeINR 305,000INR 350,000INR 353,000
(USD 4575)(USD 5250)(USD 5610)
* 1 INR = 0.015 USD as on March 2017.
Table 7. Auto fare and gasoline rate at key urban regions of India.
CityAuto tariff * [39]Gasoline Rate *
(Rs./L)
Minimum FareFare above min. Fare (Rs./km)
ChennaiRs. 25-first 2 km15.0071.16
MumbaiRs. 15-first 1 km10.0074.42
New DelhiRs. 25-first 2 km8.0068.07
KolkataRs. 25-first 2 km12.0070.66
PuneRs. 18-first 1.5 km12.3171.30
AhmedabadRs. 11-first 1.5 km7.5070.05
BengaluruRs. 25-first 2 km13.0073.00
* As on April 2017.

