
An Integrated Approach for Estimating the Energy Efficiency of Seventeen Countries


Abstract
:1. Introduction
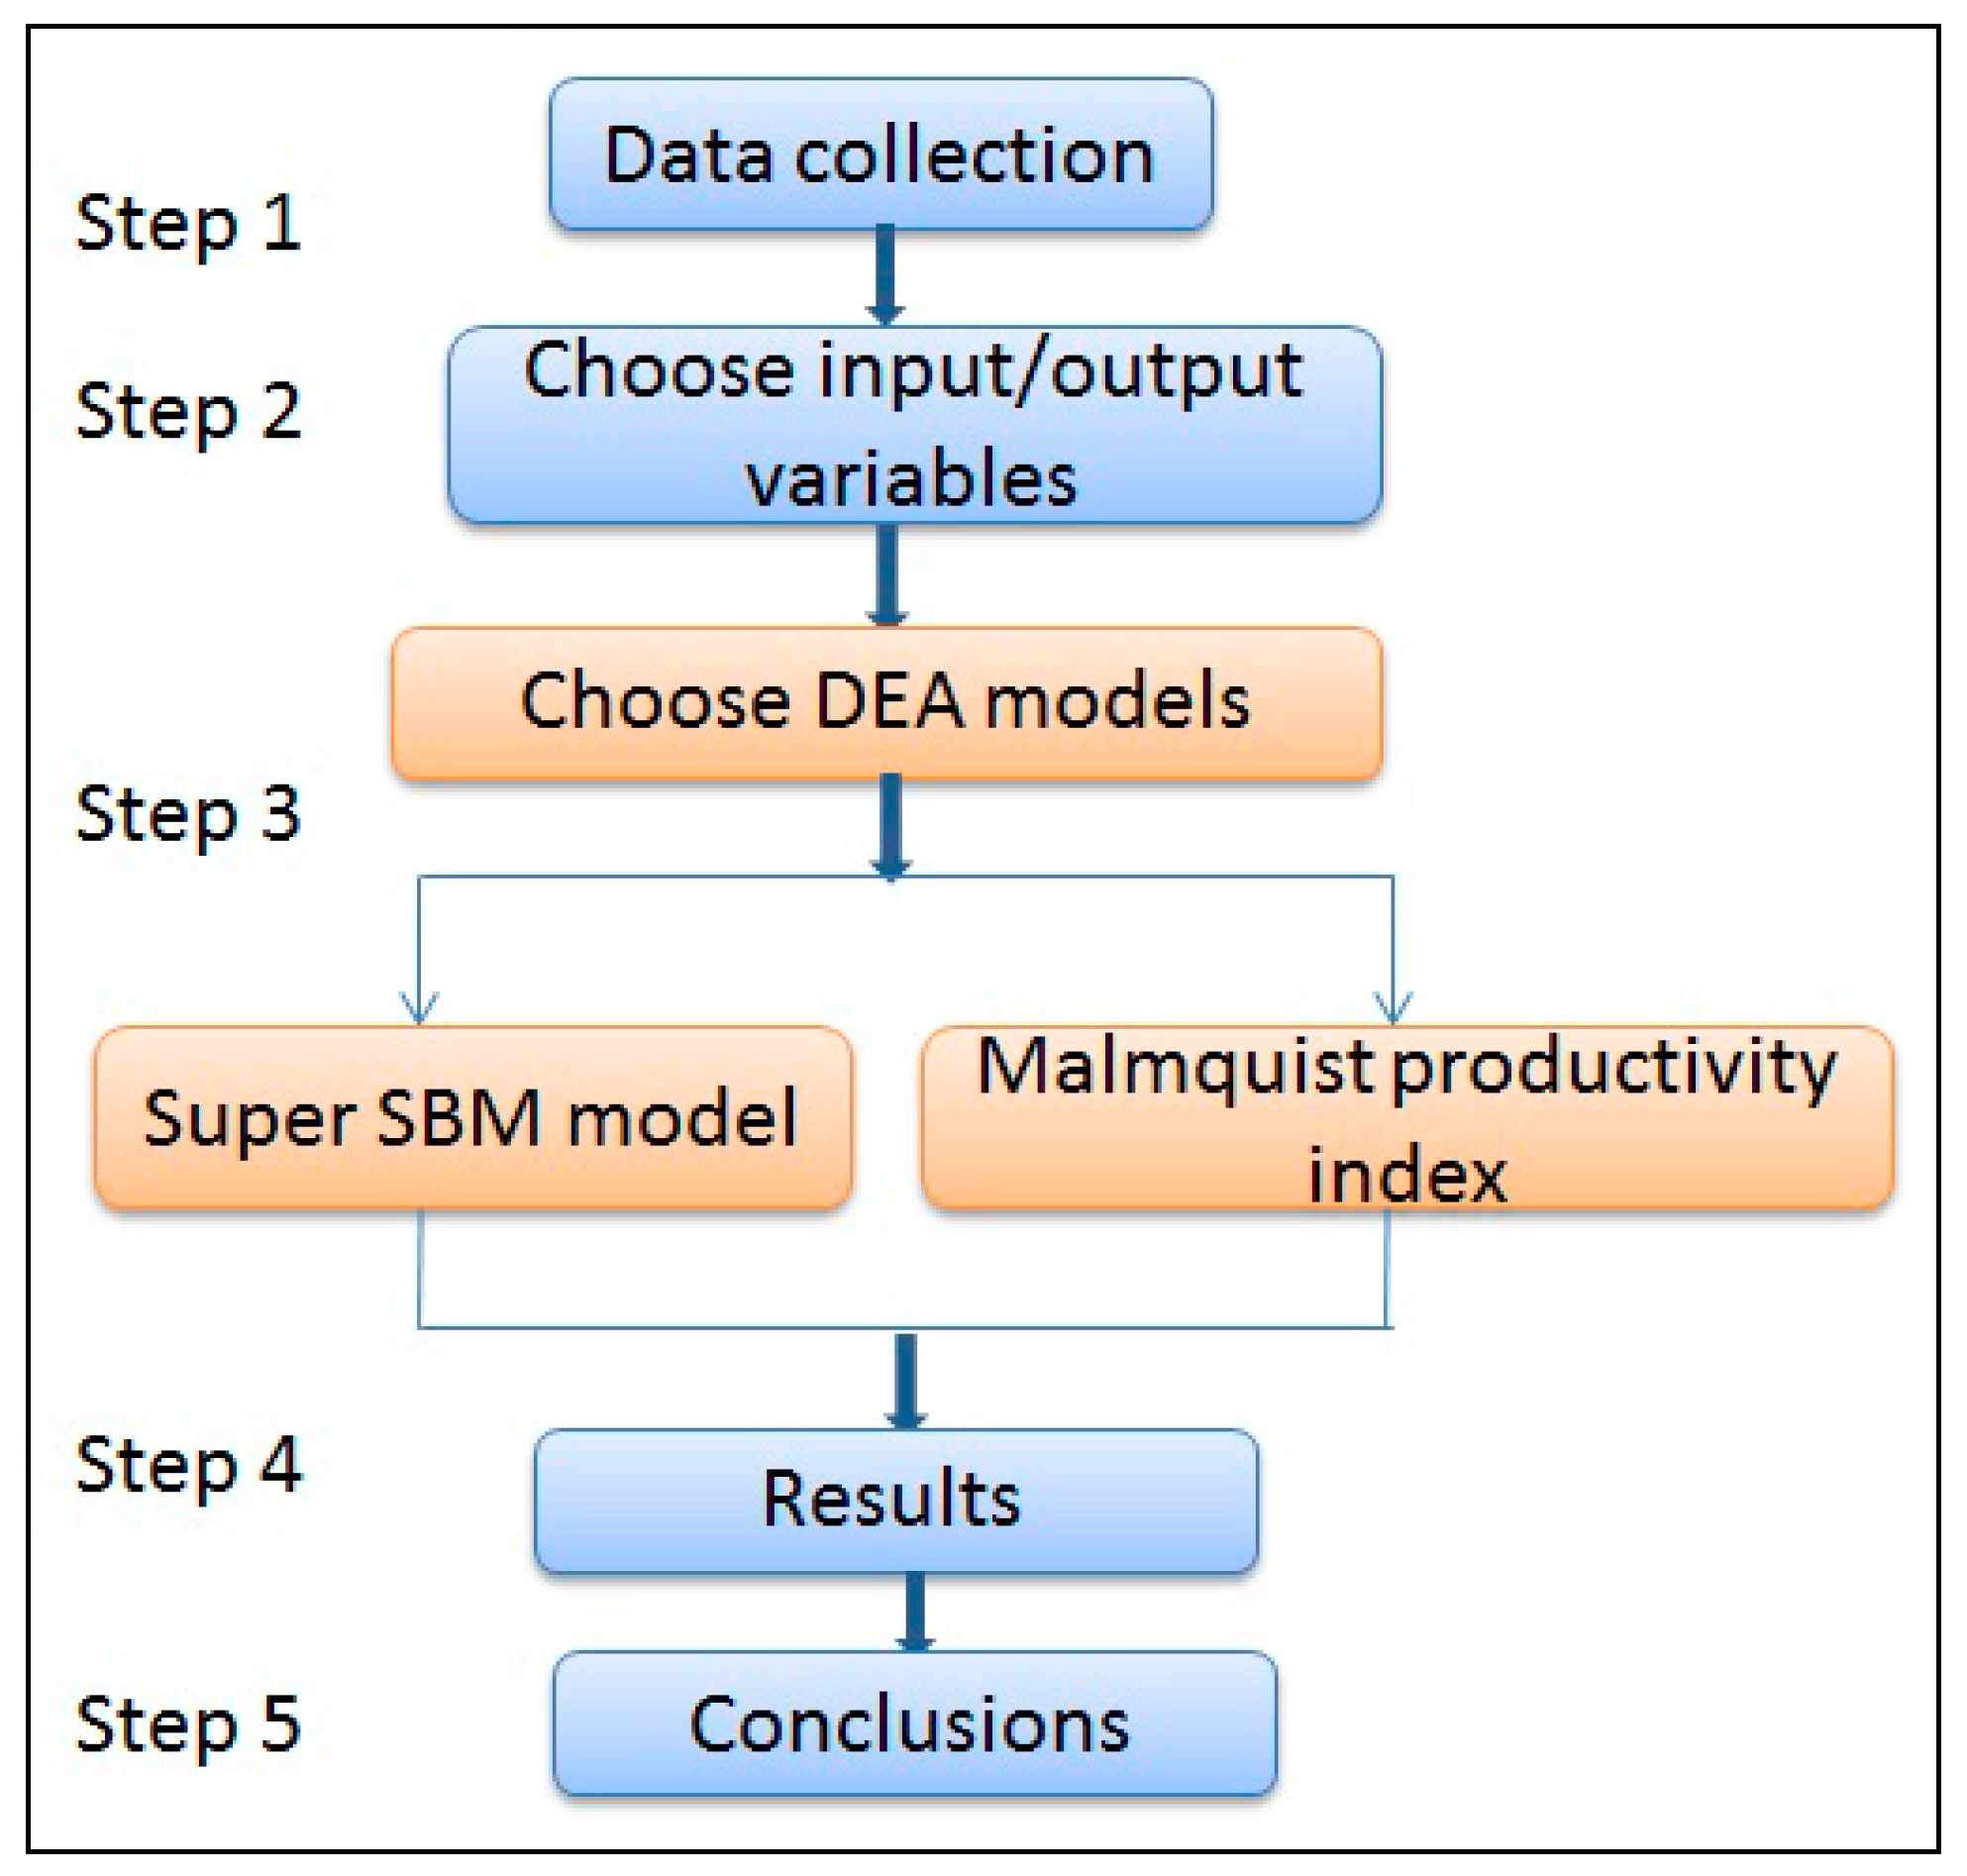
2. Methodologies
2.1. Super SBM Model
2.2. Malmquist Productivity Index
2.3. Research Procedure
3. Empirical Study
3.1. Data
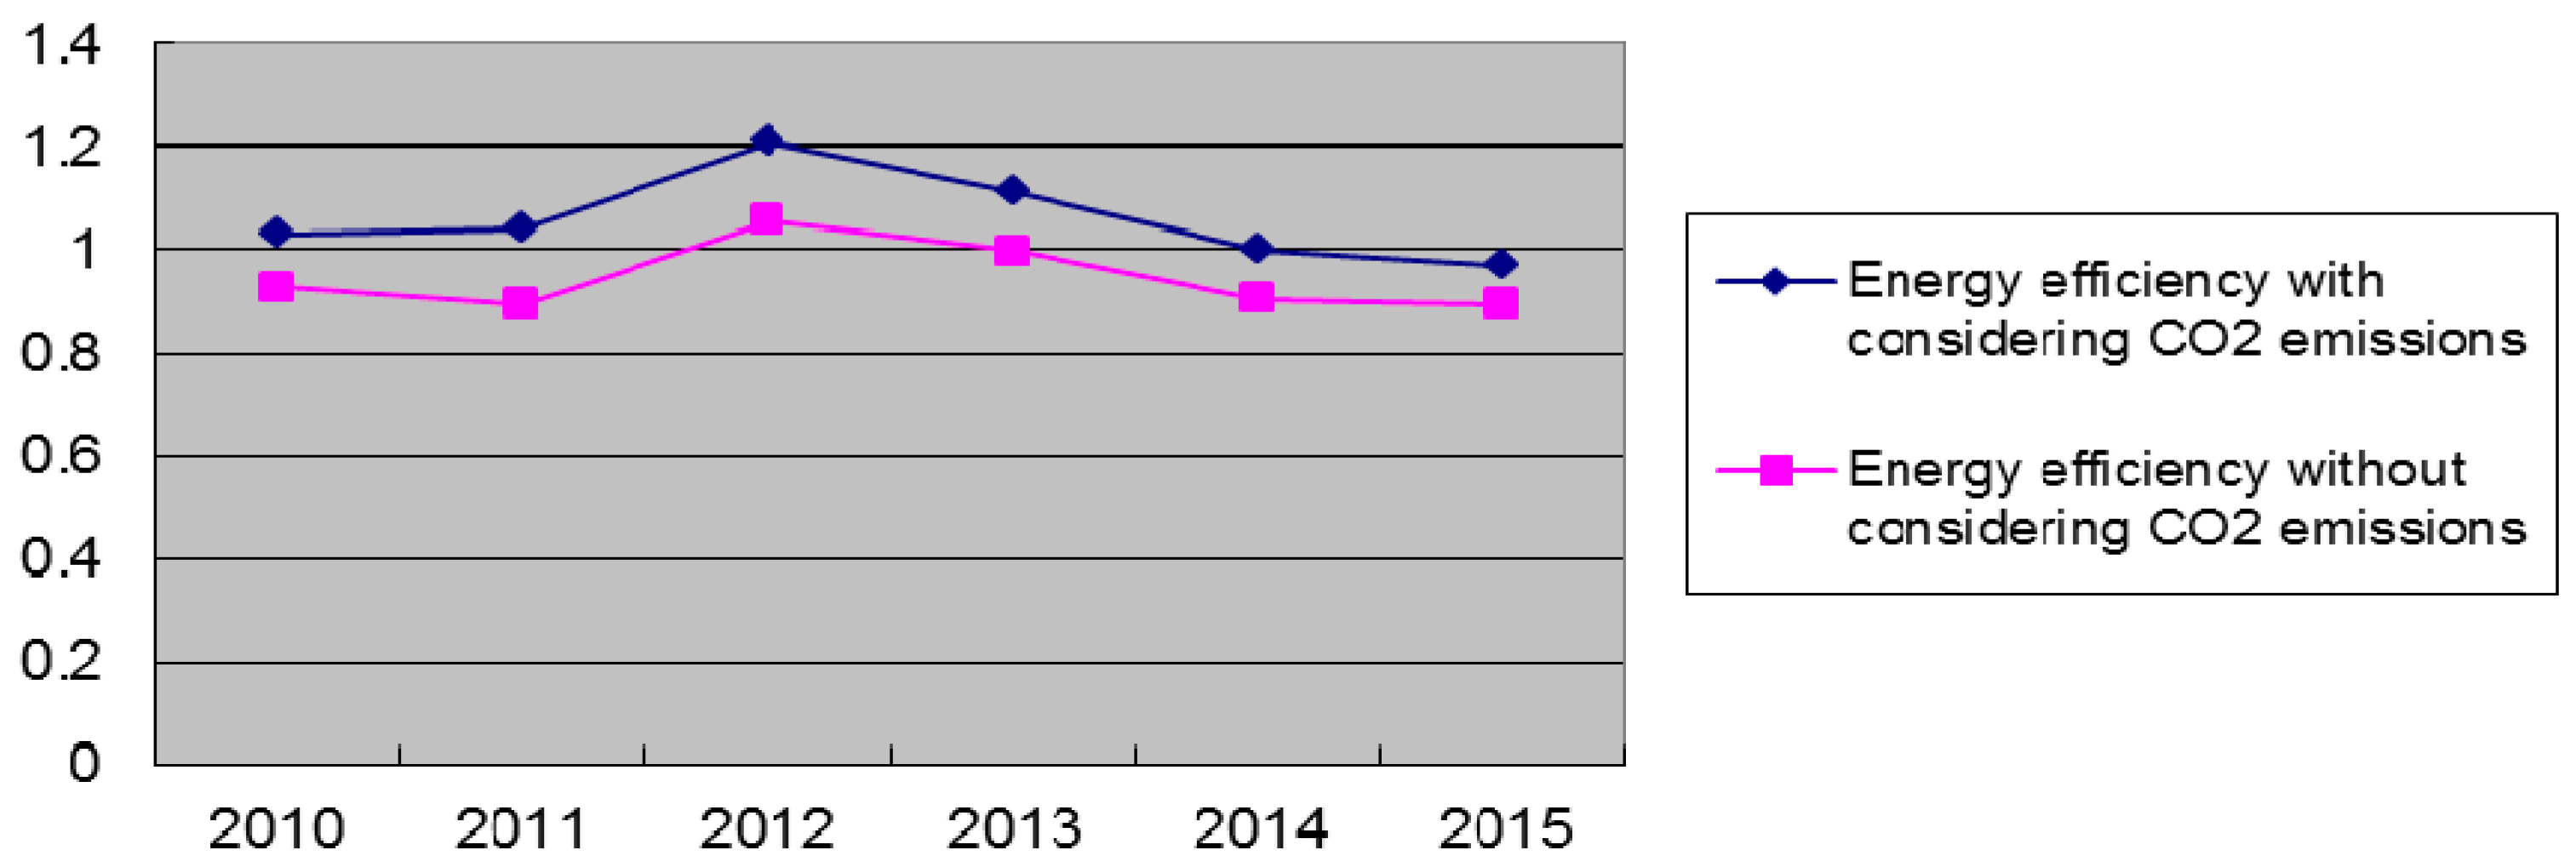
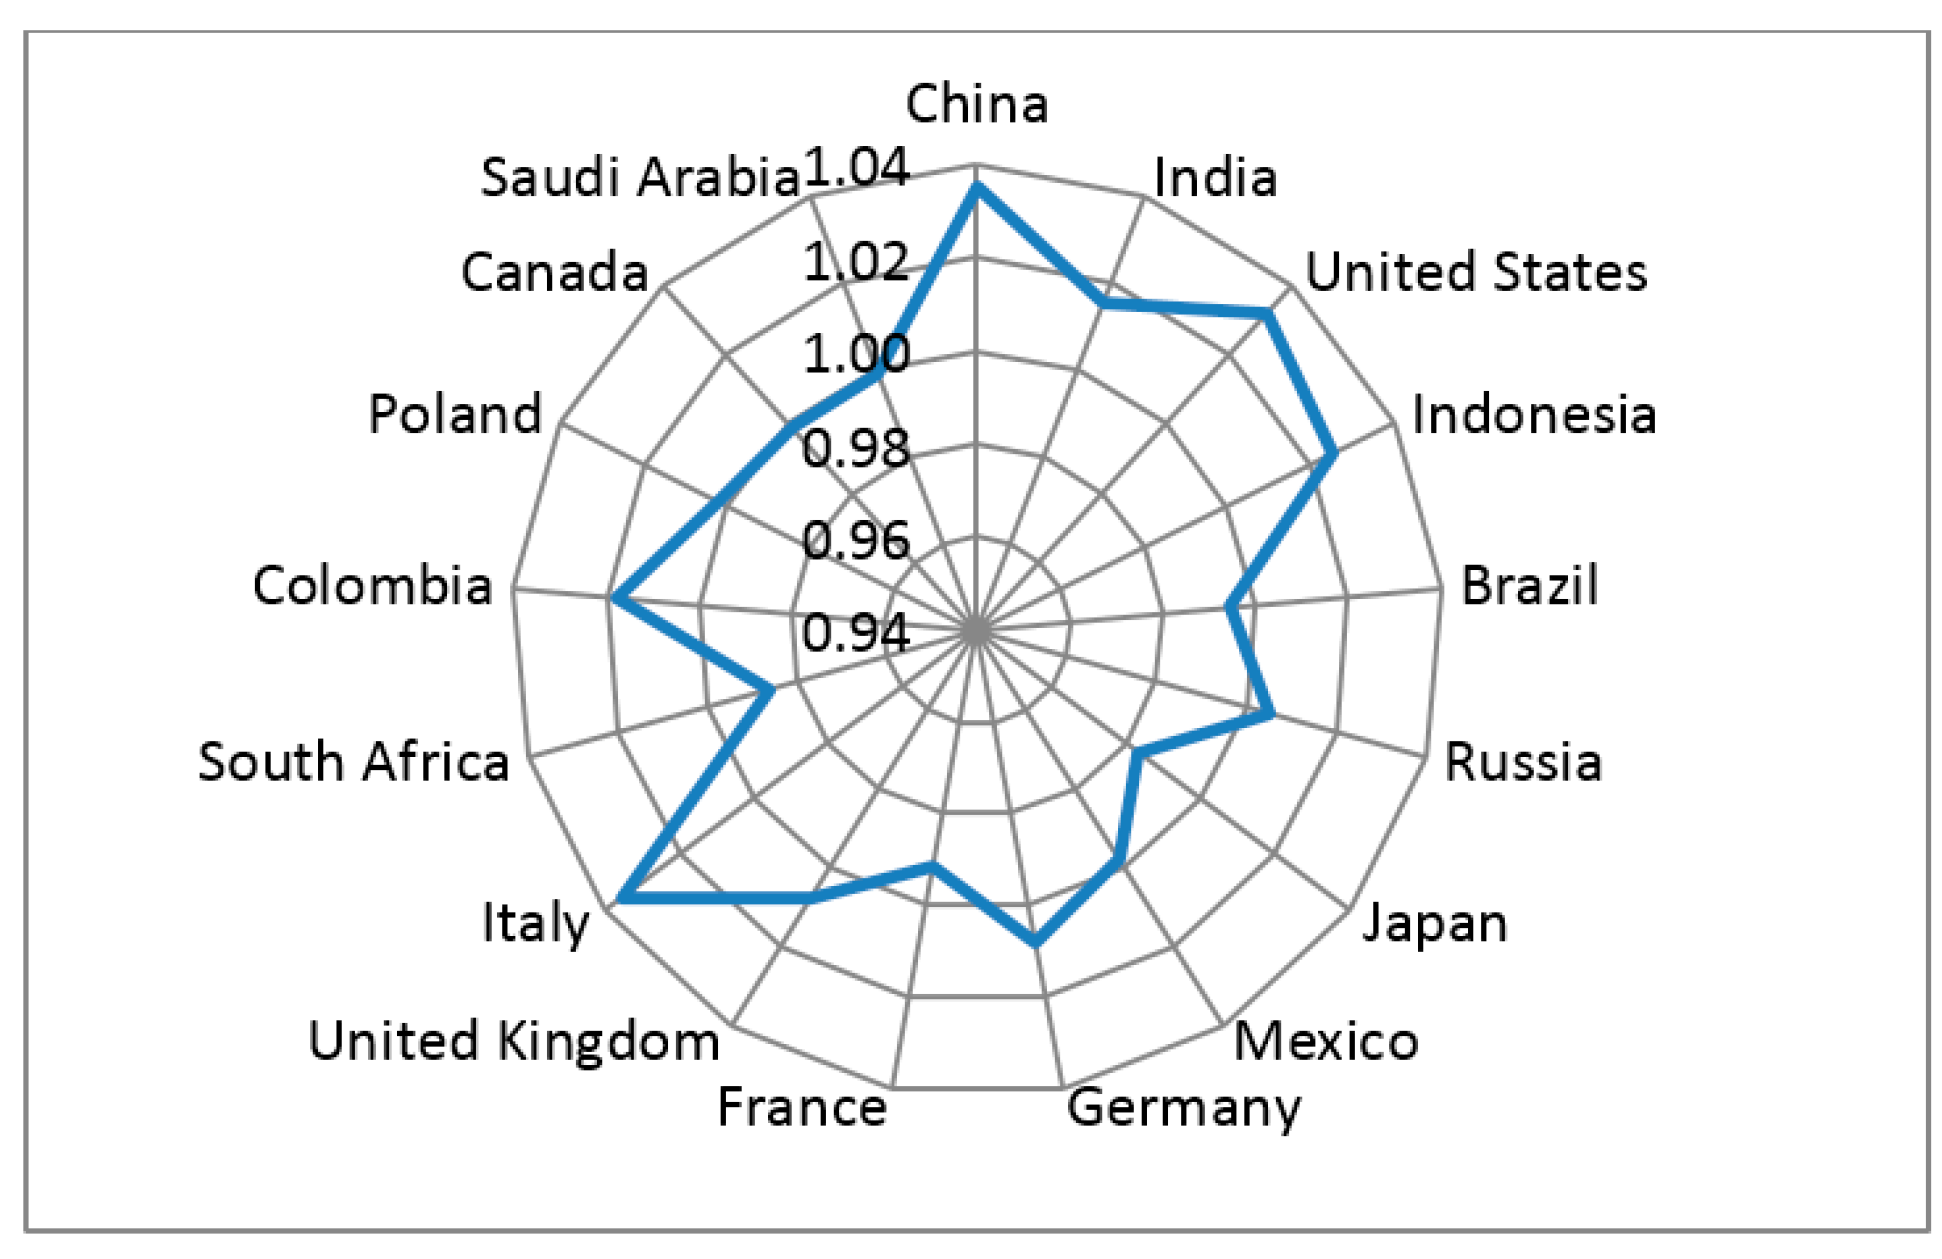
3.2. The Variation Analysis of Seventeen Countries Average Efficiency
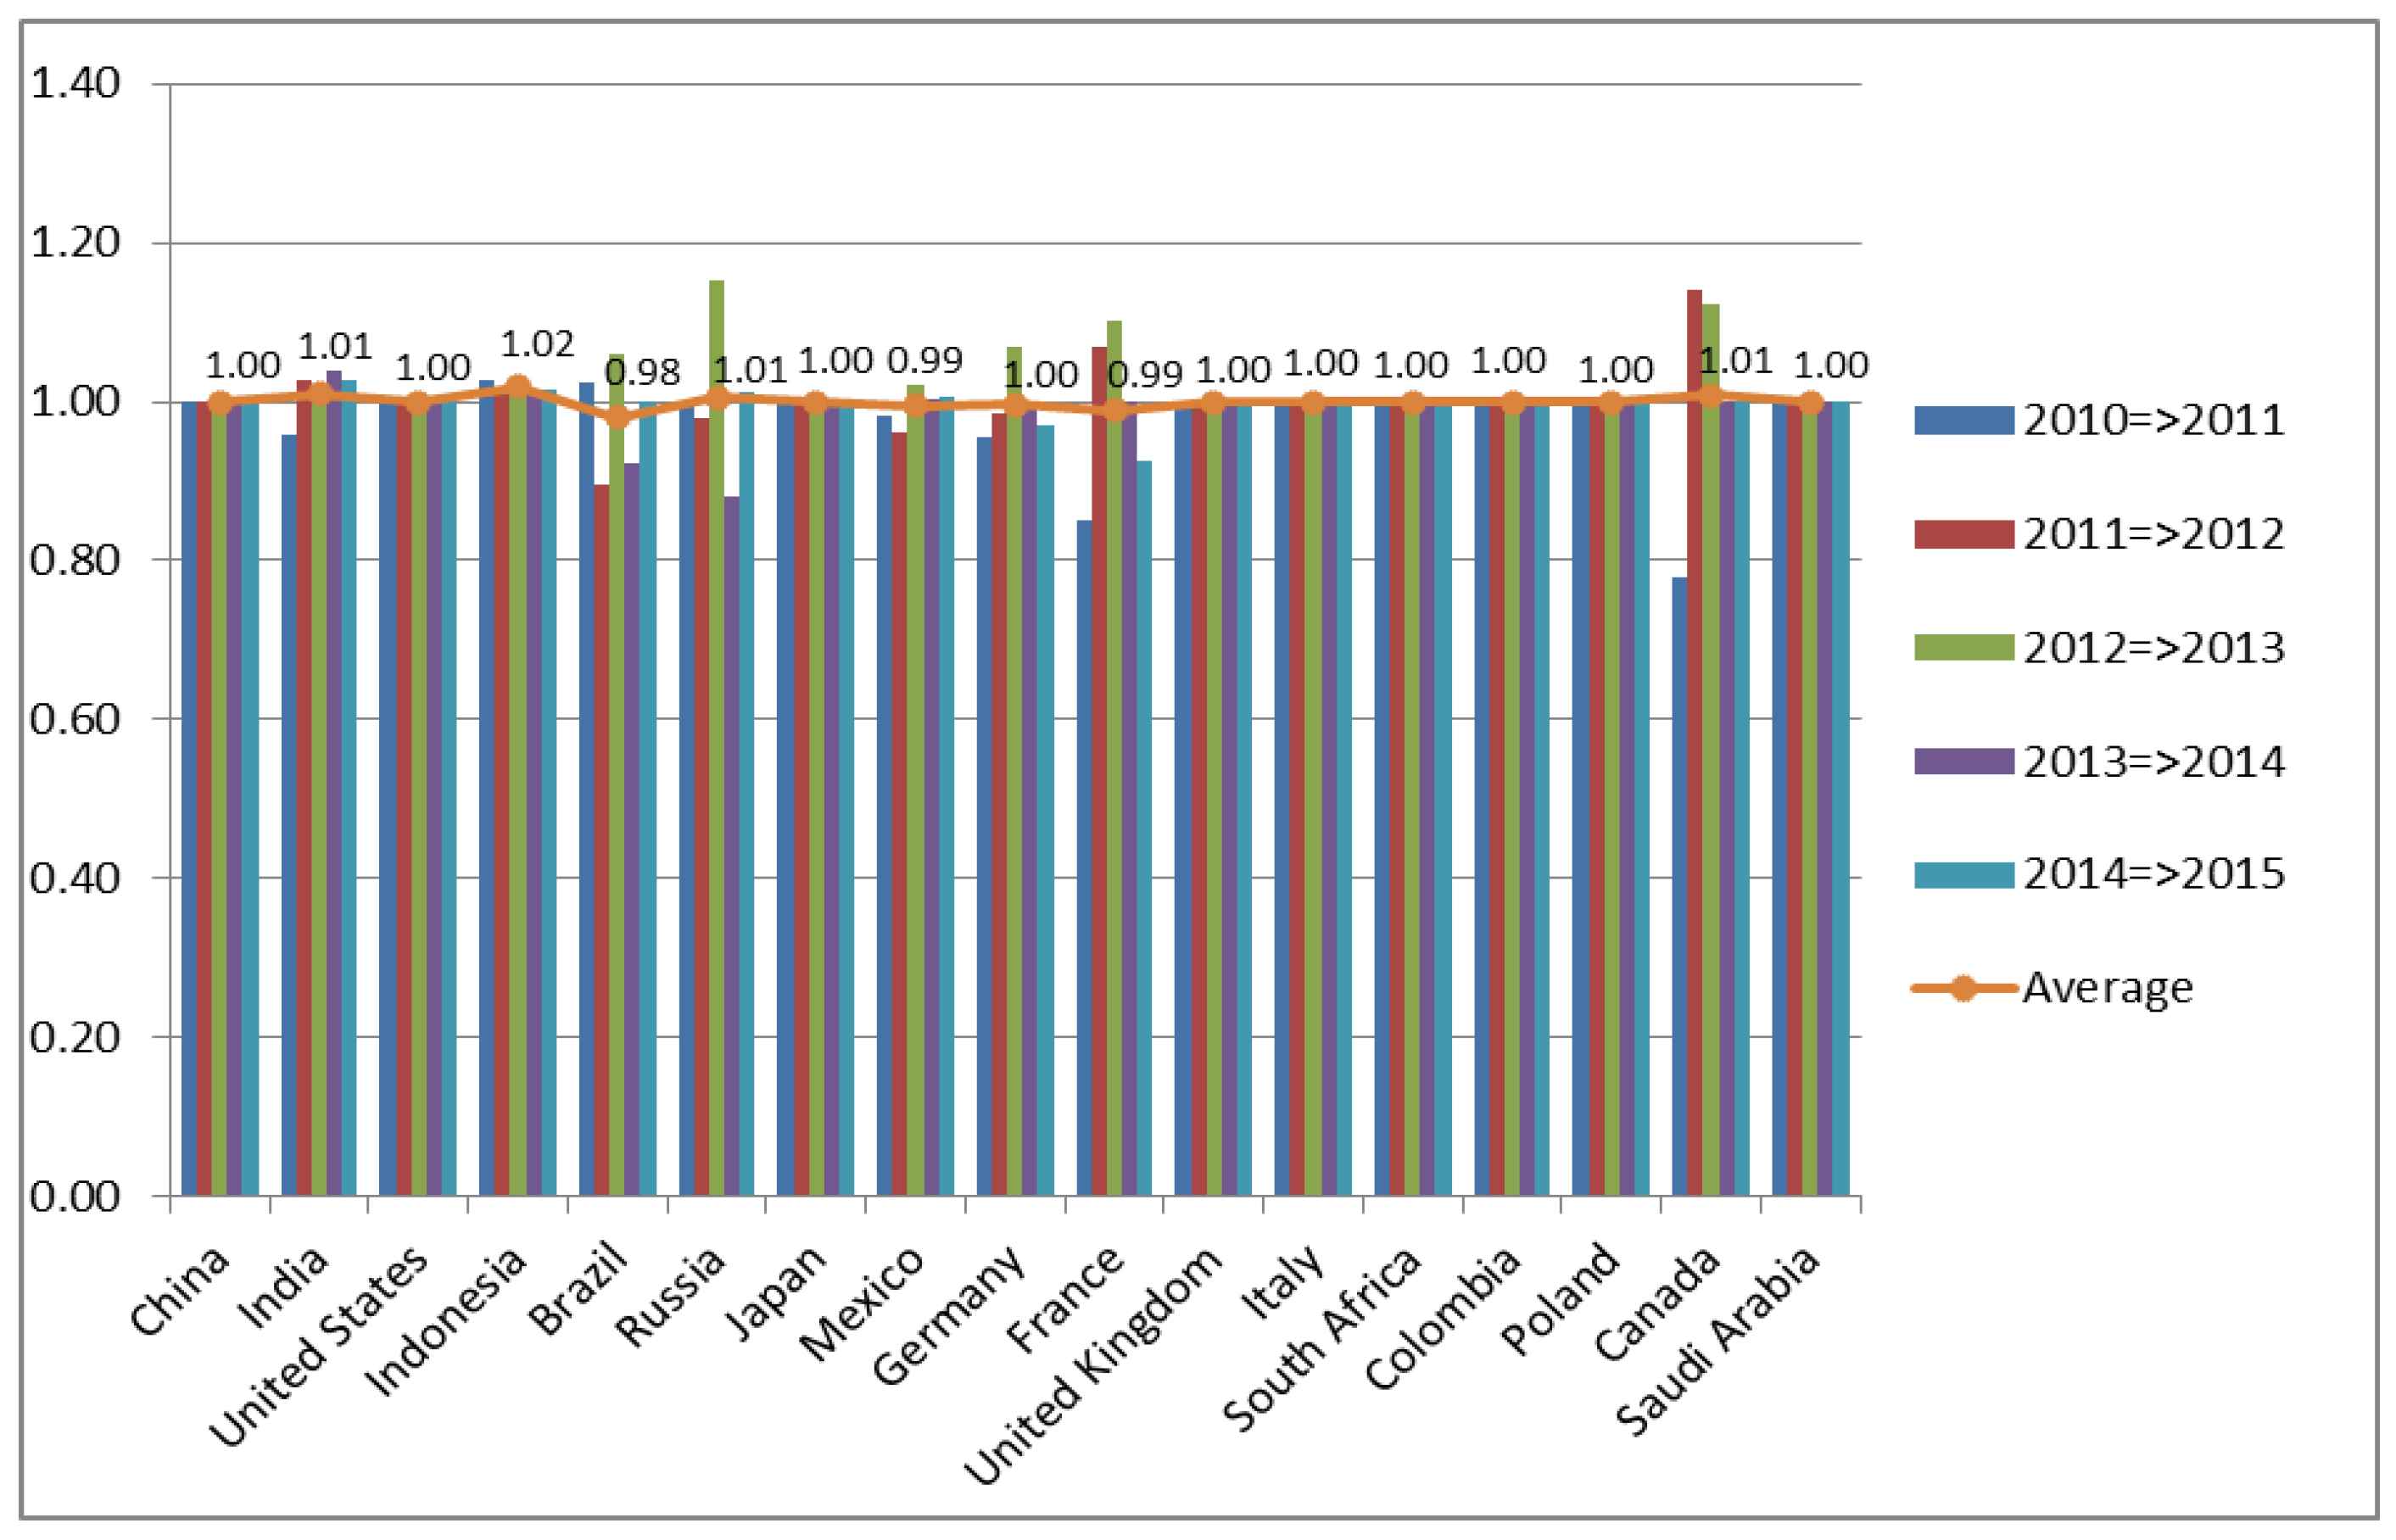
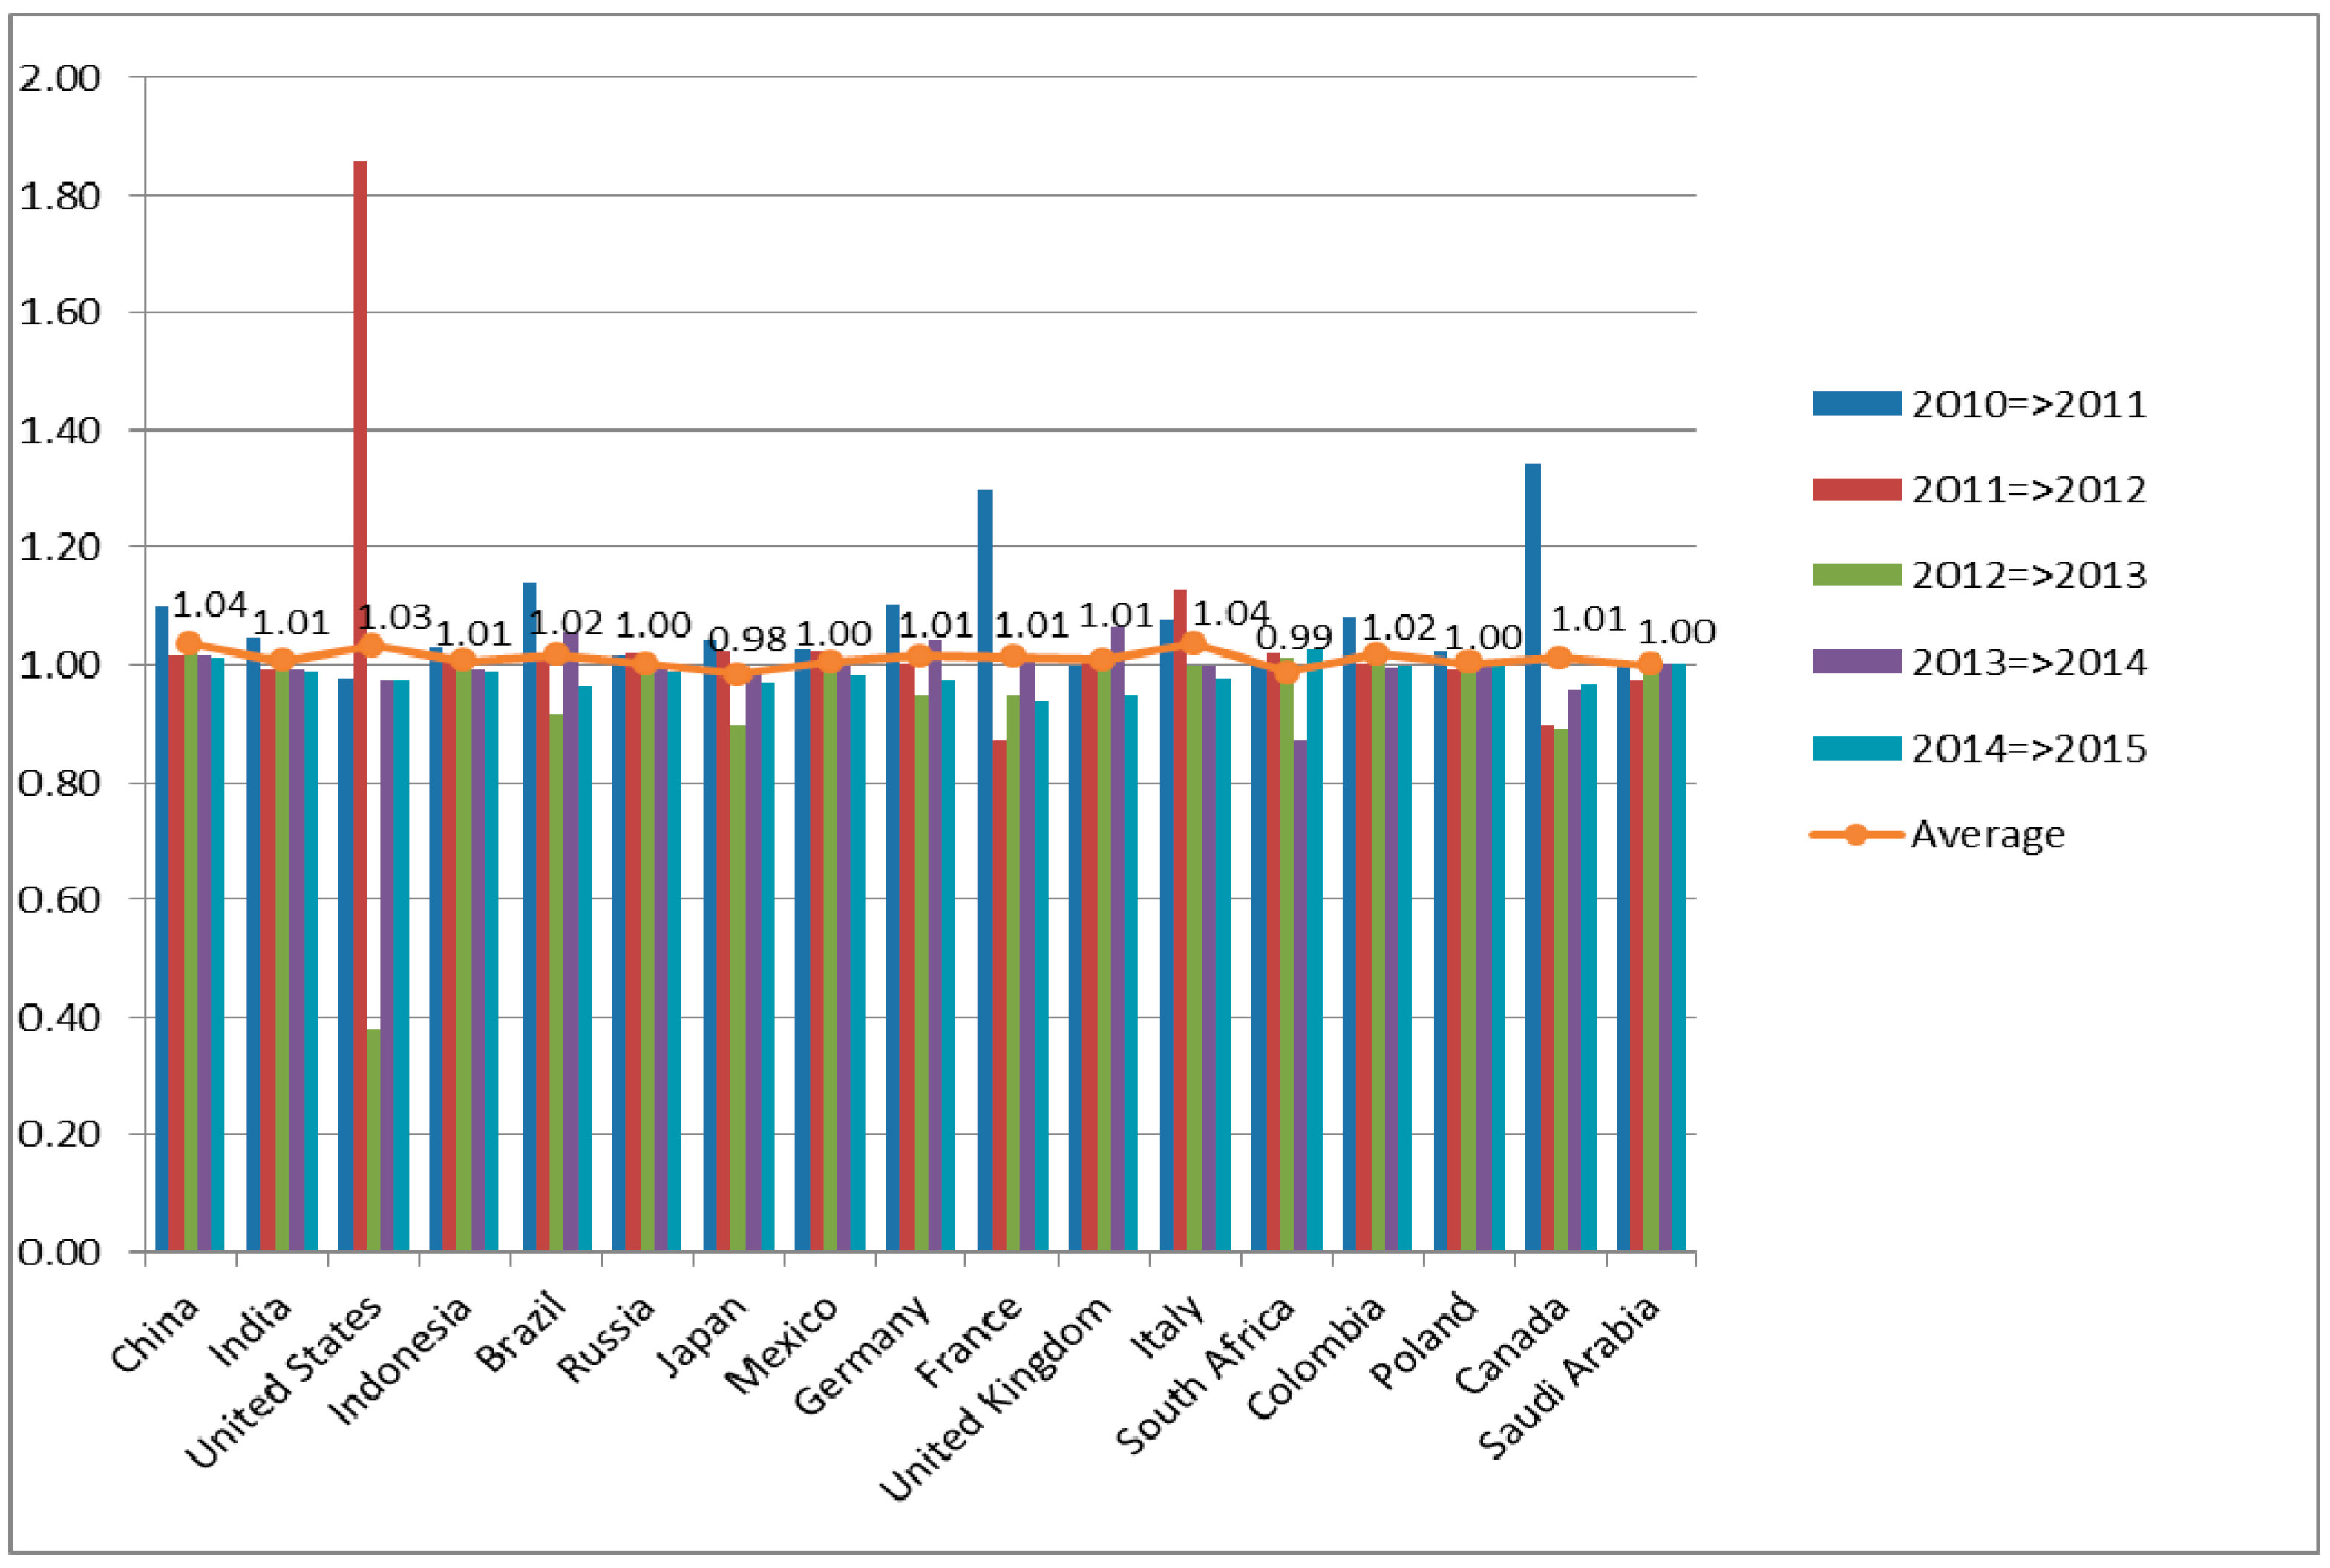
3.3. Total Energy Overall Productivity Efficiency, Technical Efficiency and Technology Efficiency
4. Conclusions
Author Contributions
Conflicts of Interest
Abbreviations
| DEA | Data development analysis |
| DMUs | Decision making units |
| SBM | Slacks based model |
| Super SBM | Super slacks based model |
| MPI | Malmquist productivity index |
| CO2 | carbon dioxide |
| GDP | gross domestic product |
References
- International Energy Agency. Worldwide Trends in Energy Use and Efficiency; OECD: Paris, France, 2008; Available online: https://www.iea.org/publications/freepublications/publication/Indicators_2008.pdf (accessed on 3 October 2017).
- U.S. Energy Information Administration. Available online: http://www.eia.gov/todayinenergy/detail.php?id=26212 (accessed on 3 October 2017).
- Ang, B.W. Monitoring changes in economy-wide energy efficiency: From energy—GDP ratio to composite efficiency index. Energy Policy 2006, 34, 574–582. [Google Scholar] [CrossRef]
- Wang, K.; Yu, S.; Zhang, W. China’s regional energy and environmental efficiency: A DEA window analysis based dynamic evaluation. Math. Comput. Model. 2013, 58, 1117–1127. [Google Scholar] [CrossRef]
- Blomberg, J.; Henriksson, E.; Lundmark, R. Energy efficiency and policy in Swedish pulp and paper mills: A data envelopment analysis approach. Energy Policy 2012, 42, 569–579. [Google Scholar] [CrossRef]
- Zhang, X.P.; Cheng, X.M.; Yuan, J.H.; Gao, X.J. Total-factor energy efficiency in developing countries. Energy Policy 2011, 39, 644–650. [Google Scholar] [CrossRef]
- Wang, K.; Wei, Y.M.; Zhang, X. A comparative analysis of China’s regional energy and emission performance: Which is the better way to deal with undesirable outputs? Energy Policy 2012, 46, 574–584. [Google Scholar] [CrossRef]
- Zhou, P.; Ang, B.W. Linear programming models for measuring economy-wide energy efficiency performance. Energy Policy 2008, 36, 2911–2916. [Google Scholar] [CrossRef]
- Zhou, P.; Ang, B.W.; Han, J.Y. Total factor carbon emission performance: A Malmquist index analysis. Energy Econ. 2010, 32, 194–201. [Google Scholar] [CrossRef]
- Lin, B.; Zheng, Q. Industrial polices and improved energy efficiency in China’s paper industry. J. Clean. Prod. 2017, 161, 200–210. [Google Scholar]
- Narayan, P.K.; Smyth, R. Energy consumption and real GDP in G7 countries: New evidence from panel cointegration with structural breaks. Energy Econ. 2008, 30, 2331–2341. [Google Scholar] [CrossRef]
- Wolde-Rufael, Y. Energy consumption and economic growth: The experience of African countries revisited. Energy Econ. 2009, 31, 217–224. [Google Scholar] [CrossRef]
- Lee, J.D.; Park, J.B.; Kim, T.Y. Estimation of the shadow prices of pollutants with production/environment inefficiency taken into account: A nonparametric directional distance function approach. J. Environ. Manag. 2002, 64, 365–375. [Google Scholar] [CrossRef]
- Färe, R.; Grosskopf, S.; Tyteca, D. An activity analysis model of the environmental performance of firms—Application to fossil-fuel-fired electric utilities. Ecol. Econ. 1996, 18, 161–175. [Google Scholar] [CrossRef]
- Lozano, S.; Gutiérrez, E. Non-parametric frontier approach to modelling the relationships among population, GDP, energy consumption and CO2 emissions. Ecol. Econ. 2008, 66, 687–699. [Google Scholar] [CrossRef]
- Zhang, N.; Zhou, P.; Choi, Y. Energy efficiency, CO2 emission performance and technology gaps in fossil fuel electricity generation in Korea: A meta-frontier non-radial directional distance function analysis. Energy Policy 2013, 56, 653–662. [Google Scholar] [CrossRef]
- Vlontzos, G.; Niavis, S.; Manos, B. A DEA approach for estimating the agricultural energy and environmental efficiency of EU countries. Renew. Sustain. Energy Rev. 2014, 40, 91–96. [Google Scholar] [CrossRef]
- Ramanathan, R. An analysis of energy consumption and carbon dioxide emissions in countries of the Middle East and North Africa. Energy 2005, 30, 2831–2842. [Google Scholar] [CrossRef]
- Chen, L.; Jia, G. Environmental efficiency analysis of China’s regional industry: A data envelopment analysis (DEA) based approach. J. Clean. Prod. 2017, 142, 846–853. [Google Scholar] [CrossRef]
- Li, H.; Shi, J.F. Energy efficiency analysis on Chinese industrial sectors: An improved Super-SBM model with undesirable outputs. J. Clean. Prod. 2014, 65, 97–107. [Google Scholar] [CrossRef]
- Wu, F.; Fan, L.W.; Zhou, P.; Zhou, D.Q. Industrial energy efficiency with CO2 emissions in China: A nonparametric analysis. Energy Policy 2012, 49, 164–172. [Google Scholar] [CrossRef]
- Egilmez, G.; Kucukvar, M.; Tatari, O. Sustainability assessment of US manufacturing sectors: An economic input output-based frontier approach. J. Clean. Prod. 2013, 53, 91–102. [Google Scholar] [CrossRef]
- Xue, X.; Wu, H.; Zhang, X.; Dai, J.; Su, C. Measuring energy consumption efficiency of the construction industry: The case of China. J. Clean. Prod. 2015, 107, 509–515. [Google Scholar] [CrossRef]
- Wang, C.N.; Ho, H.X.T.; Luo, S.H.; Lin, T.F. An Integrated Approach to evaluating and selecting green logistics providers for sustainable development. Sustainability 2017, 9, 218. [Google Scholar] [CrossRef]
- Chang, M.C. Room for improvement in low carbon economies of G7 and BRICS countries based on the analysis of energy efficiency and environmental Kuznets curves. J. Clean. Prod. 2015, 99, 140–151. [Google Scholar] [CrossRef]
- Herring, H. Energy efficiency—A critical view. Energy 2006, 31, 10–20. [Google Scholar] [CrossRef]
- Song, M.; An, Q.; Zhang, W.; Wang, Z.; Wu, J. Environmental efficiency evaluation based on data envelopment analysis: A review. Renew. Sustain. Energy Rev. 2012, 16, 4465–4469. [Google Scholar] [CrossRef]
- Xie, B.C.; Shang, L.F.; Yang, S.B.; Yi, B.W. Dynamic environmental efficiency evaluation of electric power industries: Evidence from OECD (Organization for Economic Cooperation and Development) and BRIC (Brazil, Russia, India and China) countries. Energy 2014, 74, 147–157. [Google Scholar] [CrossRef]
- Shi, G.M.; Bi, J.; Wang, J.N. Chinese regional industrial energy efficiency evaluation based on a DEA model of fixing non-energy inputs. Energy Policy 2010, 38, 6172–6179. [Google Scholar] [CrossRef]
- Zaim, O.; Taskin, F. A Kuznets curve in environmental efficiency: An application on OECD countries. Environ. Resour. Econ. 2000, 17, 21–36. [Google Scholar] [CrossRef]
- Tone, K. A slacks-based measure of super-efficiency in data envelopment analysis. Eur. J. Oper. Res. 2002, 143, 32–41. [Google Scholar] [CrossRef]
- Cooper, W.W.; Seiford, L.M.; Tone, K. Introduction to Data Envelopment Analysis and Its Uses: With DEA-Solver Software and References; Springer Science and Business Media: Berlin/Heidelberg, Germany, 2006. [Google Scholar]
- List of Countries by Carbon Dioxide Emission. Available online: https://en.wikipedia.org/wiki/List_of_countries_by_carbon_dioxide_emissions (accessed on 26 September 2017).
- World Bank. Available online: http://data.worldbank.org/ (accessed on 1 September 2017).
- Enerdata Yearbook. Available online: https://yearbook.enerdata.net/ (accessed on 1 September 2017).
- Lee, C.C. Energy consumption and GDP in developing countries: A counteracted panel analysis. Energy Econ. 2005, 27, 415–427. [Google Scholar] [CrossRef]
- Sari, R.; Soytas, U. The growth of income and energy consumption in six developing countries. Energy Policy 2007, 35, 889–898. [Google Scholar] [CrossRef]


| Year | Variable | Non Energy Inputs | Energy Inputs | Desirable Outputs | Undesirable Outputs | |
|---|---|---|---|---|---|---|
| Gross Capital Formation (% of GDP) | Labor Force (Million Workers) | Total Energy Consumption (Mtoe) | GDP (Millions in Current US$) | CO2 Emissions from Fuel Combustion (Million Tons) | ||
| 2010 | Max | 47.347 | 781.055 | 2587.751 | 14,964.372 | 7361.995 |
| Min | 16.365 | 10.066 | 31.206 | 287.018 | 65.811 | |
| Average | 24.536 | 120.018 | 529.920 | 2801.531 | 1292.103 | |
| SD | 7.692 | 196.327 | 709.491 | 3441.354 | 1931.881 | |
| 2011 | Max | 47.167 | 790.183 | 2801.673 | 15,517.926 | 8355.837 |
| Min | 16.158 | 6.555 | 31.255 | 335.415 | 66.337 | |
| Average | 24.882 | 117.642 | 540.128 | 3098.57 | 1349.492 | |
| SD | 7.734 | 199.928 | 745.353 | 3625.968 | 2104.604 | |
| 2012 | Max | 47.325 | 795.863 | 2908.356 | 16,155.255 | 8521.781 |
| Min | 16.249 | 10.853 | 31.593 | 369.659 | 65.441 | |
| Average | 24.735 | 113.700 | 548.120 | 3169.659 | 1370.249 | |
| SD | 7.873 | 201.078 | 758.084 | 3826.973 | 2124.370 | |
| 2013 | Max | 47.678 | 801.791 | 3010.468 | 16,663.16 | 8894.470 |
| Min | 16.891 | 7.689 | 31.652 | 366.057 | 67.929 | |
| Average | 24.195 | 119.509 | 558.626 | 3237.949 | 1405.250 | |
| SD | 7.618 | 203.481 | 783.033 | 3976.708 | 2208.045 | |
| 2014 | Max | 46.199 | 806.499 | 3073.153 | 17,348.071 | 8987.857 |
| Min | 16.315 | 12.135 | 33.025 | 349.873 | 71.931 | |
| Average | 24.443 | 124.805 | 565.477 | 3330.072 | 1419.327 | |
| SD | 7.381 | 203.725 | 799.421 | 4187.639 | 2236.607 | |
| 2015 | Max | 132.368 | 804.000 | 3100.893 | 17,946.996 | 8947.639 |
| Min | 16.766 | 11.670 | 34.429 | 292.080 | 76.430 | |
| Average | 30.326 | 124.349 | 568.364 | 3166.730 | 1414.967 | |
| SD | 26.480 | 203.800 | 802.636 | 4404.015 | 2218.217 | |
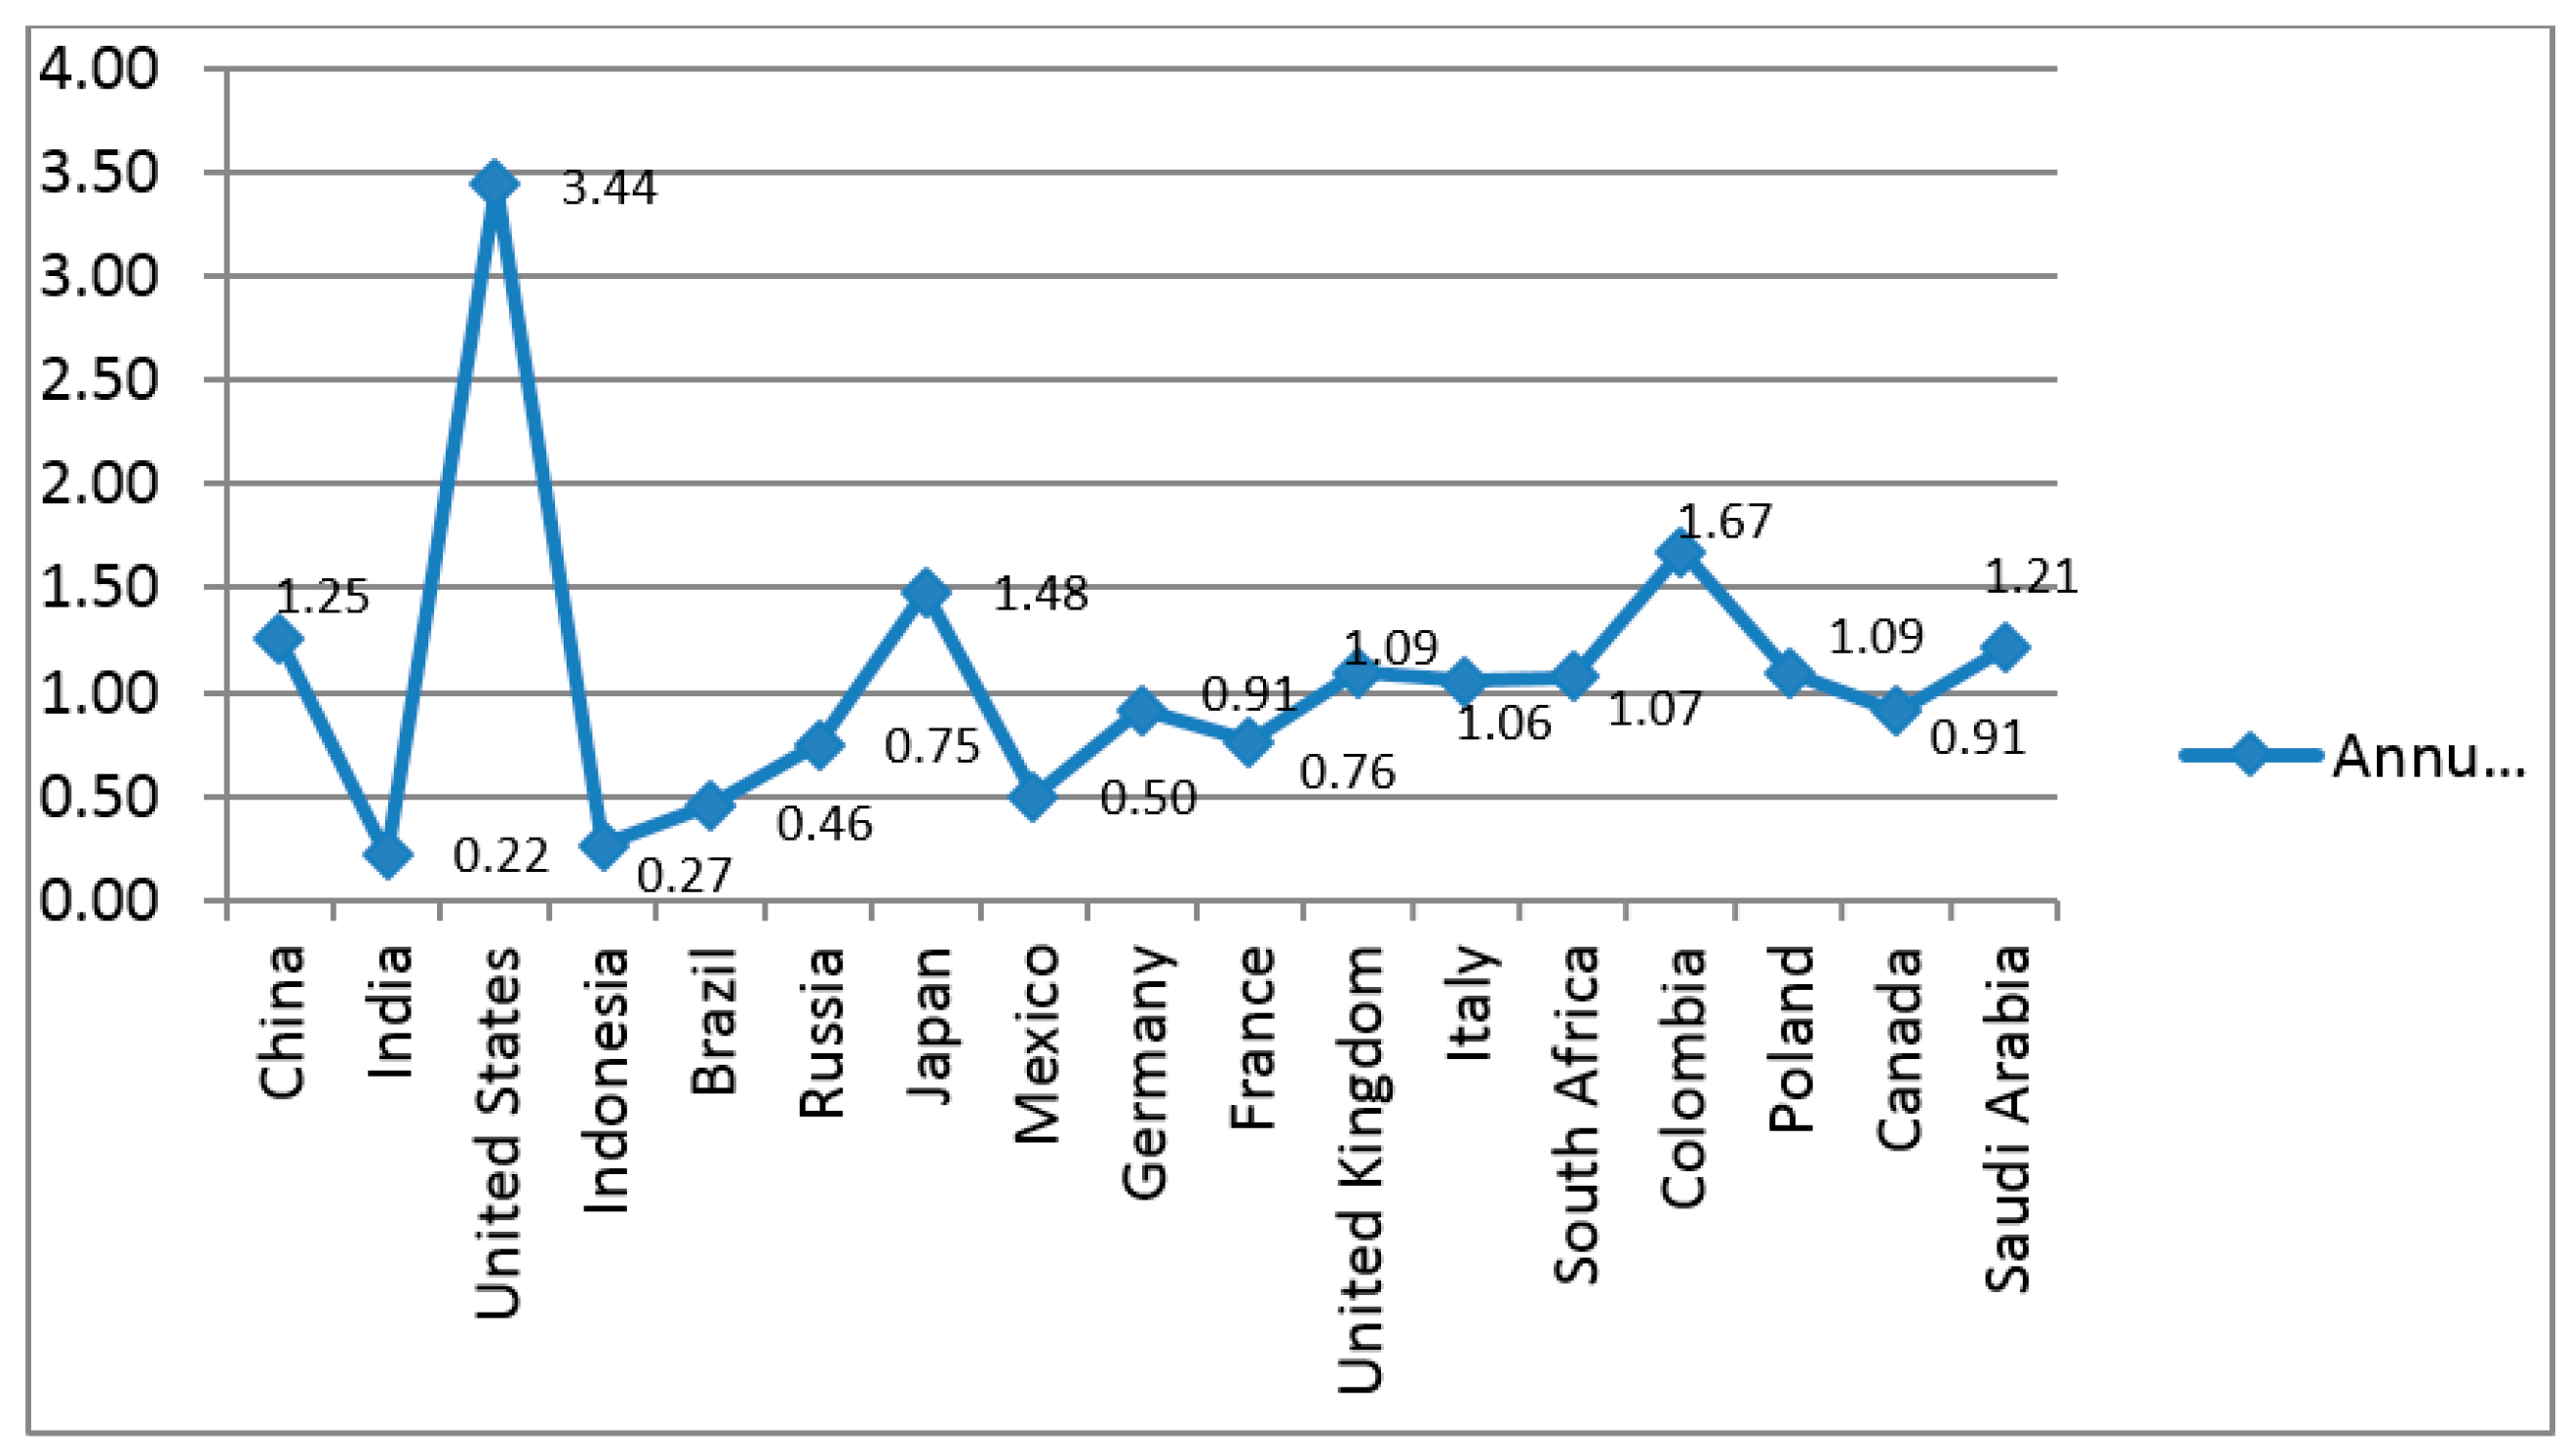
| Malmquist Productivity Index with CO2 Emissions | ||||||
|---|---|---|---|---|---|---|
| Malmquist | 2010=>2011 | 2011=>2012 | 2012=>2013 | 2013=>2014 | 2014=>2015 | Average |
| China | 1.10 | 1.01 | 1.04 | 1.01 | 1.01 | 1.04 |
| India | 1.00 | 1.02 | 1.01 | 1.03 | 1.02 | 1.02 |
| USA | 0.98 | 1.86 | 0.38 | 0.97 | 0.98 | 1.03 |
| Indonesia | 1.06 | 1.03 | 1.03 | 1.01 | 1.00 | 1.03 |
| Brazil | 1.17 | 0.90 | 0.97 | 0.97 | 0.96 | 0.99 |
| Russia | 1.01 | 1.00 | 1.13 | 0.88 | 1.00 | 1.01 |
| Japan | 1.04 | 1.02 | 0.90 | 0.98 | 0.97 | 0.98 |
| Mexico | 1.01 | 0.98 | 1.01 | 1.00 | 0.99 | 1.00 |
| Germany | 1.05 | 0.99 | 1.01 | 1.04 | 0.94 | 1.01 |
| France | 1.10 | 0.93 | 1.04 | 1.01 | 0.87 | 0.99 |
| UK | 1.00 | 1.01 | 1.02 | 1.06 | 0.95 | 1.01 |
| Italy | 1.08 | 1.13 | 1.00 | 1.00 | 0.98 | 1.04 |
| South Africa | 1.00 | 1.02 | 1.01 | 0.87 | 1.03 | 0.99 |
| Colombia | 1.08 | 1.00 | 1.02 | 1.00 | 1.00 | 1.02 |
| Poland | 1.02 | 0.99 | 1.00 | 1.00 | 1.00 | 1.00 |
| Canada | 1.05 | 1.02 | 1.00 | 0.96 | 0.97 | 1.00 |
| Saudi Arabia | 1.00 | 0.97 | 1.02 | 1.00 | 1.00 | 1.00 |
| Average | 1.04 | 1.05 | 0.98 | 0.99 | 0.98 | 1.01 |
| Max | 1.17 | 1.86 | 1.13 | 1.06 | 1.03 | 1.04 |
| Min | 0.98 | 0.90 | 0.38 | 0.87 | 0.87 | 0.98 |
| SD | 0.05 | 0.21 | 0.16 | 0.05 | 0.04 | 0.02 |
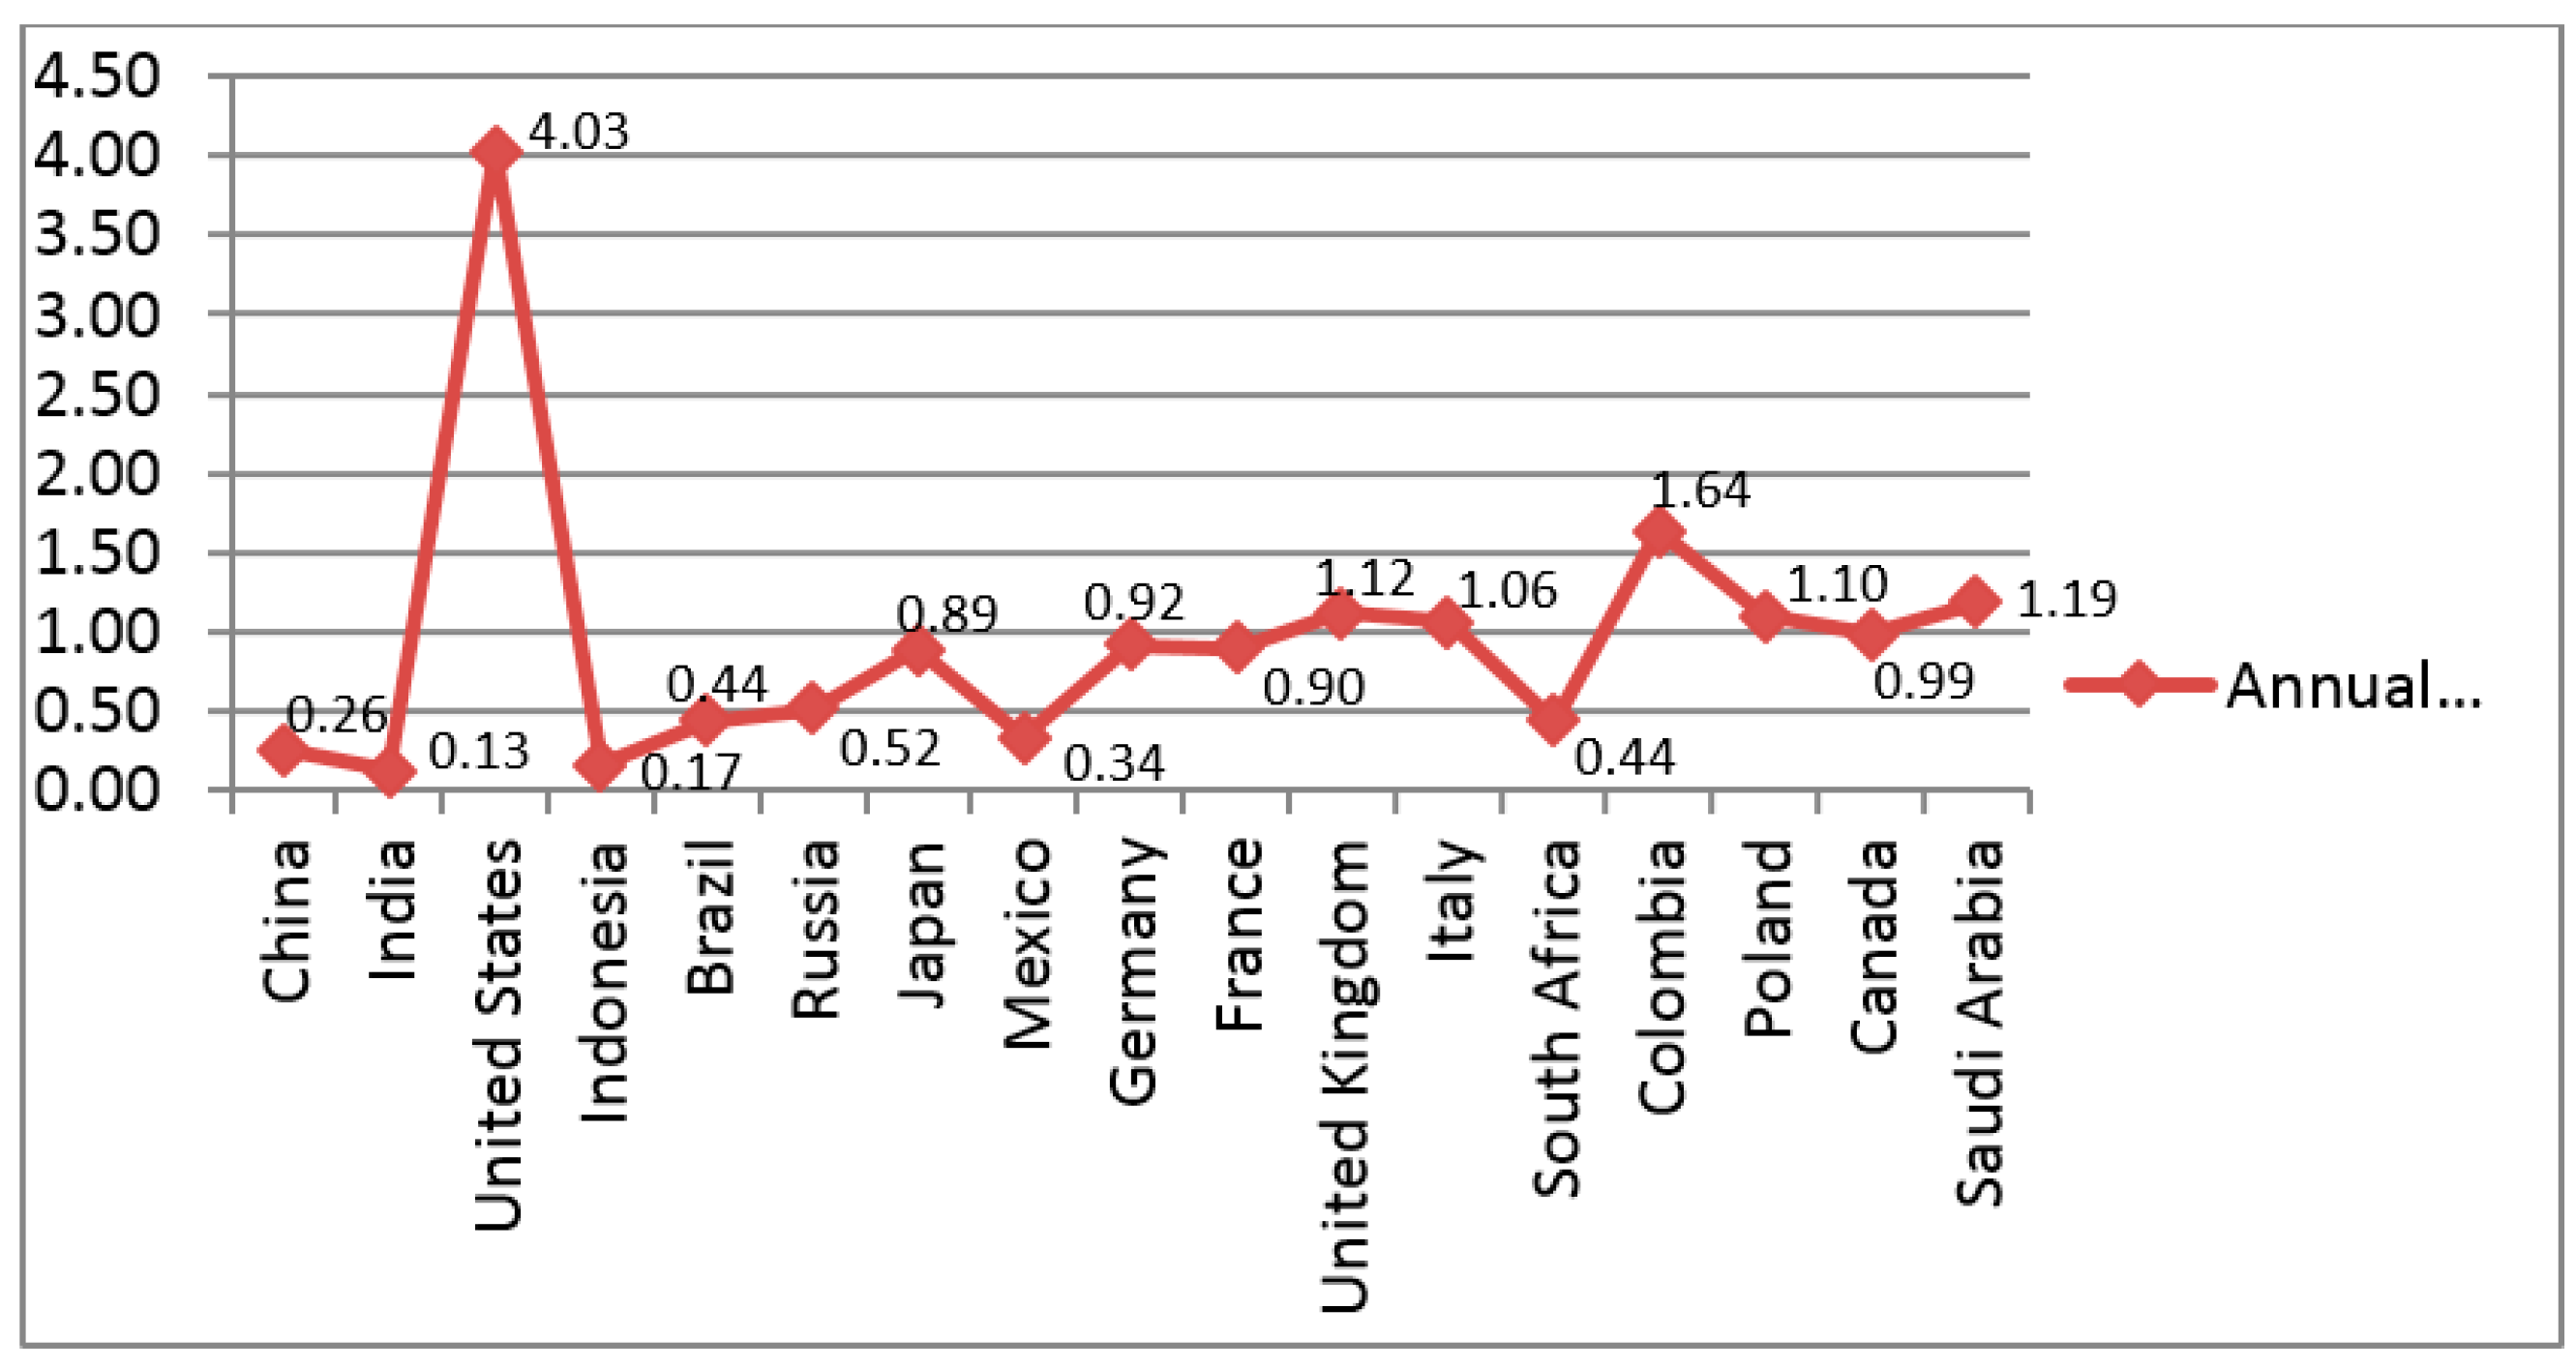
| Malmquist Productivity Index without CO2 Emissions | ||||||
|---|---|---|---|---|---|---|
| Malmquist | 2010=>2011 | 2011=>2012 | 2012=>2013 | 2013=>2014 | 2014=>2015 | Average |
| China | 1.24 | 1.13 | 1.12 | 1.09 | 1.05 | 1.13 |
| India | 1.04 | 0.98 | 1.00 | 1.04 | 0.97 | 1.01 |
| USA | 1.01 | 1.54 | 0.38 | 0.99 | 1.01 | 0.99 |
| Indonesia | 1.20 | 1.00 | 0.99 | 0.95 | 0.96 | 1.02 |
| Brazil | 1.17 | 0.90 | 0.97 | 0.96 | 0.74 | 0.95 |
| Russia | 1.31 | 1.05 | 3.33 | 0.30 | 0.66 | 1.33 |
| Japan | 1.04 | 1.01 | 0.82 | 0.95 | 0.91 | 0.95 |
| Mexico | 1.07 | 0.99 | 1.04 | 1.04 | 0.89 | 1.01 |
| Germany | 1.12 | 0.94 | 1.03 | 1.07 | 0.86 | 1.01 |
| France | 1.10 | 0.93 | 1.05 | 1.01 | 0.87 | 0.99 |
| UK | 1.07 | 0.99 | 1.02 | 1.10 | 0.95 | 1.03 |
| Italy | 1.10 | 1.13 | 1.01 | 1.00 | 0.92 | 1.03 |
| South Africa | 1.00 | 0.71 | 0.65 | 0.80 | 0.85 | 0.80 |
| Colombia | 1.08 | 1.00 | 1.01 | 0.97 | 0.85 | 0.98 |
| Poland | 1.02 | 0.99 | 1.00 | 1.00 | 0.92 | 0.99 |
| Canada | 1.09 | 1.03 | 0.99 | 0.95 | 0.92 | 1.00 |
| Saudi Arabia | 1.00 | 0.77 | 0.99 | 0.95 | 1.00 | 0.94 |
| Average | 1.10 | 1.01 | 1.08 | 0.95 | 0.90 | 1.01 |
| Max | 1.31 | 1.54 | 3.33 | 1.10 | 1.05 | 1.33 |
| Min | 1.00 | 0.71 | 0.38 | 0.30 | 0.66 | 0.80 |
| SD | 0.09 | 0.17 | 0.61 | 0.18 | 0.10 | 0.10 |
| Catchup | ||||||
|---|---|---|---|---|---|---|
| Countries | 2010=>2011 | 2011=>2012 | 2012=>2013 | 2013=>2014 | 2014=>2015 | Average |
| China | 1.00 | 1.00 | 1.00 | 1.00 | 1.00 | 1.00 |
| India | 0.96 | 1.03 | 1.00 | 1.04 | 1.03 | 1.01 |
| USA | 1.00 | 1.00 | 1.00 | 1.00 | 1.00 | 1.00 |
| Indonesia | 1.03 | 1.02 | 1.02 | 1.02 | 1.01 | 1.02 |
| Brazil | 1.02 | 0.90 | 1.06 | 0.92 | 1.00 | 0.98 |
| Russia | 1.00 | 0.98 | 1.15 | 0.88 | 1.01 | 1.01 |
| Japan | 1.00 | 1.00 | 1.00 | 1.00 | 1.00 | 1.00 |
| Mexico | 0.98 | 0.96 | 1.02 | 1.00 | 1.01 | 0.99 |
| Germany | 0.95 | 0.99 | 1.07 | 1.00 | 0.97 | 1.00 |
| France | 0.85 | 1.07 | 1.10 | 1.00 | 0.93 | 0.99 |
| UK | 1.00 | 1.00 | 1.00 | 1.00 | 1.00 | 1.00 |
| Italy | 1.00 | 1.00 | 1.00 | 1.00 | 1.00 | 1.00 |
| South Africa | 1.00 | 1.00 | 1.00 | 1.00 | 1.00 | 1.00 |
| Colombia | 1.00 | 1.00 | 1.00 | 1.00 | 1.00 | 1.00 |
| Poland | 1.00 | 1.00 | 1.00 | 1.00 | 1.00 | 1.00 |
| Canada | 0.78 | 1.14 | 1.12 | 1.00 | 1.00 | 1.01 |
| Saudi Arabia | 1.00 | 1.00 | 1.00 | 1.00 | 1.00 | 1.00 |
| Average | 0.97 | 1.00 | 1.03 | 0.99 | 1.00 | 1.00 |
| Max | 1.03 | 1.14 | 1.15 | 1.04 | 1.03 | 1.02 |
| Min | 0.78 | 0.90 | 1.00 | 0.88 | 0.93 | 0.98 |
| SD | 0.06 | 0.05 | 0.05 | 0.04 | 0.02 | 0.01 |
| Frontier | ||||||
|---|---|---|---|---|---|---|
| Countries | 2010=>2011 | 2011=>2012 | 2012=>2013 | 2013=>2014 | 2014=>2015 | Average |
| China | 1.10 | 1.01 | 1.04 | 1.01 | 1.01 | 1.04 |
| India | 1.05 | 0.99 | 1.01 | 0.99 | 0.99 | 1.01 |
| USA | 0.98 | 1.86 | 0.38 | 0.97 | 0.98 | 1.03 |
| Indonesia | 1.03 | 1.02 | 1.00 | 0.99 | 0.99 | 1.01 |
| Brazil | 1.14 | 1.01 | 0.91 | 1.05 | 0.96 | 1.02 |
| Russia | 1.02 | 1.02 | 0.98 | 1.00 | 0.99 | 1.00 |
| Japan | 1.04 | 1.02 | 0.90 | 0.98 | 0.97 | 0.98 |
| Mexico | 1.03 | 1.02 | 0.99 | 1.00 | 0.98 | 1.00 |
| Germany | 1.10 | 1.00 | 0.95 | 1.04 | 0.97 | 1.01 |
| France | 1.30 | 0.87 | 0.95 | 1.01 | 0.94 | 1.01 |
| UK | 1.00 | 1.01 | 1.02 | 1.06 | 0.95 | 1.01 |
| Italy | 1.08 | 1.13 | 1.00 | 1.00 | 0.98 | 1.04 |
| South Africa | 1.00 | 1.02 | 1.01 | 0.87 | 1.03 | 0.99 |
| Colombia | 1.08 | 1.00 | 1.02 | 1.00 | 1.00 | 1.02 |
| Poland | 1.02 | 0.99 | 1.00 | 1.00 | 1.00 | 1.00 |
| Canada | 1.34 | 0.90 | 0.89 | 0.96 | 0.97 | 1.01 |
| Saudi Arabia | 1.00 | 0.97 | 1.02 | 1.00 | 1.00 | 1.00 |
| Average | 1.08 | 1.05 | 0.95 | 1.00 | 0.98 | 1.01 |
| Max | 1.34 | 1.86 | 1.04 | 1.06 | 1.03 | 1.04 |
| Min | 0.98 | 0.87 | 0.38 | 0.87 | 0.94 | 0.98 |
| SD | 0.10 | 0.21 | 0.15 | 0.04 | 0.02 | 0.01 |
© 2017 by the authors. Licensee MDPI, Basel, Switzerland. This article is an open access article distributed under the terms and conditions of the Creative Commons Attribution (CC BY) license (http://creativecommons.org/licenses/by/4.0/).
Share and Cite
Wang, C.-N.; Ho, H.-X.T.; Hsueh, M.-H. An Integrated Approach for Estimating the Energy Efficiency of Seventeen Countries. Energies 2017, 10, 1597. https://doi.org/10.3390/en10101597
Wang C-N, Ho H-XT, Hsueh M-H. An Integrated Approach for Estimating the Energy Efficiency of Seventeen Countries. Energies. 2017; 10(10):1597. https://doi.org/10.3390/en10101597
Chicago/Turabian StyleWang, Chia-Nan, Hong-Xuyen Thi Ho, and Ming-Hsien Hsueh. 2017. "An Integrated Approach for Estimating the Energy Efficiency of Seventeen Countries" Energies 10, no. 10: 1597. https://doi.org/10.3390/en10101597
APA StyleWang, C.-N., Ho, H.-X. T., & Hsueh, M.-H. (2017). An Integrated Approach for Estimating the Energy Efficiency of Seventeen Countries. Energies, 10(10), 1597. https://doi.org/10.3390/en10101597