A Comparative Study on Damage Mechanism of Sandwich Structures with Different Core Materials under Lightning Strikes

 ,
,
Abstract
:
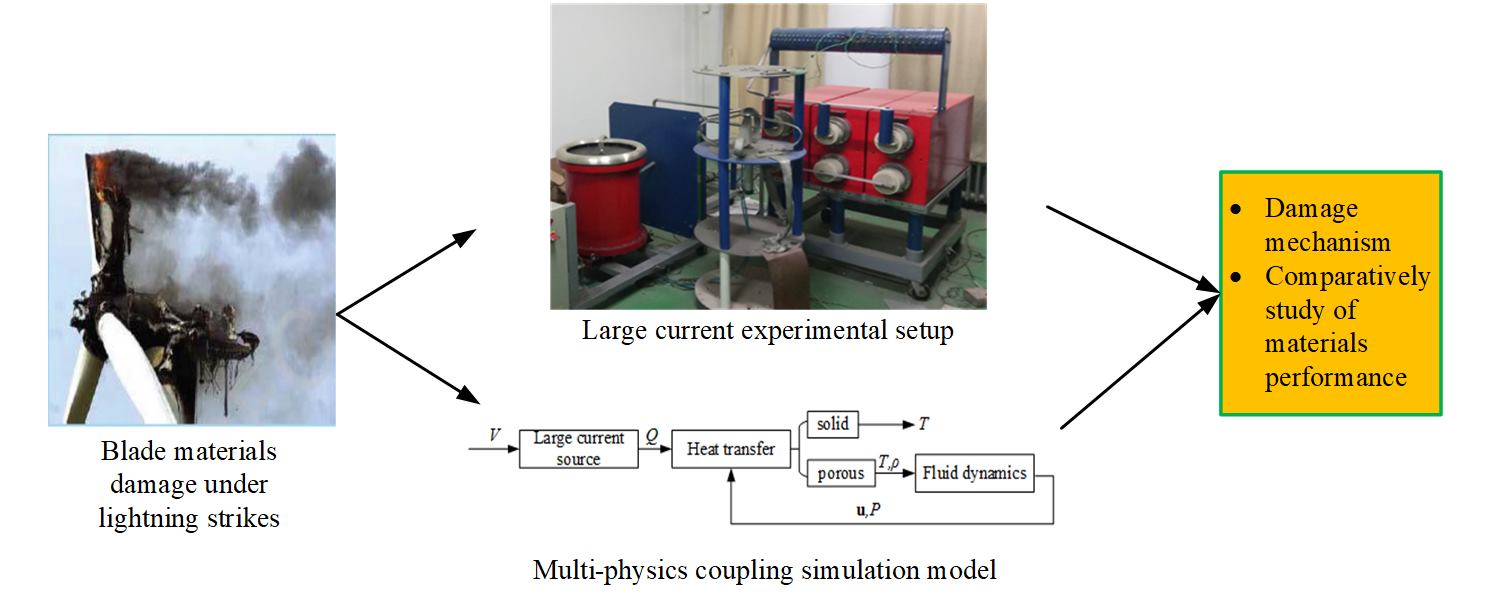
1. Introduction
2. Large Current Experiments
2.1. Experimental Methods
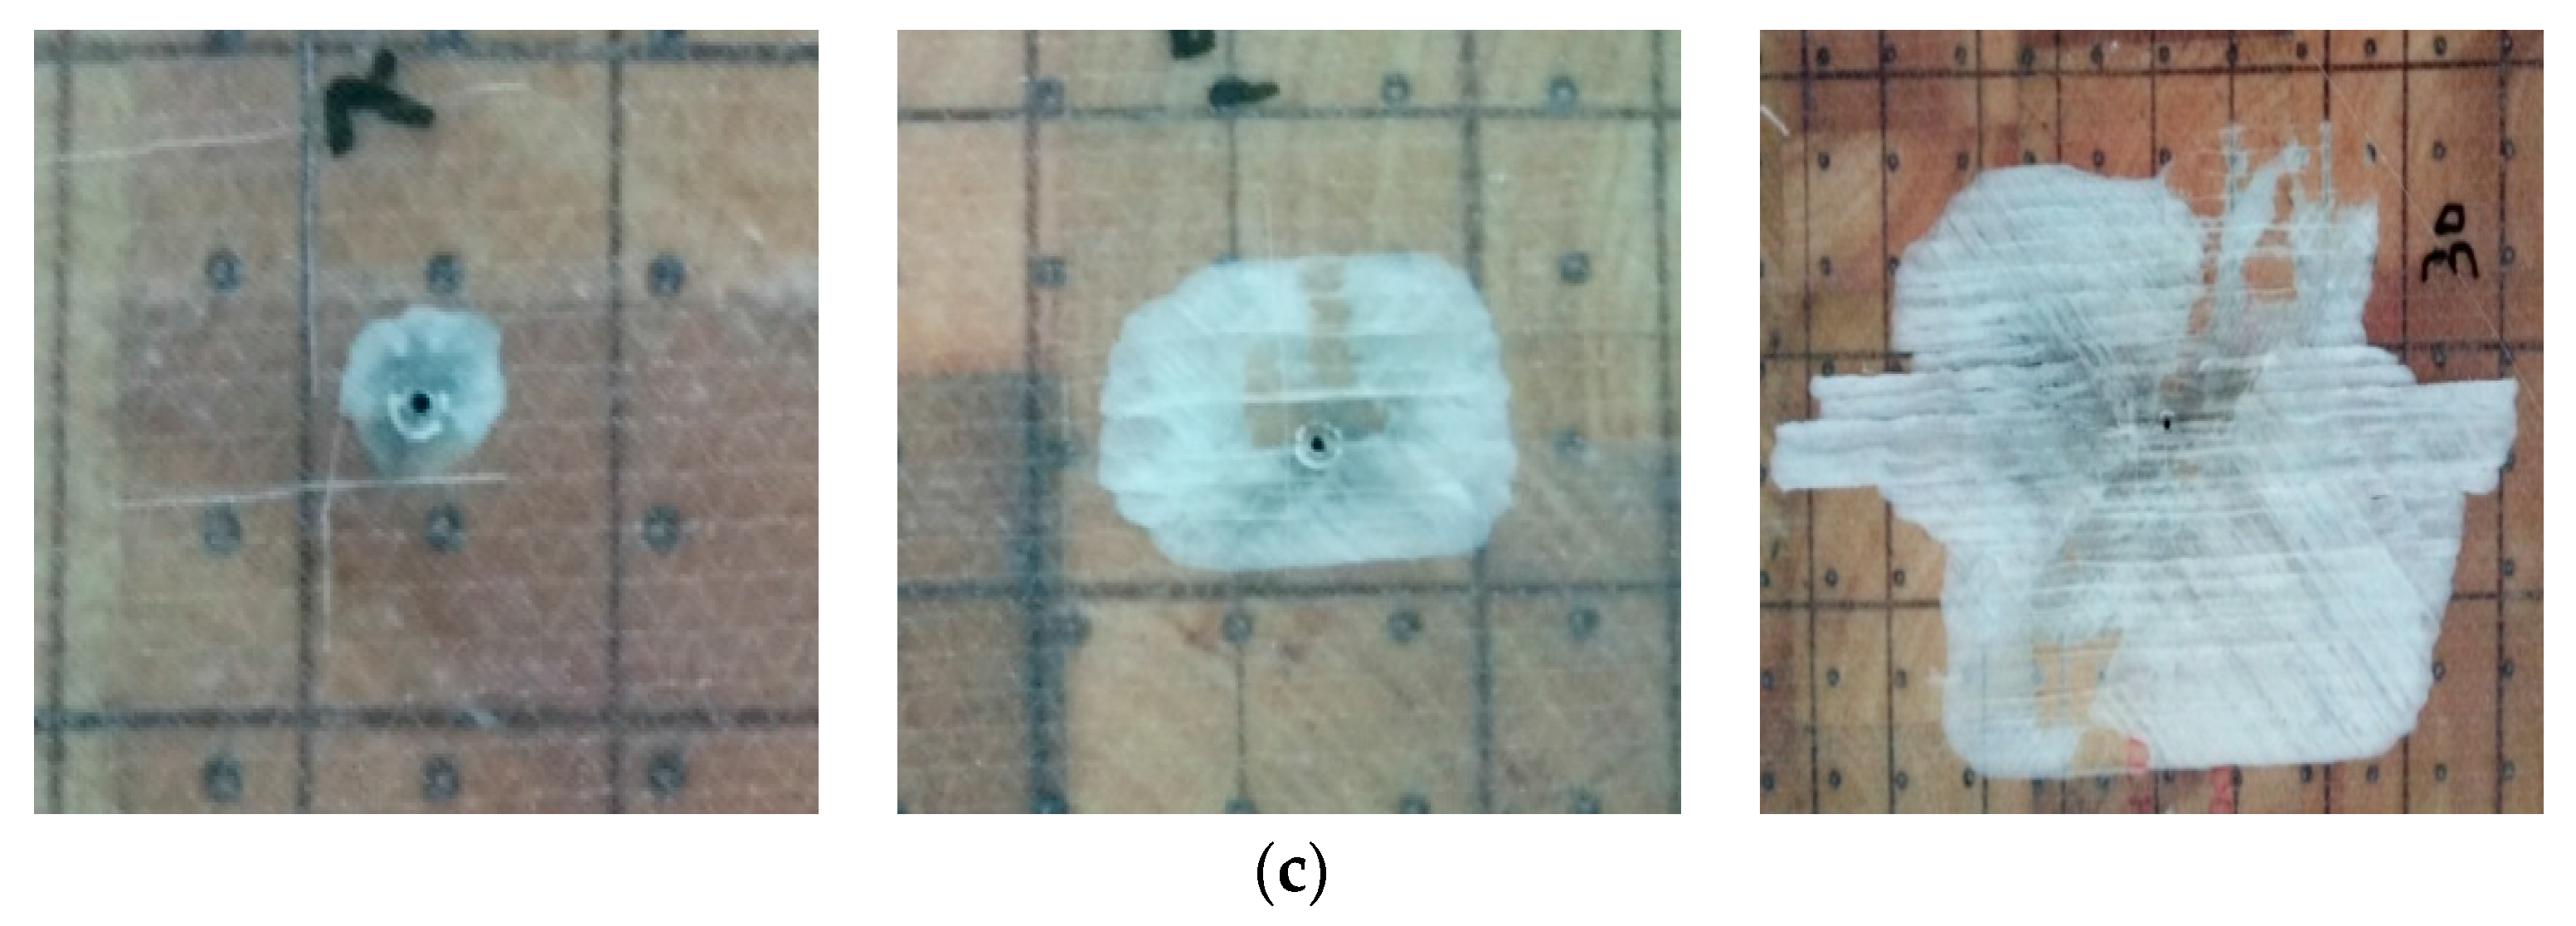
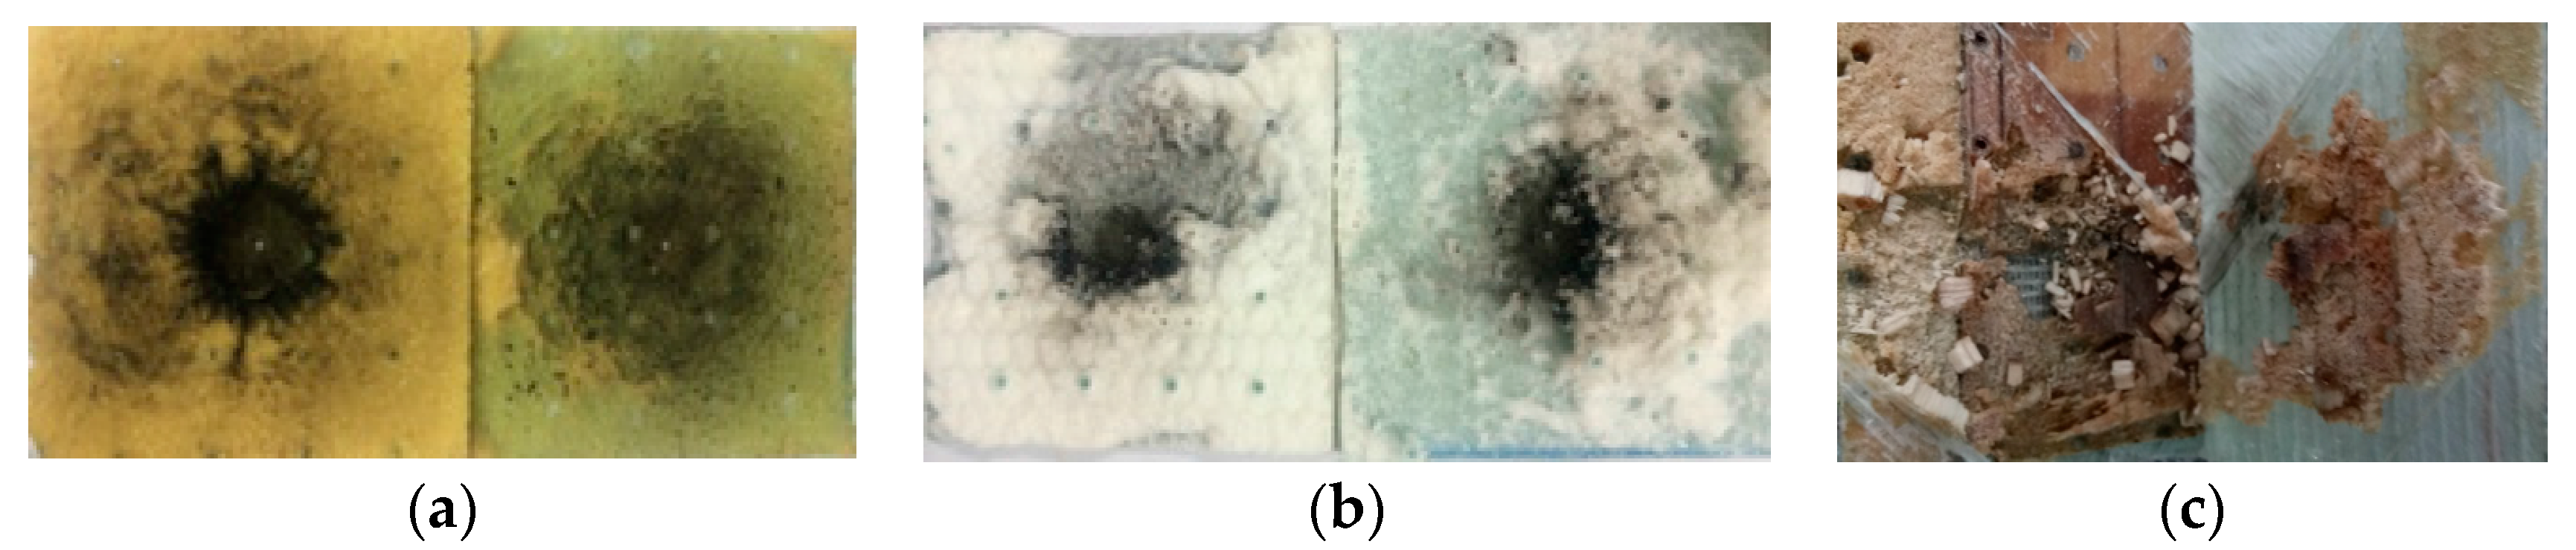
2.2. Results and Discussion
3. Numerical Study on the Temperature and Pressure Distribution
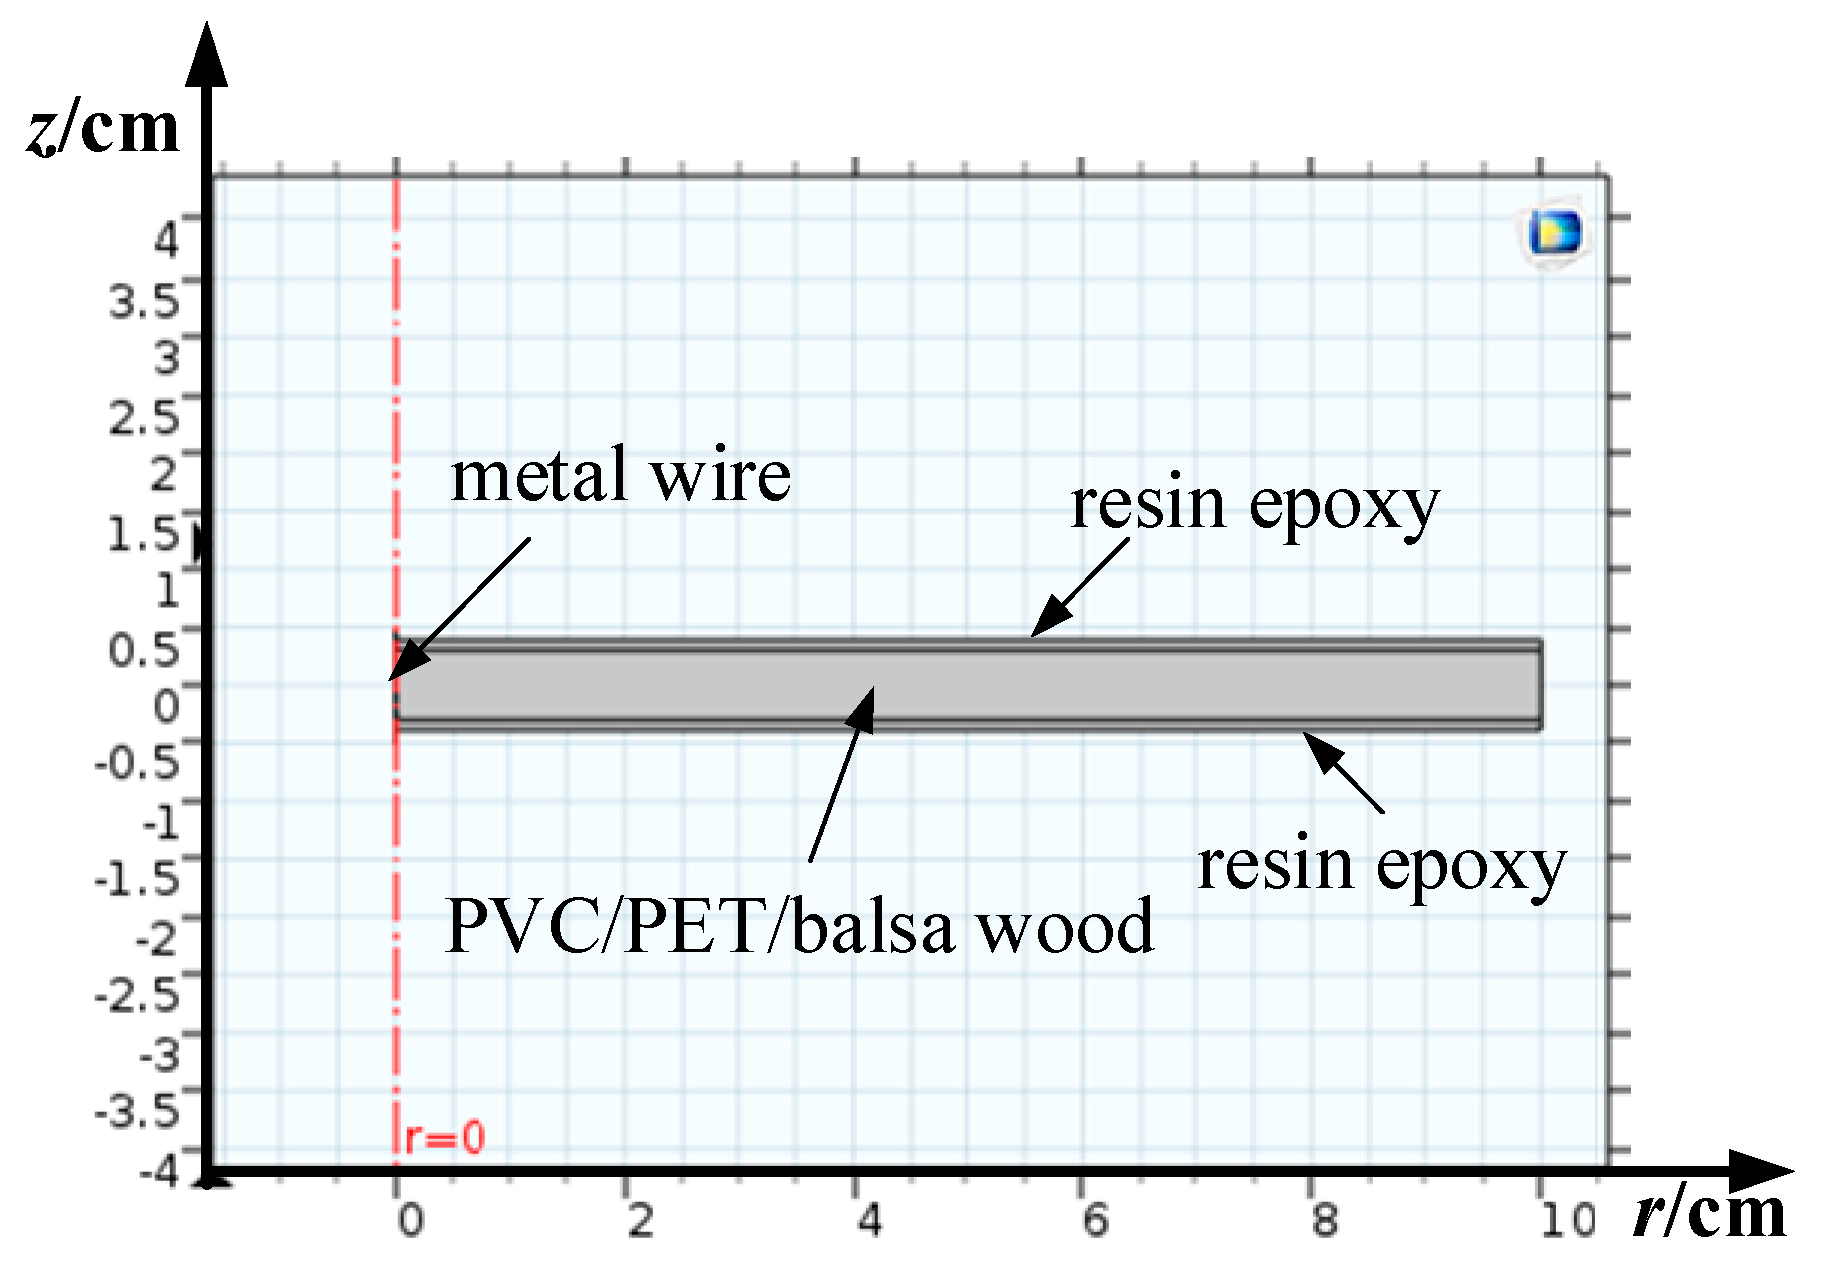
3.1. Simulation Model
3.1.1. Geometry Model
3.1.2. Large Current Source
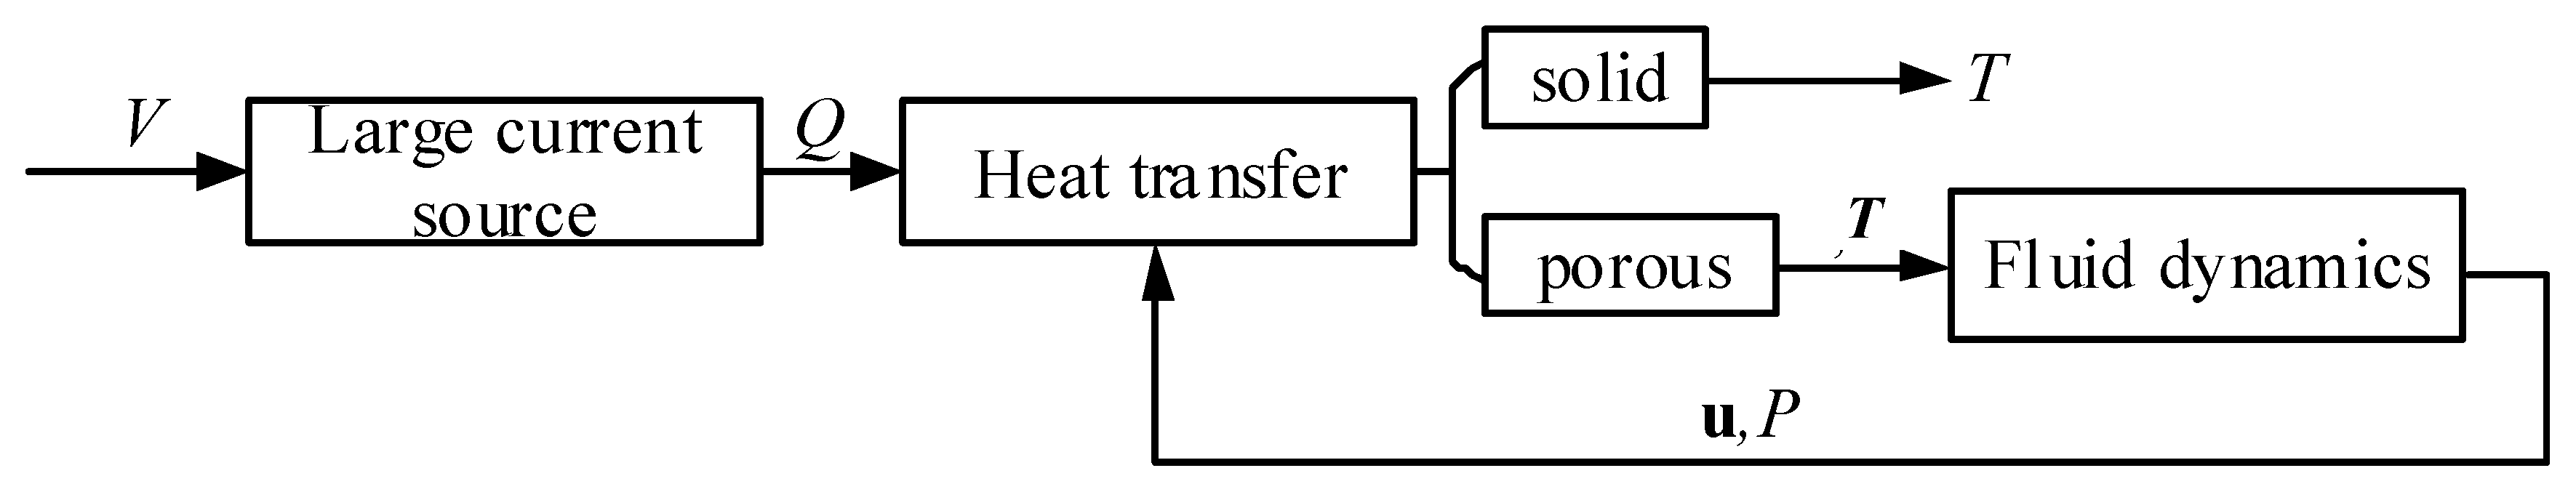
3.1.3. Heat Transfer in Solids, Porous Materials
3.1.4. Fluid Dynamics in Porous Materials
3.1.5. Multi-Physics Coupling
3.2. Simulation Results
3.2.1. Temperature Distribution
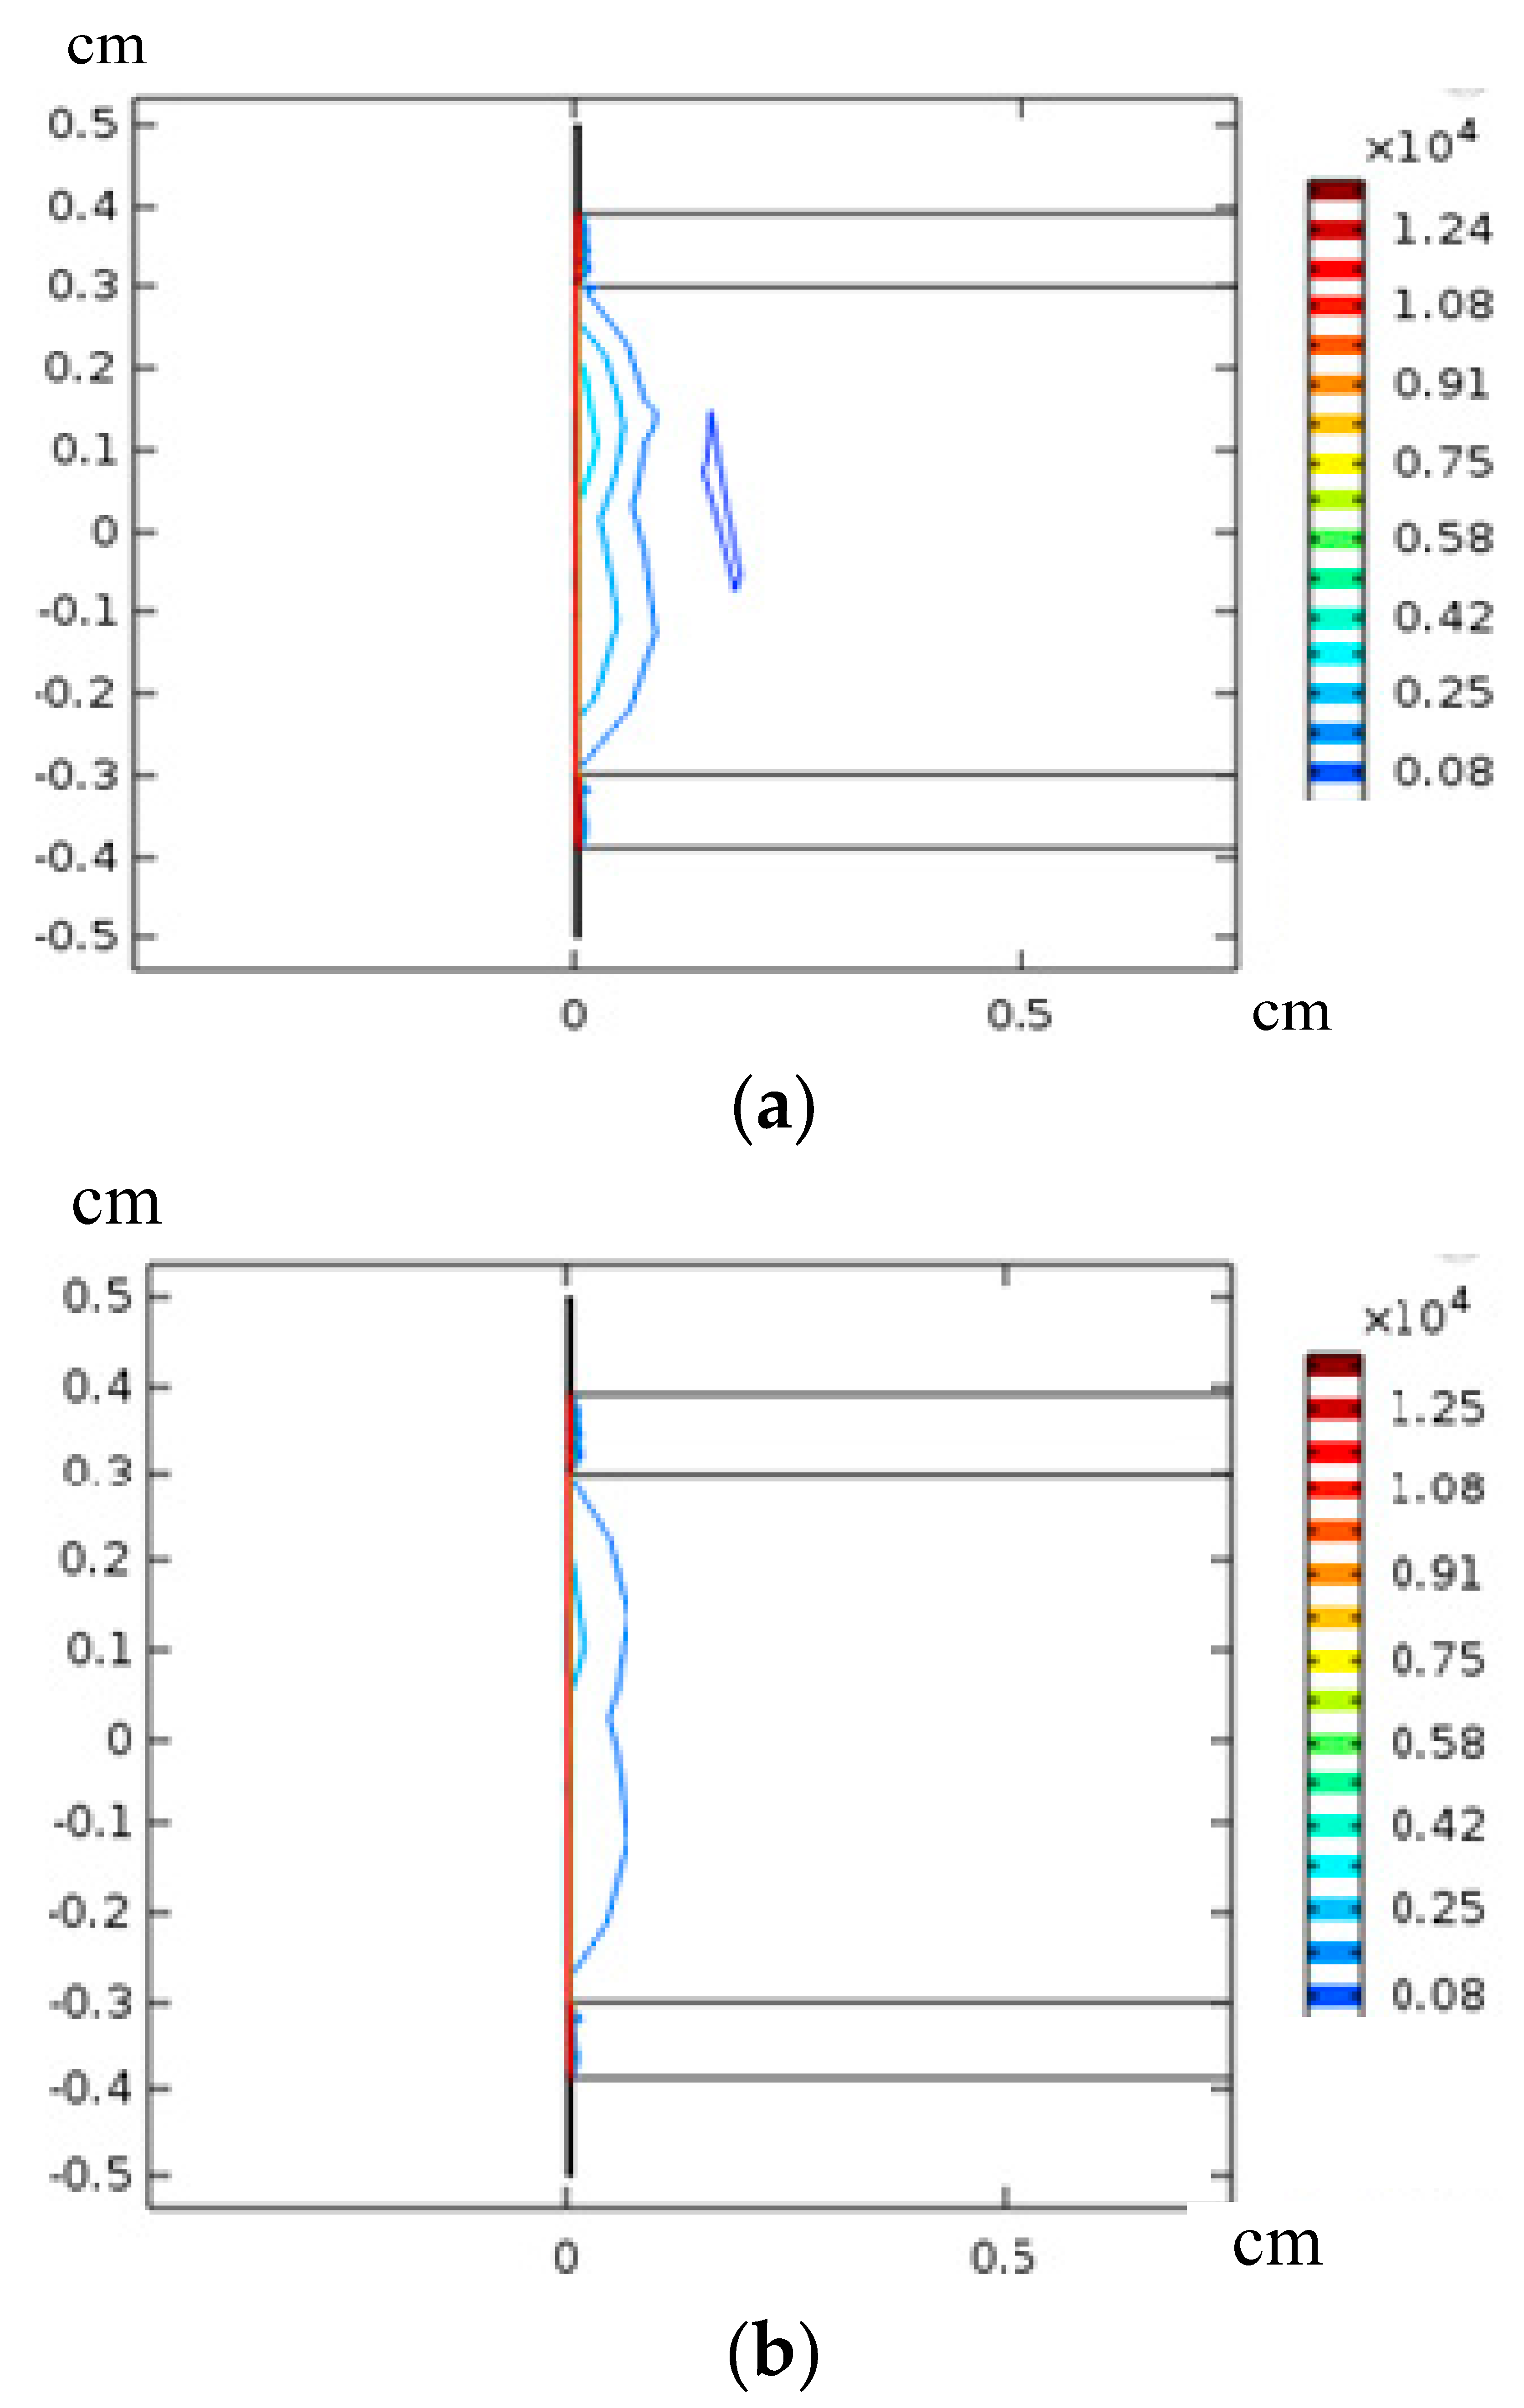
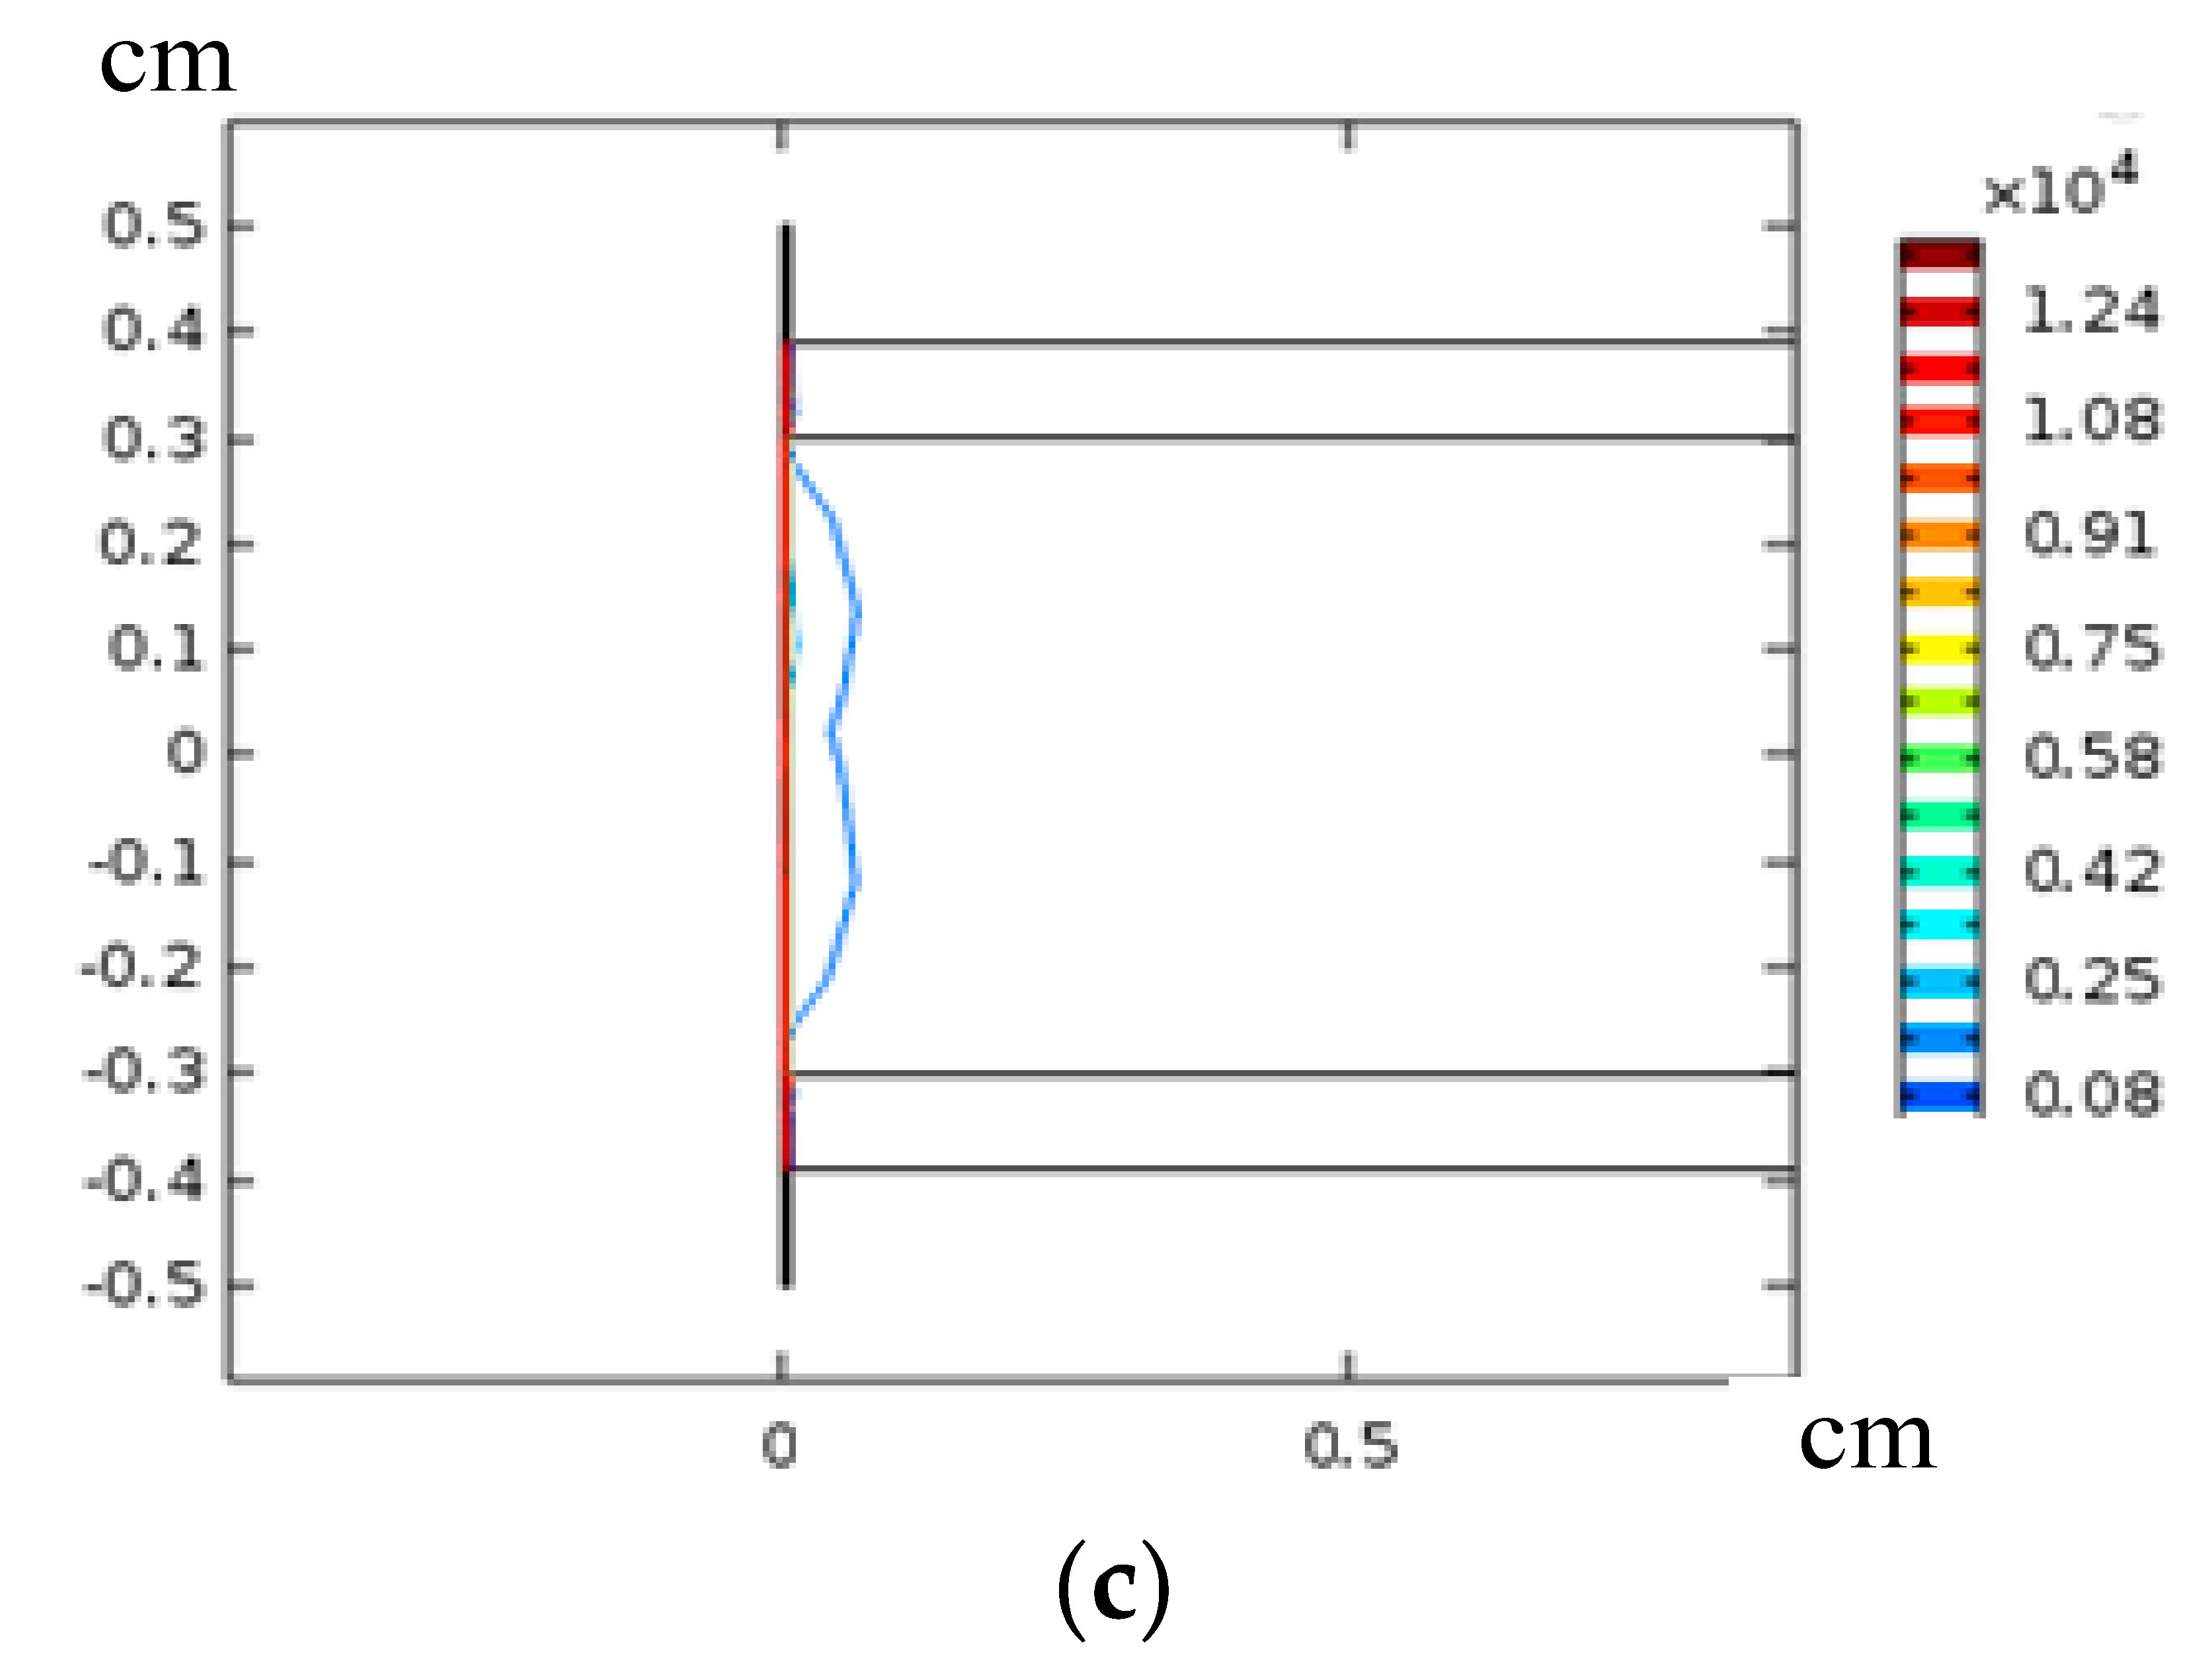
3.2.2. Pressure Distribution
3.2.3. Influence of Porosity, Permeability
4. Conclusions
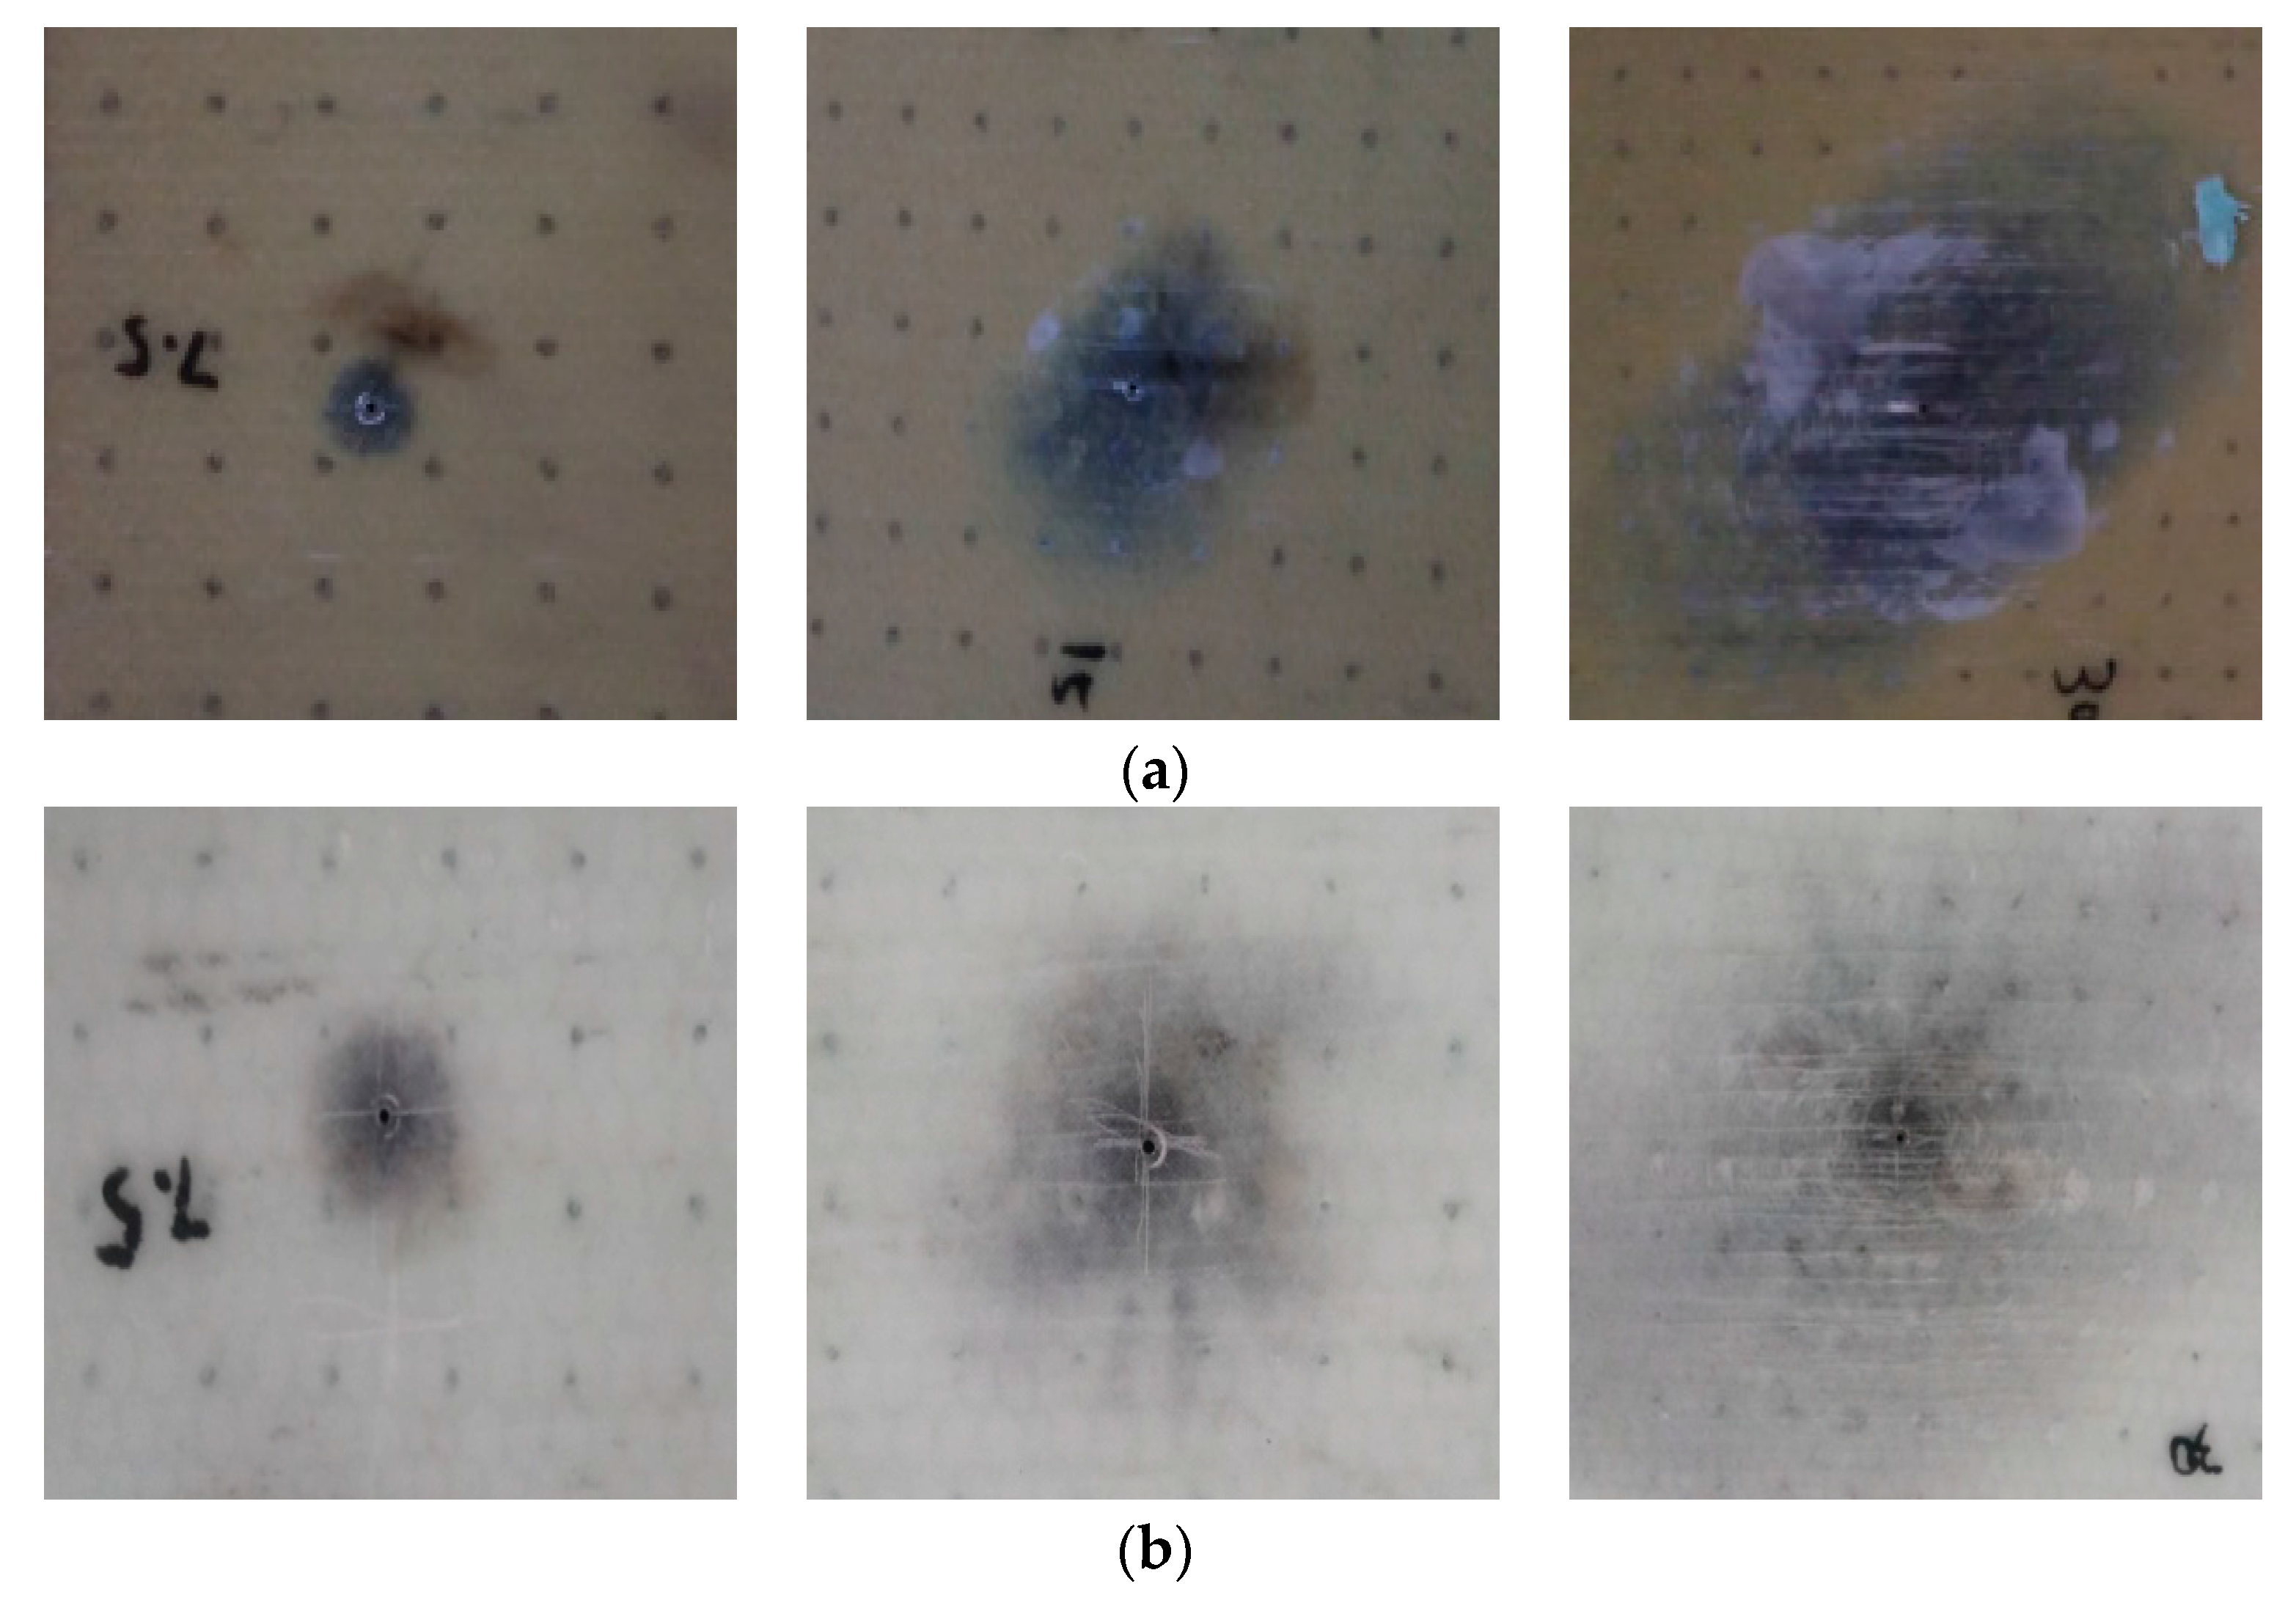
- PVC, PET and balsa wood all underwent severe damage under a large current, but their damage types were different: PVC and PET suffered serious pyrolysis and cracks inside, while the damage of the balsa wood sample involved fibers breaking off and large delamination at its interface with the resin layer. Balsa wood was burnt only in a little under the experimental current used.
- Porous materials transferred heat much faster than the resin layer, because the fast air-flow convection under the thermal impact from lightning strongly promoted heat transfer in the porous material layer.
- PVC sample had highest average value of temperature and pressure because of its highest air fraction and airflow convection, so it suffered the biggest mechanical damage and chemical damage; and balsa wood suffered relatively less chemical damage because of its higher glass transition temperature. Balsa wood is very soft, which makes it good at reducing the expansion pressure inside, while bad bonding between it and resin layer resulted in large delamination at the interface with the resin. However, when the energy of the lightning current is extremely large, balsa wood usually catches fire more likely than PVC and PET because of its own characteristics, and under the worst conditions, this fire can last for a long time and cause a serious fire hazard.
- If the gas fraction of the porous materials is decreased, that is, the solid fraction is increased, the heat transfer by gas convection in the porous materials can be decreased. Then the damaged area can be reduced and more energy goes out by the current channels to the outside environment in practice. This is a good way to reduce the scale of damage to porous materials under lightning strike conditions.
Acknowledgments
Author Contributions
Conflicts of Interest
References
- Candela, G.A.; Find, M.S.; Nissim, M. Lightning damage to wind turbine blades from wind farms in the U.S. IEEE Trans. Power Deliv. 2016, 31, 1043–1049. [Google Scholar] [CrossRef]
- Napolitano, F.; Paolone, M.; Borghetti, A. Models of wind-turbine main-shaft bearings for the development of specific lightning protection systems. IEEE Trans. Electromagn. Compat. 2011, 53, 99–107. [Google Scholar] [CrossRef]
- Rodrigues, B.; Mendes, F.; Catalão, S. Protection of wind energy systems against the indirect effects of lightning. Renew. Energy 2011, 36, 2888–2996. [Google Scholar] [CrossRef]
- Li, X.; Wang, J.; Wang, Y. Lightning transient characteristics of cable power collection system in wind power plants. IET Renew. Power Gener. 2015, 9, 1025–1032. [Google Scholar] [CrossRef]
- Candela, G.A. Lightning Protection of Flap System for Wind Turbine Blades. Ph.D. Thesis, Technical University of Denmark, Lyngby, Denmark, 2014. [Google Scholar]
- Yokoyama, S.; Yasuda, Y.; Minowa, M.; Sekioka, S. Clarification of the mechanism of wind turbine blade damage taking lightning characteristics into consideration and relevant research project. In Proceedings of the International Conference on Lightning Protection (ICLP), Vienna, Austria, 2–7 September 2012. [Google Scholar]
- Yasuda, Y.; Yokoyama, S.; Idenno, M. Verification of lightning damage classification to wind turbine blades. In Proceedings of the International Conference on Lightning Protection (ICLP), Vienna, Austria, 2–7 September 2012. [Google Scholar]
- Arinaga, S.; Tsutsumi, K. Experimental study on lightning protection methods for wind turbine blades. In Proceedings of the International Conference on Lightning Protection, Kanazawa, Japan, 18–22 September 2006. [Google Scholar]
- Yokoyama, S. Lightning protection of wind turbine blades. Electr. Power Syst. Res. 2013, 94, 3–9. [Google Scholar] [CrossRef]
- Zhou, M.; Wang, J.; Fan, Y. Experimental study of lightning strike attachment characteristics on wind turbine generators. In Proceedings of the International Conference on Lightning Protection (ICLP), Estoril, Portugal, 25–30 September 2017. [Google Scholar]
- Long, M. On the Attachment of Lightning Flashes to Wind Turbines. Ph.D. Thesis, KTH Royal Institute of Technology, Stockholm, Sweden, 2016. [Google Scholar]
- Yan, J.; Li, Q.; Guo, Z. Puncture position on wind turbine blades and arc path evolution under lightning strikes. Mater. Des. 2017, 122, 197–205. [Google Scholar] [CrossRef]
- International Electrotechnical Commission. IEC 61400-24: 2010: Wind Turbines—Part 24: Lightning Protection; IEC: Geneva, Switzerland, 2010. [Google Scholar]
- Rachidi, F. A Review of current issues in lightning protection of new generation wind-turbine blades. IEEE Trans. Ind. Electron. 2008, 55, 2489–2496. [Google Scholar] [CrossRef]
- Radicevi, M.; Savic, S.; Madsen, F.; Badea, I. Impact of wind turbine blade rotation on the lightning strike incidence—A theoretical and experimental study using a reduced-size model. Energy 2012, 25, 644–654. [Google Scholar] [CrossRef]
- Inoue, K.; Korematsu, Y.; Nakamura, N. Study on damage-mechanism of wind turbine blades by lightning strike. In Proceedings of the International Conference on Lightning Protection, Kanazawa, Japan, 18–22 September 2006. [Google Scholar]
- Goda, Y.; Tanaka, S.; Ohtaka, T. Arc Tests of wind turbine blades simulating high energy lightning strike. In Proceedings of the International Conference on Lightning Protection, Uppsala, Sweden, 23–26 June 2008. [Google Scholar]
- Ogasawara, T.; Hirano, Y.; Yoshimura, A. Coupled Thermal–Electrical analysis for carbon fiber epoxy composites exposed. Compos. Part A 2010, 41, 973–981. [Google Scholar] [CrossRef]
- Feraboli, P.; Miller, M. Damage resistance and tolerance of carbon/epoxy composite coupons subjected to simulated lightning strike. Compos. Part A Appl. Sci. Manuf. 2009, 40, 954–967. [Google Scholar] [CrossRef]
- Yan, J.; Li, Q.; Guo, Z. Damage mechanism of PVC and balsa wood used in wind turbine blade under thermal effect of lightning strikes. In Proceedings of the International Conference on Lightning Protection (ICLP), Estoril, Portugal, 25–30 September 2016. [Google Scholar]
- Wang, Y.; Zhupanska, I. Lightning strike thermal damage model for glass fiber reinforced polymer matrix composites and its application to wind turbine blades. Compos. Struct. 2015, 132, 1182–1191. [Google Scholar] [CrossRef]
- Ding, N.; Zhao, B.; Liu, Z. Simulation of ablation damage of composite laminates subjected to lightning strikes. Acta Aeronaut. Astronaut. Sin. 2013, 34, 301–308. (In Chinese) [Google Scholar]
- Ding, N.; Zhao, B. Analysis of damage influence factors on ablation damage of composite laminates subjected to lightning strikes. Trans. Mater. Heat Treat. 2014, 35, 186–192. (In Chinese) [Google Scholar]
- Yu, C. Numerical Analysis of Heat and Mass Transfer for Porous Materials; Tsinghua University Press: Beijing, China, 2011. [Google Scholar]


| Materials | Type | Thermal Conductivity, k, W/(m·K) | Specific Heat, C, J/(kg·K) | Density, ρ, kg/m3 | Glass Transition Degree, Tg, K | Solid Fraction θ (%) |
|---|---|---|---|---|---|---|
| Epoxy resin | SWANCOR 2511-1A/1BS | 0.4749 | 989.58 | 1200 | 363 | 100 |
| PVC | 3A C70.55 | 0.0331 | 1003 | 66 | 355 | 8 |
| PET | 3A T92.100 | 0.0399 | 1166 | 98 | 340 | 13 |
| Balsa wood | 3A SB100 | 0.0803/0.0661 | 1047 | 92 | 543 | 11 |
| Current Peak Value (kA) | 6.28 | 12.56 | 21 | |||
|---|---|---|---|---|---|---|
| cd | md | cd | md | cd | md | |
| PVC | 0.11 | 0.50 | 0.35 | 3.5 | 1.7 | 6.10 |
| PET | 0.07 | 0.45 | 0.21 | 3.0 | 1.5 | 5.50 |
| Balsa wood | 0.01 | 0.75 | 0.09 | 4.1 | 0.39 | 7.50 |
| Solid Fraction | 1 Time | 2 Times | 3 Times | 5 Times |
|---|---|---|---|---|
| PVC | 0 | 22.5 | 68.7 | 72.6 |
| PET | 0 | 17.7 | 70 | 73.3 |
| Balsa wood | 0 | 30.7 | 49.3 | 86.7 |
| Solid Fraction | 1 Time | 2 Times | 3 Times | 5 Times |
|---|---|---|---|---|
| PVC | 0 | 2.6 | 5.1 | 23.1 |
| PET | 0 | 3.6 | 22.1 | 26.3 |
| Balsa wood | 0 | 3.2 | 20.6 | 25.9 |
© 2017 by the authors. Licensee MDPI, Basel, Switzerland. This article is an open access article distributed under the terms and conditions of the Creative Commons Attribution (CC BY) license (http://creativecommons.org/licenses/by/4.0/).
Share and Cite
Yan, J.; Wang, G.; Li, Q.; Zhang, L.; Yan, J.D.; Chen, C.; Fang, Z. A Comparative Study on Damage Mechanism of Sandwich Structures with Different Core Materials under Lightning Strikes. Energies 2017, 10, 1594. https://doi.org/10.3390/en10101594
Yan J, Wang G, Li Q, Zhang L, Yan JD, Chen C, Fang Z. A Comparative Study on Damage Mechanism of Sandwich Structures with Different Core Materials under Lightning Strikes. Energies. 2017; 10(10):1594. https://doi.org/10.3390/en10101594
Chicago/Turabian StyleYan, Jiangyan, Guozheng Wang, Qingmin Li, Li Zhang, Joseph D. Yan, Chun Chen, and Zhiyang Fang. 2017. "A Comparative Study on Damage Mechanism of Sandwich Structures with Different Core Materials under Lightning Strikes" Energies 10, no. 10: 1594. https://doi.org/10.3390/en10101594
APA StyleYan, J., Wang, G., Li, Q., Zhang, L., Yan, J. D., Chen, C., & Fang, Z. (2017). A Comparative Study on Damage Mechanism of Sandwich Structures with Different Core Materials under Lightning Strikes. Energies, 10(10), 1594. https://doi.org/10.3390/en10101594