Article

An Integrated Approach for Estimating the Energy Efficiency of Seventeen Countries

by
Chia-Nan Wang
1,*,
Hong-Xuyen Thi Ho
1,2,* and
Ming-Hsien Hsueh
1,*
1
Department of Industrial Engineering and Management, National Kaohsiung University of Applied Sciences, Kaohsiung 80778, Taiwan
2
Department of Economics, Ho Chi Minh City University of Technology and Education, Ho Chi Minh City 800010, Vietnam
*
Authors to whom correspondence should be addressed.
Energies 2017, 10(10), 1597; https://doi.org/10.3390/en10101597
Submission received: 13 September 2017 / Revised: 27 September 2017 / Accepted: 3 October 2017 / Published: 13 October 2017
(This article belongs to the Special Issue Industrial Energy Efficiency 2018)

Abstract

:
Increased energy efficiency is one of the most effective ways to achieve climate change mitigation. This study aims to evaluate the energy efficiency of seventeen countries. The evaluation is based on an integrated method that combines the super slack-based (super SBM) model and the Malmquist productivity index (MPI) to investigate the energy efficiency of seventeen countries during the period of 2010–2015. The results in this study are that the United States, Columbia, Japan, China, and Saudi Arabia perform the best in energy efficiency, whereas Brazil, Russia, Indonesia, and India perform the worst during the entire sample period. The energy efficiency of these countries arrived mainly from technological improvement. The study provides suggestions for the seventeen countries’ government to control the energy consumption and contribute to environmental protection.

1. Introduction

Energy consumption and greenhouse gases are directly related to global warming and climate change. At present, due to the world’s considerable economic growth, energy production is considered to have a key role in the economic development of many countries. However, energy production growth has led some nations to expend more costs with environmental pollution. Between the 1990s and 2005, the International Energy Agency estimated that global final energy use increased by 23%, while the associated carbon dioxide (CO2) emissions rose by 25% [1]. Moreover, according to the U.S. Energy Information Administration, world energy consumption will increase by as much as 48% between 2012 and 2040. It contributes to almost 26% of global greenhouse gas emissions [2]. Thus, to slow down energy consumption and to promote low-carbon output development, improving energy efficiency becomes one of the most effective choices. Nowadays, in order to obtain a strategy of environmental protection and economic growth, many countries’ governments have been implementing a package of policies to improve the energy efficiency. Ang [3] mentioned that energy efficiency performance can provide useful information for evaluating the effectiveness of energy efficiency polices. Furthermore, the measurement of the energy efficiency with the consideration of environmental factors can help to reduce energy consumption and mitigate environmental pollution [4].
Therefore, it would be interesting to examine the energy efficiency mode of more countries where energy consumption efficiency is of the greatest concern.
In the context of energy efficiency estimation, there are numerous different indicators to ascertain energy efficiency according to definitions given in literature reviews [4,5,6]. Wang et al. [7] pointed out that energy efficiency improvements, as well as environmental efficiency, are mainly based on the input factors of energy, capital, labor, and the economic output factor of gross domestic product (GDP). Zhou and Ang [8] mentioned that input variables involve capital stock, and labor force; and, output variables involve GDP and CO2 emissions, which are often used to measure energy efficiency. Zhou et al. [9] showed that total labor force, total primary energy consumption, and capital stock are considered to be inputs; and, GDP and CO2 emissions are considered as outputs. Lin and Zheng [10] posed in their work the impact of industrial polices to improve energy efficiency in China’s paper industry. The factors of energy, labor, capital, and gross industrial were all included as input and output factors in their study. Among the studies for G7 countries, Narayan and Smyth [11] found that capital formation, energy consumption, and real GDP are major factors affecting economic growth and environmental problem. In a study of African countries, Wolde-Rufael [12] pointed out that real GDP per capita, energy use per capita, gross capital formation per capita, and labor force are important factors of evaluating the causal effect of energy consumption on economic growth.
In the past few years, there is much research that has been done on energy efficiency through various methods. However, in dealing with multiple inputs and outputs used to investigate relative efficiency, data envelopment analysis (DEA) is most commonly used to study energy efficiency [13,14,15]. Some researchers have implemented the DEA approach to measure economic, environmental, and energy efficiency in countries and regions. For instance, Zhang et al. [6] applied a DEA window to examine the total factor energy efficiency in twenty-three developing countries during the time of 1980–2005. The paper pointed out that Botswana, Mexico, and Panama perform the best in terms of energy efficiency, while Kenya, Philippine, Sri Lanka, and Syria perform the worst in energy efficiency during the sample period. Zhang et al. [16] employed the Malmquist productivity index (MPI) in order to estimate energy efficiency, CO2 emissions performance, and technology gaps in fossil fuel electricity generation in Korea. Vlontzos et al. [17] estimated the energy and environmental efficiency of European countries by implementing DEA models for the period of 2001–2008. Ramanathan [18] analyzed the energy consumption and carbon dioxide emissions in seventeen countries of the Middle East and North Africa by means of the Malmquist productivity index (MPI) approach. Chen and Jia [19] applied the DEA based approach to measure the environmental efficiency of China’s regional industry. The results showed that the environmental efficiencies of China’s industry were generally low and did not show any increasing trend through the past five years. Li and Shi [20] improved the super slack-based model with environmental outputs to perform an energy efficiency analysis on various Chinese industrial sectors. They found that the energy efficiency of each industrial sector had improved substantially during the period from 2001 to 2010. Wu et al. [21] measured the industrial energy efficiency with CO2 emissions in China by means of DEA. Egilmez et al. [22] implemented DEA to analyze the sustainability performance and improve the energy efficiency of the U.S. manufacturing sector. Xue et al. [23] used DEA to investigate the total energy consumption efficiency of China’s construction industry. Wang et al. [24] integrated DEA models and grey forecasting methods to evaluate green logistics providers for sustainable development. Chang [25] applied DEA and directional distance function model to examine the overall efficiency of G7 and BRICS countries, including Canada, France, Germany, Italy, Japan, the United Kingdom, the United States, Brazil, Russia, India, China, and South Africa. The study found out that G7 countries have higher efficiency than BRICS countries before 2005. Energy efficiency is not only about being “environmental friendly”, but it also promotes economic efficiency [26]. Therefore, it would be interesting to estimate the energy efficiency of one or more countries. Previous studies have shown clearly that there is a relationship between economic growth, energy, and the environment. In addition, energy consumption and CO2 emissions are factors that have an impact on the environment. As of yet, there has been no study to investigate the energy efficiency of countries, which in list of countries by carbon dioxide emissions including China, India, the United States, Indonesia, Brazil, Russia, Japan, Mexico, Germany, France, the United Kingdom, Italy, South Africa, Colombia, Poland, Canada, and Saudi Arabia by implementing an integration method. As such, this study proposes an effective approach, which combines the super SBM model and the Malmquist productivity index to estimate the energy efficiency of seventeen countries under consideration with and without undesirable factor during the period of 2010–2015. The performance estimation results from these two models may give a comprehensive view of overall energy and environmental productivity efficiency, technical efficiency, and technology efficiency of seventeen countries represented in this study. This research may help policy makers to improve energy efficiency, economic development, as well as to reduce environmental pollution.
The rest of this paper is organized as follows. Section 2 provides the proposed super SBM model and the Malmquist productivity index for the energy efficiency evaluation. Section 3 presents the data and describes the performance of seventeen countries in the period of 2010–2015. Section 4 summarizes and concludes the paper.

2. Methodologies

In this section, the study presents the super slack-based model, which is used to analyze the energy efficiency performance of seventeen countries that are central to this research. In addition, the Malmquist productivity index is implemented to measure the productivity efficiency, technical efficiency, and technology efficiency in time varying data of seventeen countries.

2.1. Super SBM Model

DEA is known as a useful method to measure the efficiencies of decision making units (DMUs). However, traditional DEA efficiency models cannot deal with undesirable outputs [27]. In fact, in the production process, desirable outputs and undesirable outputs are inevitable. Moreover, undesirable outputs are the most widely applied in the energy and environment efficiency measurement [28,29,30]. Tone [31] proposed a new measuring efficiency model based on slacks-based measure (SBM) model to give the super slacks-based measure (super SBM) model with undesirable outputs, which is implemented for assessing the efficiency of DMUs. Hence, the paper uses the super SBM model to investigate the energy efficiency coincident with CO2 emissions in seventeen countries. We consider that there are n DMUs, each of them has three factors: inputs, desirable outputs, and undesirable outputs.
Let x R m be the input vector, let Y g R s 2 and Y b R s 2 be the desirables and undesirables output vector, respectively. We define the matrices as follows:
X = [ x 1 , x 2 , x n ] R m × n ,
Y g = [ y 1 g , y 2 g , y n g ] R s 1 × n ,
Y b = [ y 1 b , y 2 b , y n b ] R s 2 × n ,
where X > 0 , Y g > 0 , Y b > 0 . Taking λ , S , S g , S b as the decision variables. According to Cooper et al. [32], the super SBM model dealing with undesirable outputs for assessing the efficiency of DMU is ( x 0 , y 0 g , y 0 b ) .
SBM model
ρ = min 1 1 m i = 1 m S i x i o 1 + 1 S 1 + S 2 ( r = 1 S 1 s r g y r 0 g + r = 1 S 2 s r b y r o b ) ,
x 0 = X λ + S y 0 g = Y λ g S g y 0 b = Y λ b + S b S , S g , S b , λ 0 ,
Subject to
δ = min 1 m i = 1 m x i x i 0 1 S 1 + S 2 ( r = 1 S 1 y r g y r o g + r = 1 S 2 y r b y r 0 b ) ,
Super SBM
x j = 1 , 0 n λ j x j y g j = 1 , 0 n λ j y j g y b j = 1 , 0 n λ j y j b x x 0 , y g y 0 g , y b y 0 b , y g 0 , λ 0 ,
Subject to
x j = 1 , 0 n λ j x j y g j = 1 , 0 n λ j y j g y b j = 1 , 0 n λ j y j b x x 0 , y g y 0 g , y b y 0 b , y g 0 , λ 0 ,

2.2. Malmquist Productivity Index

To evaluate the total energy performance of DMUs, this study applied the Malmquist productivity index (MPI) and the Malmquist carbon emission index extended by Färe et al. [14] and Zhou et al. [9]. We propose the energy efficiency performance overtime.
Let t and t + 1 refer to two time periods. Assume that D 0 t ( x 0 t + 1 , y 0 t + 1 ) and D 0 t + 1 ( x 0 t + 1 , y 0 t + 1 ) are the distance functions of the inputs and outputs at periods t for the environmental DEA technologies at t and t + 1 , respectively. The energy performance index is defined as follows:
M t t + 1 = [ D 0 t ( x 0 t + 1 , y 0 t + 1 ) D 0 t ( x 0 t , y 0 t ) D 0 t + 1 ( x 0 t + 1 , y 0 t + 1 ) D 0 t + 1 ( x 0 t , y 0 t ) ] 1 / 2 ,
where M t t + 1 is the index between periods t and t + 1 .
If M t t + 1 > 1 (or M t t + 1 < 1 ) indicates that the energy performance has increased or declined.
As Zhou et al. [9], the Malmquist carbon emissions performance index can be decomposed into two components: technical efficiency change (TEC) and the efficiency frontier change (FC).
T E C = D 0 t + 1 ( x 0 t + 1 , y 0 t + 1 ) D 0 t ( x 0 t , y 0 t ) ,
F C = [ D 0 t ( x 0 t + 1 , y 0 t + 1 ) D 0 t + 1 ( x 0 t + 1 , y 0 t + 1 ) D 0 t ( x 0 t , y 0 t ) D 0 t + 1 ( x 0 t , y 0 t ) ] 1 / 2 ,
Equation (4) evaluates the change in the energy efficiency index of DMUs.
Equation (5) evaluates the technology shifts from t to t + 1 .

2.3. Research Procedure

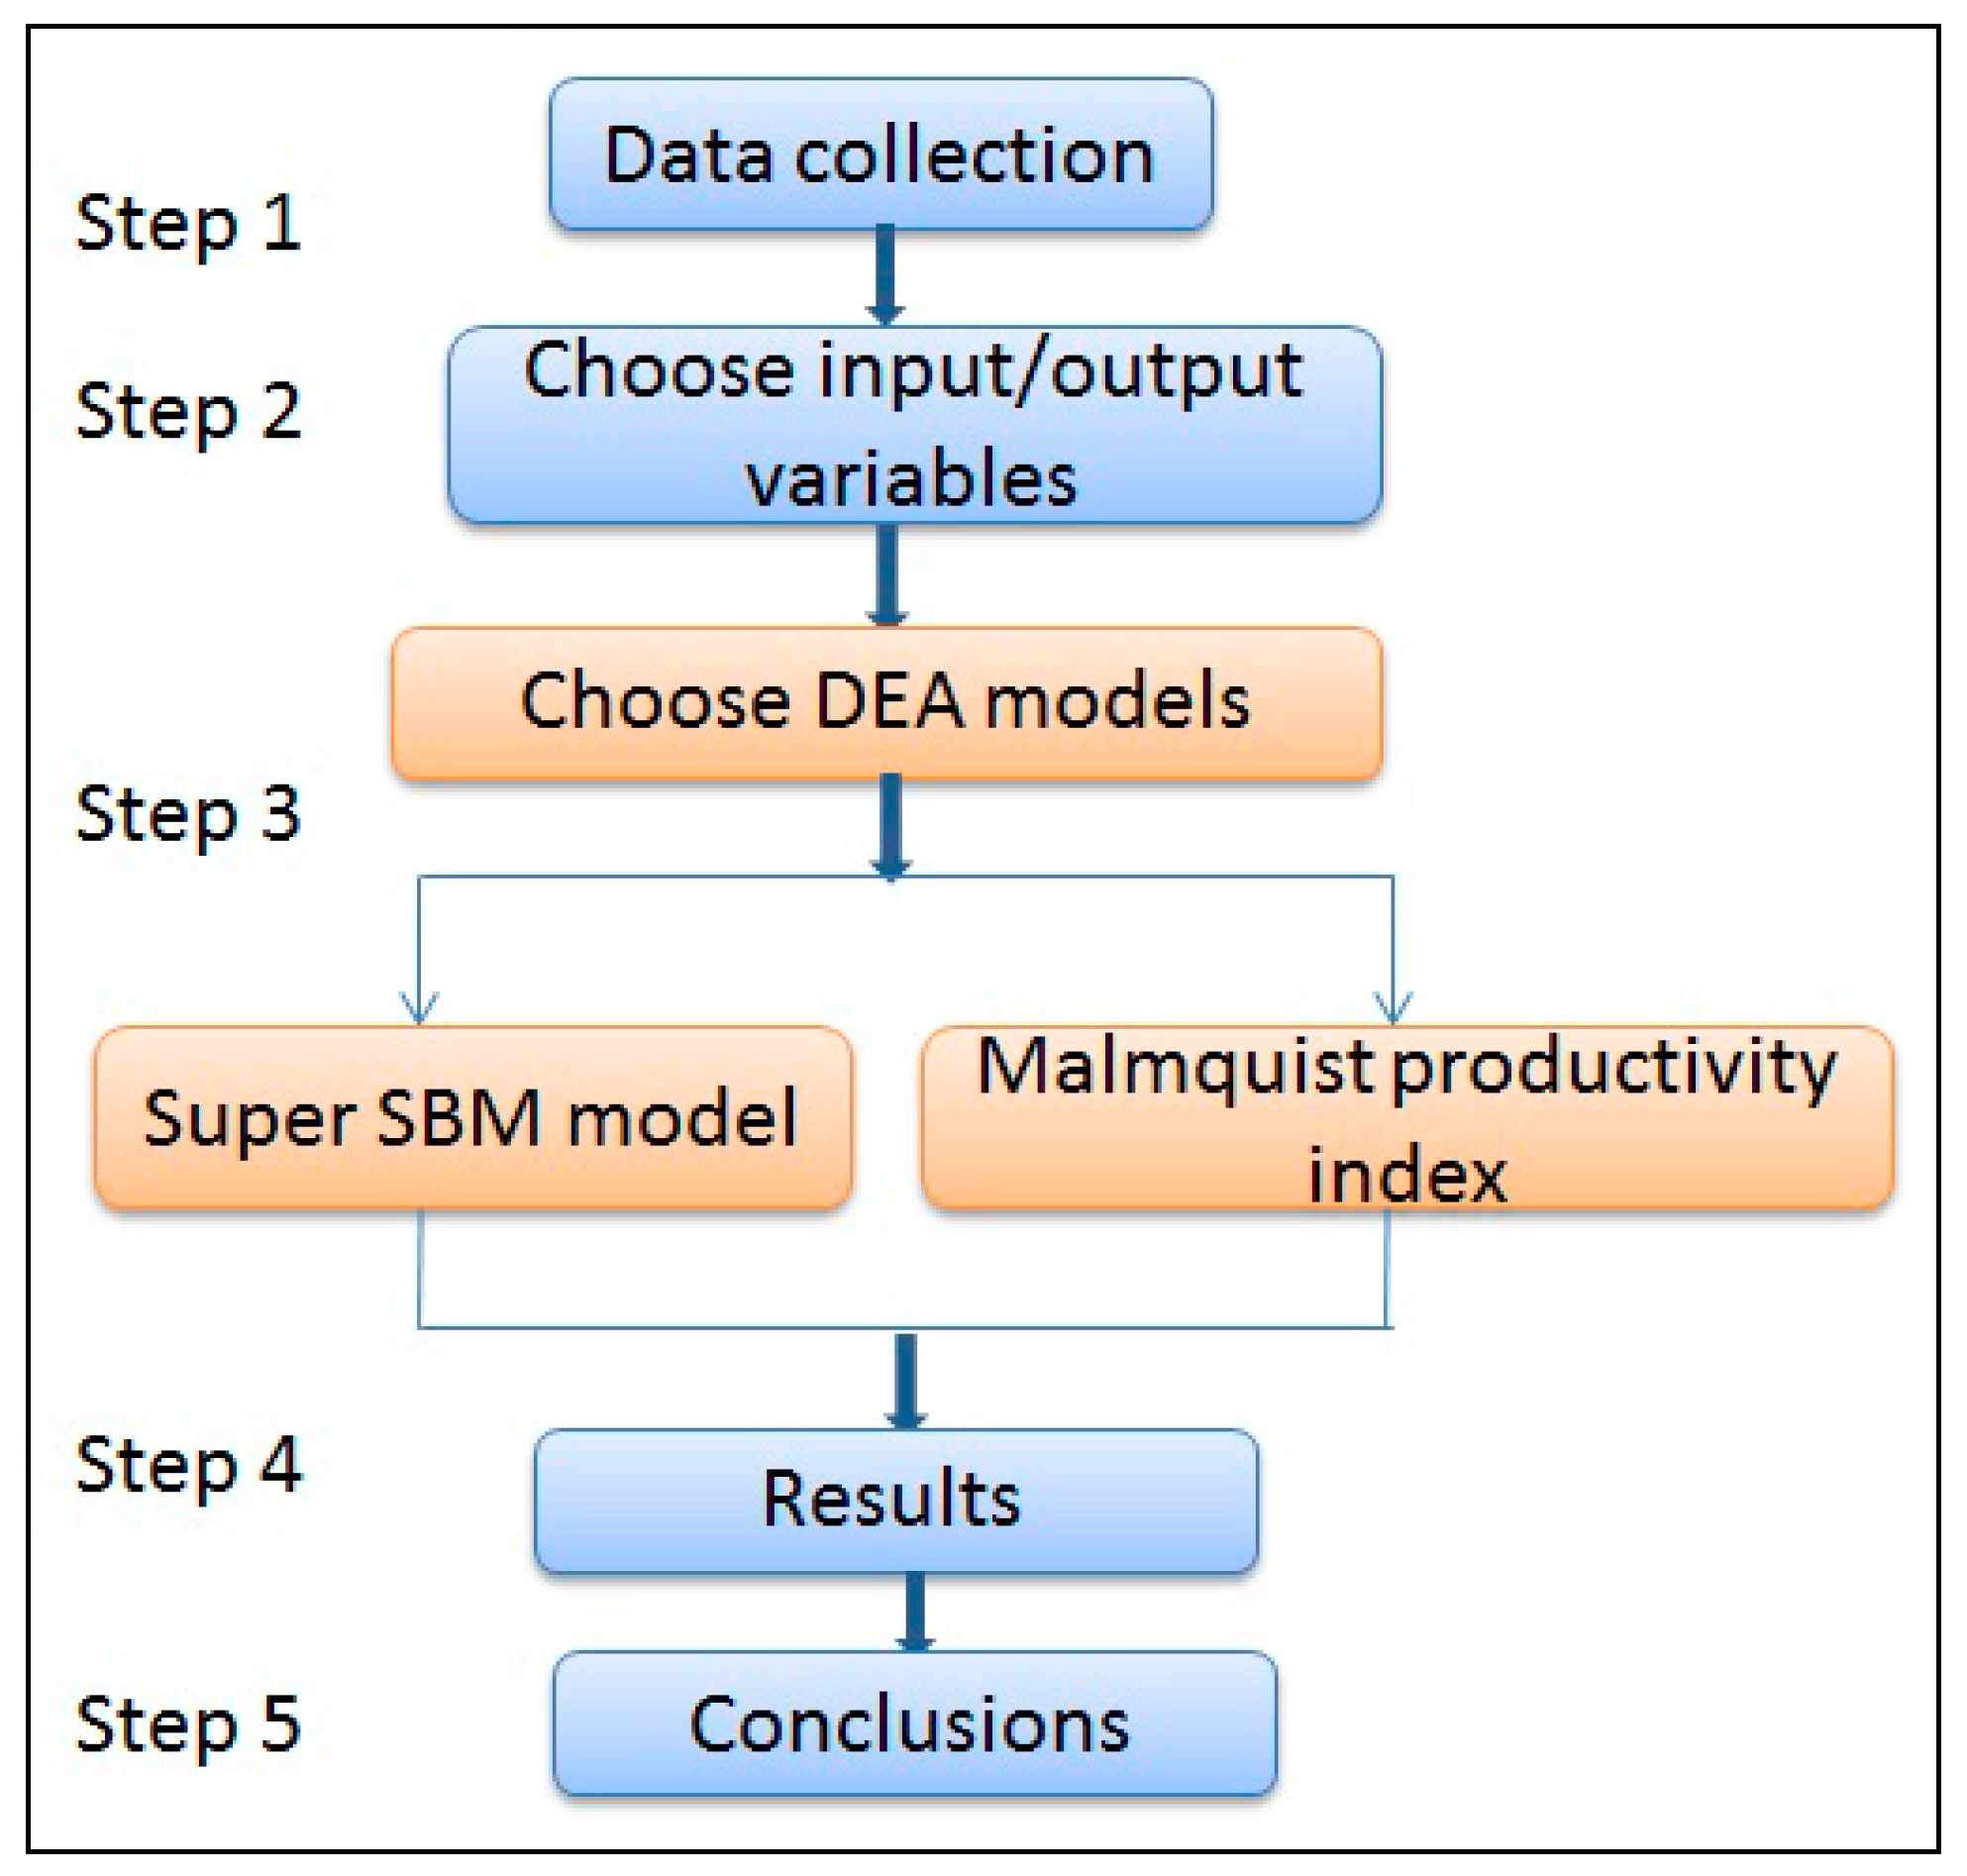
This study was divided into five steps, as shown in Figure 1. The first step is to perform the data collection. According to total primary energy consumption by country, an index of the top fifty nations in energy consumption is to be considered. However, due to data availability, this study collects data from only seventeen countries as a relative sample used to evaluate national energy efficiency.
The second step is to choose the input and output variables. To achieve the purpose of energy efficiency estimation, the input and output indicators must include economic, energy, and environmental factors. This study chooses three input factors: gross capital formation, labor force, and total energy consumption. Two output factors are considered to be gross domestic product (GDP) and CO2 emissions resulting from fuel combustion. These factors also meet the requirement of DEA approach to the number of DMU.
The third step is to evaluate the energy efficiency of seventeen countries. The super SBM model and MPI of DEA-Solver software is applied for the calculations in Step 3. Firstly, the research applied to the super SBM model used to rank and then to analyze the energy efficiency with and without consideration of the CO2 emissions factor. Secondly, energy efficiency overall productivity efficiency, technical efficiency, and technology efficiency are estimated based on the MPI.
The fourth step is to report the empirical results, and the fifth step is to give the conclusions drawn from this research.

3. Empirical Study

3.1. Data

According to the list of countries by carbon dioxide emissions [33], there are forty-nine countries with the highest CO2 emissions in 2015. However, due to data availability, this study takes the data of seventeen countries as a sample. The data are collected for a six year period from 2010–2015. Based on previous studies, we employ annual data on the gross capital formation and labor force as two non-energy inputs, while gross domestic product (GDP) exists as a desirable output and carbon dioxide emission as an undesirable output. The data on gross capital formation, labor force, and GDP are obtained from the World Bank [34]. The total energy consumption and CO2 emissions are gathered from the Enerdata Yearbook [35]. Gross capital formation consists of outlays on additions to the fixed assets of the economy plus net changes in the level of inventories [36]. Thus, the paper uses the growth of gross capital formation as a proxy for capital stock. The variables employed in this paper based on the literature [37]. The data for labor force comprises of people who supply labor for the production of goods and services during a specified period [34]. GDP data are given in terms of current U.S dollars. The total energy consumption includes coal, gas, oil, electricity, heat, and biomass. The CO2 emissions result from fuel combustion (coal, oil, and gas).
Table 1 shows a summary of statistics for input and output factors for selected years between 2010 and 2015 for seventeen countries in this study. The study point out that, on average, the gross capital formation, labor force, total energy consumption, GDP, and CO2 emissions for seventeen countries are all significant from 2010 to 2015.

3.2. The Variation Analysis of Seventeen Countries Average Efficiency

This study applies the super SBM model to examine the energy efficiency in seventeen countries. The research used two tests to evaluate energy efficiency. In the first test, the energy efficiency with consideration to the undesirable output was estimated for all seventeen countries by using the super SBM model. In the second test, the energy efficiency without consideration of the undesirable output was appreciated by using the super SBM model. The purpose is to provide a comparison between the effects of consideration with and without the undesirable factor. Figure 2 and Figure 3 pointed out the detailed evaluation results of the two tests.
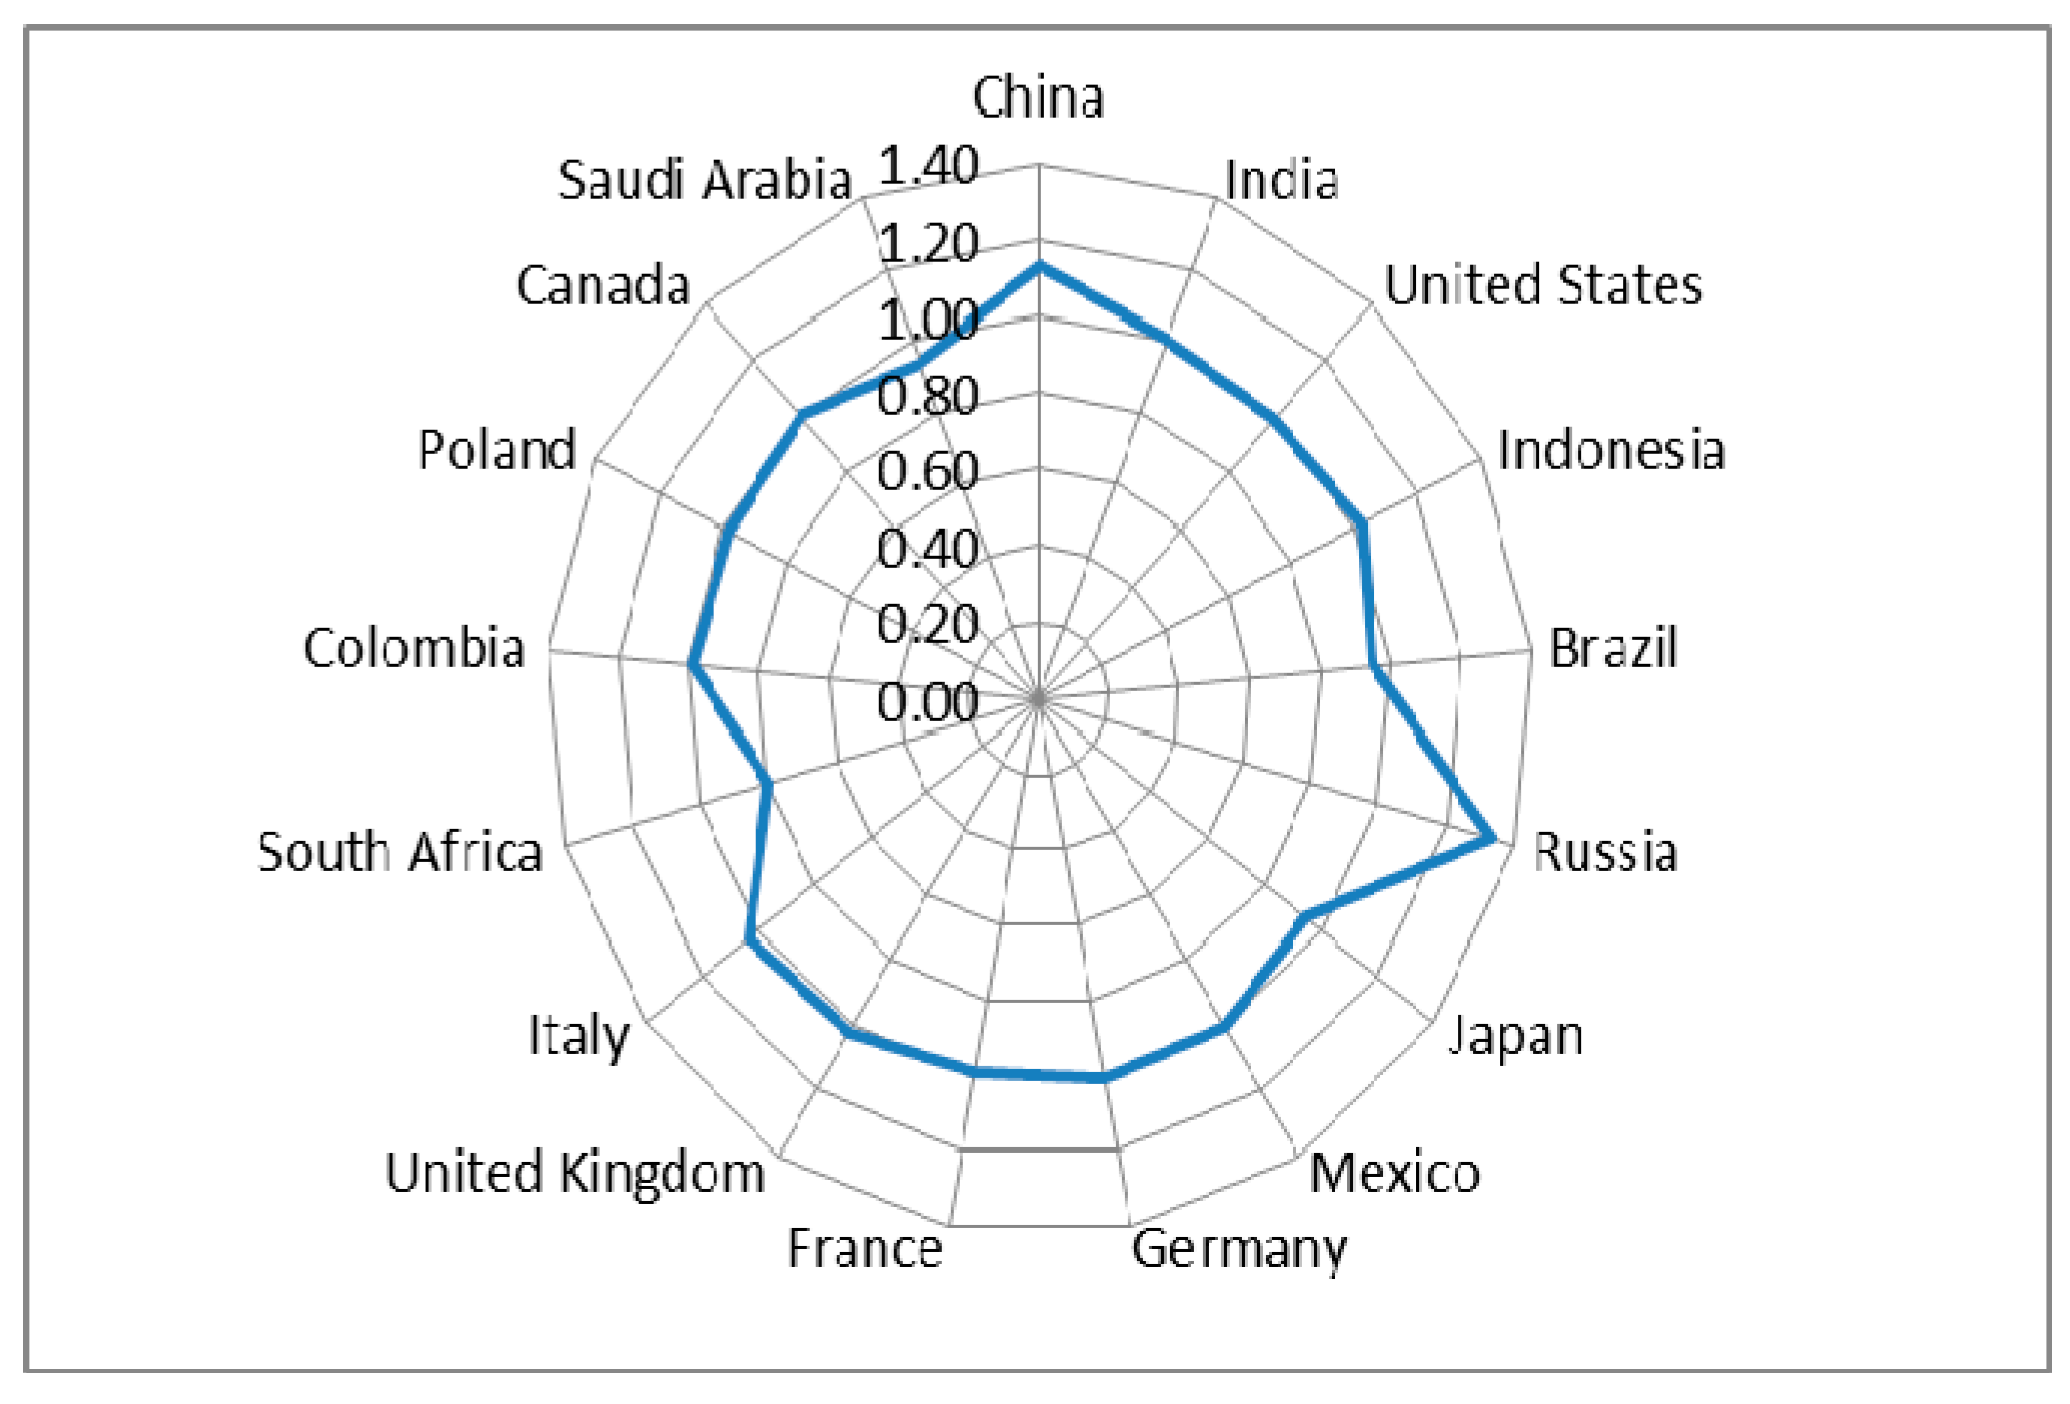
It can be seen from Figure 2 that the mean energy efficiency of seventeen countries from 2010 to 2015, with consideration of CO2 emissions, is 1.06. The average energy efficiency in China, the United States, Japan, Columbia, and Saudi Arabia is higher than 1.20 with consideration of undesirable output. The efficiency levels are lower than 0.5 in Brazil, Indonesia and India. The other countries’ energy efficiency levels are between 0.5 and 1.20.
In 2015, ten countries, namely the United States, Colombia, Saudi Arabia, China, United Kingdom, Poland, South Africa, Canada, Italy, and Japan were considered to be highly energy and environmentally efficient, with average scores larger than 1.01. The other seven countries had average efficiency scores of between 0.19 and 0.92. India’s performance was deemed to be the worst.
Figure 3 shows that from 2010 to 2015, the mean energy efficiency without consideration of CO2 emissions is 0.945. The average energy efficiency in the United States, Columbia, and Saudi Arabia are higher than 1.18 without considering undesirable output. The average energy efficiency levels of China, India, Indonesia, Brazil, Mexico, and South Africa, are lower than 0.5. The average energy efficiency levels of Japan, Germany, France, the United Kingdom, Italy, Poland, and Canada are located between 0.8 and 1.0.
The results of Figure 2 and Figure 3 show that there is little difference between the efficiency levels with or without consideration of the CO2 emissions factor. The average score of all of the countries with consideration of the CO2 emissions factor is higher than the efficiency without consideration of the CO2 emissions factor. This indicates that the energy of these countries has high efficiency, but at the cost of environmental pollution. Thus, it is significant to consider the undesirable output factors when energy efficiency evaluation is to be made.
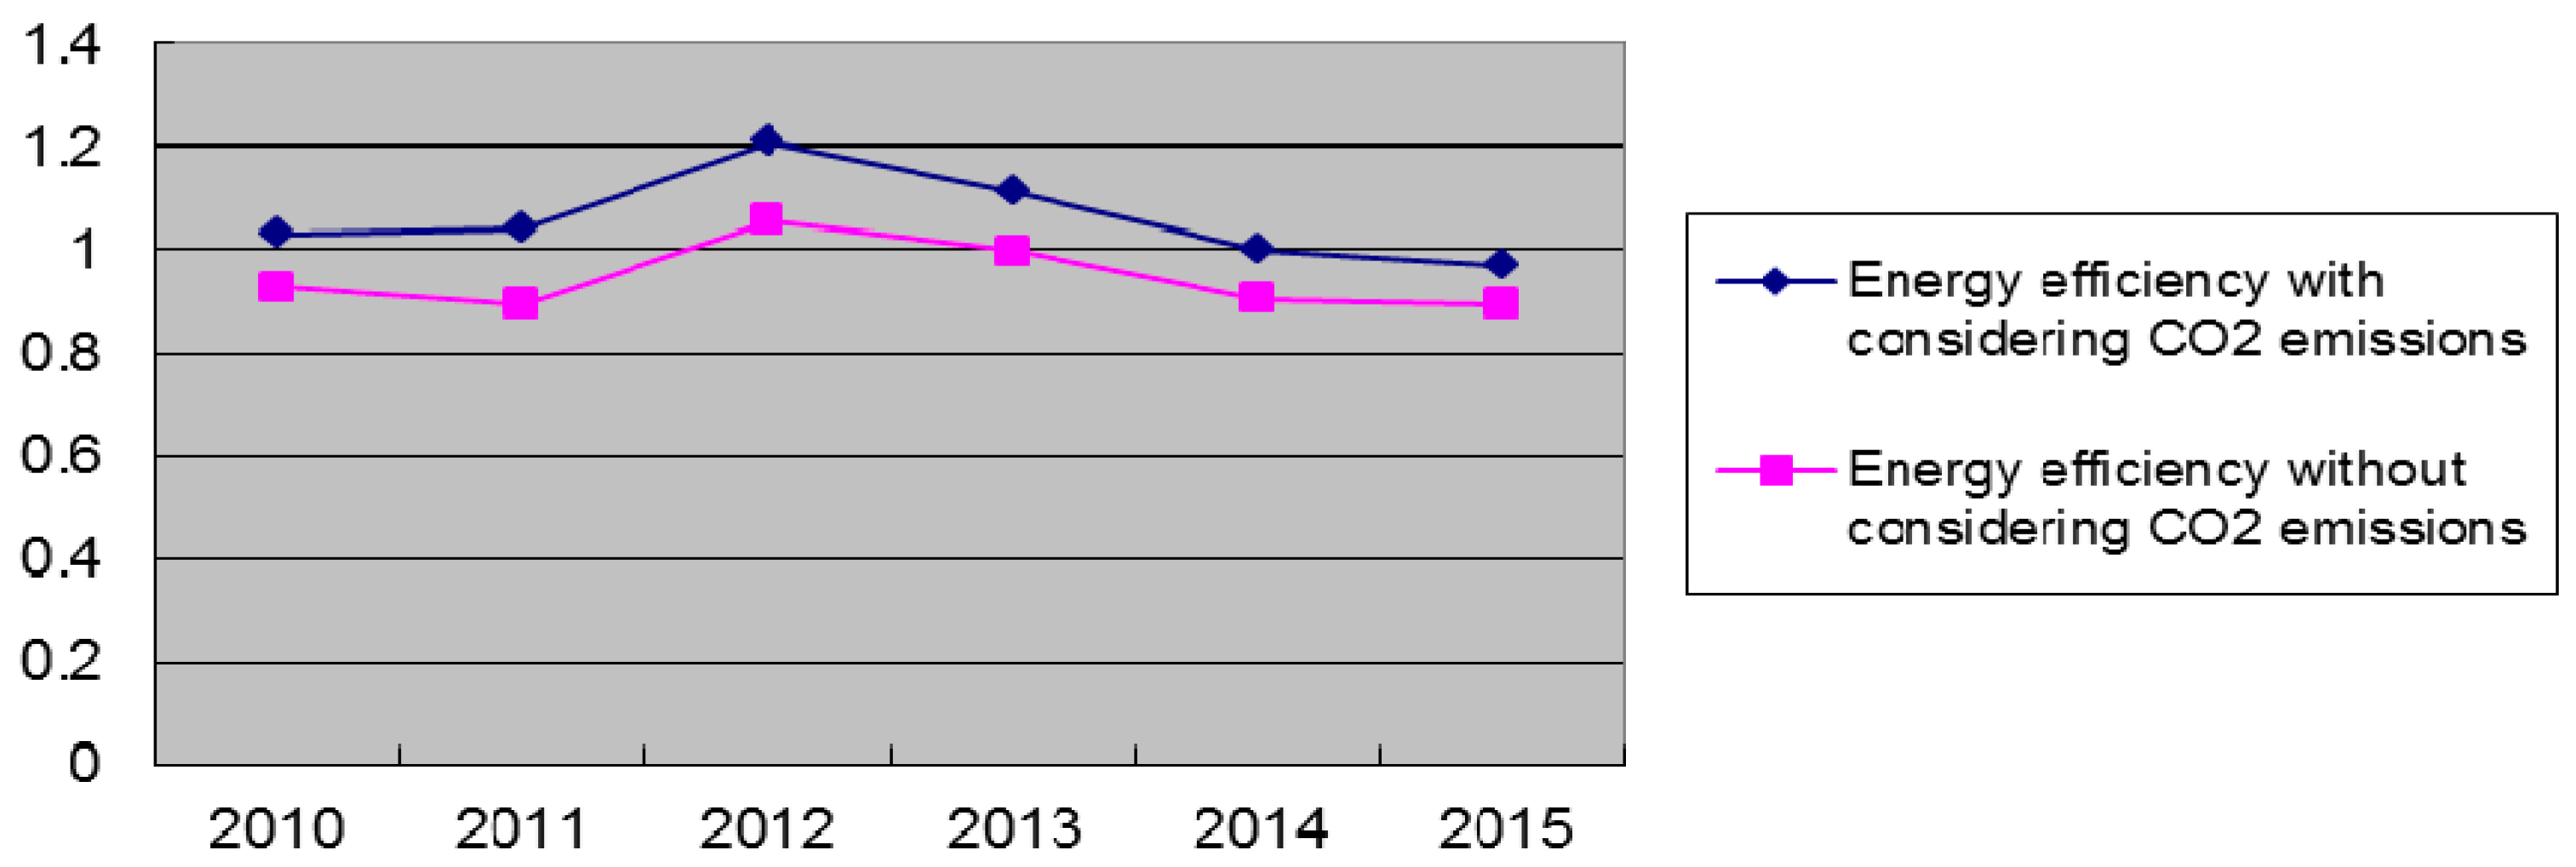
Figure 4 compares the seventeen countries average energy efficiency between consideration with the CO2 emissions factor and without the CO2 emissions factor in 2010–2015. According to Figure 3, the average energy efficiency without consideration of the CO2 emissions factor declines from 0.927 in 2010, and to 0.89 in 2015, a 3.7% drop. The average energy efficiency with consideration of the CO2 emissions factor increases from 1.03 in 2010 to 1.13 in 2013; and, it decreased in 2015 by 6% when compared with 2010. Meanwhile, from 2010 to 2015, the energy efficiency with consideration of the CO2 emissions factor in output is always lower than the efficiency without consideration of CO2 emissions output. This indicates the impact of environmental pollution on overall energy efficiency.

3.3. Total Energy Overall Productivity Efficiency, Technical Efficiency and Technology Efficiency

The study measures the average energy performance of seventeen countries over time. To better understand the energy performance and productivity growth in the seventeen selected countries, the study analyzes two types of energy productivity performance: energy productivity performance with consideration of the CO2 emissions factor as undesirable output, and energy productivity performance without consideration of the CO2 emissions factor.
Table 2 presents the energy productivity performance of seventeen countries from 2010–2015. It can be seen that most of the energy productivity performance with consideration of the CO2 emissions of seventeen countries is larger than one in the sample periods of 2010–2011 and 2011–2012. The average of the index is 1.04 and 1.05, respectively.
During the sample period, the seventeen countries as a whole experienced a positive change (=1.01). However, the energy productivity efficiency decreased by 6.4% in 2014–2015 when compared with 2010–2011. Thus, during three periods of time (i.e., 2012–2013, 2013–2014, and 2014–2015), there was a demonstrable negative change. The average energy productivity performance index estimates that during the period of 2010–2015, China, India, Indonesia, the United States, Russia, Germany, the United Kingdom, Italy, Columbia, and Poland seem to have made slight progress in their energy productivity units. The average score of these countries is larger than 1, respectively. Japan and South Africa are the only two countries that decreased in terms of their energy productivity performance.
Figure 5 shows the average productivity efficiency score of different countries over time. The average of the index for Japan is 0.98, appearing as the lowest score. The average efficiency score of China is 1.04, representing the highest score in 2010–2015, followed by Italy. With an average score increase of 87.7% in the period of 2011–2012 as compared with 2010–2011, the United States likewise experienced good performance in energy productivity. From the results, it can be seen that China, Italy, and the United States showed progress in total energy productivity, while Japan showed a slight decrease in energy productivity and environmental efficiency.
Table 3 shows the result of energy productivity performance without consideration of the CO2 emissions factor. The result indicates that most of the countries have reached energy productivity efficiency in the period 2010–1011. However, in the period 2013–2015, due to the global financial crisis, all seventeen countries deteriorated in total energy productivity except for China. China is found to be the best in energy productivity in 2013–2015, followed by the United States. During the period 2010–2015, the entire seventeen countries also experienced positive change (=1.01).
Finally, the findings in Table 3 and Figure 4 show the difference in energy productivity performance when considering CO2 emissions and without considering the CO2 emissions factor. The average energy productivity of seventeen countries with consideration of CO2 emissions declined from 1.04 in 2010–2011 to 0.90 in 2014–2015. With consideration of the CO2 emissions factor, all seventeen countries experienced an annual 14.2% decrease in total energy efficiency. Without considering the CO2 emissions factor, all seventeen countries showed a 19% regression in energy productivity in 2010–2015. This means that all seventeen countries had the most energy productivity growth when factoring in CO2 emissions along with GDP growth. These factors are important when evaluating the total energy productivity growth. It provides an overview about the presence of a country.
Figure 6 shows the average score of energy productivity index without consideration of CO2 emissions for all seventeen countries. The results indicate that the average score of Russia is 1.33, this being the highest energy productivity, with an annual growth rate of 2.4%. This rate level is followed by China, Italy, and the United Kingdom, with efficiency scores of 1.13; 1.03, and 1.02, respectively, while South Africa, with an average score of 0.80, has the lowest energy productivity of all seventeen countries observed.
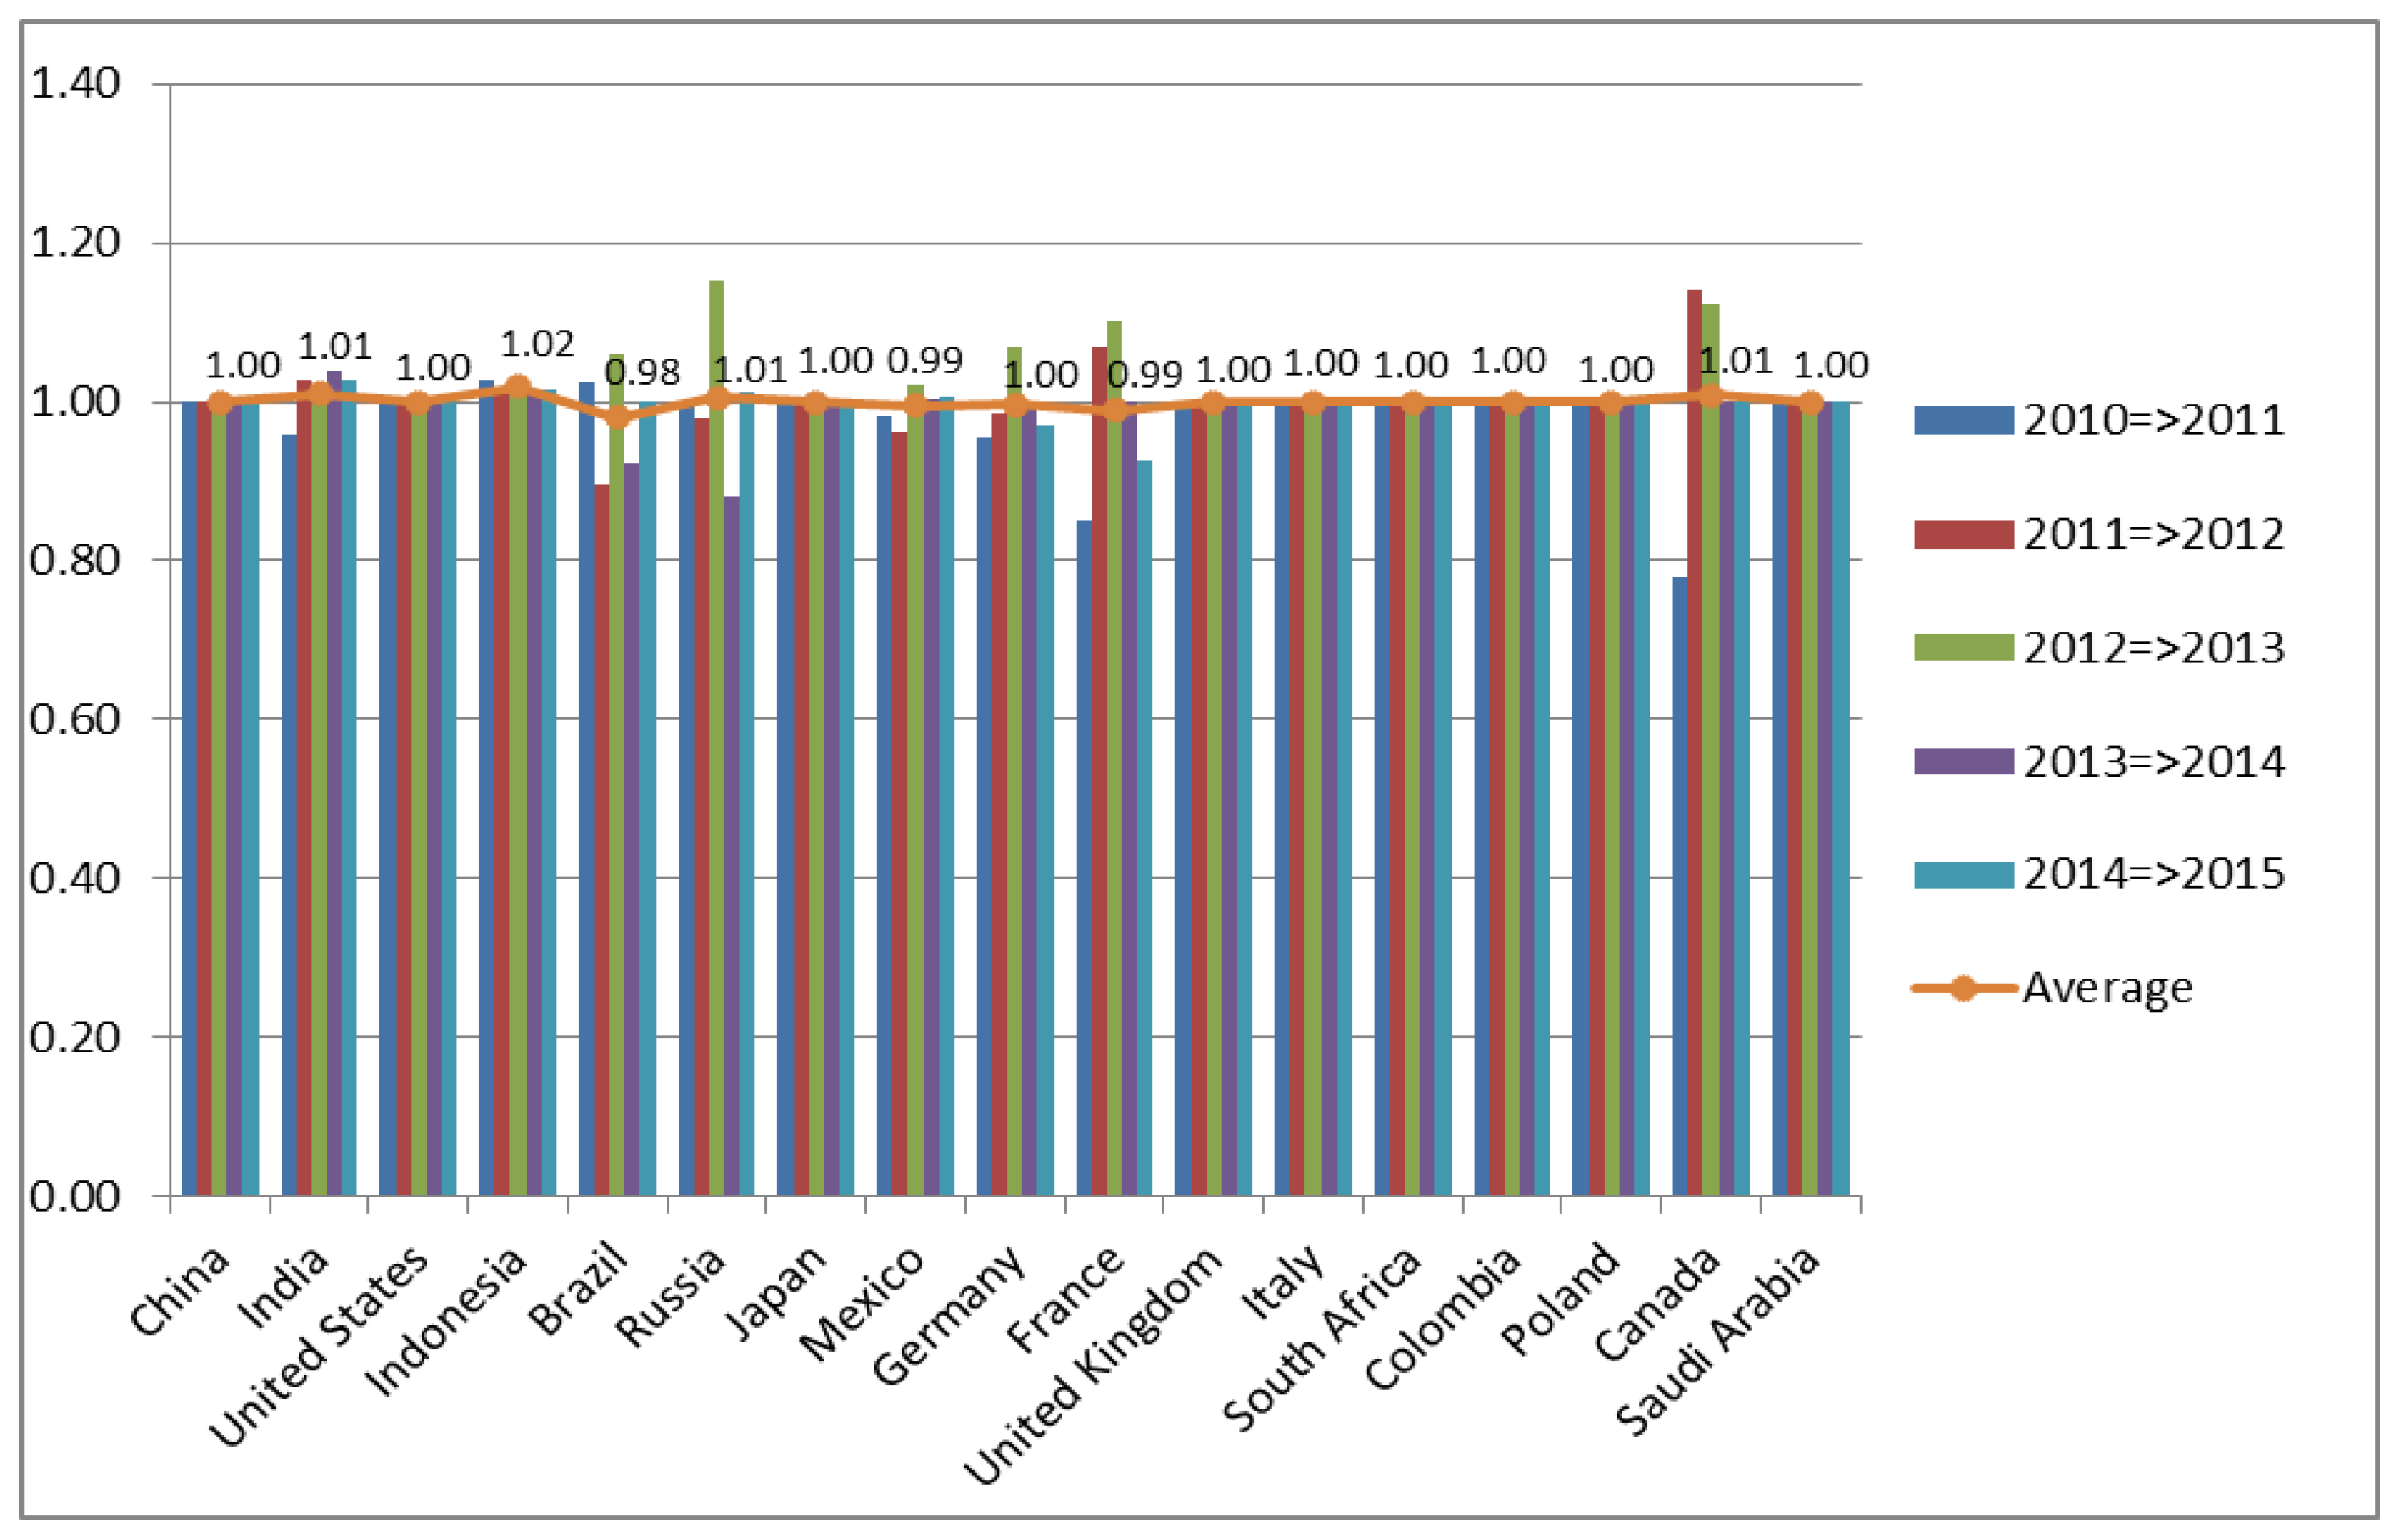
Next, we compose energy efficiency with CO2 emissions by energy technical change and energy technology change. Table 4 shows the energy technical change (catch-up effect) of seventeen countries. In the period of 2010–2015, the average energy technical change for all countries reached the efficiency score of 1. It is found that the seventeen countries as a whole had improved by 3% since 2010 in terms of their technical energy. However, there are six countries, namely China, the United States, Japan, the United Kingdom, South Africa, and Poland, which did not change in terms of their technical energy efficiency (=1.0) over time. Among the seventeen countries, Indonesia, India, Russia, and Canada are found to be significant in terms of their technical energy efficiency. Brazil and France possess average scores lower than 1, which means that these two countries were not successful in technical best practices in the sample period.
It can be observed from Figure 7 that the technical efficiency of Indonesia shows the highest score (=1.02). This result indicates that Indonesia has grown in technical energy change in the period 2010–1015. In the period 2014–2015, the mean value of technical efficiency change for India is 1.03, which means a 7% improvement has taken place in technical energy change when compared with results in 2010–2011. This status is followed by Indonesia and Russia.
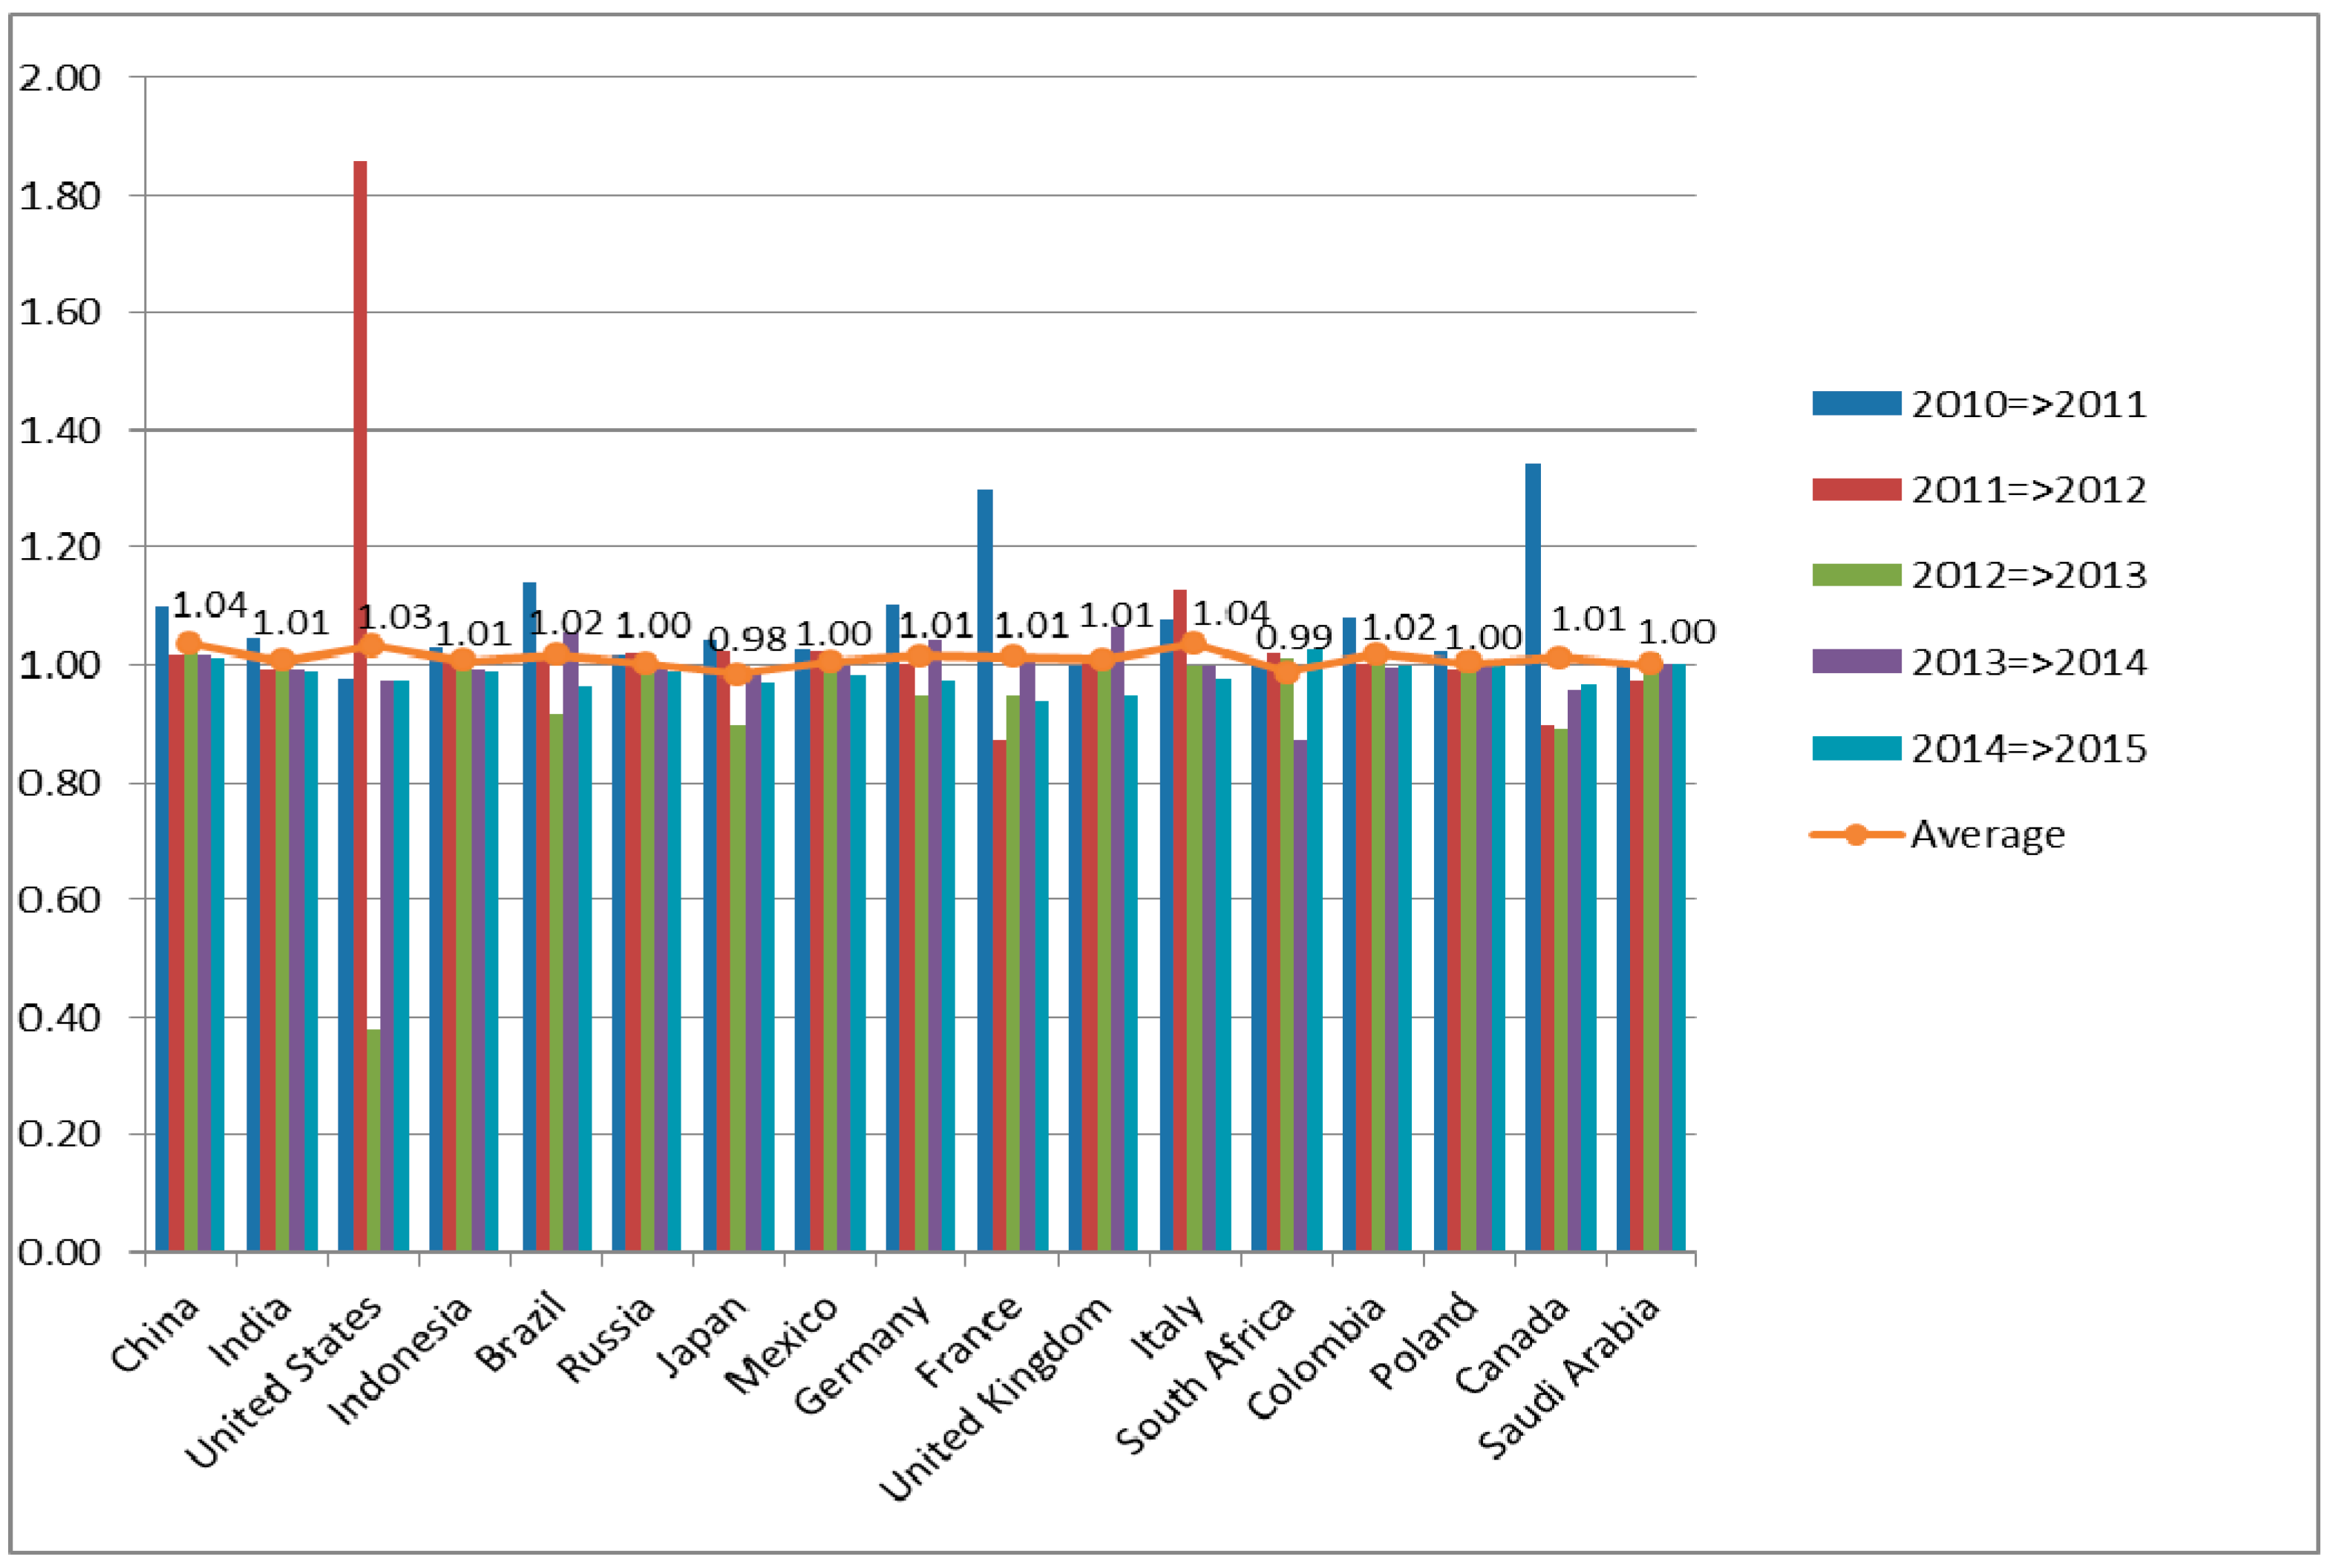
Table 5 shows the results of the energy technological change in seventeen countries. The results indicate that most countries have experienced a slight change in their energy technological efficiency. France and Saudi Arabia in 2011–2012; the United States, Japan, Germany, and Canada in 2012–2013; South Africa in 2013–2014; India, Brazil, the United Kingdom, and Italy in 2014–2015, are all less significant. Besides, among seventeen countries, the average score of Japan and South Africa are below the number one. It designates that these two countries that have dropped in their energy technological efficiency from 2010–2015. Another fifteen countries have an average score larger than 1, which means that they have experienced a significant technological improvement during the sample period. The increase of frontier index for these seventeen countries could be a signal of the global economic change which has taken place in recent years.
We may conclude that the improvement in energy efficiency with consideration of CO2 emissions is mainly due to technical improvement and is based on this economic shock.
As shown in Figure 8, the average energy technological change of the United States has an efficiency score of 1.86 as the highest estimation in the period of 2011–2012, indicating an 88% growth when compared with 2010–2011, while the energy technological change of France and Canada indicated a 42.4% and a 44% drop, respectively. It indicates that the worst practice frontier of the two countries during the period of 2011–2012.

4. Conclusions

This study employs DEA models including the super SBM and the Malmquist productivity index to measure the energy and environmetal efficiency. For this paper, a sample of seventeen countries for the period 2010–2015 is used. The total energy and enviromental efficiency of seventeen countries are observed. First, the super SBM model is used to compare the energy efficiency with and without consideration of carbon dioxide emission as an undersirable output. The empirical results show that when considering carbon dioxide emission as a factor, all seventeen countries showed a decline in efficiency performance by 6%. Without considering the CO2 factor, these countries found a 3.7% decrease in efficiency performance from 2010–2015. Second, we applied the Malmquist productivity to evaluate the energy and environmetal efficiency of seventeen countries by measuring the productivity efficiency, technical efficiency, and technology efficiency levels from 2010–2015.
The productivity efficiency with and without consideration of CO2 emissions as undersirable outputs have all been considered. It is clear to observe that by considering the CO2 emissions factor in the output, the results indicate that the average energy productivity efficiency of seventeen countries tends to fall by as much as 3%.
By measuring the energy performance index in terms of technical change and technological change, we may see that the total energy efficiency of seventeen countries improved by 2.6% from 2010–2015. This is due in large part from the progress in technical change. The empirical study has shown that the United States ranks first, followed by Columbia, Japan, China, and Saudi Arabia, which have improved in their energy performance and environmental efficiency. By contrast, Brazil, Russia, Indonesia, and India have seen deterioration in energy performance.
According to the new climate economy, it is estimated that improving energy efficiency is crucial. Moreover, it is a proven way to reduce Greenhouse gas emissions cost effectively, increase economic activity, and improve resource productivity.
The main contribution of this paper is to provide an evaluation and comparison of the energy and environmental efficiency of seventeen countries. The research results may help to improve energy efficiency, to achieve economic growth, and to address environmental protection goals. The findings in this study provide policymakers with incentive to achieve cleaner production, energy consumption efficiency, and a reduction of CO2 emissions. The estimation results may give useful information and practical suggestions for the governments of seventeen countries to realize their collective goal of contributing to the saving and mitigating impacts of global climate change.

Author Contributions

Chia-Nan Wang contributed to design the research and analysis tools; Hong-Xuyen Thi Ho collected the data and wrote the paper; Ming-Hsien Hsueh checked and revised the paper. All authors have read and approved the final manuscript.

Conflicts of Interest

The authors declare no conflict of interest.

Abbreviations

The following abbreviations are used in this manuscript:
DEAData development analysis
DMUsDecision making units
SBMSlacks based model
Super SBMSuper slacks based model
MPIMalmquist productivity index
CO2carbon dioxide
GDPgross domestic product

References

  1. International Energy Agency. Worldwide Trends in Energy Use and Efficiency; OECD: Paris, France, 2008; Available online: https://www.iea.org/publications/freepublications/publication/Indicators_2008.pdf (accessed on 3 October 2017).
  2. U.S. Energy Information Administration. Available online: http://www.eia.gov/todayinenergy/detail.php?id=26212 (accessed on 3 October 2017).
  3. Ang, B.W. Monitoring changes in economy-wide energy efficiency: From energy—GDP ratio to composite efficiency index. Energy Policy 2006, 34, 574–582. [Google Scholar] [CrossRef]
  4. Wang, K.; Yu, S.; Zhang, W. China’s regional energy and environmental efficiency: A DEA window analysis based dynamic evaluation. Math. Comput. Model. 2013, 58, 1117–1127. [Google Scholar] [CrossRef]
  5. Blomberg, J.; Henriksson, E.; Lundmark, R. Energy efficiency and policy in Swedish pulp and paper mills: A data envelopment analysis approach. Energy Policy 2012, 42, 569–579. [Google Scholar] [CrossRef]
  6. Zhang, X.P.; Cheng, X.M.; Yuan, J.H.; Gao, X.J. Total-factor energy efficiency in developing countries. Energy Policy 2011, 39, 644–650. [Google Scholar] [CrossRef]
  7. Wang, K.; Wei, Y.M.; Zhang, X. A comparative analysis of China’s regional energy and emission performance: Which is the better way to deal with undesirable outputs? Energy Policy 2012, 46, 574–584. [Google Scholar] [CrossRef]
  8. Zhou, P.; Ang, B.W. Linear programming models for measuring economy-wide energy efficiency performance. Energy Policy 2008, 36, 2911–2916. [Google Scholar] [CrossRef]
  9. Zhou, P.; Ang, B.W.; Han, J.Y. Total factor carbon emission performance: A Malmquist index analysis. Energy Econ. 2010, 32, 194–201. [Google Scholar] [CrossRef]
  10. Lin, B.; Zheng, Q. Industrial polices and improved energy efficiency in China’s paper industry. J. Clean. Prod. 2017, 161, 200–210. [Google Scholar]
  11. Narayan, P.K.; Smyth, R. Energy consumption and real GDP in G7 countries: New evidence from panel cointegration with structural breaks. Energy Econ. 2008, 30, 2331–2341. [Google Scholar] [CrossRef]
  12. Wolde-Rufael, Y. Energy consumption and economic growth: The experience of African countries revisited. Energy Econ. 2009, 31, 217–224. [Google Scholar] [CrossRef]
  13. Lee, J.D.; Park, J.B.; Kim, T.Y. Estimation of the shadow prices of pollutants with production/environment inefficiency taken into account: A nonparametric directional distance function approach. J. Environ. Manag. 2002, 64, 365–375. [Google Scholar] [CrossRef]
  14. Färe, R.; Grosskopf, S.; Tyteca, D. An activity analysis model of the environmental performance of firms—Application to fossil-fuel-fired electric utilities. Ecol. Econ. 1996, 18, 161–175. [Google Scholar] [CrossRef]
  15. Lozano, S.; Gutiérrez, E. Non-parametric frontier approach to modelling the relationships among population, GDP, energy consumption and CO2 emissions. Ecol. Econ. 2008, 66, 687–699. [Google Scholar] [CrossRef]
  16. Zhang, N.; Zhou, P.; Choi, Y. Energy efficiency, CO2 emission performance and technology gaps in fossil fuel electricity generation in Korea: A meta-frontier non-radial directional distance function analysis. Energy Policy 2013, 56, 653–662. [Google Scholar] [CrossRef]
  17. Vlontzos, G.; Niavis, S.; Manos, B. A DEA approach for estimating the agricultural energy and environmental efficiency of EU countries. Renew. Sustain. Energy Rev. 2014, 40, 91–96. [Google Scholar] [CrossRef]
  18. Ramanathan, R. An analysis of energy consumption and carbon dioxide emissions in countries of the Middle East and North Africa. Energy 2005, 30, 2831–2842. [Google Scholar] [CrossRef]
  19. Chen, L.; Jia, G. Environmental efficiency analysis of China’s regional industry: A data envelopment analysis (DEA) based approach. J. Clean. Prod. 2017, 142, 846–853. [Google Scholar] [CrossRef]
  20. Li, H.; Shi, J.F. Energy efficiency analysis on Chinese industrial sectors: An improved Super-SBM model with undesirable outputs. J. Clean. Prod. 2014, 65, 97–107. [Google Scholar] [CrossRef]
  21. Wu, F.; Fan, L.W.; Zhou, P.; Zhou, D.Q. Industrial energy efficiency with CO2 emissions in China: A nonparametric analysis. Energy Policy 2012, 49, 164–172. [Google Scholar] [CrossRef]
  22. Egilmez, G.; Kucukvar, M.; Tatari, O. Sustainability assessment of US manufacturing sectors: An economic input output-based frontier approach. J. Clean. Prod. 2013, 53, 91–102. [Google Scholar] [CrossRef]
  23. Xue, X.; Wu, H.; Zhang, X.; Dai, J.; Su, C. Measuring energy consumption efficiency of the construction industry: The case of China. J. Clean. Prod. 2015, 107, 509–515. [Google Scholar] [CrossRef]
  24. Wang, C.N.; Ho, H.X.T.; Luo, S.H.; Lin, T.F. An Integrated Approach to evaluating and selecting green logistics providers for sustainable development. Sustainability 2017, 9, 218. [Google Scholar] [CrossRef]
  25. Chang, M.C. Room for improvement in low carbon economies of G7 and BRICS countries based on the analysis of energy efficiency and environmental Kuznets curves. J. Clean. Prod. 2015, 99, 140–151. [Google Scholar] [CrossRef]
  26. Herring, H. Energy efficiency—A critical view. Energy 2006, 31, 10–20. [Google Scholar] [CrossRef]
  27. Song, M.; An, Q.; Zhang, W.; Wang, Z.; Wu, J. Environmental efficiency evaluation based on data envelopment analysis: A review. Renew. Sustain. Energy Rev. 2012, 16, 4465–4469. [Google Scholar] [CrossRef]
  28. Xie, B.C.; Shang, L.F.; Yang, S.B.; Yi, B.W. Dynamic environmental efficiency evaluation of electric power industries: Evidence from OECD (Organization for Economic Cooperation and Development) and BRIC (Brazil, Russia, India and China) countries. Energy 2014, 74, 147–157. [Google Scholar] [CrossRef]
  29. Shi, G.M.; Bi, J.; Wang, J.N. Chinese regional industrial energy efficiency evaluation based on a DEA model of fixing non-energy inputs. Energy Policy 2010, 38, 6172–6179. [Google Scholar] [CrossRef]
  30. Zaim, O.; Taskin, F. A Kuznets curve in environmental efficiency: An application on OECD countries. Environ. Resour. Econ. 2000, 17, 21–36. [Google Scholar] [CrossRef]
  31. Tone, K. A slacks-based measure of super-efficiency in data envelopment analysis. Eur. J. Oper. Res. 2002, 143, 32–41. [Google Scholar] [CrossRef]
  32. Cooper, W.W.; Seiford, L.M.; Tone, K. Introduction to Data Envelopment Analysis and Its Uses: With DEA-Solver Software and References; Springer Science and Business Media: Berlin/Heidelberg, Germany, 2006. [Google Scholar]
  33. List of Countries by Carbon Dioxide Emission. Available online: https://en.wikipedia.org/wiki/List_of_countries_by_carbon_dioxide_emissions (accessed on 26 September 2017).
  34. World Bank. Available online: http://data.worldbank.org/ (accessed on 1 September 2017).
  35. Enerdata Yearbook. Available online: https://yearbook.enerdata.net/ (accessed on 1 September 2017).
  36. Lee, C.C. Energy consumption and GDP in developing countries: A counteracted panel analysis. Energy Econ. 2005, 27, 415–427. [Google Scholar] [CrossRef]
  37. Sari, R.; Soytas, U. The growth of income and energy consumption in six developing countries. Energy Policy 2007, 35, 889–898. [Google Scholar] [CrossRef]
Figure 1. Research procedure.
Energies 10 01597 g001
Figure 2. Average energy efficiency performance with carbon dioxide (CO2) emissions of seventeen countries from 2010 to 2015.
Energies 10 01597 g002
Figure 3. Average energy efficiency performance without CO2 emissions of seventeen countries from 2010–2015.
Energies 10 01597 g003
Figure 4. The seventeen countries average energy efficiency with and without considering CO2 emissions factor from 2010 to 2015.
Energies 10 01597 g004
Figure 5. Estimation of the Malmquist productivity index with CO2 emissions for seventeen countries in 2010–2015.
Energies 10 01597 g005
Figure 6. Estimation of the Malmquist productivity index without CO2 emissions in seventeen countries for 2010–2015.
Energies 10 01597 g006
Figure 7. The energy efficiency performance index of different countries over time.
Energies 10 01597 g007
Figure 8. The energy technology performance index of seventeen countries over time.
Energies 10 01597 g008
Table 1. Summary statistics of inputs and outputs for seventeen countries, (average, 2010–2015).
YearVariableNon Energy InputsEnergy InputsDesirable OutputsUndesirable Outputs
Gross Capital Formation (% of GDP)Labor Force (Million Workers)Total Energy Consumption (Mtoe)GDP (Millions in Current US$)CO2 Emissions from Fuel Combustion (Million Tons)
2010Max47.347781.0552587.75114,964.3727361.995
Min16.36510.06631.206287.01865.811
Average24.536120.018529.9202801.5311292.103
SD7.692196.327709.4913441.3541931.881
2011Max47.167790.1832801.67315,517.9268355.837
Min16.1586.55531.255335.41566.337
Average24.882117.642540.1283098.571349.492
SD7.734199.928745.3533625.9682104.604
2012Max47.325795.8632908.35616,155.2558521.781
Min16.24910.85331.593369.65965.441
Average24.735113.700548.1203169.6591370.249
SD7.873201.078758.0843826.9732124.370
2013Max47.678801.7913010.46816,663.168894.470
Min16.8917.68931.652366.05767.929
Average24.195119.509558.6263237.9491405.250
SD7.618203.481783.0333976.7082208.045
2014Max46.199806.4993073.15317,348.0718987.857
Min16.31512.13533.025349.87371.931
Average24.443124.805565.4773330.0721419.327
SD7.381203.725799.4214187.6392236.607
2015Max132.368804.0003100.89317,946.9968947.639
Min16.76611.67034.429292.08076.430
Average30.326124.349568.3643166.7301414.967
SD26.480203.800802.6364404.0152218.217
Table 2. The energy productivity scores with CO2 emissions in seventeen countries for the period 2010–2015.
Malmquist Productivity Index with CO2 Emissions
Malmquist2010=>20112011=>20122012=>20132013=>20142014=>2015Average
China1.101.011.041.011.011.04
India1.001.021.011.031.021.02
USA0.981.860.380.970.981.03
Indonesia1.061.031.031.011.001.03
Brazil1.170.900.970.970.960.99
Russia1.011.001.130.881.001.01
Japan1.041.020.900.980.970.98
Mexico1.010.981.011.000.991.00
Germany1.050.991.011.040.941.01
France1.100.931.041.010.870.99
UK1.001.011.021.060.951.01
Italy1.081.131.001.000.981.04
South Africa1.001.021.010.871.030.99
Colombia1.081.001.021.001.001.02
Poland1.020.991.001.001.001.00
Canada1.051.021.000.960.971.00
Saudi Arabia1.000.971.021.001.001.00
Average1.041.050.980.990.981.01
Max1.171.861.131.061.031.04
Min0.980.900.380.870.870.98
SD0.050.210.160.050.040.02
Table 3. The energy productivity scores without CO2 emissions in seventeen countries for the period of 2010–2015.
Malmquist Productivity Index without CO2 Emissions
Malmquist2010=>20112011=>20122012=>20132013=>20142014=>2015Average
China1.241.131.121.091.051.13
India1.040.981.001.040.971.01
USA1.011.540.380.991.010.99
Indonesia1.201.000.990.950.961.02
Brazil1.170.900.970.960.740.95
Russia1.311.053.330.300.661.33
Japan1.041.010.820.950.910.95
Mexico1.070.991.041.040.891.01
Germany1.120.941.031.070.861.01
France1.100.931.051.010.870.99
UK1.070.991.021.100.951.03
Italy1.101.131.011.000.921.03
South Africa1.000.710.650.800.850.80
Colombia1.081.001.010.970.850.98
Poland1.020.991.001.000.920.99
Canada1.091.030.990.950.921.00
Saudi Arabia1.000.770.990.951.000.94
Average1.101.011.080.950.901.01
Max1.311.543.331.101.051.33
Min1.000.710.380.300.660.80
SD0.090.170.610.180.100.10
Table 4. The energy efficiency change of seventeen countries from 2010–2015.
Catchup
Countries2010=>20112011=>20122012=>20132013=>20142014=>2015Average
China1.001.001.001.001.001.00
India0.961.031.001.041.031.01
USA1.001.001.001.001.001.00
Indonesia1.031.021.021.021.011.02
Brazil1.020.901.060.921.000.98
Russia1.000.981.150.881.011.01
Japan1.001.001.001.001.001.00
Mexico0.980.961.021.001.010.99
Germany0.950.991.071.000.971.00
France0.851.071.101.000.930.99
UK1.001.001.001.001.001.00
Italy1.001.001.001.001.001.00
South Africa1.001.001.001.001.001.00
Colombia1.001.001.001.001.001.00
Poland1.001.001.001.001.001.00
Canada0.781.141.121.001.001.01
Saudi Arabia1.001.001.001.001.001.00
Average0.971.001.030.991.001.00
Max1.031.141.151.041.031.02
Min0.780.901.000.880.930.98
SD0.060.050.050.040.020.01
Table 5. The technology change of seventeen countries from 2010–2015.
Frontier
Countries2010=>20112011=>20122012=>20132013=>20142014=>2015Average
China1.101.011.041.011.011.04
India1.050.991.010.990.991.01
USA0.981.860.380.970.981.03
Indonesia1.031.021.000.990.991.01
Brazil1.141.010.911.050.961.02
Russia1.021.020.981.000.991.00
Japan1.041.020.900.980.970.98
Mexico1.031.020.991.000.981.00
Germany1.101.000.951.040.971.01
France1.300.870.951.010.941.01
UK1.001.011.021.060.951.01
Italy1.081.131.001.000.981.04
South Africa1.001.021.010.871.030.99
Colombia1.081.001.021.001.001.02
Poland1.020.991.001.001.001.00
Canada1.340.900.890.960.971.01
Saudi Arabia1.000.971.021.001.001.00
Average1.081.050.951.000.981.01
Max1.341.861.041.061.031.04
Min0.980.870.380.870.940.98
SD0.100.210.150.040.020.01