Introduction
When viewing the external world, observers make eye movements to shift their gaze to foveate objects of interest for further visual processing. Despite many years of research, it is not fully understood how targets for such gaze shifts are selected. Saliency models have been proposed, in which viewers are assumed to shift their gaze to objects and parts of the scene that are likely to attract attention, making use of the distribution of features such as colors, edges, and contrast in the scene (
Itti, Koch, & Niebur, 1998;
Itti & Koch, 2001). Observers, however, also have a strong tendency to fixate the center of an image (
Tatler, 2007) and it has been suggested when quantifying the performance of saliency models, that this central bias needs to serve as the baseline for evaluating a model’s performance, suggesting a crucial role for the central bias in allocating visual attention (
Clarke & Tatler, 2014). Similar support for this essential role for oculomotor biases was found by
Tatler and Vincent (
2009).
The tendency to fixate the center of an image, the central bias, has been consistently found in studies in which participants fixate images (
Parkhurst, Law, & Niebur, 2002;
Tatler, 2007), isolated words (
Vitu, Kapoula, Lancelin, & Lavigne, 2004), head centered video recordings (
Cristino & Baddeley, 2009;
Foulsham, Walker, & Kingstone, 2011;
’t Hart et al., 2009), movie clips (
Dorr, Martinetz, Gegenfurtner, & Barth, 2010;
Tseng, Carmi, Cameron, Munoz, & Itti, 2009), and also when walking around freely (
Foulsham et al., 2011;
’t Hart et al., 2009). In image and video viewing, the bias may represent a bias towards objects of interest. People, when taking photographs, have a tendency to direct the camera in such a way that objects of interest are located in the center of the image, known as the photographer’s bias (
Reinagel & Zador, 1999). Viewers of these images may use this tendency and therefore focus on the center of the image, where objects of interest can often be found due to this bias. In free navigation, the navigator may act as a ‘photographer’ and aim for objects of interest to be located in the center of the image (
Dorr et al., 2010;
Schumann et al., 2008), but more likely, such a possible viewing strategy could reflect a different approach, such as an attempt to keep the eye in mid-orbit, from where it is easier to move the eye quickly (
Biguer, Jeannerod, & Prablanc, 1982;
Pelz & Canosa, 2001;
Tatler, 2007). During free navigation, the observer can make gaze shifts by combining body, head, and eye rotations, and the selection of how to shift one’s gaze may depend on the size of the required gaze shift, although large variability across observers has been reported (
Fuller, 1992).
Establishing the central bias during day-to-day viewing has technological implications. Mobile eye tracking equipment may not be affordable to everyone. Moreover, researchers interested in gaze coordination of larger groups of research participants, for example in school settings or transport hubs, may be interested in lower-cost options to track each individual’s gaze. Glasses with small head-centered video cameras are now widely available at a low cost. These may come in the form of the Google Glass system, the Microsoft HoloLens or other products (e.g., spy-glasses). If we can establish which section of the head-centered video image provides the best heuristic to estimate an observer’s direction of gaze, and if we can determine how accurate such heuristics would be, equipment such as spy-glasses may provide a reasonable gaze tracking alternative.
Past studies of the central bias in day-to-day viewing have focused on navigation and its comparison to viewing the same images during head-fixed eye tracking (
Foulsham et al., 2011;
’t Hart et al., 2009). During navigation, gaze is directed at objects at a relatively large distance, which could influence the relative contributions of head and body movements to gaze shifts. When viewing objects at a larger distance, gaze shifts across larger angular distances can be obtained by relatively small shifts in the orientation of the eyes, and therefore eye movements may be preferred over head movements. On the other hand, navigation involves large body and head movements, and eye movements may be made to compensate for these movements. Because of these possible influences of larger viewing distances, it is therefore important to establish whether the central bias persists when tasks are performed that involve viewing objects at a closer distance. Although studies have examined eye movements during other day-to-day tasks, such as tea making (
Land, Mennie, & Rusted, 1999), driving (
Land & Lee, 1994), and sports (
Land & McLeod, 2000), none of these studies have reported the spatial distribution of gaze positions or have directly compared these spatial distributions across tasks. Fixed-head eye tracking using images on a computer screen has suggested that task modulates the pattern of eye movements (
Castelhano, Mack, & Henderson, 2009;
DeAngelus & Pelz, 2009;
Tatler, Wade, Kwan, Findlay, & Velichkovsky, 2010;
Yarbus, 1967), but it is unclear how these results extend to day-to-day tasks.
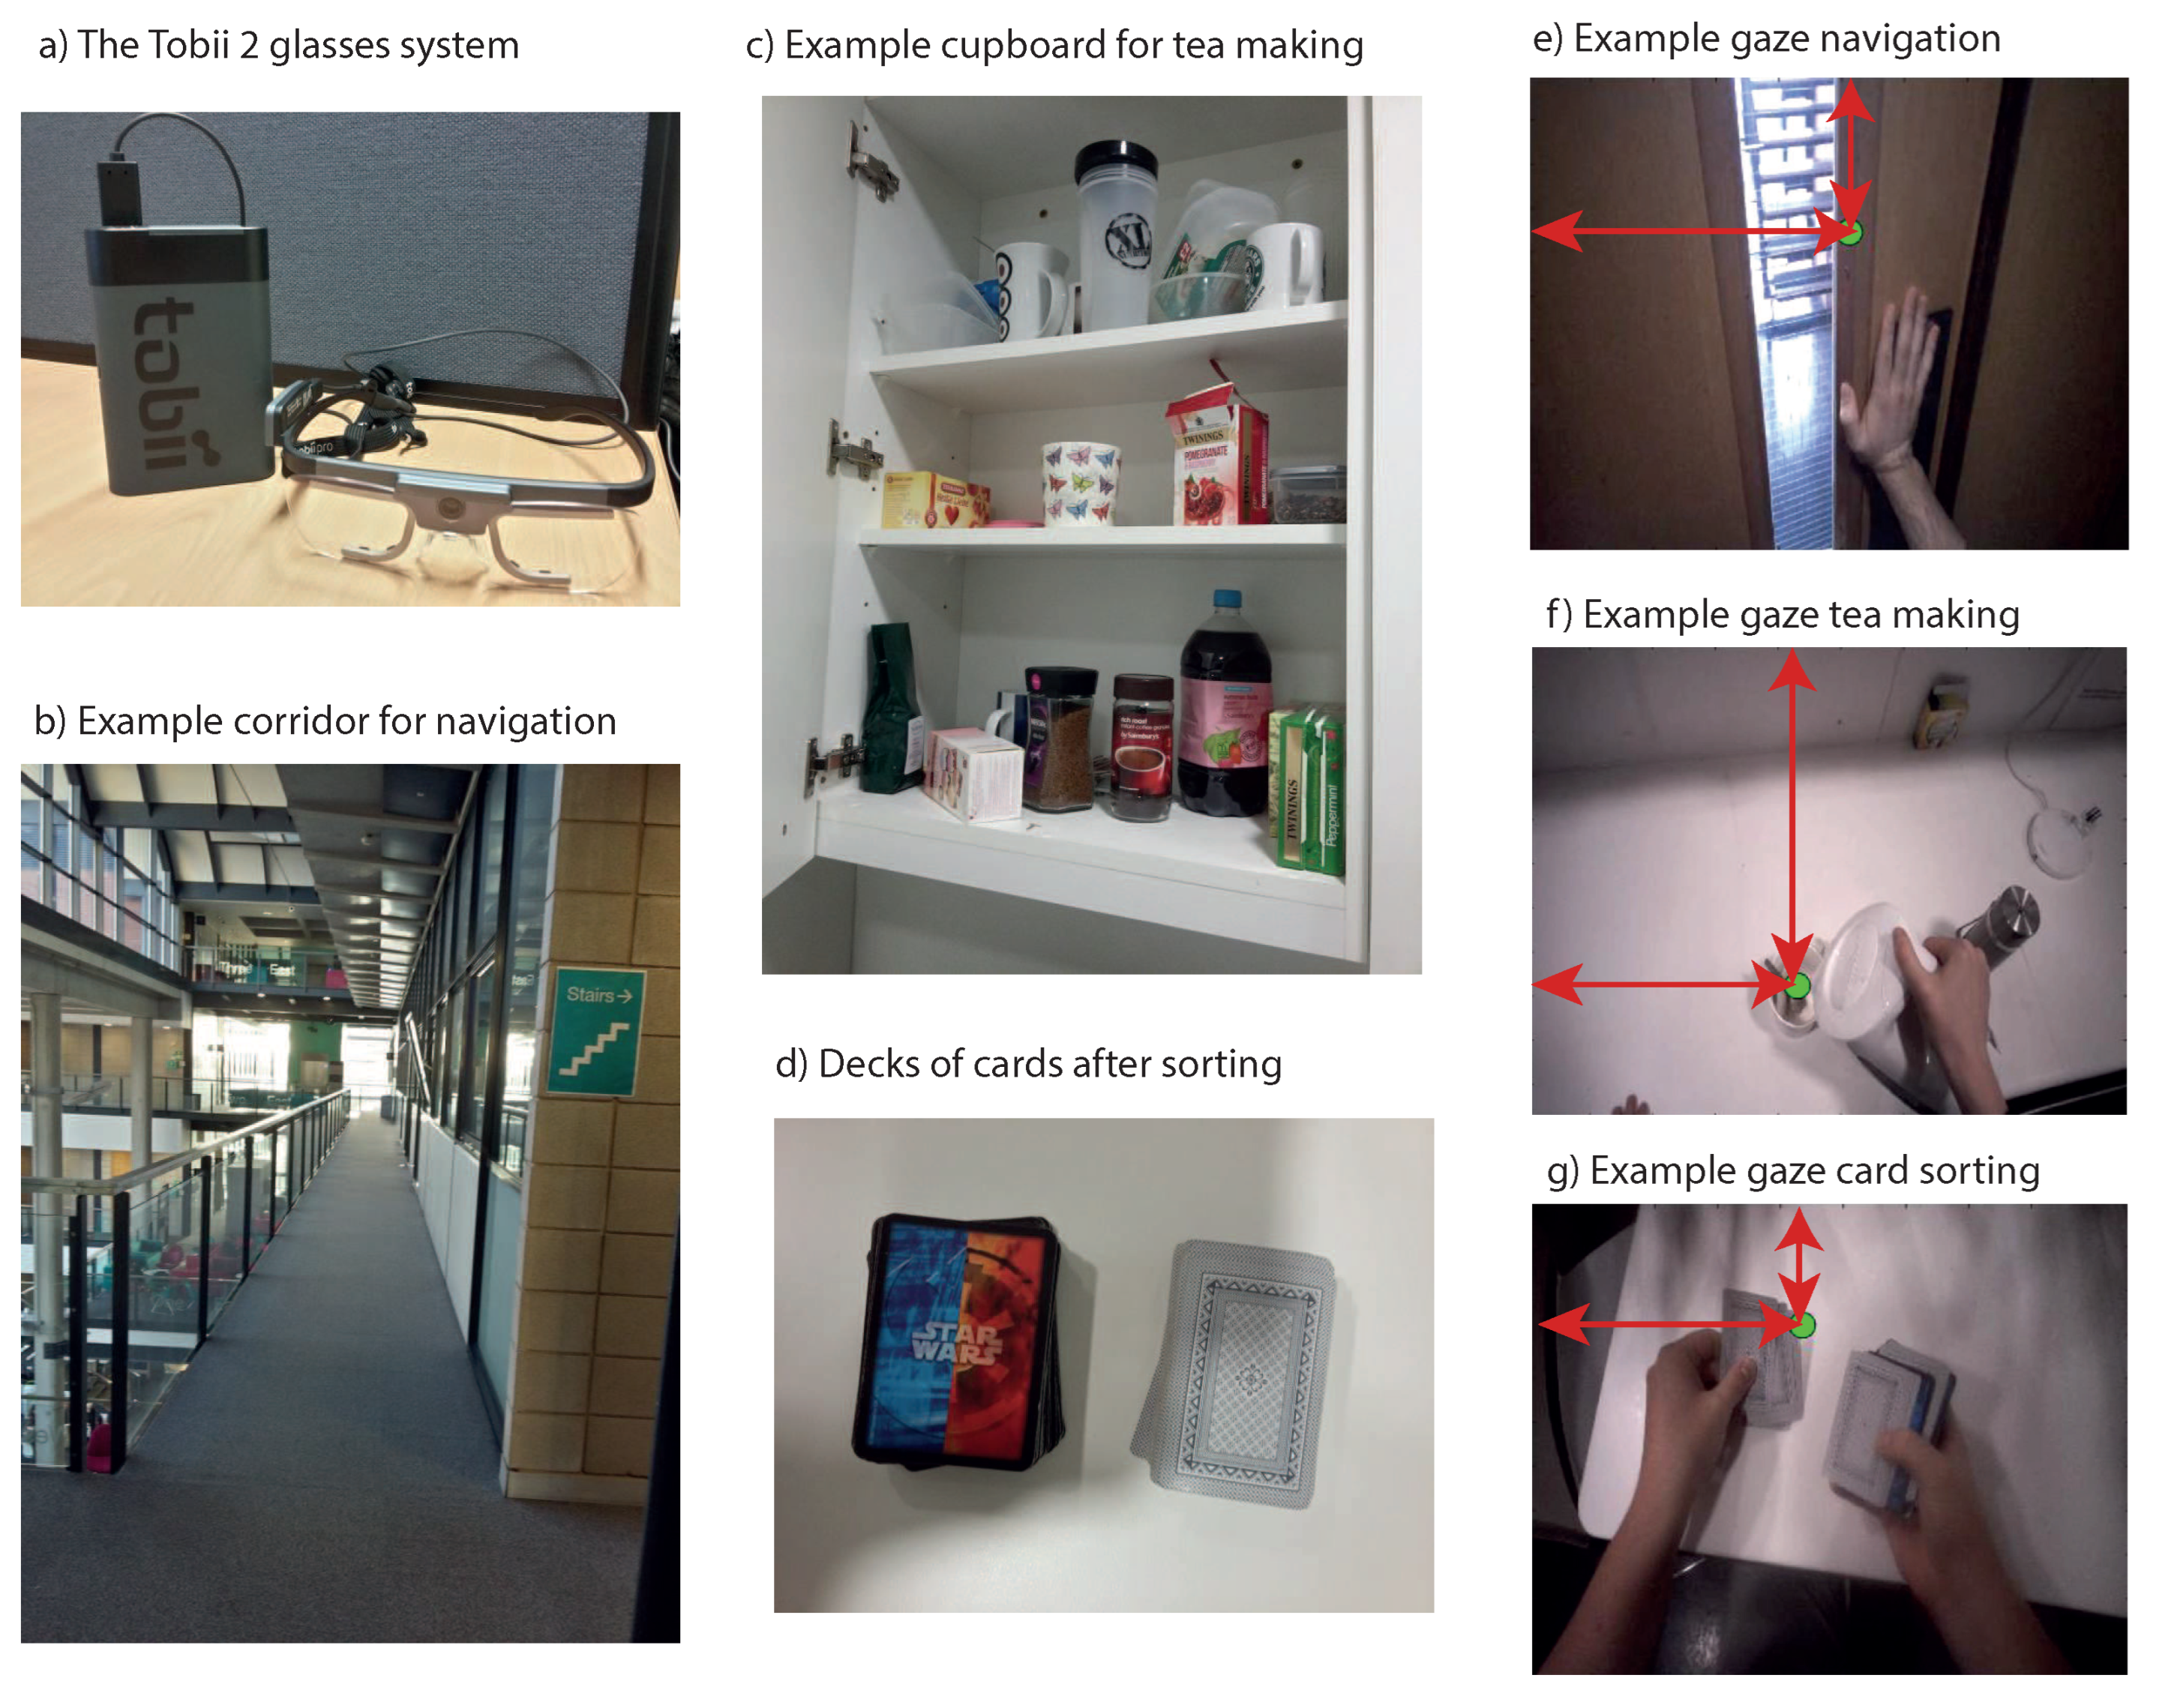
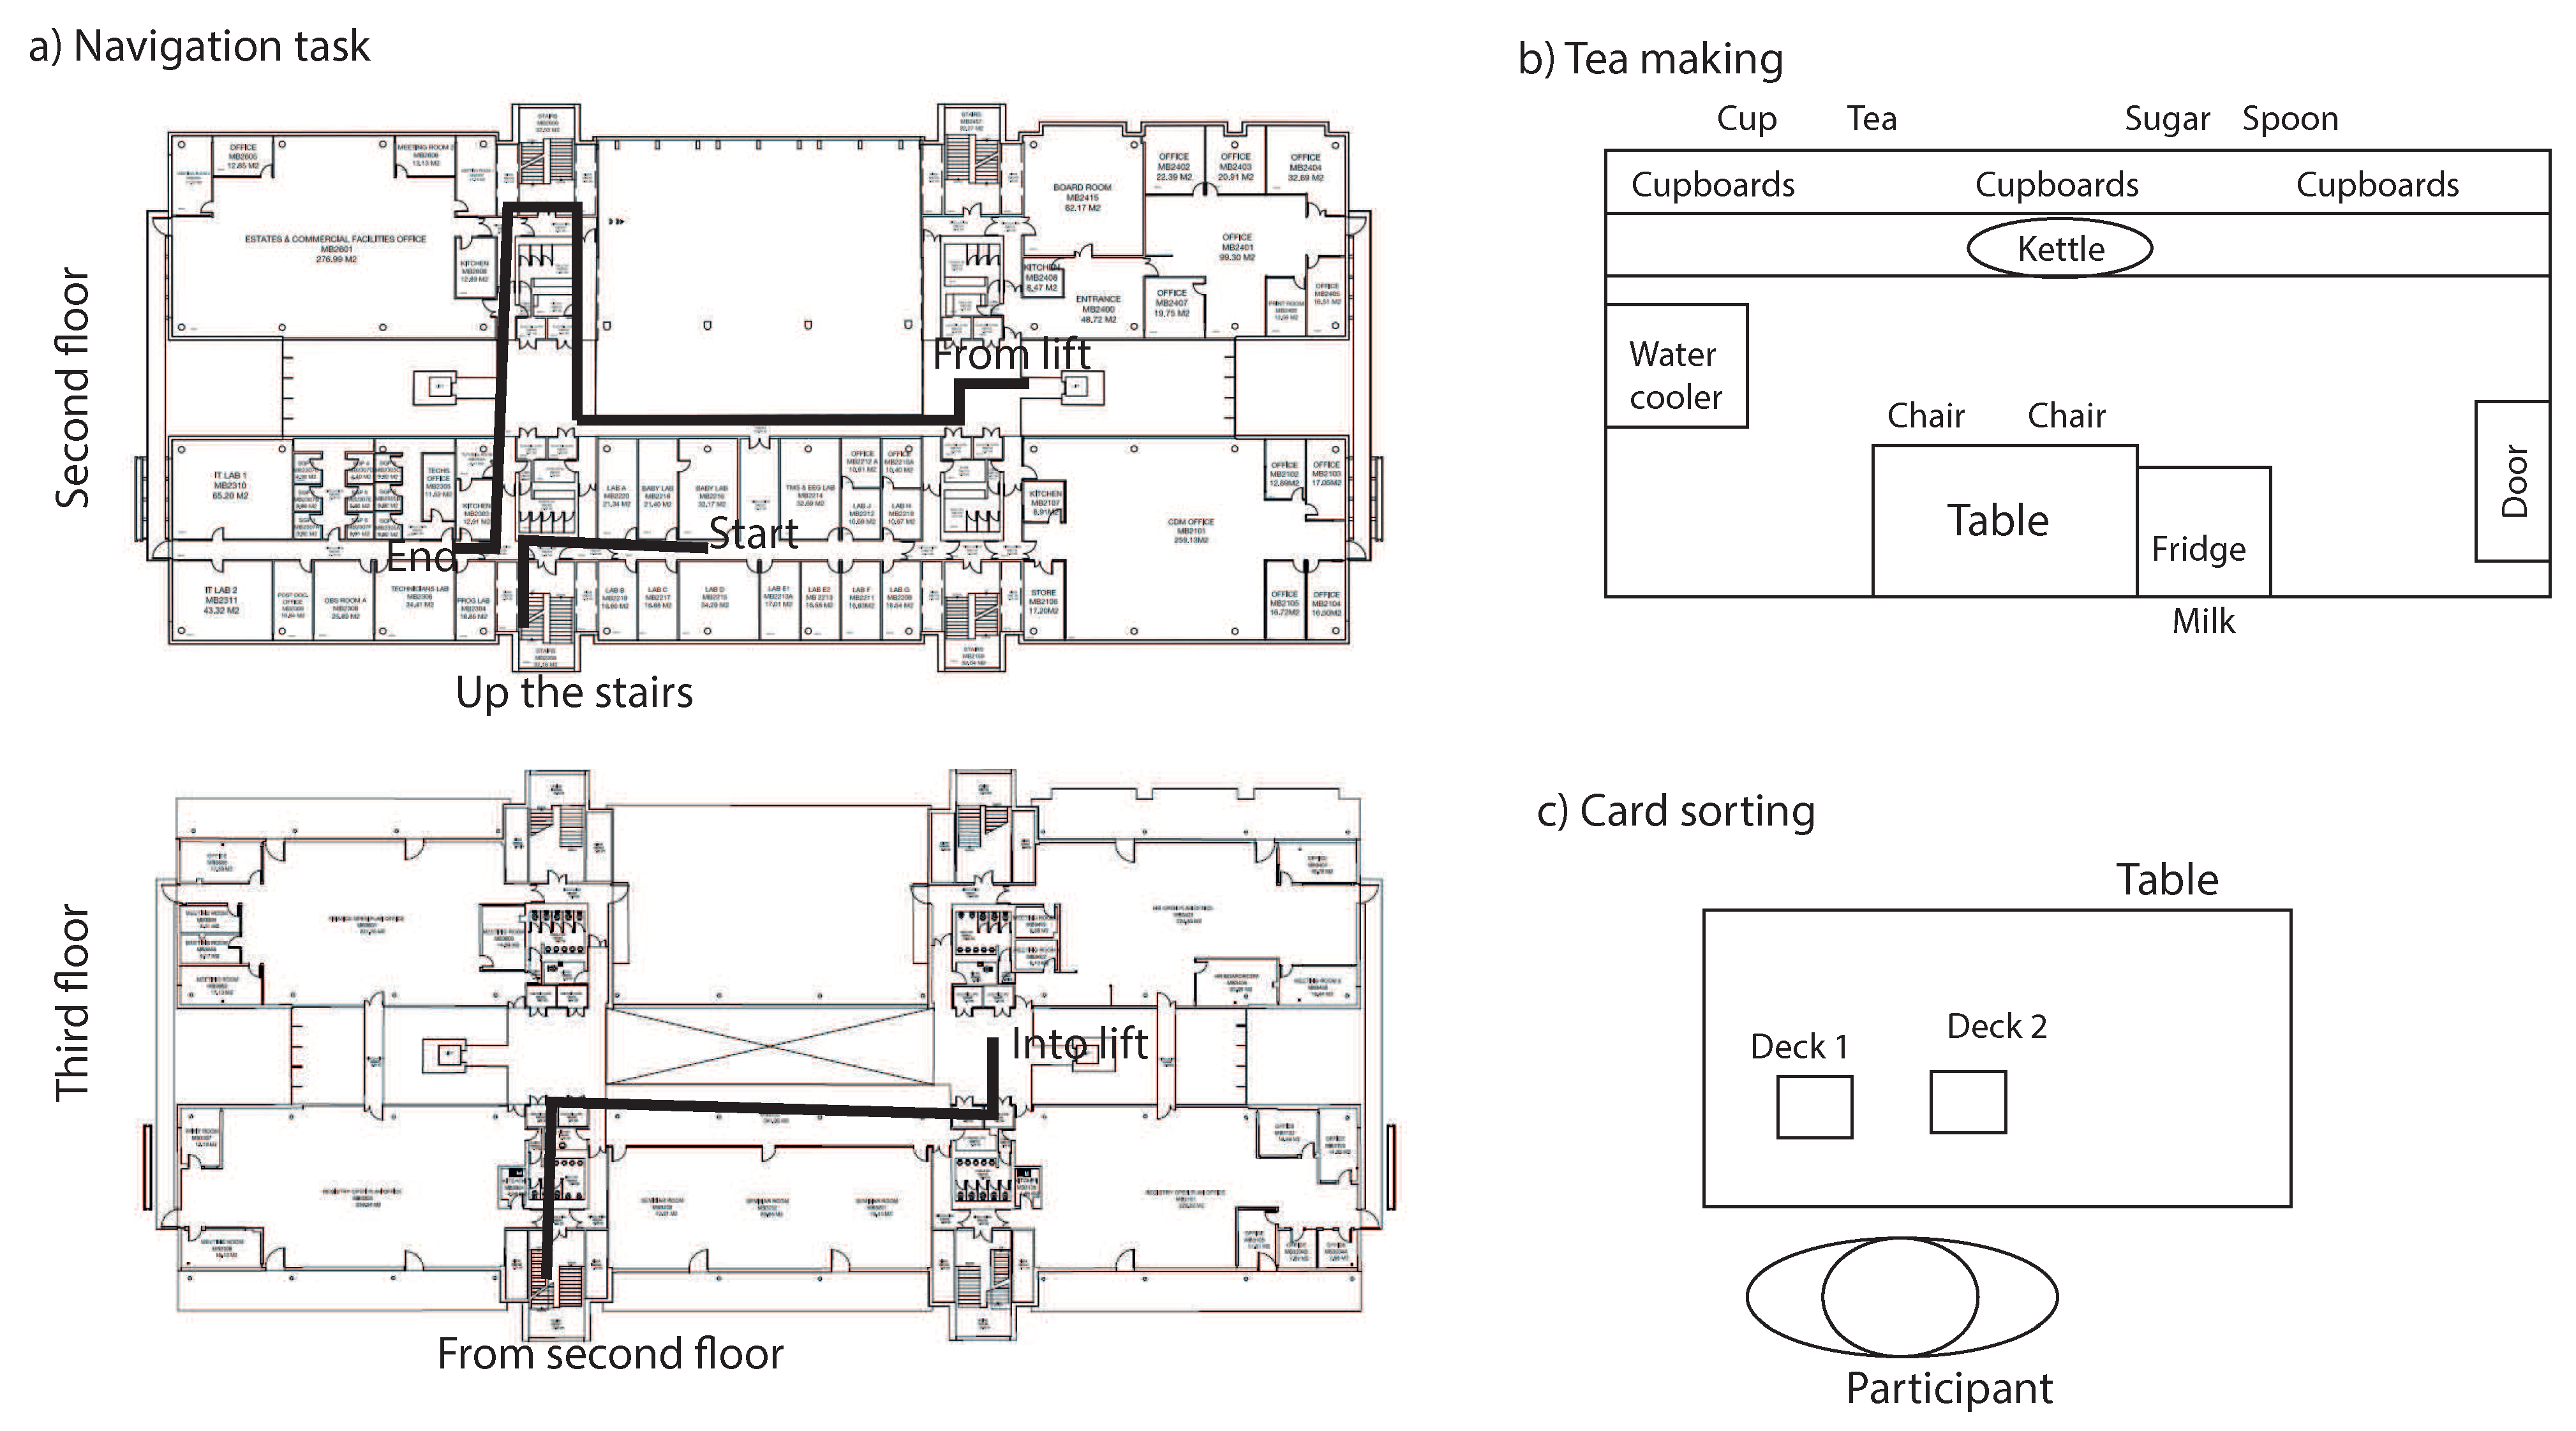
The present study therefore aims to directly compare the central bias across three different tasks, each involving interactions with objects at different distances (see
Table 1 for estimates of the distances involved in each of the tasks). As a baseline, a navigation task was used, which should compare to earlier studies of the central bias in navigation (
Foulsham et al., 2011;
’t Hart et al., 2009). This task involves looking at relatively large distances, in which observers look where they are going. While the task may also involves shorter viewing distances, for example when opening a door or pressing an elevator button, the overall viewing distance is relatively large (
Table 1). The navigation task was compared to tea making (a classical task in this context, Land et al., 1999), which involves interacting with objects at arms-length or slightly further away (before initiating the grasps of the objects), and to card sorting, where the objects involved (the decks of cards) are typically held near the body (at less than an arm’s length). By comparing the tasks, we compare two hypotheses. If compensatory eye movements for head and body movements dictate the distribution of gaze positions, the largest spread of gaze position across the headmounted video image is expected for navigation, followed by tea making, and card sorting. If, on the other hand, gaze shifts are mostly reflecting making adjustments of the viewing angle towards objects at small and large distances, because objects at large distances require smaller head or eye turns than objects at smaller distances, the largest deviations of gaze position are expected for card sorting, followed by tea making and navigation.
Results
Figure 3a provides 2D histograms of all the samples recorded in each of the three tasks (samples across all participants). The plots suggest that participants fixated mostly along the vertical midline of the video images, without any clear task influences.
To study the distribution of individual participants,
Figure 3b plots the gaze distribution of each of the participants in the form of an ellipse around their average gaze position, with separate horizontal and vertical radii equal to the standard deviation for that participant. Although many ellipses overlap, there is some variation in the position and size of the ellipses across participants.
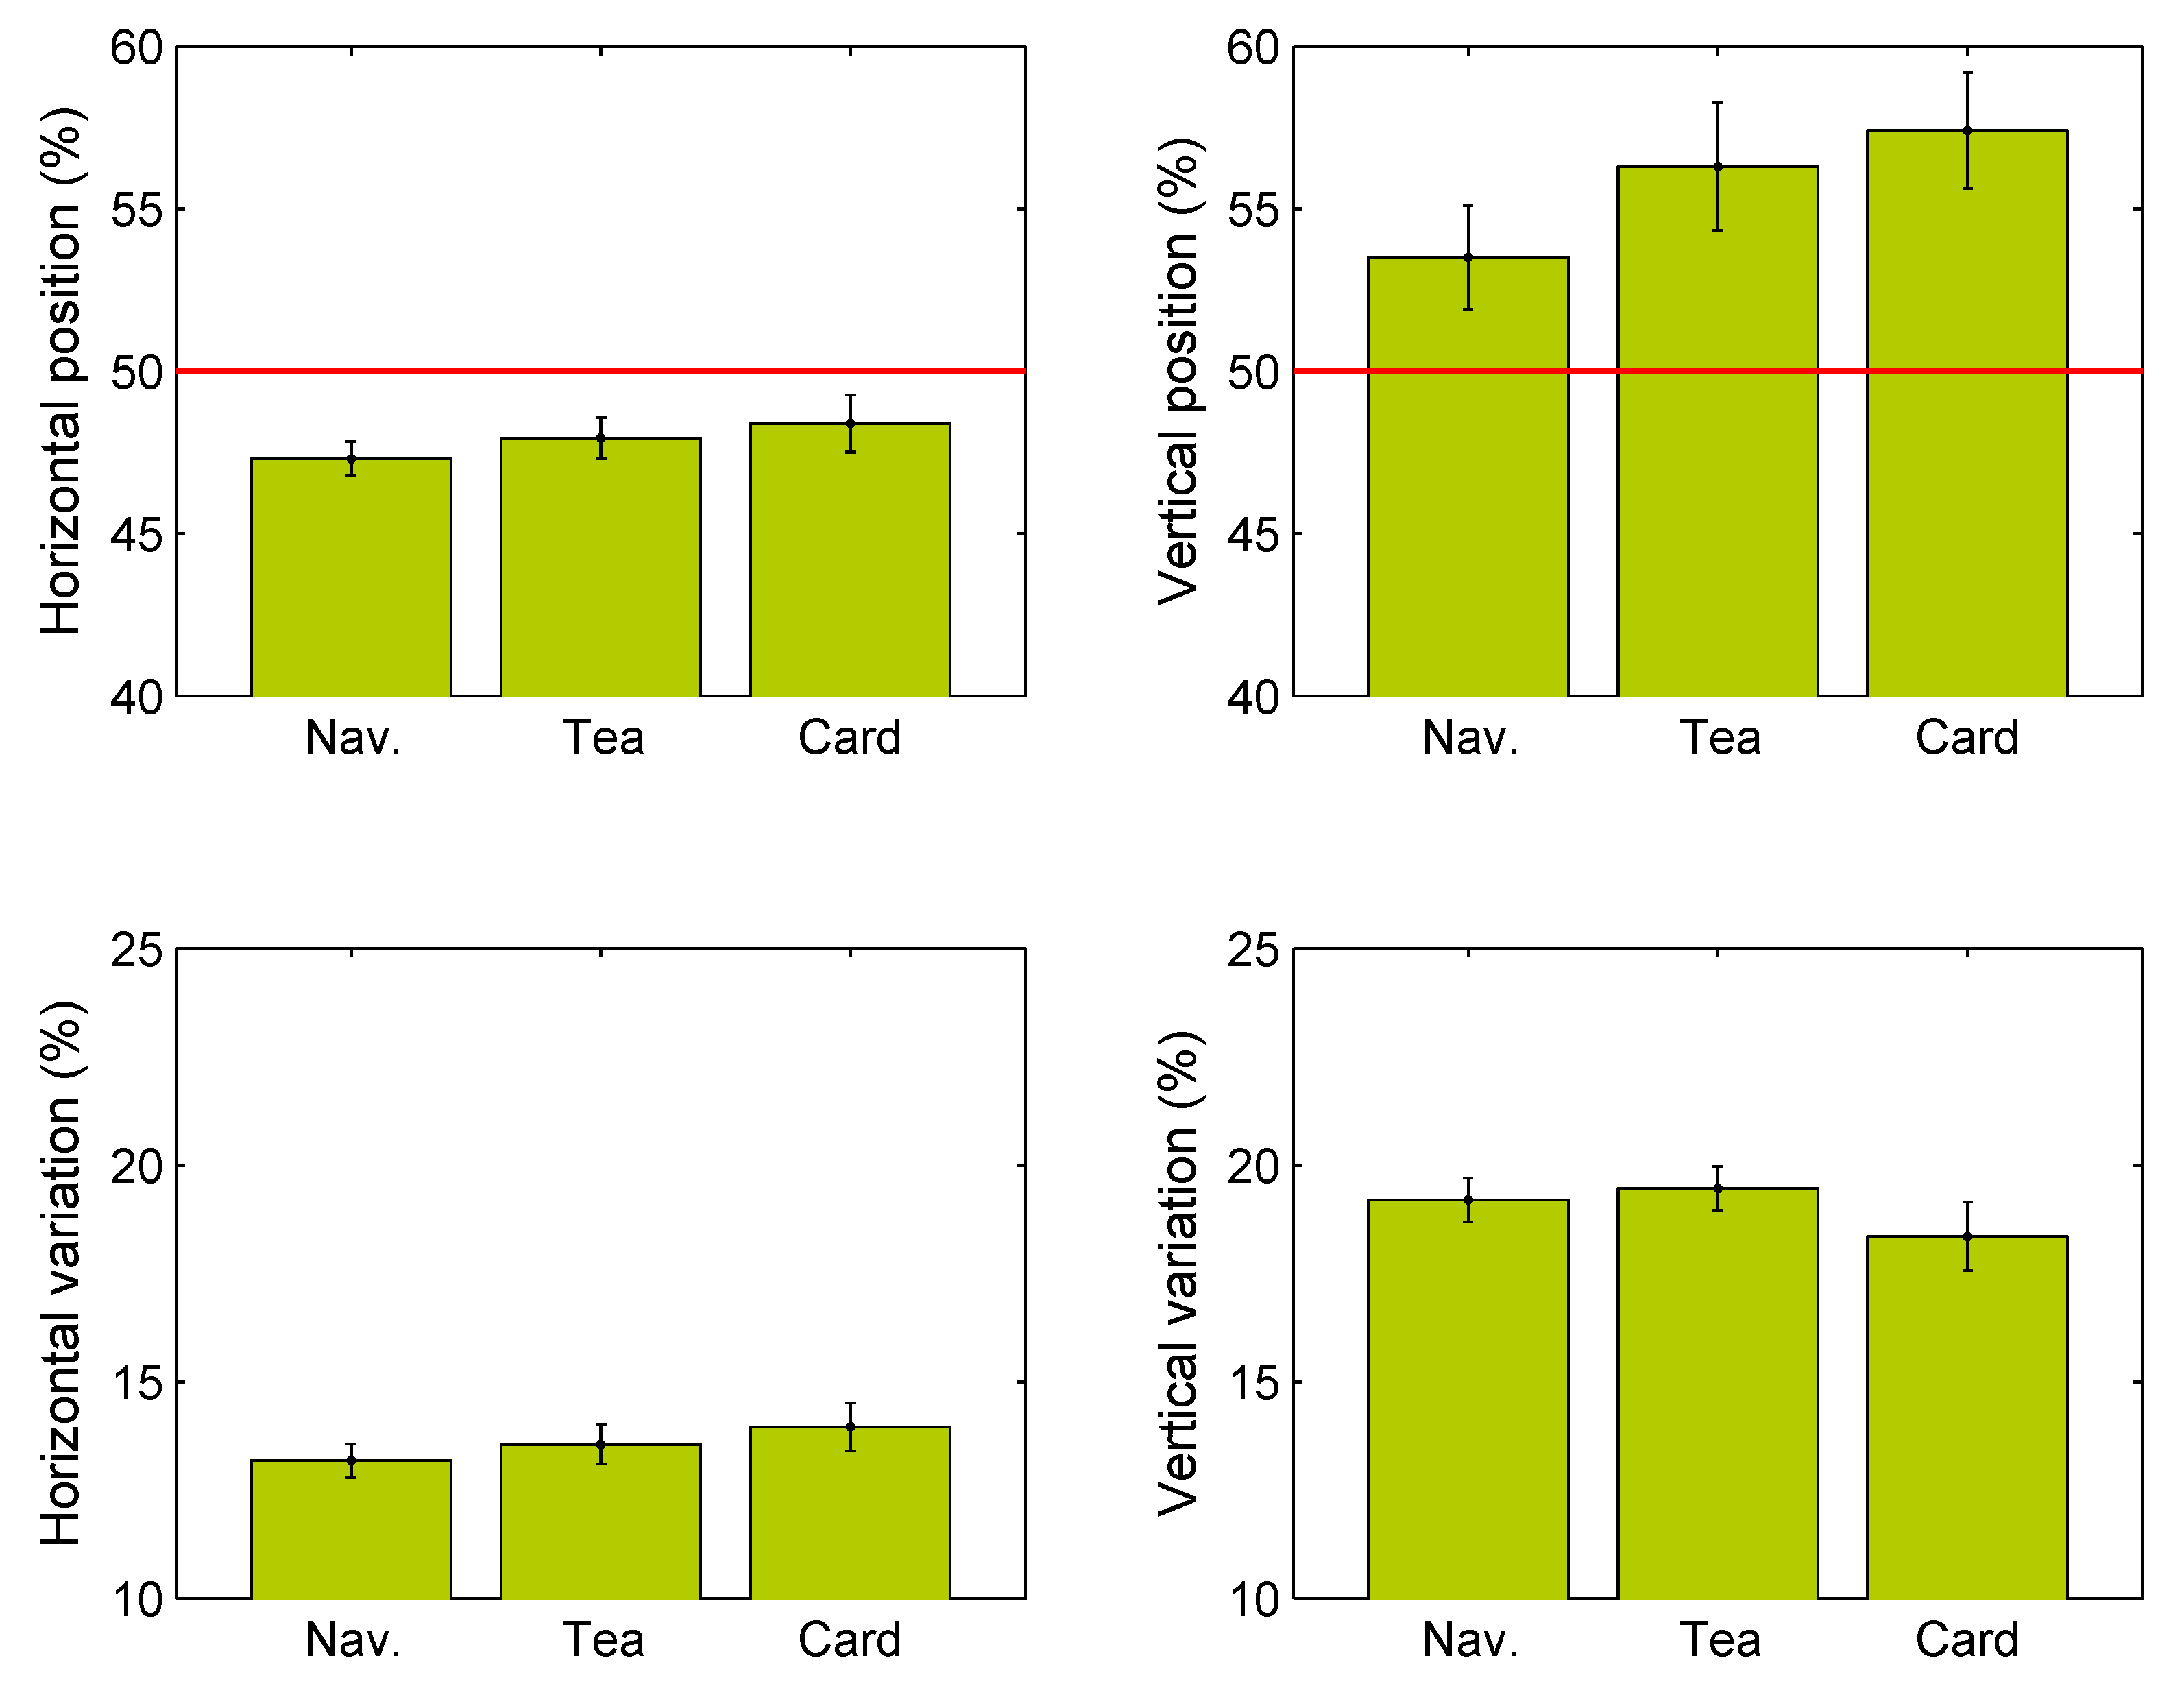
To quantify the bias in gaze position and the variability in gaze position,
Figure 4 plots the average gaze position and standard deviations of gaze position across tasks. The data plotted here were obtained by computing the average gaze location in the image for each participant separately, as well as the standard deviation of these locations, which were then averaged across participants. Gaze locations are shown as a percentage of the width and height of the video image. Repeated measures ANOVAs and BF10 factors (indicating the evidence in support of the alternative hypothesis against the null hypothesis) showed no effect of task on the horizontal gaze position (F(1.7,68.7) = 0.90, p = 0.39,
= 0.022, BF10 = 0.164) and no effect of task on the vertical gaze position (F(2,82) = 1.71, p = 0.19,
= 0.040, BF10 = 0.32). Likewise, no effect of task was found on the horizontal (F(2,82) = 0.81, p = 0.45,
= 0.019, BF10 = 0.16) and vertical standard deviations (F(1.4,55.8) = 0.86, p = 0.39,
= 0.020, BF10 = 0.17). Moreover, effect sizes were relatively small (all
< 0.1).
One-sample t-tests showed that horizontal gaze positions were left of the vertical midline for the navigation task (t(41) = 5.06, p < 0.001, d = 0.78; medium to large effect size) and tea making task (t(41) = 3.26, p = 0.0023, d = 0.50; medium effect size), but not for the card sorting task (t(41) = 1.83, p = 0.075, d = 0.28; small effect size). The same tests for vertical gaze positions showed that gaze was directed above the horizontal midline for the tea making task (t(41) = 3.20, p = 0.0027; d = 0.34; small effect size), and the card sorting task (t(41) = 4.15, p < 0.001; d = 0.49; medium effect size), but not for the navigation task after adjusting the critical p-value using a Bonferroni correction (t(41) = 2.20, p = 0.033; d = 0.64; medium effect size). Paired samples t-tests showed that vertical standard deviations were larger than horizontal standard deviations for all three tasks (all p<0.01 after Bonferroni correction).
Data loss
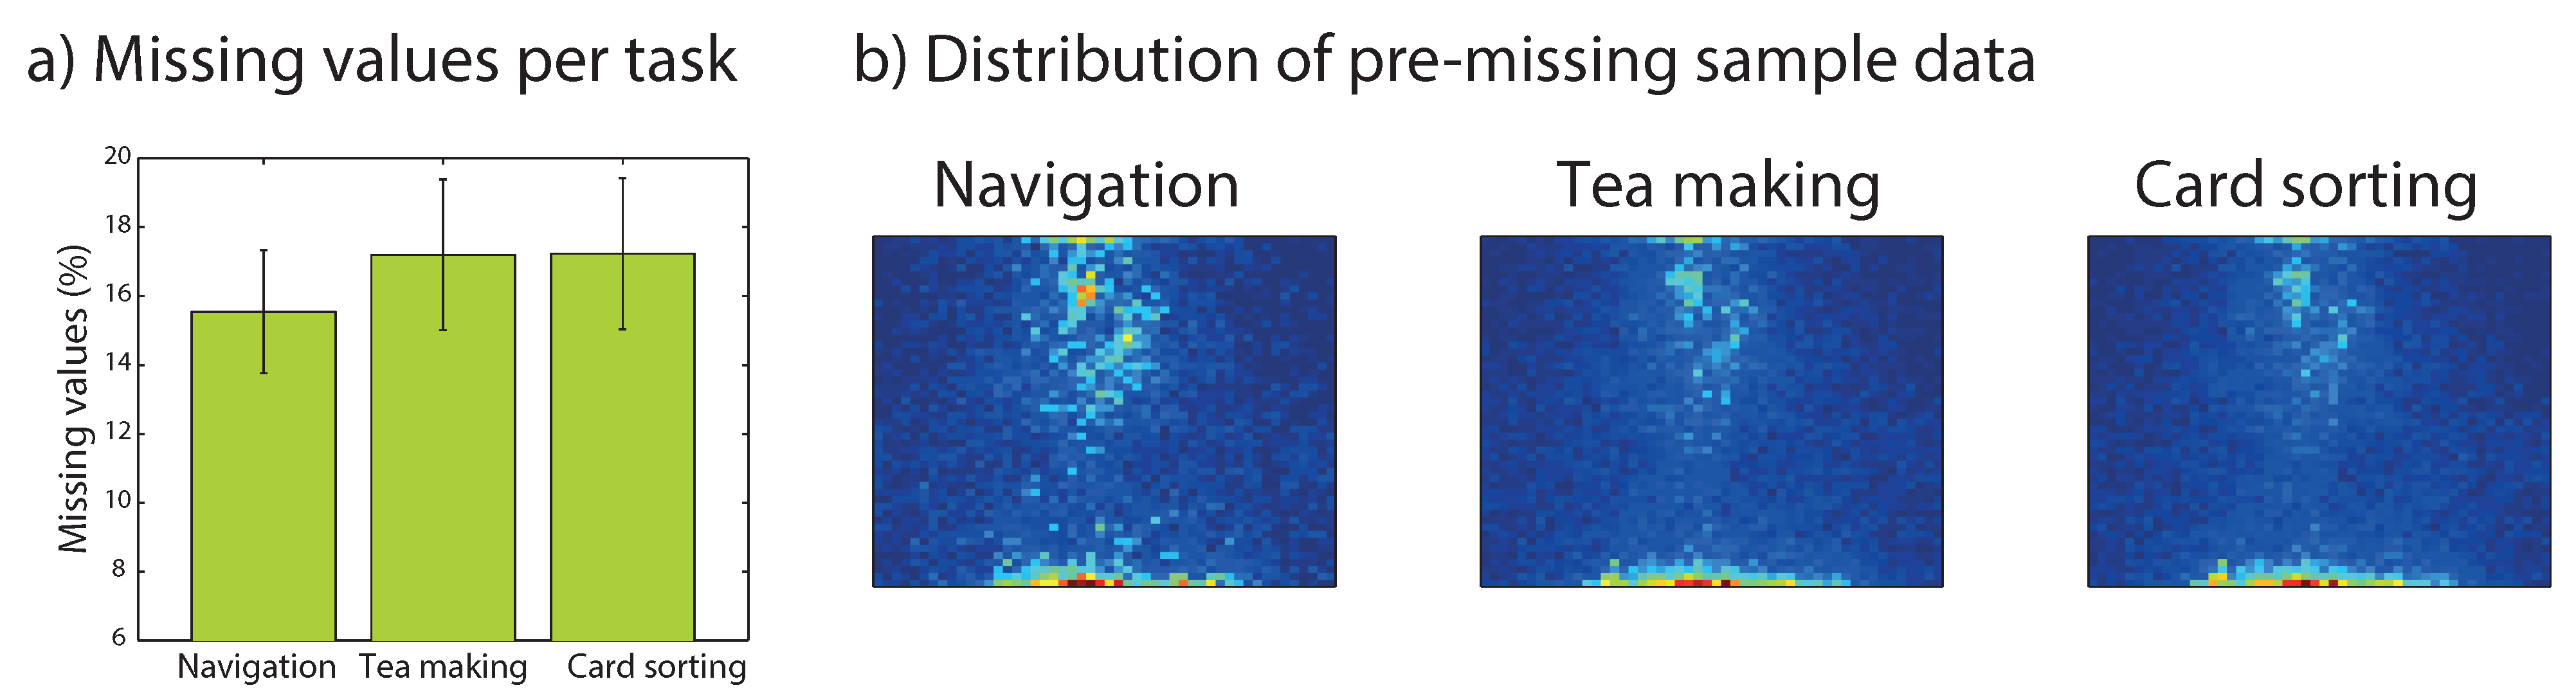
A possible cause of the central bias that needs to be examined is that recording of eye gaze may be worse along the edges of the head mounted video image. This cause cannot be directly investigated (as the data are missing), but we can determine whether data loss varies across tasks, and where the observer was looking just before data loss occurred (which may give an indirect indication of the possible cause).
Figure 5a shows that missing values occurred for around 17% of the samples. While missing values tended to be slightly less frequent for the navigation task, the difference between the three tasks did not reach statistical significance and a Bayesian analysis suggested that the evidence for the null hypothesis (no task effect) to be a factor 10 times the evidence for the alternative hypothesis (F(2,82) = 0.32, p = 0.73,
= 0.008, BF10 = 0.099).
The spatial distribution of the samples just before missing values is provided in
Figure 5. It shows that for all three tasks, just before a missing value, the observer most likely fixated the lower edge of the head mounted image. Missing values therefore appear to be mostly due to participants looking down with their eyes and less by turning their head downwards. Other missing values are preceded by samples along the vertical midline. These may be due to blinks, but this would need to be investigated further in mobile eye tracking systems that explicitly code for blinks in the data. Overall, the distribution of the samples of missing data do not suggest that the central bias in our data is due to the system failing to measure eye gaze at the edge of the video image (there is no ring of pre-missing-value-samples away from the edge of the video image).
Using the bias as a heuristic for gaze position
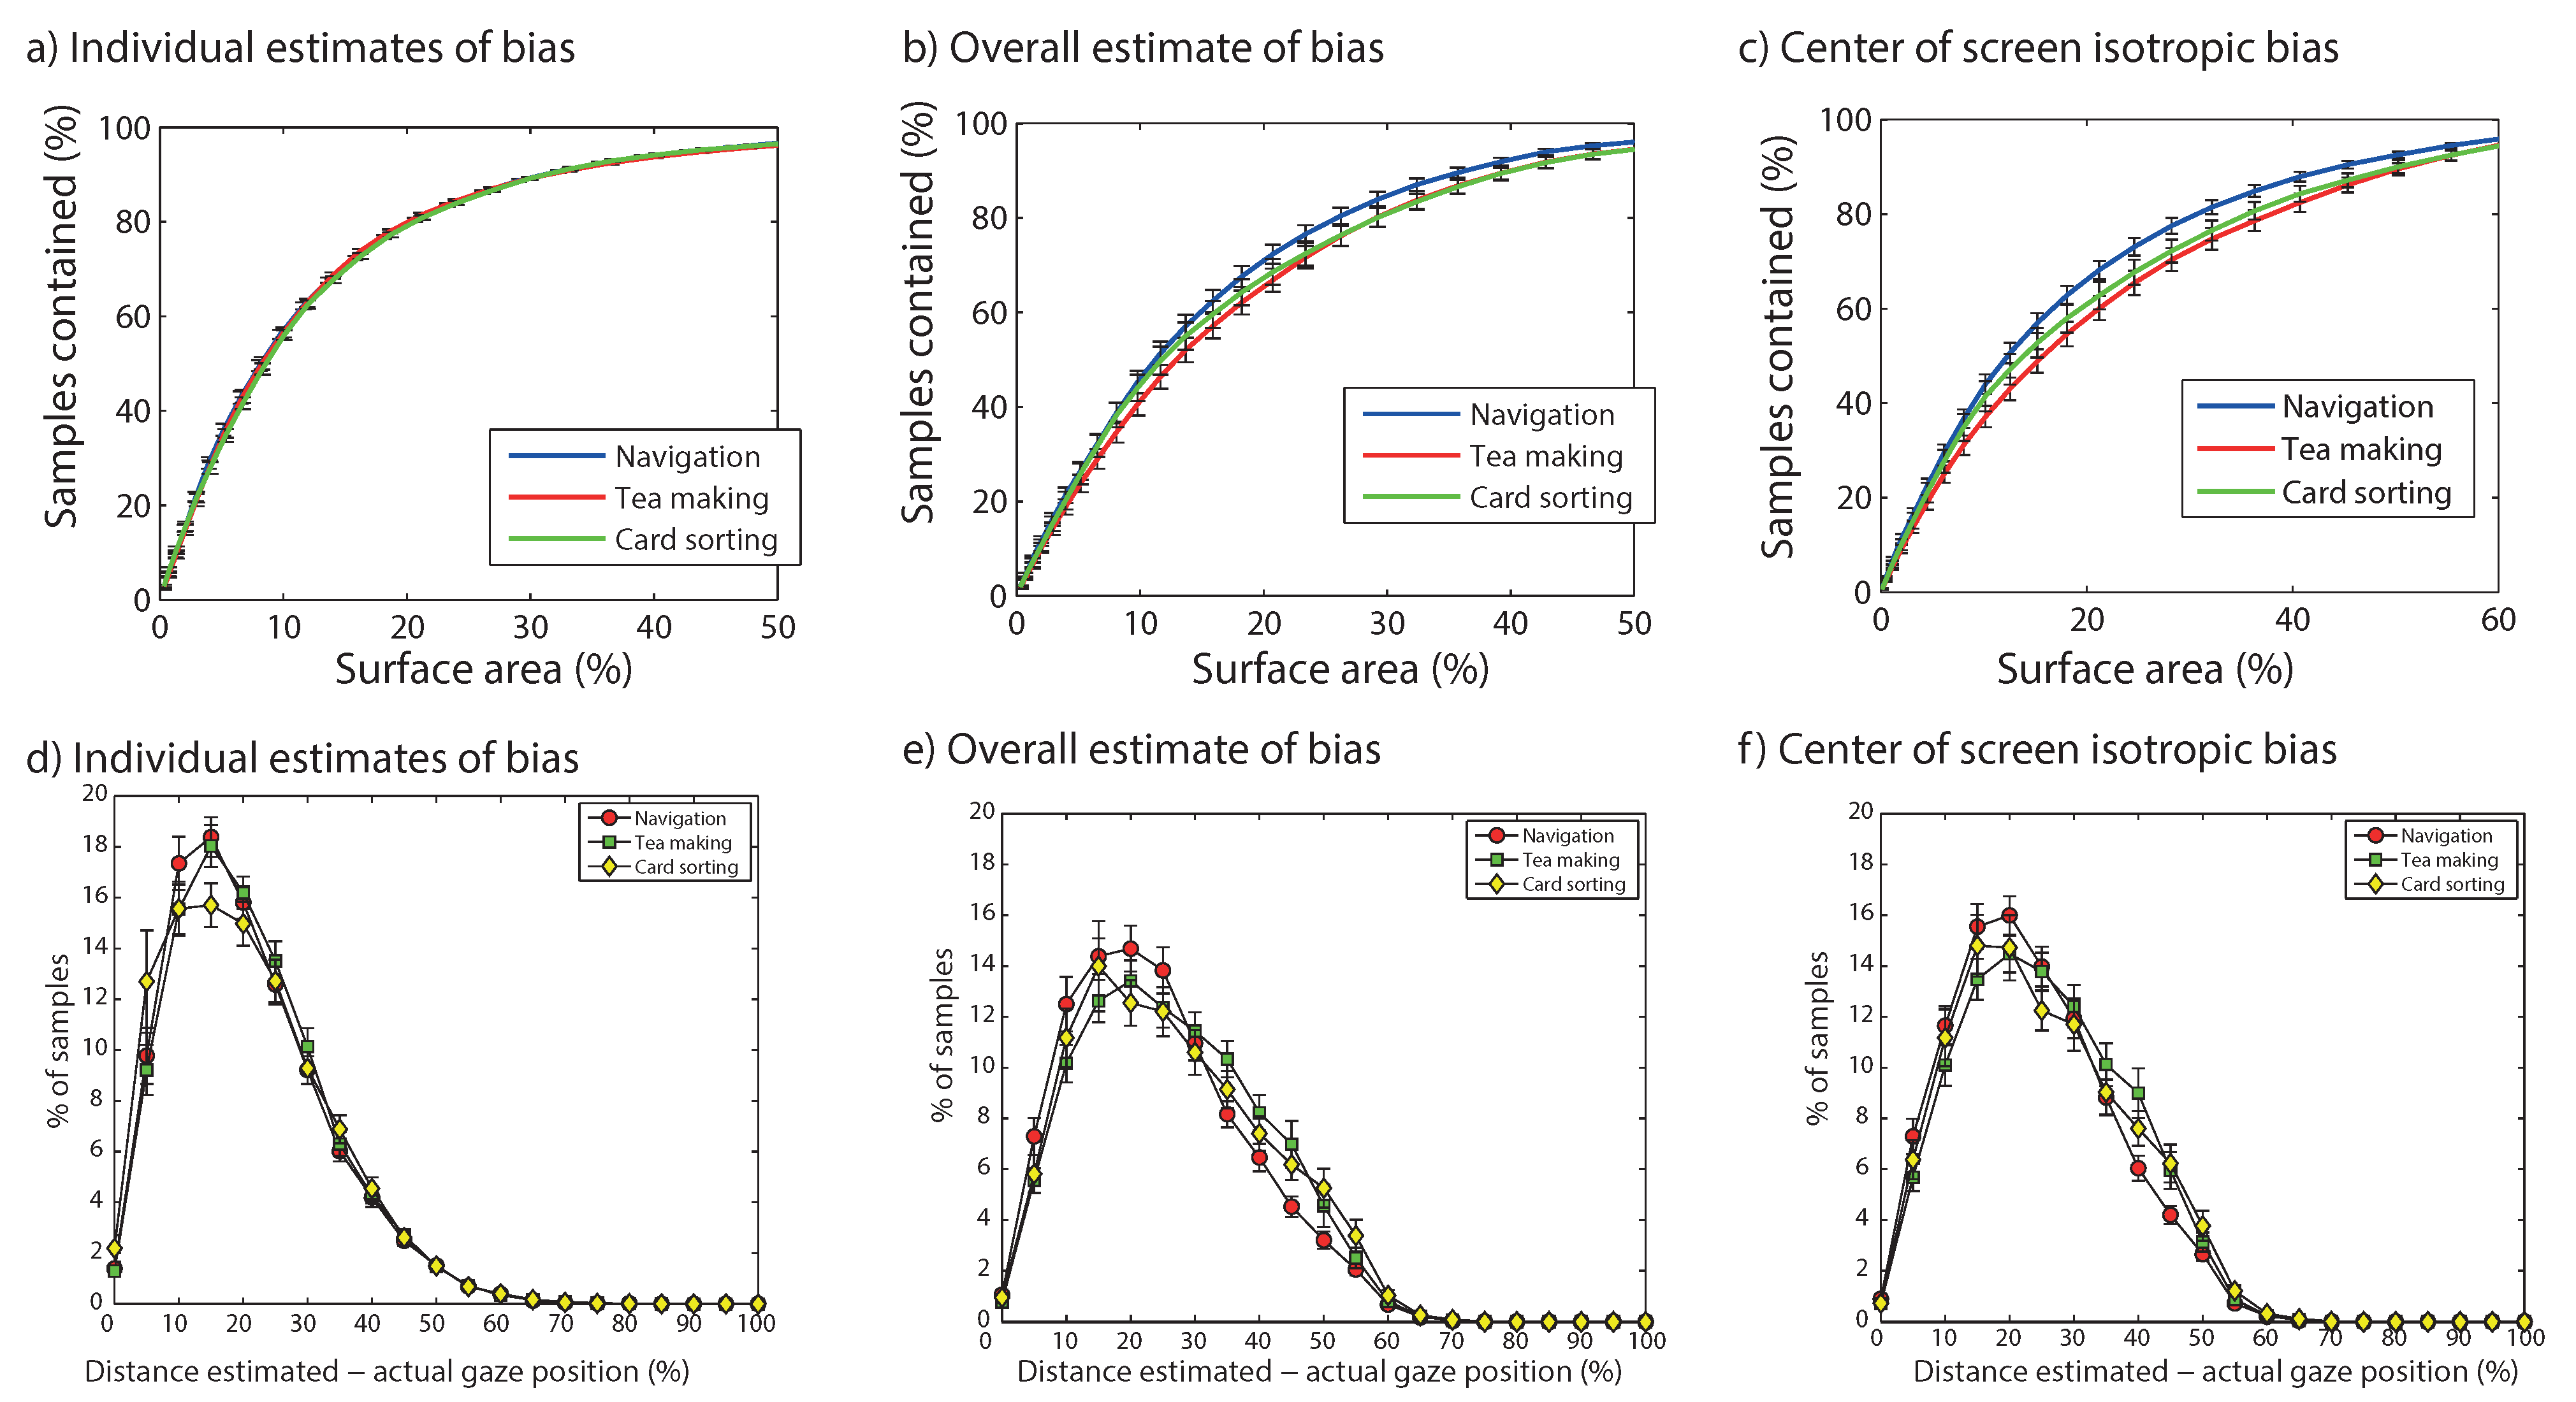
The average data show that participants systematically fixate near the center of the head-centered image, and that this tendency was unaffected by the task participants performed. To establish whether these findings can be used to estimate where in the head-centered image participants fixate without eye tracker information, we compute two measures. First, we determine what percentage of samples of the eye tracking data are contained within ellipses around the participants’ average gaze bias of various sizes. With this measure, it is possible to determine what area of the video image from the head mounted camera needs to be considered to capture a certain percentage of gaze points. The second measure considers the histogram of distances between estimated gaze position (on the basis of the central bias) and the actual gaze position. Three different strategies will be considered, differing in the amount of information used from the present findings.
Individual ellipses. A first strategy would be to first record a sample of a participant’s eye movements with a mobile eye tracker, and then remove the mobile eye tracker and fit the participant with the head-mounted video camera (e.g., spy glasses). A slight complication of this method would be that the direction of the video camera in both systems would need to be identical (i.e., how much it points downwards or upwards), but for the sake of the present analysis, this is assumed to be the case. For such an approach, one eye tracker would need to be available. For each participant a ‘calibration’ is performed, in which the central bias for that participant is estimated using the mobile eye tracker. After this calibration phase, participants are then entered into the group testing phase of the study and each asked to wear a head-centered video camera (which can be spyglasses instead of mobile eye trackers). The central bias measured with the mobile eye tracker for each participant can then be used to estimate where people are looking on the basis of the head-centered video images.
In terms of data analysis, the ellipse estimating where the participant fixates in the video image is based on that participant’s mean and standard deviation of the gaze position acquired with the eye tracker during the ‘calibration’ stage. To evaluate how well such an approach would work,
Figure 6a plots the number of samples contained within ellipses for each participant as a function of the area occupied by the ellipse (as a percentage of the video image). This done for a range of ellipse sizes from near 0% of the image to near 50% of the image. During this process, we used the observed horizontal and vertical standard deviation of gaze positions for each participant to determine the shape of the ellipse, and multiply these standard deviations by an increasing factor to increase the size of the ellipse. The results suggest that to capture 80% of participants’ gaze locations, a surface of around 20% of the image is needed and a surface of around 30% of the image to capture 90% of the samples. Across the three tasks, we find that similar size ellipses are needed to capture the same number of samples.
Figure 6d provides another view of how good estimates are on the basis of people’s individual central biases. In this plot, histograms are provided of the distance between the actual gaze position and the center of the individual participants’ ellipses (used as estimates of where the look on the basis of the head mounted video image only). This shows that most samples are at around 20% of the size of the video image (horizontal and vertical deviations weighted equally), with only few samples beyond 40% of the size of the image. For the card sorting task, there appear to be more observations with smaller distances from the actual position, but the difference with the other two tasks is small.
Use data from present study. A second strategy would be to use the present data and compute an average gaze location across tasks and participants (as shown in
Figure 4), and to use these data as an estimate where in the head-centered image participants fixate. This strategy would suit labs without an eye tracker, but with head-mounted video cameras, and takes advantage of the present results. As with the first strategy, the success of the approach depends on whether the angle of the head-mounted video camera (the amount by which it looks down or up from the participant’s head) is similar across configurations. For the present analysis, we assume it is.
Figure 6b provides an estimate of how large the area of the ellipse based on these estimates need to be to contain a certain percentage of gaze points. The estimates differ slightly across tasks (with navigation needing the smallest ellipes), but overall, to capture around 80% of the samples, a surface area of around 30% is needed with this second strategy. To capture 90% of the samples around 40% of the area of the image is needed. In terms of distances between the actual and estimated gaze positions, using the average bias across participants increases the proportion of samples at longer distances from the actual difference than by using individual biases (
Figure 6e).
Assume central fixation. A final strategy is to assume participants look in the center of the image and that their horizontal and vertical standard deviation of gaze points are identical. This strategy does not require an eye tracker, and assumes that people tend to look at the center of the head mounted image.
Figure 6c estimates the size of the surface area of the image needed to a certain percentage of gaze points. To capture 80% of the gaze points, an area of around 36% of the image is needed, whereas to capture 90% of the samples around 50% of the image is needed. Smaller ellipses are needed for the navigation task than for tea making or card sorting, possibly because vertical gaze positions were slightly closer to the midline for this task (
Figure 4). The distances with the actual gaze position (
Figure 6f) do not differ much with respect to the second method considered, using the central bias observed in the present study (
Figure 6e).
Periods away from the central bias
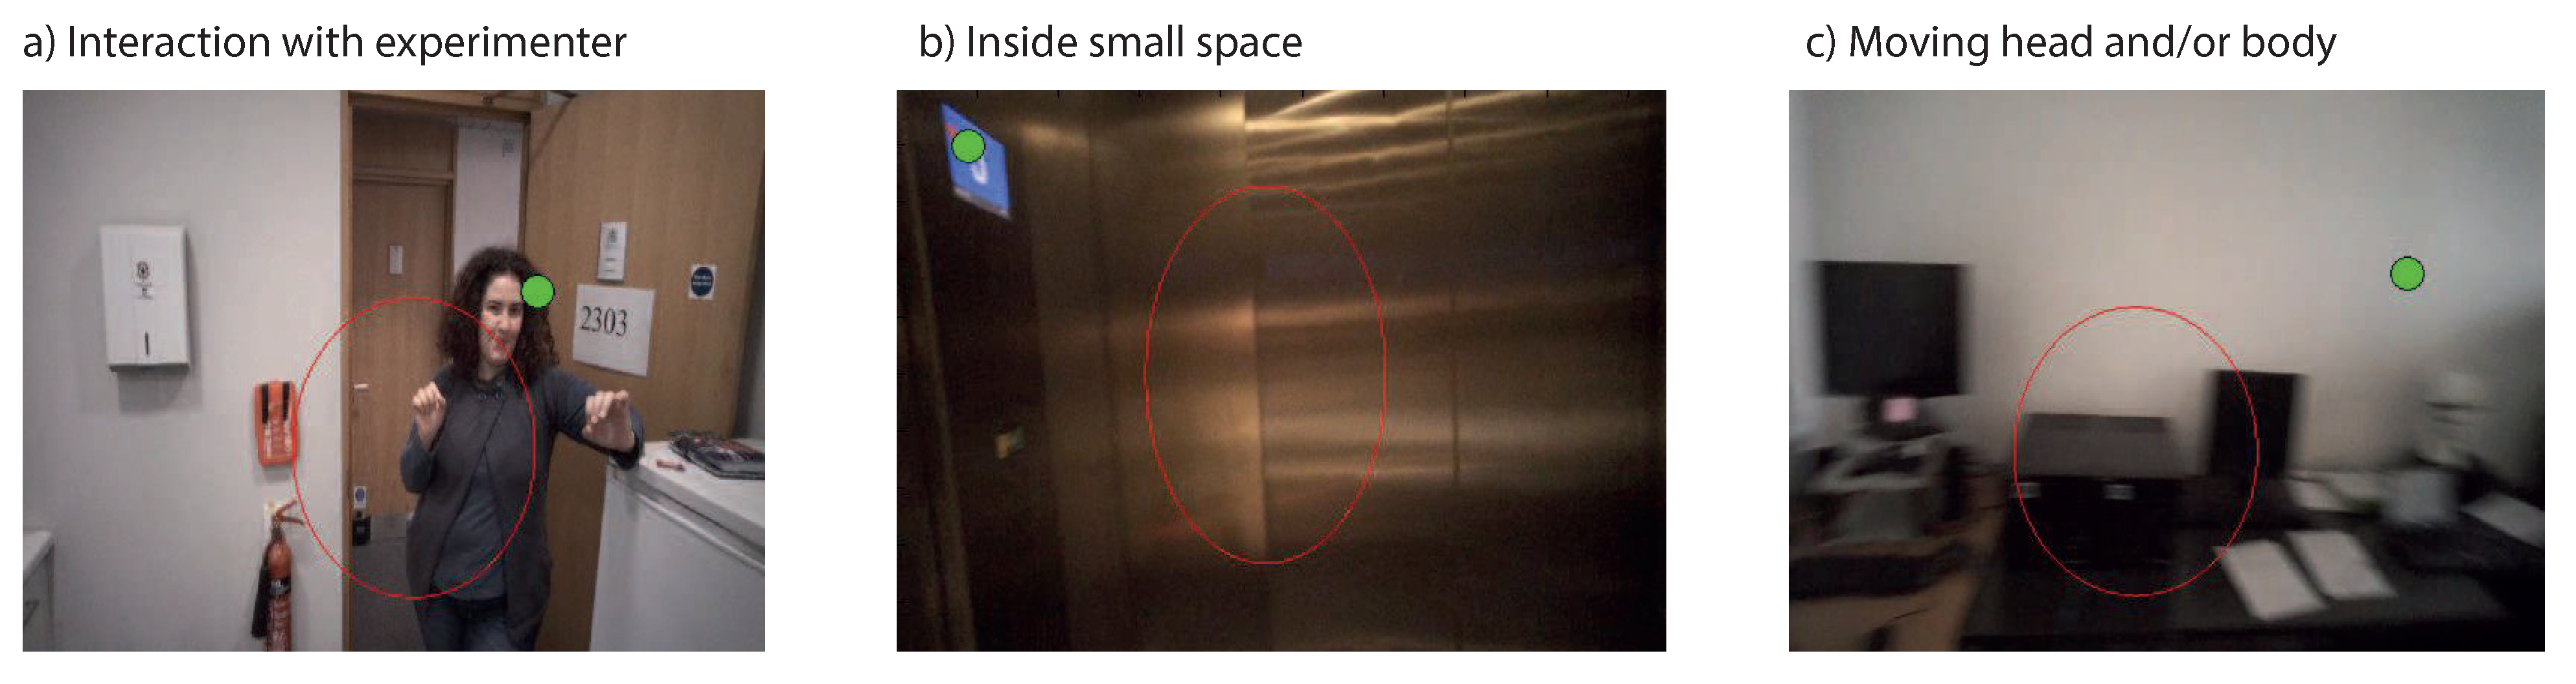
One approach to improve eye tracking on the basis of the head-centered video image alone, is to determine when participants fixate outside the center region, and to examine whether any common aspects can be found for periods of fixation outside the center region. Possibly, such periods can be detected on the basis of visual properties of the video image (e.g., motion blur), allowing for these sections of the video to be removed so that they do not contaminate the analysis.
To examine what happens during periods of fixation outside the central regions, sequences of gaze positions outside an ellipse centered around a participant’s average gaze position and with a width and height of 1.25 times the standard deviation that lasted at least 5 samples (83 milliseconds) were extracted. Visual inspection of the extracted frames suggested that viewing outside the central region occurred mostly (1) when interacting with the experimenter, (2) moving one’s head or body (resulting in image blur), and (3) when inside a small space (e.g., a lift; see
Figure 7).
Discussion
To examine how task influences the central bias in gaze behavior in day-to-day viewing, we recorded eye movements from participants while they performed three different tasks (navigation, tea making, card sorting) while wearing a mobile eye tracker. We chose these tasks to reflect a range of viewing distances (
Table 1) to examine whether the central bias is influenced by this factor. Analysis of the data showed a strong bias towards (slightly left and above) the center of the head centered video image, which was independent of the task participants performed.
In our study, we found a bias towards gaze locations along the vertical midline, with systematically larger vertical variability in gaze locations than horizontal variability. These results contrast with earlier observations when tracking eye movements towards static and dynamic images using head-fixed eye tracking. In this latter situation, the distribution of gaze points tends to be along the horizontal midline (e.g.,
Cristino & Baddeley, 2009;
’t Hart et al., 2009), although a wide horizontal distribution is not systematically found (e.g.,
Tatler, 2007). The larger vertical variability also contrasts with some findings in mobile eye tracking (
Kretch & Adolph, 2015;
’t Hart et al., 2009), although the bias towards the horizontal midline was weaker for outdoor navigation (
Foulsham et al., 2011) and in infants (
Kretch & Adolph, 2015).
Participants in our study tended to look slightly left of the vertical midline. Such a leftward bias was also found by (
Foulsham et al., 2011) while walking (mobile eye tracking), but not while watching (with a stabilized head eye tracker). Other studies, however, have reported leftward biases during stabilized head eye tracking. For example, when viewing fractals, observers’ first saccade tended to be directed towards the left (
Foulsham & Kingstone, 2010). This tendency to make a first leftward saccade was also found for viewing natural scenes (
Foulsham, Gray, Nasiopoulos, & Kingstone, 2013) and in face perception (
Butler et al., 2005). Leftward biases are also found in the distribution of fixations, for example in face perception (
Guo, Meints, Hall, Hall, & Mills, 2009;
Guo, Smith, Powell, & Nicholls, 2012;
Hermens & Zdravković 2015) and visual search (
Durgin, Doyle, & Egan, 2008). Leftward biases for faces have been explained from a right-hemispheric dominance in processing faces, but observations of leftward biases in other tasks (navigation, tea making, scene perception) suggest that the leftward bias in eye movements may have a different cause. Leftward biases in eye movements may relate to reading direction (e.g.,
Chokron & De Agostini, 1995;
Spalek & Hammad, 2005), and it would therefore be interesting to investigate gaze biases during day-to-day tasks in participants with a dominant reading direction other than left-to-right (e.g., in Hebrew, or Asian writing systems).
Previous research has suggested that observers tend to fixate more towards the top of the image for interiors and more towards the bottom of images for urban scenes (
Parkhurst et al., 2002). Our data suggest that for indoor navigation, like in outdoor navigation (
Foulsham et al., 2011), there is a bias towards the top half of the image. Vertical biases in mobile eye tracking, however, need to be interpreted with care, as the recorded gaze position in the image depends on how the scene camera is oriented with respect to the observer’s head, and may therefore vary with the equipment used. To examine the extent to which the vertical bias is due to the equipment used, future studies should examine the bias for identical tasks with the different eye tracking systems, and methods should be developed to align the recorded video images of different eye tracking systems. Presently, we can only compare vertical biases (e.g., across different tasks) within the same participant measured with the same system. Differences in the orientation of the head-mounted camera can also explain why the size of the area of the video image containing 90% of all gaze points was smaller when participant specific regions were used, compared to when the region was based on data from all participants (as the downward angle of the scene camera may vary across participants).
Previous work has suggested a stronger central bias with more object interactions (
Bambach, Crandall, & Yu, 2013). Our tasks varied in the number of such interactions. In navigation, object interactions were infrequent and mostly involved opening doors, holding hand rails, and pressing lift buttons (an estimated 8 object interactions per participant, based on a random subset of 10 the participants). More object interactions took place during tea making, involving opening cupboard doors, and handling the objects involved in making the tea (an estimated 34 object interactions per participant). Finally, card sorting involved continuous handling of objects (the cards). Because we did not find a difference between tasks in the central bias, our data therefore suggest no role for the number of object interactions in the central bias, but it is unclear why we reach a different conclusion from
Bambach et al. (
2013) on this matter. It should be noted that our study was not specifically designed to investigate this matter and therefore future studies should address this issue further with tasks specifically designed to compare the amount of object handling while keeping all other conditions constant.
In our study we relied on one system (the Tobii 2 glasses), which uses binocular recording, 3D modeling of the human eyes and a single point calibration method to estimate where observers are looking in the head mounted image. How this particular method compares with methods applied by other systems that may use monocular eye recordings, offline calibration methods, flexible orienting of the head mounted camera, and other methods of mounting the system on observers’ heads, is unclear. Data from our navigation task generally agrees with those obtained by (
Foulsham et al., 2011) using a different system, which suggests that the biases that we observe are linked to human viewing strategies rather than to how the data are measured, but future studies should investigate this matter in more detail.
It may be tempting to interpret the present results and those from earlier mobile eye tracking studies (
Foulsham et al., 2011;
Kretch & Adolph, 2015;
’t Hart et al., 2009) as evidence for a photographer’s bias as the cause of the central bias, as, for example, put forwards by
Tseng et al. (
2009) (however, see
Tatler, 2007). In this bias, objects of interest are placed in the center of the image by the photographer, which could explain why eye tracking towards these images shows a bias to the center. During day-to-day tasks, the observer may adopt a similar strategy, and place objects of interest in the middle of the head-centered image (
Dorr et al., 2010;
Schumann et al., 2008). Such an automatic ‘photographer’s bias’ (turning one’s head towards objects of interest) may explain why the central bias is found both when freely navigating (head movements allowed) and when watching videos of someone else navigating (no head movements allowed,
Foulsham et al., 2011;
’t Hart et al., 2009). The photographer’s bias in day-to-day, however, is likely to have a different cause than the aesthetic considerations that may underlie the bias for images. A likely candidate is the tendency of humans to keep the eye centered in its orbit (one of the causes of the central bias suggested by
Tatler, 2007), where the position of the eye can be best estimated (
Biguer et al., 1982;
Pelz & Canosa, 2001), and from which the eye can most easily rotate into different directions. In such an interpretation, what the bias shows is that people move their head when orienting towards objects of interest, rather than shifting their eye gaze within the head.
Our results suggest that the central bias provides a reasonable heuristic for estimating where people look on the basis of a head-centered video image, in agreement with earlier suggestions that the bias provides a good baseline for predicting where observers fixate in static images (
Clarke & Tatler, 2014;
Tatler & Vincent, 2009). Our analysis shows that when the bias of a particular participant is known, 90% of an observer’s gaze samples are contained in a window of around 30% of the image. While this is still a relatively large section of the image, which may contain several objects (e.g., while it will not be possible to tell what word a person is fixating while reading a text, it will probably tell whether the observer is looking at the book, or the wall instead), it demonstrates that a global sense of observers’ eye movements can be obtained from a head mounted video image alone.
Our analysis also demonstrated that there were certain situations where observers tend to fixate outside the central window (interacting with people, during head and body movements, inside narrow spaces). For applications in which head-mounted cameras are used as a method to estimate an observer’s gaze, it would be best to exclude these intervals, because it is likely that the observer’s cannot be guessed from the central bias. Events such as these may be detected for example by tracking people’s head movements (with technology such as that used in mobile phones and tablets) or by applying computer algorithms to detect motion blur in video images (
Tong, Li, Zhang, & Zhang, 2004), by using binocular information from eye tracking systems to estimate the average viewing distance (to detect small spaces), or software to automatically detect faces in video images (
Hsu, Abdel-Mottaleb, & Jain, 2002;
Jesorsky, Kirchberg, & Frischholz, 2001;
Yang & Huang, 1994) to detect social interactions. Further improvements in estimating the direction of the observer’s gaze in head-mounted video recordings may be obtained by applying saliency models (e.g.,
Itti & Koch, 2001), but applying such models will be computationally expensive, and may not always be a feasible option. At present we can only speculate why participants deviate from the central bias in the observed circumstances. Possibly, direct looks at the relatively unfamiliar experimenter were avoided (
Foulsham, Walker, & Kingstone, 2009;
Laidlaw, Foulsham, Kuhn, & Kingstone, 2011). Possibly, participants avoid turning their head in small spaces. And possibly, the eyes move before the head follows in day to day tasks, but such explanations need to be studied in more specifically designed future studies.
Our results have direct implications for emerging technologies, allowing for the recordings and streaming of videos from the users’ point of view. A possible application would be to provide direct information about fixated objects via visual feedback to the person wearing the technology (augmented reality, e.g., Google Glass or Microsoft’s HoloLens). For example, the device could provide a restaurant’s menu the moment a user is walking past and looking at the outside of a restaurant, or a patient’s medical records when a physician turns their head towards the patient. The central bias may be an important first step in the development of such technology.


