Introduction
When describing textual and diagrammatic representations of information, Simon (1978) and Larkin and Herbert (1987) distinguished between informational and computational equivalence of representations. Two forms of representations are informationally equivalent if information in one form is also derived from the other. On the other hand, two forms of representation are computationally equivalent if they are not only informationally equivalent but also inferences from each can be drawn quickly and easily. Diagrams are commonly considered to be computationally more efficient than text. However, this is not always the case when individual variables such as complexity are investigated (Freedman & Shah, 2002; Huang, Hong, & Eades, 2006; Roth & Bowen, 2003). This study was designed to increase our understanding of efficiency of graph processing when compared to text that is informationally equivalent.
Graphs have been used widely to communicate information in both academic and nonacademic settings. Understanding graph processing is an important goal for educators, cognitive scientists, and graphic designers because graph generation and comprehension is a fundamental part of curricula across various disciplines including literacy, science, and mathematics (Kramarski, 2004; Organisation for Economic Co-Operation and Development (OECD), 2000). When learning how to interpret and use graphs, students need to process various types of information simultaneously. For example, when taught to interpret Cartesian x-y coordinates, they learn to interconnect numerical data in the axes and transform numerical data to abstract entities (e.g., bars or lines) (Leinhardt, Zaslavsky, & Stein, 1990). From a cognitive perspective, Carpenter and Shah (1998) described graph processing as a function of interaction between the conceptual process of interpreting verbal sources (e.g., labels) and perceptual process of interpreting visual sources (e.g., bars, lines). Accordingly, understanding how graph viewers comprehend graphs has the potential of informing us to understand more precisely aspects of human information processing. In addition, a deeper understanding of graph processing is likely to be attributed to the design of more effective graphical representations (Peebles & Cheng, 2003).
Cognitive load theory, a widely accepted model of human information processing, rests on the assumption that cognitive capacity in working memory is limited, so that cognitive processing involving learning is executed under the constrains of limited working memory capacity (Sweller, 1988). Research associated with cognitive load suggests that effective instructional material promotes learning by allocating cognitive resources to activities that are relevant to learning and preventing cognitive overload that results in a lower performance (Clark, Nguyen, Sweller, & Baddeley, 2006; Plass, Homer, & Hayward, 2009; Sweller, Ayres, & Kalyuga, 2011). Cognitive load theory describes three types of cognitive loads; intrinsic, extrinsic, and germane loads (De Jong, 2010). Intrinsic load refers to the inherent characteristics of material itself and posits that some materials place high demands on cognitive process than others. Extrinsic load is unnecessary cognitive load that is imposed by poor material layout, surplus of information, etc. Finally, germane load refers to individual’s factors involved in the process of learning such as interpreting, exemplifying, and organizing when dealing with intrinsic load. Our study focuses on the intrinsic cognitive load. Particularly, we are manipulating complexity of materials (i.e., graphs) by which the number of elements in the graphs that must be processed in working memory differs in order to investigate how the manipulation affects participants’ information processing.
Two types of complexity are particularly salient to understand graphing: form (or content) complexity (Holzinger, Kickmeier-Rust, & Albert, 2008; Sweller & Chandler, 1994) and task complexity (Huang et al., 2006). Form complexity refers to the numbers of content components that need to be processed simultaneously in working memory for solving a problem (Elliott, Beddow, & Frey, 2009; Sweller & Chandler, 1994). An example of manipulating form complexity is the use of one as compared to two or more bars on a bar graph for displaying graphed information. Task complexity refers to the load imposed by task demands (Huang et al., 2006). An example of task complexity is use of questions that require locating a single point on a graph versus questions that require locating and comparing two or three points on a graph (Friel, Curcio, & Bright, 2001 for reviews).
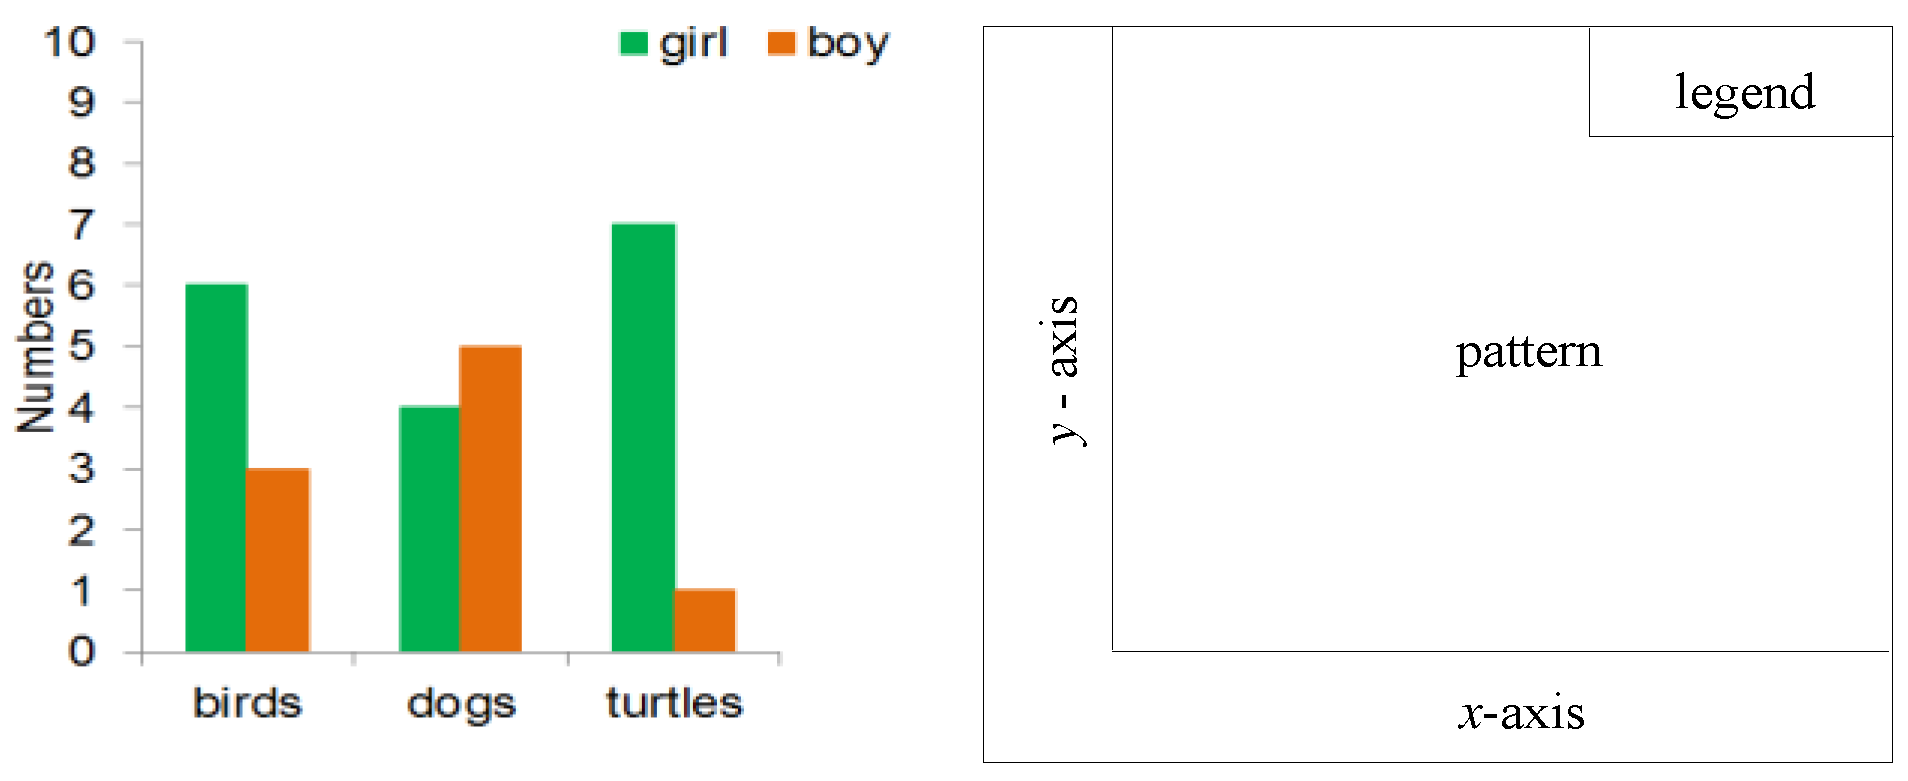
Eye-tracking measures are well suited for studying printing representation such as graphs and words because they allow for direct process-related measures such as location and speed (de Koning, Tabbers, Rikers, & Paas, 2010; Körner, 2011; Peebles & Cheng, 2003). More specifically, eye tracking measures yield quantitative and qualitative data on specific regions of printed symbols, allowing a direct comparison of the average time spent on each are during comprehension (Körner, Höfler, Tröbinger, & Gilchrist, 2014; Lohse, 1997). Carpenter and Shah (1998) divided line graphs into five regions, x-axis, y-axis, pattern, labels, and titles, to examine the pattern of eye gazes of college students when reading the line graphs. They found that graph viewers identify values in the axes and labels (verbal interpretation processes), encode visual data in lines (pattern recognition processes), and integrate the two sources of information into a coherent interpretation. Similarly, when constructing their model of graph-based reasoning, Peeble and Cheng (2003) divided line graphs into x-axis, y-axis, graph pattern, question, and answer regions and measured the eye movement pattern of college students. The students scanned question elements, viewed the relevant regions (i.e., axes or pattern) in the target graph, and then answered the question. Based on the eye tracking data, Peeble and Cheng described search procedures and visual attention processes of graph viewers in graphing. Finally, Kim, Lombardino, Cowles, and Altmann (2014) used eye-tracking methods to investigate how subject characteristics of college students (e.g., reading ability) affected viewing time on graph subregions (e.g., x-and yaxes, graphic pattern, legend). Students with reading disabilities were significantly slower in processing linguistic regions than their peers with typical reading skills.
Examining the details of eye fixations and movements in graphs, we intended to expand this line of research theoretically and methodologically. Existing graph studies have provided valuable insights into variables involved in the graph viewer’s cognitive processing. In our study, by comparing students’ interactions with literate information presented in graphic and in text formats, we strove to better understand how elementary level of information comprehension is affected by variations in graphic and question types. We believe this information will lead eventually to guiding instructors and designers to develop instructional materials that provide optimal learning environments for typical and challenged learners. Methodologically, we would explore a new data measure to the eye-tracking stream in graph comprehension. We examine students’ scanning patterns using entropy H value of eye transition data, derived from information theory, which is suitable for generating natural results that are interpretable (Shic, Chawarska, Bradshaw, & Scassellati, 2008). We divide the graph displays into five regions (x-axis, y-axis, graphic pattern, legend, and question) for eye data analysis. As mentioned above, this approach is routinely used in graph studies (e.g., Carpenter & Shah, 1998; Peebles & Cheng, 2003); however, in the studies, mainly eye fixation data (e.g., viewing time) are reported. In our study, in addition to the eye fixation data, eye movement data including entropy H value and location of the first fixation were analyzed.
This study was motivated by our interest how eye tracking patterns might help us to better understand the effects of varying forms of information representation on students. Our primary aim was to explore how college students process informationally equivalent forms presented in two different modalities (i.e., text and graph). Our second aim was to develop more precise characterization of graph comprehension that vary in graphic form complexity and task type. For this second aim, we examined eye fixations (i.e., total gaze duration and total fixation counts) and eye movements (i.e., start locations participants were looking at first and eye transition analysis using entropy H) in individual areas of interest (AOIs: legend, pattern, x-axis, y-axis, and question).
Methods
Participants
We recruited participants from a psychology subject pool at the University of Central Arkansas. Subjects chose to be compensated in one of two ways. Some chose to receive extra course credit and other chose the compensation fee of $10/hour. All participants were native speakers of American English and showed negative histories for pervasive cognitive deficits, behavioral disturbances, neurological illness, psychiatric illness, hearing impairment, or uncorrected visual impairment including color-blindness (Our experiment used colors in the graph stimuli (e.g., bars in graphs). See Appendix 1). This study was approved by the University’s Human Subject Institutional Review Board (IRB) and all IRB policies were followed.
Eighty students agreed to participate in this study. Two participants were excluded from the analysis; data for one subject had to be eliminated due to technical difficulties and another subject scored below one standard deviation (i.e., < 85) on a standardized intellectual test, Woodcock-Johnson III Test of Cognitive Abilities (Woodcock, McGrew, & Mather, 2002). The final cohort of subjects was composed of 78 college students (57 women; 21 men; mean age = 21.30, SD = 4.78).
Experimental stimuli
Stimuli included a total of 48 computer screens. We manipulated three variables, presentation modality (graph or text), question type (point-locating or comparison), and form complexity (single or double). Hence, eight presentation conditions were composed of a total 48 items (six items for each condition). The eight presentation examples are shown in Appendix 1.
The graph stimuli were adapted from a previous study of graph comprehension (Kim et al., 2014). Graphs were created to be simple and to avoid the use of contentspecific knowledge. To study eye gaze positions, each graph was divided into four quadrants: (1) an
x-axis consisting of three common objects (e.g., dogs, turtles, birds), (2) a
y-axis with numbers ranging from 0 to 10, (3) graphic pattern (i.e., bars), and (4) a legend identifying referents represented in the graph (i.e., boy, girl). The location of these components on the graph stimuli is shown in
Figure 1.
For the text stimuli, all sentences contained a subject (boy or girl), three common animate objects (e.g., dogs, turtles, birds) and identical sentence structures (e.g., The boy has two birds, three dogs, and seven turtles). In the single form condition, a ten-word sentence was presented on the screen (e.g., The boy has five dogs, two turtles, and one bird). In the double form condition, two doublespaced ten-word sentences were presented together on the screen (e.g., The girl has one turtle, five dogs, and two birds. The boy has three turtles, five dogs, and nine birds.).
For manipulating the form complexity, two graphic pattern conditions (i.e., single bar graph vs. double bar graph) in the graph stimuli and two text conditions (i.e., single sentence text vs. double sentence text) in the text stimuli were used. For manipulating the task complexity (question type), a point-locating question (e.g., How many dogs does the boy have?) and a comparison question (e.g., Does the girl have more turtles than birds?) accompanied graph or text stimuli. To minimize the potential memory constraints, the question was included on each of the stimulus screen rather than appearing separately. Appendix 1 shows examples of four graph types (i.e., a single bar graph with a point-locating question, a single bar graph with a comparison question, a double bar graph with a point-locating question, and a double bar graph with a comparison question) and four text types (i.e., single sentence text with a point-locating question, single sentence text with a comparison question, double sentence text with a point-locating question, and double sentence text with a comparison question) that were viewed by participants.
All 48 stimuli were presented to subjects individually on a computerized screen in a pseudo-randomized order. Participants did not view stimuli from the same condition on more than three consecutive trials. To avoid unintended effects of item order, we assigned the order of graphs to two sets, A and B, and alternated which set was presented to participants such that set A was presented for half of participants (n = 39) and set B (n = 39) for the other half (To confirm that there was no significant difference between sets A and B, we compared participant data between the sets. Participants in sets A and B did not differ for age (set A M = 20.21, SD = 2.15, set B M = 22.33, SD = 6.21; F(1, 76) = 4.07, p = .05), graph response accuracy (set A M = 47.39, SD = 0.74, set B M = 47.43, SD = 0.64; F(1, 76) = 0.11, p = .75), text viewing time (set A M = 5.76 s, SD = 1.44, set B M = 5.78 s, SD = 1.19; F(1, 76) = 0.01, p = .95), or graph viewing time (set A M = 5.29 s, SD = 1.24, set B M = 5.14 s, SD = 1.13; F(1, 76) = 0.29, p = .59)).
Eye-tracking apparatus
Eye movements were tracked using an LC Technologies head-free EyeFollower binocular system operating at 120 Hz. Gaze point tracking accuracy reported by the manufacturer is less than 0.4˚ throughout the operational head range (rater range: 30 inches and vertical range: 16 inches. Fixations ere extracted with a temporal threshold of 100 ms (100 ms is shorter than average fixation times reported in some previous studies as the minimal duration of a fixation (275 ms in Rayner, 1998). On the other hand, some researchers include gazes with fixation duration shorter than this values for textgraph co-reference stimuli. For example, Underwood, Jebbett, and Robert (2004) included gaze with a fixation duration above 60 ms for their sentence-picture verification experiments. Acarturk, Habel, Cagiltay, and Alacam (Acartürk, Habel, Cagiltay, & Alacam, 2008) included gaze above 100 ms for their graphtext comprehension experiments. Because these previous studies had most similar types of stimuli, we decided to include gazes above 100 ms in the analysis) and a spatial dispersion threshold of 1.5˚ (minimum deviation of 25 screen pixels). Participants sat at a distance of 23.62 inches (60 cm) from the LCD monitor and used a custom-designed keyboard for inputting manual responses. Graphs were presented in a black component (e.g., x-axis, y-axis, letters) and two color components (i.e., bars) on a white background on a 24 inch (61cm) light-emitting diode (LED) monitor with a resolution of 1920 × 1080 pixels. The text and questions were presented in black Arial 20 point font. The graphs subtended a horizontal visual angle of 9.6˚ and a vertical visual angle of 8.4˚. The characters for text and questions subtended a horizontal visual angle of 0.37˚ and a vertical visual angle of 0.46˚. Calibrations for fixations were accepted if fixation accuracy showed an average drifting error no greater than a quarter of an inch. The average root mean square error was 0.17 inches. Minds Eyetracking Solutions software program was used to analyze participants’ fixation data.
Procedure
Participants individually completed all tasks in the following order: (1) general background questionnaire, (2) brief intelligence assessment, and (3) experimental eye tracking task. The entire procedure took approximately 40 min. Prior to the experimental task, the experimenters explained the eye-tracking methodology and participants were given time to become familiar with the equipment. This was followed by a thirteen-point calibration procedure and a practice trial on eight items to familiarize subjects with the stimuli and task. The experimenter provided verbal feedback regarding accuracy of answers for the practice items only.
For the experimental trials, the experimenter instructed participants to view the stimulus and answer the accompanying question as rapidly and as accurately as possible; however, no time limit was given. To avoid a possible bias related to a leftand righthand dominance, the experimenter asked participants to press the spacebar with their dominant hand. The participants controlled the timing of the presentation for each stimulus by pressing the spacebar to advance the program to the next trial after completing a trial. Each participant response to a comprehension question received a score of either 1 (correct answer) or 0 (incorrect answer). The maximum total score was 48 across all trials.
Results
Data were analyzed using SPSS version 17.0 for Windows (SPSS Inc., 2008). Incorrect responses (0.9%) were excluded from the data analysis. For eye tracking data, the experimenter (1st author) visually inspected each trial to check that the tracker had correctly recorded eye movements. Approximately 4% of data were excluded due to track loss or program error. For the first research question, which addressed the effect of presentation modality on speed of subjects’ comprehension processing, total gaze duration data were compared for 24 graph and 24 text stimuli. For the second question, which addressed subjects’ eye fixation time for specific graphic subregions, total gaze duration and total fixation count data were compared for the four subregions (x-axis, y-axis, graph legend, and graphic pattern) for 24 graphs. For the third question, which addressed the effect of question type and graphic form complexity on the subjects’ eye movements for graphic subregions, both location (i.e., first location subjects were looking at) and transition (Entropy H) analyses were used for four graphs from each condition (i.e., single bar graph with a pointlocating question, single bar graph with a comparison question, double bar graph with a point-locating question, double bar graph with a comparison question).
Total gaze duration analysis for graphs and text
Total gaze duration (sum of the durations of fixations on graph or text stimuli) was calculated to address how presentation modality (graph vs. text) affected participants’ processing speed when question type and form complexity were manipulated. Questions were presented with the graph or text stimuli on the screen; however, the duration of fixations on the question region was not included in the total gaze duration on graph or text stimuli.
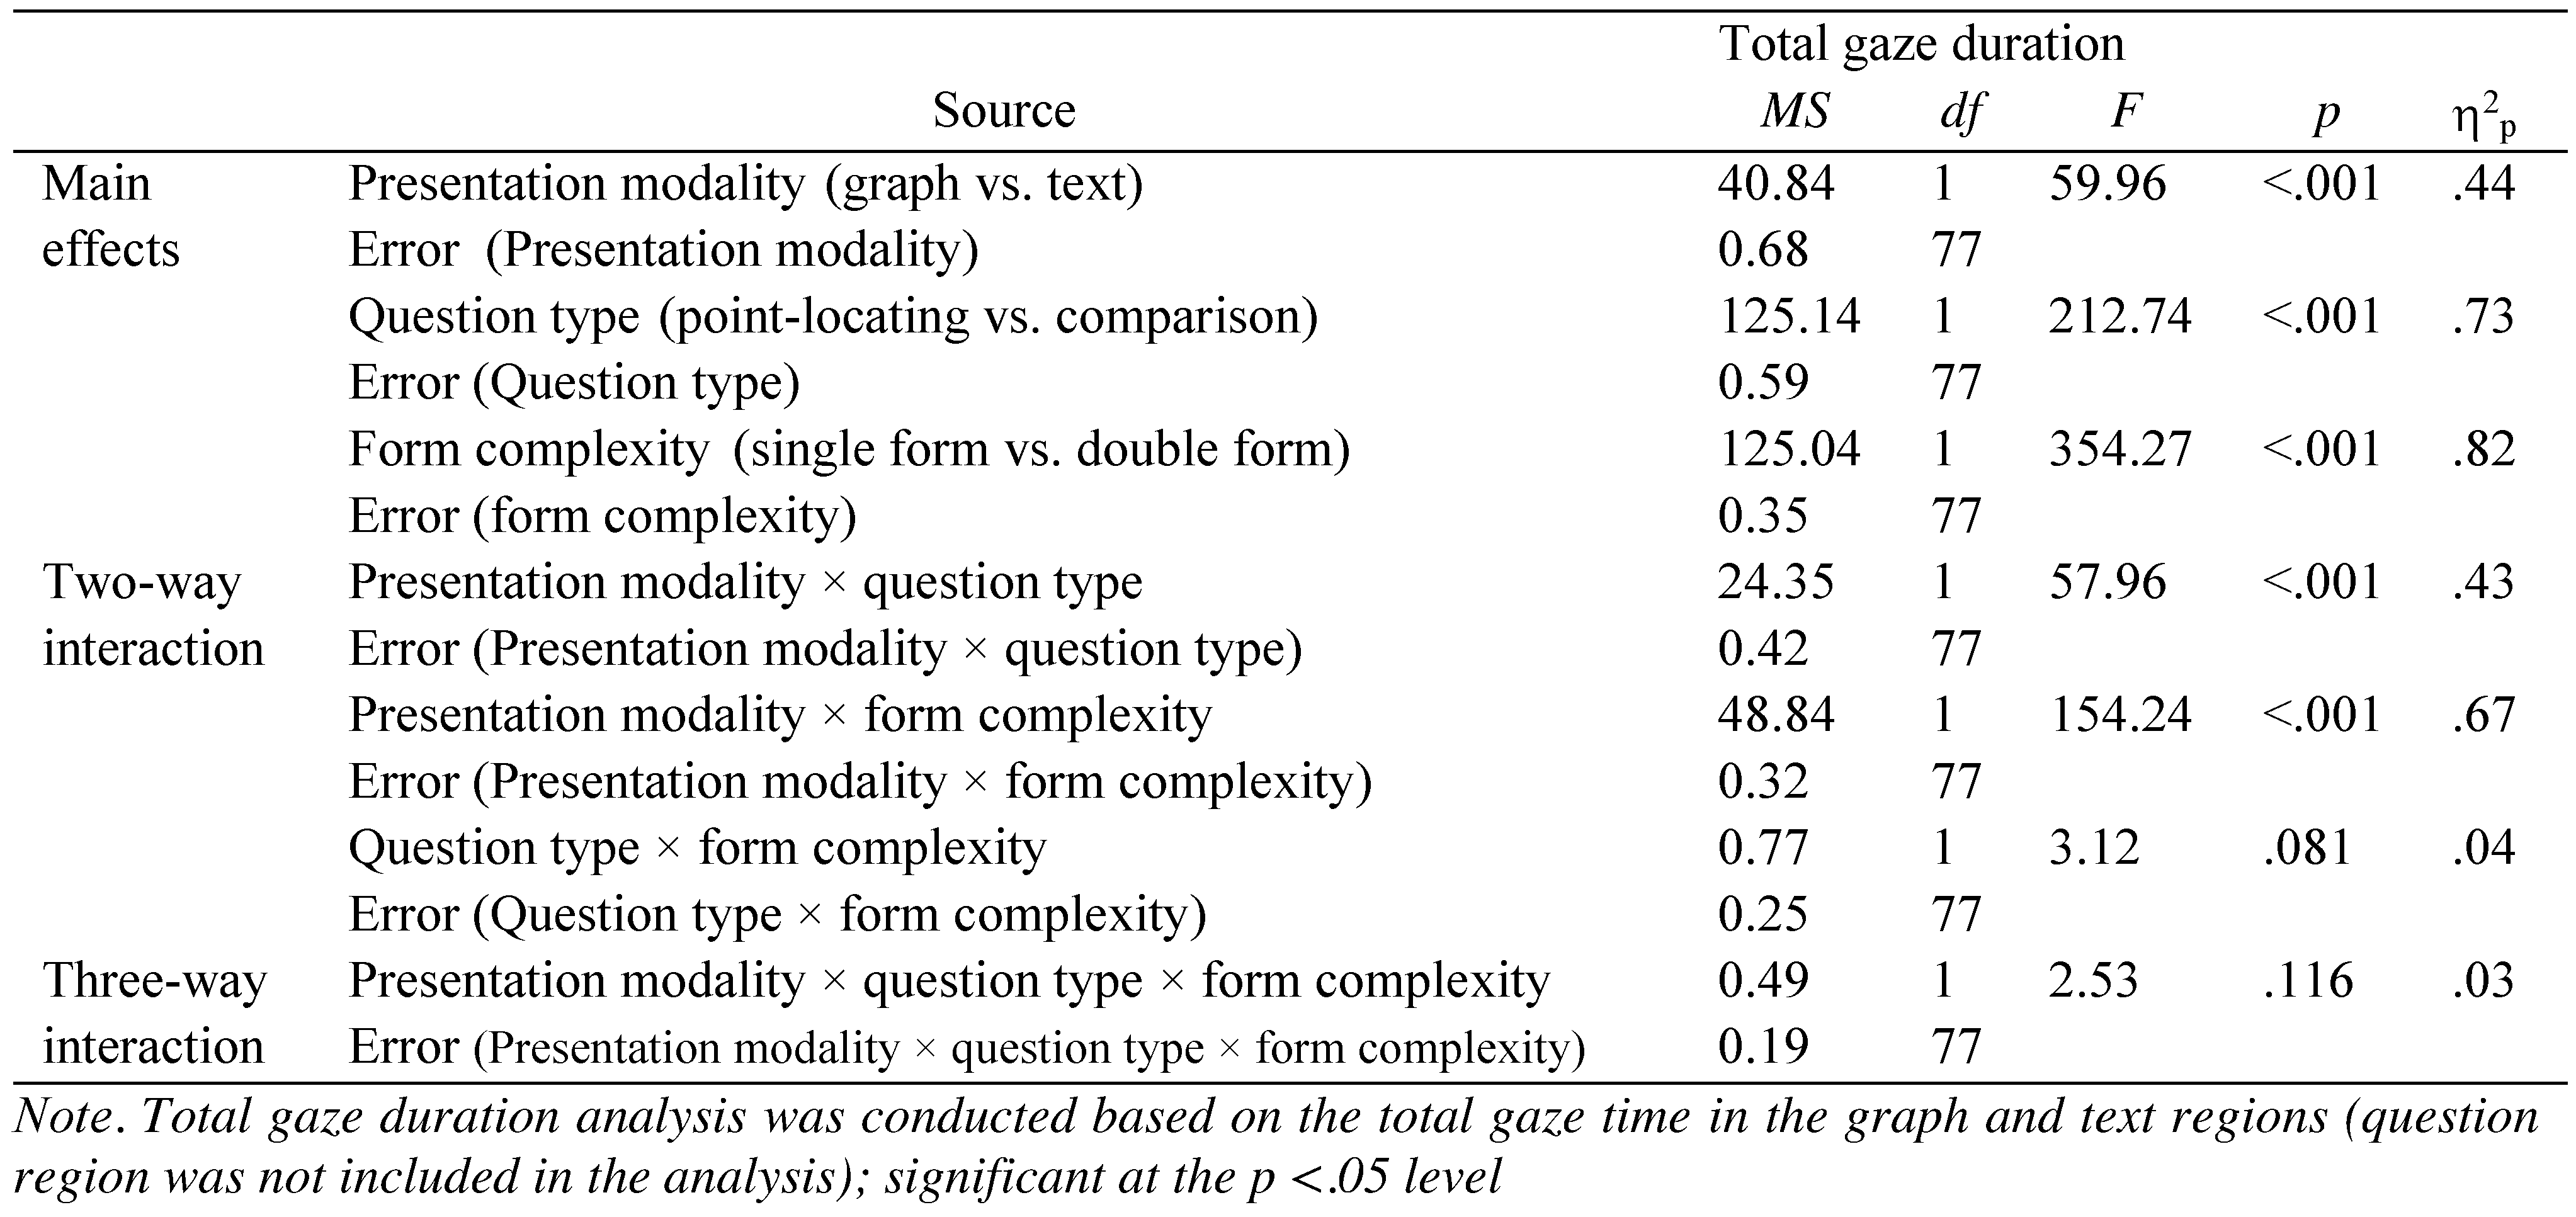
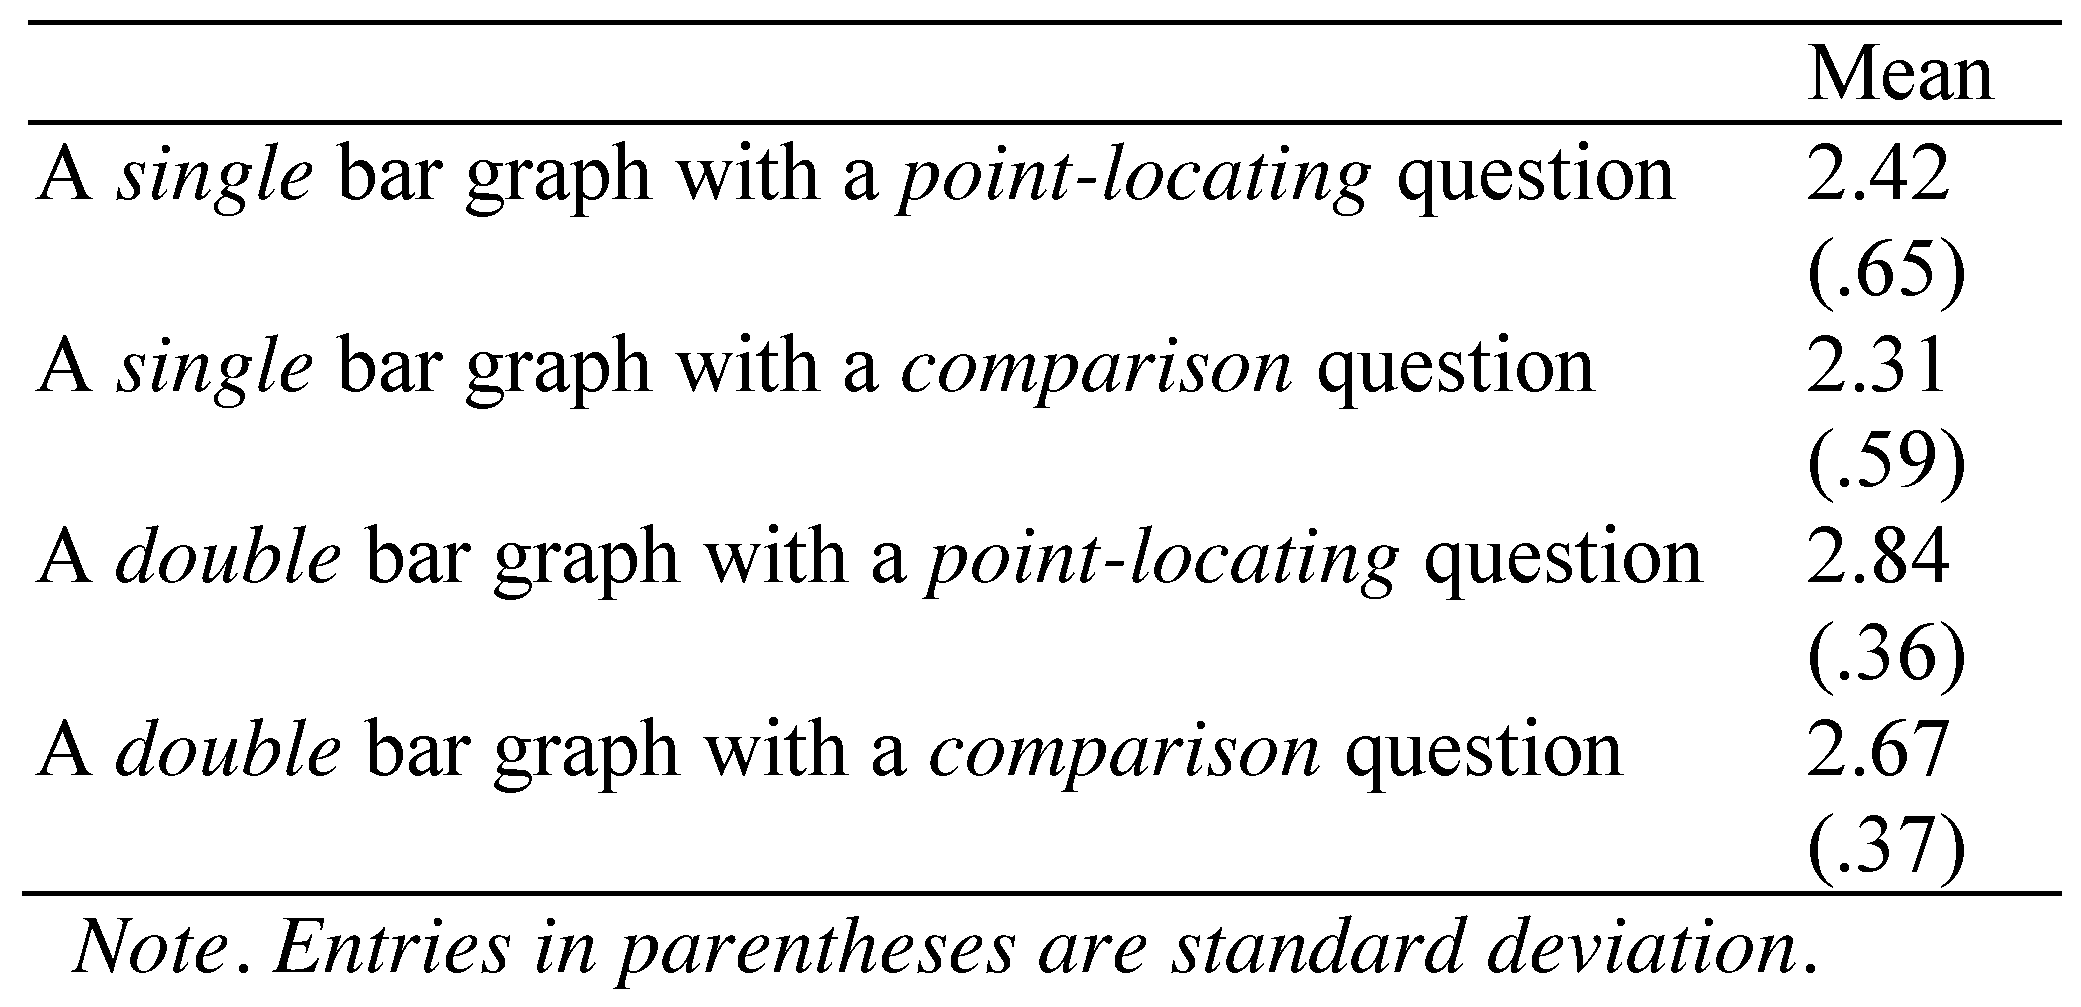
Table 1 shows the mean total gaze duration for graph and text stimuli across question type (point-locating and comparison questions) and form complexity (single and double). Total gaze duration was analyzed using a 2 (presentation modality: text, graph) × 2 (question type: point-locating, comparison) × 2 (form complexity: single, double) repeated measures analysis of variance (ANOVA) with Bonferroni-corrected post-hoc tests.
The ANOVA yielded three main effects and two 2way interaction effects (see
Table 2). Significant main effects were found for all variables (i.e., presentation modality, question type, and form complexity). First, the total gaze duration was significantly longer for text stimuli (
M = 3351.0 ms) than for graph stimuli (
M = 2839.7 ms). Second, the total gaze duration was significantly longer in the comparison question condition (
M = 3542.6 ms) than in the point-locating question condition (
M = 2647.1 ms). Third, the total gaze duration was significantly longer in the double form condition (
M = 3542.5 ms) than in the single form condition (
M = 2647.2 ms).
The first significant two-way interaction was found between presentation modality and question type. Post hoc Bonferroni test (p < .05) showed that the total gaze duration for graph and text stimuli did not significantly differ in the point-locating question condition, t(77) = −1.46, p = .15. Conversely, the total gaze duration was significantly shorter for graph stimuli than for text stimuli in the comparison question condition, t(77) = −11.25, p < .001. Second, presentation modality and form complexity significantly interacted. In the single form condition, the total gaze duration was significantly shorter for the graph stimuli than for the text stimuli, t(77) = −14.86, p < .001. However, in the double form condition, the total gaze duration between the graph and text stimuli did not significantly differ, t(77) = −0.55, p = .59.
Total gaze duration and total fixation count for areas of interest in graphs
Total gaze duration (sum of the durations of fixations on an AOI) and total fixation count (total number of gaze fixations on an AOI) were calculated for each of four subregions (i.e., legend, pattern,
x-axis,
y-axis) to address how form complexity and question type variables differentially affected the processing time on individual graphic areas.
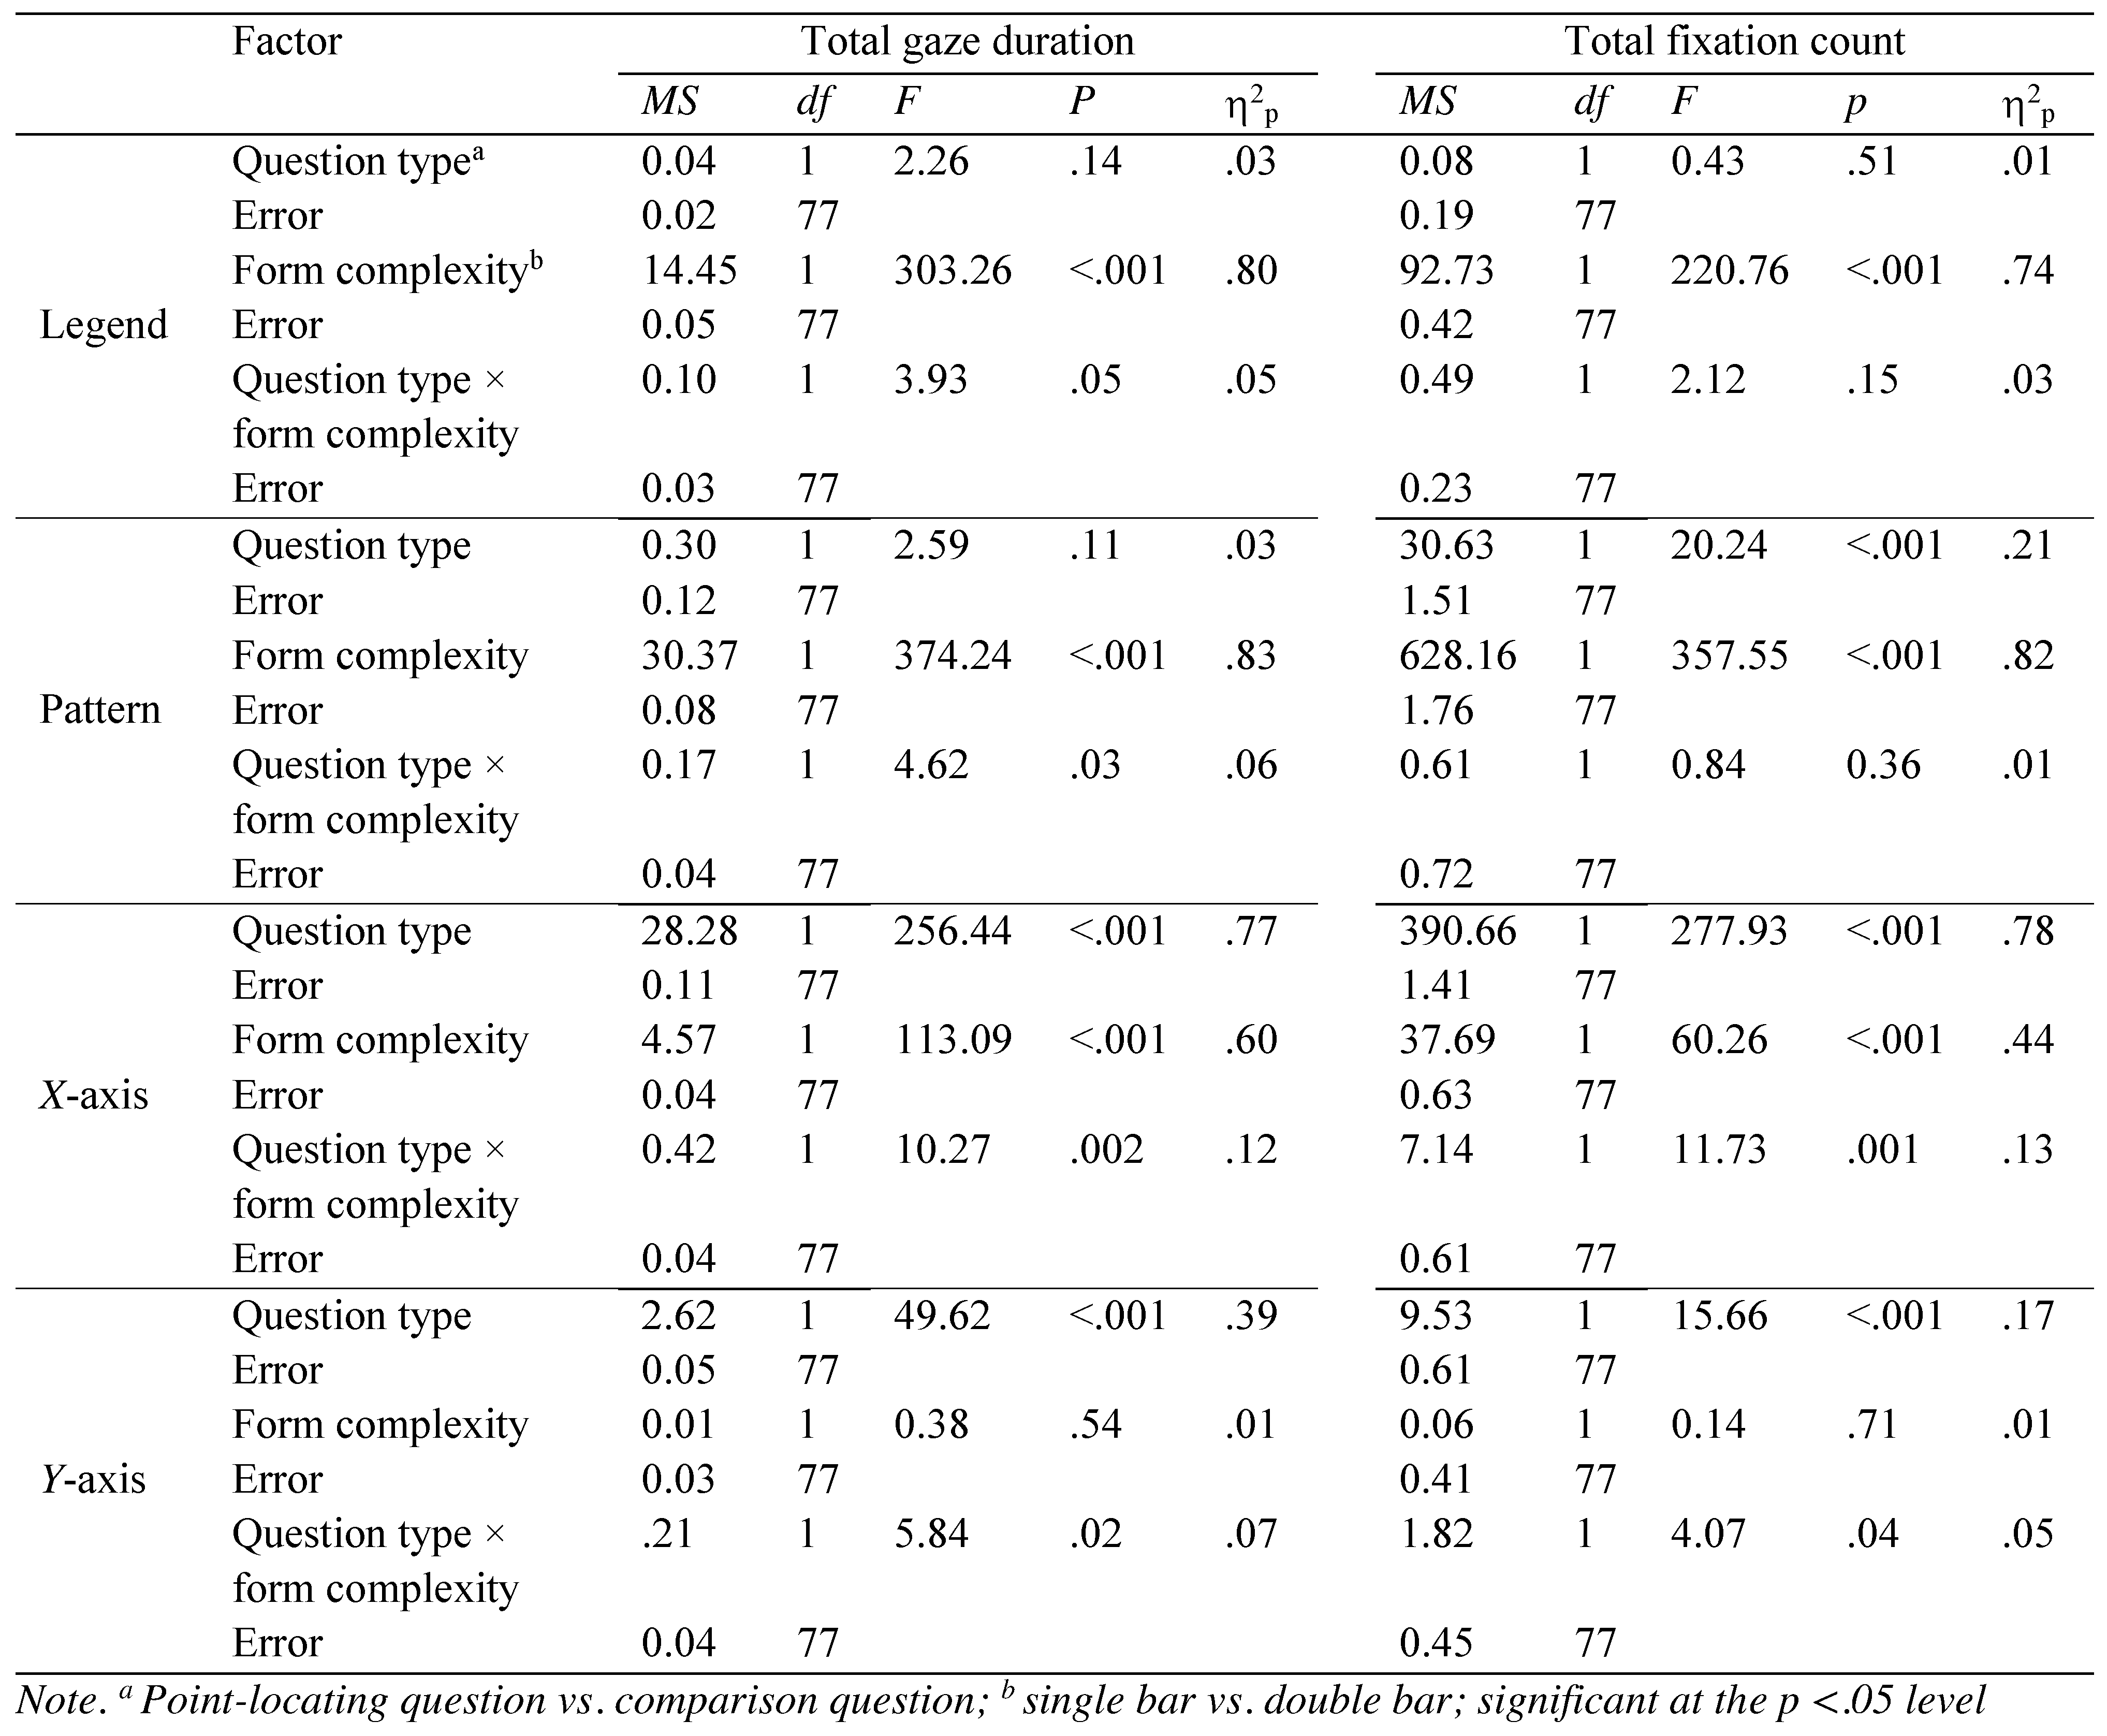
Table 3 shows the mean total gaze duration and total fixation count for each region and
Table 4 shows the results of repeated ANOVAs comparing total gaze duration and total fixation count in the four AOIs as a function of question type and form complexity. For the legend region, the mean total gaze duration was significantly longer for the double bar condition than for the single bar condition. For the pattern region, the mean total gaze duration was significantly longer for the double bar graphs than for the single bar graphs. Additionally, the form complexity significantly interacted with the question type, showing no difference in total gaze duration between the two question types on the single bar graphs
, t(77) = −0.38,
p = .71 but significantly longer total gaze duration for the comparison question condition than for the point-locating question condition on the double bar graphs,
t(77) = −2.75,
p = .02.
Within the x-axis region, the mean total gaze duration was significantly longer for the comparison question condition than for the point-locating question condition. The mean total gaze duration was significantly longer for the double bar graphs than for the single bar graphs. Lastly, the question type significantly interacted with form complexity, indicating that while the mean total gaze duration was longer for the double bar graphs than for the single bar graphs in both question conditions, the mean total gaze duration difference between the single and double bar graphs was larger for the comparison question condition than for the point-locating question condition.
Within the y-axis region, the mean total gaze duration was significantly longer for the point-locating question condition than for the comparison question condition. Furthermore, the question type significantly interacted with form complexity. The follow-up comparisons showed that for the point-locating question condition, the total gaze duration was significantly longer in the single bar graphs than in the double bar graphs, t(77) = −2.83, p = .007. For the comparison question condition, there was no difference in the gaze duration between the single and double bar graphs, t(77) = 1.14, p = .26.
Table 4 also displays the results of ANOVAs comparing total fixation count in the four AOIs (legend, pattern,
x-axis,
y-axis) as a function of question type and form complexity. For the legend region, the mean total fixation count was significantly higher for the double bar graphs than for the single bar graphs. For the pattern region, the mean total fixation count was significantly higher for the comparison question condition than for the point-locating question condition. In addition, the mean total fixation count was significantly higher for the double bar graphs than for the single bar graphs.
Within the x-axis region, the mean total fixation count was significantly higher for the comparison question condition than for the point-locating question condition. The mean total fixation count was significantly higher for the double bar graphs than for the single bar graphs. The question type significantly interacted with form complexity, indicating that while the mean total fixation count was higher for the double bar graphs than for the single bar graphs in both question types, the mean total fixation count difference between the single and double bar graphs was larger for the comparison question condition than for the point-locating question condition.
Within the y-axis region, the mean total fixation count was significantly higher for the point-locating question condition than for the comparison question condition. Furthermore, the question type significantly interacted with form complexity. The follow-up comparisons showed that for the point-locating question condition, the total fixation count was significantly higher in the single bar graphs than in the double bar graphs, t(77) = −2.43, p = .01. For the comparison question condition, there was no difference in the total fixation count between the single and double bar graphs, t(77) = 0.97, p = .33.
Location analysis for areas of interest in graphs
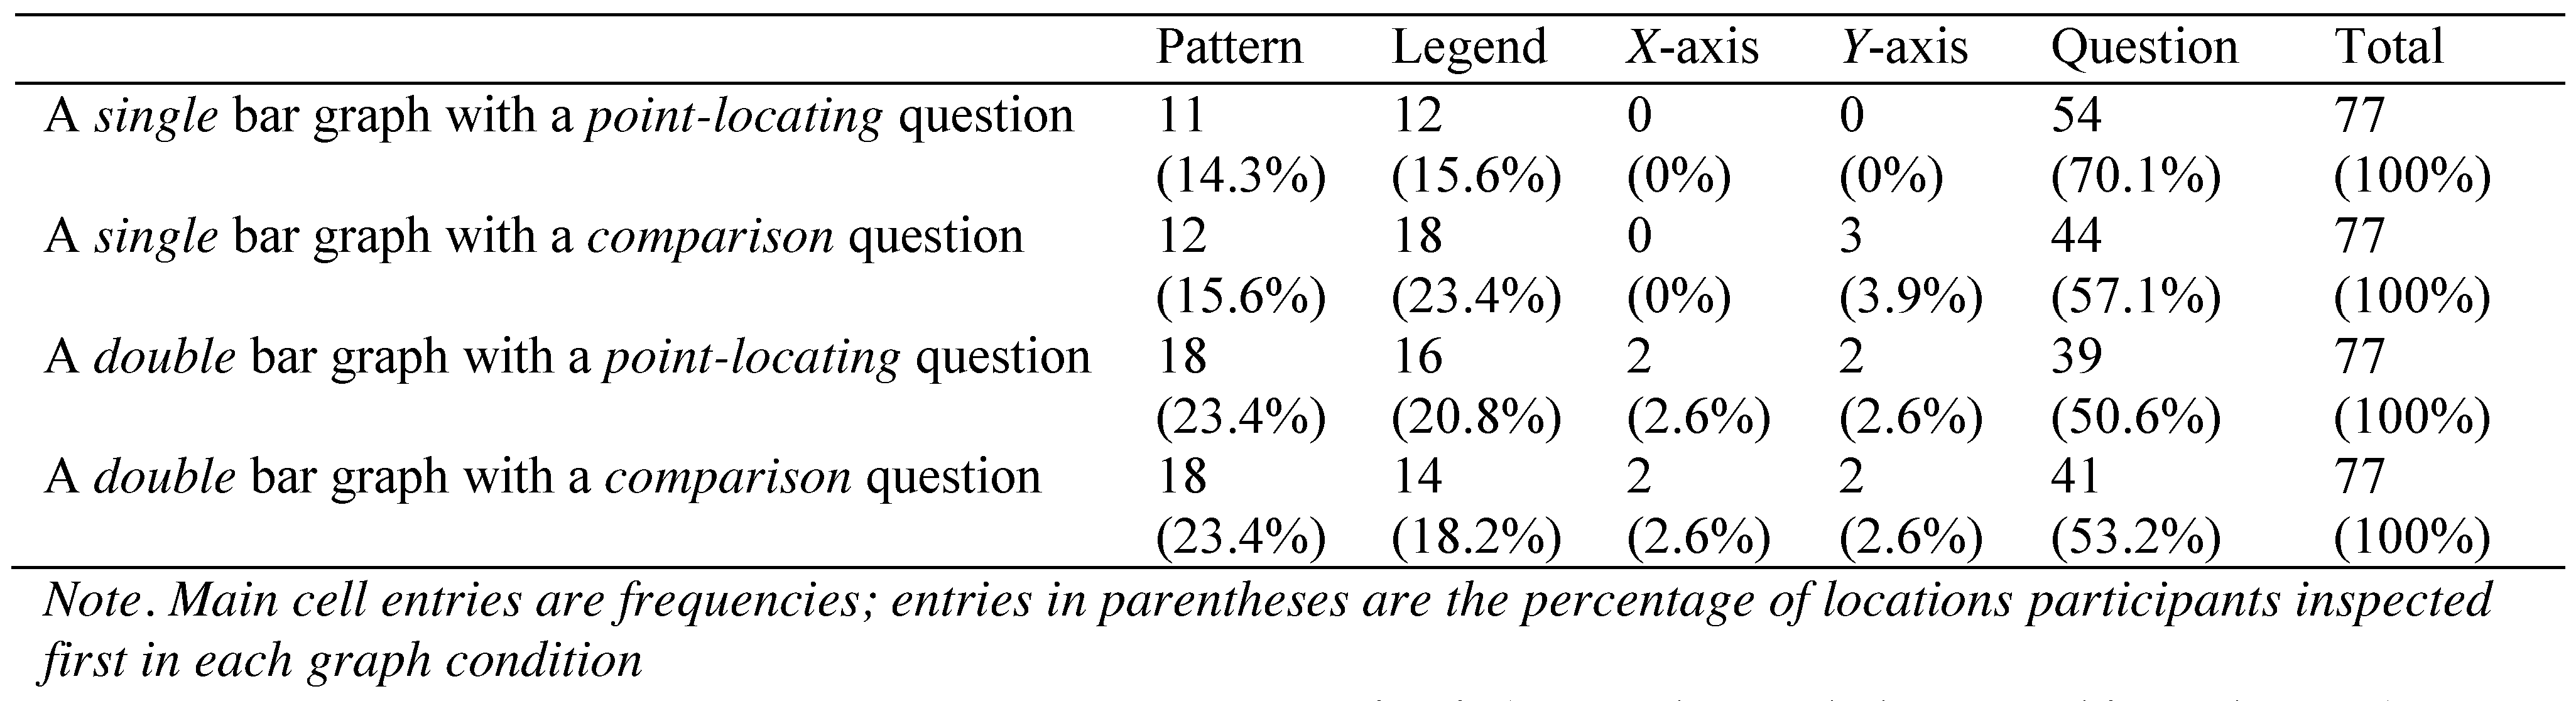
To determine participants’ initial point of fixation, both with and without including the question region, the participants’ first fixation point for four graphs from each of four conditions were manually coded; (1)
a single bar graph with a point-locating question, (2)
a single bar graph with a comparison question, (3)
a double bar graph with a point-locating question, and (4)
a double bar graph with a comparison question. Four graphs from each of the four conditions were selected for the location analysis that met the following criteria: graphs (a) were not the first graph of each condition presented to the participants, (b) were not the last graph of each condition presented to the participants, and (c) were correctly answered by all of the 78 participants. We excluded one participant’s data from analysis because she began her inspection outside of the AOIs. All the remaining data (77 participants × 4 graphs from each condition = 308) were used for analysis.
Table 5 shows the frequency of occurrence of elements participants looked at first.
Across the graph conditions, approximately 40-70% of participants looked at the question first followed by the pattern or legend areas. The three-way (question type × form complexity × AOIs) loglinear analysis produced a final model that retained the form complexity × AOIs interactions and the main effect of the AOIs. The form complexity × AOIs interaction was significant, x2(4) = 10.41, p < .05, indicating that for the single bar graphs, more participants inspected the question region first than for the double bar graphs. The main effect of AOIs was significant, x2(4) = 317.19, p < .001, indicating that significantly more participants inspected the question region before the other areas.
Next, we excluded the question region from the AOIs to examine where the participants most frequently looked at first among the graph areas (i.e., pattern, legend, x-axis, y-axis) and conducted loglinear analysis again. The threeway (form complexity × question type × AOIs) loglinear analysis produced a final model that retained the main effect of the AOIs, x2(3) = 105.69, p < .001, indicating that significantly more participants inspected the pattern and legend regions first than xor y-axes. The form complexity × AOIs interaction was not significant, x2(3) = 6.04, p > .05.
Eye transition analysis for five areas in graphs
To examine participants’ scanning patterns in graphs varying task complexity and question types, their eye movements were analyzed in terms of transitions of gaze between regions (pattern, legend,
x-axis,
y-axis, question). We used transition matrices in which each cell shows the number of transitions from a region placed on the row to another region placed on a column. The proportion of transitions for each region was calculated by dividing the number of transitions in one region by the total numbers of transitions. Then, an Entropy
H of transition ratio analysis, a measurement of the randomness of scanpath distribution across areas (Holmqvist et al., 2011), was calculated using the following formula: H(R) =
![Jemr 08 00012 i001]()
. R is the normalized transition matrix and
![Jemr 08 00012 i002]()
is the ratio (probability) of looking at a particular transition
![Jemr 08 00012 i003]()
. A high value of entropy indicates participants show a relatively high number of gaze transitions between regions. Entropy analysis is a fine-grained measure of the influence of specific stimuli on visual search that takes into account the context of the scanning circuit (Acartürk & Habel, 2012; Shic et al., 2008). A repeated measures ANOVA using Bonferroni’s adjustment was conducted to examine the effect of question type and form complexity on the eye transitions on the graph stimuli.
Data from three students were excluded from the analysis due to partial eye movement errors. Analysis of the remaining 75 students’ eye movements for the four graphs used in the location analysis resulted in a total of 2595 eye movements (511 for the single bar graph with a point-locating question, 539 for the single bar graph with a comparison question, 740 for the double bar graph with a point-locating question, and 805 for the double bar graph with a comparison question). All the movement data were manually coded and transcribed and the transition matrices were constructed for each graph (75 participants × 4 graphs = 300 matrices). The average entropy values for each graph are presented in
Table 6. A 2 (question type) × 2 (form complexity) repeated ANOVA yielded a significant main effect for form complexity,
F(1, 75) = 37.28,
p < .001, indicating that the entropy of double bar graphs was significantly higher than the entropy of single bar graphs. This suggests that participants were making more transitions between regions in the double bar graphs than in the single bar graphs. There was also a significant main effect for question type,
F(1, 75) = 37.28,
p < .01, indicating that the entropy of pointlocating questions was significantly higher than the entropy of comparison questions. This suggests that participants were making more transitions between regions when the point-locating questions were presented than when the comparison questions were presented. There was no significant interaction effect between the graphic complexity and question type.
In summary, our analyses showed that (1) graph processing and text processing speeds did not differ for the point-locating questions but graph processing was faster than text processing speed for the comparison questions, (2) graph processing was significantly faster than text processing in the single form condition than in the double form condition, (3) the question type mainly affected total gaze duration and fixation counts on the xand yaxes while the form complexity affected the legend, pattern and x-axis regions, (4) participants tended to read questions before looking at graphs, but as the stimuli became complicated, they scanned the overall graph first by looking at the pattern or the legend, and (5) participants made more transitions between subregions for the double bar graphs than for the single bar graphs and for the point-locating question condition than for the comparison question condition.
Discussion
We used eye-tracking methods to investigate interactions between presentation modality, question types, and form complexity. In addition, eye-tracking fixation and movement data were used to determine eye gaze patterns on key locations on graphs when complexity for question type and graphic forms were manipulated.
Interactions between presentation modalities and question type
Total gaze duration, used as a proxy for processing times, varied for graph and text stimuli when complexity of question type was manipulated. The amount of time spent looking at graphs or text to answer accompanying questions did not differ when participants were given point-locating questions. However, when given comparison questions, participants took longer to process the text stimuli than the graphs. This finding is consistent with Friel et al. (2001)’s explanation that while point-locating questions simply require the extraction of a single point, comparison questions require to compare two data points and interpret relationships in the data, thereby graph viewers need longer time to answer the comparison questions.
Further, both cognitive load (Sweller, 1988; Sweller et al., 2011) and perceptual salience (Lowe, 2003) theories of learning and retaining information may account for, at least in part, the faster speed of processing for comparison questions in the graph format. Cognitive load theory (Clark et al., 2006), a frequently used framework for guiding learning and design principals, posits that information is processed in separate channels in working memory, a verbal channel for processing verbal input and a visual channel for processing visual input. Given the assumption that each channel has a limited capacity for the amount of information that can be processed at one time, researchers have argued that viewers learn more efficiently when information is presented both verbally and visually (Mayer & Moreno, 1998). Hence, it is plausible that our participants processed comparison questions more efficiently when accompanied by graphs because this condition allowed for recruiting more crosssensory input (visual and verbal) and accompanying working memory capacity.
Additionally, the perceptual salience of the colors used to graph the data may have facilitated faster processing times in the graph condition. Even though we carefully manipulated the graph stimuli so the participants compared only the same color bars in each graph to diminish the effect of perceptual salience, previous studies have shown that color stimuli can be more effective for learning new content than black-and-white stimuli (Christ, 1975; Dwyer & Moore, 1991). Researchers have observed that colors attract viewer’s attention to the relevant parts of materials (Baker & Dwyer, 2000) and that viewers prefer the colored visuals to black-and-white graphics and attend to the colored material more vigilantly (Pett & Wilson, 1996). Kleinman and Dwyer (1999) studied the effect of visual elements on information acquisition. They used simple line drawing outlines of parts of the human hears in two conditions. In one condition, parts of the heart were color-coded. In an alternative condition, parts of the heart were shown in black-and-white. When asked to label the heart parts, students exposed to the condition in which parts of the heart were shown in color-coded sections yielded higher rates of accuracy than students exposed to the condition in which the heart was shown in black-and-white parts.
In the current study, the degree to which color was an important variable was dependent on the type of questions. The graph stimuli were processed faster than the text stimuli when the comparison questions were presented, but not when the point-locating questions were presented even though all graphs contained colored bars. For the comparison question, students needed to differentiate between data represented in colored bars while for the point-locating question, they needed to focus on the intersection of the xand y-axes to answer the question. It appears that color aided the participants only when they were required to compare bars to arrive at an answer. Further studies are needed to determine the effect of color on graph and text interpretation. For example, in the text condition, two sentences (i.e., one for boy and another for girl) could be presented in two different colors and then, the effect of colors in text could be compared to those in graphs.
Related to the perceptual salience of features in graphs, the feature selection hypothesis states that visually salient features facilitate the process of filtering relevant from irrelevant information (Hegarty, Canham, & Fabrikant, 2010). For our graph stimuli in which graphic patterns (i.e., bars) are inherently salient and then readily identifiable, it was possible for students to stop searching the graph once they found the two relevant bars and thereby ignore the third bar to answer the comparison question. In contrast, for the text stimuli, students had to read the entire text and then extract the relevant information in order to answer the question. Thus, some graphs may have the benefits of quickly extracting key information over text when portions of the graph can be ignored when answering specific types of questions.
Conclusions
Currently, informational text makes up 50% of required reading at the elementary level and its proportion increases up to 80% in college and the work environment (National Governors Association Center for Best Practices, 2010). Informational text has info-graphic features such as graphs, tables, charts, and diagrams. Contrary to the common belief that graphs invariably help comprehension, people often have difficulty reading and interpreting information depicted in graphs (Shah, Hegarty, & Mayer, 1999). Therefore, it is important to explore the impact of using graphs to facilitate information processing and learning.
The current study aimed at investigating how college students’ graph viewing strategies varied when presentation modality and graph characteristics were manipulated. Our results showed that (1) students processed graphs faster than text especially when responding to more complex questions, however, with the more complex graphs, this advantage of processing speed for graphs over text diminished; (2) students spent the majority of their time viewing information from the axes and label regions; (3) students typically read questions before viewing graphs, however, with the more complex graphs, they were more apt to initially fixate on graphical elements prior to reading the questions; and finally, (4) both graphic complexity and question types about information represented in graphs significantly affected students’ eye movement patterns.
The findings of this study lead to some recommendations for educational design. Our study demonstrates that three factors, stimulus factors (i.e., graphic patterns), task characteristics (i.e., question types), and the graph viewer’s goals critically affect their graph comprehension. First, good stimuli should not only convey right information but also respect limitations of human cognition and memory (Huang et al., 2006). Consideration of this nature is particularly important when information presented in graphs becomes complicated. Instead of conveying all information in one graph, it could be better to display two separate graphs having appropriate amount of information. In addition, visual cues (e.g., meaningful colors, arrow, and pattern) can minimize search cost and working memory load (Boucheix & Lowe, 2010). For example, the relevant information in two separate graphs can be highlighted in the same color (Kosslyn, 1994) or the irrelevant information can be shaded (de Koning et al., 2010). Second, tasks types activate different schema for graph interpretation. Point-locating questions and comparison questions are well suited for bar graphs in which bars of different heights represent discrete values. On the other hand, trend judgement questions are wellsuited for line graphs in which lines connect discrete values and show changes in values (Zacks & Tversky, 1999). Therefore, it is important that developers of educational materials consider whether task types conform to the types of graphic display to make graphical understanding more efficiently. Third, our study also revealed that graph viewers spend the majority of their time on comprehending conceptual information from the axes and label regions of a graph. Thus, to improve graph comprehension, students need to be informed to pay close attention to the referents and their corresponding values as labeled on the axes (Parmar & Signer, 2005). Students should learn how to adjust their searching goals, problem-solving strategies, and self-referenced feedback depending on graph conditions (i.e., graphic forms or question types).
We suggest that future studies further investigate the implications of cognitive load theory on graph comprehension. In our study, the verbal message (question) was presented in the written form. According to the cognitive load theory, spoken words would be processed through the auditory channel while pictures would be processed through the visual channel. It would be interesting to compare comprehension of graphs with spoken message to comprehension of graphs with written message. Second, to understand further the effect of graphs on information processing and learning, future research could study graph production. Most previous studies including our study have primarily focused on graph interpretation. However, as good reading does not guarantee good writing, successful graph comprehension does not guarantee successful graph construction. Graph construction could be more difficult for students to learn than graph interpretation because graph construction relies on generating new information that is not given whereas graph comprehension relies on reaction to given information (Leinhardt et al., 1990). It would be interesting to study the extent to which stimulus complexity, task types, and learners’ characteristics affect graph construction. Finally, for the location analysis and eye transition analysis, we selected four graphs from each condition and analyzed 78 participants’ first fixation point and eye movements between regions. Future studies should replicate our findings with a larger sample.
 . R is the normalized transition matrix and
  is the ratio (probability) of looking at a particular transition
  . A high value of entropy indicates participants show a relatively high number of gaze transitions between regions. Entropy analysis is a fine-grained measure of the influence of specific stimuli on visual search that takes into account the context of the scanning circuit (Acartürk & Habel, 2012; Shic et al., 2008). A repeated measures ANOVA using Bonferroni’s adjustment was conducted to examine the effect of question type and form complexity on the eye transitions on the graph stimuli.
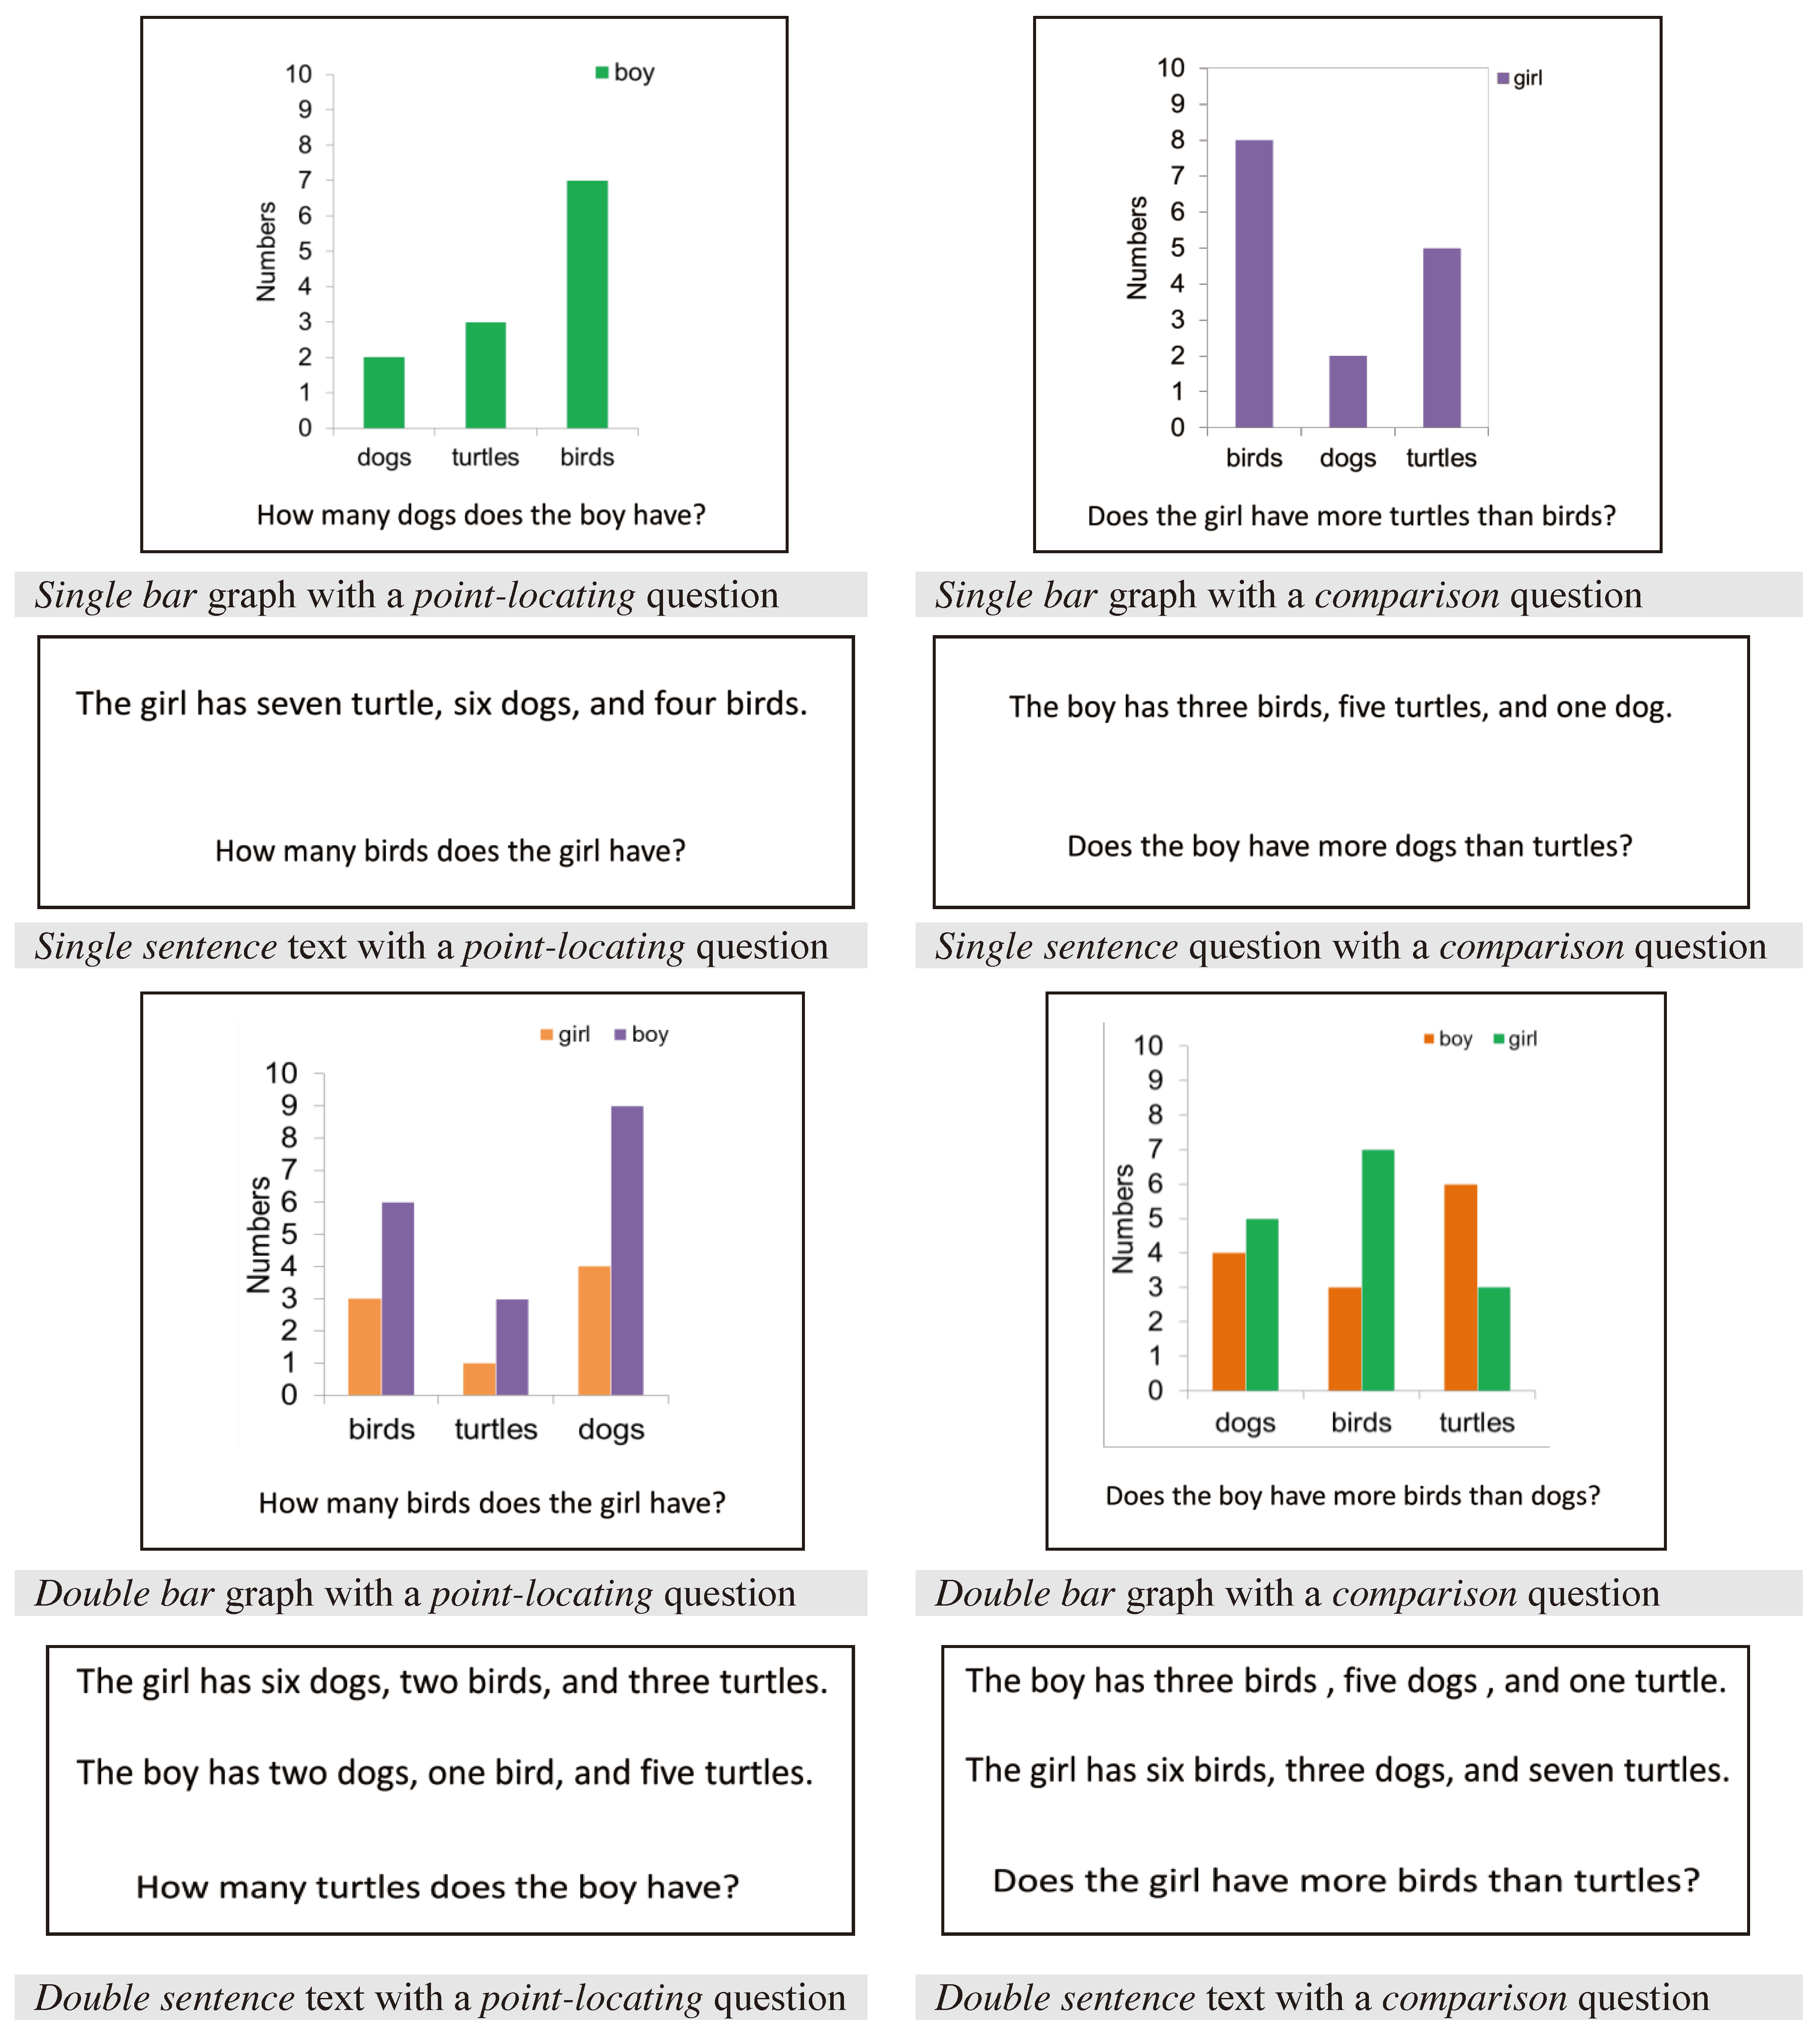
