Introduction
A wide variety of gaze tracking systems are available commercially, each tailored for a specific set of applications. Video-based eye-tracking is based on the principle that when near infrared (NIR) light is shone onto the eyes, it is reflected off the different structures in the eye to create four Purkinje reflections (
Crane and Steele, 1985). The vector difference between the pupil centre and the first Purkinje image (PI) (also known as the glint or corneal reflection (CR)), is tracked.
Tracking a person’s gaze with a video-based system involves a number of steps. These steps can be loosely grouped into two sets, namely those involved with the detection of the eyes and eye features (e.g. pupil and glint centres) in the video frames, and those which map the detected features to gaze coordinates or Point of Regard (PoR) on the stimulus. For purposes of this paper, it is assumed that the location of features in the eye video is known and the focus is on the challenge to use these as input to determine a person’s Point of Regard.
A simple video-based eye tracking system was developed with one camera and one infrared light source. The accuracy obtained with various combinations of calibration set and mapping model is evaluated for this system.
This study aims to replicate and confirm the results of an earlier study (
Blignaut, 2013). The data set in the earlier study showed clear trends with regard to the relationships between the gaze target coordinates and the pupilglint vectors in the eye video. In that study it was found that the number and arrangement of calibration targets as well as the mapping function is critically important to ensure good accuracy of a video-based eye tracker. A mapping model was derived (see below for details) and it was proven to provide an accuracy of less than 0.5° when used with a 24-point grid.
It was also indicated in
Blignaut (
2013) that accuracy cannot be based on a few validation points only as their might be areas of bad accuracy between the validation points. This study aims to see if these results hold for another data set.
The results of this study should contribute towards the drive for cheaper and simpler eye trackers as it aims to find the optimal polynomial model to map features in the eye video of an eye tracker with one camera and one infrared source to gaze coordinates. While the principles of deriving the model might be applied to more complicated trackers, it is highly unlikely that the resulting models will apply to other configurations.
Gaze Estimation
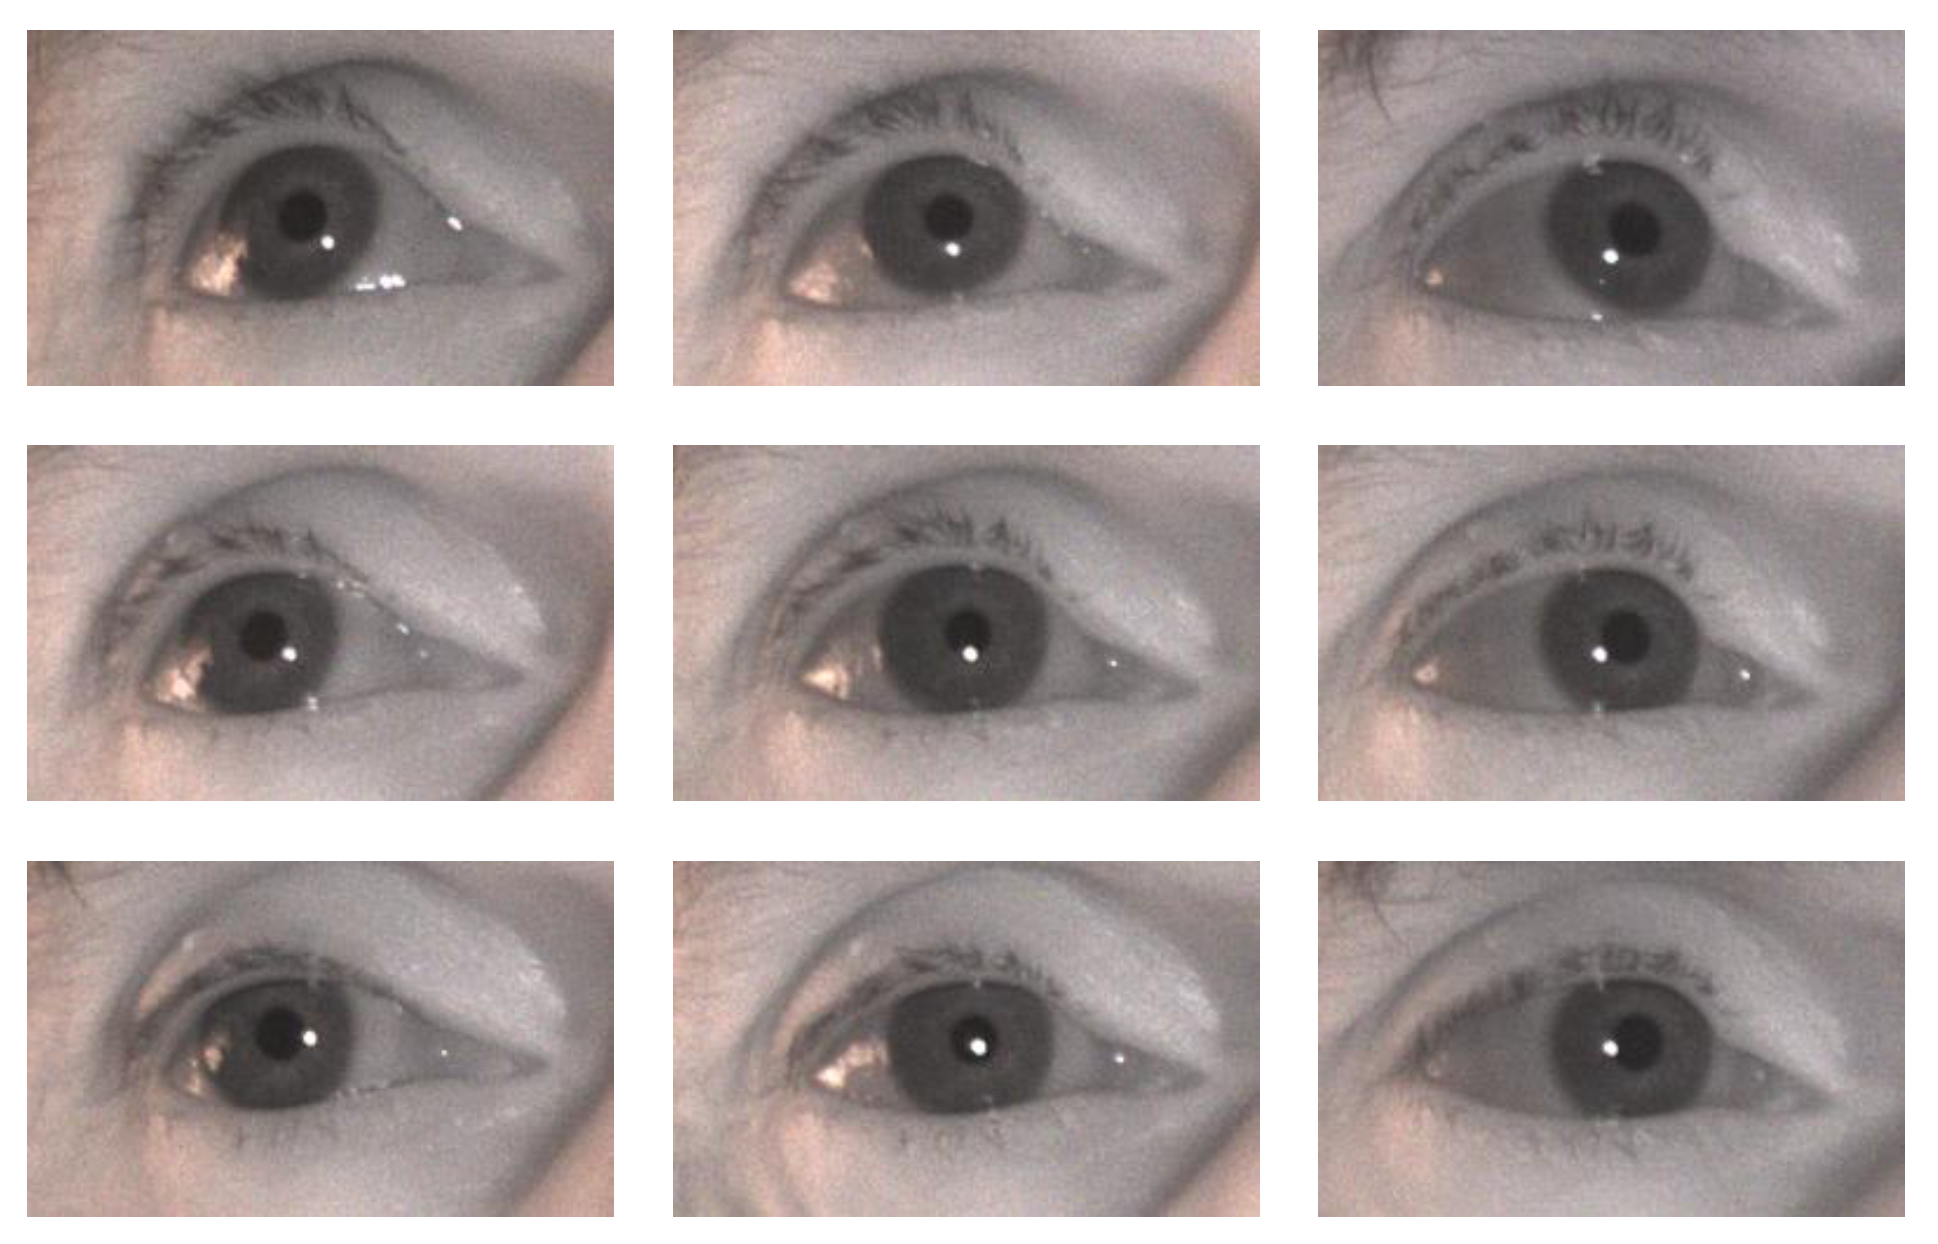
In a video-based eye tracker the pupil-glint vector changes as the eyes move (
Figure 1). The model-based gaze estimation approach determines the 3D line of sight and calculates a person’s Point of Regard (PoR) as the point where the line of sight intersects some object in the field of view, usually a computer monitor. It follows that for this approach to be implemented, the positions and orientations of the cameras, infrared lights and monitor (or other object(s) that the user might view) has to be known to a high accuracy.
Regression-based systems use polynomial expressions to determine the Point of Regard as a function of the pupil-glint vector in the eye image. Polynomial models should include two independent variables (x and y components of the pupil-glint vectors) which may or may not interact with each other for each one of the dependent variables (X and Y of the Point of Regard) separately. The coefficients for each term in the model need to be determined for every individual through a calibration process.
Using an appropriate polynomial model, the difference in x-coordinates (x’) and difference in y-coordinates (y’) between the pupil and glint can be mapped to screen coordinates (X,Y). Corrections for head movement can be done by normalising the pupil-glint vector in terms of the distance between the glints (if there are more than one IR source) or between the pupils (inter-pupil distance (IPD)), e.g. x = x’ / IPD (if there is only on IR source as in this study).
Polynomial Models in General
A set of
n points can be approximated with a polynomial of
n or less terms
where
x and
y refer to the normalised
x and
y components of the pupil-glint vector of a specific eye at a specific point in time and
X refers to the X-coordinate of the PoR for the specific eye on the two dimensional plane of the screen. A similar, but not necessarily identical, model can be used for the Y-coordinate of the PoR for the specific eye.
According to
Hennessey et al. (
2008), the polynomial order may vary but is most often of first order:
The coefficients
ak and
bk,
k ϵ (0,n-1), are determined through a calibration process which requires the user to focus on a number of dots (also referred to as calibration targets) at known angular positions while storing samples of the measured quantity (
Abe et al., 2007).
A least squares regression is then done to determine the polynomials such that the differences between the reported PoRs and the actual PoRs (the positions of the dots on the monitor) are minimised. The regressions are done separately for the left and right eyes and an interpolated PoR is calculated as the average of the (Xleft,Yleft) and (Xright, Yright) coordinates.
A set of
n points can be fitted with a polynomial of
n terms in which case
R² (indication of goodness of fit) will be 1. Regression with less terms or through more points will result in a polynomial that does not necessarily pass through any of the points and
R² will be less. This does, however, not necessarily mean that the approximations will be worse. In the simplified example of
Figure 2 with a single independent variable, a 6
th order polynomial (7 terms
a0 + a1x +a2x2 + a3x3 + a4x4 + a5x5 + a6x6 ) fits the seven points exactly, but interpolation at
x=17 will obviously be bad. A 5
th order approximation of the data has a lower
R², but interpolations between the points will be much better. Because of the end effects, even this polynomial will provide bad approximations at
x values larger than 18.
The decision of how the regression model should look is therefore not obvious. Draper and Smith (1981) indicates that, apart from the brute-force method (i.e. testing all the possible equations), there is no systematic procedure that can provide the most suitable mapping equation.
Specific Models
The simplest model would be to map the gaze coordinates in terms of a linear relationship with the normalised pupil-glint vector without considering interactions between the two dimensions:
A second order polynomial in
x and
y with first order interactions are used by Mitsugami, Ukita and Kidode (2003) and
Cerrolaza et al. (
2012):
The above model can be extended to include second order interactions:
Cerrolaza and Villanueva (
2008) generated a large number of mapping functions, varying the degree and number of terms of the polynomial. They found that, apart from some of the simplest models, increasing the number of terms or the order of the polynomial had almost no effect on accuracy. A preferred model was chosen as one that showed good accuracy across all configurations in addition to having a small number of terms and being of low order:
In a previous study (
Blignaut and Wium, 2013), we examined the accuracy of 625 polynomials and found the following model to provide the best results for all participants as long as at least 8 calibration points are used:
In another previous study (
Blignaut, 2013) we used specific trends with regard to the relationships between the gaze target coordinates and the pupil-glint vectors in the eye video to derive a set of polynomials.
This model provided very good accuracy (< 0.5°) for the simple one camera, one IR source eye tracker, given that enough calibration points were used to facilitate regression of the multi-term polynomials (
Blignaut, 2013).
Calibration Targets
Besides the polynomials to use for interpolation, a mapping model also entails the number and arrangement of calibration targets. To limit the end effects of polynomial interpolation, it is important that there are targets on the edges of the display area. More calibration targets will allow polynomials with more terms which might result in better accuracy but takes more time and might be strenuous on the participant’s eyes. The ideal situation would be to find a set of polynomials that is very accurate while using only a small number of calibration targets.
Accuracy
Accuracy is measured as the distance, in degrees, between the position of a known target point and the average position of a set of raw data samples, collected from a participant looking at the point (
Holmqvist et al., 2011).
This error may be averaged over a set of target points that are distributed across the display. The interest in this paper is in minimising the error that occurs due to the calibration process, specifically for a simple one light, one camera configuration.
While an accuracy of 0.3° has been reported for tower-mounted high-end systems operated by skilled operators (Holmqvist et al, 2011), remote systems are usually less accurate.
Hansen and Ji (
2010) provided an overview of remote eye-trackers and reported the accuracy of most model-based gaze estimation systems to be in the order of 1° - 2°.
Methodology
Experimental Configuration
An eye tracker was developed with a single CMOS camera with USB 2.0 interface and a 10 mm lens together with a single infrared light source. The UI-1550LE-C-DL camera from IDS Imaging (
http://en.ids-imaging.com/) has a 1600×1200 sensor with pixel size of 2.8 μm (0.0028 mm). The images were rendered on a screen with a pixel size of 0.364 mm. The calibration was done on a 1360×768 (495 mm×280 mm) section of the screen at a distance of 800 mm from the participants. The camera was positioned 280 mm in front of the screen with an eye-camera distance of 600 mm. See
Figure 3 for details.
Data capturing
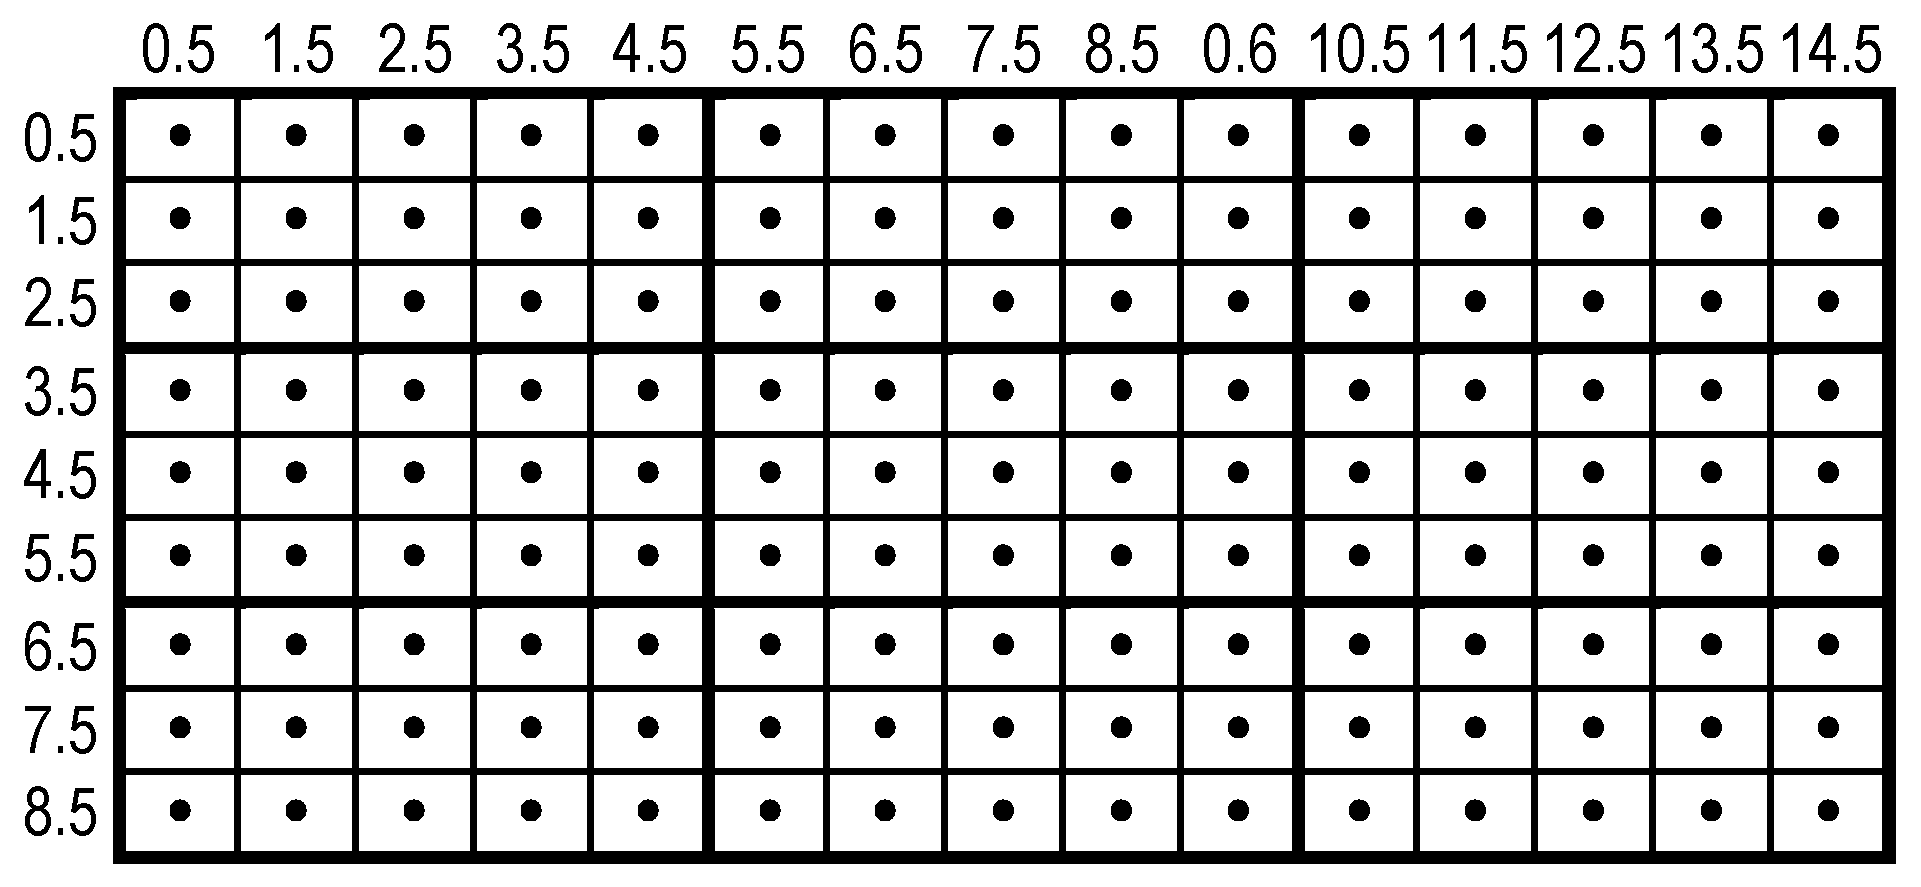
The calibration area was divided into a 15×9 grid to have the same width:height ratio as that of the display area (1360×768 pixels) (
Figure 4). Twenty six (26) participants were presented with a series of 135 targets that covered the entire grid. Five data sets were captured for every participant.
No chin rest was used, but participants were requested to keep their heads as still as possible at a constant distance from the eye camera. Participants could at any time look away from the screen and rest their eyes. A target would only be accepted if the gaze was stable for a minimum period of 1 second. For each target, the pupil-glint vector of the last 500 ms of the period of stable gaze was saved to a database. The saved data were used afterwards to simulate the calibration procedure for various combinations of calibration target arrangements and mapping models.
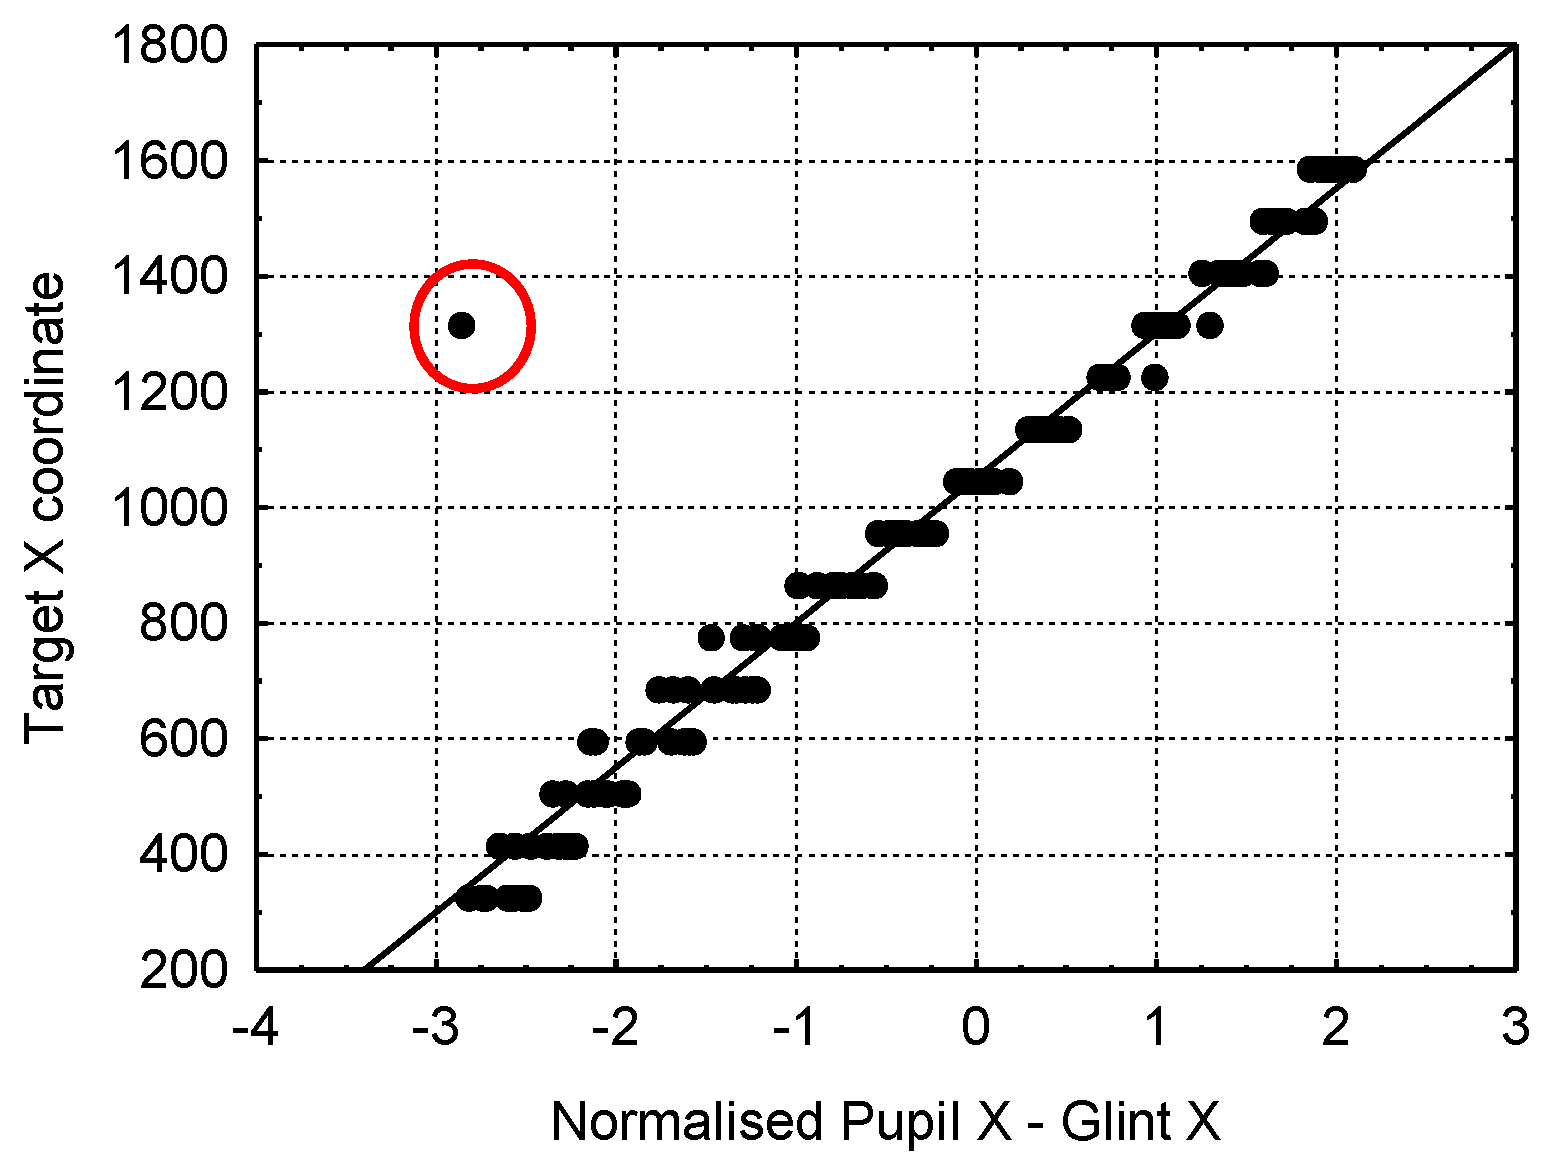
To ensure that participants focused on a target, an initial linear regression was done after the 135 targets were accepted (
Figure 5). A specific target was displayed again if the pupil-glint difference did not fall within 6σ of the average distance from the line. This procedure was repeated until all data points were within this tolerance from the regression line.
Despite the technique of normalising the pupil-glint vectors in terms of the inter-pupil distance (IPD), accuracy can still be affected by gaze distance. Therefore, in order to compare the accuracy of various polynomials with one another, the gaze distance was controlled.
Gaze distance was approximated in terms of the interpupil distance (IPD). The system was calibrated at 600 mm where the IPD in pixels was equated to the average IPD of 63 mm for adults (
Dodgson, 2004). Although the inter-pupil distance differs slightly from one person another, the effect is not more than 30 mm. It is not important that the value is 100% accurate – the distance indicator only serves to ensure that the gaze distance for a specific person remains constant.
Two fixed concentric circles were displayed around each target, representing camera distances of 597 and 603 mm respectively. A third concentric circle was displayed with varying radius as the participant moves his head backwards or forwards (
Figure 6). The participant had to move his head until the dynamic circle is between the two fixed circles, i.e. in the range 598 mm - 602 mm. For this study, the focus was solely to find the most appropriate mapping model at a specific gaze distance. Future studies will include gaze distance as a separate independent variable for the regression polynomial.
Calibration and Validation
Calibration. Data for the pupil-glint vectors at selected cells in the 15×9 grid (
Figure 4) was selected to serve as calibration targets. The accuracy for six different calibration sets, which varies with regard to the number and arrangement of targets (
Figure 7), were compared with one another. One of these arrangements is the full 135-point set that were used as benchmark for the best possible accuracy that can be attained.
Since the regression is done separately for the X and Y dimensions, it was thought that the arrangement of calibration targets should be such that they cover as many distinct X and Y values as possible. Having 9 points on a 3×3 grid effectively limits the regression to 3 distinct X and 3 distinct Y values. In
Figure 7 below, 18 calibration targets are, for example, arranged to cover 11 distinct X and 9 distinct Y coordinates.
Validation. Normally, the accuracy of a system can be determined by requesting a participant to look at a second series of evenly spread targets (the first series being the calibration targets) for which the X and Y coordinates are known. The accuracy is then calculated as the average of the differences between the known and reported positions.
To ensure representative measurement of accuracy, validation targets (to be distinguished from calibration targets) should be spread regularly across the entire range at small intervals. For this study, the saved pupil glint vectors for all 135 cells in the 15×9 grid were used towards this purpose (cells marked with • in
Figure 4).
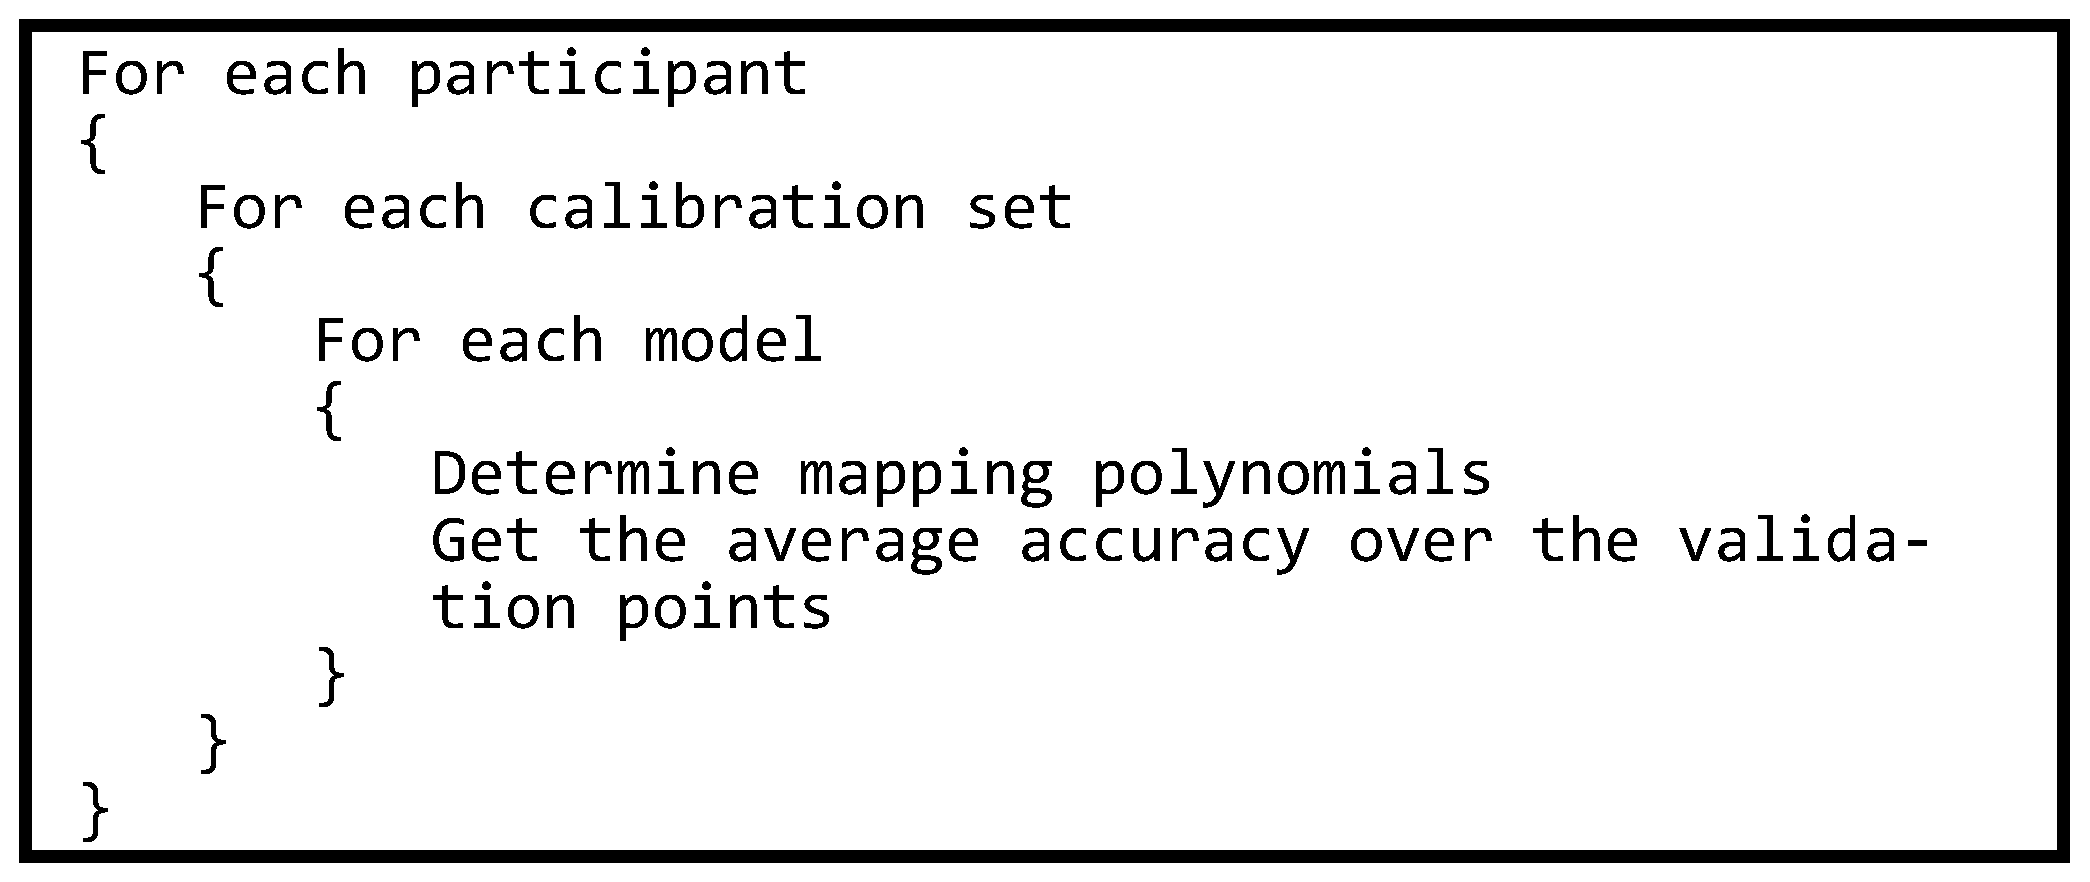
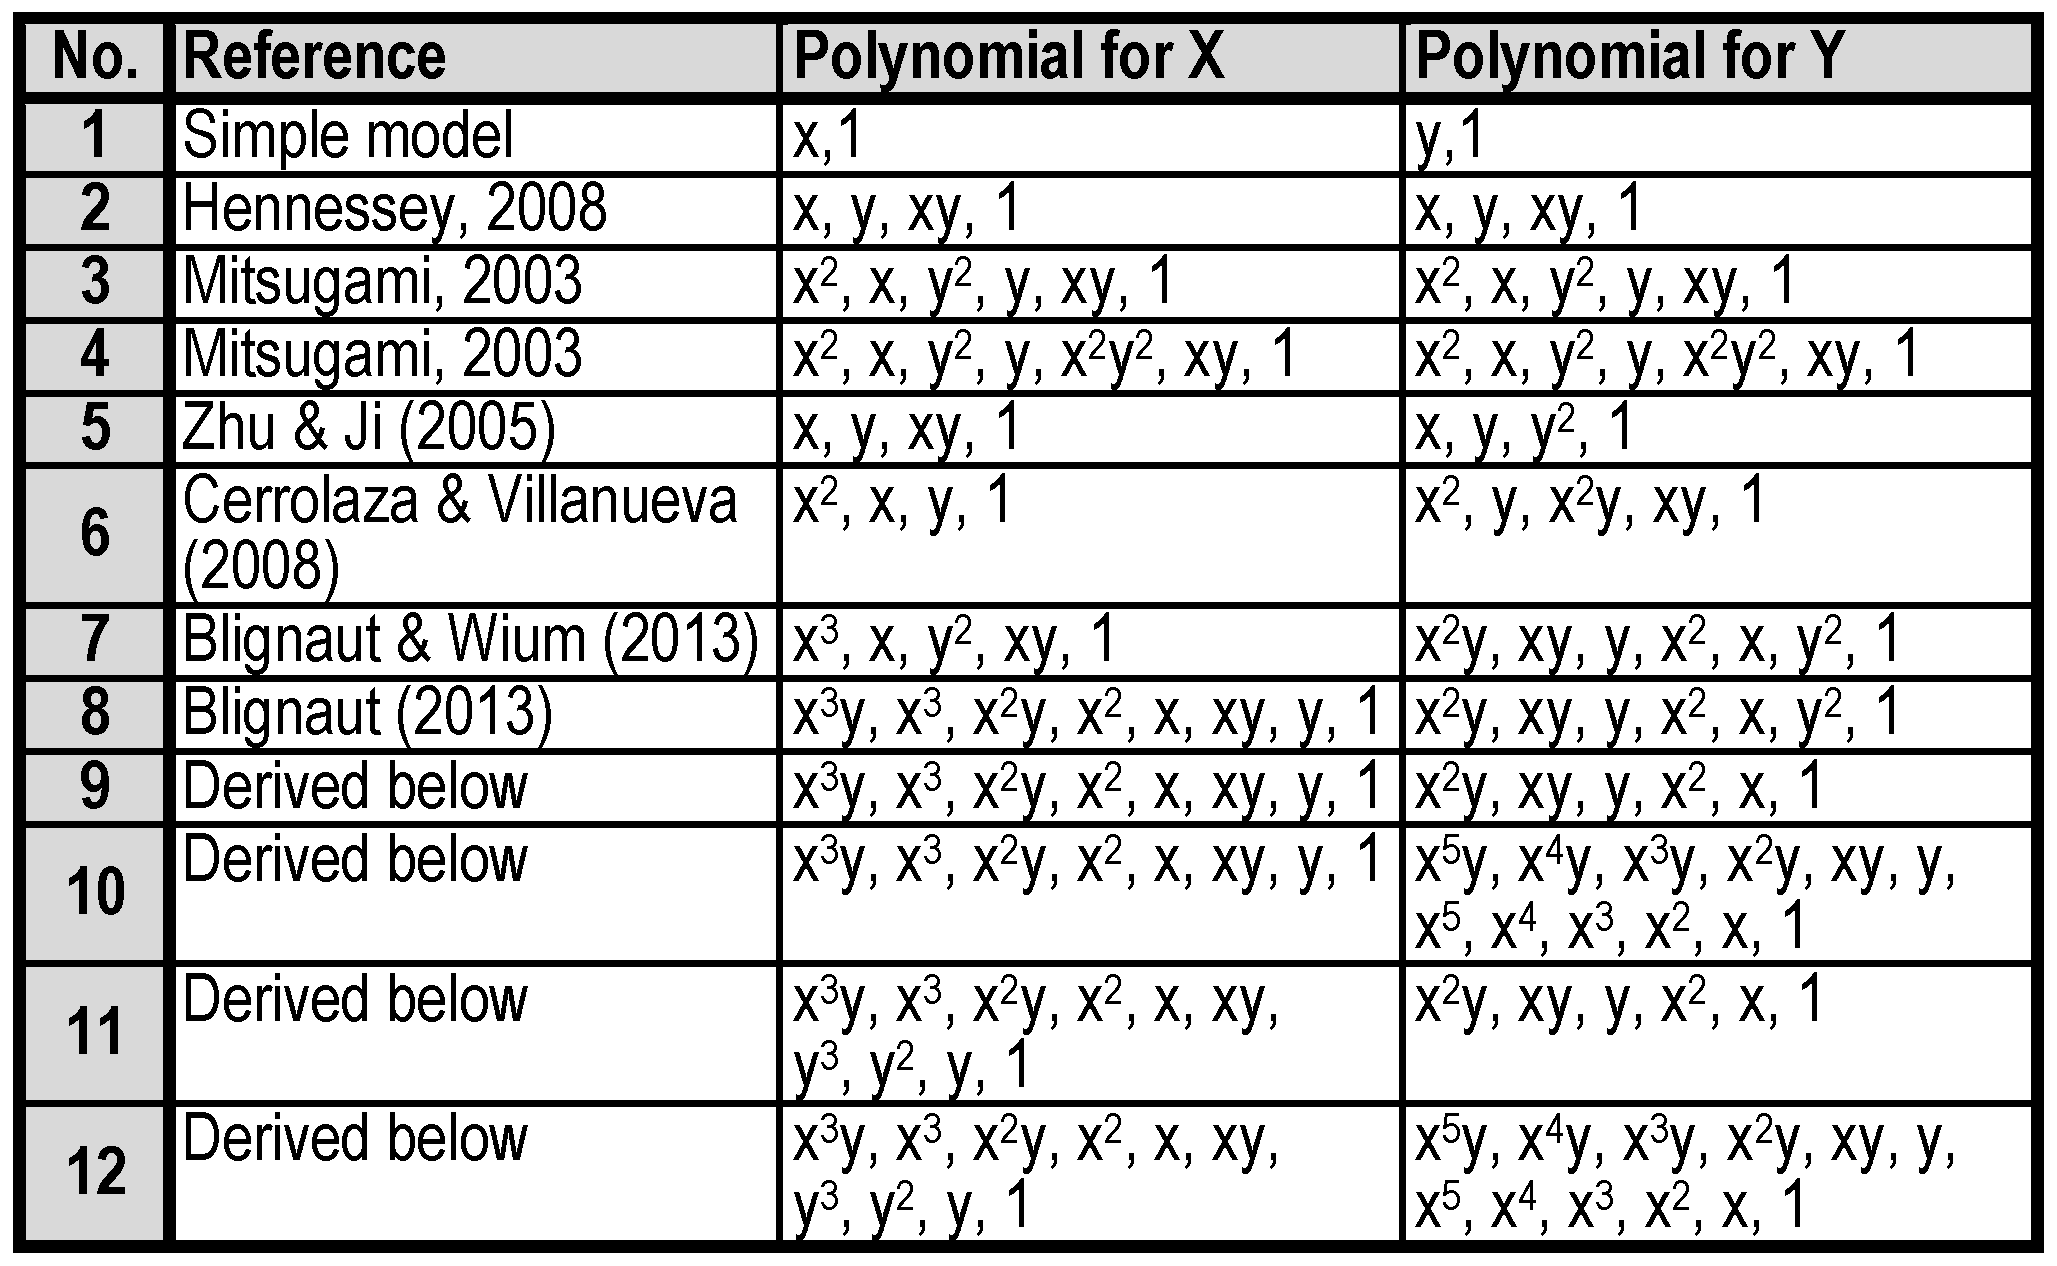
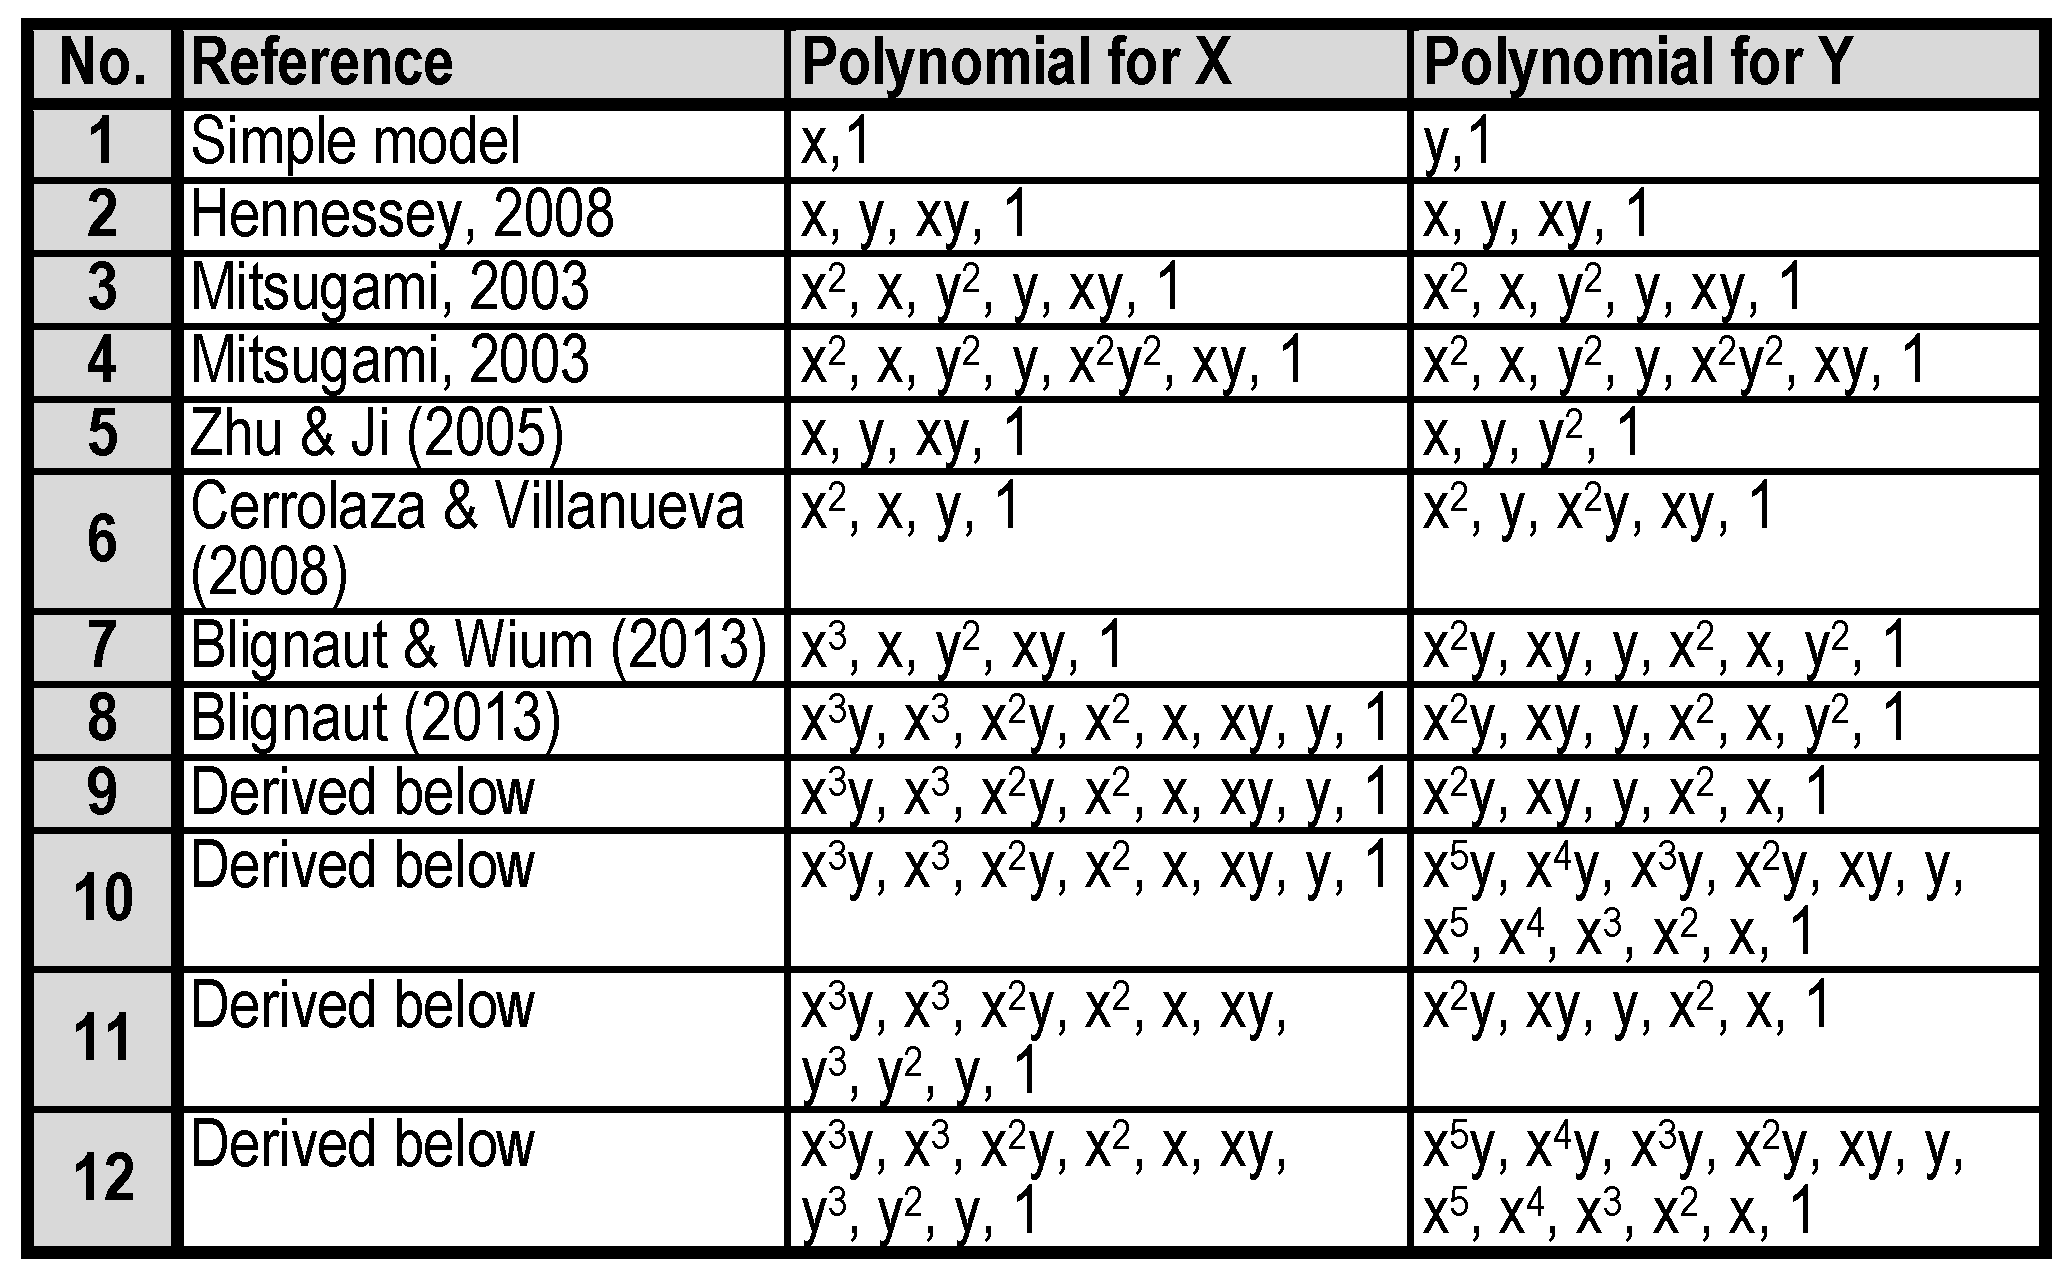
For every participant/calibration set combination, the pupil-glint vectors in the calibration cells were used to determine the regression coefficients for each one of 12 polynomial models (
Table 1). Models 9-12 in
Table 1 will be derived later. A high level algorithm of the process is given in
Figure 8.
Derivation of alternative models
Relationship between (Pupil X – Glint X) and PoRx
The models mentioned above express the X and Y coordinates of the PoR as two bivariate polynomials in terms of the x and y coordinates of the pupil-glint vector. In an attempt to simplify the relationships, the data that was captured was analysed while controlling for one of the two independent variables (the x and y coordinates of the pupil-glint vector). In other words, X was expressed in terms of x only at a specific value for Y. This means that for the 15×9 grid, nine relationships could be written for X in terms of x and 15 relationships could be written for Y in terms of y.
Figure 9 shows the relationships between the target X coordinate and the average normalized pupil-glint X (referred to as
PGX) of 130 data sets (26 participants with 5 repetitions each) at 9 distinct Y coordinates for the left and right eyes.
From
Figure 9 it can be inferred that a third degree polynomial should fit each one of the 9 relationships very well. The following relationship was found between the normalised pupil-glint differences and the X-coordinate of the target for the left eye at Y=200:
The
R2 values at the other Y-positions of the targets are given in
Table 2.
In general terms, the relationship can be written as
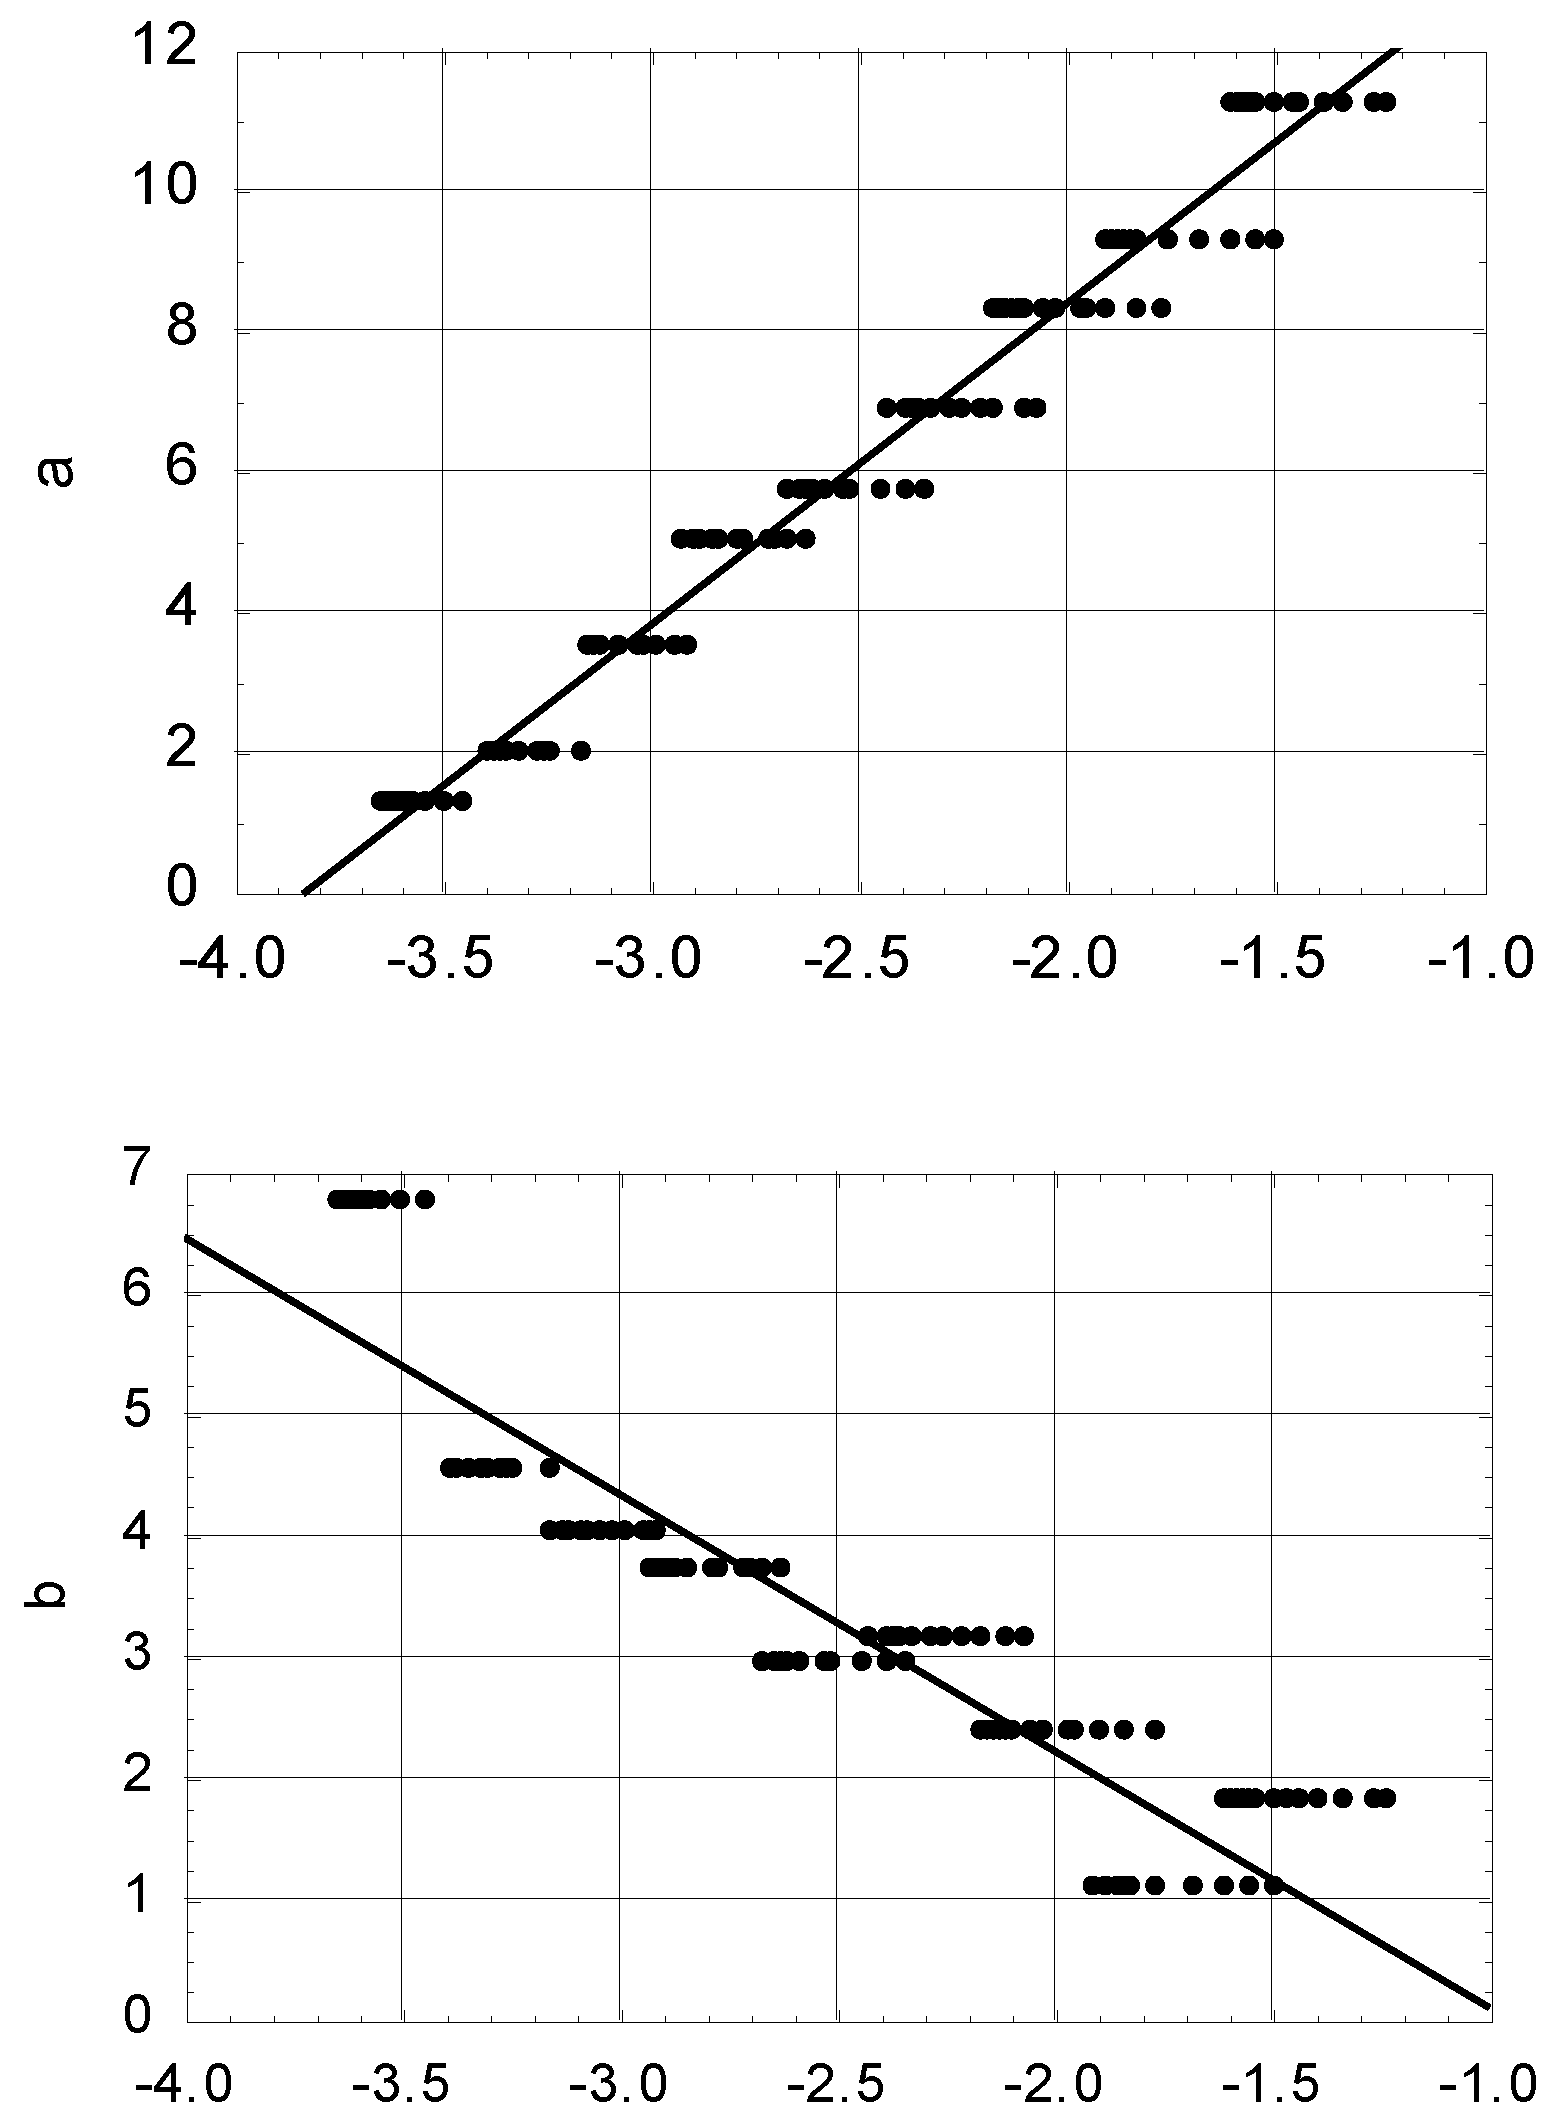
Figure 10 shows plots of the coefficients
a,
b,
c and
d against the average normalized pupil-glint Y for the left eye. Similar trends were found for the right eye.
Table 3 shows the respective
R2 values for the left and right eyes.
The relationships could thus be written as follows:
Substituting these into the general equation (1) above, we get
This is a small difference from the model used in
Blignaut (
2013) as in the latter study a linear relationship was used between d and the target Y coordinate.
Relationship between (Pupil Y – Glint Y) and PoRy
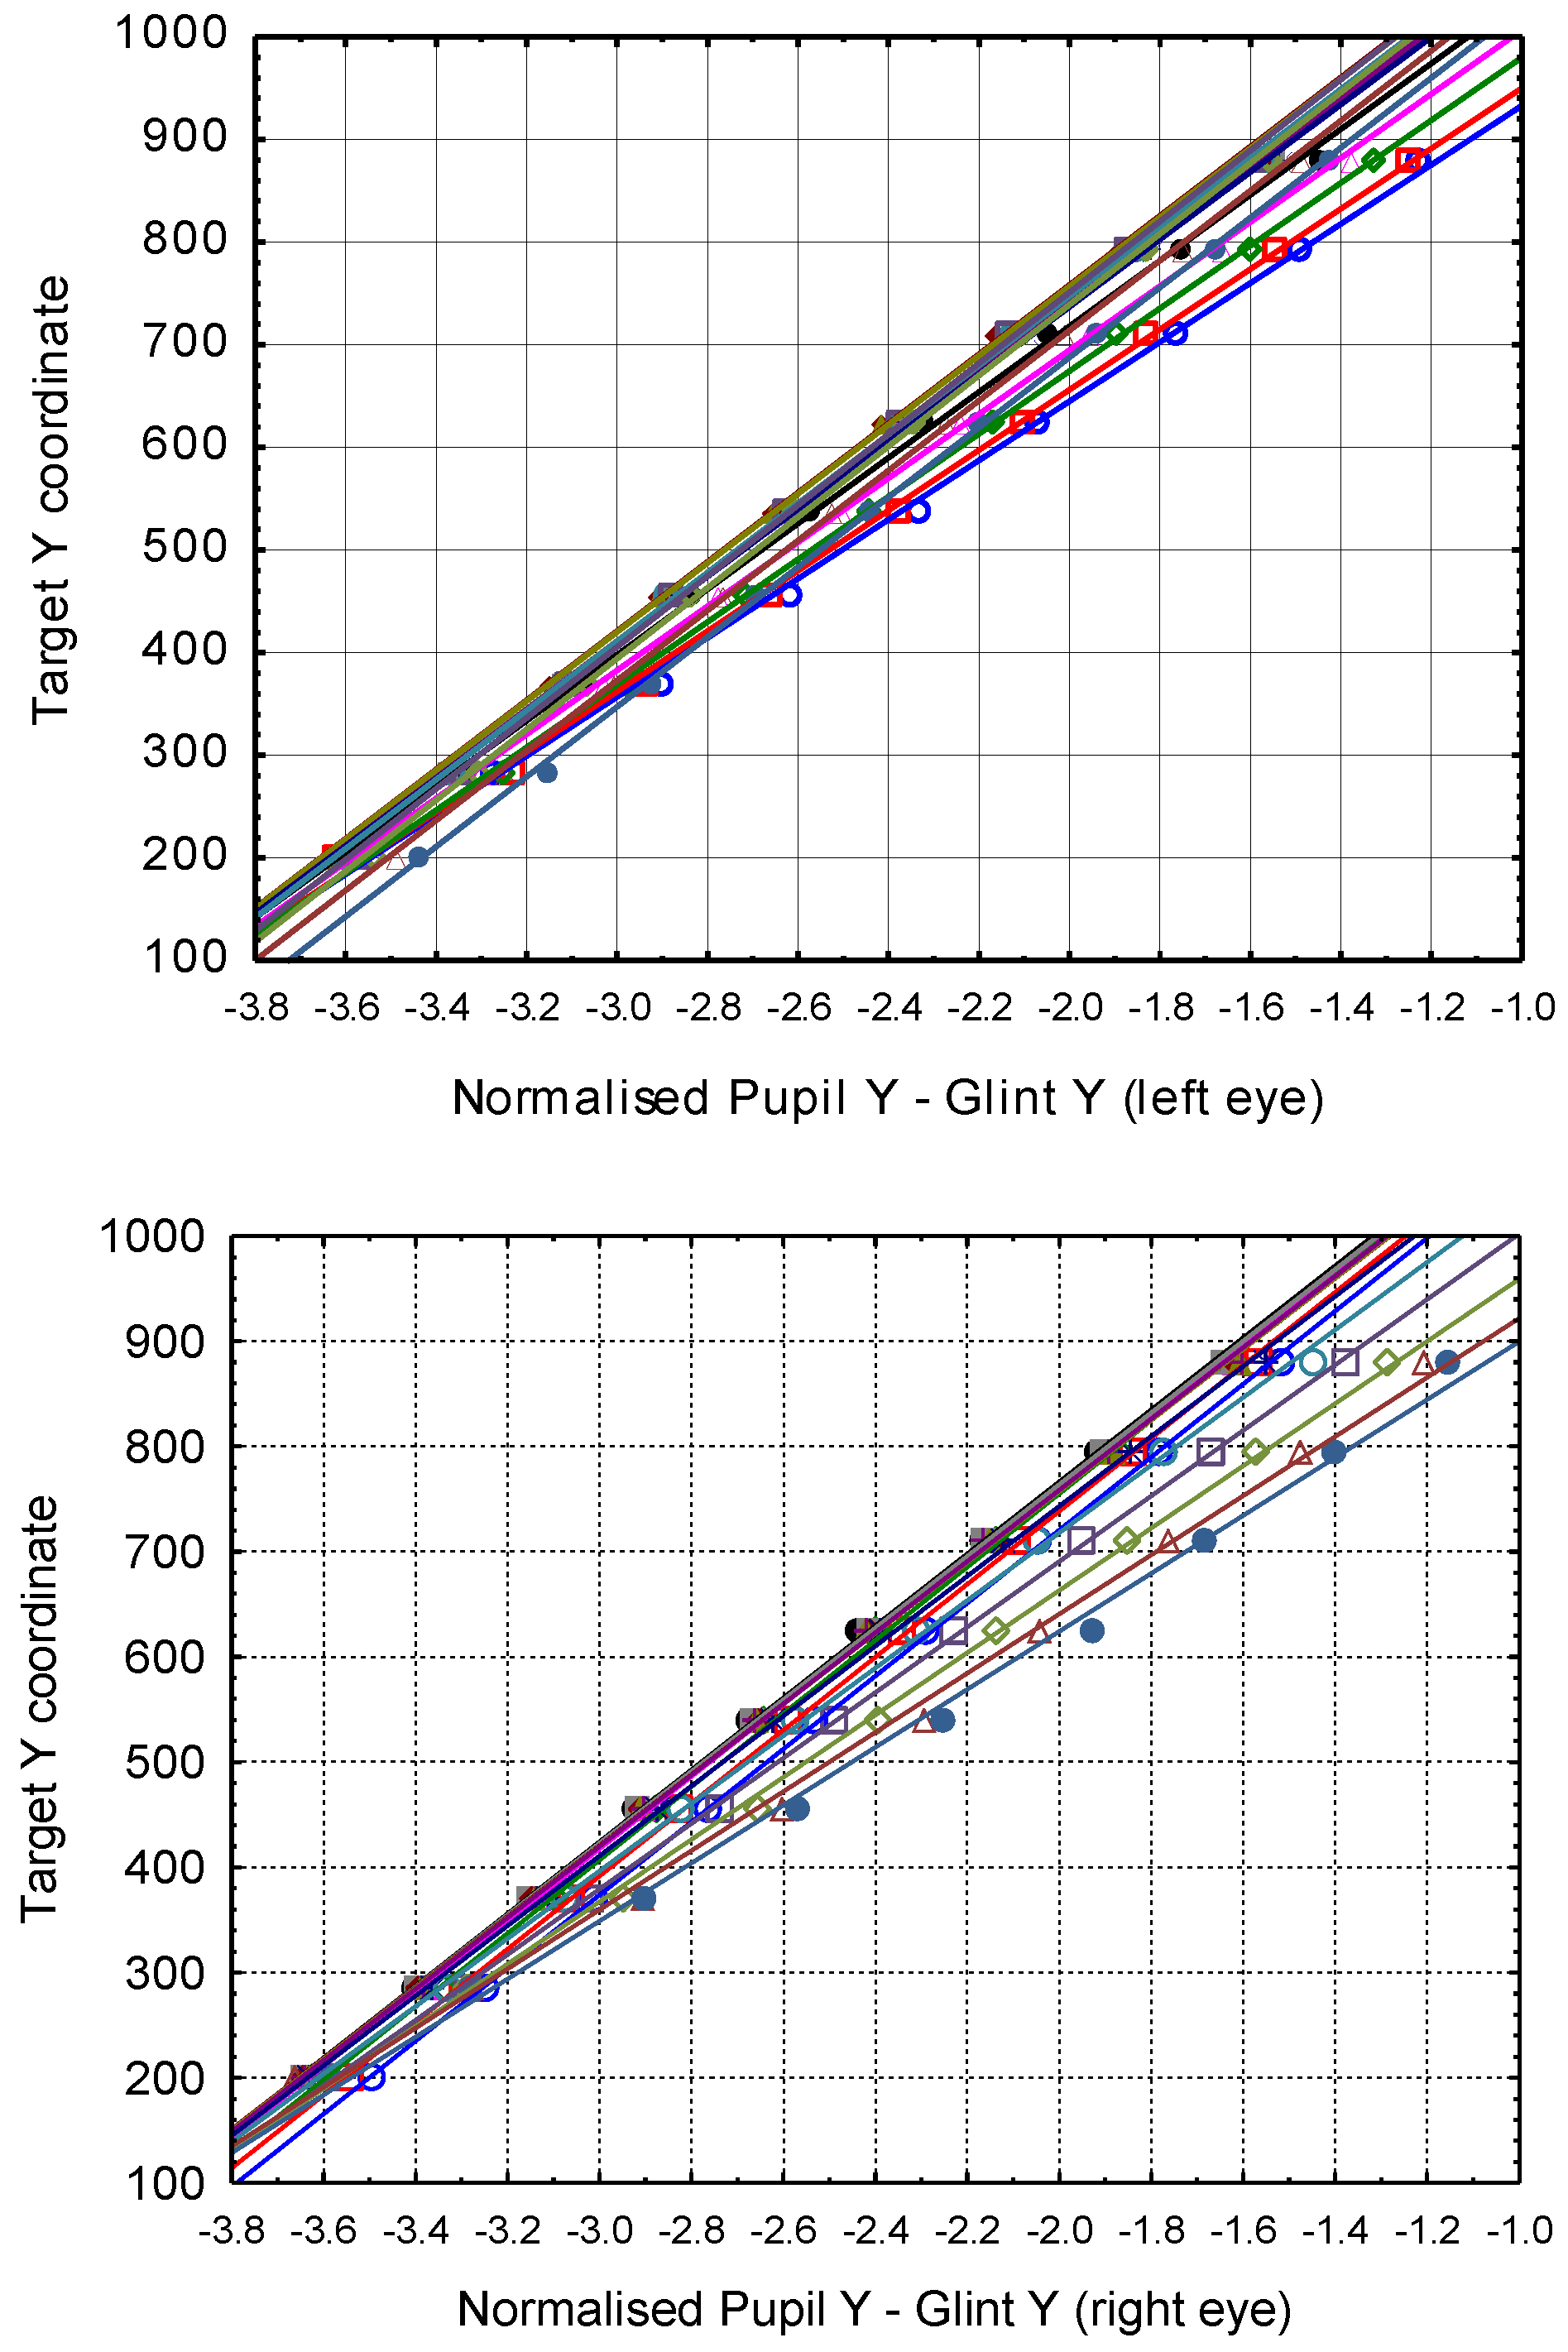
Figure 11 shows the relationships between the target Y coordinate and the average normalized pupil-glint Y (
PGY) of 130 data sets (26 participants with 5 sets each) at 15 distinct X coordinates for the left and right eyes.
From
Figure 11 it can be inferred that a straight line should fit each one of the 15 relationships very well. The following relationship was found between the normalised pupil-glint differences and the Y-coordinate of the target for the left eye at X=326:
The
R2 values at the other X-positions of the targets are given in
Table 4. In general terms, the relationship can be written as
In
Blignaut (
2013) this relationship between the target Y coordinate and
PGy was expressed as a second order polynomial.
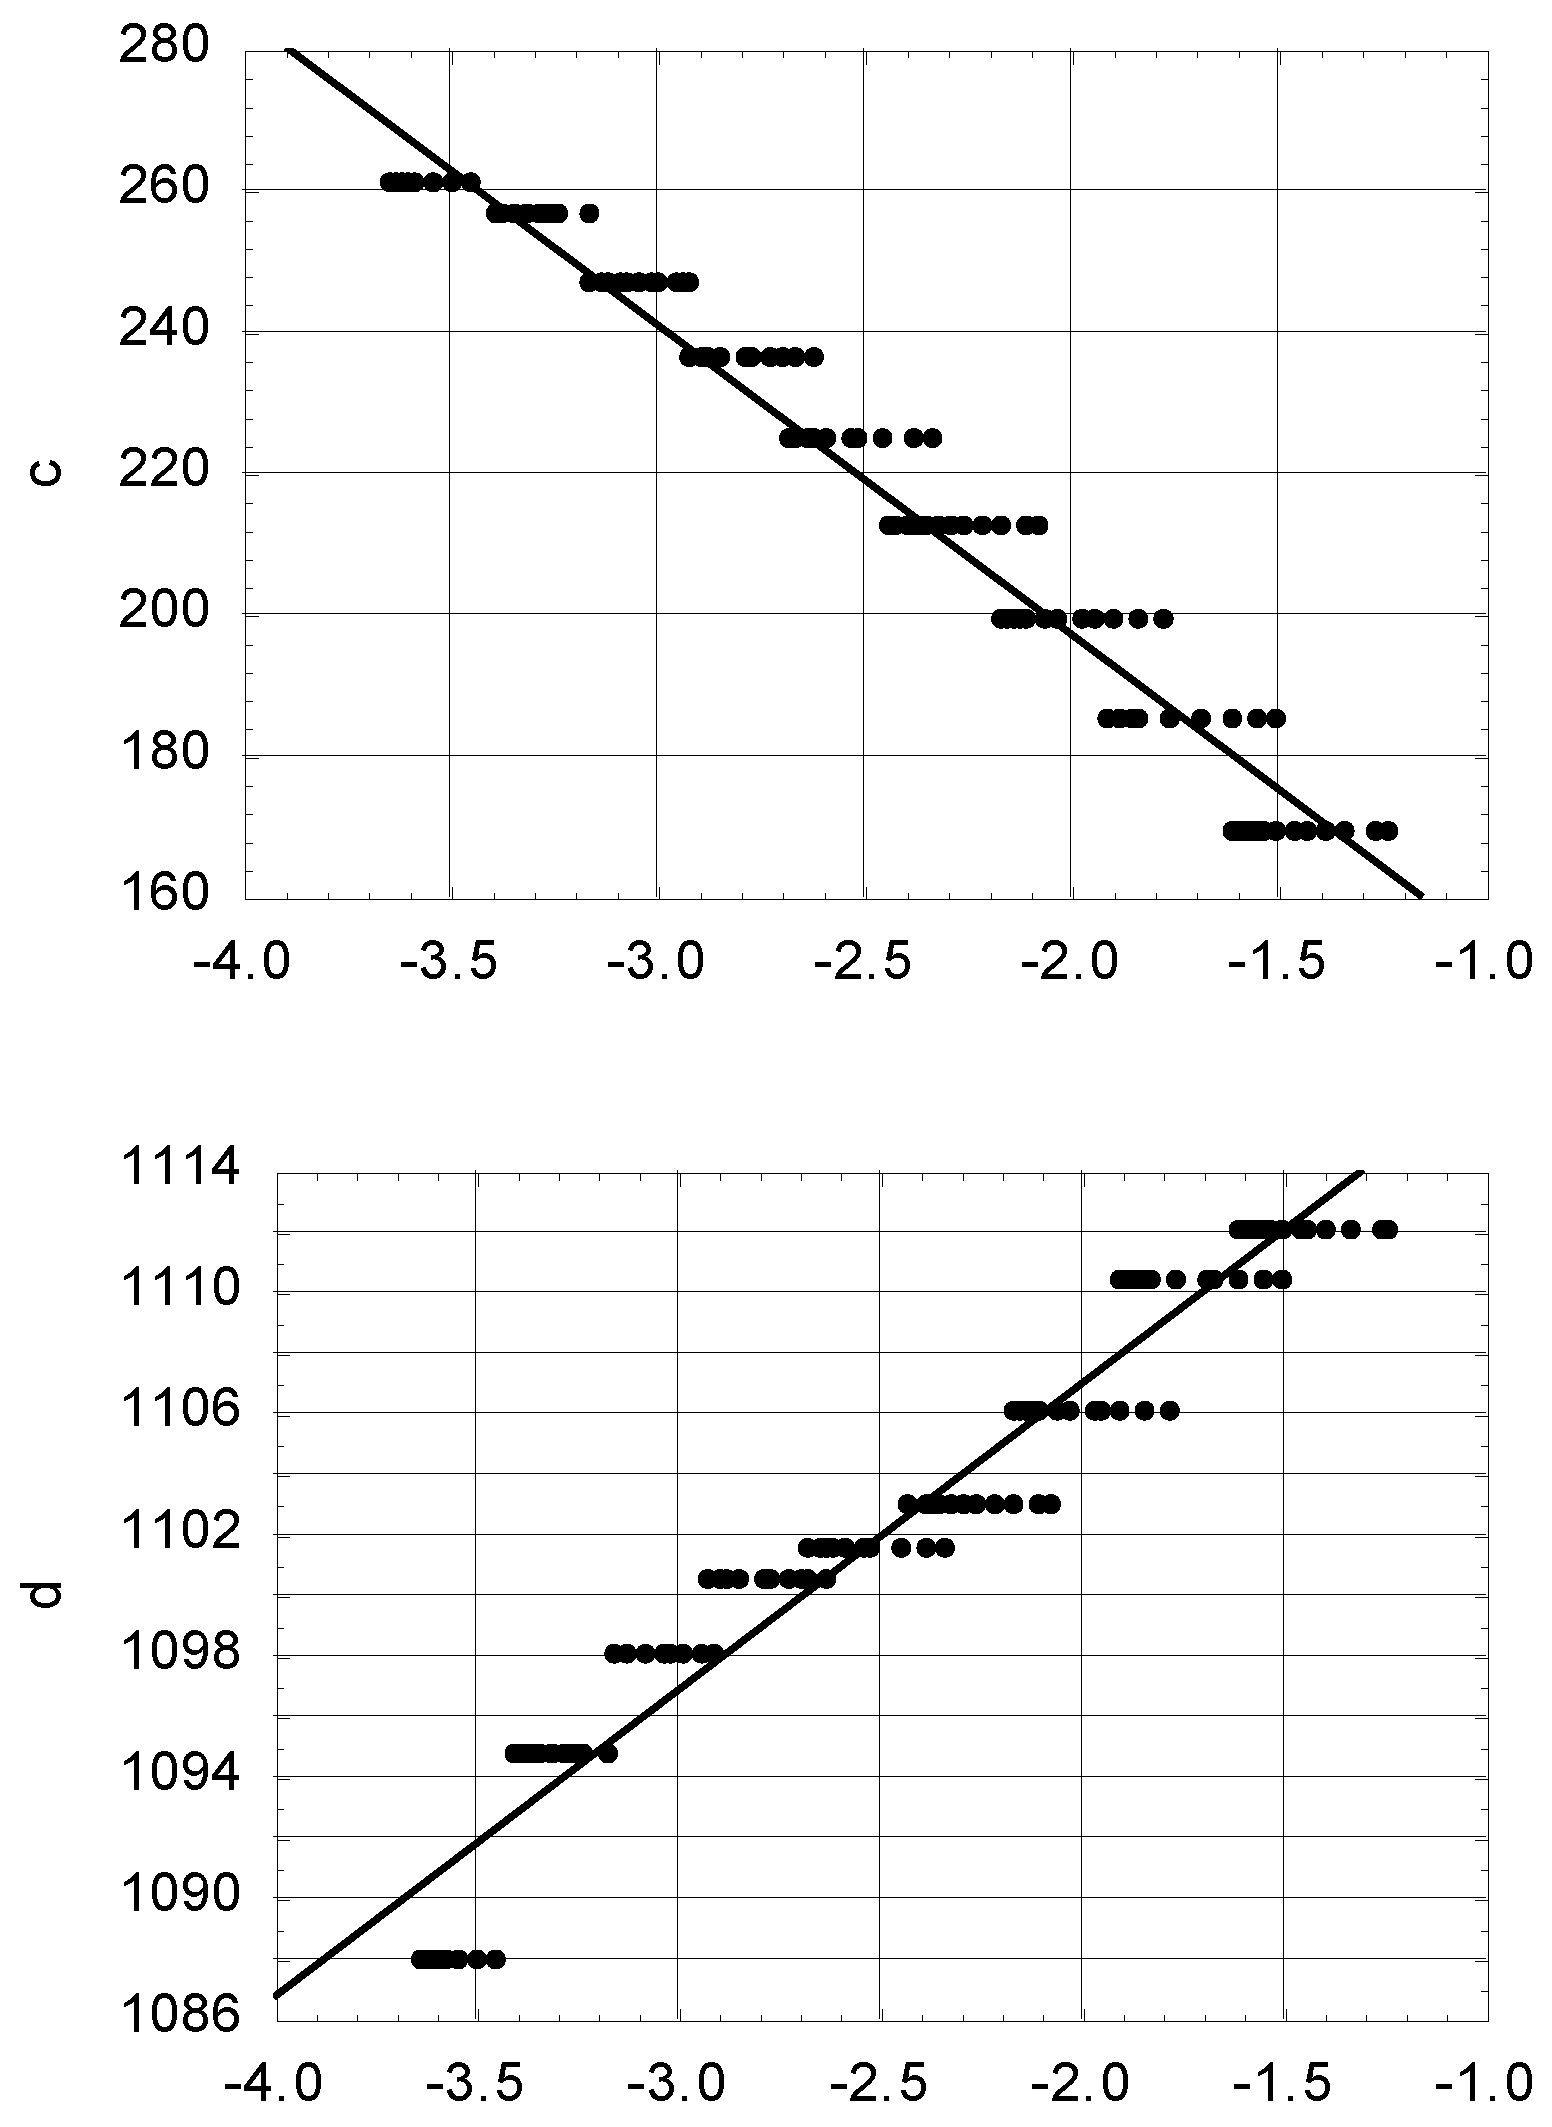
Figure 12 shows plots of the coefficients
a and
b against the average normalized pupil-glint X for the left and right eyes. It is evident that the trends of the plots change at when the normalised pupil-glint vector changes from negative to positive or when the glint moves to the other side of the pupil (cf.
Figure 1). Therefore, it might be an option to have separate polynomial fits for
PGX > 0 and
PGX < 0, but that could cause sudden transition jumps when the glint moves to the other side of the pupil.
Table 5 shows the
R2 values of second and fifth order polynomial fits for the left and right eyes. An important consequence of a fifth order polynomial is that we will need at least six distinct X values for a calibration procedure and that there are calibration points at the edges of the area of interest to limit the impact of end-effects.
The fifth order relationships could be written as follows:
Substituting these into the general equation (3) above, we get
Since fifth order polynomials would need a large number of calibration points, the relationships were also approximated with second order polynomials:
yielding
Results
Comparison of polynomial models and calibration configurations
Table 6 shows the average accuracy over 130 data sets (26 participants with 5 data sets each) for selected calibration configurations (See
Table 1 for details about each model). The second Mitsugami model (
Mitsugami et al., 2003) gives the best results for the 9-point calibration configuration (0.87°) while no model gives acceptable results with 5 calibration points. The original Blignaut model provides the best accuracy with all calibration configurations with 14 or more points. The small improvement of 23 points over 14 points might not justify the extra effort.
Distribution of Accuracy
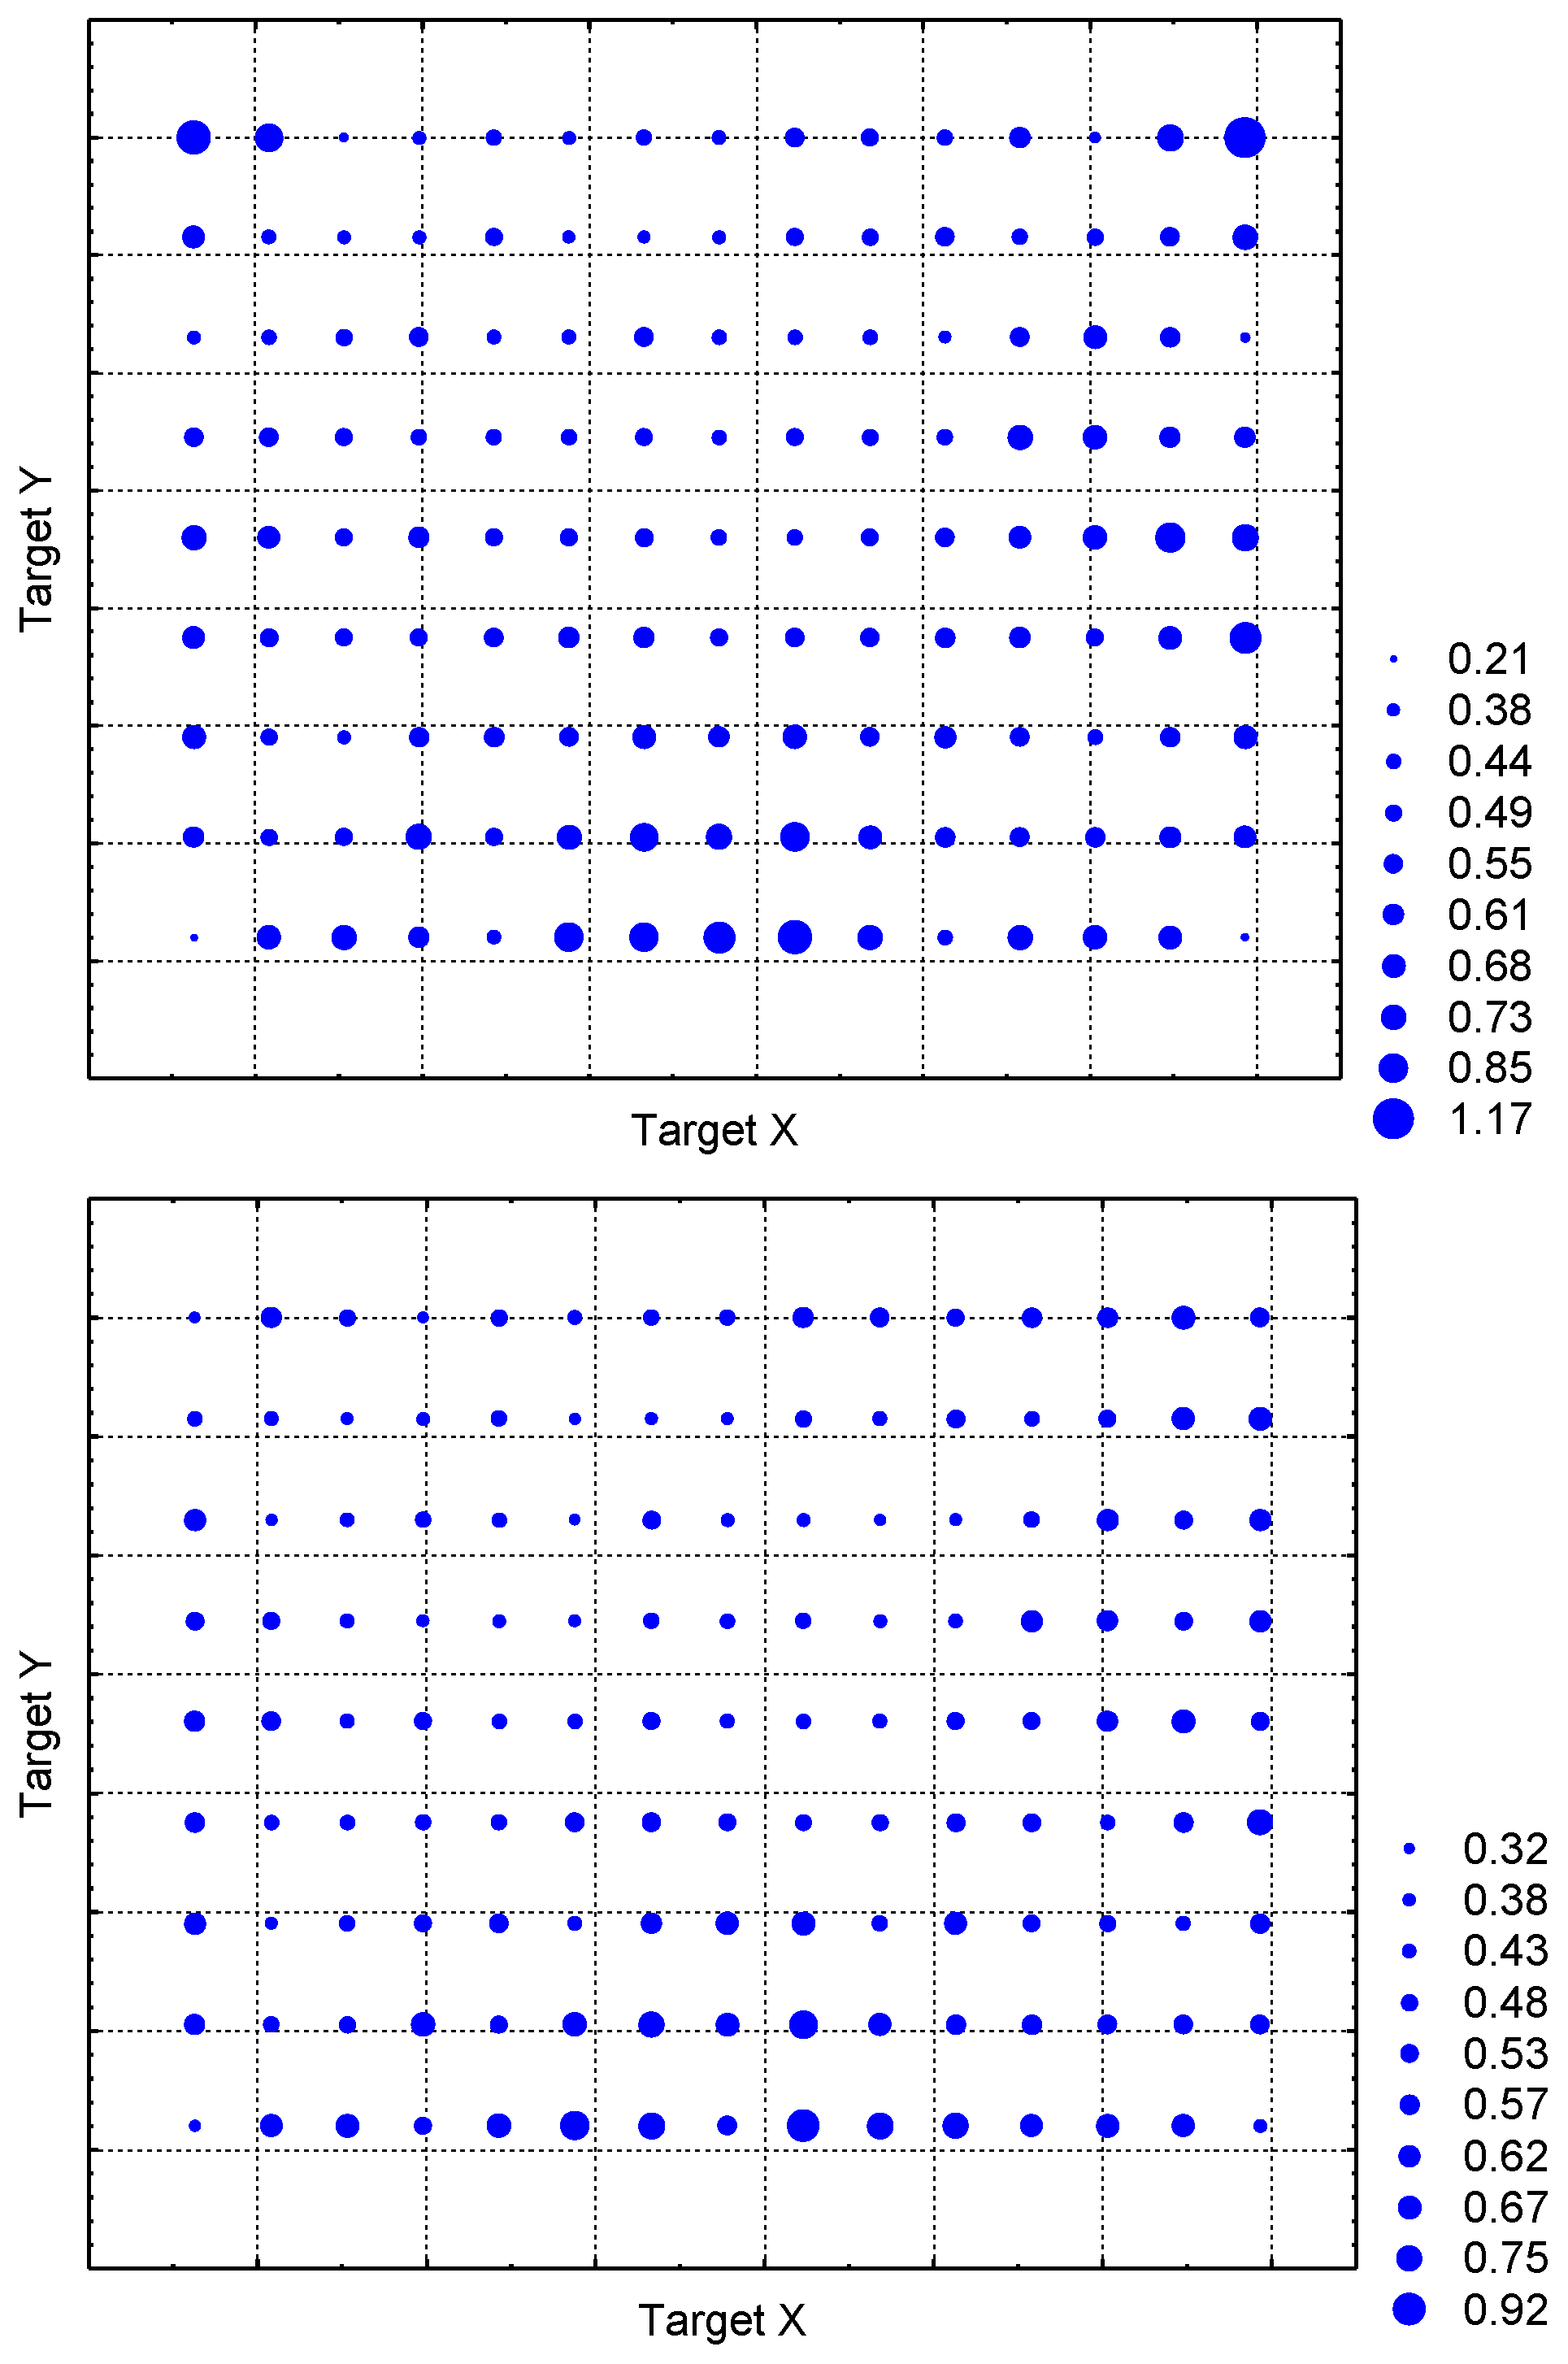
Figure 13 shows a bubble chart of the average error over all 130 data sets (26 participants with 5 data sets each), represented by the size of a bubble, against the X and Y coordinates of the validation targets for model 4 in combination with the 9-point calibration configuration. Although the average accuracy over the entire display area is reasonable (0.87°), there is a large area at the bottom of the screen where the accuracy is unacceptably bad.
Figure 14 shows similar bubble charts for model 8 in combination with the 14- and 23-point calibration configurations. Not only is the average accuracy considerably better (0.58° and 0.53° respectively), the errors are also distributed more evenly across the entire screen.
Discussion
Using a data set with 26 participants, watching five sets of 135 gaze targets in a 15×9 grid, the effectiveness of a mapping function that was derived in an earlier study (
Blignaut, 2013) was confirmed.
It was proven again that a simple system with one USB camera and a single infrared source is capable of achieving accuracy values that compare well with that of industrial systems (see discussion above). It is also not necessary to apply a complex mathematical model for gaze estimation. Mapping the pupil-glint vector to gaze coordinates can work as long as the mapping function is carefully selected along with the optimum configuration of calibration targets.
A systematic approach towards the selection of an appropriate mapping function was illustrated. Visual inspection of calibration data in one dimension while controlling for the other, can be used to discover relationships between the dependent (PoR) and independent (pupil-glint vector) variables. This approach can be used to derive a mapping function that will result in good (≅0.5°) accuracy values, provided that 14 or more calibration points are used. It was shown that complex, high-order, relationships do not necessarily provide better results than a model that was derived in an earlier study (
Blignaut, 2013).
It is important to note that accuracy should not be sacrificed for the sake of calibration speed. It is believed that a few more seconds for the calibration routine is a worthwhile investment towards better results during studies. A proper implementation of the calibration procedure should allow participants to blink or even look away during the process in order to reduce eye fatigue. While capturing data for this study, participants completed a set of 135 gaze targets within three minutes, meaning that a calibration procedure with 23 targets should take less than 30 seconds to complete.
The best combination of mapping function and calibration configuration should ensure an even distribution of inaccuracy. The bubble chart in
Figure 13 shows that there might be sudden occurrences of bad accuracy as well as regions where the accuracy is much worse than the average.
It was also motivated above that a good average accuracy might not be acceptable. Application of the often used 9-point calibration grid in combination with the Mitsugami model on the data in this study resulted in an average error 0.87° which is within the typical range of video-based systems (
Hansen and Ji, 2010). The uneven distribution of error (
Figure 13) might make the system unusable for gaze interaction as certain targets might be inaccessible.
As a consequence of the results in this study it follows that the accuracy of an eye tracking system cannot be expressed in absolute terms and depends on several factors that include hardware configuration as well as software algorithms, procedures and parameters. Manufacturers may, therefore, provide regular updates to the socalled firmware – the software that resides inside the machine itself and which is actually responsible for the eye tracking data that is provided to the researcher.
In other words, stating the accuracy of an eye tracker without reference to the calibration procedure that was used can be misleading. Researchers should also specify the version of firmware along with the make and model of the eye tracker that was used for a study.


