Introduction
Eye-tracking methodology has been used for the study of cognitive processing in graphic-based problem-solving such as concept identification (
Groner & Groner, 1982), series problems (
Groner & Groner, 1983), mental rotation tasks within spatial ability tests (
Just & Carpenter, 1985), comprehension of complex graphs (
Körner, 2011), mechanical systems problems (
Hegarty & Just, 1993), arithmetic tasks (Hegarty, Mayer, & Green, 1992; Hegarty, Mayer, & Monk, 1995), geometric reasoning tasks (
Epelboim & Suppes, 1997,
2001) and insight problems (
Grant & Spivey, 2003; Knoblich, Ohlsson, & Raney, 2001). Eye movement analyses shed light on the internal cognitive processes of human problem solvers (
Knoblich et al., 2001; van Gog, Paas, van Merrienboer, & Witte, 2005;
Yoon & Narayanan, 2004). Based on the immediacy assumption and the eye-mind assumption (
Just & Carpenter, 1980), eye-tracking methodology provides researchers with a method for observing people’s cognitive processes when solving graphic-based problems.
Previous studies examining graphical problem-solving often focus on the “input phase” of problem comprehension (
Groner & Groner, 1983;
Hegarty et al., 1992;
Hegarty et al., 1995; Ratwani, Trafton, & Boehm-Davis, 2008). In doing so, researchers have simplified the “output phase” by providing multiple-choice options via keyboard responses (e.g., Madsen, Larson, Loschky, & Rebello, 2012) or verbal protocols (e.g.,
Epelboim & Suppes, 2001;
Hegarty et al., 1995). With the aid of new technical devices, users can express their thoughts more intuitively through drawing or writing on a touchscreen. Recently, an increasing number of multimedia programs provide practice with graphical problem-solving skills through the input with a touchscreen (
Edens & Potter, 2007). This procedure typically involves problem-solvers inputting a problem statement and diagram and then outputting a handwritten solution (e.g., words, symbols, or drawings). Problem-solving is considered a very complex task in this context given the need for consecutive signal switching between the eye (sensor) and hand (motor). This type of task is referred to as “complete problem-solving” (CPS), as it includes the viewing input phase, the writing output phase, and the switching that is required between these phases.
Investigating CPS is a challenge due to the difficulty that researchers face when attempting to observe the consecutively complex interactions between input and output phases. However, eye-tracking analyses provide a pragmatic way of reducing this difficulty given this methods’ high timing and spatial resolutions. In general, there is a lack of research investigating participants’ online processes while performing CPS with a handwriting device. Moreover, there is a lack of research examining what kinds of eye movement measures would be beneficial for observing the complete input-output problem-solving process. Thus, the present study utilized eye-tracking during the use of a handwriting device to investigate the online processes of CPS for graphic-based problems.
Geometrical problem solving
The use of geometry problems, which require cognitive transformations (Greeno & Estes, 1978), is pervasive in Mathematics education. A typical transformation problem consists of an initial description of the question, a goal, and several necessary mathematical concepts. During the problem-solving process, problem-solvers utilize these mathematical concepts to reduce the gaps between the initial state and the goal (
Simon & Newell, 1971). Geometry problems have descriptions that are always presented with diagrams, which index the visual-spatial information to reveal the given conditions and goals. The diagram aids in solving the problem in a more effective and efficient manner (
Larkin & Simon, 1987). Problem-solvers have to selectively extract information from the problem and diagram, identify the useful concepts from their prior knowledge available in their long-term memory, and simultaneously integrate new and old information. The problem can be solved when the gap between prior knowledge (old) and the goal (new) can be identified and the information can be integrated. Researchers have proposed that the following four stages are involved when solving mathematical problems: translation, integration, planning, and execution (
Mayer, 1985; Mayer, Larkin, & Kadane, 1984). These stages have been used to determine when problem-solvers perceive difficulty while solving arithmetical word problems (
Mayer, 1985). The results suggest that difficulty is experienced frequently during the integration and planning stages.
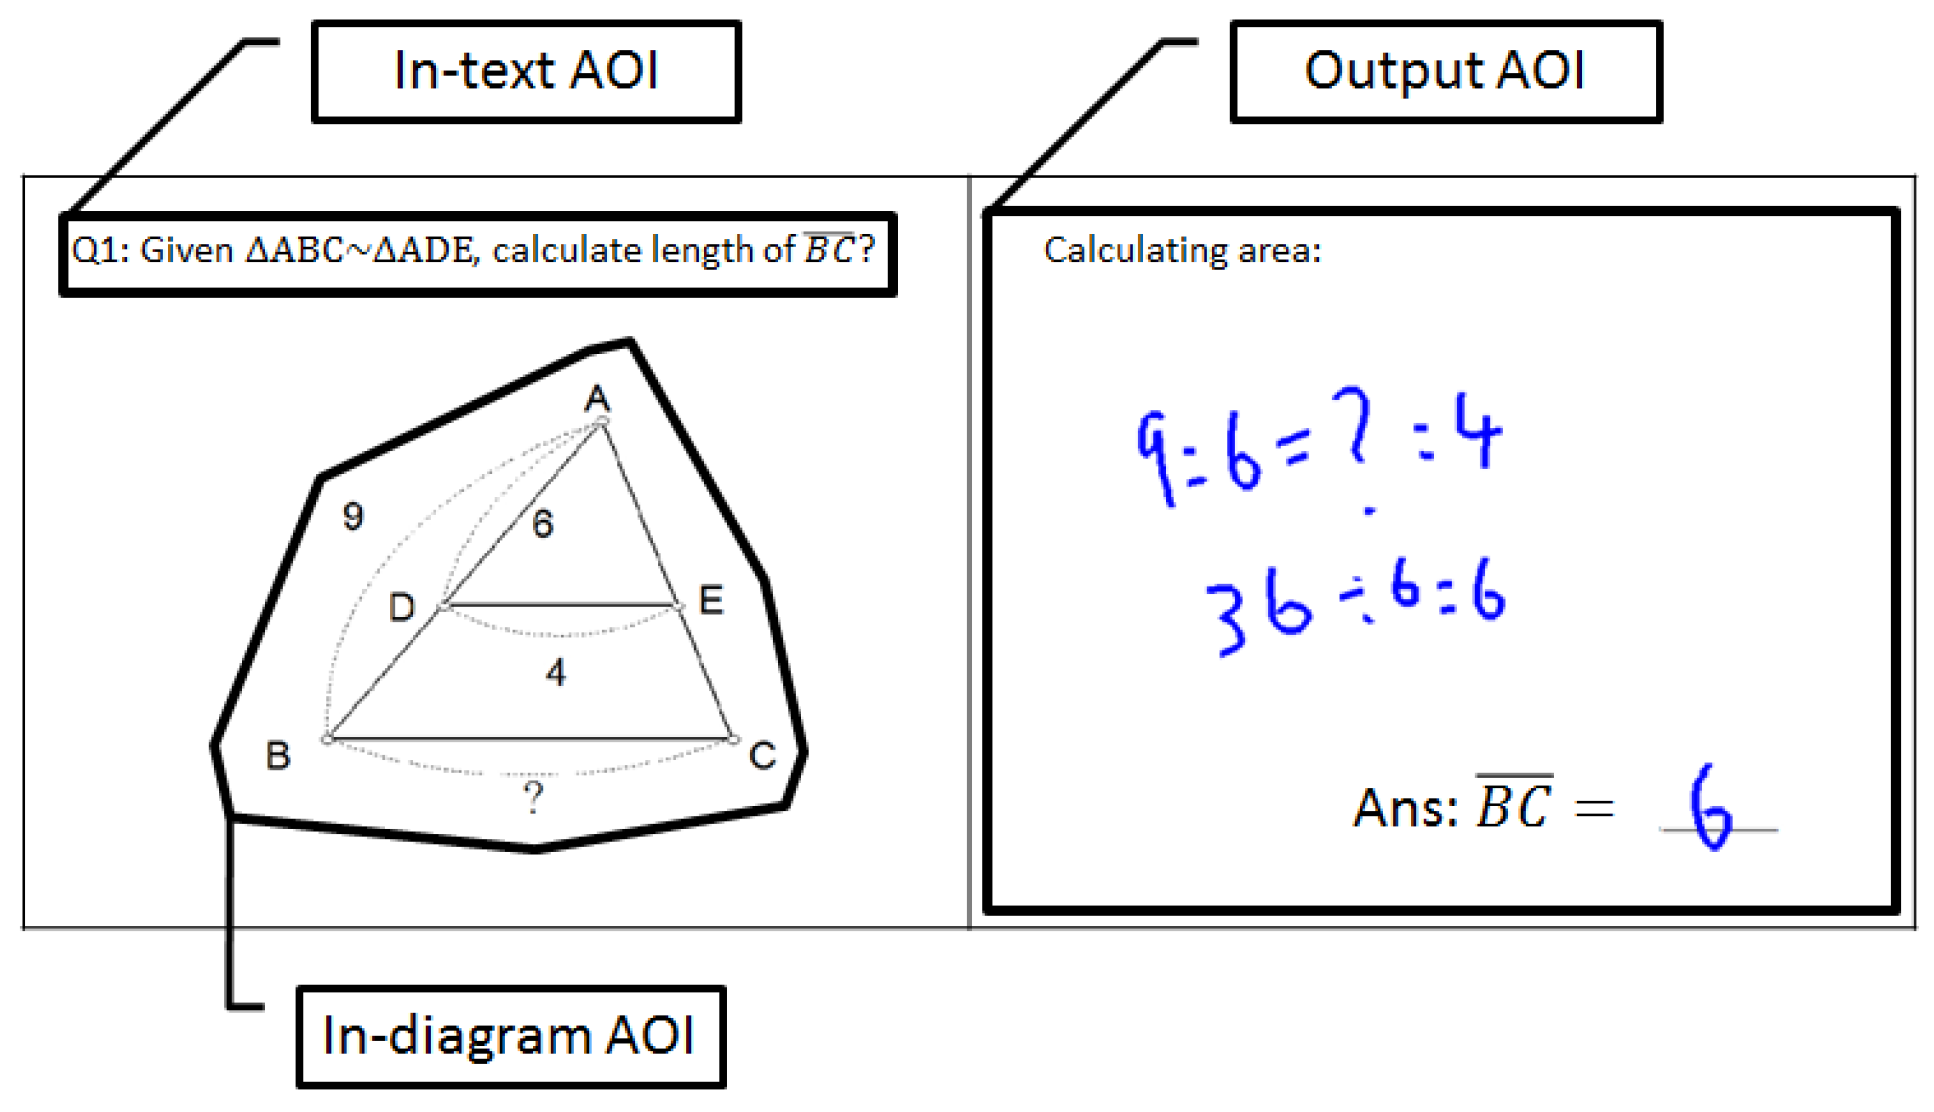
We designed problems based on the similarity properties because they are fundamental in geometry learning. For instance, the Common Core Georgia Performance Standards (CCGPS) state that students should use similarity criteria for triangles to solve problems, to prove relationships between geometric figures and to make geometric inference (Georgia Department of Education, USA, 2013) which is very typical in worldwide high school curriculum. In addition, these problems are highly analogous to the problems frequently presented in high school textbook; therefore, it would be reasonable to infer that these problems show high ecological validity. A typical similar-triangle problem consisted of a brief statement that preceded the problem section, and a diagram with paired similar triangles. Solvers can extract (input) crucial information from the two components. In a CPS context, an empty space is created for solvers to write (output) the solution. To solve the problems, participants need to apply the fundamental property of similar triangles, which states that two triangles are similar if their corresponding angles are equal and the corresponding sides have identical ratios (mathematically denoted as △ABC~△DEF). The ratio is defined as the similar ratio of the pair of triangles. The individual must identify possible similar triangles, recognize the corresponding congruent angles and find the corresponding sides that are of the same proportion. For example, in
Figure 1, a mental operation must be performed to find the similar second triangle by moving one of the triangles up (or down) when the individual reads one of the overlapped triangles. After finding the corresponding similar triangles, the problem solvers would recall that corresponding sides are in proportion, and then would derive the appropriate equations. For example, given the similar relationship between ∆ABC and ∆ADE, solvers have to find the corresponding sides by comparing two triangles and mathematically derive the formula (e.g., 9 : 6 =
: 4 for
Figure 1). Besides the basic property of similar triangles, each problem is distinct in that different mental operations are required to find similar-triangle pattern. For problem one, the spatial relation of the pairs of similar-triangles is in translation such that a simple mapping operation must be performed when the individual reads one of the triangles and then moves to the right (or left) to find the similar second triangle for the corresponding angles. For problem 2, two triangles are partially overlapped. Problem solvers have to identify two similar triangles by mentally separating the triangles. For problem 3, a flip-over mapping is required to determine two similar triangles. For problem 4, a vertical mapping is required to identify two similar triangles. For problem 5, mental rotations are necessary to compare the two triangles. Please refer to
Lin and Lin (
2013) for detailed descriptions and illustrators on the five problems. In sum, the major differences among the five problems are the configurations as well as the mental operations need to solve the problem.
During the problem-solving process, problem solvers have to simultaneously translate problems into mental representations, integrate information, and retrieve problem schemas to plan and execute. These processes tax the cognitive system (Scheiter, Gerjets, & Schuh, 2010;
Sweller, 1988). As the capacity of working memory is limited at a given time (
Miller, 1956), these cognitive processes place considerable demand on individuals’ cognitive system (
Paas, 1992). By measuring cognitive load, researchers may be able to detect the perceived difficulty of a problem.
Eye movement measures in problem-solving
Mayer (
2010) noted that eye-tracking methodology contributes to our understanding of how a particular instructional design influences learning. In addition,
Mayer (
2010) suggested that examining the total fixation durations spent in specific areas of the instructional material could be a promising indicator for testing hypotheses about online cognitive processes during problem-solving. Both dwell time and fixation count are pervasively adopted in the field of problem solving (
Carpenter & Just, 1978;
Grant & Spivey, 2003). The dwell time and fixation count measure the time of which the solver’s attention is devoted to the relevant areas of interest (AOIs). Longer dwell time or higher fixation count suggests that learners require more cognitive capacity for processing information on a specific area (
Carpenter & Just, 1978).
Hegarty et al. (
1992) used eye movement methodology to observe students’ fixation behaviors while solving arithmetic word problems. This study focused on problem comprehension and results were collected through verbal responses. The results revealed that low-accuracy students fixated longer on problem descriptions than high-accuracy students. Moreover, low-accuracy participants made more regressions to the problem statements. In subsequent research, the fixation behaviors of successful and unsuccessful problem-solvers were used to examine whether they utilized different problem-solving strategies (
Hegarty et al., 1995).
The run count can be viewed as a measure that represents the perceived difficulty with respect to a specific area. For example,
Hegarty et al. (
1992) have proposed that learners required more re-readings of previously fixated words for difficult problems. During complete problem solving, in addition to read the problem (text and diagrams), solvers have to write the solution. Therefore, it needs to investigate eye movement measures that would be beneficial for research regarding CPS processes.
The present study
The present study investigated eye movements during geometry problem-solving that involved simultaneously viewing (i.e., input) and writing (i.e., output) processes and the switching in between. We addressed three research questions in this study. First, we examined whether differences in eye movements were evident between successful and un-successful problem-solvers. For unsuccessful solvers, the perceived difficulty was expected to be higher than successful solvers. Unsuccessful solvers were expected to watch longer, have higher fixation counts, and run counts on the text and diagram area. When solvers could not find a pair of similar triangles, they might be unable to shift their attention to the output area or they might frequently switch their attention between the diagram and the output area. Therefore, unsuccessful solvers were likely to have longer dwell time, higher fixation counts, and lower run counts on the output area. Second, we investigated the relationship between perceived difficulty and eye movement behaviors. We expected eye movement might reflect the perceived difficulty with respect to each area. Third, we examined whether eye movements across various AOIs would differ significantly when solving problems. We are generally interested in determining the kinds of eye movement measures that are sensitive to the perceived difficulty of geometry problems. Because different mental operations could lead to different levels of difficulties, we expected solvers watch longer and have higher fixation counts on the text and diagram area of the problems that they feel difficult. With regards to the run counts, when a mental operation is complex (e.g., mental rotation), solvers might re-fixate more frequently on the diagram than a mental operation is simple (e.g., a translation). Therefore, we expected problem solvers might have higher run counts on the diagram that were especially difficult. When solvers cannot find a pair of similar triangles, they might be unable to shift their attention to the output area or they might frequently switch their attention between the diagram and the output area. We expected that they showed longer dwell time, higher fixation counts, and lower run counts on the output area.
Method
Experimental design for the current study included one within-subjects factor (i.e., mental manipulations) that had five levels. Five geometry problems were designed to provide differing levels of mental manipulation.
Participants
Sixty-three participants (23 male and 40 female) from a senior high school in northern Taiwan participated in the current study. All participants were between the ages of 17 and 19 years. We obtained permission from participants and administrators at the school. All participants volunteered for this study and each participant received US$2 for their participation.
Materials
The materials consisted of seven slides, which were numbered from 1 to 7. Given that participants were unfamiliar with using a tablet device to solve mathematical problems, slide 1 presented brief instructions regarding how to use the handwriting pen on the left side of the screen and participants could practice on the right side of the screen. Slide 2 presented introductory information regarding the subsequent tasks, including the number of problems and time limit.
Slides 3 to 7 presented five problems that required an understanding of “the properties of similar triangles” to solve for the length of a specific side of two similar triangles. Each slide presented a pair of similar triangles that are frequently shown in chapters introducing basic concepts of geometry from high school mathematical textbooks. Each problem consisted of a brief statement and a diagram with paired similar triangles. Participants were required to solve for some unknown sides on the right side of the screen (Calculating area). The five problems required different features of mental manipulations to solve, as follows: Problem one required horizontal translation, problem two required vertical translation of an overlapped triangle, problem three required reflection, problem four required reflection (i.e., flip-over/rotation), and problem five required rotation and identification of a spatially hidden condition. To minimize the effect of confounding factors, the layout, relative distance, font size, and area was made approximately identical for each diagram. In addition, the numbers of elements, equations, and mental operations were also controlled with great effort. Thus, the influence of the problems on the participants should solely due to the differing types of mental operations that the problems invoke.
Solvers were asked to solve the problems by writing or drawing on a digital drawing tablet that was connected to a computer and eye-tracker. Participants first read a problem description with the appropriate diagram on the left-hand side of the screen (see
Figure 1). Then they had to generate one equation to find the length of the unknown side. Participants’ drawing traces were simultaneously projected to “the calculating area” on the right-hand side of the screen. The following three areas of interest (AOIs) were analyzed in the present this study: In-text AOI, In-diagram AOI, and Output AOI. For participants, the In-text and In-diagram AOIs functioned as input resources for the problems, whereas the Output AOI reflected participants’ writing traces while they engaged in calculating processes.
Design
The experiment used a within-subject design. The within-subject factor was the difficulty with five levels. The problems were designed to demonstrate various levels of difficulties. The single item used to measure perceived cognitive load is designed by
Paas (
1992). The item is a nine-point Likert scale that ranges from 1 (low) to 9 (high). Furthermore, responses to an open-ended question asking for the source of difficulty in solving problems were collected. The authors were interested in determining whether the eye movements at each predefined AOIs (In-text AOI, In-diagram AOI, and Output AOI) would be sensitive to the designated levels of difficulties.
Apparatus
An EyeLink 1000 desktop remote eye-tracker system (SR Research Ltd., Canada) with a sampling rate of 500Hz and an accuracy of 0.5 degrees recorded participants’ eye movements. The use of target stickers allowed participants to move their heads in more natural ways. The experimental materials were presented on a 22in monitor (resolution: 1024 X 768; refreshing rate: 85Hz) that was connected to a computer with an Intel dual core running at 3.0GHz with a Windows XP service pack 2 environment. Participants were seated in front of the monitor at a distance of 60 cm. Before conducting the experiment, each participant was calibrated to validate the gaze durations in the predefined areas. If the calibration was poor or the participant was unable to complete the calibration process, the procedure was terminated. All eye movement data were preliminarily analyzed using Data Viewer (SR Research Ltd., Mississauga, Ontario, Canada).
It might be a potential problem that participants tended to look down at their hands when a handwriting tablet was adopted. Therefore, a Wacom Bamboo Pen and Touch tablet device (Model: CTH661) with an active area of 9 x 5 inches were used to record participants’ handwriting (Wacom Corporation, Saitama Japan). The tablet supported both right- and left-handed participants. When the participants wrote the solutions with the digital pen, the trace was simultaneously shown on the screen but not on the tablet. We observed that participants steadily watched the handwriting trace on the screen instead of watching the tablets when they performed the task. In addition, we decreased the luminance of the experimental environment so as to reduce the possibility of participants directing their vision to the tablets.
Participants could press the button on the pen to erase their writings on the screen. We used Experiment Builder version 1.10.206 (SR Research Ltd., Canada) and a customized class written in Python was used to implement the writing and erasing in this experiment procedure. This procedure could integrate eye-tracking and handwriting devices. The procedure collected participants’ eye movement data while they used a tablet device to solve problems. In addition, a screenshot of each solved problem was saved for subsequent analyses.
Procedure
To observe the CPS processes naturally and uphold the need for ecological validity, the experiment was conducted in a senior high school instead of in a traditional laboratory. Participants performing the tasks individually with controlled light. First, an instructor told students that the purpose of the task was to solve geometry problems that were related to similar triangles. The instructor also provided information regarding the schedule and room for the task. Cues were not provided during the test phase, and references were not permitted. Participants were aware that communication was not allowed and that they should follow instructions. They were instructed to write the equations while solving the problems as clearly as possible. Participants were seated in front of a computer equipped with a remote desktop eye-tracker. Participants’ positions were adjusted to ensure that the distance between them and the monitor was approximately 60 cm. The eye-tracker was calibrated for each participant to insure the validity of the eye movement data prior to the main experiment. After successful calibration, participants engaged in solving the problems using the tablet device and the eye-tracker simultaneously recorded their eye movements. A slide was presented on the screen illustrating how to use the handwriting device, and participants could practice how to write and erase trace on the right side screen. Slide three to seven represented five similar triangle problems. Three minutes were given to each participant for the instruction of the use of handwriting device, introduction of the similarity property and each math problem solving (five problems in total) respectively. When time is up, the next problem automatically showed on the screen. Following the problem-solving task, participants required to complete the questionnaire which measured perceived difficulty (QPD). Time for completing the QPD was not limited. Most participants completed the QPD in ten minutes.
Measure
The primary purpose of the present study was to determine whether any specific eye movement measures were associated with the different types of mental operations. Specifically, this study investigated whether eye movement measures would vary with geometry problems that had different features. A second research question examined whether differences in eye movement measures were evident between successful and unsuccessful problem-solvers when they were solving the different types of problems. Based on previous research (
Boucheix & Lowe, 2010; Jarodzka, Scheiter, Gerjets, & van Gog, 2010; Ozcelik, Arslan-Ari, & Cagiltay, 2010;
Rayner, 1998;
Schmidt-Weigand & Scheiter, 2011), three kinds of eye-tracking measures were tested, which were first, last, and total fixation-related measures. Eye movement measures of the first-type consist of the first fixation visited ia count (FFVIC), first fixation duration (FFD), first run dwell time (FRDT), and first run fixation count (FRFC). The last-type consist of the last fixation duration (LFD), last run dwell time (LRDT), and last run fixation count (LRFC). The total-type consist of dwell time (DT), fixation count (FC), and run count (RC). FFVIC is defined as the number of different AOIs visited prior to the first fixation to the current AOI. Dwell time is defined as the sum of the durations across all fixations within the current AOI. Fixation count is defined as the number of fixations within an AOI. Run count is defined as the number of times an AOI was entered and departed. Examining chronological differences between these three types of measures may aid in identifying the time effects for the same measures. For example, it would be interesting to examine whether there were differing fixation counts between two problems, as we could then investigate the time period in which the fixation counts differed. The ten eye movement measures were examined within the three different AOIs across the five problems. Fixations that longer than 200 ms were included in the data analysis. The ten eye movement measures were calculated based on this criterion. For example, run count is defined as the number of times an AOI was fixated longer than 200 ms and then departed.
All participants provided their genders and their Chinese and Mathematic scores for the college entrance examination. The QPD, which consisted of five self-report cognitive load questions, measured the level of perceived difficulty. Responses were provided using a nine point Likert scale. Participants reported their perceived difficulty while solving each problem. Higher scores indicated that participants felt that a problem was more difficult.
Results
Because six participants failed in the calibration process, the sample size that used to analysis was fifty-seven. Given the exploratory nature of the present research, it is necessary to examine the validity of our stimuli and the QPD survey. First, the difficulty levels for the five problems were validated using chi-square tests of independence. Second, we examined whether participants’ perceived cognitive loads differed during problem-solving. Third, our three research questions were investigated using corresponding statistical analyses.
Repeated measures data can be analyzed using the univariate techniques for split plot designs (
Milliken & Johnson, 1989) under specific assumptions on the covariance structures of within subject data. In the present study, differences among three AOIs (In-text AOI, In-diagram AOI, and Output AOI) on eye movement measures were analyzed using the traditional repeated measure ANOVA, which assumes sphericity for the variance covariance matrix (
Khattree & Naik, 1999). In other words, the structure of error variance is compound symmetry. However, the areas of AOIs are different in terms of density of geometry knowledge which are expected to lead to heterogeneity of responses. (e.g., dwell time). Also, the correlations between two of the AOIs are unlikely to be identical. As a result, to perform necessary statistical corrections, sophisticated statistical analysis would be necessary. For example, a linear mixed model can choose a proper covariance structure to estimate the adequate model that best fits to the data (Littel, Milliken, Stroup, Wolfinger, & Schabenberger, 2006). However, a sophisticated analysis would be complicated. Given the exploratory nature of the study, a traditional repeated measure ANOVA is adopted in this research.
The pass rate, which was used as a measurement of objective difficulty, was defined as the proportion of participants who correctly solved the problems. A chisquare test of independence indicated there was an association between the pass rates and problems, χ2 (4, N = 285) = 56.606, p < .001, suggesting that the problems varied in objective difficulty. A one-way repeated measures analysis of variance was conducted to examine whether different problems resulted in varying levels of perceived difficulty. In fact, the perceived difficulty differed across problems, F(4, 53)= 29.498, p< .001, η2= .690. Multiple comparisons revealed that the perceived difficulty for problem one was lower than for the other four problems and the perceived difficulty of problem five was higher than the other four problems. The perceived difficulty for problems two, three, and four did not differ significantly.
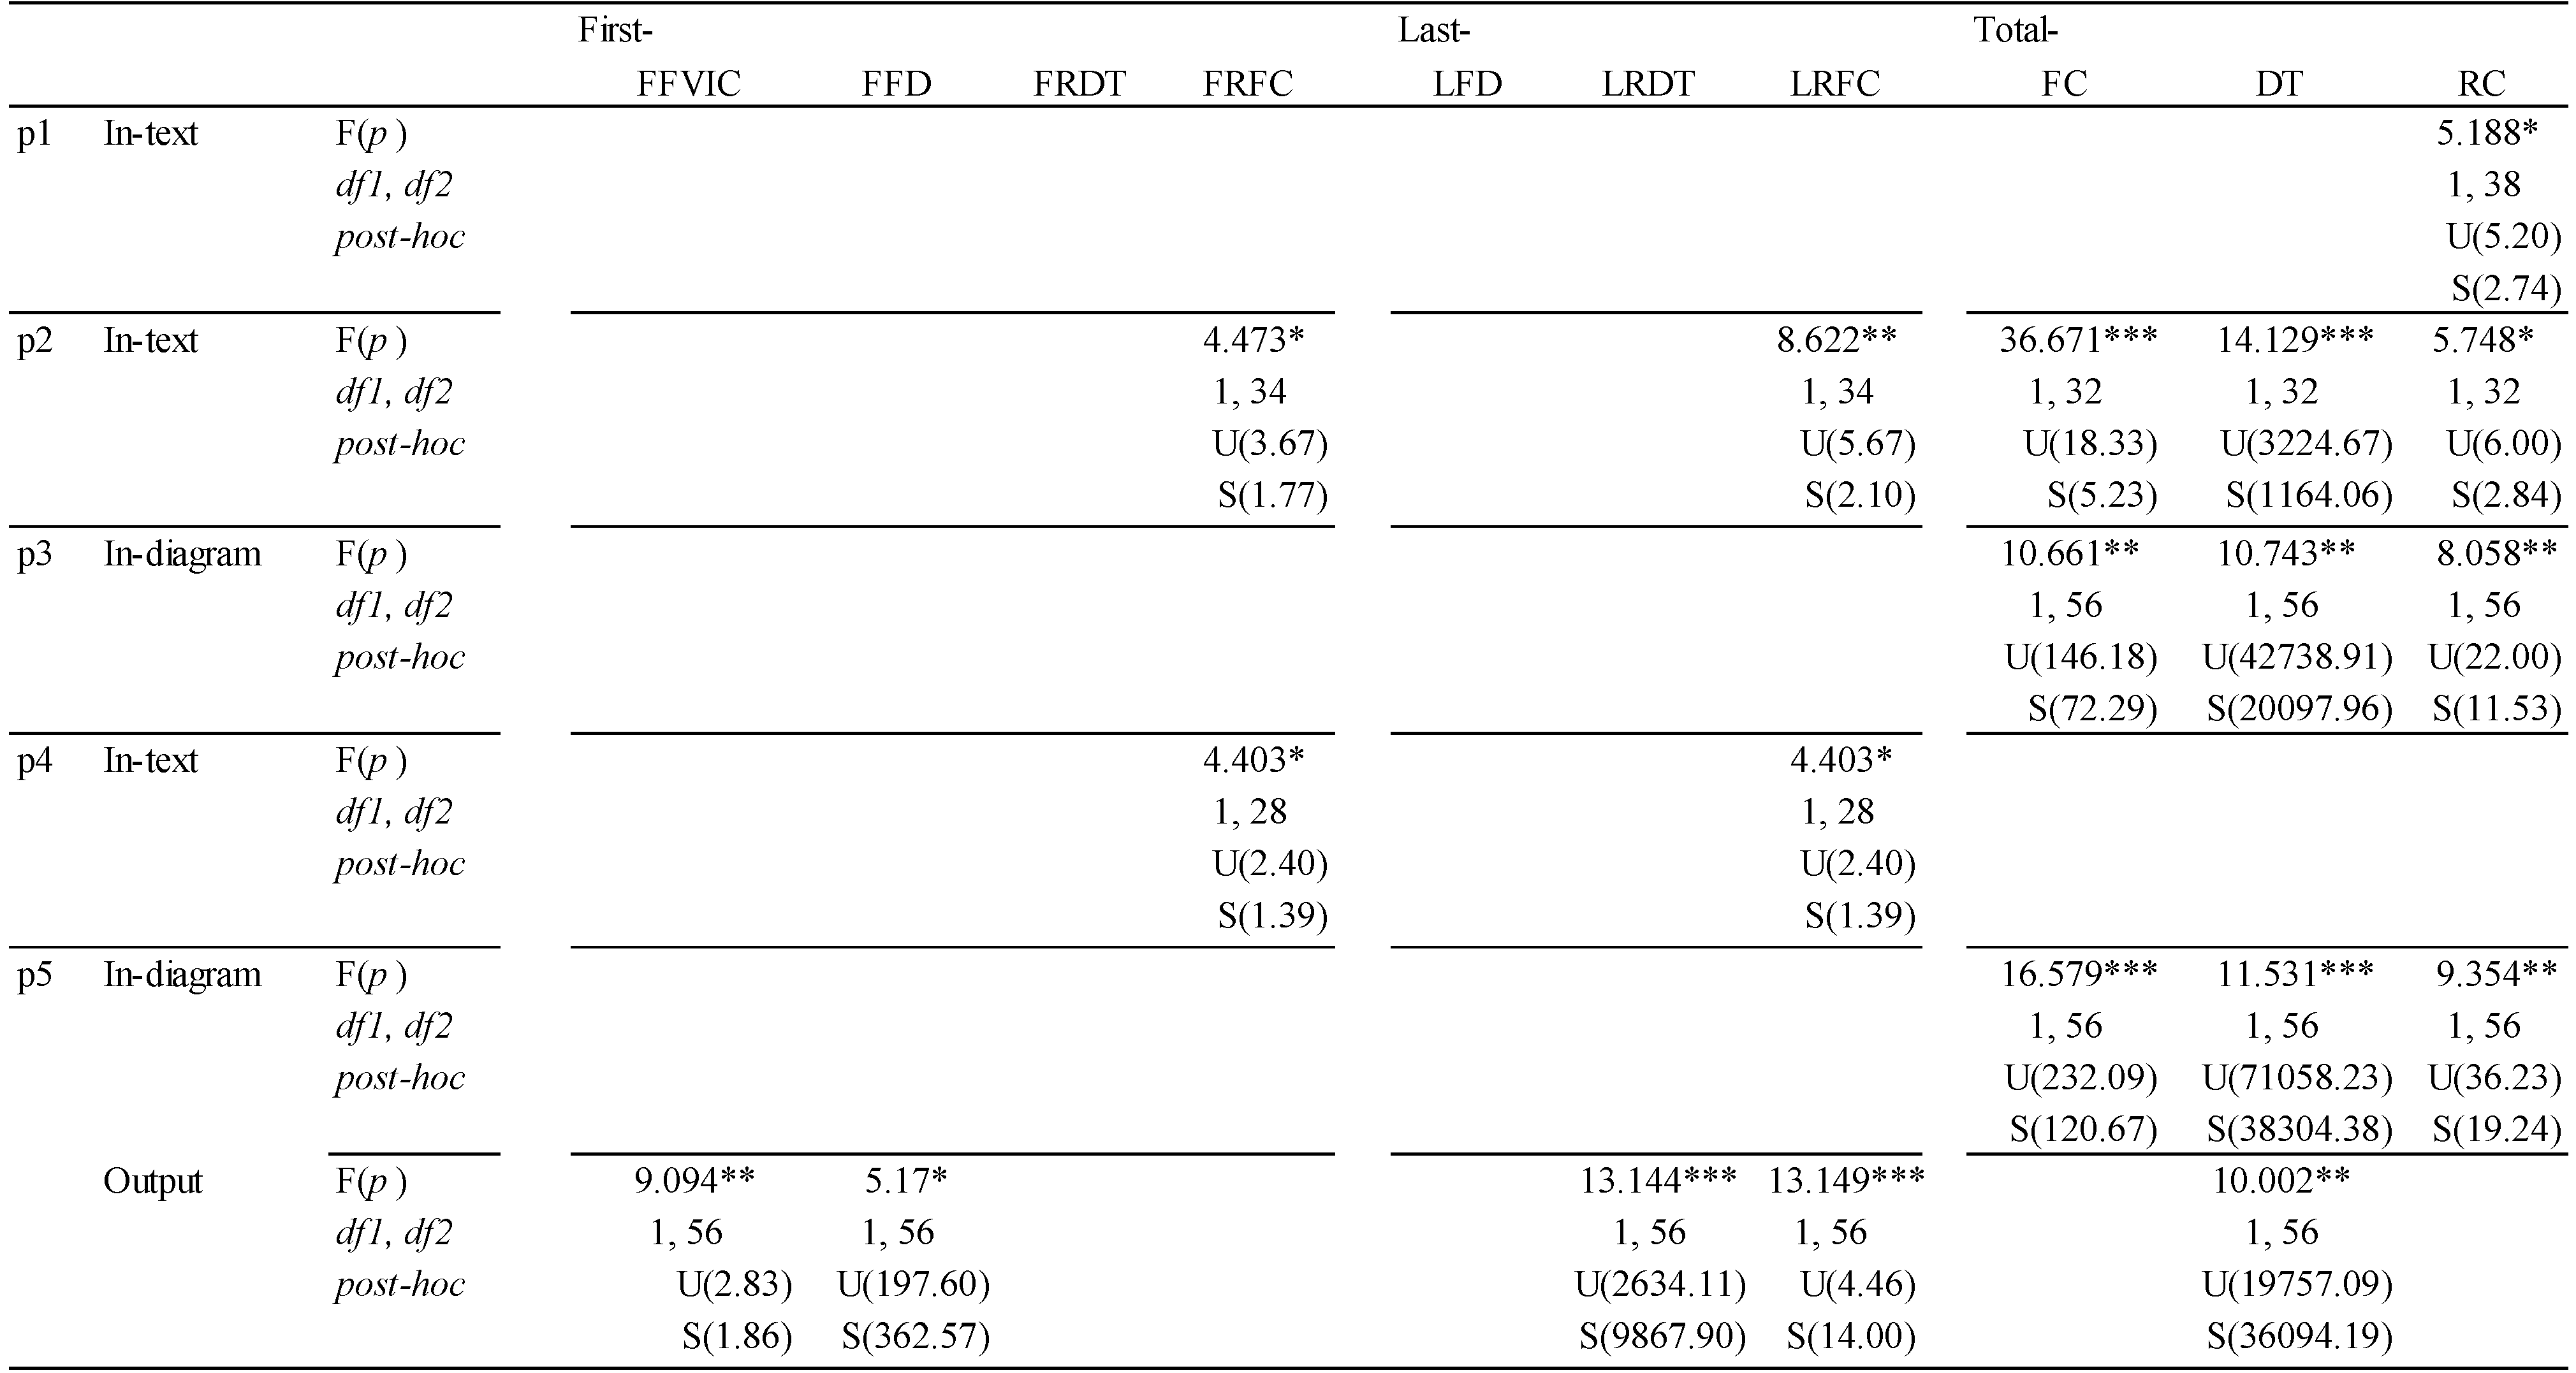
A series of analyses of variance (ANOVAs) were conducted to examine whether the ten eye movement measures for the three AOIs (In-text, In-diagram, and Output) differed between successful and unsuccessful problem-solvers across the five problems. If the variance was homogeneous, the Scheffe test was used for post-hoc mean comparisons; if not, the Game-Howell test was used. The Type I error rate was set to .05 for the present research. For efficiency, the
F values, degrees of freedom, significance levels, and post-hoc comparisons are presented in
Table 1. No consistent patterns were evident between the successful and unsuccessful solvers across the five problems. However, results suggested that unsuccessful solvers attended more (e.g., fixation and run counts) to the In-text AOI and had greater FC, RC, and longer DT within the In-diagram AOI while solving problems three and five than successful solvers. Moreover, for problem five, successful solvers had longer FFD, LRDT, and LRFC, and greater DT within the output area. Thus, successful solvers were more likely to focus their attention within the calculating area than unsuccessful solvers. There were no significant differences between successful and unsuccessful solvers with regard to the Output AOI across problems that had high pass rates (problems one to four). In contrast, significant differences were evident for multiple measures within the Output area when participants solved problem five.
To investigate whether eye movements were sensitive to perceived difficulty, a series of Spearman’s rank correlation tests were performed to examine the linear relationships between the ten eye movement measures within the three AOIs (In-text, In-diagram, and Output) and participants’ perceived difficulty. The results indicated that the total-type measures, including FC, DT, and RT, in the In-diagram area for problem one were positively correlated to solvers’ perceived difficulties (FC: rho(57)= .374, p< .01; DT: rho(57)= .372, p< .01; rho(57)= .421, p< .01). When participants felt difficulty solving problem one, which required translation, they spent more time fixating to the diagram and frequently in-and-out the diagram area. For problem two, LFD in the In-text area was negatively correlated with solvers’ perceived difficulty, LFD: rho(35)= -.434, p< .05. The results indicated that when participants felt difficult solving problem two, in which the two triangles were overlapped, they had spent less time fixating within the text area. For problem five, total-type measures, including FC, DT, and RT. within the In-diagram area were positively correlated to solvers’ perceived difficulty (FC: rho(57)= .421, p< .01; DT: rho(57)= .483, p< .001; rho(57)= .301, p< .05). When participants felt difficulty solving problem five, which required rotating the triangles, they spent more time fixating to the diagram and frequently reread the diagram. In contrast, FC and DT in the output area were negatively correlated with solvers’ perceived difficulty, (FC: rho(57)= -.0.285, p< .05; rho(57)= -.291, p< .05). The results indicated that when participants felt difficulty solving problem five, they spent less time fixating within the calculating area.
Table 2 presents ten eye movement measures for the five problems. Different measures demonstrated distinct patterns across the five problems. Because only minimum information was provided, we found participants seldom watched the In-text AOI. For the In-text AOI, the FC decreased slightly from problem one (4.38) to problem four (2.02) yet increased significantly to problem five (6.88). The DT decreased slightly from problem one (1296.62) to problem four (439.16) yet increased significantly to problem five (1705.93). The RC decreased slightly from problem one (112.44) to problem four (8.16) yet increased significantly to problem five (15.38). For the In-diagram AOI, no clear tendency was observed. The FC for problem one (59.09) was the lowest, while the FC for problem five (190.30) was the highest. The DT for problem four (14493.16) was the lowest, while the DT for problem five (58775.54) was the highest. The RC for problem four (11.16) was the lowest, while the RC for problem five (29.86) was the highest. For the Output AOI, the FC decreased slightly from problem one (64.05) to problem four (39.14) yet increased significantly to problem five (53.54). The DT decreased slightly from problem one (33569.89) to problem four (20178.39) yet increased significantly to problem five (25883.50). The RC decreased slightly from problem one (12.44) to problem four (8.16) yet increased significantly to problem five (15.38). In general, participants spent more time on each AOI of the problem five than the other problems. For conciseness, please refer to
Table 2.
A series of one-way repeated measures ANOVAs were conducted to examine whether eye movement measures, including the first-, last-, and total-types, differed across the five problems. Specifically, this study aimed to determine the types of eye movement measures that reflect the change in problems for each AOI. Regarding the first-type of eye movement measures, the FFVIC within the In-diagram AOI differed significantly across the five problems, F(4, 212)= 3.51, p< 0.01, η2= .062. The FRDT within the In-diagram AOI also differed significantly across the five problems, F(4, 212)= 3.66, p< 0.01, η2= .064. The FFD within the three AOIs did not differ significantly. The FRFC within the In-diagram AOI differed significantly across the five problems, F(4, 212)= 3.68, p= 0.01, η2= .064. With regard to the last-type measures, the LFD within the Output AOI differed significantly across the five problems, F(4, 208)= 2.81, p< .05, η2= .051. The LRDT and LRFC within the three AOIs did not differ significantly across the five problems, ps> .05. With regard to the total-type measures, the FC within the three AOIs differed significantly across the five problems, In-text: F(4, 216)= 5.76, p< .001, η2= .096; In-diagram: F(4, 216)= 41.65, p< .001, η2= .435; Output: F(4, 216)= 4.38, p< .01, η2= .075. The DT within the three AOIs differed significantly across the five problems, In-text: F(4, 216)= 6.26, p< .001, η2= .104; In-diagram: F(4, 216)= 42.85, p< .001, η2= .442; Output: F(4, 216)= 4.69, p< .01, η2= .080. The RC within the three AOIs differed significantly across the five problems, In-text: F(4, 216)= 7.77, p< .001, η2= .126; In-diagram: F(4, 216)= 23.15, p< 0.001, η2= .300; Output: F(4, 216)= 6.72, p< .001, η2= .111. These results suggest that some eye movement measures, including DT, FC, and RC, significantly differed within the three AOIs as different problems were solved, whereas others for including FFVIC, FRDT, FRFC, LFD, and LRFC, only significantly differed within specific AOIs. Moreover, some eye movement measures, such as FFD and LRDT, were not sensitive to changes across the three AOIs.
Discussion
The present study utilized eye-tracking methods to investigate issues regarding CPS processes during solving geometry problems which were designed and proved to be in various difficulty levels. The results revealed that eye movement measures did not typically differ across the three AOIs for the successful and unsuccessful solvers while they were solving problems one through four. One possibility is that these four problems were not difficult for the solvers (pass rates ranged from .79 to .89). Therefore, the processes being utilized did not differ, resulting in similar patterns of eye movement behaviors. Specifically, these four problems relied on easier mental manipulations of the triangles (e.g., mental translation); therefore, the eye movements were not obviously different across the three AOIs. However, when participants solved problem five, which required mentally rotating of the triangle, unsuccessful solvers either had difficulty in extracting the crucial information from the diagram or mentally rotating one of the triangles, which resulted in an increased focus on and more frequently referencing of the diagram (as evident by a greater number of run counts). The finding is in accordance with the findings which suggested that longer dwell time or more fixation count were compatible with cognitive processes during mental rotation (
Carpenter & Just, 1978;
Just & Carpenter, 1976). In addition to mental rotation, the results indicated fixation-based measures might be relevant to cognitive processes during mental translation (problem three). The results of the study conducted by Hegarty, Mayer, and Green (1992) pointed out that participants required frequently fixated words for difficult problems. We found unsuccessful problem solvers tended to frequently watch the In-text AOI while solving problem one and two. In contrast, successful solvers spent more time writing equations to determine plausible answers, which resulted in an increase in eye movements within the calculating area.
Yet, previous results are inconsistent with the present finding. When an insight problem was solved,
Grant and Spivey (
2003) found that successful problem-solvers spent more time looking at the crucial region of the diagram than unsuccessful problem-solvers. This inconsistency may be due to the characteristics of the problems presented in the task. When solving mathematical problems, the key concepts (or key mental operations) dominate the extent to which the problems can be solved. If key concepts can be easily determined, solvers may switch to the calculating area and start writing equations within the calculating area earlier, resulting in greater fixation durations within the Output AOI. By contrast, the key concepts needed to solve an insight problem are usually simple. However, there are many possibilities (solutions) to solve the problem. To determine the best answer, solvers may spend much time fixating at the crucial area(s).
We found reliable relationships between the perceived difficulty and total-type eye movement behavior within the In-diagram area when participants solved problem five (which required mental rotation). If solvers experienced difficulty while solving problem five, the attention directed to the output area decreased. This phenomenon might result from the problem-solving procedure: when the solvers experienced difficulty solving a problem, they sought crucial information, which was mainly located in the In-diagram area, causing considerable increases in fixations and referencing within the In-diagram area. If the key information for solving the problem was evident, then subsequent attention shifted to the calculating area. For higher cognitive load solvers, fixation frequencies and fixation durations within the calculating area decreased. However, this pattern could be observed primarily for problems one and five.
In addition, the results suggest that three eye movement measures, which are dwell time, fixation count, and run count, distinguish between successful and unsuccessful solvers when solving specific problems. These three measures are also significantly correlated with perceived difficulty with regard to specific AOIs and problems. Compared to other measures examined in this study, dwell time, fixation count, and run count are more sensitive to changes in problems within the In-text, Indiagram, and Output AOIs. First, the dwell time and fixation count measures showed similar patterns across the five problems. For the In-text and In-diagram AOIs, dwell times and fixation counts were greater for the problem that required mental rotation than for the other problems. For the Output AOI, dwell times and fixation counts were greater for problems one to four than for problem five. Although problems one to four required different mental manipulations on the triangles, evidence from the pass rates indicated their difficulty levels were low. Therefore, participants spent more time writing answers while solving easy problems, which lead to an increase in the amount of time spent within the calculating area compared to searching for useful information in the In-text and In-diagram areas. Second, the run counts presented a consistent pattern across the three interest areas. Run counts gradually decreased from problem one to four, but rapidly increased when participants solved problem five (mental rotation were needed), which could be due to the difficulty of the problem. Problems one through four were easier; therefore, participants spent less time referencing the three interest areas. Problem five was difficult compared to the previous problems; therefore, participants frequently referenced the three AOIs to extract necessary information needed to solve this problem. It caused an increase in the run counts for these AOIs. In sum, of all the eye movement measures examined in the present study, two eye movement measures, including dwell time and fixation count, are recommended for online observation of cognitive processes during CPS processes. With regard to the most efficient types of eye movement measures, the present study revealed that the total-type eye movement measures are more sensitive to changes in the problems being solved and are better able to distinguish between successful and unsuccessful problem-solvers than firstand last-type eye movement measures. Thus, the results of this study indicate that the use of eye-tracking paradigms aid in the examination of the time course for mathematical problem-solving.
Limitations and future research
Although the geometry problems were designed to measure different types of mental manipulations, it is possible that participants used other strategies to solve these problems. Future research should attempt to discourage participants from applying multiple mental manipulations when problem-solving.
In addition, knowledge of fundamental properties (e.g., the perceptual span) with regard to multimedia material provides a concrete basis for research examining CPS processes. Future research could examine issues regarding the establishment of eye movement parameters in CPS environments.
Given the exploratory nature of the study, a traditional repeated measure ANOVA is adopted in this research. Future research can use accurate analyses, such as generalized linear modeling or hierarchical linear models to analyze eye movement data.
