Abstract
Measures of scanpath similarity are essential in many domains of eye tracking research. Depending on the question, different calculations are adequate. We (Foerster, Carbone, Koesling, & Schneider, 2011) developed a method with a functional matching procedure suitable for sequential tasks. Here, we report two extensions. We introduced an alignment variant making the method more robust across tasks. We added the possibility to compare scanpaths according to multiple characteristics. The extended method, here called “functionally sequenced scanpath similarity method (FuncSim)” reveals whether gaze characteristics are similar in the same functional units of a task, opposed to when participants are engaged in different functional units. Finally, the advantages of our method are presented and compared to other methods of scanpath similarity calculation.
Introduction
A scanpath is the spatiotemporal sequence of fixations and saccades performed during one trial of eye movement measurements. The term scanpath was first introduced by Noton and Stark in 1971 (1971a, 1971b). In their study, eye movement sequences of participants were compared across encoding and recognition of simple line drawings. Scanpath analysis revealed high similarity across these conditions, leading to the conclusion that the idiosyncratic scanpath of a participant directly reveals his or her current cognitive processes. Although, such a strong connection between cognition and scanpaths is no longer believed, it is still argued that the scanpath reveals something about the underlying cognitive processes involved in eye movement control. Foulsham, Dewhurst, Nyström, Jarodzka, Johansson, Underwood, and Holmqvist (2012), for instance, argued recently that scanpaths are indeed similar between encoding and retrieval of spatial information, because eye movements are used as spatial retrieval cues for memory content. Scanpath similarities have also been found between visual perception and imagery (Laeng & Teodorescu, 2002) as well as between different levels of expertise in a sensorimotor task (Foerster et al., 2011). Scanpaths during a highly trained sequential sensorimotor task were even similar with and without visual input (Foerster, Carbone, Koesling, &
Schneider, 2012). Hence, in all these experimental conditions, scanpath similarity measures are essential for understanding how various factors shape eye movement control over space and time.
However, different methods can be used to determine scanpath similarity quantitatively. Some methods calculate with exact x- and y-coordinates, others with regions of interest. Some methods align fixations according to their numerical index, others according to their temporal position in the path. Each procedure has benefits and limits, so that it depends on the accomplished task and the research question which method to choose. Especially for research on sequential tasks, such as sensorimotor real-world tasks, none of the existing methods is suitable. The most prominent methods are the string edit methods (Brandt & Stark, 1997; Hacisalihzade, Stark, & Allen, 1992; Levenshtein, 1966, Noton & Stark, 1971a, 1971b). String edit methods compare fixations within scanpaths according to their spatial similarity along their numerical and more recently temporal position within the paths (Cristino, Mathôt, Theeuwes, & Gilchrist, 2010). The first step of these methods is to superimpose a grid onto the spatial dimension where the scanpaths have been executed, for instance onto the computer screen in a laboratory experiment. Each grid region is then labeled individually, usually by letters, numbers, or a combination of both. In the next step, each of the to-be-compared scanpaths is expressed as a string according to the sequence of region labels it passes through. A scanpath with a first fixation in B, a second in D, and a last fixation in G would become the string BDG. In order to evaluate the similarity between two paths, the string corresponding to one of the paths is transformed into the string corresponding to the other path by insertion, deletion, and substitution of individual labels. Transforming the string GNIRF into AIJRF would consist of one substitution of G by A, one deletion of N, and one insertion of J after I, adding up to three editing steps. The number of editing steps needed to transform the one string into the other is the dissimilarity value. This value is often normalized in a way that perfect similarity is expressed by 0, while “maximum” dissimilarity is expressed by 1 (for details see, e.g., Cristino et al., 2010). There are some variants of string editing. The editing steps can be differently weighted. The duration of fixations can be taken into account, for instance, by repeating the labels of longer fixations respectively to shorter fixations. The substitution by a label that is far away within the grid can be weighted higher than the substitution by a label that is near within the grid (e.g., Cristino et al., 2010). However, all string edit methods compare fixation locations according to their similarity along the scanpaths, meaning that fixations will be more likely aligned that have either similar numerical indices within the path or were executed after a similar interval from trial onset. This procedure is reasonable if the to-be-compared scanpaths are executed in response to a relatively stable visual input, such as in picture viewing.
In real-world sensorimotor tasks such as walking (Jovancevic-Misic & Hayhoe, 2009), sandwich making (Hayhoe, Shrivastava, Mruczek, & Pelz, 2003), or sports (Land & McLeod, 2000), however, trial completion times vary across trial repetitions and participants. In addition, stimuli viewing times are uncontrollable because participants actively change their environment while performing the task. Fixations performed during one and the same functional unit of the task - e.g., a specific sub-action - can have a different index in the two paths and might be executed at a different interval after trial onset. When performing a task for the first time, participants typically need longer and perform more fixations than when having acquired a reasonable degree of expertise (Epelboim, Steinman, Kowler, Edwards, Pizlo, Erkelens, & Collewijn, 1995; Foerster et al., 2011). Apart from these intraindividual differences during skill acquisition, there are inter-individual differences, in that some participants may execute more fixations and take longer to perform a specific task than other participants. Imagine a child and its parents tying a shoe. The child will take much longer than the adults even though working off exactly the same sub-actions to fulfill the task. When investigating such an everyday action, you might want to know whether they all fixate similar locations on the shoe or the lace while performing exactly the same sub-action. Do both look at the lace while setting the loop or does the child look at its own finger while the adult looks at the lace? The overall question is how similar scanpaths are during such sequential sensorimotor tasks, when eye movements are compared within the sub-actions along the task sequence.
In a study on learning the sensorimotor skill of speed stacking (Foerster et al., 2011), we wanted to know how eye movement patterns differ across low and high levels of expertise. Therefore, we used mobile eye tracking to investigate eye movements in speed stacking before and after a 14-days training session. In speed stacking, pyramids of plastic cups have to be stacked up and down as fast as possible in a fixed sequence. Participants became faster and performed fewer fixations while learning the task. However, we wanted to know whether they nevertheless looked at similar locations to guide their hand movements, i.e. whether scanpaths are similar across levels of expertise. As the scanpaths were much shorter after training, traditional scanpath similarity methods could not help answer the question whether participants looked at similar locations while performing the same sub-action of the task. Therefore, we developed a scanpath similarity method with a functional matching procedure. First, we divided the task into 44 units. The objectrelated actions (ORAs) of the task were used as units. According to Land and Hayhoe (2001) an ORA is an act that is performed on an object without interruption. In the case of speed stacking, an ORA was defined as stacking up or down a single cup or stack of cups to other cups or stacks. Second, the cup’s starting configuration of each of the 44 ORAs was drawn schematically with a common coordinate system (see real-world example at the end of the present paper and Figure 7). The locations of all fixations were plotted in the scheme with respect to the cup arrangement of the corresponding ORA. This was done manually based on the frame-by-frame video information of the mobile eye tracker’s recordings. Afterwards, standardized x- and y-coordinates as well as an ORA index could be assigned to each fixation. This means that first the location of each fixation was standardized according to the visual input during the task, and second that each fixation was labeled according to the task’s functional unit – here ORA – in which it occurred. After having labeled all fixations, the mean fixation location within each functional unit was calculated for all scanpaths, respectively. Then, Euclidean distances were calculated between to-be-compared scanpaths. Finally, distance values were evaluated by testing them against random baseline values of the same data set. The random baseline values were calculated by first scrambling fixation locations and then calculating the Euclidean distances between the scrambled path and the actually observed path. Therefore, the method compares whether fixation locations are more similar within the functional units of the to-be-compared paths than across the functional units of one and the same path. In other words, it is tested whether the variance across scanpaths is smaller than the variance within a scanpath.
The question the method answers so far is whether the location sequence is similar in two scanpaths. However, not only the sequence of fixation locations can be of interest when comparing scanpaths, but also other characteristics of eye movements within the paths, such as fixation durations, saccade lengths, or saccade directions (cf. Dewhurst, Nyström, Jarodzka, Foulsham, Johansson, & Holmqvist, 2012; Jarodzka, Holmqvist, & Nyström, 2010). In addition, averaging fixation locations within task components is a sub-optimal calculation step, if many different fixations belong to each functional unit of the task. Therefore, we extended our method to strengthen its applicability for scanpath comparisons in sequential tasks. Here, we report the extended version of our functionally sequenced scanpath similarity method (FuncSim). First, we will define the types of tasks whose scanpaths can be investigated with FuncSim. Then, the prerequisites and algorithms of FuncSim are described in detail. Afterwards, we will outline the advantages of the method compared to traditional methods. Finally, we compare FuncSim with recent scanpath similarity methods (ScanMatch by Cristino et al, 2010, and MultiMatch by Dewhurst et al., 2012; Jarodzka et al., 2010), first on the basis of artificial examples, and second with the help of a real-world example.
Sequential tasks as the domains of application
The functional sequenced scanpath similarity method has been proven to be useful in comparing scanpaths in the sensorimotor task of speed stacking across levels of expertise, across participants, and across lighting conditions (Foerster et al., 2011, 2012). The method is useful in all tasks that can be divided into distinct functional units, as is often the case with sensorimotor tasks. A characteristic of these sensorimotor tasks is that they consist of distinct sub-actions or sub-tasks that have to be accomplished. The sequence of these sub-units can be completely fixed, partly fixed, or completely variable. When playing a specific piece on the piano, for instance, the sequence of notes to be played is completely fixed. However, when making a peanut butter jelly sandwich (Hayhoe, Shrivastava, Mruczek, & Pelz, 2003), you can decide whether you want to spread the butter or the jelly first. Nevertheless, you cannot spread jelly or peanut butter on the bread before opening the respective jar. Sandwich making is an example of a task with a partly fixed sequence of sub-units. Note that sub-units of piano playing consist of the same type of actions (key boarding) to different objects of the same type (piano keys), while sandwich making consists of many different types of actions on different types of objects. Tasks that can be investigated with this method are not restricted to tasks on graspable objects in the world. Reading is an example. Here, sub-units are not actions on graspable objects, but actions (speaking) to sentences, words, or syllables on a paper or a computer screen. Do participants look at the same place on the text while uttering the same sub-unit of it? Moreover, there don’t have to be necessarily objects in the world. Reciting a speech or a poem by heart is an example. In this case, sub-units (spoken words) are performed to internally activated object representations. Sub-units don’t have to be motor responses - they can be internal cognitive “responses”. External signals can be used to determine the cognitive sub-task of the participant and the sub-units at the same time. Tone signals could, for instance, instruct participants which cognitive sub-task they shall perform, e.g., a first tone indicates to count numbers on a computer screen, a second tone indicates to sum the numbers, a third tone indicates to multiply them, etc. Finally, sub-units can be of varying complexity and execution time. The important prerequisite for using FuncSim is that fixations can be assigned to distinct units of the task.
FuncSim: The functionally sequenced scanpath similarity method
In previous publications (Foerster et al., 2011, 2012), we introduced the sub-action sequenced linear distance method that allows to determine scanpath similarity within functional units of a task. Here, we report the following two major extensions of our method. First, we introduced a second alignment variant making the method more robust across tasks. Second, we added the possibility to compare scanpaths according to multiple characteristics (cf., Dewhurst et al., 2012; Jarodzka et al., 2010) to expand the number of research questions that can be investigated with this method.
Before using FuncSim, it has to be ensured that fixation location data belong to a common coordinate system. This is already the case in static eye tracking with fixed body and head position. However, in mobile eye tracking without such a movement restriction, the location of each fixation has to be standardized, e.g., in world coordinates according to the visual input during the task (Figure 1). In stacking a pyramid of cups (Foerster et al., 2011, 2012), for example, fixation locations could be standardized according to the bottom cup that is not moved. In tying a shoe, fixation locations could be standardized according to the location of the shoe. In mobile eye-tracking, this is usually done by manual frame-by-frame coding. In this laborious procedure, fixations are extracted from the eye-tracking video in a frame-by-frame manner. It is manually coded whether the change in the eye-marker position on the video is small enough to be part of the same fixation or large enough to be part of a saccade to another position. Although this procedure is open to errors, it is still the state-of-the art in mobile eye-tracking research (Holmqvist, Nyström, Andersson, Dewhurst, Jarodzka, & Van de Weijer, 2011, pp. 175-176). However, with the fast progress in eye-tracking technologies, semiautomatized computer vision-based analysis procedures might be available in the future.
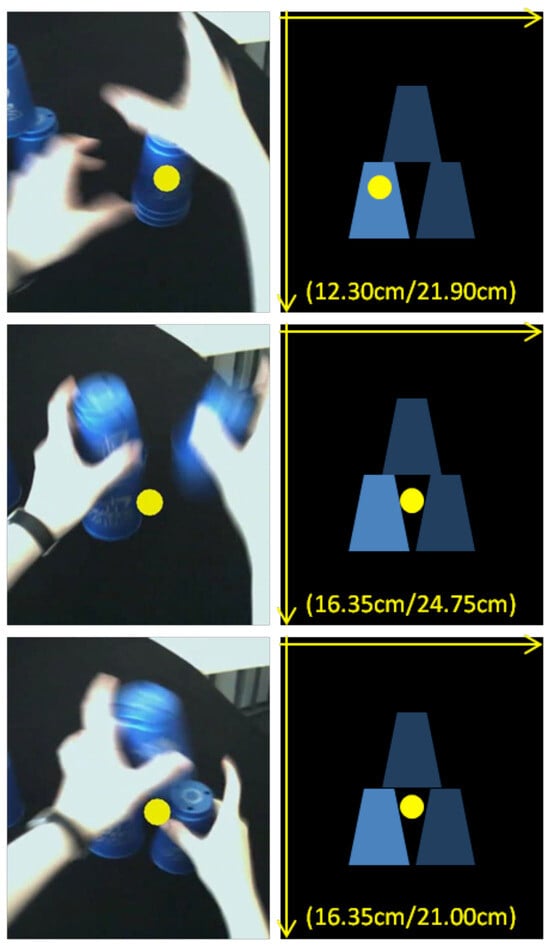
Figure 1.
Fixations of one of the authors (RMF) during the speed-stacking task indicated by yellow dots while stacking up a pyramid of three cups. On the left side: Video frames of the SMI HED mobile eye tracker with overlaid gaze positions. On the right side: Fixation locations standardized according to the location of the bottom cup, the only cup that isn’t moved when stacking a threecup pyramid. The up-stacked pyramid is always displayed. Standardized x- and y-coordinates in cm with the origin in the upper left corner are displayed in brackets. The task is sequenced into 3 functional action units. The upper pictures belong to the first functional action unit: Grasping the stack of three cups with both hands. The middle pictures belong to the second functional action unit: Stacking the top cup to the right with the right hand. The bottom pictures belong to the third functional action unit: Stacking the middle cup to the top with the left hand.
Moreover, each fixation has to be labeled according to the task’s functional unit in which it had been executed (Table 1 and Figure 2). If a fixation starts in one functional unit and ends in the next functional unit, we recommend doubling it and labeling it once with the former and once with the latter functional unit. This means that coordinates and fixation duration of this fixation appear twice as in the shaded lines of Table 1. If a fixation lasts for even more functional units, it can be added and labeled as often as functional units are traversed. After this labeling procedure, each functional unit contains all fixations that have been made from its onset to its offset. While this is our recommendation, the user can of course decide to assign fixations spanning several functional units solely to that unit, in which it starts or solely to that unit, in which it ends. Knowing that all fixations in a specific task are just-in-time, it might be plausible to assign fixations to those units in which they start. However, knowing that fixations in the investigated task are quite anticipatorily, it might be more useful to assign fixations to those units in which they end.

Table 1.
Assignment of fixations of two artificial scanpaths to functional units. The first three fixations of scanpath 1 were performed during the first functional unit. The fourth fixation began in unit 1 and ended in unit 2, therefore it appears in two lines (shaded), one time labeled 1 and one time labeled 2.
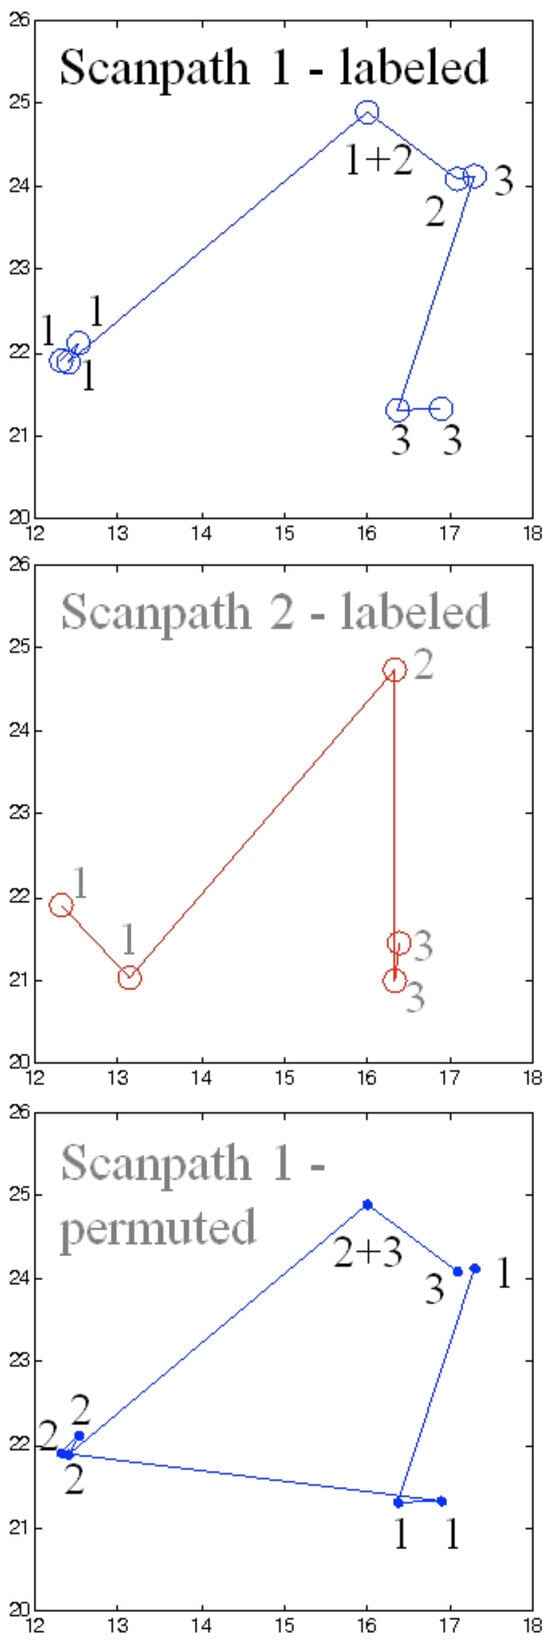
Figure 2.
Artificial scanpath from Table 1 (scanpath 1 in blue at the top and scanpath 2 in red in the middle) with fixations labeled according to the functional units to which they belong, as well as the randomly chosen permutation of scanpath 1(blue at the bottom). The forth fixation of scanpath 1 is labeled with 1 and 2 because it started during unit 1 and ended during unit 2.
In sensorimotor real-world tasks, the functional units are usually actions. In reading, functional units could be words, so that fixations would be labeled according to the word that was spoken at the same time. In externally sequenced tasks, the external signal could be used as functional unit, e.g., response cues. In a laboratory task, a response cue can be a stimulus on the computer screen, or a tone from the loudspeaker that announces the next sub-task, e.g., solve first mathematical problem in response to high tone, solve second problem in response to high tone. In other tasks, other functional units could be chosen of course.
After having labeled all fixations, data can be analyzed with FuncSim. The first step of the FuncSim algorithm is the calculation of length and direction values. As lengths and directions can only be calculated based on two successive fixations, the next fixation is always taken into account. This means that the last length and direction within each functional unit is calculated on the basis of the saccade that starts in the regarded unit and ends in the next functional unit. In addition, no length and no direction values are assigned to a path’s very last fixation. Length values are calculated in the same measure as the x- and y-coordinates (e.g., cm, pixel, degrees of visual angle). Direction values are calculated from -180 to +180 to the horizontal. Copied fixations contain the same characteristics in each functional unit. Length and direction calculations for the artificial scanpaths of Table 1 can be seen in Table 2.
In the second step of the FuncSim algorithm, a random version of scanpath 1 is created. Therefore, functional units and their fixations are scrambled with the premise that no functional unit remains at the old position within the sequence. Fixation sequences within functional units are kept constant (Figure 2). Thus, the calculated random scanpath is a permutation of scanpath 1’s functional unit sequence. The random scanpath will be used for the computation of random baseline difference scores in the last step of the FuncSim algorithm. Note that this random baseline is a conservative baseline as the permuted scanpath contains really fixated locations instead of also possible randomly chosen locations on the coordinate range.
In the third step, FuncSim aligns the two-becompared scanpaths in a meaningful way to each other. Two variants of FuncSim can be used to align the scanpaths. The former procedure “average” averages fixation locations, fixation durations, saccade length, and saccade directions within each functional unit, so that each functional unit contains only one value of each dimension (one line per functional unit, Table 3 and Figure 3). Especially with many different fixations within functional units, an alternative to averaging is useful. The new variant “reldur” (relative duration) takes the fixation durations into account, i.e., fixations within functional units are aligned according to their durations relative to the sum of all fixation durations within the functional unit (Table 3 and Figure 3 and Figure 4). In this way, multiple fixations within a specific functional unit across the to-becompared paths are aligned according to the contribution they have to the functional unit’s overall dwell time. As an example, in scanpath 2, the first fixation (350 ms) lasts for 7/11 of functional unit 1 (350 ms+200 ms), while the second fixation (200 ms) lasts for only 4/11. When scaling the smaller overall dwell time of scanpath 2 in functional unit 1 to the longer overall dwell time of scanpath 1, this ratio is maintained (Figure 4). The rationale behind this alignment procedure within functional units is that unit segments have constant relative durations on the whole unit. This means that when a unit is performed at a different speed, all unit segments are scaled in time. It has been shown that this is the case for the timing of action sequences (Lacquaniti, Terzuolo, & Viviani, 1984; Viviani & Terzuolo, 1980; Wing, 1978). Therefore, by aligning fixations within functional units of a task according to their relative duration, it is aimed to compare the same segments within units to each other. However, if there is reason to believe that the investigated functional units do not follow this relative timing, then the “average” alignment procedure might be more adequate even with more fixations per functional unit.
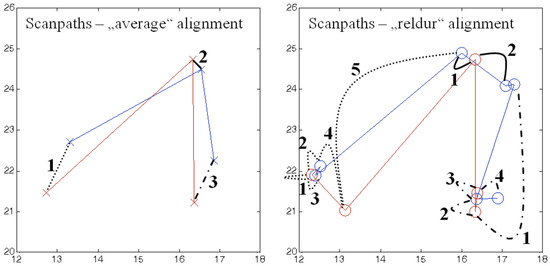
Figure 3.
Alignment of the artificial scanpaths from Table 1 and Figure 2. Scanpath 1 in blue and scanpath 2 in red. On the left side, fixation information (here location indicated by crosses) is averaged within each functional unit, so that averaged values can be compared per unit. On the right side, scanpaths are not simplified. Instead, fixations within functional units are aligned according to relative fixation durations within the functional unit (see also Figure 4). Curved black lines indicate which fixations are compared to each other within the functional units (1=dotted, 2=solid, 3=broken). Numbers are comparison indices per functional unit.
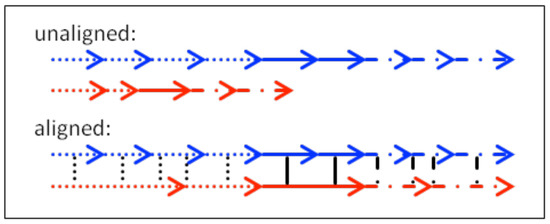
Figure 4.
Simplified illustration of the “reldur” alignment of the scanpaths from Table 1 and Figure 2. Fixations within functional units are aligned according to their relative fixation durations within the unit. Each arrow symbolizes a fixation. Blue arrows belong to scanpath 1 and red arrows belong to scanpath 2. Assignment to functional units is symbolized by line types (1=dotted, 2=solid, 3=broken). In the unaligned depiction, the length of an arrow symbolizes the duration of the fixation. In the aligned depiction, the length of an arrow symbolizes the scaling of a fixation according to its proportion on the overall dwell time of its functional unit. Black vertical lines indicate which fixations are assigned to each other for later similarity calculations.
In a forth step FuncSim calculates the difference values between assigned fixations within the functional units of the to-be-compared scanpaths. Location dissimilarity is calculated as Euclidean distances between assigned fixation locations. Location difference is calculated in the imported measure. This can for instance be pixel, cm, or degree of visual angle. Apart from this location difference score, we extended our method by the calculation of fixation duration differences, saccade length differences, as well as saccade direction differences. Fixation duration difference is the absolute difference between the durations of the assigned fixations. Evidently, the actually measured fixation durations are compared and not the relative fixation durations from the alignment procedure. Fixation duration difference is calculated in the imported measure, e.g., in milliseconds or seconds. Length difference is the absolute difference between the assigned fixation-to-fixation lengths and is calculated in the same measure as location difference. Direction difference is the absolute difference between the assigned fixation-to-fixation directions and is calculated in degrees. Lineseparated between-path differences (BPDs) in all dimensions for the artificial scanpaths of Table 1 and Figure 2 can be seen in Table 4. The average of all difference scores (location, duration, length, and direction) serve as final dissimilarity values of FuncSim (Means in Table 4). These values are not normalized further. This could be done of course. For instance, the mean Euclidean distance could be normalized based on the diagonal of the eye tracking video, or the task’s work space as “maximum” dissimilarity value. However, one and the same quantitative difference value does not always resemble the same qualitative dissimilarity. If participants’ task was to insert a thread into a needle, a smaller distance value should be regarded similar than if participants’ task was to throw a ball into a basket. Thus, the size of task objects is an important criterion for judging the magnitude of the calculated mean Euclidean distance. The same holds for the other difference scores. Instead of normalizing the difference scores according to any arbitrary value of the measurement, we conducted a similarity evaluation procedure based on the variance across the functional units of the task.
Therefore, in a final step, FuncSim calculates random baseline differences in all dimensions that can be used for statistical testing. Computation of a random baseline was inspired by the method reported in the study of ‘t Hart, Vockeroth, Schumann, Bartl, Schneider, König, and Einhäuser (2009). Random baseline differences are calculated in each dimension by comparing scanpath 1 with its randomly chosen unit sequence permutation (see step 2). Alignment of scanpath 1 and its permutation is performed according to the chosen procedure (”average“ or ”reldur“, see step 3). Difference scores are calculated as described in the last paragraph. Line-separated random baseline differences (RBDs) in all dimensions for the artificial scanpaths of Table 1, Table 2 and Table 3 can be seen in Table 4. Note that a different number of lines arises with ”reldur“ alignment for RBDs than for BPDs as different scanpaths are compared (scanpath 1 to its permutation instead of to scanpath 2). The averages of all difference scores within a dimension serve as final dissimilarity values of FuncSim’s random baseline (Means in Table 4). Again, these values are not normalized further.
A t-test can be performed to evaluate whether the calculated between-paths difference (BPD) scores across to-be-compared scanpaths are significantly smaller than the random baseline difference (RBD) scores calculated within the same scanpath. Therefore, with the help of FuncSim it can be compared whether gaze characteristics (fixation location, fixation duration, fixation-to-fixation length, and fixation-to-fixation direction) are more similar within functional units across to-be-compared scanpaths than across functional units within one and the same scanpath. In this way, FuncSim is an adequate method to judge whether scanpaths are similar if participants are engaged in the same functional unit of a task. Here is a summary of the preparation steps needed to use FuncSim as well as FuncSim’s algorithm steps:
- Preparation:
- A.
- Standardizing x- and y-coordinates.
- B.
- Labeling fixations according to functional units.
- FuncSim algorithm:
- Calculating length and direction values.
- Creating baseline path by random unit permutation.
- Aligning scanpaths according to functional units &
- “average” - Averaging within functional units.
- “reldur” - Aligning according to relative fixation durations within functional units.
- Calculating between-path differences (BPDs).
- Calculating random baseline differences (RBDs).
- Post-testing:
- Testing statistically whether BPDs are significantly smaller than RBDs
In the next section, the advantages of FuncSim compared to other scanpath similarity methods will be presented. In the sections thereafter, these advantages will be supported by mathematical examples.
Advantages of FuncSim
Benefits of comparison dimensions
An advantage compared to traditional scanpath similarity methods (e.g., Mannan distances or string-edit methods) was added to FuncSim with the extension of difference score calculations on multiple dimensions (cf. Dewhurst et al., 2012; Jarodzka et al., 2010). Now, it is not only possible to compare the similarity in fixation locations along the sequence of eye movements, but also to compare the similarity in terms of fixation durations, saccade lengths, and saccade directions along the paths. In this way, it is also recognized whether scanpaths differ in the location sequence just because they are scaled (same directions), or have spatial offsets (same directions and lengths), but are otherwise perfectly similar (see next section: “Comparing the methods”).
Benefits of exact location sequence
Just like the mean linear distance or Mannan distance method and its extensions (Foulsham & Underwood, 2008; Henderson, Brockmole, & Castelhano, 2007; Mannan, Ruddock, & Wooding, 1995; Mathôt, Cristino, Gilchrist, & Theeuwes, 2012), FuncSim computes precise Euclidean distances. However, unlike the Mannan distance, FuncSim performs a prior sequencing and alignment of fixations along the paths. No prior sequencing is performed for the calculation of Mannan distances. Mannan distances are the mean linear distances between nearest located fixations of to-be-compared scanpaths. As a result identically located fixations performed in reverse order lead to maximal scanpath similarity with the Mannan distance. The method in its simplest form is agnostic to the sequence (for an exception see Mathôt et al., 2012). This is not the case with FuncSim.
The minimum string-edit method (Brandt & Stark, 1997, Foulsham & Underwood, 2008; Levenshtein, 1966; Myers & Gray, 2010) calculates similarity along the sequence of fixations within the paths. However, location similarity is judged according to the sequence of areas of interest (AOI) that have been traversed by the to-be-compared scanpaths. Using AOIs instead of precise x- and y-coordinates has several disadvantages. The similarity index calculated as minimum number of editing steps (insertions, deletions, and substitutions) to transform one scanpath’s AOI string into the other is strongly affected by the size of the AOIs as well as by the placement of AOI borders. The comparison of two scanpaths with relatively large preset AOIs results in higher similarity than the comparison of the same two scanpaths with smaller preset AOIs (Figure 5). Moreover, fixations within the same AOI do not cause an editing step while fixations in adjacent AOIs cause an editing step, even if the absolute distance of the former pair is higher than that of the latter pair (Figure 5).
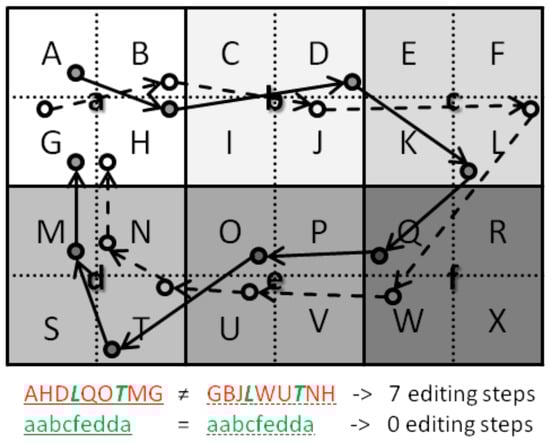
Figure 5.
Disadvantages of string edit methods. The same scanpath comparison leads to fewer editing steps and higher similarity scores with larger AOI regions (lowercase letters) than with smaller AOI regions (uppercase letters). Distant fixations within the same AOI region (e.g., the two fixations in T) lead to fewer editing steps and higher similarity scores than nearby fixations within different AOI regions (e.g., the fixations in M and N).
As FuncSim compares location similarity based on x- and y-coordinates, it is not necessary to preset AOIs on which the similarity will depend. This is particularly beneficial for real-world analyses with visual input that cannot easily be clustered in AOIs. In the real world, participants are faced with complex, cluttered scenes containing objects that differ in size, and may even overlap. Moreover, when approaching or departing, objects change their size, not only on the retina, but also in the video frame of a mobile eye tracker. FuncSim takes these challenges of the real world into account.
Benefits of alignment based on functional units
A further advantage of FuncSim is that similarity scores are independent of the difference in the number of fixations between the to-be-compared scanpaths, the lengths of the scanpaths. Based on the alignment procedure, each fixation of one path is aligned with one or more fixations of the other path for similarity calculations. No fixation is lost by this analysis compared to other methods (Cristino et al., 2010; Dewhurst et al., 2012; Jarodzka et al., 2010). In most string editing methods, inequality in the length of fixation sequences leads to lower similarity because of insertions and deletions. In contrast, for FuncSim, high similarity is computed as long as the fewer fixations in the one path are indeed similar to the more fixations in the other path. This is a nice feature for real-world tasks as it accounts for the fact that the length of scanpaths differs across individuals as well as across repetitions when interacting with the dynamic real world. When learning an object-based sequential sensorimotor task, participants usually become faster and perform fewer fixations (e.g., Epelboim et al., 1995; Foerster et al., 2011). However, fixation locations across levels of expertise are not significantly more different than fixation locations across participants with the same experience level (Foerster et al., 2011 and real-world example in the present paper). In addition, the saved fixations have no different function than the kept fixations. Participants perform fewer fixations on a target location to guide the hand after training, while several guiding fixations can be observed to the same target position before training. However, it is not the case that participants perform task-irrelevant fixations when they perform a task the first time and then learn to make guiding fixations. Scanpath length does not only differ across levels of expertise. There are also inter-individual differences. Some participants require more time to accomplish a task and therefore also perform more fixations, while others perform faster and require fewer fixations.
Importantly, the functional matching procedure of FuncSim bears advantages for scanpath comparisons in sequential tasks. Unlike all other available scanpath comparison methods, FuncSim takes the structure of the investigated task into account and uses it as unique alignment criteria. Real-world tasks are often characterized by an inherent hierarchy and sequence of distinct sub-tasks or sub-actions. FuncSim aligns the eye movements of the to-be-compared scanpaths according to the smallest functional units of the task, e.g., its object-related actions. In this way, scanpaths are compared with respect to the distributions of fixations to the task-inherent functional units. Difference scores across fixations are calculated within the same functional unit of the task. Therefore, the method does not compare whether the Xth fixations of two scanpaths are similarly located, or whether the fixations that had been executed X seconds after task onset are similarly located, but whether the fixations made during functional unit X are similarly located across paths.
FuncSim even provides an additional opportunity. It might be that some participants look more anticipatory than others. While performing a specific sub-action of a task, these participants might already look at locations informative for the upcoming sub-action, while the others fixate important information just-in-time (how it was observed by Hayhoe, Shrivastava, Mruczek, & Pelz,
2003). In this case, units of the anticipatory participants’ paths could be subtracted by 1 and compared with the other participants’ paths in order to see whether the anticipatory participants are indeed most of the time one step ahead.
Moreover, FuncSim can also be used if the order of sub-units is not fixed. Some tasks consist of a fixed number of sub-units that can be accomplished in varying order. When making a cup of tea, for instance, water could be heated first and the teabag could be placed in the cup thereafter, ending with filling the boiled water in the cup. However, you could also place the teabag in the cup first or even last. FuncSim can answer whether participants look the same way while acting on the same subunit, irrespective of the order in which the sub-units were accomplished. The idiosyncratic units of the task have just to be labeled respectively. In the tea making example, water boiling could be labeled with 1 in each case, teabag placing with 2 in each case, and water filling with 3 in each case. If the units have been performed in a different order, FuncSim automatically reorders fixations according to the functional unit order, and computes the scanpath similarity as if fixations had been performed in this order. Thus, FuncSim calculates scanpath similarity based on comparing same sub-actions. If the question is in contrast whether fixation sequences are similar in the observed sub-unit order, units in both paths have to be labeled in the order they were observed. In this case, in the tea making example whichever action was performed first would be labeled with 1 (e.g., water heating in path1 and teabag placing in path2), whichever action follows with 2 and so on. Finally, if the question is simply whether the fixation sequences are similar over time, methods without functional sequencing work fine. Alternatively, all fixations could be labeled the same (e.g.: 1 for only one task without sub-units) and FuncSim could be used with “reldur” (relative duration) alignment, again when assuming that the investigated task has a continuous nature. Thus, FuncSim bears the opportunity to answer a diversity of research questions that cannot be answered with other methods.
Benefits of an implemented evaluation procedure
A final crucial benefit of FuncSim is its evaluation procedure. The calculated difference scores are more meaningful and interpretable than in other measures, and they can be tested against the provided inherent random baseline. Most scanpath similarity methods normalize the calculated dissimilarity value (e.g., number of editing steps) so that 0 means perfect similarity, and 1 means “maximum” dissimilarity. However, it is not clear what the maximal dissimilarity of two scanpaths is. Therefore, it is also a non-trivial question how to normalize a dissimilarity value. For maximal position dissimilarity, the diagonal of the screen could be used in computer experiments (cf. Dewhurst et al., 2012), where participants are not allowed to look somewhere else than on the screen. Although, it can be questioned whether the diagonal of the screen is a fair maximum as participants would presumable not alternate between the corners of the blank screen when having no task to fulfill. In the real world, however, the spatial scale is even infinite, and some participants may use more space for a task than others. In addition, fixation durations and path lengths have no discrete limit. The absolute dissimilarity of path direction is 180°, which could be used for normalizing the direction value (cf. Dewhurst et al., 2012). However, here again it is questionable whether this normalization is fair, as task-unrelated scanpaths would presumable not consist of alternating saccades. String edit values are usually normalized on the basis of the number of fixations within the longer path (cf. Cristino et al., 2010) making it dependent on the length similarity of the to-be-compared scanpaths. Because of these considerations, we decided not to normalize the difference scores. Instead, the difference scores can be compared to task conditions and the sample. Differences in fixation locations could for instance be compared to the size of the objects in the task, or to the maximal fixation location difference of the currently compared samples. In this way, normalization is no default operation in FuncSim, but can be done individually if needed.
Instead of having a default normalization procedure, FuncSim has a default random baseline evaluation procedure. The question that shall be answered in most scanpath similarity investigations is whether compared scanpaths are significantly similar or not. A single value - normalized or not - is no answer to this question. Which value can be seen similar, and which value dissimilar? Of course, similarity is a continuum. Nevertheless, we want to know whether the similarity is considerably high or not. In the analysis of variance, variance across a manipulation is compared to variance within the sample. We followed this idea in our evaluation procedure. The calculated difference scores across the compared scanpaths are tested against the difference scores within the same scanpath. The within-paths differences are calculated by comparing the actually observed sequence with a randomly chosen sequence of functional action units. With these between-path and random baseline within-path values, a t-test by the investigator can reveal whether similarity is significant, respectively whether difference scores are significantly smaller between than within scanpaths. In the next section, the presented advantages will be supported by comparing how FuncSim and two recent scanpath similarity methods (ScanMatch and MultiMatch) perform in eight examples.
Comparing the methods
In this section, the functional sequencing method FuncSim is compared to the string edit method ScanMatch (Cristino et al., 2010), and the vector-based method MultiMatch (Dewhurst et al., 2012; Jarodzka et al., 2010), which are the most recent scanpath similarity methods. The comparison of the methods is made on eight pairs of artificial scanpaths (Figure 6) that were constructed to illustrate several crucial aspects of scanpath comparisons in sequential sensorimotor tasks.
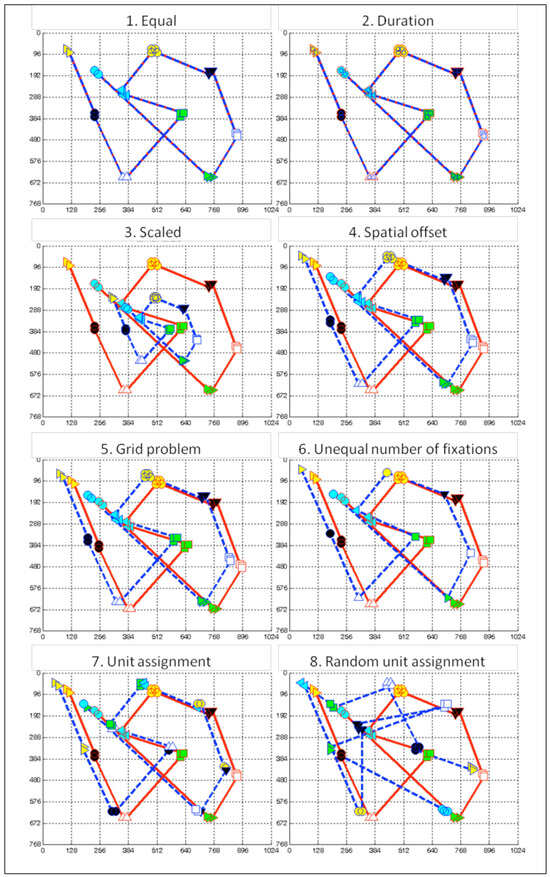
Figure 6.
Artificial scanpaths for method comparisons. Red lines and red marker outlines belong to path 1, and blue lines and blue marker outlines belong to path 2. Marker shapes and face colors indicate assignment of corresponding fixations to functional units (1=yellow triangle, 2=black circle, 3=white triangle, 4=green square, 5=blue triangle, 6=yellow circle, 7=black triangle, 8=white square, 9=green triangle, 10=blue circle). Fixation durations are symbolized by marker size. 1: Equal red and blue paths. 2: Fixations of the blue path have half the duration of the red path. 3: Blue path was generated by scaling x- and y-coordinates of red path by the factor 0.5. 4: Blue path was generated by shifting the red path 30 pixels up and 50 pixels to the left. Fixations within same sub-actions are located within same grid regions. 5: Blue path was generated by shifting the red path 30 pixels up and 50 pixels to the left. Fixations within same sub-actions are located in different grid regions. All fixations are 20 pixels lower and 20 pixels more to the right than in forth example. 6: The blue path contains fewer fixations than the red path. The blue path is also shifted 30 pixels up and 50 pixels to the left. 7: Fixations of the blue path are differently assigned to the functional units than the fixations of the red path. 8: Fixation groups of both paths are randomly assigned to functional units.
X- and y-coordinates of artificial scanpaths were limited to 1,024 and 768 pixels, respectively. The MultiMatch toolbox for Matlab was downloaded from http://wiki.humlab.lu.se/dokuwiki/doku.php?id=public:useful_links. The ScanMatch toolbox for Matlab was downloaded from http://seis.bris.ac.uk/~psidg/ScanMatch. Each ScanMatch comparison was calculated with an 8 x 8 grid upon a 1,024 x 786 pixel spatial layout. Temporal binning was allowed. For each comparison, the substitution matrix threshold of ScanMatch was set to 2 times the standard deviation of saccade length divided by the ratio of 1,024 to 768. This procedure is recommended in Cristino et al. (2010).
Table 5 shows the results. ScanMatch and MultiMatch provide normalized similarity scores from 0 = minimal similarity up to 1 = maximal similarity. FuncSim provides difference scores for distance, duration, length, and direction in the entered unit of measurement, i.e., pixels for distance and length, milliseconds for duration, and degrees for direction in the examples. FuncSim dissimilarity scores are calculated for the to-be-compared scanpaths as well as between the first path and its randomly chosen permutation as baseline dissimilarity score. The difference Δ between dissimilarity scores (Δ = random baseline – between-path) in Table 5 delivers a hint whether the dissimilarity would become significantly lower than random, i.e., with high Δ-values.
Table 5.
Scanpath similarities calculated by ScanMatch, MultiMatch, and FuncSim between artificial scanpaths. ScanMatch and MultiMatch provide normalized similarity scores (NSS) between 0 = low similarity, and 1 = high similarity. FuncSim provides between-path differences (BPD) for distance, duration, length, and direction in the entered unit of measurement between the to-be-compared scanpaths as well as differences between the first path and its scrambled derivative, the random baseline difference (RBD). The difference (Δ) between BPD and RBD indicates the relevance of the BPD.
Identifying perfect similarity
Example 1 “Equal” is composed of two identical scanpaths (Figure 6.1). The example was chosen, because recognizing two identical scanpaths as perfectly similar is a prerequisite all scanpath similarity methods have to fulfill. Correspondingly, all three measures robustly confirm maximal scanpath similarity with between-path differences (BPDs) of 0, and normalized similarity scores (NSSs) of 1. RBDs for duration are zero, as duration of all fixations was set the same. Thus, fixation durations do also not differ within paths.
Benefits of comparison dimensions
Example 2 “Duration” compares scanpaths that differ only in fixation durations (Figure 6.2). The duration of all path 1 fixations was set to 300 ms, and the duration of all path 2 fixations was set to 150 ms. FuncSim reveals this pattern with zero BPDs for location, length, and direction, but not for duration. The BPD for duration reveals that fixation durations are on average 150 ms different across paths. In addition, the negative Δ-value for duration of -150 indicates that durations are more different within units across the paths (BPD = 150 ms) than within the same paths across units (RBD = 0 ms). Also MultiMatch reveals this pattern with NSSs of 1 in all dimensions, but duration (.50). As ScanMatch was used with temporal binning, the difference in fixation durations leads to a different alignment and thus also to a lower NSS of .67. ScanMatch is agnostic to the dimension in which the scanpaths differ. This example shows why it is useful to have duration sequence as separate dimension in a scanpath similarity method. Otherwise, perfect location similarity could remain unrecognized because of fixation duration differences. In addition, the example demonstrates what is meant by FuncSim’s meaningful difference scores. FuncSim not only recognizes that the paths differ only in duration sequence, but also depicts the mean value of the duration sequence difference in milliseconds.
In example 3 “Scaled”, a scanpath is compared with its derivative scaled by 0.5 (Figure 6.3). In this case, fixation durations and path directions are still the same, while locations and length are different between paths. FuncSim depicts this pattern with zero BPDs for duration and direction. The ScanMatch NSS of .19 is extremely low in this case, as similarity is computed only on the basis of location information. MultiMatch NSSs for location (.81) and length (.85) are only slightly lowered. The direction NSS is also lowered (.89) slightly. This example demonstrates that it is useful to have separate dimensions of location, duration, length, and direction sequence similarity. It also shows that it can be useful to align fixations independently of the dimensions as only FuncSim does, and calculate the dimension scores thereafter and separately from each other. MultiMatch’s multi-dimensional alignment procedure in contrast aligns scanpaths so that the similarity in all dimensions is maximized simultaneously, i.e., finding the best alignment over all dimensions. This might have led to the fact that no perfect direction similarity had been calculated. Of course, aligning scanpaths separately from the similarity dimensions as FuncSim does is only possible, if other features can be used for alignment such as functional units of the task. This advantage does only arise in sequential tasks that can be divided into functional units.
Example 4 “Spatial offset” compares a scanpath with its derivative shifted 50 pixels to the left and 30 pixels up (Figure 6.4). As nearby fixations are located within the same grid region, the ScanMatch NSS is 1. ScanMatch assumes the same similarity for this example as for example 1 “Equal”. MultiMatch recognizes the slight spatial offset with a location NSS of .95. FuncSim not only recognizes the spatial offset, but also reveals its magnitude with a location BPD of 58.31. This is exactly the square root of the sum of squares of 50 and 30. Again, we can learn from this example that dimensions are more informative than a single value. The dimensions reveal that scanpaths only differ in fixation location, but not in length, direction, and duration. Beyond that, FuncSim depicts the mean magnitude of the spatial offset in the location difference value.
Benefits of exact location sequence
Example 4 “Spatial offset” additionally demonstrates the advantage of using exact location information as FuncSim and MultiMatch do. In this way, location sequence similarity scores are not influenced by preset parameters. Spatial offsets are recognized whether or not crossing a predefined border.
Example 5 “Grid Problem” is composed of the same two paths as example 4, except that by shifting both paths 20 pixels down and right nearby fixations fall in different grid regions (Figure 6.5). This example was conducted to demonstrate the limits of string-editing methods. Because string-edit methods like ScanMatch are influenced by the location of grid borders, similarity is judged much lower in this case (.44) compared to example 4, although absolute location difference is exactly the same. FuncSim and MultiMatch correctly identify that the similarity in examples 4 and 5 is exactly the same. RBDs and Δ-values differ slightly between examples 4 and 5, because the random unit assignment procedure naturally leads to slightly different values on every run.
Benefits and limits of alignment based on functional units
In example 6 “Unequal number of fixations”, the blue path was generated from the red path by picking only one fixation per unit, and shifting these 30 pixels up and 50 pixels to the left (Figure 6.6). This example demonstrates how the different methods deal with the alignment of a short and a long scanpath. Although nearby fixations are located within the same grid region, the ScanMatch NSS is only .33. The reason is that ScanMatch as string edit method aligns on the basis of the numerical indices of fixations. Dissimilar located fixations have to be substituted or deleted. Remaining fixations all have to be deleted to transform the longer path into the shorter path. Each deletion is a costly transformation step. Therefore, a difference in the length of to-be-compared scanpaths automatically reduces the similarity score. As FuncSim aligns fixations according to their unit indices, and nearby fixations belong to the same unit in this example, FuncSim Δ-values for location are high (341.90 with average, and 435.99 with reldur alignment). Thus, FuncSim recognizes that fixations in the short and the long path are located quite similarly, although one path is shorter than the other paths. The Δ-values for length are negative (-119.24 with average, and -129.92 with reldur alignment) in this example, as the averaged lengths are more different across paths than within a path. This is the case, because the short saccades of the red path bridging the very nearby located fixations within units are lacking in the blue path. For the same reason, the direction Δ-values are relatively low (54.35 with average, and 30.77 with reldur alignment). Saccades with a variety of directions are present within each unit of the red path, but not the blue path. Also, MultiMatch is not so much dependent on the length difference of the compared paths. However, all NSSs are quite high with MultiMatch in this example (all above .95). This is very likely the consequence of MultiMatch’s simplification step prior to similarity calculation that might have aggregated many of the nearby fixations in the red path. Depending on whether the investigator is interested in these small variations, it might be either useful or obstructive to aggregate them.
In example 7 “Unit assignment”, the unit assignment of example 4 was changed, i.e., no longer all the nearest located fixations belong to the same unit (Figure 6.7). In a real task, this would imply that subjects looked at very similar locations in the same order, but not during the same sub-unit of the task. This example demonstrates for which kind of research questions FuncSim was conducted. As can be seen in Table 5, the differing unit assignment leads to higher BPD values and smaller Δ-values than in example 4. FuncSim was conducted to be sensitive to unit assignment differences. It correctly recognizes that the variance between scanpaths within the same units is enhanced. As ScanMatch and MultiMatch are agnostic to the assignment of fixations to the sequence of the task, they perform as in example 4. ScanMatch and MultiMatch were conducted to find the best alignment of scanpaths, i.e., the alignment providing the highest similarity. These methods are especially adequate if there is no further knowledge about the task structure. If the investigator wants to know whether fixation sequence over time is similar irrespective of the performed actions over time, then ScanMatch and MultiMatch are the adequate methods. However, if the question is whether participants look in a similar way while performing the same sub-units of a task, then FuncSim is the method to choose.
In example 8 “Random unit assignment”, fixation locations are still the same as in example 4, but the 10 units were randomly assigned to the fixation groups in each path. Afterwards, the fixations were reordered according to the new task sequence (1-10 units of the task). Thereby, also a different fixation sequence is generated as can be seen in Figure 6.8. The logic of this example is to show that unit order of FuncSim is the equivalent to fixation order of ScanMatch and MultiMatch. While different unit assignment with kept fixation order (example 7) only influences FuncSim values, random unit assignment and thus changed fixation order should be indicated by low similarity values in all methods. FuncSim BPDs are high and Δ-values are negative indicating that the similarity is higher across a path and its permutation than across the different paths. MultiMatch calculates the lowest values in this example, but unexpectedly high with .66 for direction up to .90 for length. A duration NSS of 1 and BPD of 0 was expected as fixation durations were exactly the same in both paths. As the sequence of fixation groups is random in example 8, we had expected dramatically smaller MultiMatch similarity scores. This result strengthens the argument that normalization is nontrivial, and that normalized values might inadequately be interpreted as similar or dissimilar by an inexperienced user. The ScanMatch value of .48 is even higher in this example than in examples 3 (scaled), 5 (grid problem), and 6 (unequal number of fixations). By chance, some similar located fixations were placed at similar indices in the sequence causing the moderate ScanMatch similarity score. Fixations of examples 3, 5, and 6 in contrast fall at different grid regions.
Artificial examples, but real problems
It has to be mentioned that these artificial examples were constructed in order to show the limits of ScanMatch and MultiMatch as well as the advantages of FuncSim. However, this does not mean that the problems they depict are not real. The problems of duration differences, scaled scanpaths, and scanpaths with spatial offsets or with unequal number of fixations do exist in the real world as we will see in the next section. Participants fixate longer in one condition and shorter in another condition. Scanpaths can be scaled when object distances vary. Scanpaths can have spatial offsets because of object movements. It is often the case that scanpaths differ in the number of fixations, although exactly the same task was performed because of speed differences. The grid problem is a problem to face when calculating ScanMatch scores in a real-world task. In contrast to a computer monitor with preselected stimuli locations, the location of objects in the real world cannot always be controlled. In addition, interacting with the environment changes the location of objects and their relations to each other, so that superimposing a grid is difficult. Most importantly, if the research question is whether the taskrelated sequence of fixations is similar, FuncSim has the power to answer this question. FuncSim calculates how similar the sequence of locations, durations, lengths, and directions is when fixations are aligned according to the inherent structure of functional units of the task.
Evidently, FuncSim is not always the method to choose. FuncSim has no advantage with tasks that do not bear an inherent structure or sequence. As an example, there is no inherent sequence in viewing a picture on a computer screen, or, at least, there is no objective indicator of a sequence. Therefore, functional units cannot be defined and FuncSim would align fixations just according to their temporal position in the scanpaths (with “reldur” alignment). This would presumably underestimate scanpath similarity. In addition, even if a task has an inherent structure, you might not always be interested in functional similarity. If the question is whether the scanpaths are similar independent of the task’s inherent structure, FuncSim does not provide any benefit. It is the research question that decides which scanpath-similarity method fits best.
Real-world example
In this section, we reanalyze data from Foerster et al. (2011) with the functional sequencing method FuncSim. In Foerster et al. (2011), nine right-handed trained participants had to stack up and down pyramids of plastic cups in a predetermined sequence as fast as possible. This so-called speed-stacking or sport-stacking task consists of 44 grasping and placing actions that can be used as functional units. Participants were trained for 14 consecutive days. Besides other variables, scanpaths were compared between the first and the last training day. Eye movements were measured using a monocular head-mounted eye tracker (SMI iView XTM HED). Gaze-overlaid videos from each participant’s fastest trial on the first and the last training day were analyzed frame-by-frame. Each video frame was first assigned to one of the 44 functional units of the task. Next, within each functional unit, gaze positions were standardized according to the topological structure of cup arrangements during the functional unit. This was done by matching a marker in a cuparrangement line drawing of the respective functional unit to the gaze marker in the current video frame (Figure 7). Fixations spanning several functional units were added and labeled as often as needed (as described above). above). Pixel information in the line drawings was scaled to cm information in the real scene. Fixation duration information was not annotated in this study.
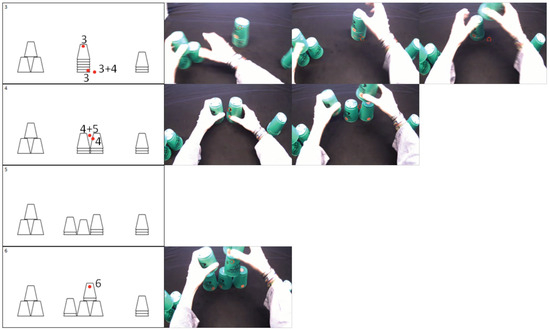
Figure 7.
Examples of cup-arrangement line drawings. Each cup is illustrated as a trapezium with the long horizontal line as the open part of the cup. Additional horizontal lines near the open part of a cup illustrate piles of cups. Each line drawing represents a functional unit. The numbers in the upper left corner of the line drawings indicate which unit’s start configuration they depict. A start configuration is at the same time the end configuration of the last unit. To the left of each line drawing, frames of the gaze video are depicted that show a fixation belonging to the respective unit. The red circle in the video frames indicates were the participant looked. The red dots in the line drawings were matched in position with the gaze makers in the video frames for every annotated fixation and labeled with the units during which they were performed.
The annotation procedure of one participant stacking up a six-cup pyramid is presented exemplarily in Figure 7. In sub-unit 3 (upper line drawing), the right hand has to grasp the upper three cups of the middle stack and place them to the right of the stack. The end configuration of this unit 3 is at the same time the start configuration of unit 4 (line drawing in the second row of Figure 7). In unit 4, the upper two cups of the left-most stack have to be placed with the left hand to the left of the stack. Again, the resulting configuration is the start configuration for the next unit 5 (line drawing in the third row of Figure 7). In unit 5, the two upper cups of the right stack of the six-cup pyramid base have to be stacked up on the two right-most cups of the pyramid with the right hand. The resulting configuration is the start configuration of unit 6 (line drawing in the last row of Figure 7). In unit 6, the upper cup of the left-most stack has to be stacked up to the left-most cups of the six-cup pyramid base. The unit thereafter would be upstacking the top cup with the right hand (not in Figure 7). The pictures on the right of the line drawings show some of the corresponding gaze videos of each functional unit. Three different locations were fixated during unit 3 which were plotted as red dots in the line drawing. The last fixation during unit 3 spanned over to unit 4 and was thus labeled 3 and 4. During unit 4 two further fixations were performed as indicated in the gaze video frame examples. Again the last fixation during unit 4 spanned over to unit 5 and was labeled respectively. No further fixation was performed during unit 5. The next fixation was performed while the participant was already engaged in unit 6.
When watching the gaze videos, it is intuitively clear that participants saccaded often in the same sequence of locations while doing the task (see Movie 3 in Foerster et al., 2011). On the first as well as on the last day, participants looked just-in-time at hand movement goal locations, namely target locations for grasping and placing.
Table 6 shows how the different algorithms perform on the real-world data. ScanMatch values were calculated with grid regions having approximately the size of a cup (7.5 cm width and 9.5 cm height) and without temporal binning (fixation duration information was not available). For each comparison, the substitution matrix threshold of ScanMatch was set to 2 times the standard deviation of saccade length divided by the ratio of the working space (100 cm width and 50 cm height). ScanMatch values are low to moderate, so that it is not clear whether scanpaths are indeed similar. One can assume that ScanMatch values underestimate similarity in this experiment, because the number of fixations decreased during learning (from 95 to 62 per trial) and compared scanpaths thus have unequal number of fixations (see section artificial example 6). MultiMatch values in contrast are quite high in all dimensions but direction. However, it is not clear whether similarity is significant or not. FuncSim dissimilarity values can be evaluated by comparing them to the random baseline. Two-tailed paired t-tests reveal that dissimilarity across training days is significantly lower than the random baseline regarding location sequence as well as direction sequence confirming the subjective impression from the gaze videos. Location sequence difference across training days was on average 8.72 cm which is less than a cup’s height. However, length sequence dissimilarity across training days is not significantly different from the random baseline. Here, length sequence differs on average only about 8 cm (a cup’s width) not only across training days but also across functional units. Thus, length seems to be quite similar throughout this task no matter of the actual sequence. This pattern might emerge due to the relatively constant distance of the cups to each other. FuncSim thus nicely reveals that length similarity is a fixed property of the task and no feature that is modulated by the task sequence.
Table 6.
Scanpath similarity and dissimilarity scores calculated by ScanMatch, MultiMatch, and FuncSim across scanpaths of the first and the last training day in the cup-stacking task for all nine participants. ScanMatch and MultiMatch provide normalized similarity scores (NSS) between 0 = low similarity, and 1 = high similarity. FuncSim provides between-path differences (BPD) and random baseline differences (RBD) in the entered unit of measurement. T-values and p-values are provided for the two-tailed comparison between BPDs and RBDs of FuncSim in each dimension.
Summary
In this paper, we presented a scanpath similarity method with a functional matching procedure (FuncSim) that calculates difference scores on multiple dimensions, and evaluates these scores based on the variance within a path. The strengths of FuncSim compared to other recent scanpath similarity methods were demonstrated on the basis of eight artificial examples and one real-world example. Because of the alignment of fixations according to a task’s inherent sequence, FuncSim is perfectly suitable to compare scanpath similarity in sequential tasks, a characteristic often found in real-world, object-based sensorimotor tasks. Does a child look at the same locations as an adult when passing through the sub-action of tying a shoe? Is the sequence of saccade directions similar when walking down a specific street twice? Is the difference across compared scanpaths significantly smaller than the variance within them? These and other questions can be answered with the functionally sequenced scanpath similarity method FuncSim.
Using FuncSim
FuncSim code for MATLAB including the artificial scanpath pairs (Foerster & Schneider, 2013) can be freely downloaded at http://www.uni-bielefeld.de/psychologie/ae/Ae01/Research/FuncSim. In case of problems or questions contact the corresponding author who will be happy to help you. When publishing data analyzed with FuncSim, please cite this paper.
Author Note
This research was supported by a grant of the Cluster of Excellence Cognitive Interaction Technology (CITEC) at Bielefeld University.
Correspondence should be addressed to Rebecca Foerster, Department of Psychology, Neuro-cognitive Psychology, Bielefeld University, P.O. Box 100131, D-33501 Bielefeld, Germany, E-mail rebecca.foerster@unibielefeld.de
References
- Brandt, S. A., and L. W. Stark. 1977. Eye movementbased memory effect: A reprocessing effect in face perception. Journal of Experimental Psychology: Learning, Memory, and Cognition 25: 997–1010. [Google Scholar]
- Cristino, F., S. Mathôt, J. Theeuwes, and I. D. Gilchrist. 2010. ScanMatch: A novel method for comparing fixation sequences. Behaviour Research Methods 42: 692–700. [Google Scholar] [CrossRef] [PubMed]
- Dewhurst, R., M. Nyström, H. Jarodzka, T. Foulsham, R. Johansson, and K. Holmqvist. 2012. It depends on how you look at it: Scanpath comparison in multiple dimensions with MultiMatch, a vector-based approach. Behavior Research Methods, 1–22. [Google Scholar] [CrossRef]
- Epelboim, J., R. M. Steinman, E. Kowler, M. Edwards, Z. Pizlo, C. J. Erkelens, and H. Collewijn. 1995. The function of visual search and memory in sequential looking tasks. Vision Research 35: 3401–3422. [Google Scholar] [CrossRef]
- Foerster, R. M., E. Carbone, H. Koesling, and W. X. Schneider. 2011. Saccadic eye movements in a highspeed bimanual stacking task: Changes of attentional control during learning and automatization. Journal of Vision 11, 7 9. : 1–16. [Google Scholar] [CrossRef]
- Foerster, R. M., E. Carbone, H. Koesling, and W. X. Schneider. 2012. Saccadic eye movements in the dark while performing an automatized sequential highspeed sensorimotor task. Journal of Vision 12, 2 8. : 1–15. [Google Scholar] [CrossRef] [PubMed][Green Version]
- Foerster, R. M., and W. X. Schneider. 2013. FuncSim Toolbox for Matlab. CITEC, Bielefeld University. [Google Scholar] [CrossRef]
- Foulsham, T., R. Dewhurst, M. Nyström, H. Jarodzka, R. Johansson, G. Underwood, and K. Holmqvist. 2012. Comparing scanpaths during scene encoding and recognition: A multi-dimensional approach. Journal of Eye Movement Research 5: 1–14. [Google Scholar] [CrossRef]
- Foulsham, T., and G. Underwood. 2008. What can saliency models predict about eye movements? Spatial and sequential aspects of fixations during encoding and recognition. Journal of Vision 8, 2 6. : 1–17. [Google Scholar] [CrossRef]
- Gray, W. D., and W.-T. Fu. 2004. Soft constraints in interactive behavior: The case of ignoring perfect knowledge in-the-world for imperfect knowledge inthe-head. Cognitive Science 28, 3: 359–382. [Google Scholar]
- Hacisalihzade, S., L. Stark, and J. Allen. 1992. Visual perception and sequences of eye movement fixations: A stochastic modeling approach. IEEE Transactions on Systems, Man, and Cybernetics, vol. 22, pp. 3474–3481. [Google Scholar]
- Hayhoe, M. M., A. Shrivastava, R. Mruczek, and J. B. Pelz. 2003. Visual memory and motor planning in a natural task. Journal of Vision 3, 1 6. : 49–63. http://www.journalofvision.org/content/3/1/6. [CrossRef] [PubMed]
- Henderson, J. M., J. R. Brockmole, and M. S. Castelhano. 2007. Edited by R. van Compel, M. Fischer, W. Murray and R. W. Hill. Visual saliency does not account for eye movements during visual search in real-world scenes. In Eye movements: A window on mind and brain. Amsterdam: Elsevier, pp. 537–562. [Google Scholar]
- Holmqvist, K., M. Nyström, R. Andersson, R. Dewhurst, H. Jarodzka, and J. Van de Weijer. 2011. Eye tracking: A comprehensive guide to methods and measures. New York: Oxford University Press. [Google Scholar]
- Jarodzka, H., K. Holmqvist, and M. Nyström. 201. A vector-based, multidimensional scanpath similarity measure. Proceedings of the 2010 Symposium on EyeTracking Research and Applications, 211–218. [Google Scholar]
- Jovancevic-Misic, J., and M. Hayhoe. 2009. Adaptive gaze control in natural environments. The Journal of Neuroscience 29, 19: 6234–6238. [Google Scholar] [CrossRef]
- Lacquaniti, F., C. Terzuolo, and P. Viviani. 1984. The law relating the kinematic and figural aspects of drawing movements. Acta Psychologica 54: 115–130. [Google Scholar] [CrossRef]
- Laeng, B., and D.-S. Teodorescu. 2002. Eye scanpaths during visual imagery reenact those of perception of the same visual scene. Cognitive Science 26: 207–231. [Google Scholar] [CrossRef]
- Land, M. F., and M. M. Hayhoe. 2001. In what ways do eye movements contribute to everyday activities? Vision Research 41: 3559–3565. [Google Scholar] [CrossRef] [PubMed]
- Land, M. F., and P. McLeod. 2000. From eye movements to actions: How batsmen hit the ball. Nature Neuroscience 3, 12: 1340–1345. [Google Scholar] [CrossRef]
- Levenshtein, V. I. 1966. Binary codes capable of correcting deletions, insertions, and reversals. Soviet Physics, Doklady 10: 707–710. [Google Scholar]
- Mannan, S., K. H. Ruddock, and D. S. Woodman. 1995. Automatic control of saccadic eye movements made in visual inspection of briefly presented 2-D images. Spatial Vision 9: 363–386. [Google Scholar]
- Mathôt, S., F. Cristino, I. D. Gilchrist, and J. Theeuwes. 2012. A simple way to estimate similarity between pairs of eye movement sequences. Journal of Eye Movement Research 5, 1: 1–15. [Google Scholar] [CrossRef]
- Myers, C. W., and W. D. Gray. 2010. Visual scan adaptation during repeated visual search. Journal of Vision 10, 8 4. : 1–14. [Google Scholar] [CrossRef]
- Noton, D., and L. W. Stark. 1971a. Scan paths in eye movements during pattern perception. Science 171: 308–311. [Google Scholar] [CrossRef] [PubMed]
- Noton, D., and L. Stark. 1971b. Scan paths in saccadic eye movements while viewing and recognizing patterns. Vision Research 11: 929–942. [Google Scholar] [CrossRef] [PubMed]
- ‘t Hart, B. M., J. Vockeroth, F. Schumann, K. Bartl, E. Schneider, P. König, and W. Einhäuser. 2009. Gaze allocation in natural stimuli: Comparing free exploration to head-fixed viewing conditions. Visual Cognition 17: 1132–1158. [Google Scholar] [CrossRef]
- Viviani, P., and C. Teruolo. 1980. Edited by G. E. Stelmach and J. Requin. Space-time invariance in learned motor skills. In Tutorials in motor behavior. Amsterdam: North-Holland, pp. 525–533. [Google Scholar]
- Wing, A. M. 1978. Edited by G. E. Stelmach. Response timing in handwriting. In Information processing in motor control and learning. New York: Academic Press, pp. 153–172. [Google Scholar]


Copyright © 2013. This article is licensed under a Creative Commons Attribution 4.0 International License.