Combining EEG and Eye Tracking: Using Fixation-Locked Potentials in Visual Search
Abstract
:Introduction
Material and methods
Stimuli and apparatus
Participants
Apparatus
EEG
Visual search scenarios
FLERP analysis
Statistical analysis
Results
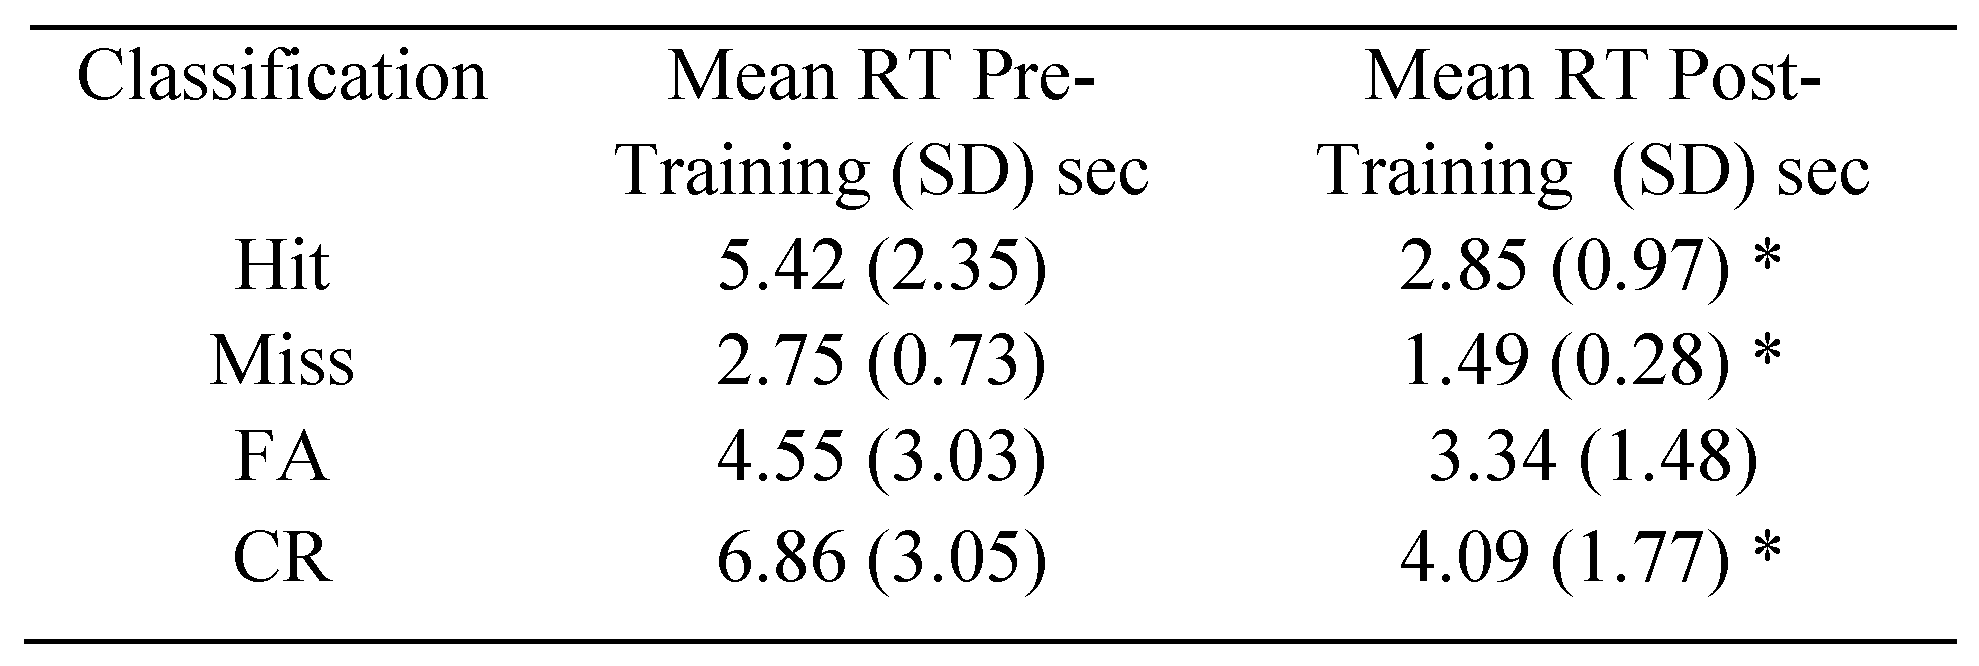
Performance
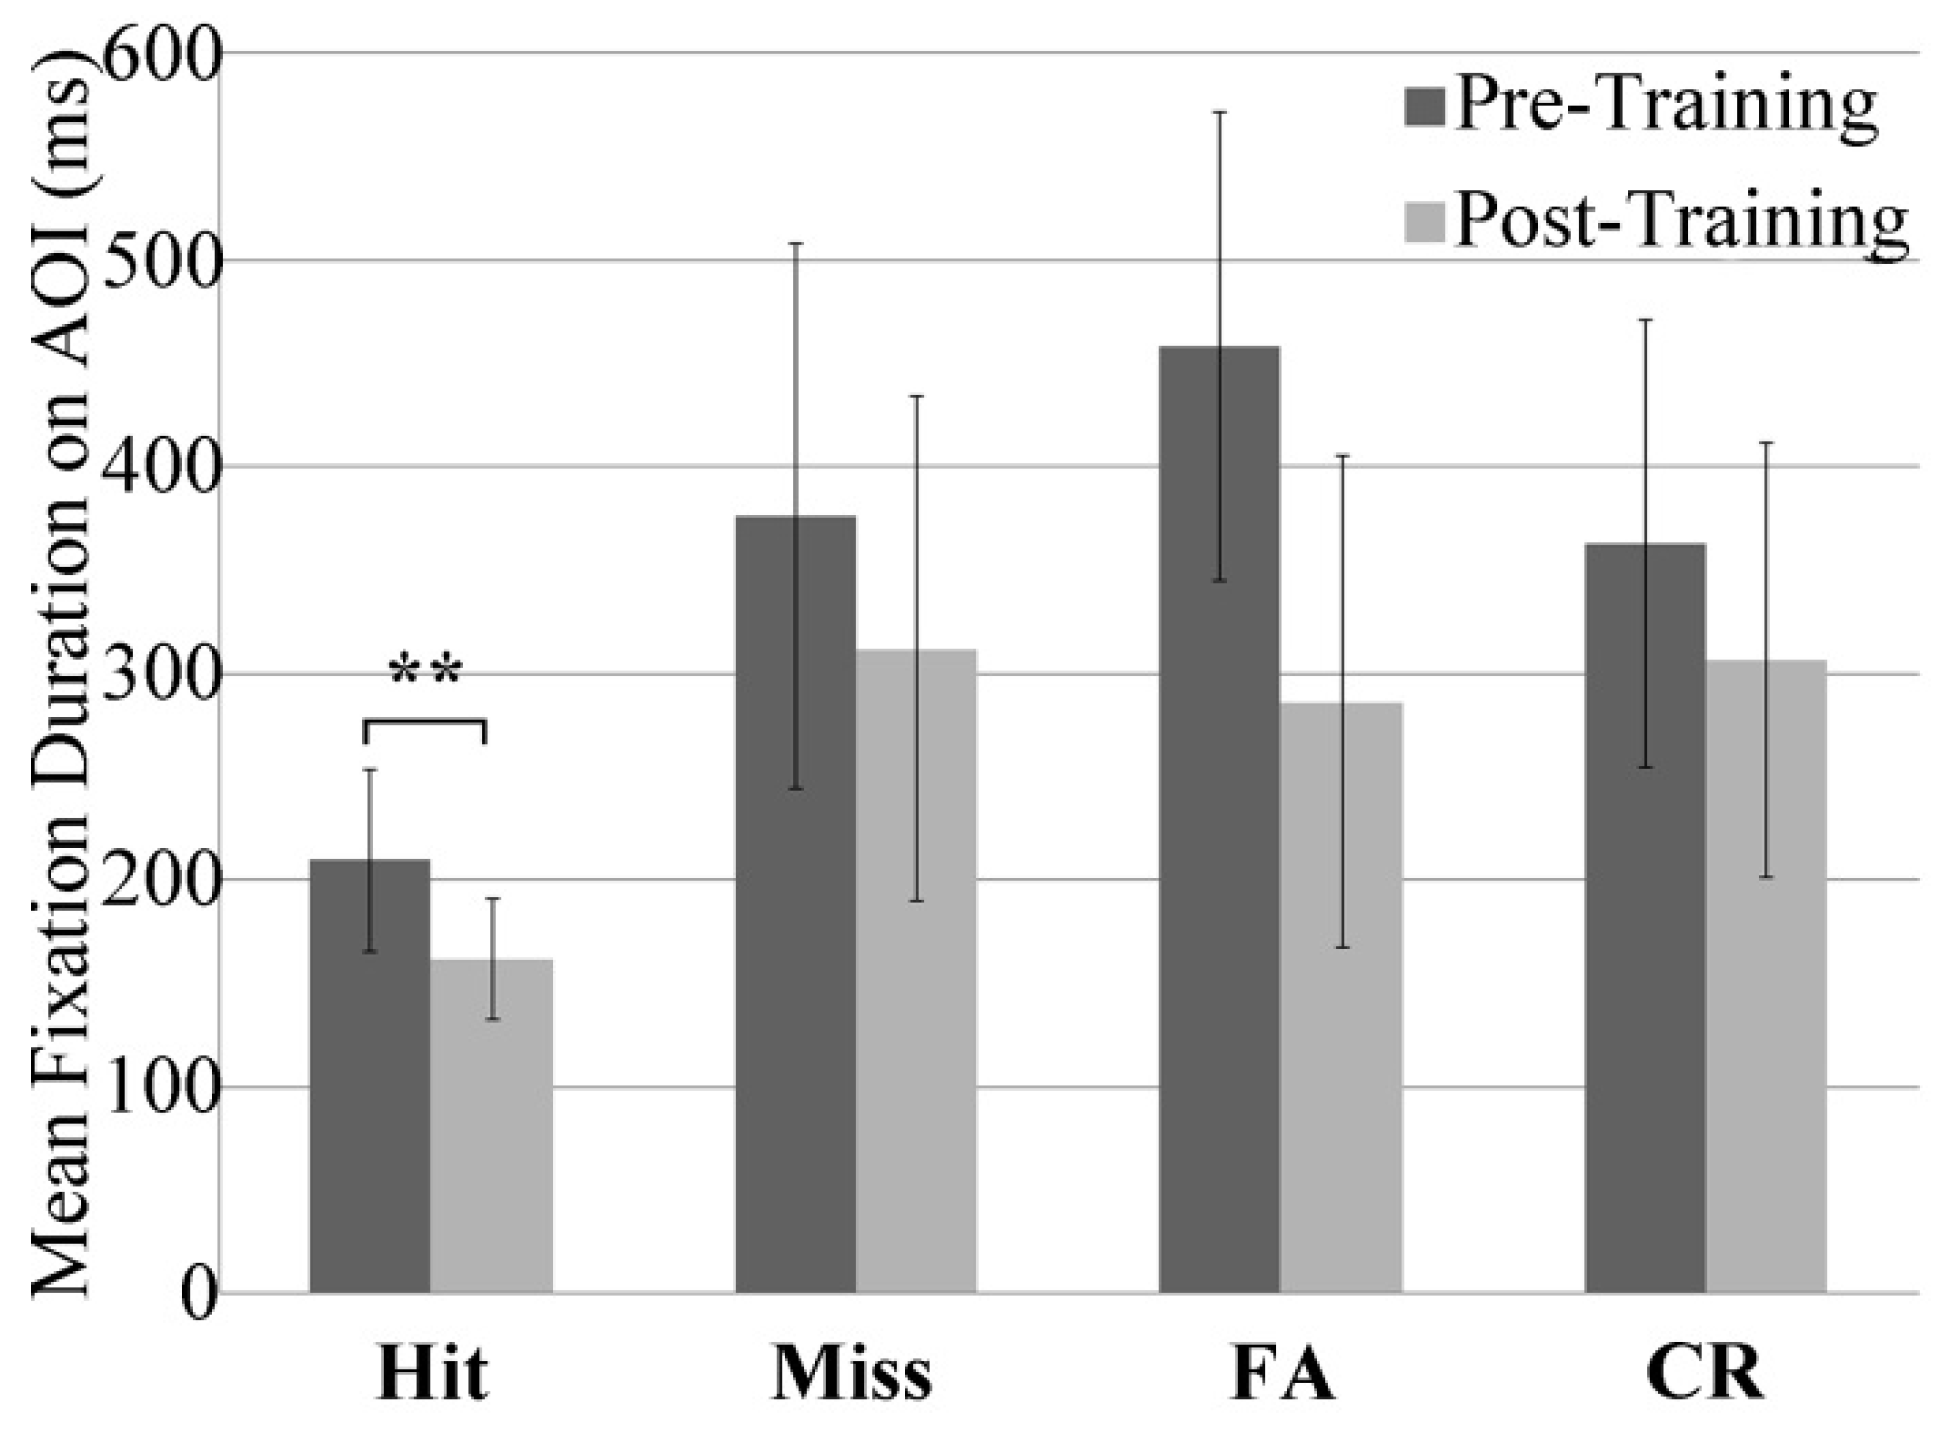
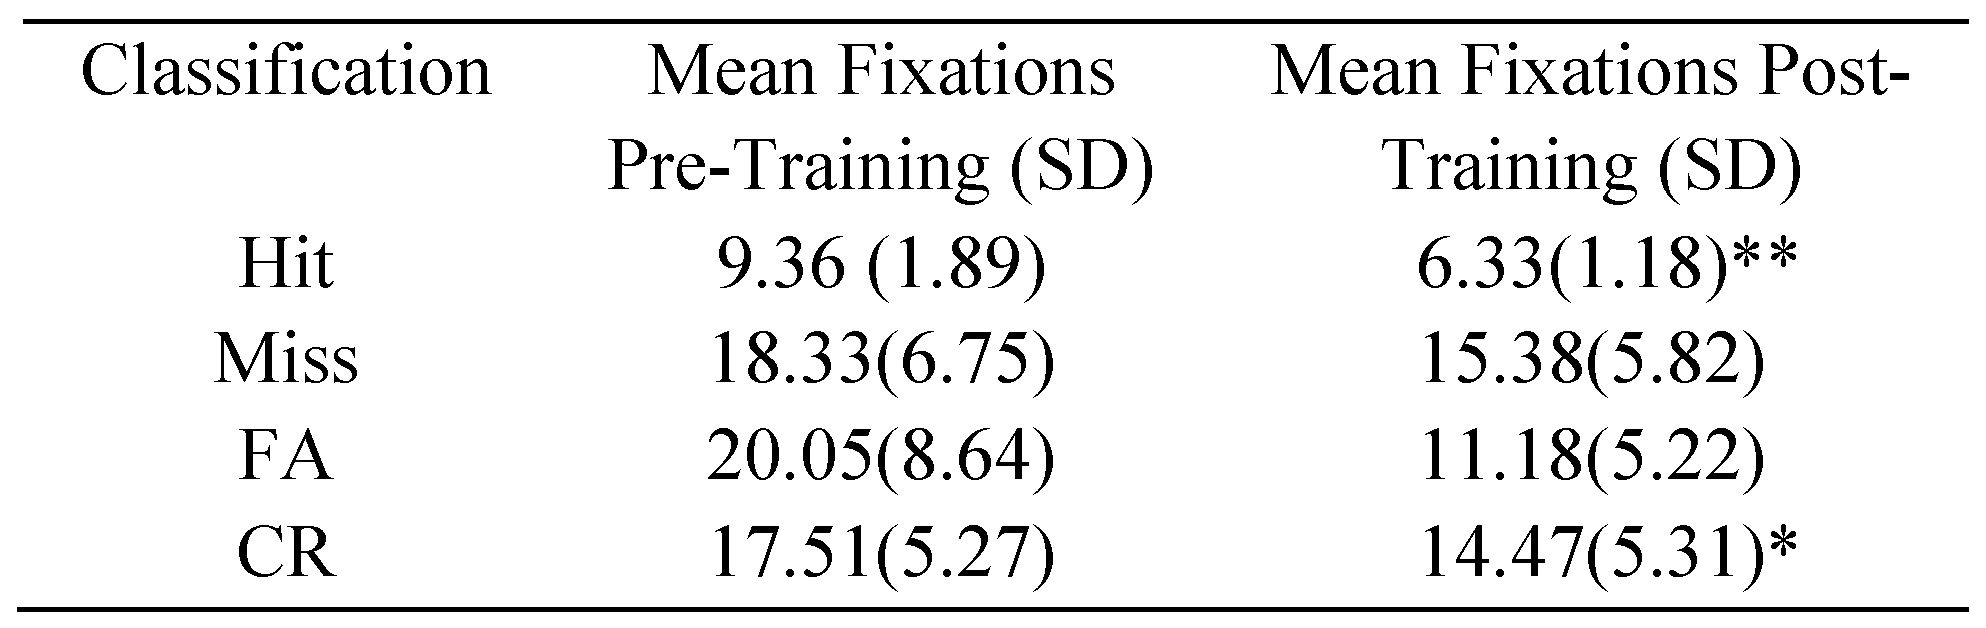
Eye Fixations
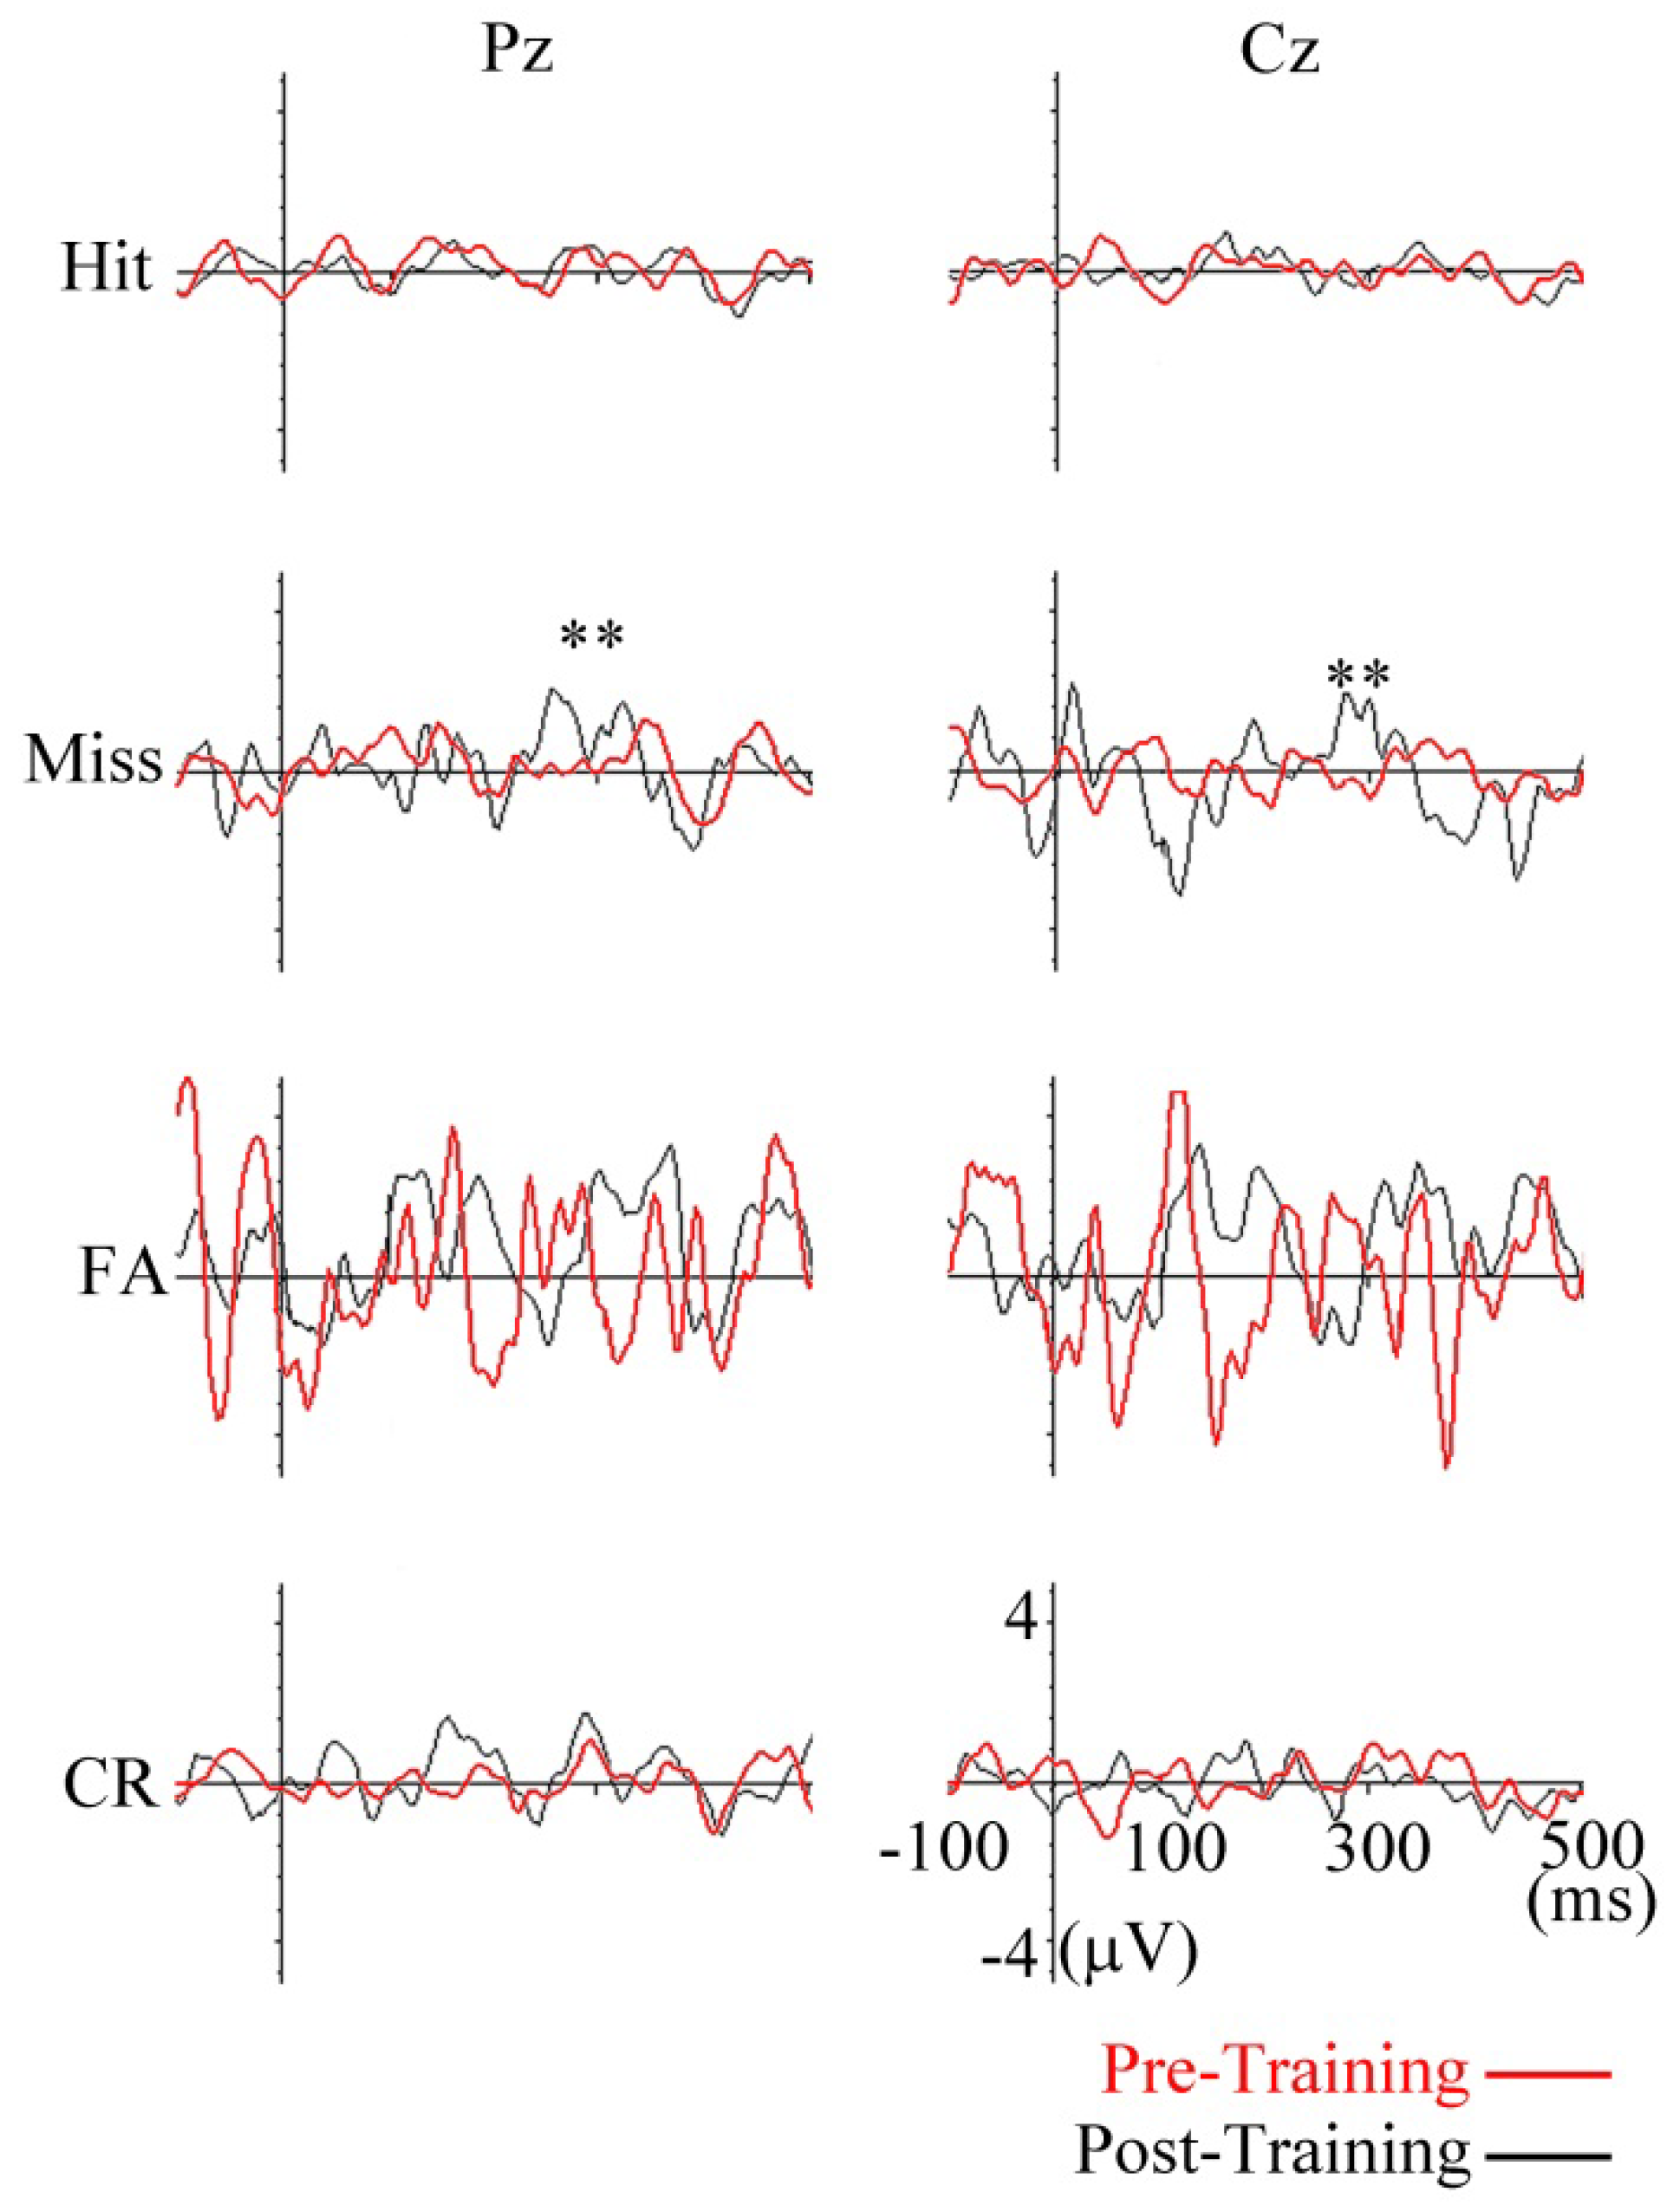
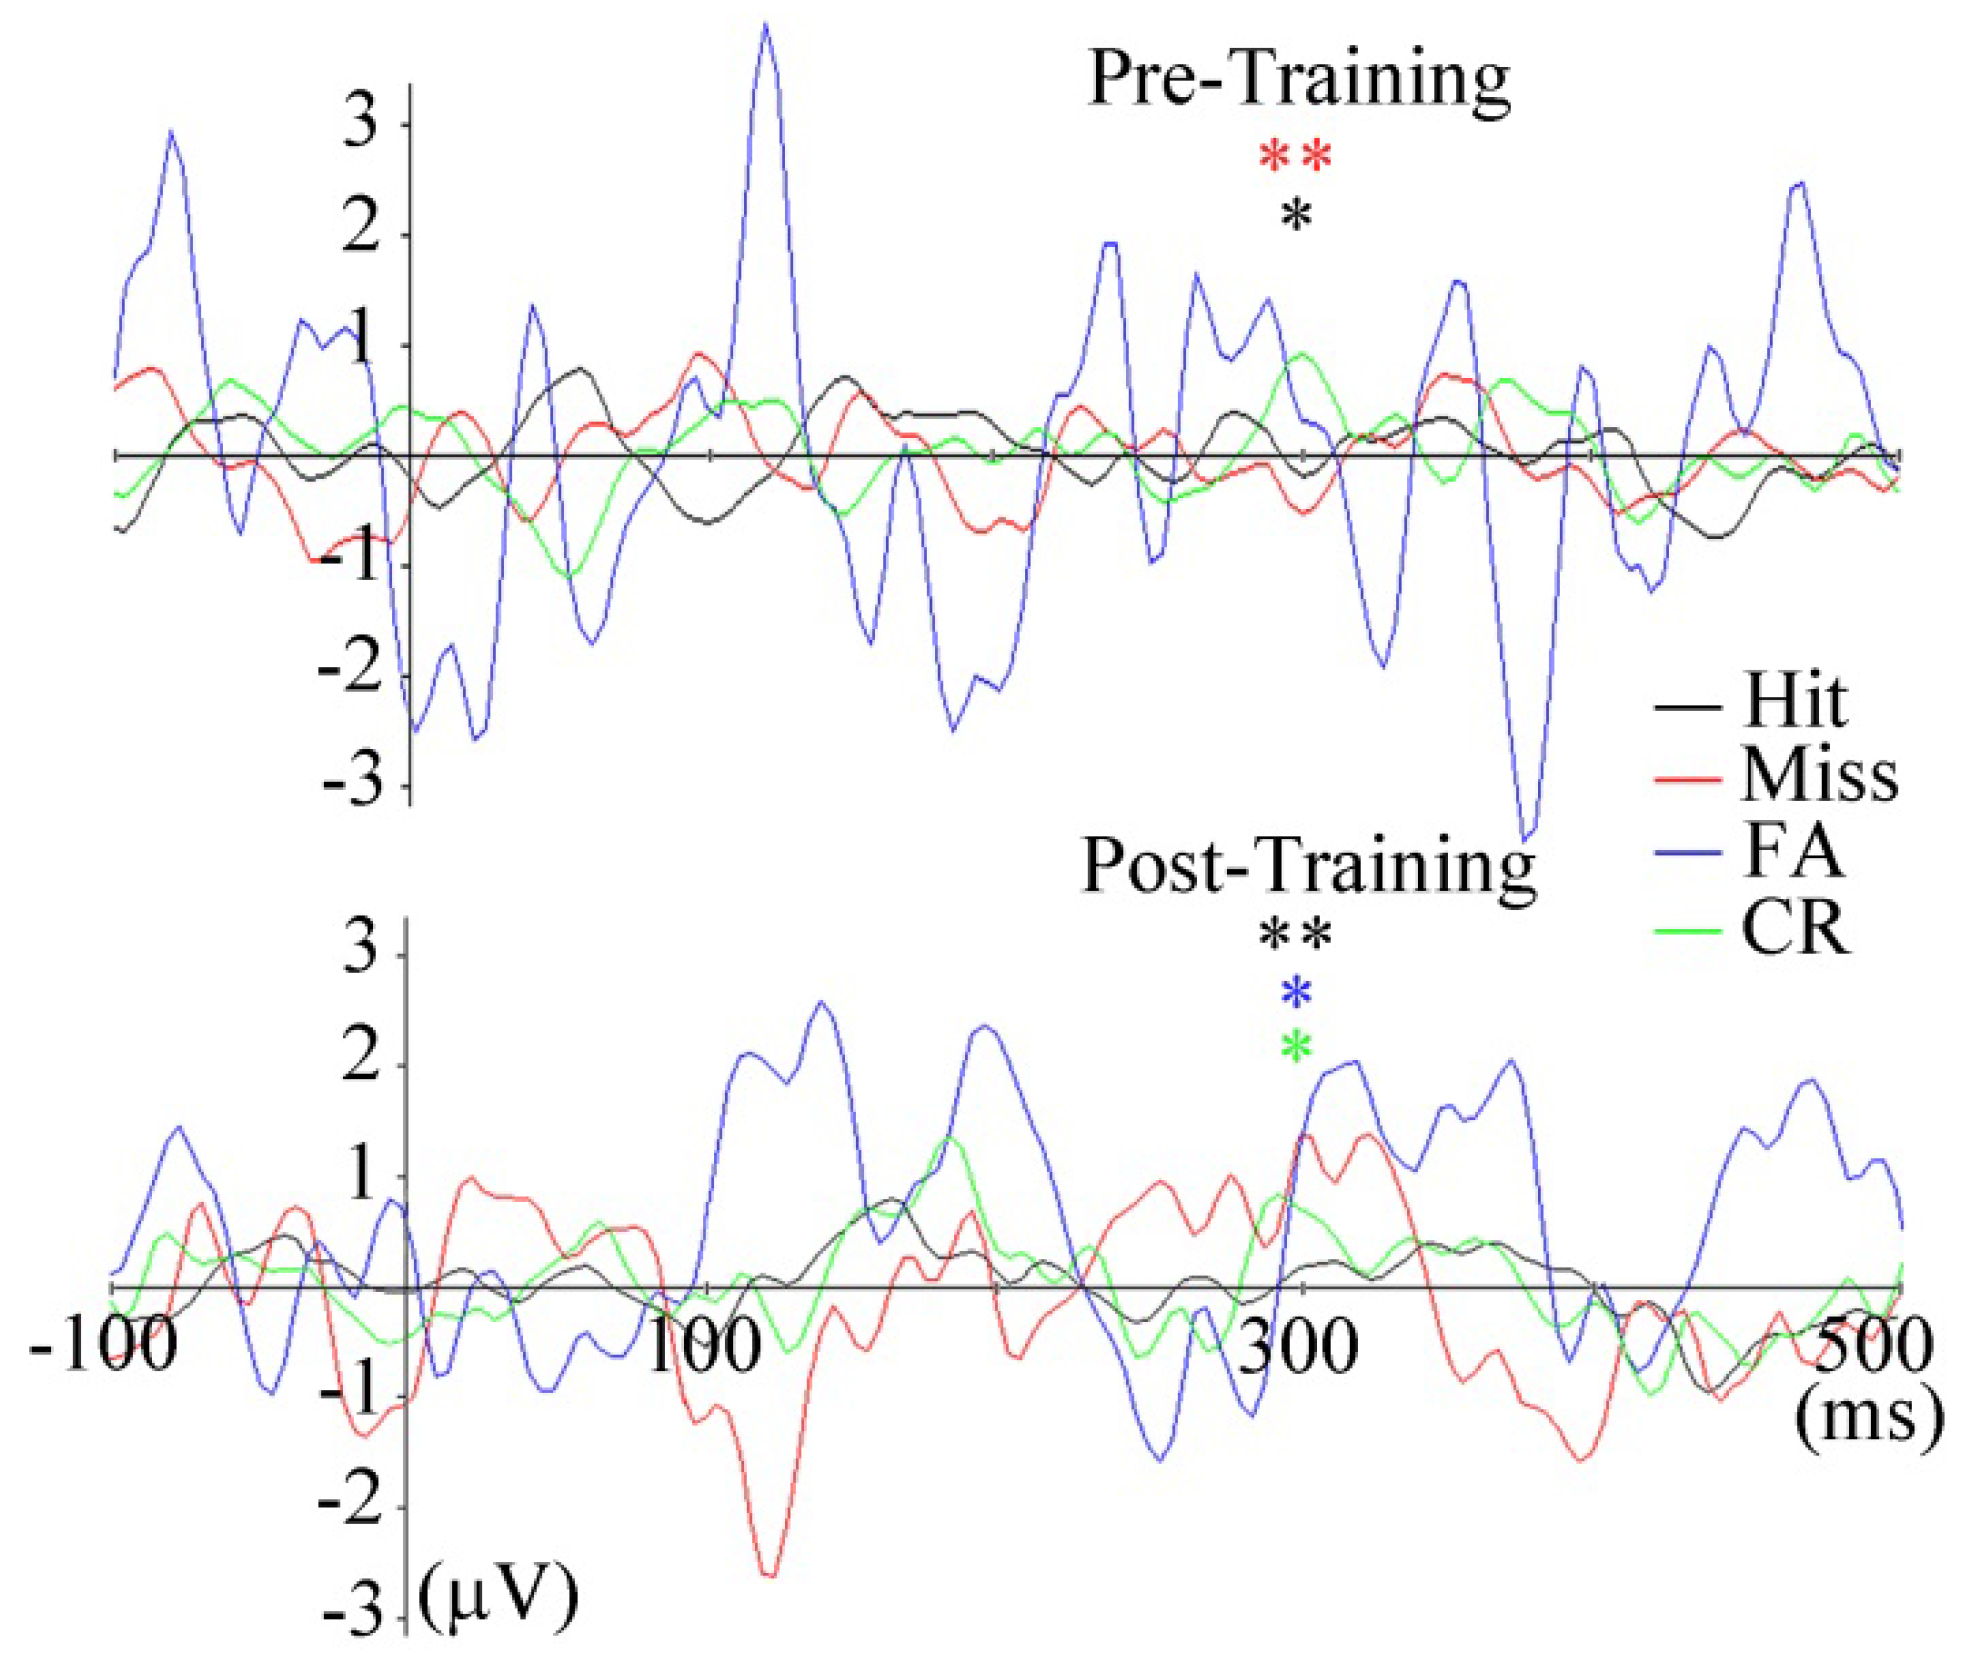
FLERPs
Discussion
Conclusions
Acknowledgments
References
- Albright, T. D. 2012. On the perception of probable things: neural substrates of associative memory, imagery, and perception. Neuron 74, 2: 227–245. [Google Scholar] [CrossRef]
- Andersson, R., M. Nystrom, and K. Holmqvist. 2010. Sampling frequency and eye-tracking measures: how speed affects durations, latencies, and more. J Eye Mov Res 3, 3: 1–12. [Google Scholar] [CrossRef]
- Berka, C., D. J. Levendowski, M. M. Cvetinovic, M. M. Petrovic, G. Davis, M. N. Lumicao, V. T. Zivkovic, M. Popovic, and R. Olmstead. 2004. Real-time analysis of eeg indexes of alertness, cognition, and memory acquired with a wireless EEG headset. International Journal of Human-Computer Interaction 17, 2: 151–170. [Google Scholar] [CrossRef]
- Censor, N., D. Sagi, and L. G. Cohen. 2012. Common mechanisms of human perceptual and motor learning. Nature Reviews Neuroscience 13, 9: 658–664. [Google Scholar] [CrossRef] [PubMed]
- Clark, V. P., S. Fan, and S. A. Hillyard. 1995. Identification of early visually evoked potential generators by retinotopic and topographic analyses. Human Brain Mapping 2: 170–187. [Google Scholar] [CrossRef]
- Colrain, I. M. 2011. Sleep and the brain. Neuropsychological Review 21, 1: 1–4. [Google Scholar] [CrossRef] [PubMed]
- Davidson, P. R., R. D. Jones, and M. T. Peiris. 2007. EEG-based lapse detection with high temporal resolution. IEEE Transactions on Biomedical Engineering 54, 5: 832–839. [Google Scholar] [CrossRef]
- Del, R. M. J., J. Mourino, M. Franze, F. Cincotti, M. Varsta, J. Heikkonen, and F. Babiloni. 2002. A local neural classifier for the recognition of EEG patterns associated to mental tasks. IEEE Transactions on Neural Networks 13, 3: 678–686. [Google Scholar]
- Delorme, A., and S. Makeig. 2004. EEGLAB: an open source toolbox for analysis of single-trial EEG dynamics including independent component analysis. Journal of Neuroscience Methods 134, 1: 9–21. [Google Scholar] [CrossRef]
- Dimigen, O., W. Sommer, A. Hohlfeld, A. M. Jacobs, and R. Kliegl. 2011. Coregistration of eye movements and EEG in natural reading: analyses and review. Journal of Exerimental Psychology, General 140, 4: 552–572. [Google Scholar] [CrossRef]
- Dornhege, G., B. Blankertz, G. Curio, and K. R. Müller. 2004. Boosting bit rates in noninvasive EEG single-trial classifications by feature combination and multiclass paradigms. IEEE Transactions on Biomedical Engineering 51, 6: 993–1002. [Google Scholar] [CrossRef]
- Duchowski, A. T. 2002. A breadth-first survey of eye-tracking applications. Behavior Research Methods Instruments & Computers 34, 4: 455–470. [Google Scholar]
- Hale, K. S., S. Fuchs, P. Axelsson, A. Baskin, and D. Jones. 2007. Edited by D. D. Schmorrow, D. M. Nicholson, J. M. Drexler and L. M. Reeves. Determining gaze parameters to guide EEG/ERP evaluation of imagery analysis. In Foundations of Augmented Cognition (4th Edition). Arlington, VA: Strategic Analysis, Inc. [Google Scholar]
- Hansen, D. W., and Q. Ji. 2010. In the eye of the beholder: a survey of models for eyes and gaze. IEEE Transactions on Pattern Analysis and Machine Intelligence 32, 3: 478–500. [Google Scholar] [CrossRef]
- Hillyard, S. A., E. K. Vogel, and S. J. Luck. 1998. Sensory gain control (amplification) as a mechanism of selective attention: electrophysiological and neuroimaging evidence. Philosophical Transactions of the Royal Society of London Series B-Biological Sciences 353, 1373: 1257–1270. [Google Scholar] [CrossRef]
- Jacob, R. J. K. 1991. The use of eye movements in human-computer interaction techniques: what you look at is what you get. ACM Transactions on Information Systems 9, 2: 152–169. [Google Scholar] [CrossRef]
- Kamienkowski, J. E., M. J. Ison, R. Q. Quiroga, and M. Sigman. 2012. Fixation-related potentials in visual search: a combined EEG and eye tracking study. Journal of Vision 12, 7: 4. [Google Scholar] [CrossRef]
- Kastner, S., and L. G. Ungerleider. 2000. Mechanisms of visual attention in the human cortex. Annual Review of Neuroscience 23: 315–341. [Google Scholar] [PubMed]
- Khushaba, R. N., C. Wise, S. Kodagoda, J. Louviere, B. E. Kahn, and C. Townsend. 2013. Consumer neuroscience: assessing the brain response to marketing stimuli using electroencephalogram (EEG) and eye tracking. Expert Systems with Applications 40, 9: 3803–3812. [Google Scholar] [CrossRef]
- Koch, C., and S. Ullman. 1985. Shifts in selective visual attention: towards the underlying neural circuitry. Human Neurobiology 4, 4: 219–227. [Google Scholar]
- Lagerlund, T. D., G. D. Cascino, K. M. Cicora, and F. W. Sharbrough. 1996. Long-term electroencephalographic monitoring for diagnosis and management of seizures. Mayo Clinic Proceedings 71, 10: 1000–1006. [Google Scholar] [CrossRef]
- Landolt, H. P. 2011. Genetic determination of sleep EEG profiles in healthy humans. Progress in Brain Research 193: 51–61. [Google Scholar]
- Macmillan, N. A., and C. D. Creelman. 2004. Detection theory: a user’s guide (2nd edition). Psychology Press: Mahwah NJ. Mahwah, NJ. [Google Scholar]
- Mendez, O. E., and R. P. Brenner. 2006. Increasing the yield of EEG. J Clin Neurophysiol 23, 4: 282–293. [Google Scholar] [CrossRef] [PubMed]
- Montagna, B., F. Pestilli, and M. Carrasco. 2009. Attention trades off spatial acuity. Vision Research 49, 7: 735–745. [Google Scholar] [CrossRef]
- Mulckhuyse, M., and J. Theeuwes. 2010. Unconscious attentional orienting to exogenous cues: A review of the literature. Acta Psychologica 134, 3: 299–309. [Google Scholar] [CrossRef] [PubMed]
- Müller, H. J., and J. Krummenacher. 2006. Visual search and selective attention. Visual Cognition 14, 4-8: 389–410. [Google Scholar] [CrossRef]
- Naatanen, R., and T. Picton. 1987. The N1 wave of the human electric and magnetic response to sound: a review and an analysis of the component structure. Psychophysiology 24, 4: 375–425. [Google Scholar] [CrossRef]
- Petersen, S. E., and M. I. Posner. 2012. The attention system of the human brain: 20 years after. Annual Review of Neuroscience 35: 73–89. [Google Scholar] [CrossRef] [PubMed]
- Plochl, M., J. P. Ossandon, and P. Konig. 2012. Combining EEG and eye tracking: identification, characterization, and correction of eye movement artifacts in electroencephalographic data. Frontiers in Human Neuroscience 6: 278. [Google Scholar] [CrossRef]
- Ryynanen, O. R., J. A. Hyttinen, and J. A. Malmivuo. 2006. Effect of measurement noise and electrode density on the spatial resolution of cortical potential distribution with different resistivity values for the skull. IEEE Transactions on Biomedical Engineering 53, 9: 1851–1858. [Google Scholar] [CrossRef]
- Salvucci, D. D., and J. H. Goldberg. 2000. Identifying fixations and saccades in eye-tracking protocols. In Proceedings of the Eye Tracking Research and Applications Symposium. New York: ACM Press, pp. 71–78. [Google Scholar]
- Sireteanu, R., and R. Rettenbach. 2000. Perceptual learning in visual search generalizes over tasks, locations, and eyes. Vision Research 40, 21: 2925–2949. [Google Scholar] [CrossRef]
- Song, Y., Y. Ding, S. Fan, and L. Chen. 2002. An event-related potential study on visual perceptual learning under short-term and long-term training conditions. Neuroreport 13, 16: 2053–2057. [Google Scholar] [CrossRef]
- Srinivasan, R., and D. M. Tucker. 1998. The spatial Nyquist of the human EEG. Behavior Reseach Methods Instruments & Computers 30, 1: 8–19. [Google Scholar]
- Stickgold, R., D. Whidbee, B. Schirmer, V. Patel, and J. A. Hobson. 2000. Visual discrimination task improvement: A multi-step process occurring during sleep. Journal of Cognitive Neuroscience 12, 2: 246–254. [Google Scholar] [CrossRef]
- Sutton, S., M. Braren, J. Zubin, and E. R. John. 1965. Evoked-potential correlates of stimulus uncertainty. Science 150, 3700: 1187–1188. [Google Scholar] [CrossRef] [PubMed]
- Treisman, A. 2006. How the deployment of attention determines what we see. Visual Cognition 14, 4-8: 411–443. [Google Scholar] [CrossRef]
- Treisman, A., and G. Gelade. 1980. A feature-integration theory of attention. Cognitive Psychology 12, 1: 97–136. [Google Scholar] [CrossRef]
- Wada, M. 1999. Measurement of olfactory threshold using an evoked potential technique. Rhinology 37, 1: 25–28. [Google Scholar]
- Walsh, V., A. Ellison, E. Ashbridge, and A. Cowey. 1999. The role of the parietal cortex in visual attention--hemispheric asymmetries and the effects of learning: a magnetic stimulation study. Neuropsychologia 37, 2: 245–251. [Google Scholar] [CrossRef] [PubMed]
- Wickens, C. D., J. G. Hollands, S. Banbury, and R. Parasuraman. 2012. Engineering psychology and human performance, 4th edition. Upper Saddle River, NJ: Columbus, OH: Pearson. [Google Scholar]
- Wolfe, J. M., T. S. Horowitz, and N. M. Kenner. 2005. Cognitive psychology: rare items often missed in visual searches. Nature 435, 7041: 439–440. [Google Scholar] [CrossRef]
- Wolfe, J. M., and M. J. Van Wert. 2010. Varying target prevalence reveals two dissociable decision criteria in visual search. Current Biology 20, 2: 121–124. [Google Scholar] [CrossRef]

 |
 |
Copyright © 2013. This article is licensed under a Creative Commons Attribution 4.0 International License.
Share and Cite
Winslow, B.; Carpenter, A.; Flint, J.; Wang, X.; Tomasetti, D.; Johnston, M.; Hale, K. Combining EEG and Eye Tracking: Using Fixation-Locked Potentials in Visual Search. J. Eye Mov. Res. 2013, 6, 1-11. https://doi.org/10.16910/jemr.6.4.5
Winslow B, Carpenter A, Flint J, Wang X, Tomasetti D, Johnston M, Hale K. Combining EEG and Eye Tracking: Using Fixation-Locked Potentials in Visual Search. Journal of Eye Movement Research. 2013; 6(4):1-11. https://doi.org/10.16910/jemr.6.4.5
Chicago/Turabian StyleWinslow, Brent, Angela Carpenter, Jesse Flint, Xuezhong Wang, David Tomasetti, Matthew Johnston, and Kelly Hale. 2013. "Combining EEG and Eye Tracking: Using Fixation-Locked Potentials in Visual Search" Journal of Eye Movement Research 6, no. 4: 1-11. https://doi.org/10.16910/jemr.6.4.5
APA StyleWinslow, B., Carpenter, A., Flint, J., Wang, X., Tomasetti, D., Johnston, M., & Hale, K. (2013). Combining EEG and Eye Tracking: Using Fixation-Locked Potentials in Visual Search. Journal of Eye Movement Research, 6(4), 1-11. https://doi.org/10.16910/jemr.6.4.5